marie skŁodowska-curie actions statistics...
TRANSCRIPT

MARIE SKŁODOWSKA-CURIE ACTIONS
STATISTICS
INDIVIDUAL FELLOWSHIPS
1Dernière mise à jour :
11 juin 2018
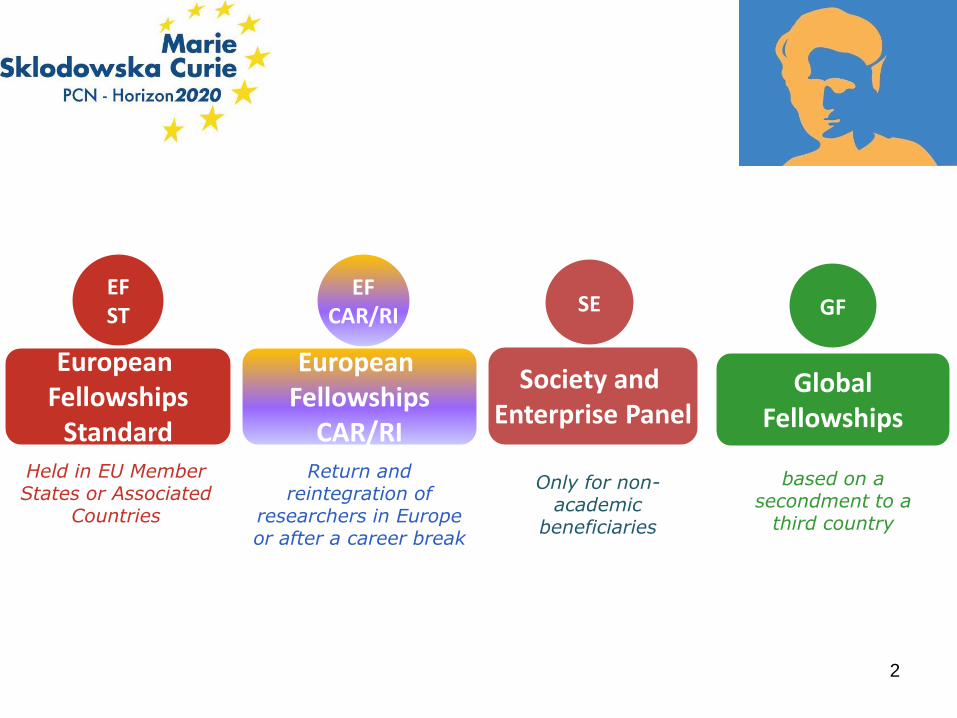
EFST
EFCAR/RI SE
European Fellowships
Standard
European Fellowships
CAR/RI
Society and Enterprise Panel
Held in EU Member States or Associated
Countries
Return and reintegration of
researchers in Europe or after a career break
based on a secondment to a
third country
GlobalFellowships
Only for non-academic
beneficiaries
GF
2
3
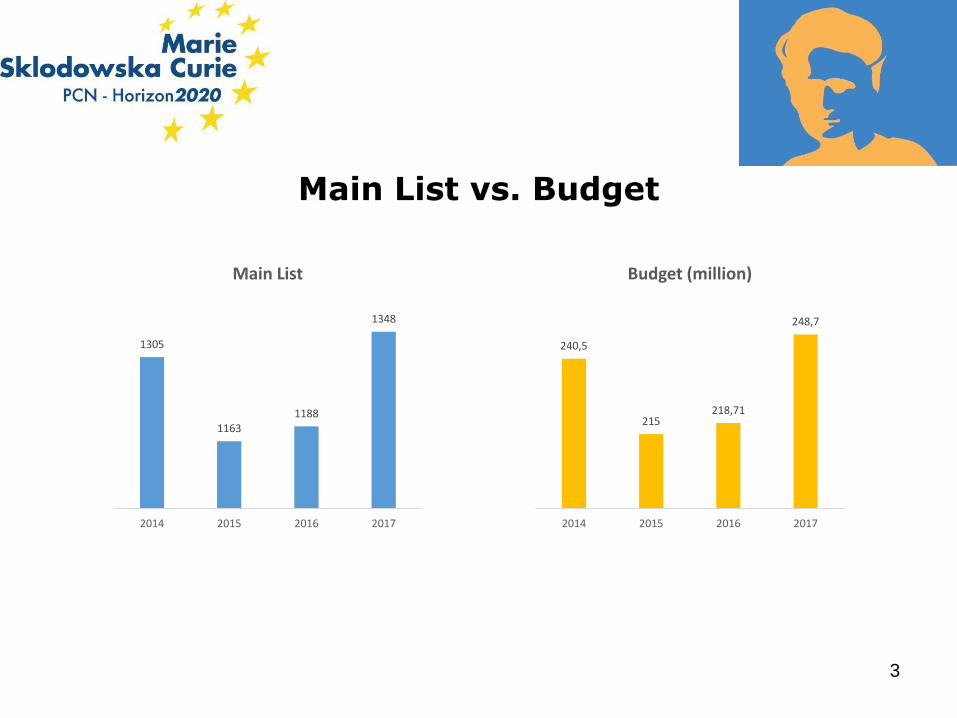
Main List vs. Budget
1305
11631188
1348
2014 2015 2016 2017
Main List
240,5
215218,71
248,7
2014 2015 2016 2017
Budget (million)
GLOBALDATA
4

IF-EF-Standard
2014 2015 2016 2017
No of eligible
proposals5756 6667 7061 7065
Main list (No of
projects)1072 947 925 1029
Success rate 18,62% 14,20% 13,10% 14,56%
Above threshold
(No of projects )4728 5406 5814 5607
Reserve list 268 237 276 204
5
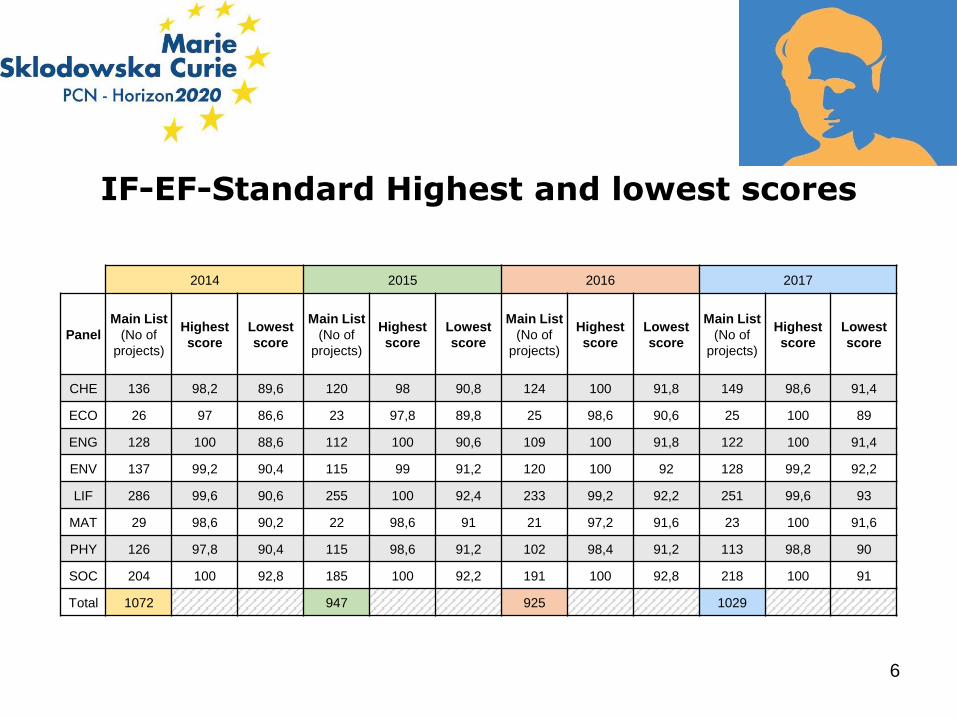
IF-EF-Standard Highest and lowest scores
2014 2015 2016 2017
Panel
Main List
(No of
projects)
Highest
score
Lowest
score
Main List
(No of
projects)
Highest
score
Lowest
score
Main List
(No of
projects)
Highest
score
Lowest
score
Main List
(No of
projects)
Highest
score
Lowest
score
CHE 136 98,2 89,6 120 98 90,8 124 100 91,8 149 98,6 91,4
ECO 26 97 86,6 23 97,8 89,8 25 98,6 90,6 25 100 89
ENG 128 100 88,6 112 100 90,6 109 100 91,8 122 100 91,4
ENV 137 99,2 90,4 115 99 91,2 120 100 92 128 99,2 92,2
LIF 286 99,6 90,6 255 100 92,4 233 99,2 92,2 251 99,6 93
MAT 29 98,6 90,2 22 98,6 91 21 97,2 91,6 23 100 91,6
PHY 126 97,8 90,4 115 98,6 91,2 102 98,4 91,2 113 98,8 90
SOC 204 100 92,8 185 100 92,2 191 100 92,8 218 100 91
Total 1072 947 925 1029
6

IF-EF-Career restart panel
2014 2015 2016 2017
No of eligible
proposals181 181 242 322
Main list (No of
projects)33 25 31 46
Success rate 18,23% 13,81% 12,80% 14,29%
Above threshold
(No of projects )124 150 177 209
Reserve list 8 8 9 13
7
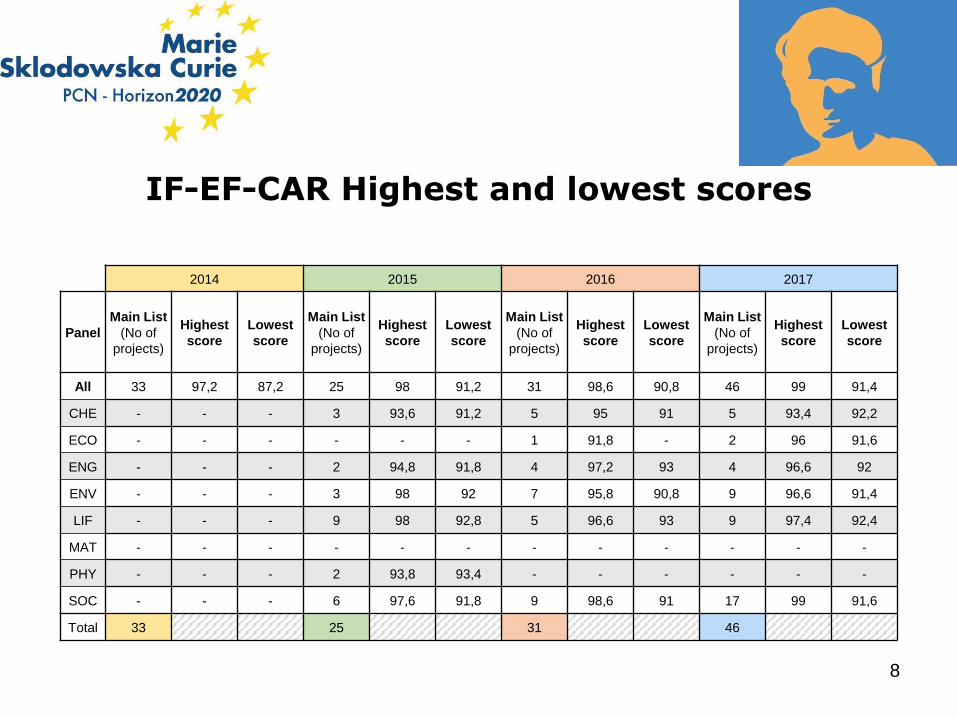
IF-EF-CAR Highest and lowest scores
2014 2015 2016 2017
Panel
Main List
(No of
projects)
Highest
score
Lowest
score
Main List
(No of
projects)
Highest
score
Lowest
score
Main List
(No of
projects)
Highest
score
Lowest
score
Main List
(No of
projects)
Highest
score
Lowest
score
All 33 97,2 87,2 25 98 91,2 31 98,6 90,8 46 99 91,4
CHE - - - 3 93,6 91,2 5 95 91 5 93,4 92,2
ECO - - - - - - 1 91,8 - 2 96 91,6
ENG - - - 2 94,8 91,8 4 97,2 93 4 96,6 92
ENV - - - 3 98 92 7 95,8 90,8 9 96,6 91,4
LIF - - - 9 98 92,8 5 96,6 93 9 97,4 92,4
MAT - - - - - - - - - - - -
PHY - - - 2 93,8 93,4 - - - - - -
SOC - - - 6 97,6 91,8 9 98,6 91 17 99 91,6
Total 33 25 31 46
8
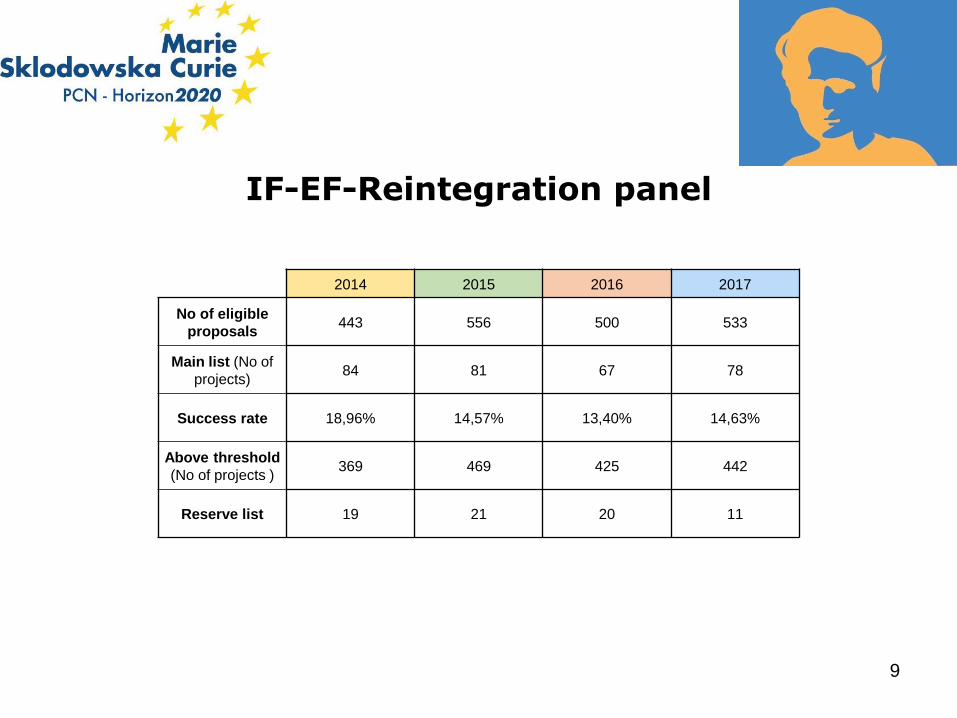
IF-EF-Reintegration panel
2014 2015 2016 2017
No of eligible
proposals443 556 500 533
Main list (No of
projects)84 81 67 78
Success rate 18,96% 14,57% 13,40% 14,63%
Above threshold
(No of projects )369 469 425 442
Reserve list 19 21 20 11
9
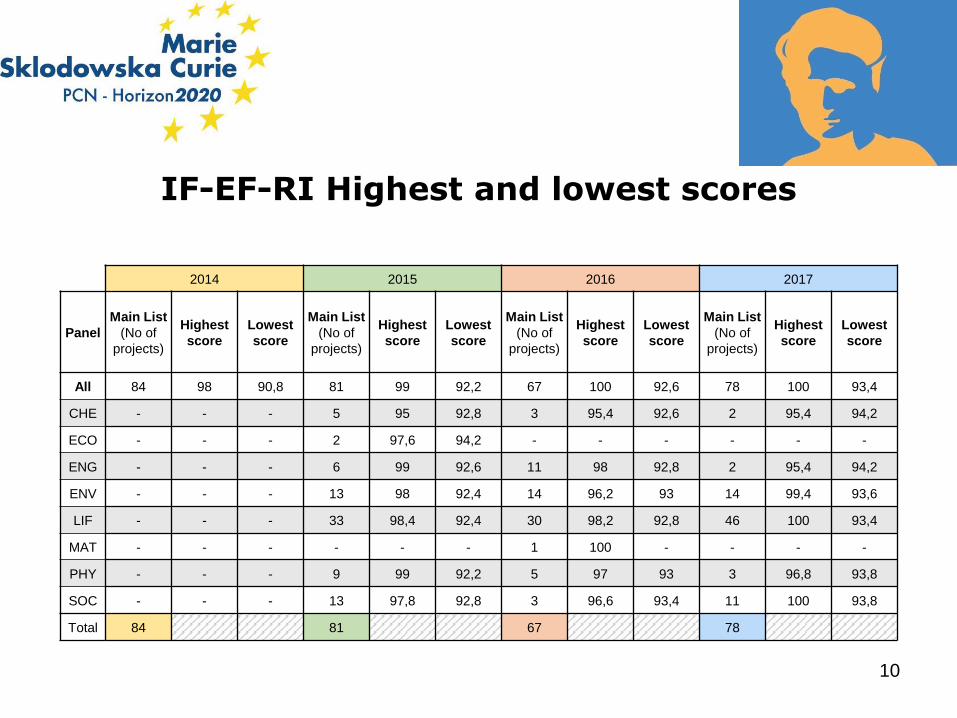
IF-EF-RI Highest and lowest scores
2014 2015 2016 2017
Panel
Main List
(No of
projects)
Highest
score
Lowest
score
Main List
(No of
projects)
Highest
score
Lowest
score
Main List
(No of
projects)
Highest
score
Lowest
score
Main List
(No of
projects)
Highest
score
Lowest
score
All 84 98 90,8 81 99 92,2 67 100 92,6 78 100 93,4
CHE - - - 5 95 92,8 3 95,4 92,6 2 95,4 94,2
ECO - - - 2 97,6 94,2 - - - - - -
ENG - - - 6 99 92,6 11 98 92,8 2 95,4 94,2
ENV - - - 13 98 92,4 14 96,2 93 14 99,4 93,6
LIF - - - 33 98,4 92,4 30 98,2 92,8 46 100 93,4
MAT - - - - - - 1 100 - - - -
PHY - - - 9 99 92,2 5 97 93 3 96,8 93,8
SOC - - - 13 97,8 92,8 3 96,6 93,4 11 100 93,8
Total 84 81 67 78
10
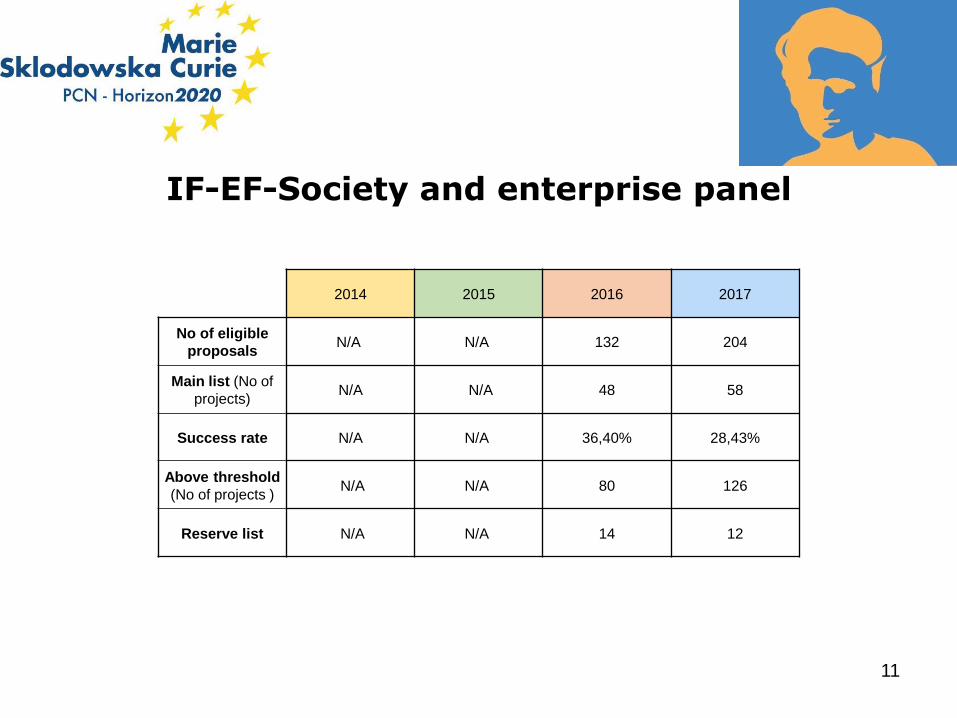
IF-EF-Society and enterprise panel
2014 2015 2016 2017
No of eligible
proposalsN/A N/A 132 204
Main list (No of
projects)N/A N/A 48 58
Success rate N/A N/A 36,40% 28,43%
Above threshold
(No of projects )N/A N/A 80 126
Reserve list N/A N/A 14 12
11

IF-EF-SE Highest and lowest scores
2014 2015 2016 2017
Panel
Main List
(No of
projects)
Highest
score
Lowest
score
Main List
(No of
projects)
Highest
score
Lowest
score
Main List
(No of
projects)
Highest
score
Lowest
score
Main List
(No of
projects)
Highest
score
Lowest
score
All - - - - - - 48 95,8 80,6 58 97 83,6
CHE - - - - - - 8 91,8 80,6 7 94 85
ECO - - - - - - 3 91,2 82,2 2 92,6 86
ENG - - - - - - 9 92 81 11 92,2 84,8
ENV - - - - - - 3 91,8 81 7 94,2 84,4
LIF - - - - - - 19 95,8 82,2 26 97 83,6
MAT - - - - - - - - - - - -
PHY - - - - - - 2 90,2 83,8 2 94,2 85,4
SOC - - - - - - 4 90,6 81,2 3 95,8 85,4
Total 0 0 48 58
12
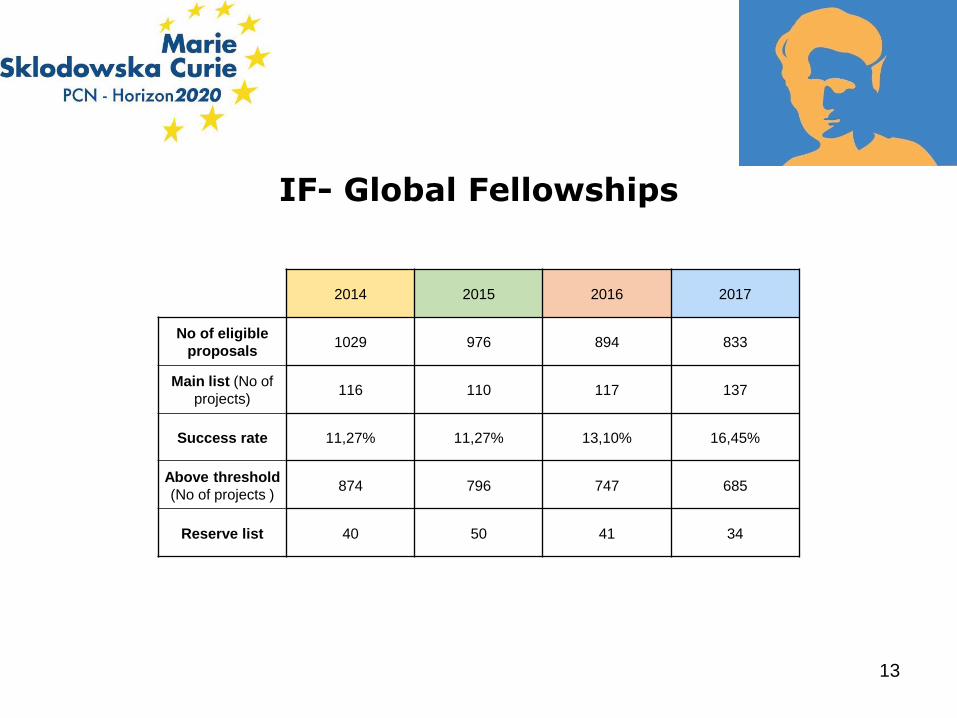
IF- Global Fellowships
2014 2015 2016 2017
No of eligible
proposals1029 976 894 833
Main list (No of
projects)116 110 117 137
Success rate 11,27% 11,27% 13,10% 16,45%
Above threshold
(No of projects )874 796 747 685
Reserve list 40 50 41 34
13
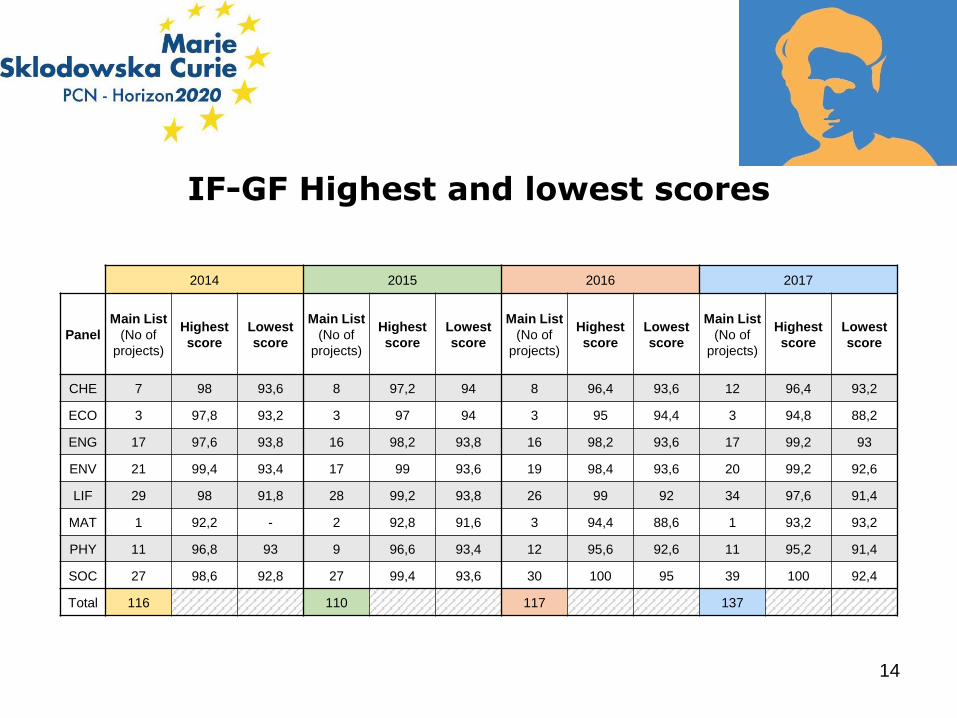
IF-GF Highest and lowest scores
2014 2015 2016 2017
Panel
Main List
(No of
projects)
Highest
score
Lowest
score
Main List
(No of
projects)
Highest
score
Lowest
score
Main List
(No of
projects)
Highest
score
Lowest
score
Main List
(No of
projects)
Highest
score
Lowest
score
CHE 7 98 93,6 8 97,2 94 8 96,4 93,6 12 96,4 93,2
ECO 3 97,8 93,2 3 97 94 3 95 94,4 3 94,8 88,2
ENG 17 97,6 93,8 16 98,2 93,8 16 98,2 93,6 17 99,2 93
ENV 21 99,4 93,4 17 99 93,6 19 98,4 93,6 20 99,2 92,6
LIF 29 98 91,8 28 99,2 93,8 26 99 92 34 97,6 91,4
MAT 1 92,2 - 2 92,8 91,6 3 94,4 88,6 1 93,2 93,2
PHY 11 96,8 93 9 96,6 93,4 12 95,6 92,6 11 95,2 91,4
SOC 27 98,6 92,8 27 99,4 93,6 30 100 95 39 100 92,4
Total 116 110 117 137
14
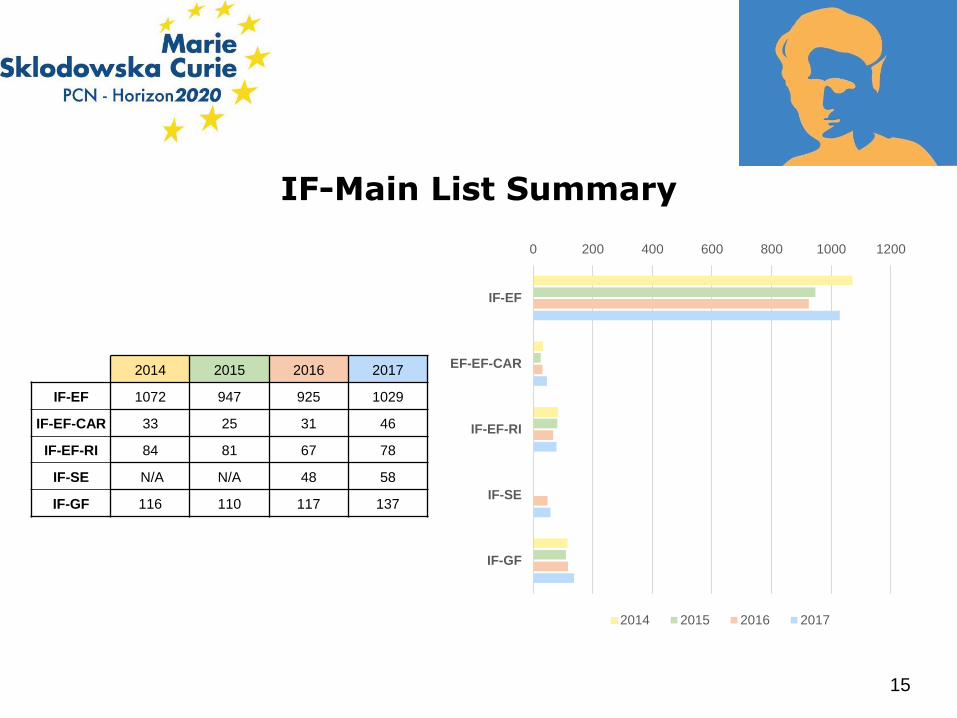
IF-Main List Summary
2014 2015 2016 2017
IF-EF 1072 947 925 1029
IF-EF-CAR 33 25 31 46
IF-EF-RI 84 81 67 78
IF-SE N/A N/A 48 58
IF-GF 116 110 117 137
15
0 200 400 600 800 1000 1200
IF-EF
EF-EF-CAR
IF-EF-RI
IF-SE
IF-GF
2014 2015 2016 2017
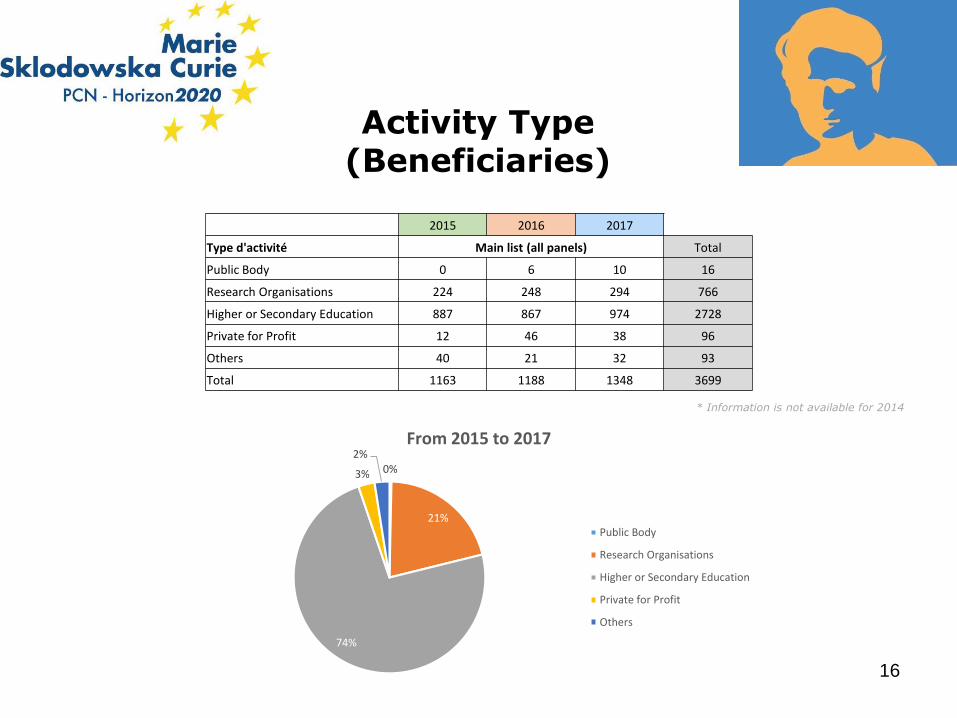
Activity Type(Beneficiaries)
16
2015 2016 2017
Type d'activité Main list (all panels) Total
Public Body 0 6 10 16
Research Organisations 224 248 294 766
Higher or Secondary Education 887 867 974 2728
Private for Profit 12 46 38 96
Others 40 21 32 93
Total 1163 1188 1348 3699
* Information is not available for 2014
0%
21%
74%
3%
2%From 2015 to 2017
Public Body
Research Organisations
Higher or Secondary Education
Private for Profit
Others
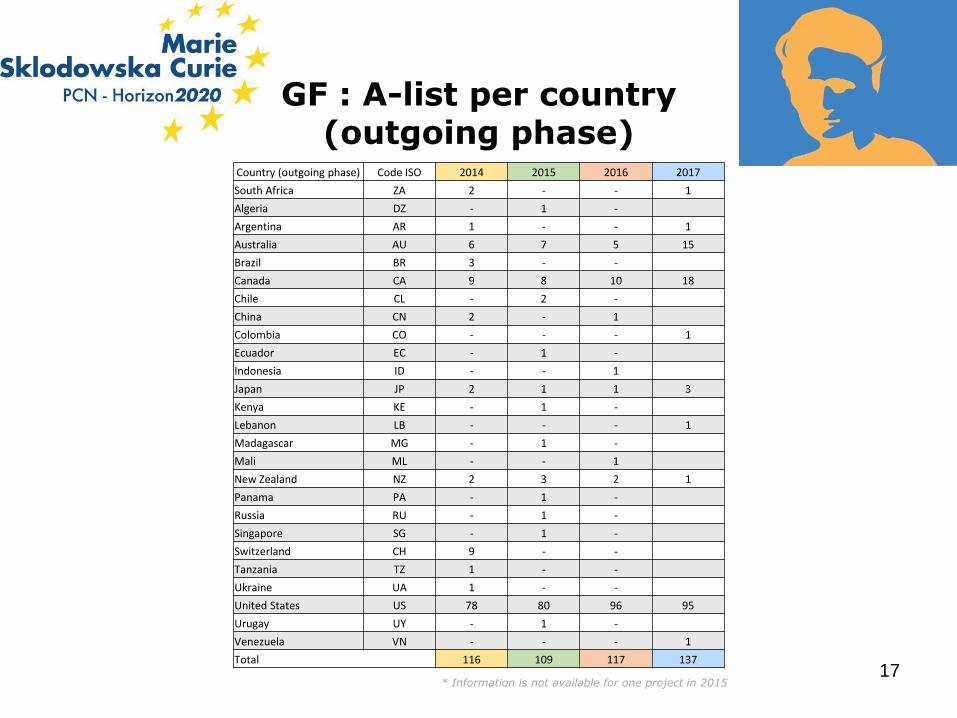
GF : A-list per country (outgoing phase)
17* Information is not available for one project in 2015
Country (outgoing phase) Code ISO 2014 2015 2016 2017
South Africa ZA 2 - - 1
Algeria DZ - 1 -
Argentina AR 1 - - 1
Australia AU 6 7 5 15
Brazil BR 3 - -
Canada CA 9 8 10 18
Chile CL - 2 -
China CN 2 - 1
Colombia CO - - - 1
Ecuador EC - 1 -
Indonesia ID - - 1
Japan JP 2 1 1 3
Kenya KE - 1 -
Lebanon LB - - - 1
Madagascar MG - 1 -
Mali ML - - 1
New Zealand NZ 2 3 2 1
Panama PA - 1 -
Russia RU - 1 -
Singapore SG - 1 -
Switzerland CH 9 - -
Tanzania TZ 1 - -
Ukraine UA 1 - -
United States US 78 80 96 95
Urugay UY - 1 -
Venezuela VN - - - 1
Total 116 109 117 137
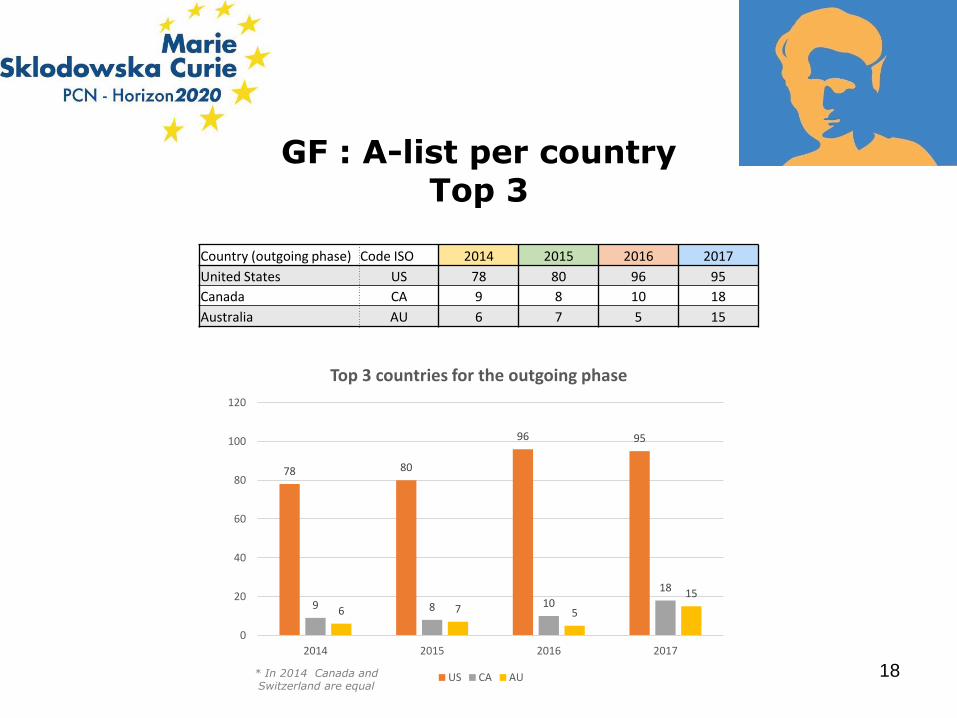
GF : A-list per country Top 3
18* In 2014 Canada and Switzerland are equal
Country (outgoing phase) Code ISO 2014 2015 2016 2017
United States US 78 80 96 95
Canada CA 9 8 10 18
Australia AU 6 7 5 15
78 80
96 95
9 8 10
18
6 7 5
15
0
20
40
60
80
100
120
2014 2015 2016 2017
Top 3 countries for the outgoing phase
US CA AU
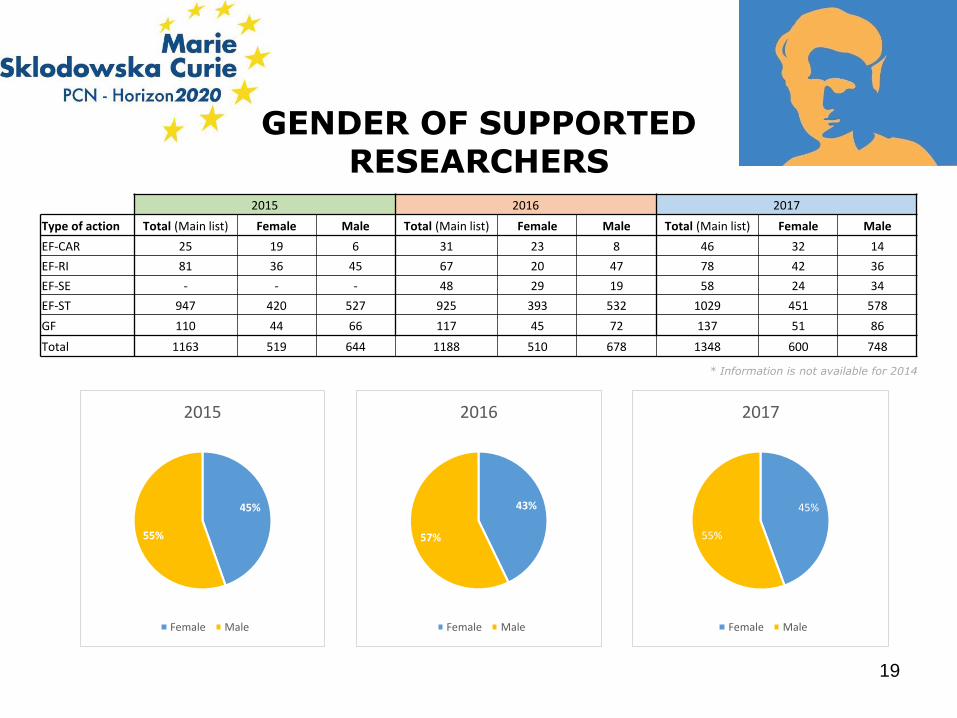
GENDER OF SUPPORTEDRESEARCHERS
19
45%
55%
2015
Female Male
43%
57%
2016
Female Male
2015 2016 2017
Type of action Total (Main list) Female Male Total (Main list) Female Male Total (Main list) Female Male
EF-CAR 25 19 6 31 23 8 46 32 14
EF-RI 81 36 45 67 20 47 78 42 36
EF-SE - - - 48 29 19 58 24 34
EF-ST 947 420 527 925 393 532 1029 451 578
GF 110 44 66 117 45 72 137 51 86
Total 1163 519 644 1188 510 678 1348 600 748
* Information is not available for 2014
45%
55%
2017
Female Male
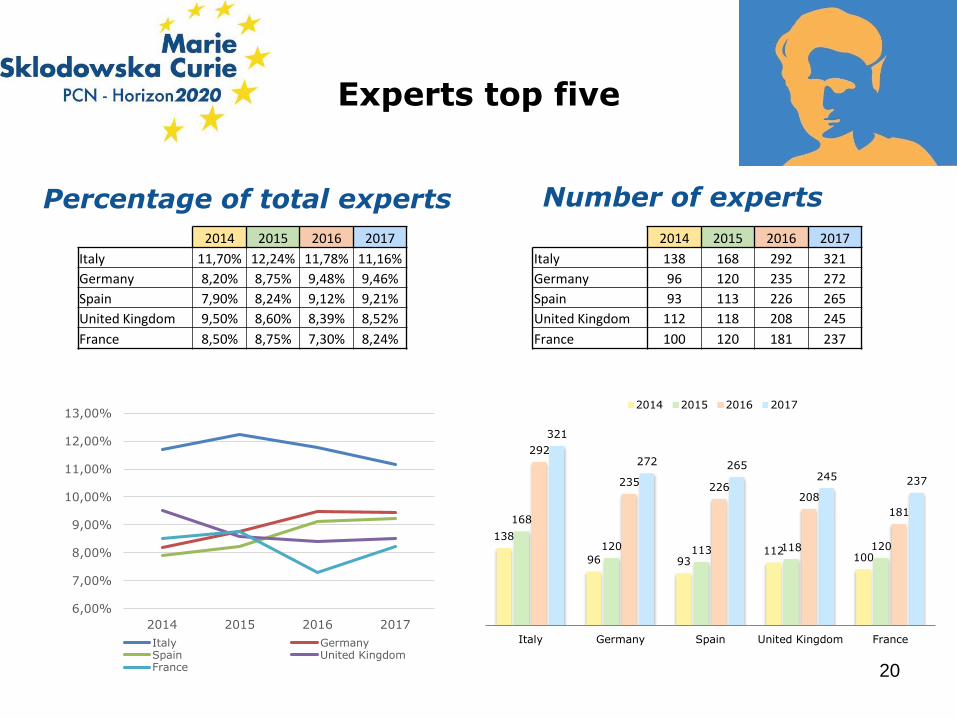
Experts top five
Percentage of total experts Number of experts
20
2014 2015 2016 2017
Italy 11,70% 12,24% 11,78% 11,16%
Germany 8,20% 8,75% 9,48% 9,46%
Spain 7,90% 8,24% 9,12% 9,21%
United Kingdom 9,50% 8,60% 8,39% 8,52%
France 8,50% 8,75% 7,30% 8,24%
2014 2015 2016 2017
Italy 138 168 292 321
Germany 96 120 235 272
Spain 93 113 226 265
United Kingdom 112 118 208 245
France 100 120 181 237
138
96 93112
100
168
120 113 118 120
292
235 226208
181
321
272 265245 237
Italy Germany Spain United Kingdom France
2014 2015 2016 2017
6,00%
7,00%
8,00%
9,00%
10,00%
11,00%
12,00%
13,00%
2014 2015 2016 2017
Italy GermanySpain United KingdomFrance

2014
21
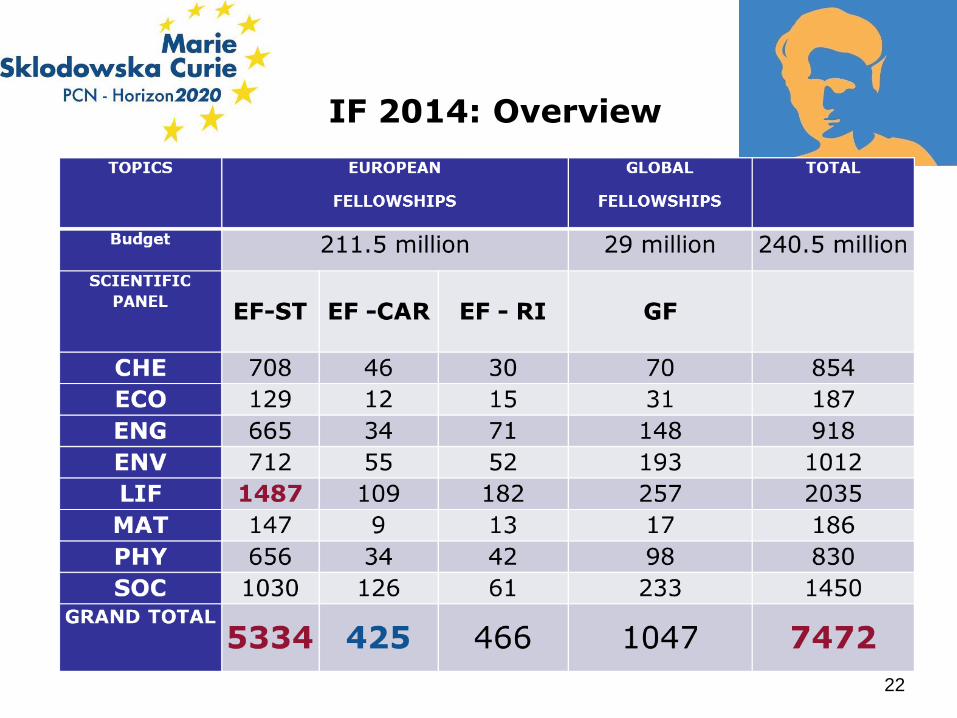
IF 2014: Overview
22
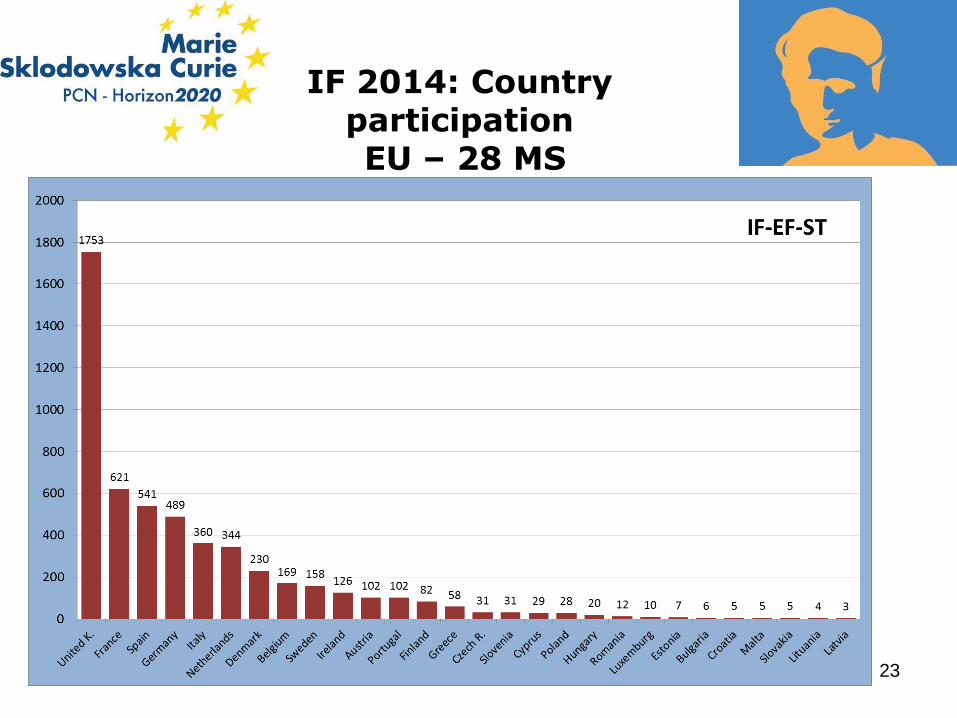
IF 2014: Country participationEU – 28 MS
23
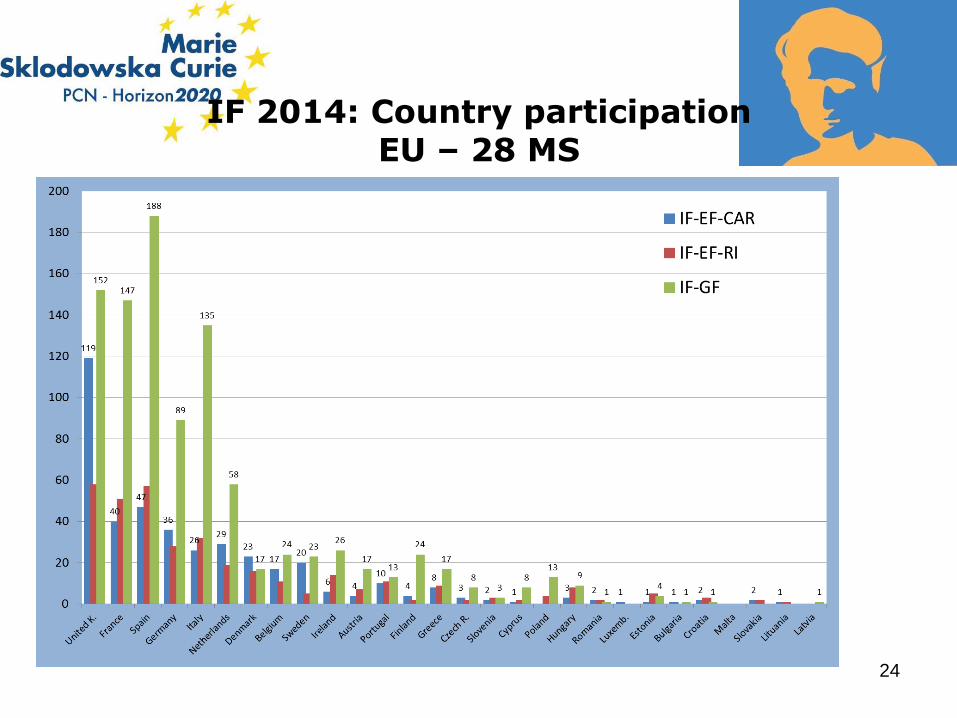
IF 2014: Country participation EU – 28 MS
24
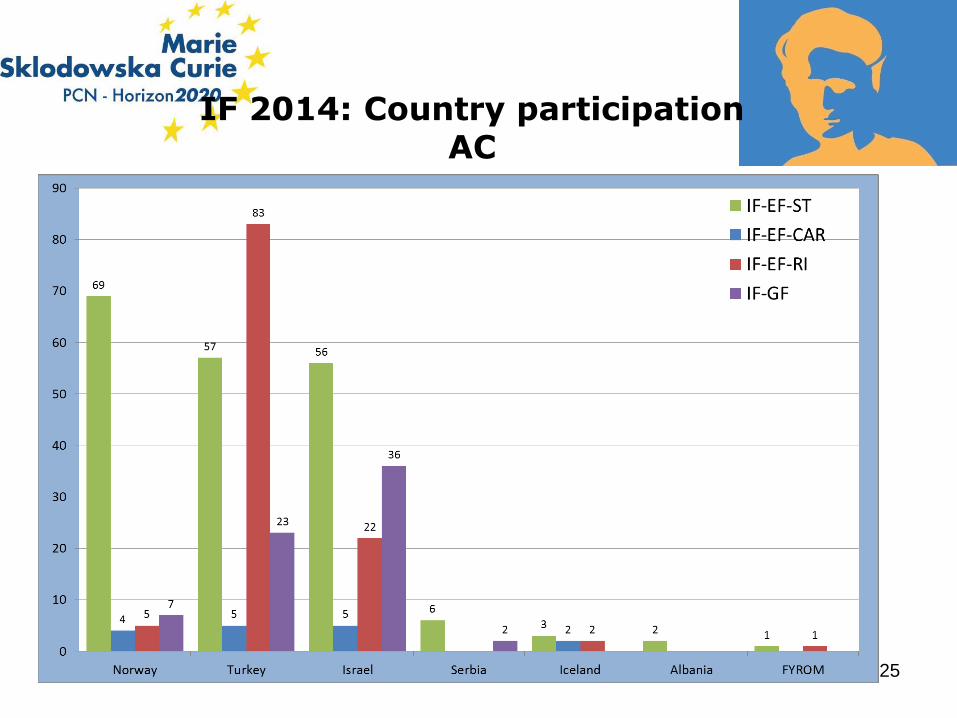
IF 2014: Country participation AC
25
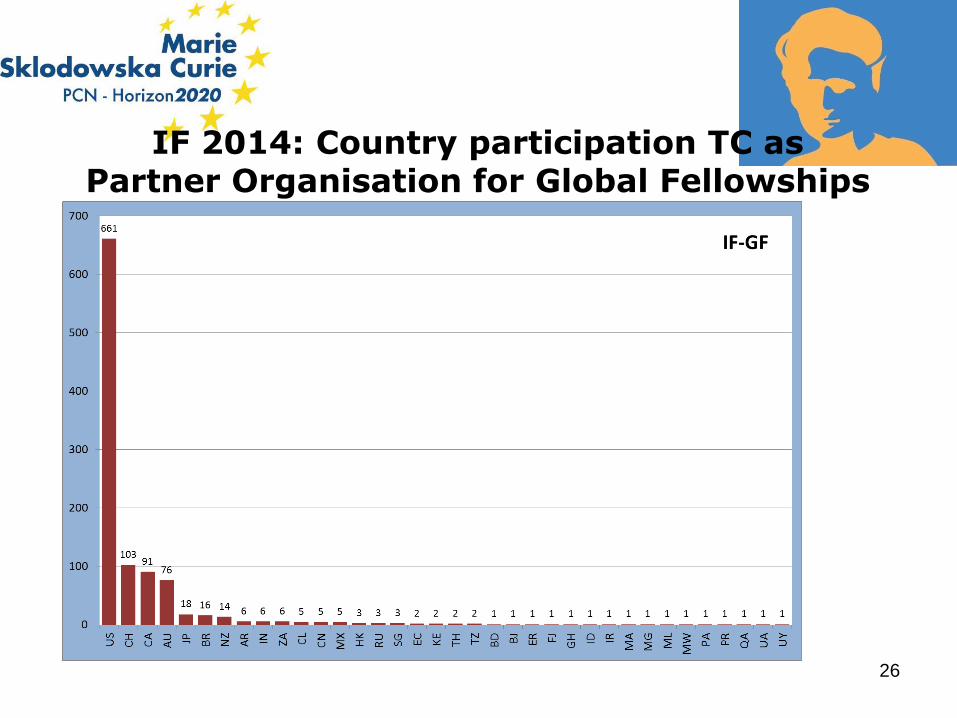
IF 2014: Country participation TC as Partner Organisation for Global Fellowships
26

IF 2014: Submitted (eligible)& A-list proposals
Withdrawals Ineligible InadmissibleST 7 16 5
CAR 2 5 2RI 0 7 0
EF 9 28 7
GF 1 9 8
Total 10 37 15
27
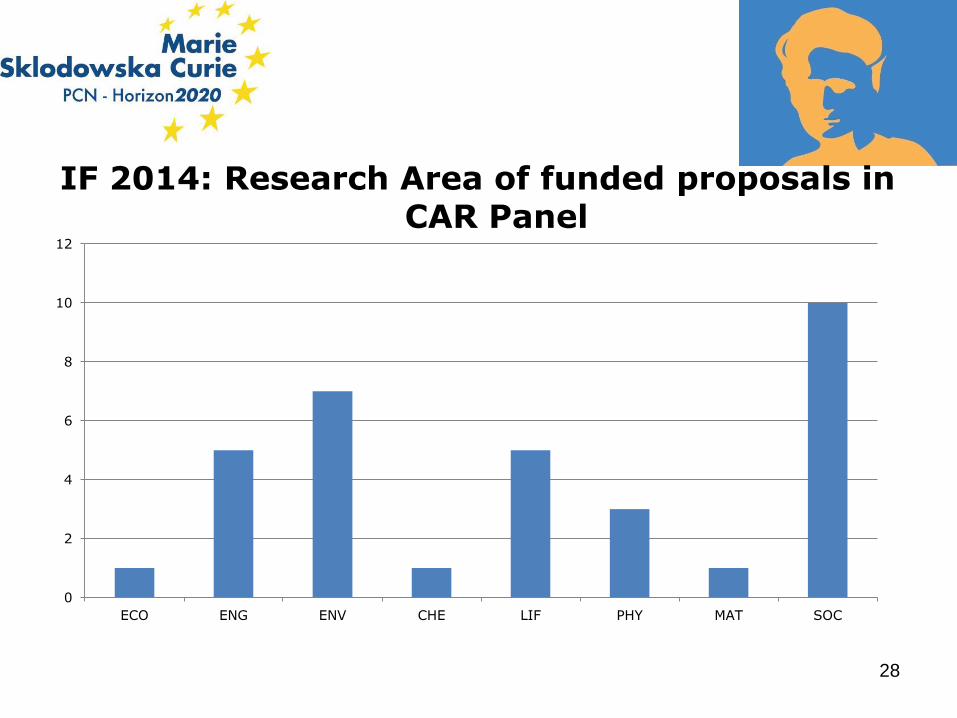
IF 2014: Research Area of funded proposals in CAR Panel
0
2
4
6
8
10
12
ECO ENG ENV CHE LIF PHY MAT SOC
28
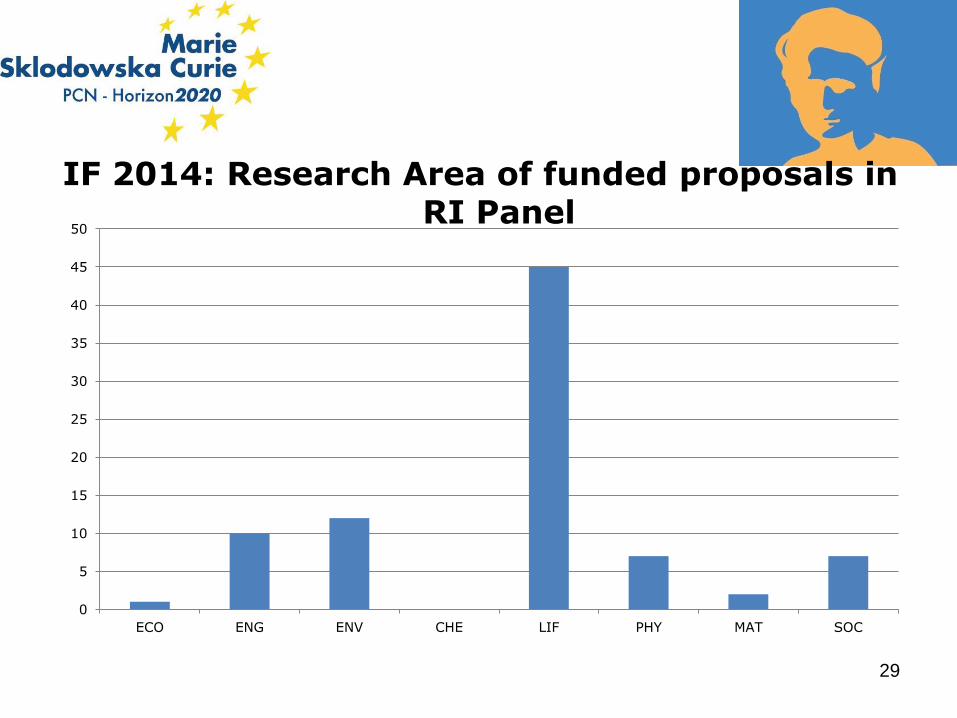
IF 2014: Research Area of funded proposals in RI Panel
0
5
10
15
20
25
30
35
40
45
50
ECO ENG ENV CHE LIF PHY MAT SOC
29

2015
30
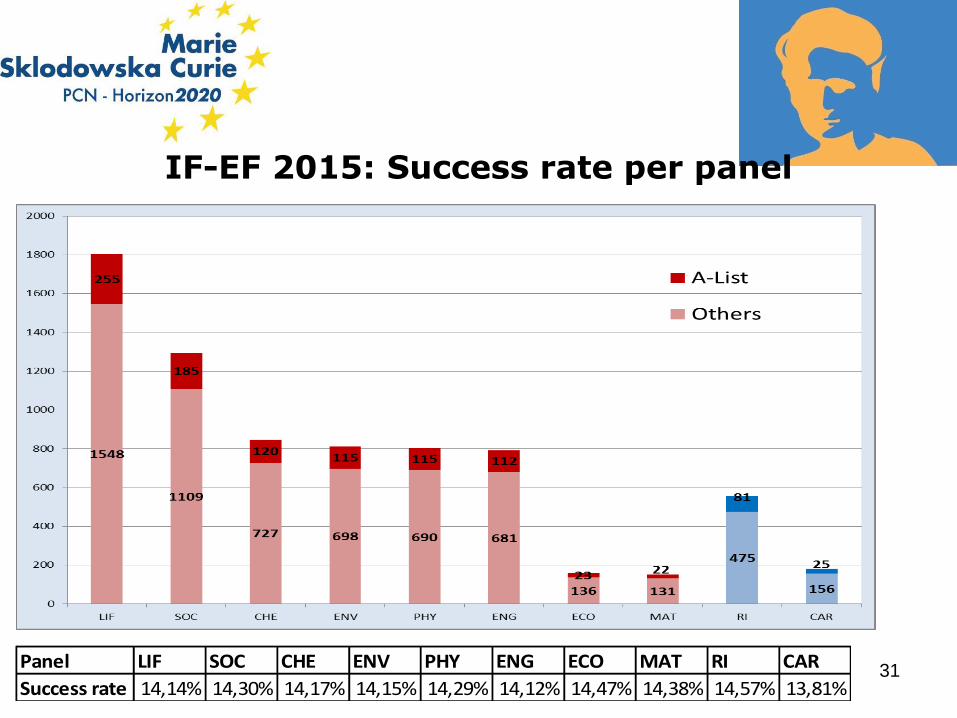
IF-EF 2015: Success rate per panel
Panel LIF SOC CHE ENV PHY ENG ECO MAT RI CAR
Success rate 14,14% 14,30% 14,17% 14,15% 14,29% 14,12% 14,47% 14,38% 14,57% 13,81%31
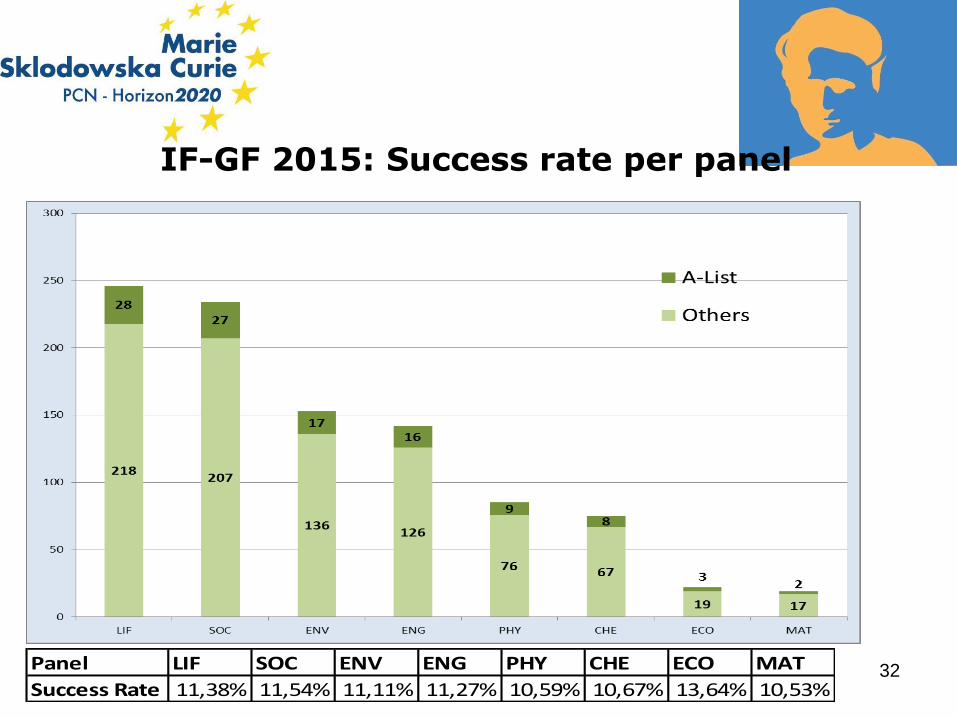
IF-GF 2015: Success rate per panel
Panel LIF SOC ENV ENG PHY CHE ECO MAT
Success Rate 11,38% 11,54% 11,11% 11,27% 10,59% 10,67% 13,64% 10,53%32
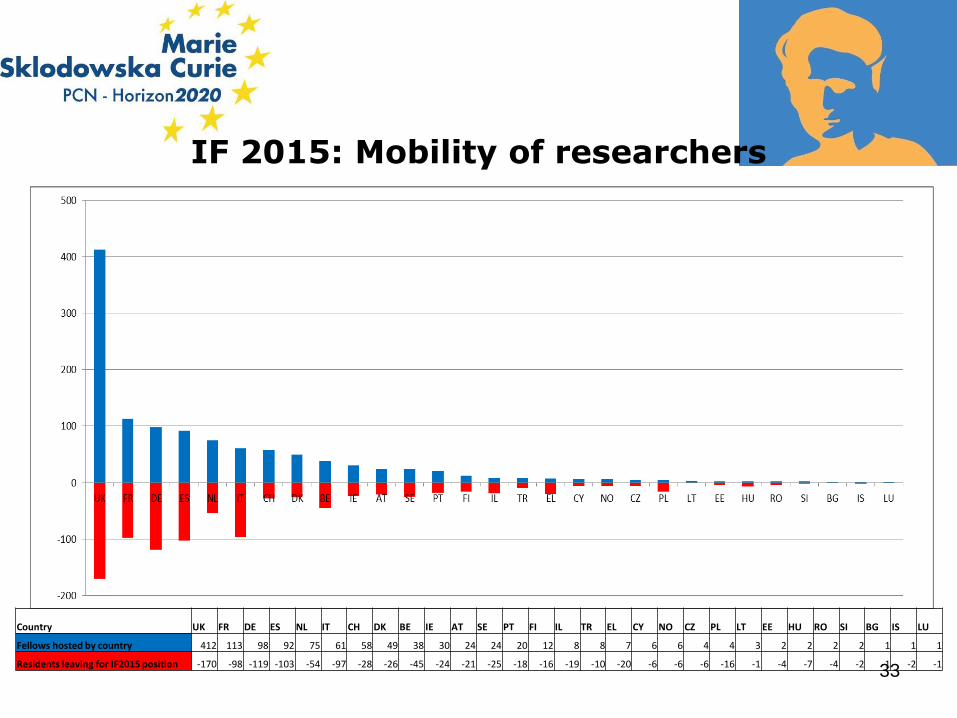
IF 2015: Mobility of researchers
Country UK FR DE ES NL IT CH DK BE IE AT SE PT FI IL TR EL CY NO CZ PL LT EE HU RO SI BG IS LU
Fellows hosted by country 412 113 98 92 75 61 58 49 38 30 24 24 20 12 8 8 7 6 6 4 4 3 2 2 2 2 1 1 1
Residents leaving for IF2015 position -170 -98 -119 -103 -54 -97 -28 -26 -45 -24 -21 -25 -18 -16 -19 -10 -20 -6 -6 -6 -16 -1 -4 -7 -4 -2 -1 -2 -133
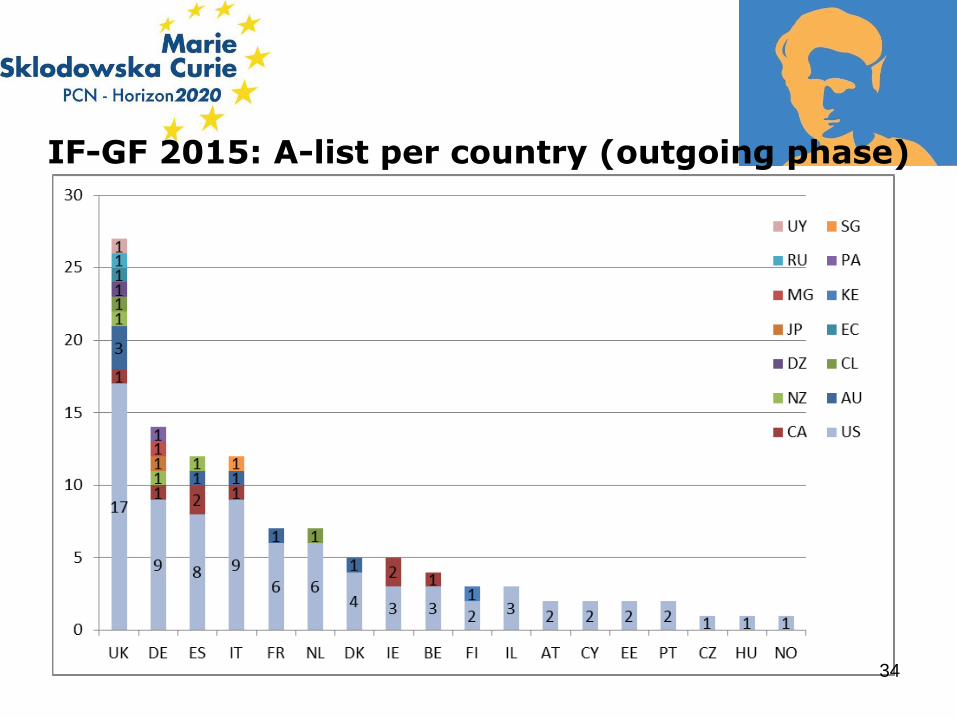
IF-GF 2015: A-list per country (outgoing phase)
34
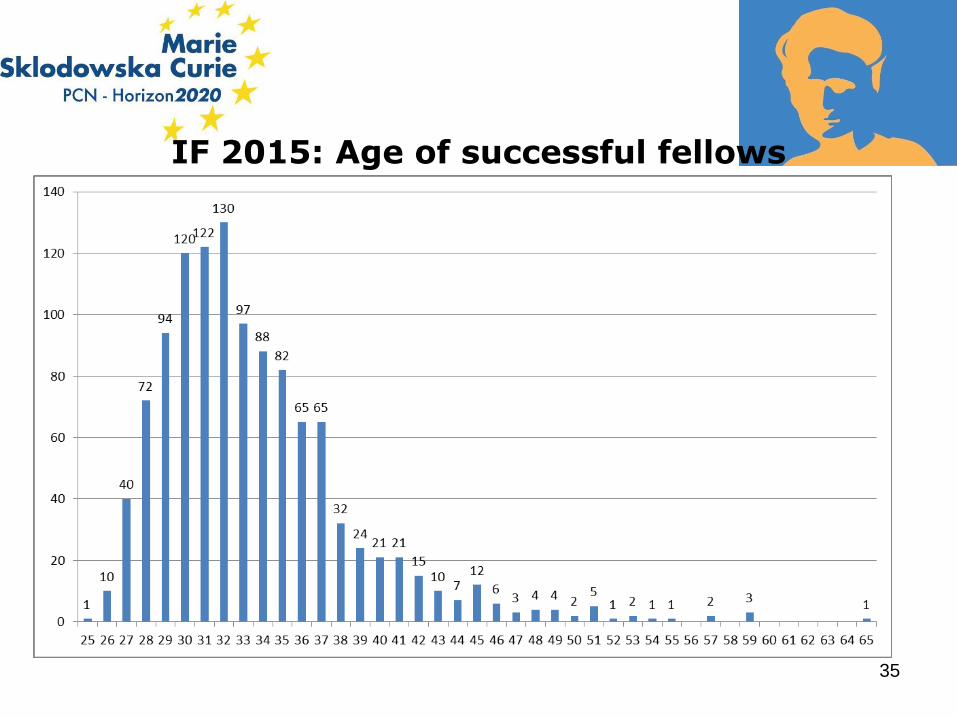
IF 2015: Age of successful fellows
35
2016
36
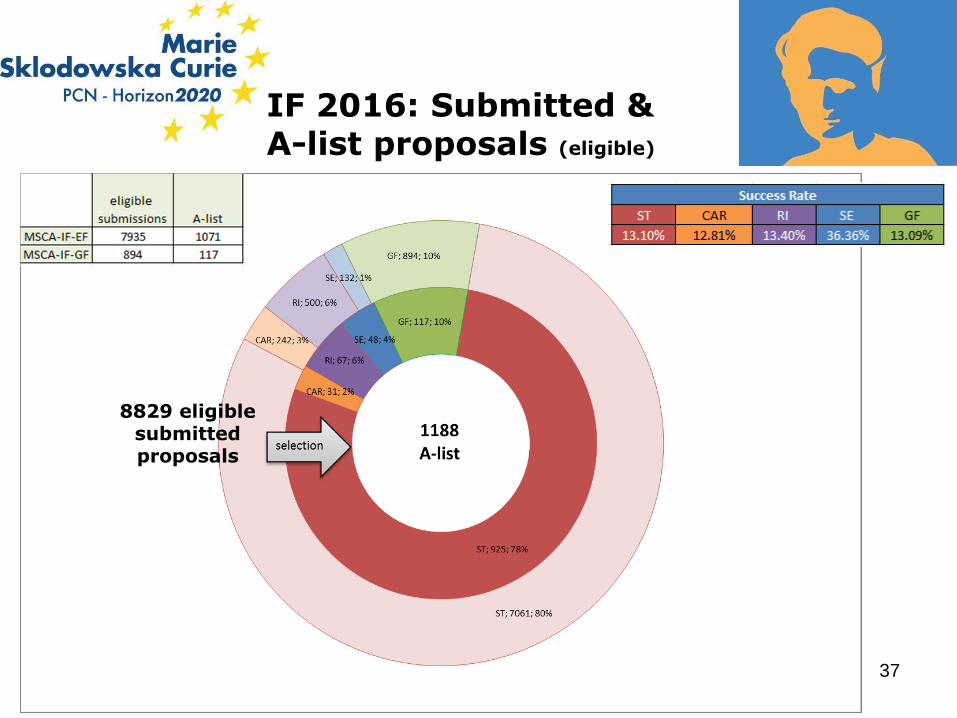
8829 eligible submitted proposals
37
IF 2016: Submitted & A-list proposals (eligible)
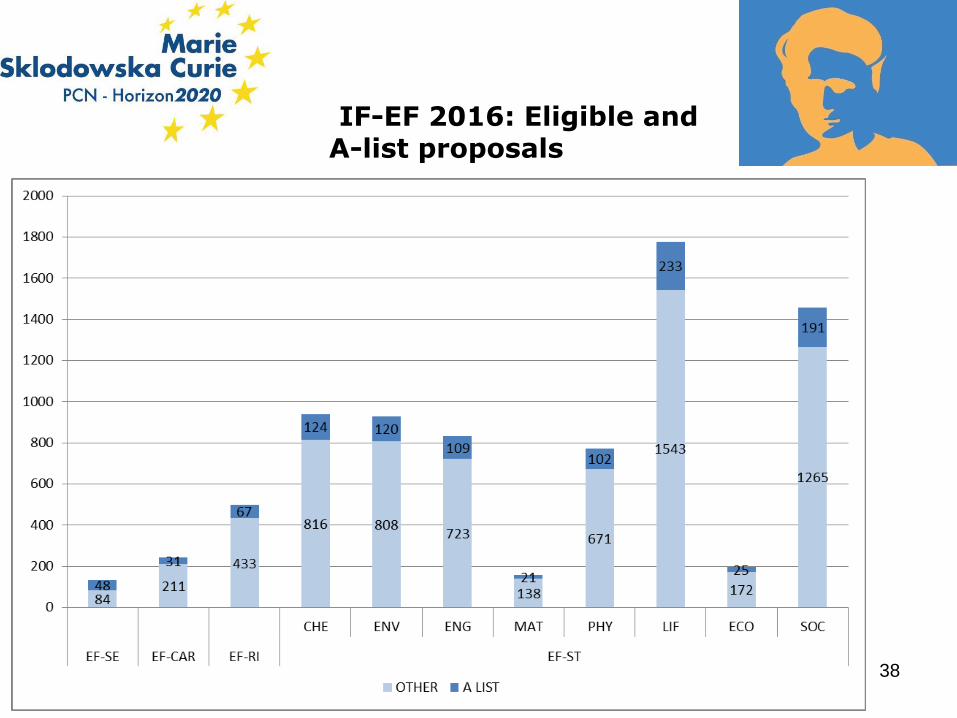
IF-EF 2016: Eligible and A-list proposals by panel
38
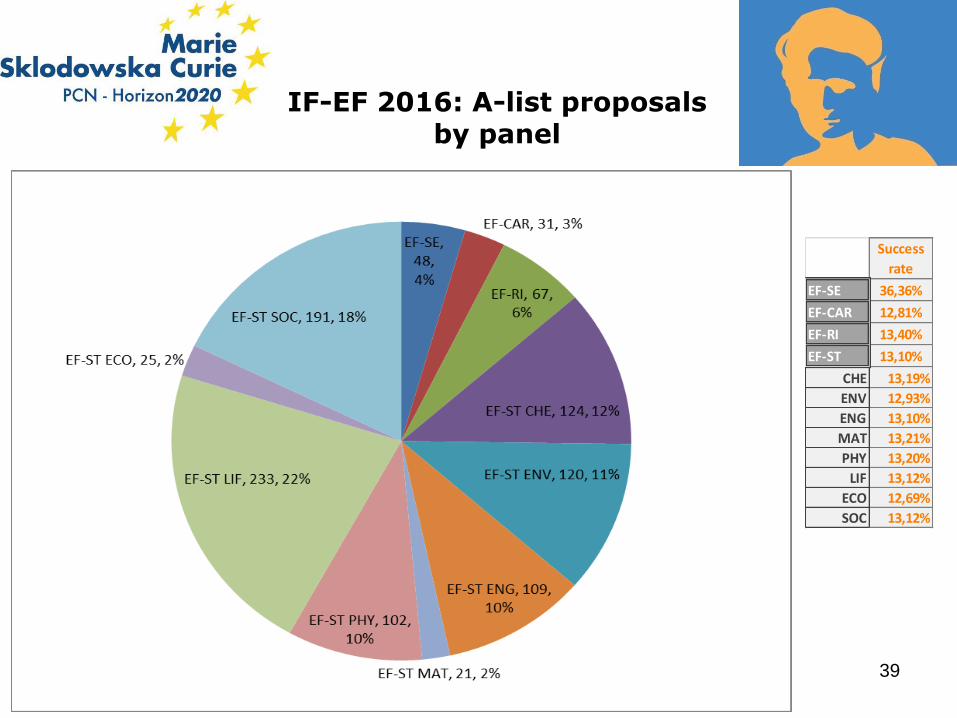
Success
rate
EF-SE 36,36%
EF-CAR 12,81%
EF-RI 13,40%
EF-ST 13,10%
CHE 13,19%
ENV 12,93%
ENG 13,10%
MAT 13,21%
PHY 13,20%
LIF 13,12%
ECO 12,69%
SOC 13,12%
39
IF-EF 2016: A-list proposals by panel
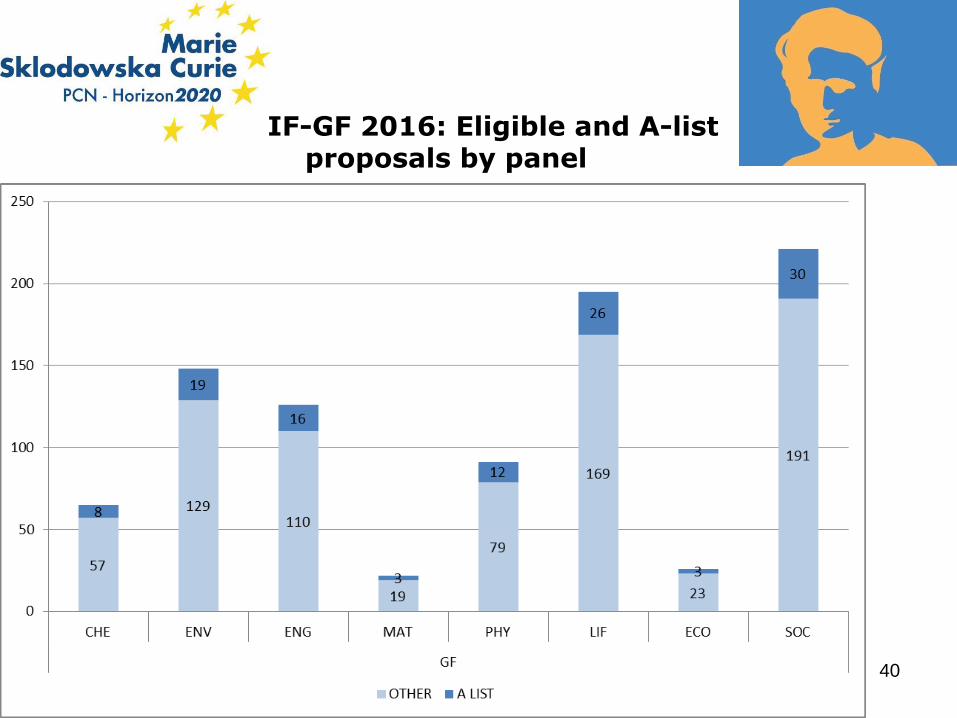
IF-GF 2016: Eligible and A-list proposals by panel
40
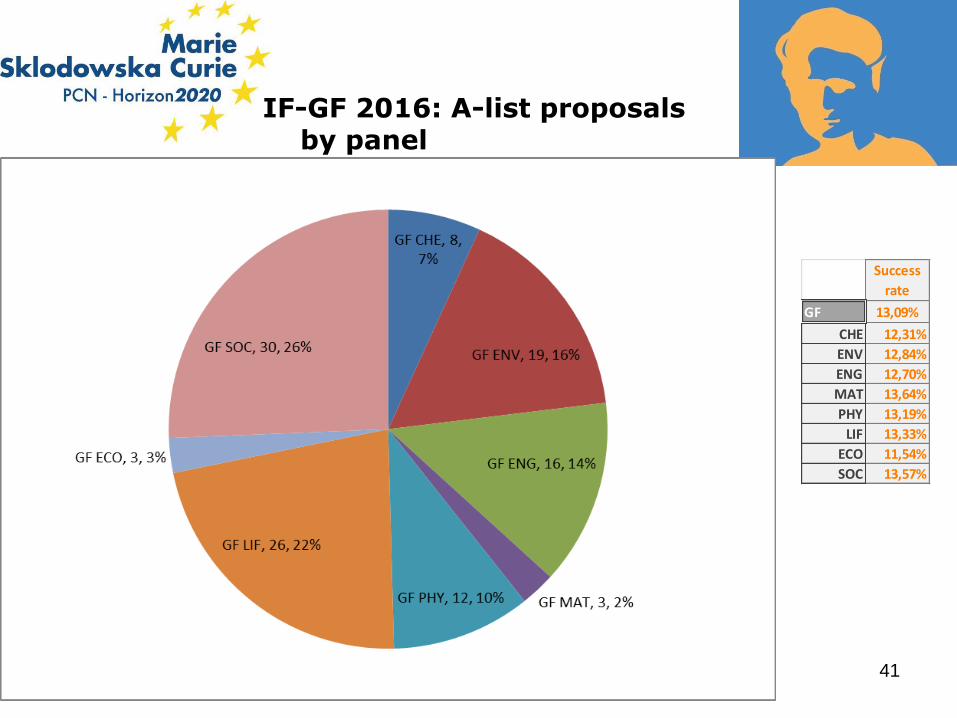
IF-GF 2016: A-list proposals by panel
Success
rate
GF 13,09%
CHE 12,31%
ENV 12,84%
ENG 12,70%
MAT 13,64%
PHY 13,19%
LIF 13,33%
ECO 11,54%
SOC 13,57%
41
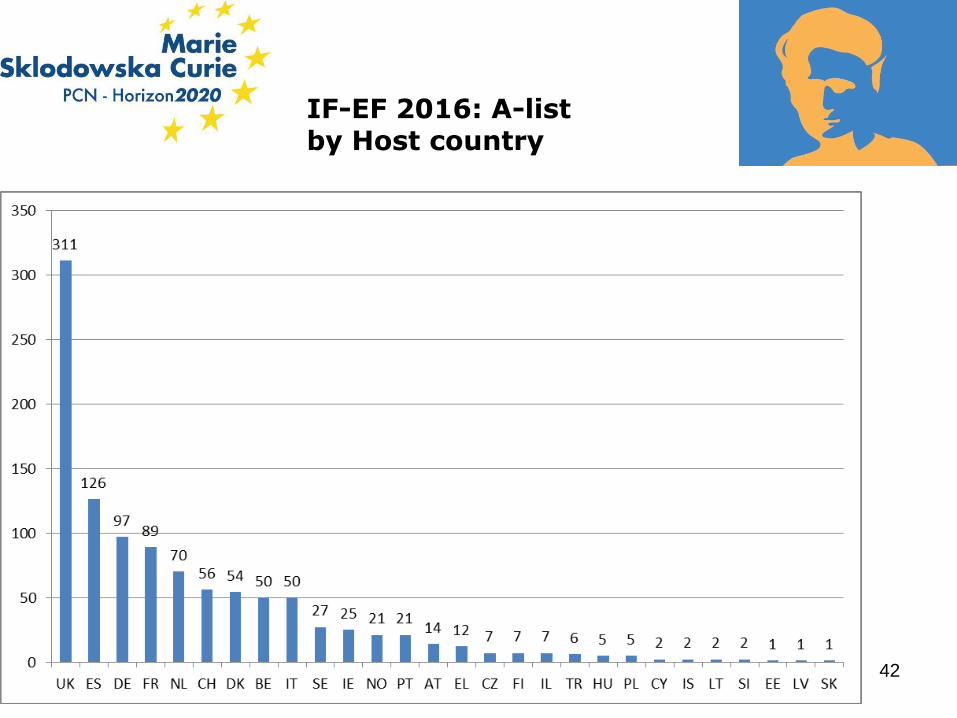
IF-EF 2016: A-listby Host country
42
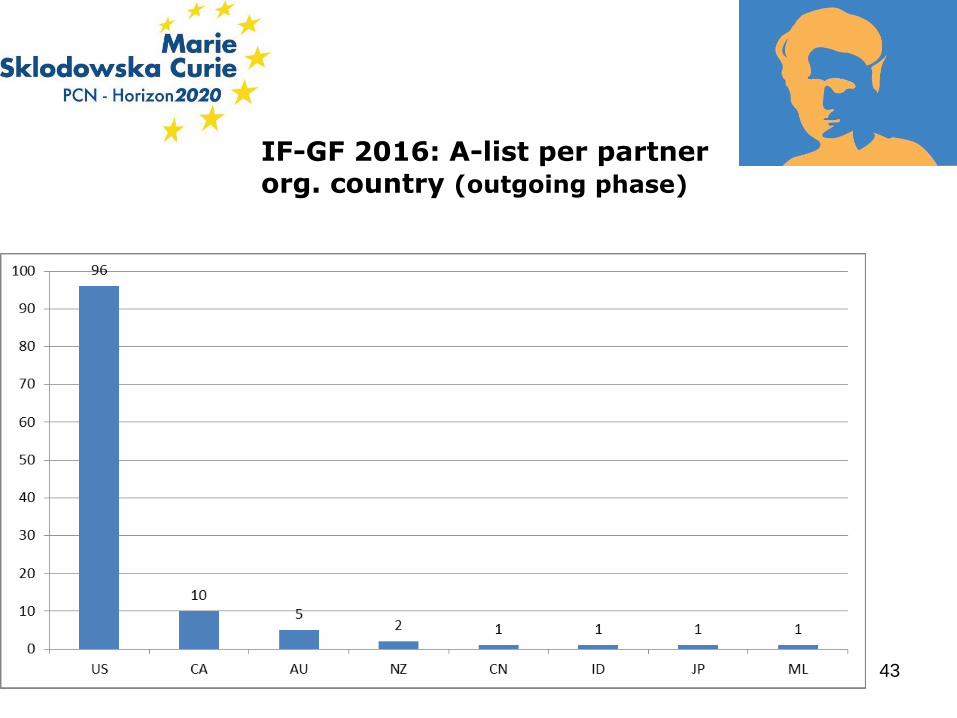
IF-GF 2016: A-list per partner org. country (outgoing phase))
43
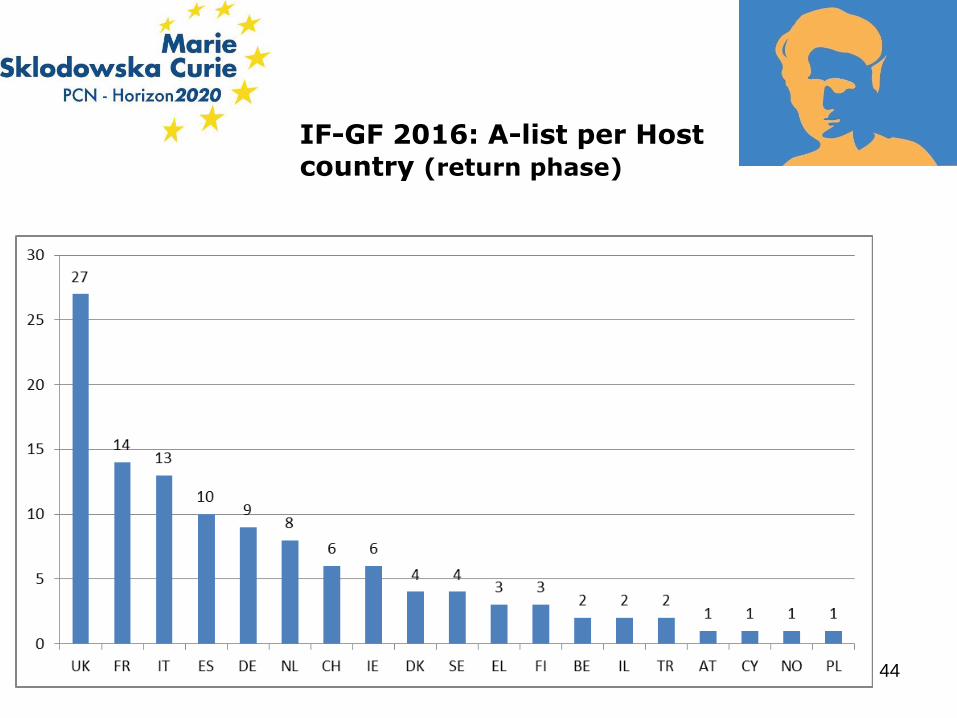
IF-GF 2016: A-list per Host country (return phase)
44
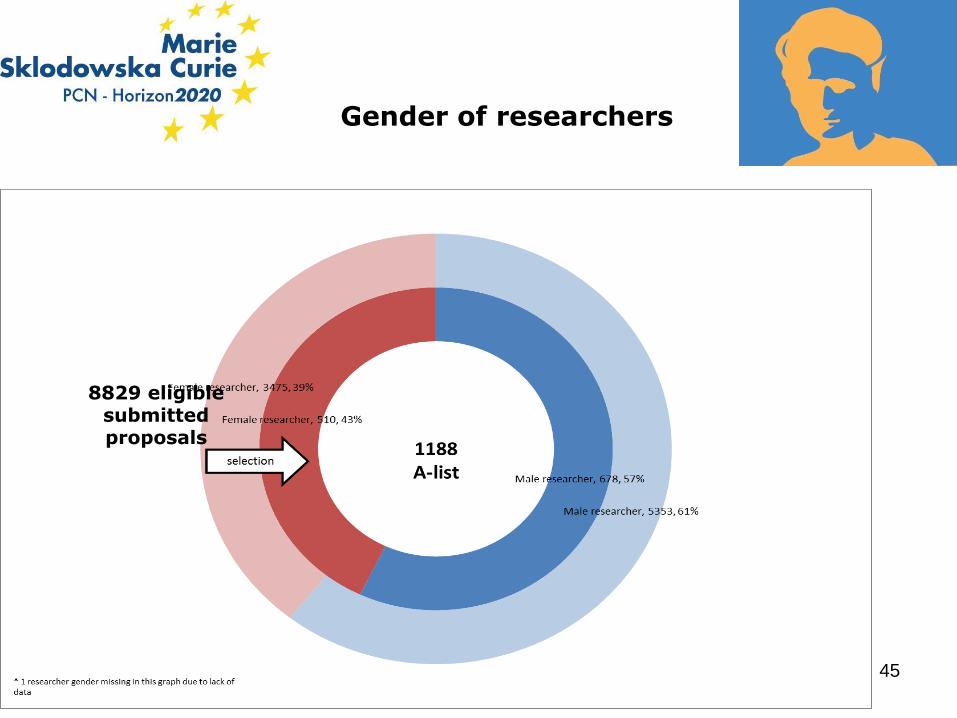
Gender of researchers
8829 eligible submitted proposals
45
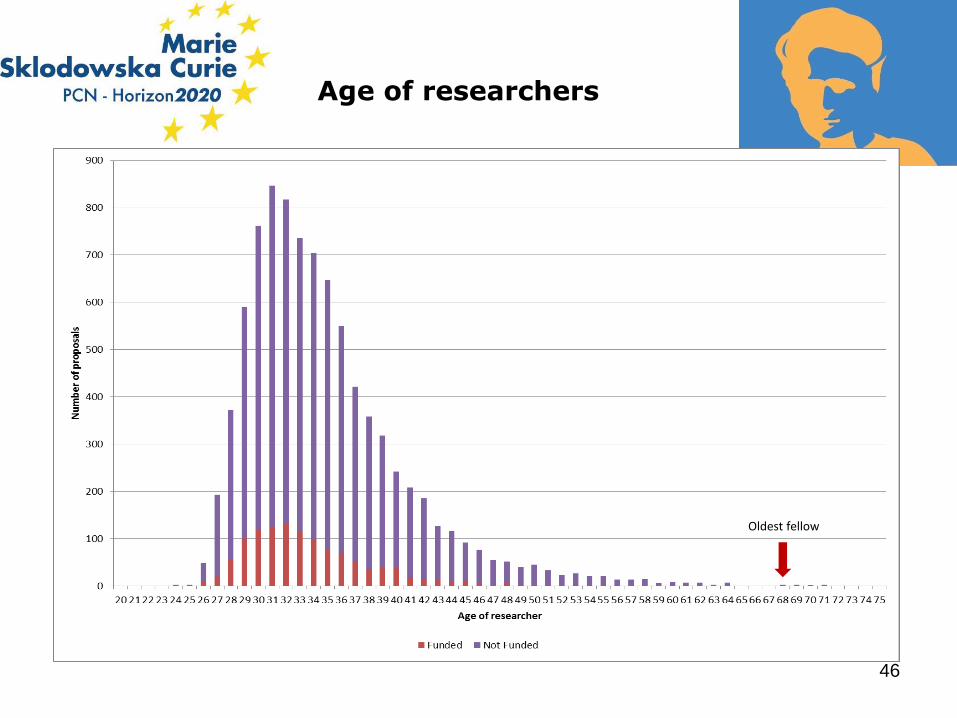
Oldest fellow
46
Age of researchers
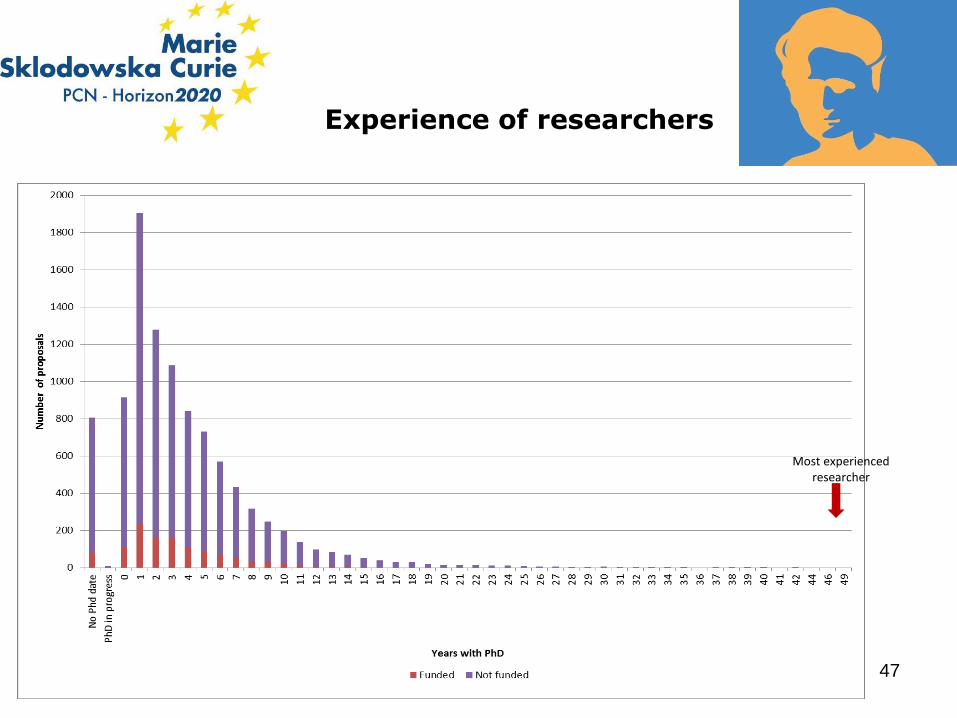
Most experienced researcher
47
Experience of researchers
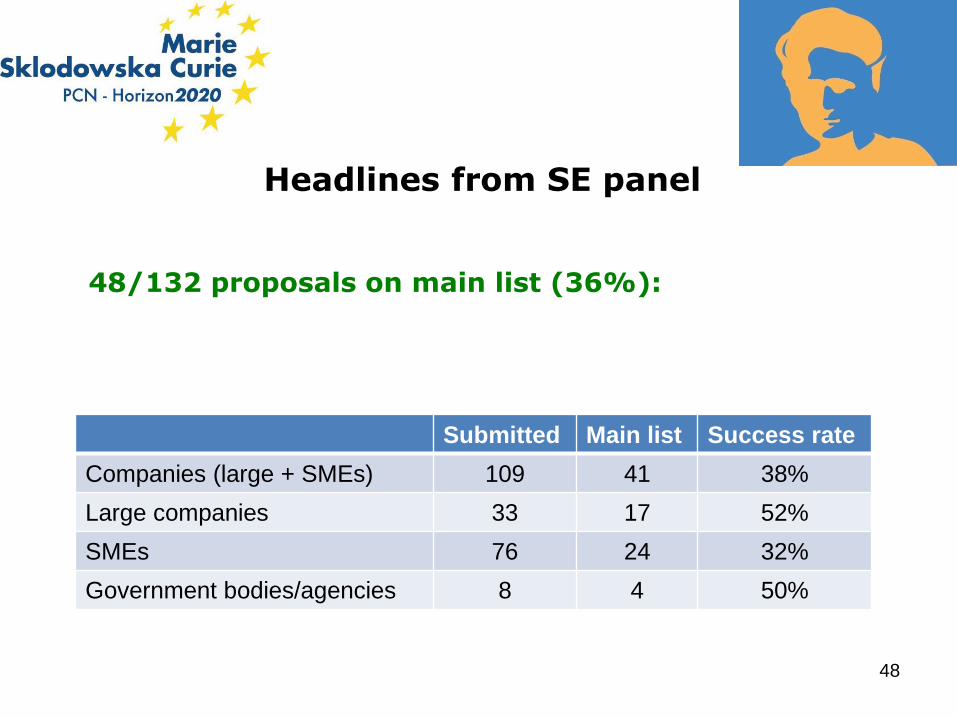
48/132 proposals on main list (36%):
Submitted Main list Success rate
Companies (large + SMEs) 109 41 38%
Large companies 33 17 52%
SMEs 76 24 32%
Government bodies/agencies 8 4 50%
Headlines from SE panel
48
Countries funded:
Diversity: 17 from SE panel, 28 from standard European Fellowships
8 of the top 10 most successful countries in the SE panel are the same as for standard European Fellowships
Scores:
Highest SE score 95.8%, lowest SE score on the main list 80.6%.
The top 28 of SE scored 85% or above
Table with the ranking range of each IF panel is on the Participant Portal
Gender:
47% of applicants to the SE Panel are women. For the IF call as a whole, 39% of the applicants are women.
Success rate of women in the SE panel (47%) was higher than the success rate of men (27%).
Consistency with the rest of IF
49
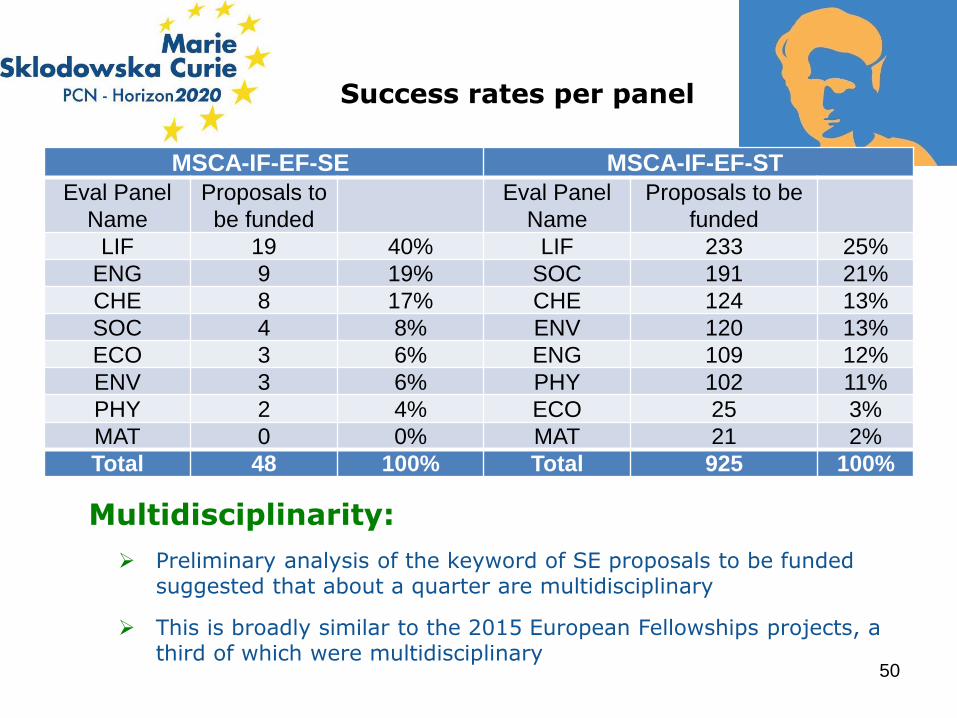
Multidisciplinarity:
Preliminary analysis of the keyword of SE proposals to be funded suggested that about a quarter are multidisciplinary
This is broadly similar to the 2015 European Fellowships projects, a third of which were multidisciplinary
MSCA-IF-EF-SE MSCA-IF-EF-ST
Eval Panel
Name
Proposals to
be funded
Eval Panel
Name
Proposals to be
funded
LIF 19 40% LIF 233 25%
ENG 9 19% SOC 191 21%
CHE 8 17% CHE 124 13%
SOC 4 8% ENV 120 13%
ECO 3 6% ENG 109 12%
ENV 3 6% PHY 102 11%
PHY 2 4% ECO 25 3%
MAT 0 0% MAT 21 2%
Total 48 100% Total 925 100%
Success rates per panel
50
OTHER DATA
51
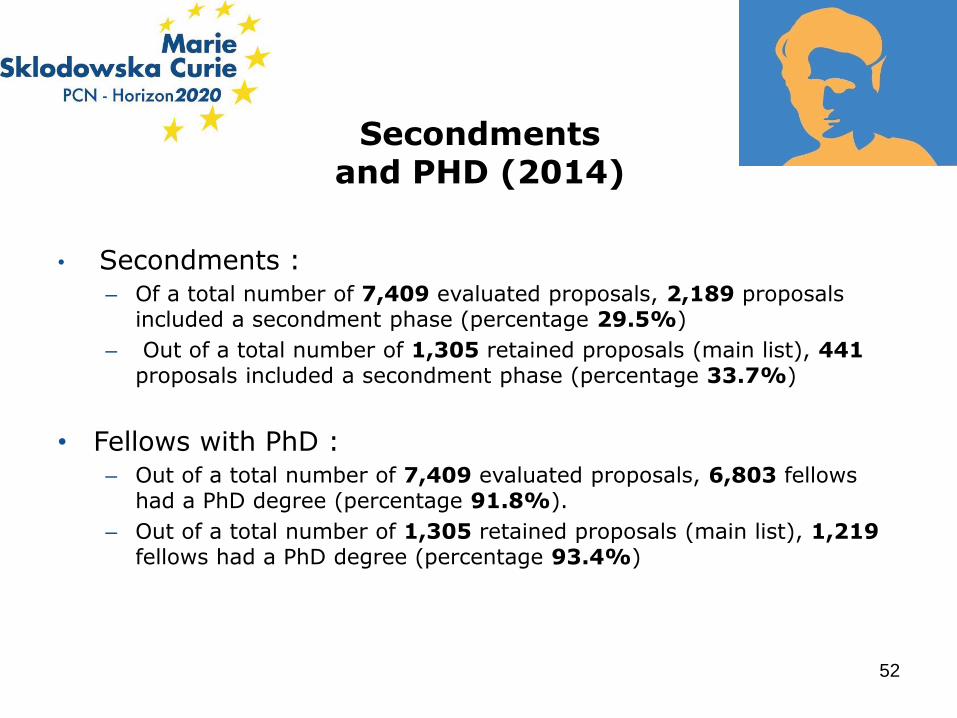
Secondmentsand PHD (2014)
• Secondments : – Of a total number of 7,409 evaluated proposals, 2,189 proposals
included a secondment phase (percentage 29.5%)
– Out of a total number of 1,305 retained proposals (main list), 441proposals included a secondment phase (percentage 33.7%)
• Fellows with PhD :– Out of a total number of 7,409 evaluated proposals, 6,803 fellows
had a PhD degree (percentage 91.8%).
– Out of a total number of 1,305 retained proposals (main list), 1,219fellows had a PhD degree (percentage 93.4%)
52
53
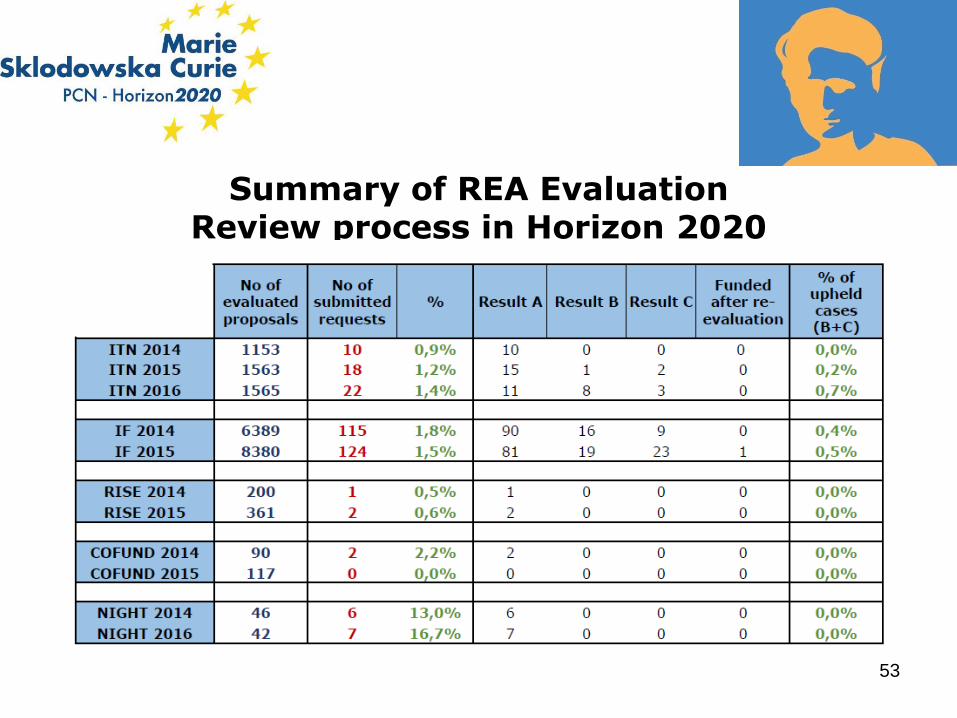
Summary of REA Evaluation Review process in Horizon 2020
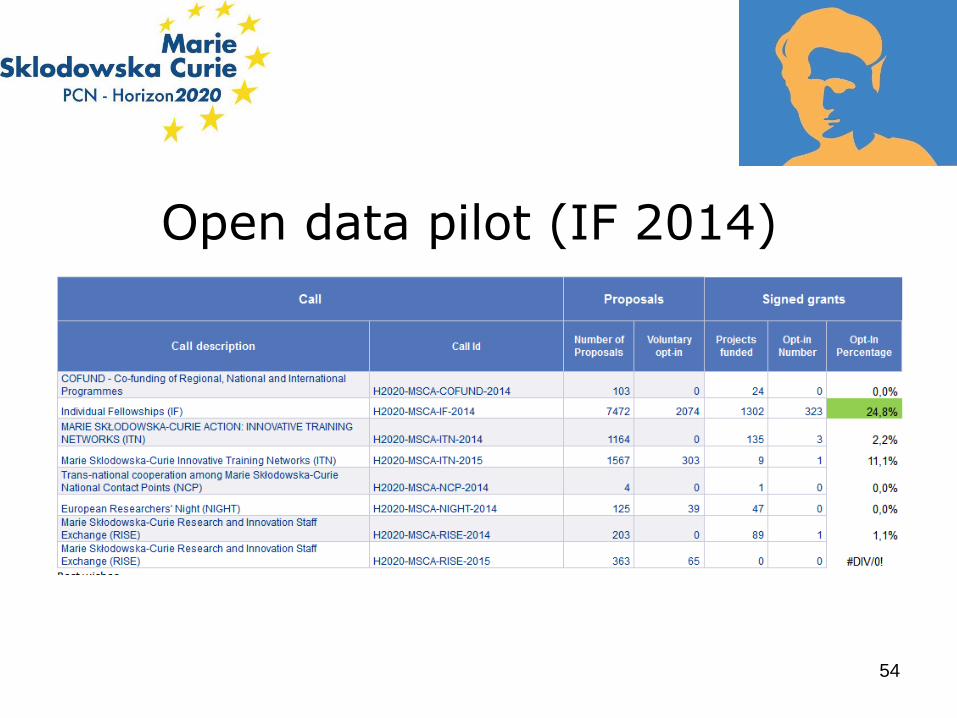
Open data pilot (IF 2014)
54