margins every producer should have 2017 i.s.u. swine day · swine analyst team jayson koopmans sr....
TRANSCRIPT

MARGINS EVERY PRODUCER SHOULD HAVE2017 I.S.U. Swine Day
June 28, 2017


Kent Bang VP & Team LeaderSteve Malakowsky VP Industry SpecialistDaryl Timmerman Sr. Financial Services ExecutiveDusty Compart Assoc. Financial Services Specialist
AgStar Swine Team

AgStar Swine Credit TeamSwine Analyst Team
Jayson Koopmans Sr. Credit DirectorRick Proehl Sr. Credit OfficerChris Murphy Sr. Business AnalystJessica Ziegler Sr. Business AnalystDanica Schmidt Sr. Business AnalystDavid Trahms Financial Services Assoc.
Agenda• Production Metrics • Driving Full-Value Pig Improvement• Lender’s Perspective
– Your Farm’s Competitive Position– How the competition stacks up
• “World Class” production• Challenges
Production Metrics• What we track, we have improved!
– Reproduction Metrics • (FR, Total Born, Born live, PWM, PSY, P/MF/Y)
• What we could do better.– Wean to Finish Metrics– Cost of Production Metrics

PigChamp Database

PigChamp Database

Wean-Finish Metrics• Not a lot of confidence in the numbers
– 85 to 88% of pigs placed in nursery or W-F barn are marketed to primary market (“full value”)
– I think these numbers are improving, but would struggle to convince you with real data, except on individual farms where they have focused on continuous improvement in this area.
• For most, this would be the biggest opportunity to drive better margins!
Drivers of “Percent Full-value Pigs• Pig Health
– Starts with the sow farm– Challenges with co-mingled pigs
• Management– Early care is critical– Temperature, air speed– Identifying poor performers and taking action
• Nutrition– Diet and access to it
• Genetics

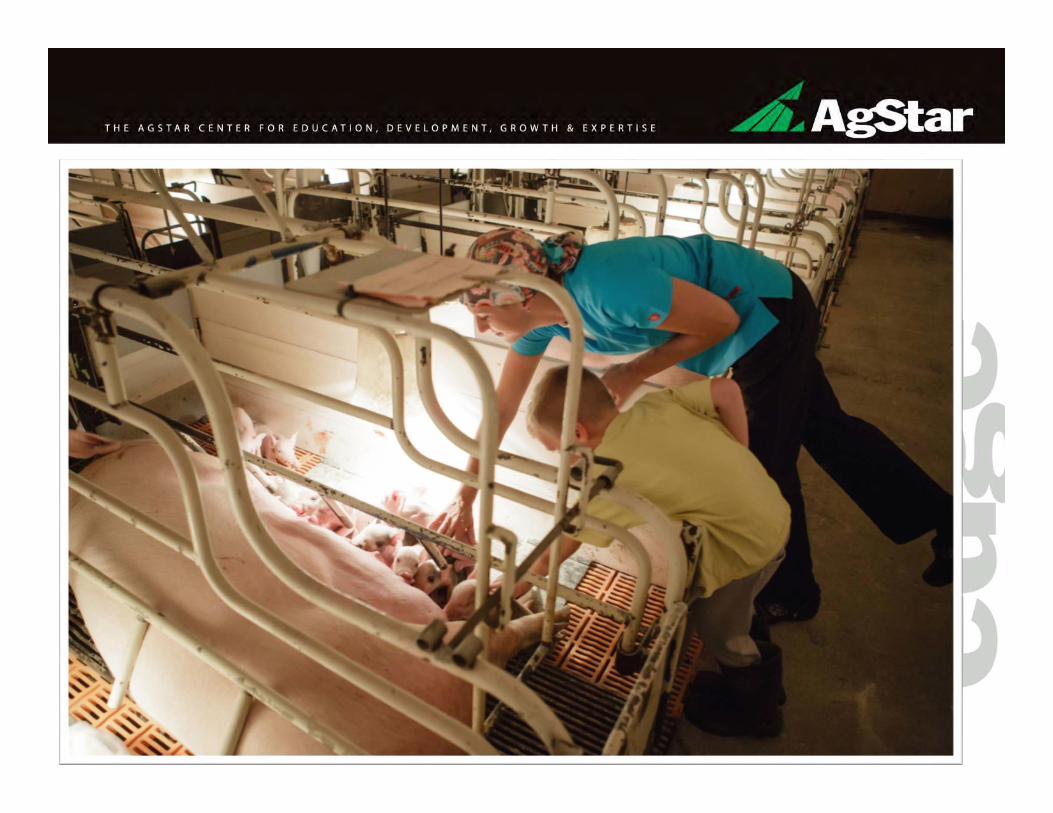
Day One Pig Care

CClena
Animal Husbandry

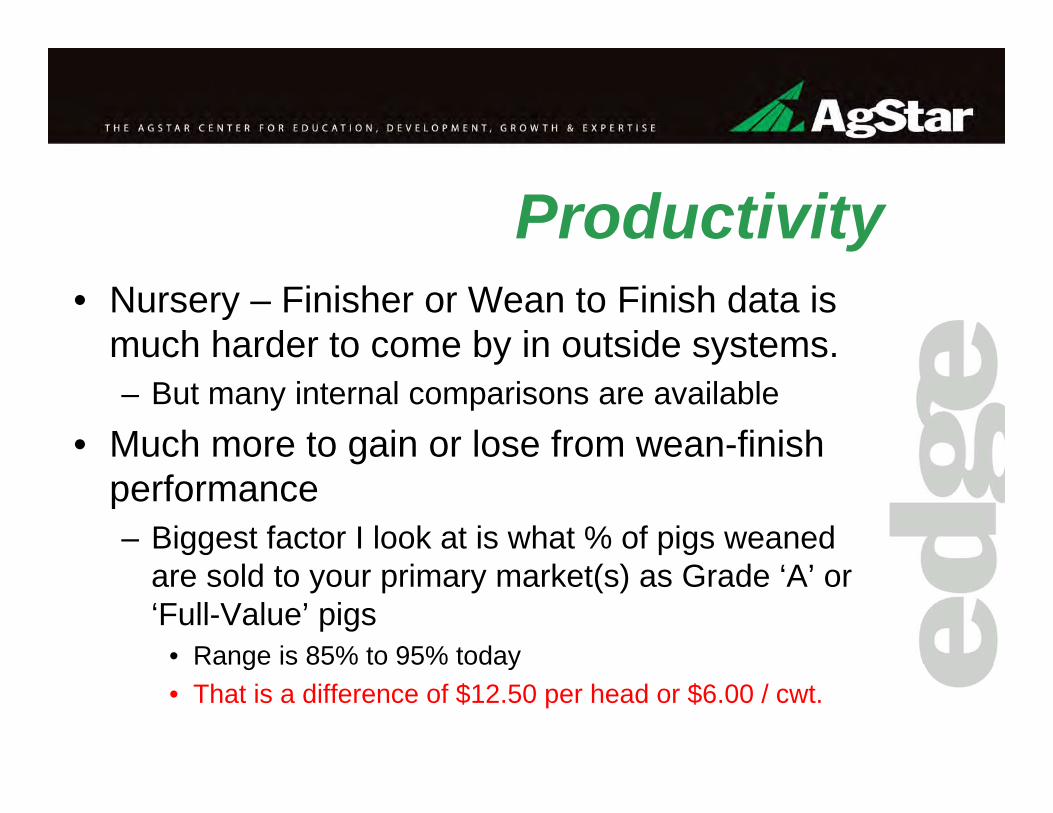
Productivity• Nursery – Finisher or Wean to Finish data is
much harder to come by in outside systems.– But many internal comparisons are available
• Much more to gain or lose from wean-finish performance– Biggest factor I look at is what % of pigs weaned
are sold to your primary market(s) as Grade ‘A’ or ‘Full-Value’ pigs
• Range is 85% to 95% today• That is a difference of $12.50 per head or $6.00 / cwt.

What are the metrics?• Mortality
– Tracking mortality, along with timing and reason• Culls & Euthanasia
– Same as above• Pigs sold at “full-value”
– May be to primary market– May be those that hit a wide weight range– May be those that hit the “box”

Marketing $80 Hogs (210# Carcass)
100% 95% 90% 85%Pigs placed 1,000 1,000 1,000 1,000 Pigs marketed 1,000 950 900 850
Revenue 168,000.00$ 159,600.00$ 151,200.00$ 142,800.00$ Pig cost 36,000.00 36,000.00 36,000.00 36,000.00 Contract 19,000.00 19,000.00 19,000.00 19,000.00 Other 81,120.00 79,120.00 77,120.00 75,120.00 Margin 31,880.00$ 25,480.00$ 19,080.00$ 12,680.00$
Cost of Production 136,120.00$ 134,120.00$ 132,120.00$ 130,120.00$ COP / cwt. 48.61$ 50.42$ 52.43$ 54.67$

Cost of Production• Iowa State Model – 2016 Live weight
– $123.46 Revenue per head $45.73 / cwt.• $74.51 Feed Cost $27.60 / cwt.• $48.37 Non-Feed Cost $17.91 / cwt.• $ 5.30 Death loss $ 1.96 / cwt.
– $128.18 Total Cost per head $47.47 / cwt.
– $(4.72) Profit per head ($1.75) / cwt.

I.S.U. Return Model

I.S.U. Return Model
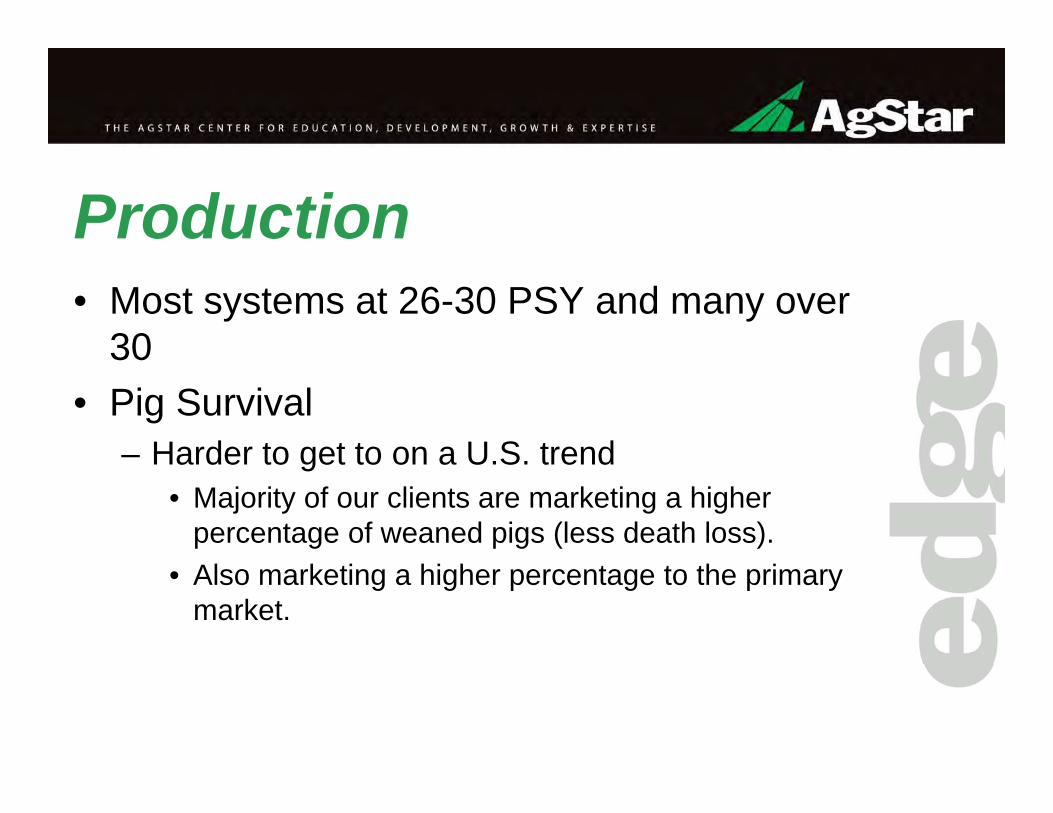
Production• Most systems at 26-30 PSY and many over
30• Pig Survival
– Harder to get to on a U.S. trend• Majority of our clients are marketing a higher
percentage of weaned pigs (less death loss).• Also marketing a higher percentage to the primary
market.

Difference makers• Percentage of pigs weaned that are
marketed to the primary market• Feed efficiency from wean to market
– F/G, kcal / lb. gain, feed cost / lb. of gain• Pig cost at weaning• Pigs per sow / year• Grower space cost / pig marketed or lbs.
marketed• RISK MANAGEMENT
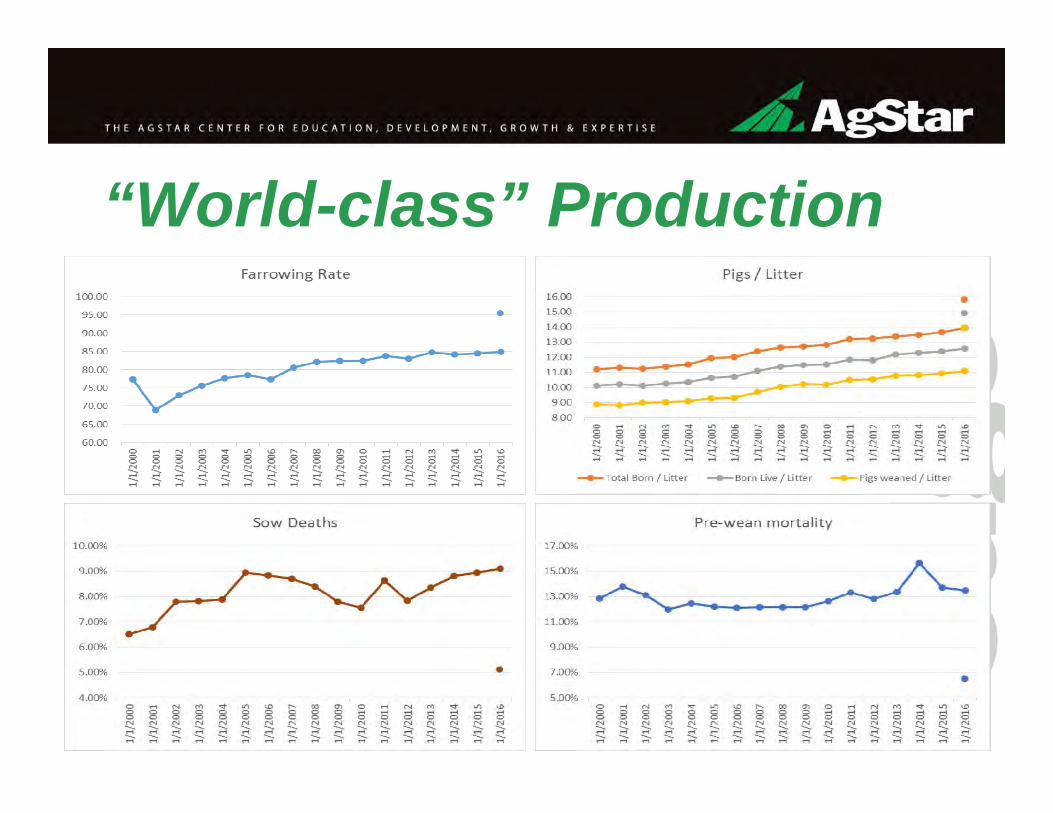
“World-class” Production
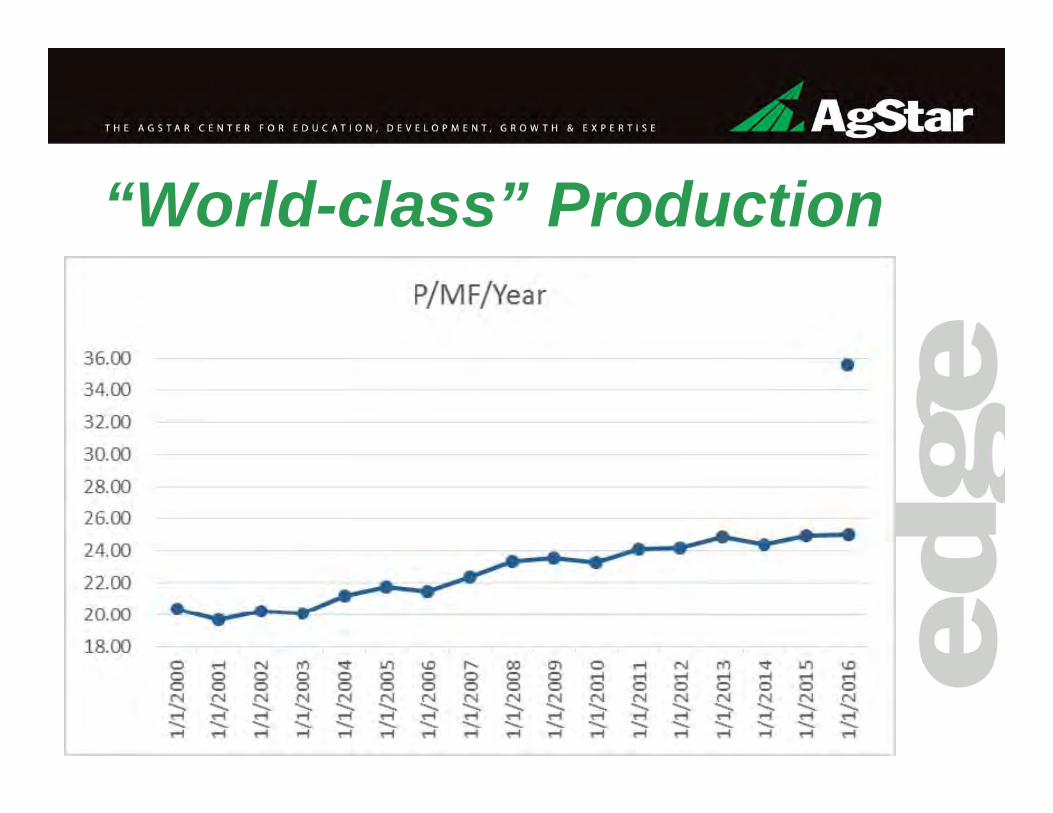
“World-class” Production
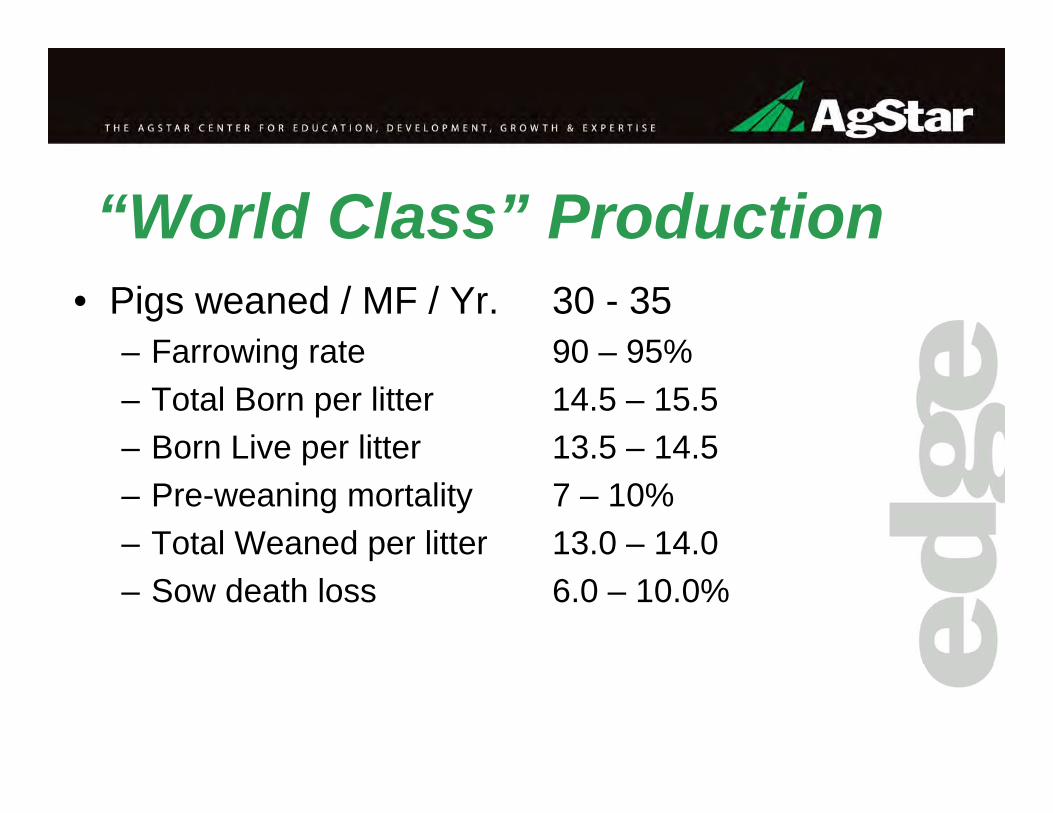
“World Class” Production• Pigs weaned / MF / Yr. 30 - 35
– Farrowing rate 90 – 95%– Total Born per litter 14.5 – 15.5– Born Live per litter 13.5 – 14.5– Pre-weaning mortality 7 – 10%– Total Weaned per litter 13.0 – 14.0– Sow death loss 6.0 – 10.0%
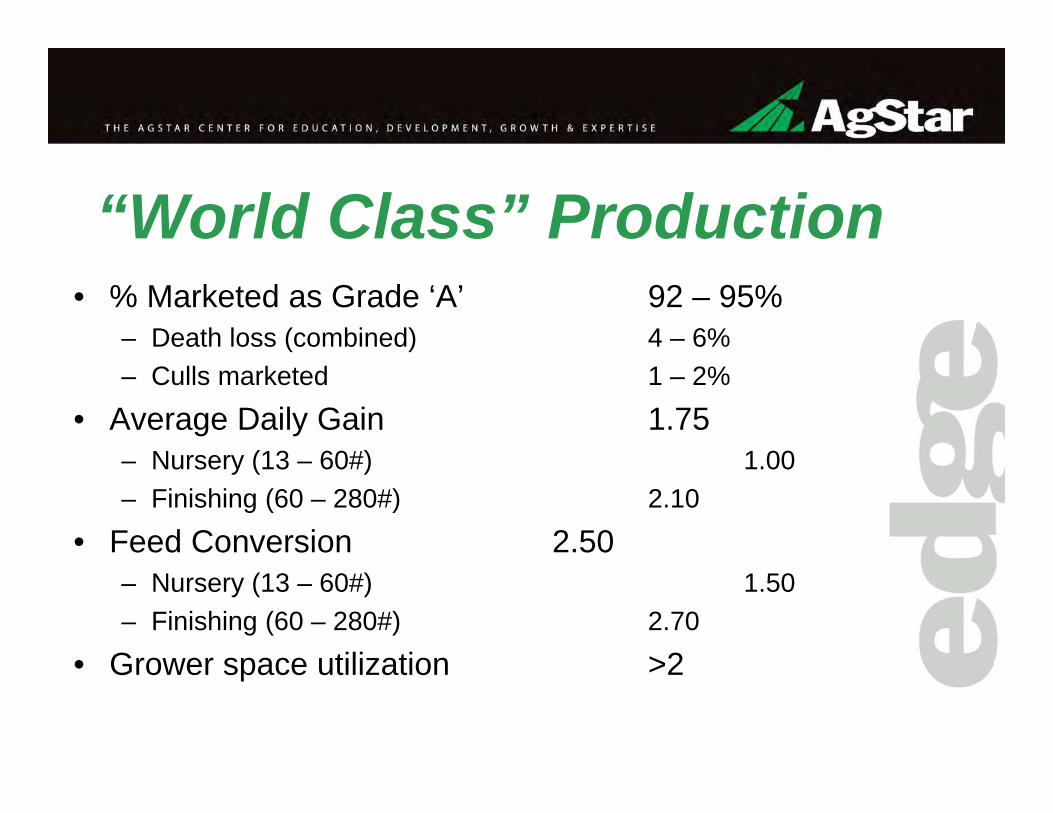
“World Class” Production• % Marketed as Grade ‘A’ 92 – 95%
– Death loss (combined) 4 – 6%– Culls marketed 1 – 2%
• Average Daily Gain 1.75– Nursery (13 – 60#) 1.00– Finishing (60 – 280#) 2.10
• Feed Conversion 2.50– Nursery (13 – 60#) 1.50– Finishing (60 – 280#) 2.70
• Grower space utilization >2

Target Mortality (W-F)• Weaning – 3 weeks post-weaning 1.0%• 3 – 12 weeks post-weaning 0.5%• 12 weeks post-weaning to market 1.5%
• Culls (Euthanasia & Marketed) 2.0%
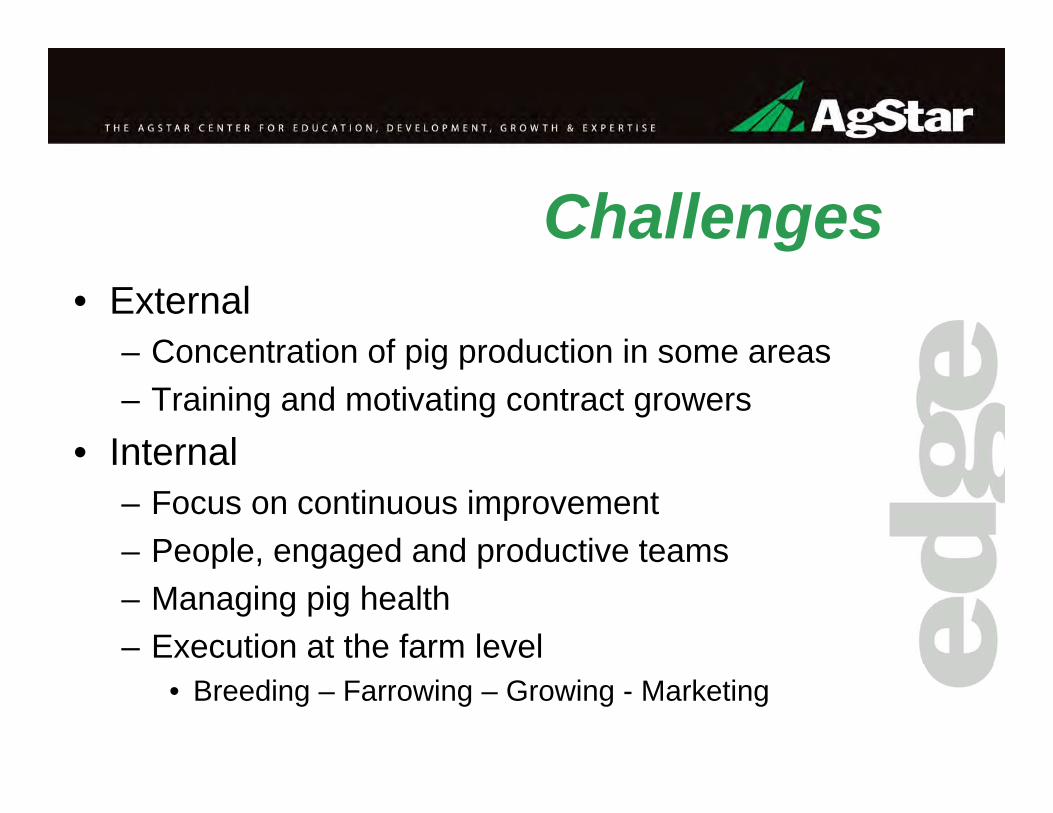
Challenges• External
– Concentration of pig production in some areas– Training and motivating contract growers
• Internal– Focus on continuous improvement– People, engaged and productive teams– Managing pig health– Execution at the farm level
• Breeding – Farrowing – Growing - Marketing

Questions / Discussion
For the latest updates within the swine industry, check out AgStar’s Hog Blog at: www.AgStarEdge.com