march 2013 special reports - motilal · pdf filespecial reports: (a) result update –...
TRANSCRIPT

Special Reports: (a) Result update – ONGC, Oil India, GAIL, BPCL, HPCL and IOCL. Cut in OPEC supply strengthens crude prices: Brent prices
moved up to USD 116/bbl (+3% MoM) in Feb-13, mainly due to supply cuts by OPEC (~1 mmbbl/d) and returning positive sentiments on the demand front.
Reuters Singapore GRM up 48% MoM to USD10.5/bbl: Driven by high auto fuel cracks and large shutdowns. Medium-term GRM outlook continues to be subdued due to over capacity and sluggish global demand. Expect GRM to be volatile (occasional spurts) due to occasional bunching up of shutdowns.
Petchem margins seem to be in recovery mode: Key product margins are marginally up MoM (except PVC) and seem to be in the recovery mode. Domestic price premium in PP/PVC improved marginally MoM while premium to PE reduced.
Stock performance: OINL was the top performing stock in O&G space in Jan-13 with 2% absolute and 5% relative return. We expect ONGC and OINL to continue to rally on back of diesel reforms and expected natural gas price hike.
Valuation and view: On the back of ongoing reforms, we continue our positive
stance on upstream (ONGC/OIL) and OMC's. BPCL is top pick among OMC's for its E&P upside potential. RIL's new refining/petchem projects likely to add to earnings
from end-FY15/FY16, but medium-term outlook on core business remain weak with RoE reaching sub-13%, Neutral.
Neutral on GAIL/GSPL due to headwinds on incremental gas. However, domestic gas scarcity augurs well for Petronet LNG.
Valuation: Coverage universe
0
4
8
12
Feb-10 Feb-11 Feb-12 Feb-13
Reuters Singapore GRM (USD/bbl)
1-M Relative Stock Performance Chart of the month
1
2
(1)
(0)
(2)
(5)
(2)
2
(6)
(6)
5
(0)
(4)
(3)
IGL
PLNG
GSPL
GAIL
CPCL
MRPL
IOC
BPCL
HPCL
OINL
ONGC
CAIRN
RIL
Intg
/Ups
trea
mO
MC'
sG
as/C
GD
Refi
ners
Reco M Cap P/E (x) P/B (x) EV/EBITDA (x) USD b FY13E FY14E FY15E FY13E FY14E FY15E FY13E FY14E FY15E
Integrated/UpstreamRIL* Neutra l 50.1 11.8 11.5 10.7 1.4 1.2 1.1 9.0 8.9 8.3 ONGC Buy 51.0 11.1 8.7 6.0 1.8 1.6 1.4 4.7 3.6 2.5 CAIRN Neutra l 10.8 4.7 5.6 5.6 1.2 1.1 0.9 3.5 3.2 2.6 OINL Buy 6.1 9.7 7.3 5.4 1.7 1.5 1.2 5.6 3.5 2.3 OMCsIOC Buy 14.0 13.3 11.3 9.3 1.2 1.1 1.0 11.6 8.6 7.1 BPCL Buy 5.3 13.7 13.4 11.6 1.7 1.5 1.4 9.7 7.6 6.8 HPCL Buy 1.9 18.9 12.0 10.4 0.8 0.7 0.7 26.9 10.9 9.0 Independent RefinersMRPL Neutra l 1.8 NA 7.2 6.3 1.3 1.2 1.0 11.4 4.9 4.0 CPCL Buy 0.3 NA 5.4 5.2 0.7 0.6 0.6 NA 5.3 4.9 Gas CompaniesGAIL** Neutra l 8.0 10.8 9.8 10.0 1.8 1.6 1.4 4.3 3.9 3.8 GSPL Neutra l 0.7 7.7 7.6 7.2 1.3 1.1 1.0 4.4 4.0 3.9 PLNG Buy 2.0 9.5 10.9 9.4 2.5 2.1 1.8 7.1 6.8 5.9 IGL UR 0.7 11.2 10.1 8.7 2.7 2.3 2.0 5.8 5.0 4.1 *No. of shares adj. for treasury shares ; **P/E adj. for investments
0
5
10
15
20
Feb-10 Feb-11 Feb-12 Feb-13
Gasoline cracks (USD/bbl)
March 2013
Index
Special Report
3QFY13 Results Update: (ONGC, Oil India, GAIL, BPCL, HPCL, IOCL) …..............................……………………………3-8
Oil market trends…………………………………………………………………………………….…………………………………………………………………9
US weekly petroleum data………………………………………………………………………………….……………………….………………………….10
GRM and product spreads ……………………………………………………..……………………………………………………………………………….11
Petchem margin trend………………………………….…………..……………………………………………………………………………………………..13
Refinery throughput and domestic consumption……………………………………………….…………………………………………………..16
Update on under-recoveries and domestic fuel pricing…………………………………………………………………………………………..17
Industry News…………………………………………………………………..……………………………………………………………………………………..19
O&G stock performances during the month…………………..……………………………………………………………………………………….22
Valuation comparison to Global peers…………………..………………………………………………………………………………………………..23
2 March 2013

ONGC reported net sales at INR210b (v/s est of INR199b, adj. for subsidy), EBITDA at INR112b (v/s est of INR103b, adj. for subsidy), and PAT at INR56b (v/s est of INR52b, adj. for subsidy), up 20% YoY and down 6% QoQ.
Reported numbers were above estimates primarily due to (a) higher standalone oil sales at 4.9mmt (v/s est 4.7mmt) due to reduction in BS&W (basin sediments and water) content and (b) higher VAP realizations.
3QFY13 gross realization stood at USD110/bbl (flat QoQ and v/s USD111.7/bbl in 3QFY12). Subsidy was below estimate at USD62.2/bbl (v/s est of USD64.4/ bbl; USD63 in 2QFY13 and USD66.8 in 3QFY12), lower by ~USD2/bbl than our estimate, primarily due to higher oil sales (used in denominator to calculate per bbl subsidy) and resulting in higher net realization at USD48/bbl (v/s USD46.8/bbl in 2QFY13 and USD45 in 3QFY12). Subsidy sharing for the quarter in absolute terms stood at INR124.3b, largely flat on a YoY and QoQ basis.
D,D&A at INR44b was marginally higher, while other income was marginally lower than estimate at INR14b (est INR15b). FY14 oil production guidance higher than our estimate: ONGC expects FY14 domestic oil production at 29.1mmt (standalone: 25.8
and JV: 3.3) and gas production at 26.5bcm (standalone: 24.6 and JV: 1.8) v/s our estimate of domestic oil production at 28.1mmt and gas production at 26.6bcm.
Upstream sharing in 9MFY13 at 36%; we model 40% in FY13: ONGC's 3QFY13 subsidy stood at INR124b and its share in upstream stood at 82.4% (v/s 82% in 9MFY13 and 80.8% in FY12). With FY13E under-recoveries at >INR1.6t (v/s INR1.4t in FY12) and given the precarious government financials, we believe FY13 upstream will be higher and model upstream subsidy sharing at 40%.
Valuation and view: We estimate gas price of USD7/mmbtu from FY15E for ONGC. Also, in line with the announced reforms, we
3QFY13 Results Update: ONGC
estimate a 30% and 50% reduction in under-recoveries in FY14E and FY15E respectively from the FY13 base. However, we have conservatively assumed a higher upstream sharing of 50%/60% in FY14E/15E to compensate for increased earnings. Our SOTP-based target price for ONGC stands at INR402/sh. Buy.
SPECIAL REPORT
3 March 2013
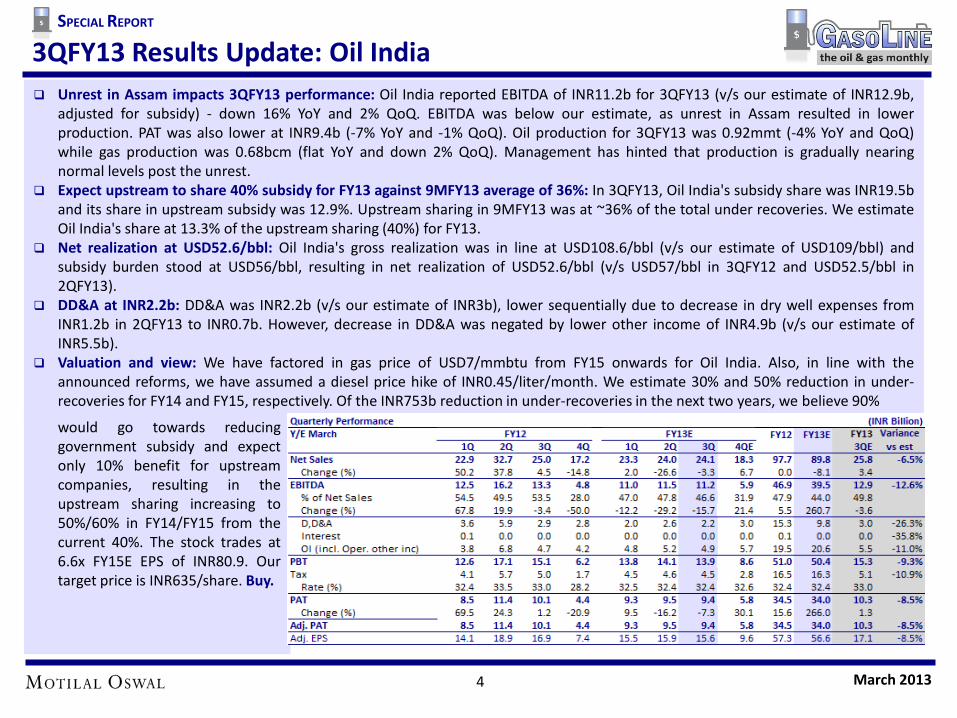
Unrest in Assam impacts 3QFY13 performance: Oil India reported EBITDA of INR11.2b for 3QFY13 (v/s our estimate of INR12.9b, adjusted for subsidy) - down 16% YoY and 2% QoQ. EBITDA was below our estimate, as unrest in Assam resulted in lower production. PAT was also lower at INR9.4b (-7% YoY and -1% QoQ). Oil production for 3QFY13 was 0.92mmt (-4% YoY and QoQ) while gas production was 0.68bcm (flat YoY and down 2% QoQ). Management has hinted that production is gradually nearing normal levels post the unrest.
Expect upstream to share 40% subsidy for FY13 against 9MFY13 average of 36%: In 3QFY13, Oil India's subsidy share was INR19.5b and its share in upstream subsidy was 12.9%. Upstream sharing in 9MFY13 was at ~36% of the total under recoveries. We estimate Oil India's share at 13.3% of the upstream sharing (40%) for FY13.
Net realization at USD52.6/bbl: Oil India's gross realization was in line at USD108.6/bbl (v/s our estimate of USD109/bbl) and subsidy burden stood at USD56/bbl, resulting in net realization of USD52.6/bbl (v/s USD57/bbl in 3QFY12 and USD52.5/bbl in 2QFY13).
DD&A at INR2.2b: DD&A was INR2.2b (v/s our estimate of INR3b), lower sequentially due to decrease in dry well expenses from INR1.2b in 2QFY13 to INR0.7b. However, decrease in DD&A was negated by lower other income of INR4.9b (v/s our estimate of INR5.5b).
Valuation and view: We have factored in gas price of USD7/mmbtu from FY15 onwards for Oil India. Also, in line with the announced reforms, we have assumed a diesel price hike of INR0.45/liter/month. We estimate 30% and 50% reduction in under-recoveries for FY14 and FY15, respectively. Of the INR753b reduction in under-recoveries in the next two years, we believe 90%
3QFY13 Results Update: Oil India
would go towards reducing government subsidy and expect only 10% benefit for upstream companies, resulting in the upstream sharing increasing to 50%/60% in FY14/FY15 from the current 40%. The stock trades at 6.6x FY15E EPS of INR80.9. Our target price is INR635/share. Buy.
SPECIAL REPORT
4 March 2013
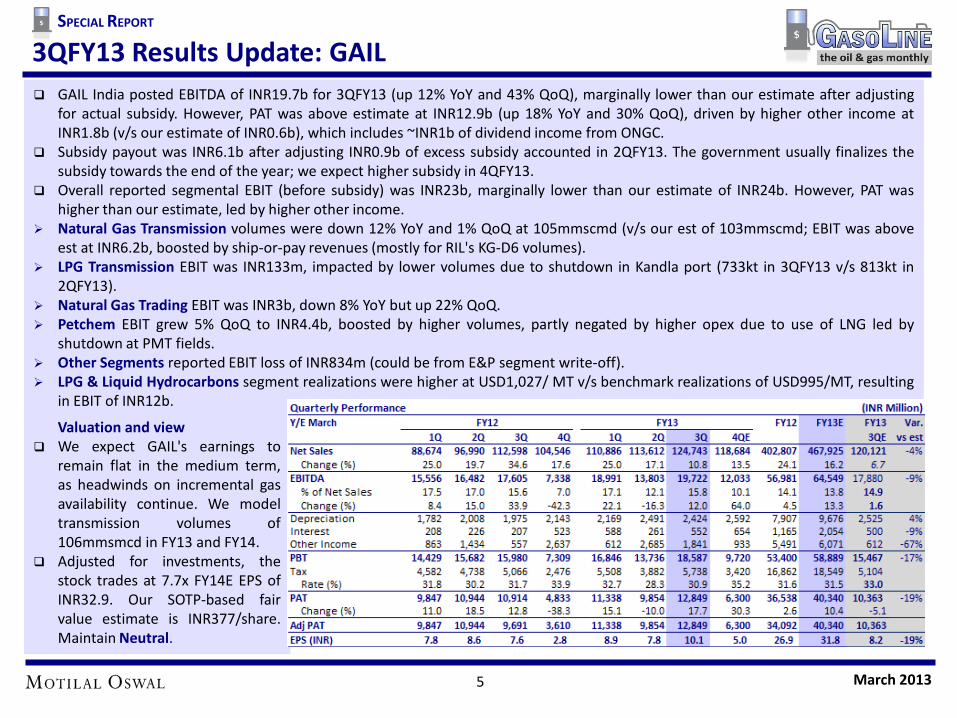
GAIL India posted EBITDA of INR19.7b for 3QFY13 (up 12% YoY and 43% QoQ), marginally lower than our estimate after adjusting for actual subsidy. However, PAT was above estimate at INR12.9b (up 18% YoY and 30% QoQ), driven by higher other income at INR1.8b (v/s our estimate of INR0.6b), which includes ~INR1b of dividend income from ONGC.
Subsidy payout was INR6.1b after adjusting INR0.9b of excess subsidy accounted in 2QFY13. The government usually finalizes the subsidy towards the end of the year; we expect higher subsidy in 4QFY13.
Overall reported segmental EBIT (before subsidy) was INR23b, marginally lower than our estimate of INR24b. However, PAT was higher than our estimate, led by higher other income.
Natural Gas Transmission volumes were down 12% YoY and 1% QoQ at 105mmscmd (v/s our est of 103mmscmd; EBIT was above est at INR6.2b, boosted by ship-or-pay revenues (mostly for RIL's KG-D6 volumes).
LPG Transmission EBIT was INR133m, impacted by lower volumes due to shutdown in Kandla port (733kt in 3QFY13 v/s 813kt in 2QFY13).
Natural Gas Trading EBIT was INR3b, down 8% YoY but up 22% QoQ. Petchem EBIT grew 5% QoQ to INR4.4b, boosted by higher volumes, partly negated by higher opex due to use of LNG led by
shutdown at PMT fields. Other Segments reported EBIT loss of INR834m (could be from E&P segment write-off). LPG & Liquid Hydrocarbons segment realizations were higher at USD1,027/ MT v/s benchmark realizations of USD995/MT, resulting
in EBIT of INR12b.
3QFY13 Results Update: GAIL
Valuation and view We expect GAIL's earnings to
remain flat in the medium term, as headwinds on incremental gas availability continue. We model transmission volumes of 106mmsmcd in FY13 and FY14.
Adjusted for investments, the stock trades at 7.7x FY14E EPS of INR32.9. Our SOTP-based fair value estimate is INR377/share. Maintain Neutral.
SPECIAL REPORT
5 March 2013

3QFY13 results better than expected: BPCL’s PAT for 3QFY13 was INR16.5b (v/s our estimate of a loss of INR1.4b) as against INR31.4b in 3QFY12 and INR50.3b in 2QFY13. EBITDA was INR22.6b, higher than our estimate of INR5.1b, led by (a) net over-recovery of INR2.2b (v/s our estimate of net under-recovery of INR12b), (b) adventitious gain (on product inventory) of INR3.3b, and (c) staff cost being lower by ~INR0.8b, though the benefits were partly offset by forex loss of INR2.2b. Given the ad-hoc subsidy sharing, we believe quarterly financials are not indicative of the likely full year performance.
9MFY13 PAT negative despite government subsidy: The upstream companies have compensated BPCL INR109b in 9MFY13 and the government has already provided a support of INR132b. However, this compensation was inadequate and resulted in INR59b loss for BPCL in 9MFY13. As in previous years, we model that major portion of the government subsidy would be received in 4Q. For FY13, similar to FY12, we model subsidy sharing of 60% by the government, 40% by upstream, and nil by OMCs.
Valuation and view Our positive stance on the stock is driven by the recently announced diesel reforms, following which gross under-recoveries are
likely to reduce by 50% by FY15. For OMCs, in the initial period of reforms, stock performance will largely be led by re-rating. The earnings benefit will be limited, as we already assume nil subsidy sharing in FY14.
We model monthly hike of INR0.45/liter in diesel price and expect OMCs to be fully compensated by upstream (40% share) and the government (60% share) for the under-recoveries on controlled products. The stock trades at 13.3x FY14E EPS of INR30.3. Adjusted for investments, it trades at 0.8x FY14E BV. BPCL is our top pick among OMCs. Maintain Buy.
3QFY13 Results Update: BPCL SPECIAL REPORT
6 March 2013

PAT higher than expected: HPCL posted a PAT of INR1.5b for 3QFY13 (we had estimated a loss of INR2.3b) as against INR27.3b in 3QFY12 and INR23.3b in 2QFY13. Given the ad-hoc subsidy sharing, we believe quarterly financials are not indicative of the likely full-year performance.
EBITDA in-line: EBITDA at INR3.9b was in line with our estimate, led by (a) net over-recoveries of INR1.9b, and (b) adventitious gain (on products) of INR0.7b, which were equally offset by (a) lower GRM of USD1.9/bbl (v/s our estimate of INR4.1/bbl), and (b) forex loss (~INR1b).
9MFY13 PAT negative despite government subsidy: Upstream companies compensated HPCL INR100b in 9MFY13 and the government has already provided a support of INR122b. However, this compensation was inadequate and resulted in INR67.7b loss for HPCL in 9MFY13. As in previous years, we model that major portion of the government subsidy would be received in 4Q. For FY13, similar to FY12, we model subsidy sharing of 60% by the government, 40% by upstream, and nil by OMCs.
Valuation and view Our positive stance on the stock is driven by the recently announced diesel reforms, following which gross under-recoveries are
likely to reduce by 50% by FY15. For OMCs, in the initial period of reforms, stock performance will largely be led by re-rating. The earnings benefit will be limited, as we already assume nil subsidy sharing in FY14.
We model monthly hike of INR0.45/liter in diesel price and expect OMCs to be fully compensated by upstream (40% share) and the government (60% share) for the under-recoveries. The stock trades at 11.8x FY14E EPS of INR27.6 and 0.7x FY14E BV. Buy.
3QFY13 Results Update: HPCL SPECIAL REPORT
7 March 2013

3QFY13 Results Update: IOCL SPECIAL REPORT
8 March 2013
3QFY13 results better than expected: IOCL’s PAT for 3QFY13 was INR33b (v/s our est. of INR1.1b) as against INR24.9b in 3QFY12 and INR96.1b in 2QFY13. EBITDA was INR51b, higher than our estimate of INR21.6b, led by (a) net over-recovery of INR4b (v/s our estimate of net under-recovery of INR26.7b), and (b) higher GRM of USD6.2/bbl against our estimate of USD4.8/bbl (resulted in additional EBITDA of ~INR8.5b), though the benefits were partly offset by (a) higher staff costs to the tune of INR2.9b, and (b) adventitious loss (on products) of INR3.6b. Interest expenses and depreciation were broadly in line at INR13.2b and INR16.7b, respectively. Given the ad-hoc subsidy sharing, we believe quarterly financials are not indicative of the full year performance.
9MFY13 PAT negative despite government subsidy: The upstream companies have compensated IOCL INR243b in 9MFY13 and the government has already provided a support of INR296b. However, this compensation was inadequate and resulted in INR132b loss for IOCL in 9MFY13. As in previous years, we model that major portion of the government subsidy would be received in 4Q. For FY13, similar to FY12, we model subsidy sharing of 60% by the government, 40% by upstream, and nil by OMCs.
Valuation and view Our positive stance on the stock is driven by the recently announced diesel reforms, following which gross under-recoveries are
likely to reduce by 50% by FY15. For OMCs, in the initial period of reforms, stock performance will largely be led by re-rating. The earnings benefit will be limited, as we already assume nil subsidy sharing in FY14.
We model monthly hike of INR0.45/liter in diesel price and expect OMCs to be fully compensated by upstream (40% share) and the government (60% share) for the under-recoveries. Buy.
OIL: Brent up 3% MoM due to supply cuts by OPEC
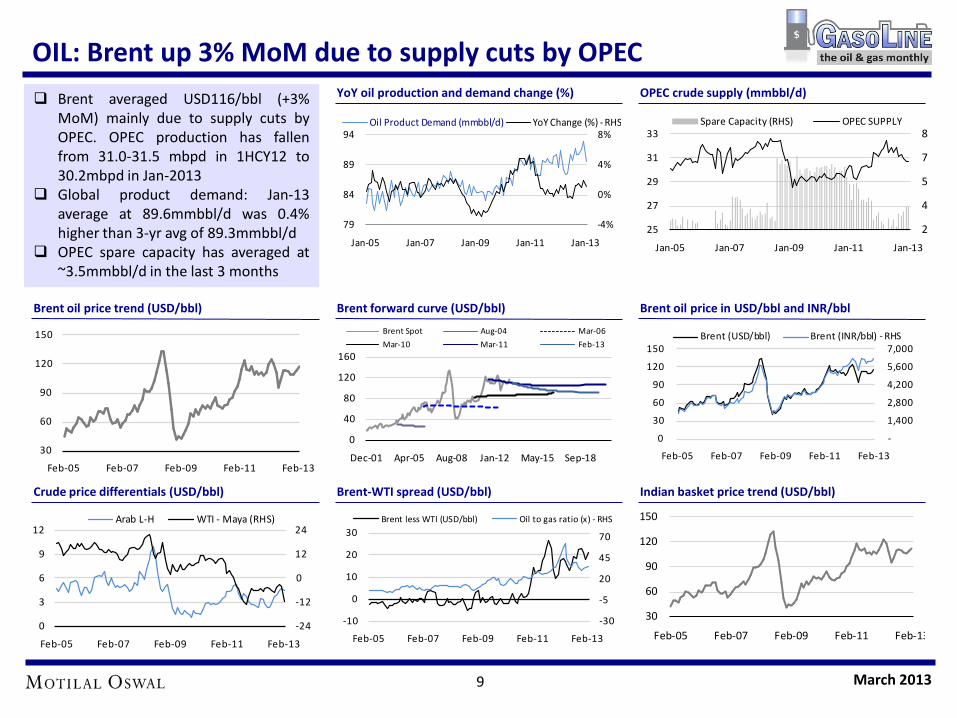
Brent averaged USD116/bbl (+3% MoM) mainly due to supply cuts by OPEC. OPEC production has fallen from 31.0-31.5 mbpd in 1HCY12 to 30.2mbpd in Jan-2013
Global product demand: Jan-13 average at 89.6mmbbl/d was 0.4% higher than 3-yr avg of 89.3mmbbl/d
OPEC spare capacity has averaged at ~3.5mmbbl/d in the last 3 months
Brent oil price trend (USD/bbl) Brent forward curve (USD/bbl) Brent oil price in USD/bbl and INR/bbl
Crude price differentials (USD/bbl) Brent-WTI spread (USD/bbl) Indian basket price trend (USD/bbl)
YoY oil production and demand change (%) OPEC crude supply (mmbbl/d)
-4%
0%
4%
8%
79
84
89
94
Jan-05 Jan-07 Jan-09 Jan-11 Jan-13
Oil Product Demand (mmbbl/d) YoY Change (%) - RHS
2
4
5
7
8
25
27
29
31
33
Jan-05 Jan-07 Jan-09 Jan-11 Jan-13
Spare Capacity (RHS) OPEC SUPPLY
30
60
90
120
150
Feb-05 Feb-07 Feb-09 Feb-11 Feb-13
-24
-12
0
12
24
0
3
6
9
12
Feb-05 Feb-07 Feb-09 Feb-11 Feb-13
Arab L-H WTI - Maya (RHS)
-30
-5
20
45
70
-10
0
10
20
30
Feb-05 Feb-07 Feb-09 Feb-11 Feb-13
Brent less WTI (USD/bbl) Oil to gas ratio (x) - RHS
0
40
80
120
160
Dec-01 Apr-05 Aug-08 Jan-12 May-15 Sep-18
Brent Spot Aug-04 Mar-06
Mar-10 Mar-11 Feb-13
-
1,400
2,800
4,200
5,600
7,000
0
30
60
90
120
150
Feb-05 Feb-07 Feb-09 Feb-11 Feb-13
Brent (USD/bbl) Brent (INR/bbl) - RHS
9 March 2013
30
60
90
120
150
Feb-05 Feb-07 Feb-09 Feb-11 Feb-13

US Weekly Petroleum Data: Oil inventory up
US crude inventory increased to 377.5 mmbbl in the last week of Feb-13, highest since July 2012, on back of higher imports and decline in demand.
US refinery utilization averaged ~84% in Feb-13 down from ~86% in Jan-13 mainly due to maintenance shutdowns.
Distillate inventories are ~13% below the last 5-year average
US crude oil inventory (mmbbl) US distillate inventory (mmbbl)
90
114
138
162
186
1 18 35 52 Week
Range (2008-12) Average (2008-12) 2013
250
285
320
355
390
425
1 18 35 52 Week
Range (2008-12) Average (2008-12) 2013
US gasoline inventory (mmbbl)
170
190
210
230
250
1 18 35 52 Week
Range (2008-12) Average (2008-12) 2013
US total product supplied (mmbbl/d) US refinery utilization (%) US crude imports (mmbbl)
17
19
20
22
23
1 18 35 52 Week
Range (2008-12) Average (2008-12) 2013
64
74
84
94
1 18 35 52 Week
Range (2008-12) Average (2008-12) 2013
10 March 2013
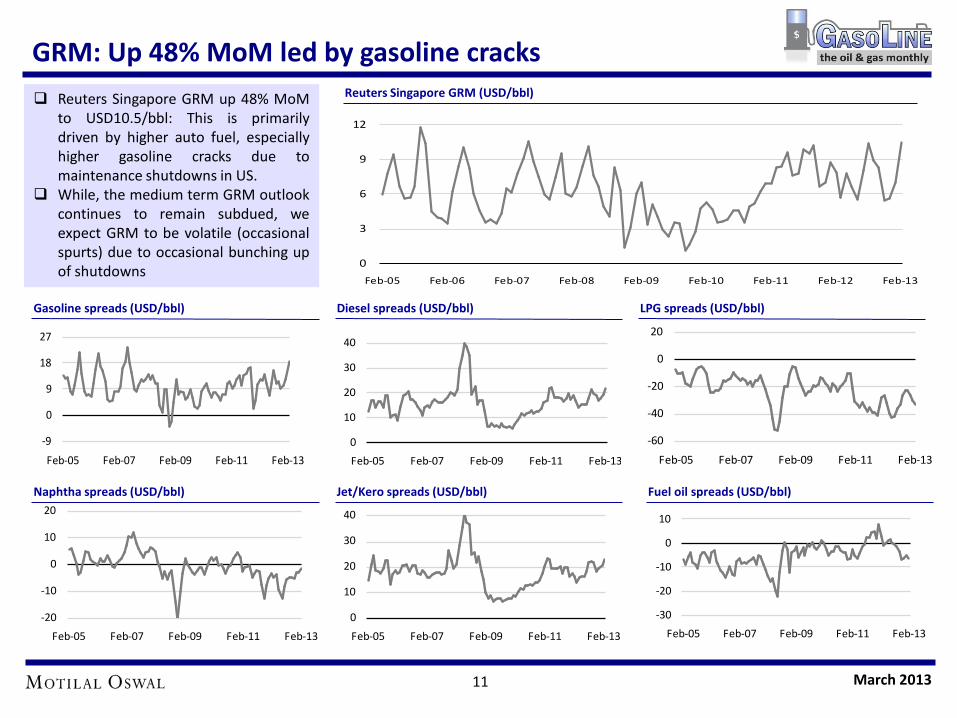
GRM: Up 48% MoM led by gasoline cracks
Reuters Singapore GRM up 48% MoM to USD10.5/bbl: This is primarily driven by higher auto fuel, especially higher gasoline cracks due to maintenance shutdowns in US.
While, the medium term GRM outlook continues to remain subdued, we expect GRM to be volatile (occasional spurts) due to occasional bunching up of shutdowns
Gasoline spreads (USD/bbl) Diesel spreads (USD/bbl) LPG spreads (USD/bbl)
Naphtha spreads (USD/bbl) Jet/Kero spreads (USD/bbl) Fuel oil spreads (USD/bbl)
-9
0
9
18
27
Feb-05 Feb-07 Feb-09 Feb-11 Feb-13
0
10
20
30
40
Feb-05 Feb-07 Feb-09 Feb-11 Feb-13
-20
-10
0
10
20
Feb-05 Feb-07 Feb-09 Feb-11 Feb-13
0
10
20
30
40
Feb-05 Feb-07 Feb-09 Feb-11 Feb-13
0
3
6
9
12
Feb-05 Feb-06 Feb-07 Feb-08 Feb-09 Feb-10 Feb-11 Feb-12 Feb-13
Reuters Singapore GRM (USD/bbl)
-60
-40
-20
0
20
Feb-05 Feb-07 Feb-09 Feb-11 Feb-13
-30
-20
-10
0
10
Feb-05 Feb-07 Feb-09 Feb-11 Feb-13
11 March 2013

GRM: Over capacity + sluggish demand = range bound margins
Oil, Product Prices and Cracks (USD/bbl)
Singapore GRM up MoM and YoY (USD/bbl)
12 March 2013

Polymer Margins: Up ~2% MoM, except PVC Domestic price premium in PP/PVC is
improved marginally MoM, however the premium to PE continued its downward slide, probably due to higher imports
International polymer/Naphtha prices were up 4% /5% MoM.
Petchem margins seem to be in recovery mode (Key product margins are up ~2%MoM, except PVC)
PE spread over naphtha (INR/kg) PP spread over naphtha (INR/kg) PVC spread over naphtha (INR/kg)
PE spread overn naphtha (USD/mt) PP spread over naphtha (USD/mt) PVC spread over naphtha (USD/mt)
0
500
1,000
1,500
2,000
Feb-05 Feb-07 Feb-09 Feb-11 Feb-13
Naphtha Ethylene Polyethylene
0
600
1,200
1,800
2,400
Feb-05 Feb-07 Feb-09 Feb-11 Feb-13
Naphtha Propylene Polypropylene
0
450
900
1,350
1,800
Feb-05 Feb-07 Feb-09 Feb-11 Feb-13
Naphtha Price Ethylene PVC
20
28
36
44
52
Apr
May Jun
July
Aug
Sept
Oct
Nov Dec Ja
n
Feb
Mar
5 yr range Last 5 yr avg. FY13
20
28
36
44
52
Apr
May Jun
July
Aug
Sept
Oct
Nov
Dec Ja
n
Feb
Mar
5 yr range Last 5 yr avg. FY13
-10
0
10
20
30
Apr
May Ju
n
July
Aug
Sept Oct
Nov
Dec Jan
Feb
Mar
5 yr range Last 5 yr avg. FY13
Key polymer price trends (INR/kg) Premium/discount to international prices (INR/kg)
-20
0
20
40
60
Feb-05 Feb-07 Feb-09 Feb-11 Feb-13
PE PP PVC
20
40
60
80
100
Feb-05 Feb-07 Feb-09 Feb-11 Feb-13
PE PP PVC
13 March 2013

Polymer Margins: International prices increased ~3.5% MoM
14 March 2013
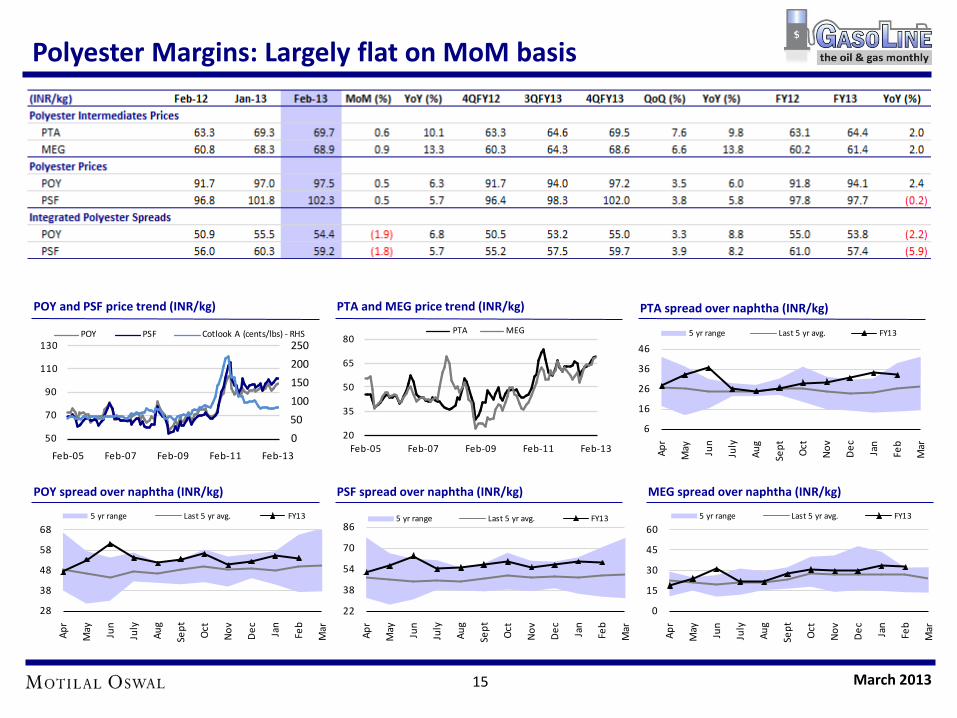
Polyester Margins: Largely flat on MoM basis
PTA and MEG price trend (INR/kg) POY and PSF price trend (INR/kg) PTA spread over naphtha (INR/kg)
POY spread over naphtha (INR/kg) PSF spread over naphtha (INR/kg) MEG spread over naphtha (INR/kg)
20
35
50
65
80
Feb-05 Feb-07 Feb-09 Feb-11 Feb-13
PTA MEG
0
50
100
150
200
250
50
70
90
110
130
Feb-05 Feb-07 Feb-09 Feb-11 Feb-13
POY PSF Cotlook A (cents/lbs) - RHS
6
16
26
36
46
Apr
May Ju
n
July
Aug
Sept Oct
Nov
Dec Jan
Feb
Mar
5 yr range Last 5 yr avg. FY13
0
15
30
45
60
Apr
May Jun
July
Aug
Sept
Oct
Nov
Dec Ja
n
Feb
Mar
5 yr range Last 5 yr avg. FY13
28
38
48
58
68
Apr
May Jun
July
Aug
Sept
Oct
Nov
Dec Ja
n
Feb
Mar
5 yr range Last 5 yr avg. FY13
22
38
54
70
86
Apr
May Jun
July
Aug
Sept
Oct
Nov
Dec Ja
n
Feb
Mar
5 yr range Last 5 yr avg. FY13
15 March 2013
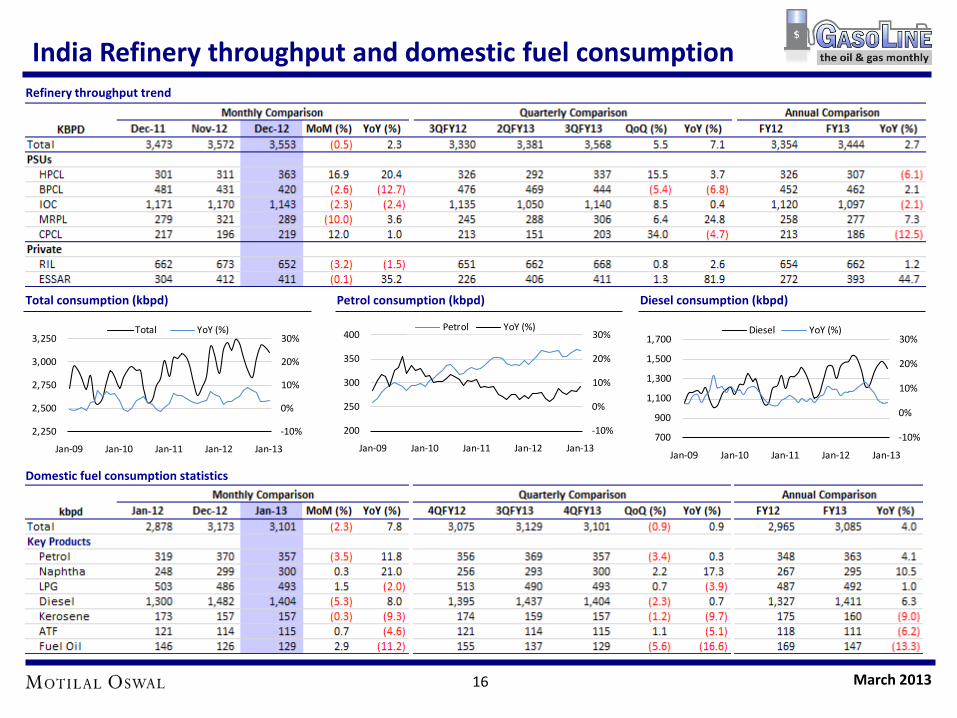
India Refinery throughput and domestic fuel consumption
Total consumption (kbpd) Petrol consumption (kbpd) Diesel consumption (kbpd)
Domestic fuel consumption statistics
Refinery throughput trend
-10%
0%
10%
20%
30%
200
250
300
350
400
Jan-09 Jan-10 Jan-11 Jan-12 Jan-13
Petrol YoY (%)
-10%
0%
10%
20%
30%
2,250
2,500
2,750
3,000
3,250
Jan-09 Jan-10 Jan-11 Jan-12 Jan-13
Total YoY (%)
-10%
0%
10%
20%
30%
700
900
1,100
1,300
1,500
1,700
Jan-09 Jan-10 Jan-11 Jan-12 Jan-13
Diesel YoY (%)
16 March 2013

Under recoveries trend and domestic fuel pricing
Latest fortnight daily under recovery run-rate at INR4.3b, implying annual under recovery at INR1.6t.
Impact of INR1/ltr price hike on under recoveries Diesel : ~INR80b Kerosene: ~INR10b LPG hike of INR25/cyl: ~INR26b
Domestic retail diesel price trend (INR/lt) Domestic retail Kerosene price trend (INR/cyl) Domestic retail LPG price trend (INR/cyl)
Fortnightly diesel under recoveries (INR/lt) Fortnightly kerosene under recoveries (INR/lt) Fortnightly LPG under recoveries (INR/cyl)
Petrol and diesel price difference (INR/lt)
17
-20%
-10%
0%
10%
20%
-
12
24
36
48
60
Dec
-04
Feb-
06
Feb-
07
Feb -
08
Feb-
09
Feb -
10
Feb-
11
Feb-
12
Feb-
13
Diesel (INR/ltr) Chg (%) - RHS
-20%
-10%
0%
10%
20%
-
20
40
60
80
Dec
-04
Feb-
06
Feb-
07
Feb-
08
Feb-
09
Feb-
10
Feb-
11
Feb-
12
Feb-
13
Petrol (INR/ltr) Chg (%) - RHS
Domestic retail petrol price trend (INR/lt)
-10%
0%
10%
20%
30%
-
5
10
15
20
Dec
-04
Feb-
06
Feb-
07
Feb-
08
Feb-
09
Feb -
10
Feb-
11
Feb-
12
Feb-
13
Kerosene (INR/ltr) Chg (%) - RHS
-20%
-10%
0%
10%
20%
-
100
200
300
400
Dec
-04
Feb-
06
Feb-
07
Feb-
08
Feb-
09
Feb-
10
Feb-
11
Feb-
12
Feb-
13
LPG (INR/Cyl) Chg (%) - RHS
20
40
60
80
Dec
-04
Dec
-05
Dec
-06
Jan-
08
Jan-
09
Jan-
10
Jan-
11
Feb-
12
Feb-
13
Petrol Diesel
12.0
14.4
13.9
12.5
9.2 12
.1
17.1
11.7
9.8
10.0
9.0
9.2 11
.3
Feb-
12
Mar
-12
Apr-
12
May
-12
Jun-
12
Jul-1
2
Aug-
12
Sep-
12
Oct
-12
Nov
-12
Dec
-12
Jan-
13
Feb-
13
28.5
31.0
31.5
30.5
27.2
28.5
32.7
33.9
31.3
30.9
30.6
31.6
33.4
Feb-
12
Mar
-12
Apr-
12
May
-12
Jun-
12
Jul-1
2
Aug-
12
Sep-
12
Oct
-12
Nov
-12
Dec
-12
Jan-
13
Feb-
13
439
571
481
396
319
231 34
7 469
479
521
461
481
439
Feb-
12
Mar
-12
Apr-
12
May
-12
Jun-
12
Jul-1
2
Aug-
12
Sep-
12
Oct
-12
Nov
-12
Dec
-12
Jan-
13
Feb-
13
March 2013
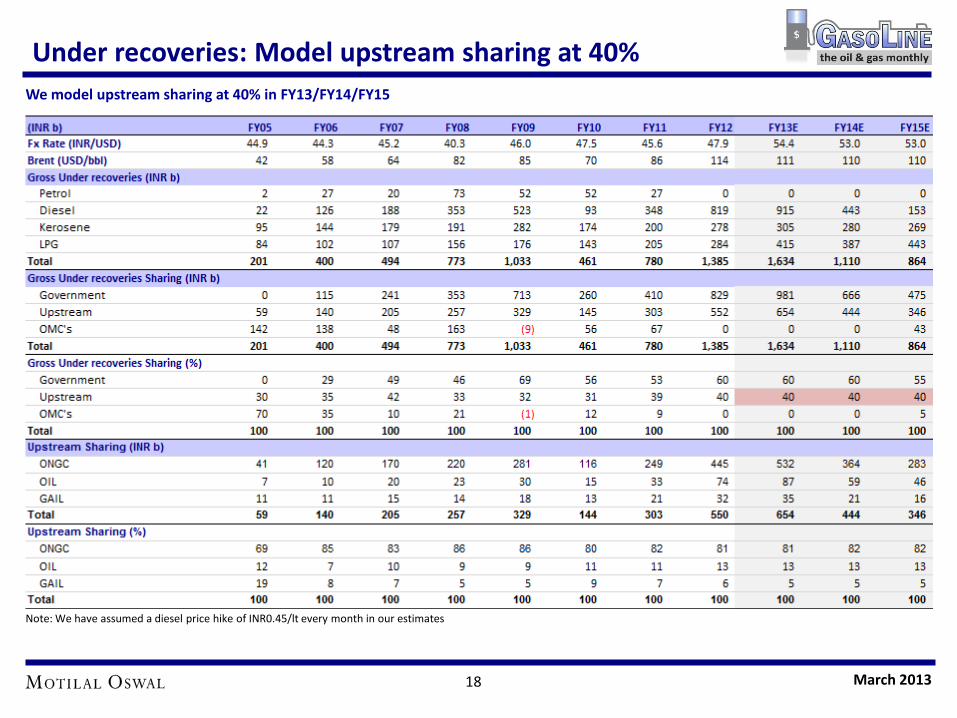
Under recoveries: Model upstream sharing at 40% We model upstream sharing at 40% in FY13/FY14/FY15
Note: We have assumed a diesel price hike of INR0.45/lt every month in our estimates
18 March 2013
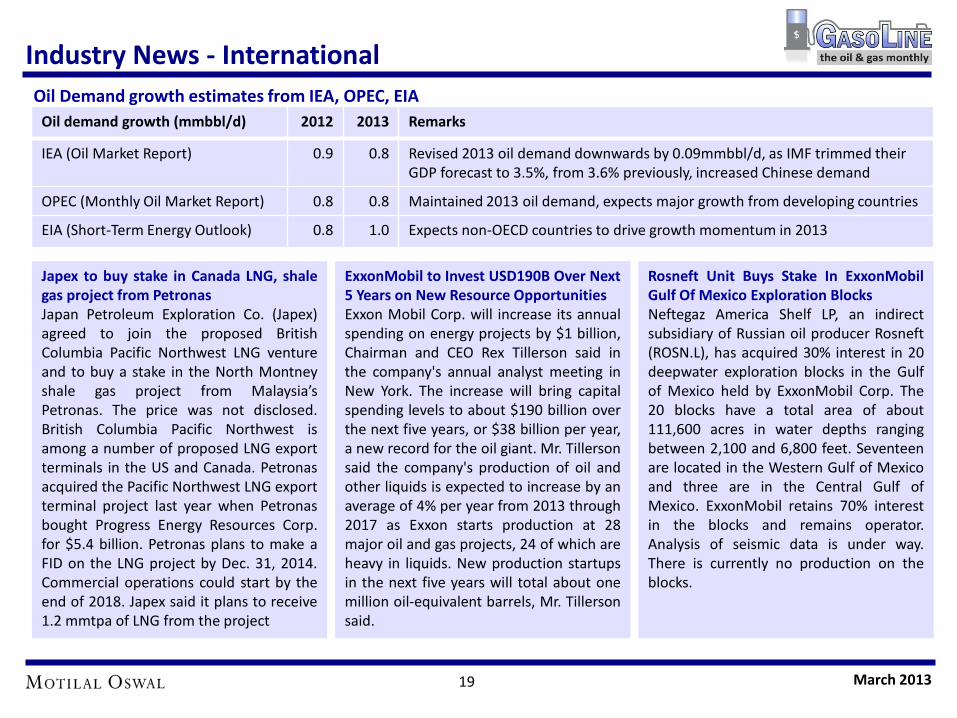
Industry News - International
Rosneft Unit Buys Stake In ExxonMobil Gulf Of Mexico Exploration Blocks Neftegaz America Shelf LP, an indirect subsidiary of Russian oil producer Rosneft (ROSN.L), has acquired 30% interest in 20 deepwater exploration blocks in the Gulf of Mexico held by ExxonMobil Corp. The 20 blocks have a total area of about 111,600 acres in water depths ranging between 2,100 and 6,800 feet. Seventeen are located in the Western Gulf of Mexico and three are in the Central Gulf of Mexico. ExxonMobil retains 70% interest in the blocks and remains operator. Analysis of seismic data is under way. There is currently no production on the blocks.
Japex to buy stake in Canada LNG, shale gas project from Petronas Japan Petroleum Exploration Co. (Japex) agreed to join the proposed British Columbia Pacific Northwest LNG venture and to buy a stake in the North Montney shale gas project from Malaysia’s Petronas. The price was not disclosed. British Columbia Pacific Northwest is among a number of proposed LNG export terminals in the US and Canada. Petronas acquired the Pacific Northwest LNG export terminal project last year when Petronas bought Progress Energy Resources Corp. for $5.4 billion. Petronas plans to make a FID on the LNG project by Dec. 31, 2014. Commercial operations could start by the end of 2018. Japex said it plans to receive 1.2 mmtpa of LNG from the project
ExxonMobil to Invest USD190B Over Next 5 Years on New Resource Opportunities Exxon Mobil Corp. will increase its annual spending on energy projects by $1 billion, Chairman and CEO Rex Tillerson said in the company's annual analyst meeting in New York. The increase will bring capital spending levels to about $190 billion over the next five years, or $38 billion per year, a new record for the oil giant. Mr. Tillerson said the company's production of oil and other liquids is expected to increase by an average of 4% per year from 2013 through 2017 as Exxon starts production at 28 major oil and gas projects, 24 of which are heavy in liquids. New production startups in the next five years will total about one million oil-equivalent barrels, Mr. Tillerson said.
Oil demand growth (mmbbl/d) 2012 2013 Remarks
IEA (Oil Market Report) 0.9 0.8 Revised 2013 oil demand downwards by 0.09mmbbl/d, as IMF trimmed their GDP forecast to 3.5%, from 3.6% previously, increased Chinese demand
OPEC (Monthly Oil Market Report) 0.8 0.8 Maintained 2013 oil demand, expects major growth from developing countries
EIA (Short-Term Energy Outlook) 0.8 1.0 Expects non-OECD countries to drive growth momentum in 2013
Oil Demand growth estimates from IEA, OPEC, EIA
19 March 2013

Industry News - Domestic
Cairn commenced exploration drilling in Rajasthan Cairn India has commenced drilling of the first exploration well, following endorsement of the exploration work programme for the Rajasthan block by the management committee two weeks ago. The company started exploration drilling after a gap of more than four years, in the prolific Barmer oilfields, Cairn said in a statement. "This is pursuant to the clarity in policy by the government, allowing for exploration operations in development blocks. This has enabled Cairn India to commence its planned aggressive exploration drilling programme to help harness the full potential of the Barmer Basin in Rajasthan,"" it said. This will help the Cairn and ONGC joint venture to realise the basin production potential of 300,000 bopd from the block, it said. The JV is currently producing 170,000 -175,000 bopd from the Rajasthan block with a strong focus on exiting the year FY 2013-14 at a production rate of 200,000-215,000 bopd from the block.
GAIL commissions INR4,500 cr Dabhol-Bengaluru gas pipeline GAIL has commissioned a INR4,500 crore pipeline carrying gas from the just operationalised Dabhol LNG terminal into Bengaluru that promises to change the energy landscape of the region. The 1,000-km pipeline will feed industries at Belgaum, Dharwad, Gadag, Bellary, Davanagere, Chitradurga, Tumkuyr, Ramanagaram and Bengaluru who have till now been using costlier and polluting liquid fuels like naphtha and diesel as feedstock. Gas will help the state power generation utility save INR800 crore annually by reducing cost, improving efficiency and drastically cutting down pollution caused by using liquid fuels. The pipeline, he said, will be extended to Mangalore this year and further to Kochi in Kerala by end of next year. The Dabhol-Bengaluru pipeline has a capacity to carry 16 mmscmd. GAIL also signed an agreement to supply 0.6 million tonnes of LNG to Karnataka Power Corp Ltd's proposed 1,400MW Bidadi power plant.
Reliance Industries, BP to invest USD5b to boost natural gas field output BP CEO Bob Dudley and RIL Chairman Mukesh Ambani have promised to accelerate investment of $5 billion in the next few years to boost natural gas output gradually from 2014 while the government has assured quick resolution of pending issues, including approvals for the D6 block, government and company officials said. The investment includes testing of a new layer of natural gas under the rapidly depleting fields in the KG-D6 fields, a joint statement from Reliance and BP said. It said "optimisation" plan from the existing field will reverse the fall in D6 output from next year, while other developments in the same block will deliver results by 2017. Dudley, who is a member of the business delegation accompanying British Prime Minister David Cameron, and Ambani gave the assurances in separate meetings with Prime Minister Manmohan Singh and Oil Minister Veerappa Moily, officials said.
20 March 2013

Industry News - Domestic
HPCL to partner Shapoorji Pallonji Group for LNG terminal HPCL and Mumbai-based infrastructure major Shapoorji Pallonji plan to set up a terminal for import of liquid gas (LNG) at a cost of Rs 5,000 crore at Chhara in Gujarat's Junagadh district through a 50:50 joint venture. SP Ports is already developing a greenfield, all weather, direct berthing port in Junagadh district. HPCL and SP Ports are carrying out a detailed feasibility study for establishing technical and commercial viability of setting up a LNG import and regasification terminal of 5 million tonnes per annum capacity at the proposed Port. The port is connected to a gas pipeline grid and evacuation of the fuel would not be an issue, they said. Gujarat already has two functional ports at Dahej and Hazira. A third one is under planning by Gujarat State Petroleum Corp (GSPC) and Larsen & Toubro (L&T) at Mundra. The Chhara terminal would be the fourth in the state. The sources said the Chhara import terminal may take a minimum of three years to build
Videocon starts selling stake in Mozambique gas field Videocon Industries has initiated the process to sell its 10% stake in the Mozambiquebased Rovuma offshore gas field in a deal that may fetch the company $2.5-$3 billion. The company, along with US based Anadarko Petroleum Corp, is in the process of together auctioning 20% stake in the oil field to raise an aggregate of $5-6 billion. The first round of bid is scheduled for March 14. Anadarko Petroleum, which holds 36.5% in the property, said that it intends to sell up to 10% stake in the Rovuma Offshore Area 1 but would retain operatorship of the asset. Anadarko Petroleum did not confirm details of the auction; Videocon declined to comment. Industry sources revealed that India's Oil India, ONGC and international players like Shell, PetroChina, and Exxon Mobil Corp may acquire the stake in gas. Mozambique, is pegged to emerge as a major global supplier of liquefied natural gas, and its gas reserves are pegged at 150 trillion cubic feet.
Veerappa Moily red-flags Finance Ministry proposal on fuel pricing Red-flagging the Finance Ministry move to cut subsidises by changing fuel pricing norm, Oil Minister M Veerappa Moily said not compensating oil PSUs for their losses will put question mark on their survival. The Finance Ministry wants petrol and diesel to be priced at a rate they can get in export market, rather than current practice of pricing the fuels after adding transportation and customs duty to the international price. "From 2005-06, the oil marketing companies have not been adding any margin on crude oil or on petroleum products. What is import price plus transportation and taxes is all that is there in the selling price,” OMCs are together projected to end the fiscal with a revenue loss of INR 1630bn. Of this, the Finance Ministry wants to shave off Rs 17,000 crore by changing methodology to export parity pricing (EPP). "If you decrease their compensation by Rs 17,000 crore, where will they get money for expansion and modernisation of refineries,”
21 March 2013

O&G stock performance
Relative stock performance (%)
Absolute stock performance (%)
(6)
(4)
2
(5)
(9)
(9)
(1)
(7)
(1)
(4)
(4)
(20) 0 20
RIL
ONGC
OIL
GAIL
HPCL
BPCL
IOC
Cairn
IGL
PLNG
GSPL1 MONTH ABSOLUTE
7
29
20
(0)
12
16
21
(7)
(0)
(7)
(1)
(50) 0 50
RIL
ONGC
OIL
GAIL
HPCL
BPCL
IOC
Cairn
IGL
PLNG
GSPL
3 MONTH ABSOLUTE
8
17
11
(7)
0
8
29
(10)
5
(1)
(11)
(50) 0 50
RIL
ONGC
OIL
GAIL
HPCL
BPCL
IOC
Cairn
IGL
PLNG
GSPL
6 MONTH ABSOLUTE
6
14
9
(9)
3
16
14
(17)
(27)
(10)
(6)
(50) 0 50
RIL
ONGC
OIL
GAIL
HPCL
BPCL
IOC
Cairn
IGL
PLNG
GSPL
1 YEAR ABSOLUTE
(3)
(0)
5
(2)
(6)
(6)
2
(4)
2
(1)
(0)
(10) (5) 0 5 10
RIL
ONGC
OIL
GAIL
HPCL
BPCL
IOC
Cairn
IGL
PLNG
GSPL
1 MONTH RELATIVE
4 26
16
(4)
9
12 18
(11)
(4)
(10)(4)
(30) (10) 10 30
RIL
ONGC
OIL
GAIL
HPCL
BPCL
IOC
Cairn
IGL
PLNG
GSPL
3 MONTH RELATIVE
(3)
6
0
(18)
(11)
(4)
18
(22)
(6)
(12)
(22)
(40) (20) 0 20
RIL
ONGC
OIL
GAIL
HPCL
BPCL
IOC
Cairn
IGL
PLNG
GSPL
6 MONTH RELATIVE
(4)
4
(1)(19)
(6)
6
4
(27)
(37)
(20)
(16)
(40) (20) 0 20
RIL
ONGC
OIL
GAIL
HPCL
BPCL
IOC
Cairn
IGL
PLNG
GSPL1 YEAR RELATIVE
22 March 2013

Valuation comparison to Global peers
23
*All averages are weighted averages
March 2013

Valuation comparison to Global peers: Integrated Companies
24
*All averages are weighted averages
March 2013
25
N O T E S
March 2013
26
This report is for personal information of the authorized recipient and does not construe to be any investment, legal or taxation advice to you. This research report does not constitute an offer, invitation or inducement to invest in securities or other investments and Motilal Oswal Securities Limited (hereinafter referred as MOSt) is not soliciting any action based upon it. This report is not for public distribution and has been furnished to you solely for your information and should not be reproduced or redistributed to any other person in any form. Unauthorized disclosure, use, dissemination or copying (either whole or partial) of this information, is prohibited. The person accessing this information specifically agrees to exempt MOSt or any of its affiliates or employees from, any and all responsibility/liability arising from such misuse and agrees not to hold MOSt or any of its affiliates or employees responsible for any such misuse and further agrees to hold MOSt or any of its affiliates or employees free and harmless from all losses, costs, damages, expenses that may be suffered by the person accessing this information due to any errors and delays. The information contained herein is based on publicly available data or other sources believed to be reliable. While we would endeavour to update the information herein on reasonable basis, MOSt and/or its affiliates are under no obligation to update the information. Also there may be regulatory, compliance, or other reasons that may prevent MOSt and/or its affiliates from doing so. MOSt or any of its affiliates or employees shall not be in any way responsible and liable for any loss or damage that may arise to any person from any inadvertent error in the information contained in this report . MOSt or any of its affiliates or employees do not provide, at any time, any express or implied warranty of any kind, regarding any matter pertaining to this report, including without limitation the implied warranties of merchantability, fitness for a particular purpose, and non-infringement. The recipients of this report should rely on their own investigations. This report is intended for distribution to institutional investors. Recipients who are not institutional investors should seek advice of their independent financial advisor prior to taking any investment decision based on this report or for any necessary explanation of its contents. MOSt and/or its affiliates and/or employees may have interests/positions, financial or otherwise in the securities mentioned in this report. To enhance transparency, MOSt has incorporated a Disclosure of Interest Statement in this document. This should, however, not be treated as endorsement of the views expressed in the report.
Disclosure of Interest Statement Companies where there is interest 1. Analyst ownership of the stock None 2. Group/Directors ownership of the stock IOC 3. Broking relationship with company covered None 4. Investment Banking relationship with company covered None
Analyst Certification: The views expressed in this research report accurately reflect the personal views of the analyst(s) about the subject securities or issues, and no part of the compensation of the research analyst(s) was, is, or will be directly or indirectly related to the specific recommendations and views expressed by research analyst(s) in this report. The research analysts, strategists, or research associates principally responsible for preparation of MOSt research receive compensation based upon various factors, including quality of research, investor client feedback, stock picking, competitive factors and firm revenues.
Disclosures
March 2013

27
Regional Disclosures (outside India) This report is not directed or intended for distribution to or use by any person or entity resident in a state, country or any jurisdiction, where such distribution, publication, availability or use would be contrary to law, regulation or which would subject MOSt & its group companies to registration or licensing requirements within such jurisdictions. For U.K. This report is intended for distribution only to persons having professional experience in matters relating to investments as described in Article 19 of the Financial Services and Markets Act 2000 (Financial Promotion) Order 2005 (referred to as "investment professionals"). This document must not be acted on or relied on by persons who are not investment professionals. Any investment or investment activity to which this document relates is only available to investment professionals and will be engaged in only with such persons. For U.S. Motilal Oswal Securities Limited (MOSL) is not a registered broker - dealer under the U.S. Securities Exchange Act of 1934, as amended (the"1934 act") and under applicable state laws in the United States. In addition MOSL is not a registered investment adviser under the U.S. Investment Advisers Act of 1940, as amended (the "Advisers Act" and together with the 1934 Act, the "Acts), and under applicable state laws in the United States. Accordingly, in the absence of specific exemption under the Acts, any brokerage and investment services provided by MOSL, including the products and services described herein are not available to or intended for U.S. persons. This report is intended for distribution only to "Major Institutional Investors" as defined by Rule 15a-6(b)(4) of the Exchange Act and interpretations thereof by SEC (henceforth referred to as "major institutional investors"). This document must not be acted on or relied on by persons who are not major institutional investors. Any investment or investment activity to which this document relates is only available to major institutional investors and will be engaged in only with major institutional investors. In reliance on the exemption from registration provided by Rule 15a-6 of the U.S. Securities Exchange Act of 1934, as amended (the "Exchange Act") and interpretations thereof by the U.S. Securities and Exchange Commission ("SEC") in order to conduct business with Institutional Investors based in the U.S., MOSL has entered into a chaperoning agreement with a U.S. registered broker-dealer, Marco Polo Securities Inc. ("Marco Polo"). Any business interaction pursuant to this report will have to be executed within the provisions of this chaperoning agreement. This website and its respective contents does not constitute an offer or invitation to purchase or subscribe for any securities or solicitation of any investments or investment services and/or shall not be considered as an advertisement tool. "U.S. Persons" are generally defined as a natural person, residing in the United States or any entity organized or incorporated under the laws of the United States. US Citizens living abroad may also be deemed "U.S. Persons " under certain rules. The Research Analysts contributing to the report may not be registered /qualified as research analyst with FINRA. Such research analyst may not be associated persons of the U.S. registered broker-dealer, Marco Polo, and therefore, may not be subject to NASD rule 2711 and NYSE Rule 472 restrictions on communication with a subject company, public appearances and trading securities held by a research analyst account.
March 2013

28
For Singapore Motilal Oswal Capital Markets Singapore Pte Limited is acting as an exempt financial advisor under section 23(1)(f) of the Financial Advisers Act(FAA) read with regulation 17(1)(d) of the Financial Advisors Regulations and is a subsidiary of Motilal Oswal Securities Limited in India. This research is distributed in Singapore by Motilal Oswal Capital Markets Singapore Pte Limited and it is only directed in Singapore to accredited investors, as defined in the Financial Advisers Regulations and the Securities and Futures Act (Chapter 289), as amended from time to time. In respect of any matter arising from or in connection with the research you could contact the following representatives of Motilal Oswal Capital Markets Singapore Pte Limited: Nihar Oza Kadambari Balachandran Email: [email protected] Email : [email protected] Contact: (+65) 68189232 Contact: (+65) 68189233 / 65249115 Office address: 21 (Suite 31), 16 Collyer Quay, Singapore 049318
Motilal Oswal Securities Limited M E M B E R O F B S E A N D N S E
Motilal Oswal Tower, Sayani Road, Prabhadevi, Mumbai 400 025, INDIA
BOARD: +91 22 3982 5500 | WEBSITE: www.motilaloswal.com
March 2013