mara hemminger page 1 10/22/2005 - university of marylandand pressing questions still remained, dr....
TRANSCRIPT

Mara Hemminger Page 1 10/22/2005
The U.S. Federal Energy Regulatory Commission’s 2002 Investigation of Enron: Information-Seeking Questions, Methods and Conclusions
Mara D. Hemminger
University of Maryland
September 12, 2005
1

Mara Hemminger Page 2 10/22/2005
Abstract The Federal Energy Regulatory Commission (FERC) investigated Enron and other energy marketers in 2002 for their suspected manipulation of the Californian energy market during the Californian energy crisis of 2000-2001. This investigation combed through large amounts of company data, such as memos, sales reports, correspondence, voice conversations, and emails. In an unusual move, FERC put into these datasets into the public domain; this corpus then became the first large collection of real-life data (email, memoranda, etc.) widely available for public use and research. This paper seeks to recreate the information-seeking process that FERC might have used when searching these data archives to find answers its questions. Of course, understanding this process requires also understanding the investigation itself, and the events that led up to it. Hence this paper can be treated as two separate but equal halves. The first half provides the necessary background to the story, namely a synopsis of the following: the energy industry and market in the United States generally, and in California specifically, at the time of the allegations; the 2000/2001 energy crisis in the West, and how it contributed to these allegations; Enron’s role within the Californian energy market; and FERC’s specific accusations against Enron. The second half of the paper examines how FERC went about finding the information for its investigation. This begins with a theoretical model of how people seek information in general, followed by a description FERC’s particular information needs, data requests, answers, and conclusions in this investigation. Finally, there are several appendices with supplemental information. These provide: a table overview of FERC’s questions and answers; sample queries that might have been posed of the email dataset during this investigation; some important players (scheduling coordinators) in California’s energy market at the time; and general historical background on the electric and gas industries in the U.S.
2

Mara Hemminger Page 3 10/22/2005
Acknowledgements Several people were instrumental in the writing of this paper, and the author would like to extend a hearty “Thank You!” to them. Dr. Douglas Oard, the author’s advisor and an associate professor at the University of Maryland’s College of Information Studies, had the vision needed to organize a group of students to examine the Enron email archives and recreate FERC’s information-seeking needs therein. The author is grateful for his allowing her to participate in this project. She is especially grateful for his patience in allowing her to tackle her part in that project with what was often more time and energy than either he or she had originally expected. Dr. Larry Makovitch of the Cambridge Energy Research Associates (CERA) research organization provided tremendous help in the author’s own times of great information need. When all her research resources failed, and pressing questions still remained, Dr. Makovitch made everything clear. He was especially helpful in confirming that the author’s mental model of the industrial, physical, and financial markets in the U.S. and California were correct. Without those models, this paper would have no backbone to hold it together. Dr. Susan Davis, assistant professor at the University of Maryland’s College of Information Studies, and her research assistant Erin Greenwell patiently read the draft from end to end, and provided absolutely invaluable editing help and suggestions – and probably drank their local coffee shops out of business in the process. Stan Morgenstein of Aspen Systems Corporation offered helpful background on FERC’s email and voice datasets, and kindly pointed the author to an excellent source of Enron research: McLean and Elkind’s The Smartest Guys in the Room: The Amazing Rise and Scandalous Fall of Enron. This book provides a broader view of the Enron debacle, as well as pithy details that will be useful for any researcher of the Enron scandal. (The corresponding documentary movie has also recently been released.) Finally, Professor Lee Strickland at the University of Maryland’s College of Information Studies provided helpful and succinct views of how the curious needs of legal investigations fit the information-seeking models discussed in this paper. On a more personal note, a heartfelt thanks goes to the author’s housemates Dave Kuhl and Ken Shimada. They lifted her spirits when she became discouraged, and helped her brainstorm a way over the numerous roadblocks to understanding the “whole picture.” An unspoken thanks is due to the author’s brothers, who demonstrate in their daily lives the importance of “doing one’s best.” She is especially grateful to her older brother, who proved that one can go back to graduate school, even after one has passed the dewy-eyed age of 20-something. Finally, the author would like to thank her parents for their ongoing love and support – and for patiently waiting for her to return home once the paper was “all done.” The author has come to realize that, in reality, there is no such thing as “all done.” But they had the kindness to wait until the closest version of that was at hand. Hopefully that version will be helpful to any who read it.
3

Mara Hemminger Page 4 10/22/2005
Table of Contents Abstract ............................................................................................................................... 2 Acknowledgements............................................................................................................. 3 Table of Contents................................................................................................................ 4 Table of Figures .................................................................................................................. 8 Introduction......................................................................................................................... 9 PART I Background....................................................................................................................... 11
U.S. Energy................................................................................................................... 11 Electricity Industry.................................................................................................... 11
Power Generation.................................................................................................. 12 Power Transmission.............................................................................................. 14 Power Distribution................................................................................................ 14 Consumer .............................................................................................................. 15
Gas Industry .............................................................................................................. 15 Electricity Market ..................................................................................................... 15
Wholesale Market ................................................................................................. 16 Physical Market ................................................................................................ 16 Financial Market ............................................................................................... 17
Futures Market .............................................................................................. 17 Forward Market ............................................................................................ 19
Retail Market ........................................................................................................ 20 Gas Market................................................................................................................ 20
California’s Energy....................................................................................................... 20 California’s Energy Sources ..................................................................................... 21 California’s Electricity Industry ............................................................................... 22
Generation............................................................................................................. 22 Transmission ......................................................................................................... 24
California’s Electricity Market ................................................................................. 26 California Before Deregulation............................................................................. 26 California’s Electricity Market Deregulation: AB1890, 1996.............................. 26
Changes to the Electricity Industry................................................................... 27 Generators ..................................................................................................... 27 Transmission Lines ....................................................................................... 28 Distribution Lines ......................................................................................... 28
Changes to the Electricity Market..................................................................... 28 Wholesale Market ......................................................................................... 29
Physical Market ........................................................................................ 29 PX ......................................................................................................... 30
Day-Ahead and Hour-Ahead Markets .............................................. 30 Utilities Required to Use PX ............................................................ 30
ISO ........................................................................................................ 31 Real-Time Market............................................................................. 31
4

Mara Hemminger Page 5 10/22/2005
Ancillary Market............................................................................... 31 Congestion Market............................................................................ 31
Regulation of the PX and ISO .............................................................. 32 SCs ........................................................................................................ 32
Financial Market ....................................................................................... 33 Retail Market ................................................................................................ 34
California’s Natural Gas Industry............................................................................. 34 California’s Natural Gas Market............................................................................... 36
Enron............................................................................................................................. 37 Enron the Corporation............................................................................................... 37 Enron in California ................................................................................................... 38
Enron as Generator ............................................................................................... 39 Enron as Forward Marketplace Owner (EOL)...................................................... 39 Enron as SC........................................................................................................... 40 Enron as Marketer................................................................................................. 40
What Went Wrong with California’s Energy Market? ................................................. 41 The California Energy Crisis, 2000-2001................................................................. 42
Increased Demand................................................................................................. 42 Reduced Supply .................................................................................................... 43 Effect on the Utilities ............................................................................................ 44 Price Caps ............................................................................................................. 44
Enron’s Demise and Investigation, 2001 ...................................................................... 45 PART II FERC’s Investigation of Enron......................................................................................... 48
Methodology Used in This Paper ................................................................................. 48 Information-Seeking Model Used............................................................................. 48 Data Presentation ...................................................................................................... 51 Data Sources ............................................................................................................. 51 Caveat ....................................................................................................................... 52 Explanation of the Chart ........................................................................................... 53
Information Need(s).............................................................................................. 54 Data Requests........................................................................................................ 55 Data Replies .......................................................................................................... 56 Evidence Relevant to IN(x) (Answers)................................................................ 56 Conclusions........................................................................................................... 56
The Nitty-Gritty ............................................................................................................ 57 Information Need 1 (IN1) ......................................................................................... 57
Data Request 1 (DR1)........................................................................................... 57 FERC’s Data Request 2 (DR2) ............................................................................. 58 FERC’s Data Request 3 (DR3) ............................................................................. 58
Gas ............................................................................................................................ 58 Electricity.................................................................................................................. 59
Scheduling False Demand............................................................................. 60 Inc’ing / Fat Boy ....................................................................................... 61
5

Mara Hemminger Page 6 10/22/2005
Dec’ing / Thin Man................................................................................... 62 Export/Re-import Strategies ......................................................................... 62
Energy Export ........................................................................................... 62 Energy Re-import: Ricochet / Megawatt Laundering............................... 63
Forced Congestion Payments........................................................................ 63 Scheduling Energy to Collect Congestion Charge II (CCC-II) ................ 63 Death Star.................................................................................................. 64 Load Shift.................................................................................................. 64 Wheel Out ................................................................................................. 65
Ancillary Services......................................................................................... 66 Get Shorty ................................................................................................. 66 Selling Non-Firm Energy as Firm Energy ................................................ 67
FERC’s General Conclusions about DR3’s Replies: Electricity ...................... 67 FERC’s Data Request 4 (DR4) ............................................................................. 68
FERC’s Information Need 1a (IN1a)........................................................................ 68 FERC’s Data Requests 5 and 6 (DR5 and DR6) .................................................. 68 FERC’s Data Requests 7 and 8 (DR7 and DR8) .................................................. 69
Market Models of IOU Behavior...................................................................... 70 Affidavits about Engaging in Enron’s Trading Strategies................................ 70 Communications Data (Email) ......................................................................... 71
Email Evidence of General Awareness of Enron’s Trading Practices ......... 71 Email Evidence of Enron’s Sale of Fake Ancillary Services ....................... 71 Email Evidence of Enron’s Forcing Congestion Payments.......................... 72
FERC’s Data Request 9 (DR9) ............................................................................. 73 FERC’s Information Need 2 ..................................................................................... 73
FERC’s Data Request 3 (DR3) ............................................................................. 74 FERC’s Data Request 7 (DR7) ............................................................................. 75
FERC’s Information Need 3 (IN3) ........................................................................... 76 FERC’s Information Need 3a (IN3a)........................................................................ 76
FERC’s Data Request 3 (DR3) ............................................................................. 76 FERC’s Information Need 3b (IN3b) ....................................................................... 77
FERC’s Data Request 1 (DR1) ............................................................................. 78 FERC’s Data Request 2 (DR2) ............................................................................. 78 FERC’s Data Requests 10-11 (DR10-11)............................................................. 79 FERC’s Data Request 12 (DR12) ......................................................................... 80 FERC’s Data Request 3 (DR3) ............................................................................. 80
FERC’s Information Need 3c (IN3c)........................................................................ 81 FERC’s Data Requests 13-17 ............................................................................... 81
Overall Conclusion ........................................................................................................... 83 Appendix A: Investigation Map........................................................................................ 86 Appendix B: Possible Email Questions .......................................................................... 102 Appendix C: Possible TREC Topics............................................................................... 110
Enron as Marketer....................................................................................................... 111 Enron as Scheduling Coordinator (SC)....................................................................... 113 Enron Manipulating the Market as an SC or Marketer............................................... 116
Appendix D: Scheduling Coordinators........................................................................... 122
6

Mara Hemminger Page 7 10/22/2005
Appendix E: History of the Gas and Electricity Markets ............................................... 124 Gas Market History..................................................................................................... 124 Electric Market History............................................................................................... 125
The Birth of the Electric Power Industry................................................................ 125 Regulation of the Electric Power Industry.............................................................. 125 Deregulation of the U.S. Electric Power Industry .................................................. 127
Deregulation of Generation Assets ..................................................................... 127 Deregulation of Transmission Assets ................................................................. 128
Index ............................................................................................................................... 129 Bibliography ................................................................................................................... 133
7

Mara Hemminger Page 8 10/22/2005
Table of Figures
Figure 1: Electricity Industry Model 12 Chart 1: Major Sources of Energy in the U.S. in 2003 13 Figure 2: Transmission Line 14 Figure 3: Distribution Line 15 Figure 4: Electricity’s Physical Market 17 Figure 5: U.S. Futures Energy Trading Hubs 19 Figure 6: Physical and Financial Energy Market Model 20 Chart 2: Sources of California’s Energy Production, 2002 21 Table 1: Electric Power Generation by Primary Energy Source, California 21 Figure 7: California’s Power Plants, 2004 23 Figure 8: California’s Electricity Transmission Lines as of 2004 25 Chart 3: California’s Generation Ownership after Deregulation (ca. 2000) 27 Figure 9: California’s Electricity Industry Model 28 Figure 10: California’s Physical and Financial Electricity Market Model 29 Chart 4: Sources of California’s Natural Gas, ca. 2001 35 Figure 11: California’s Out-of-State Gas Supplies and Pipeline Network 36 Table 2: California’s Gas and Electricity Forward Trading Hubs 37 Figure 12: Enron’s Role in California’s Deregulated Energy Market 39 Figure 13: California’s Price Caps 45, 60 Figure 14: Information-Seeking Model I 49 Figure 15: Information-Seeking Model II 49 Table 3: FERC’s Data Requests, Ordered by Number 86 Table 4: FERC’s Data Requests, Ordered by Date 87 Table 5: FERC’s INs -> FERC’s DRs -> Enron’s Replies -> FERC’s Conclusions 88 Table 6: California Scheduling Coordinators (SCs) in February 2002 122 Figure 16: Electricity’s Original Monopoly Structure and Oversight 127
8

Mara Hemminger Page 9 10/22/2005
Introduction During 2001 and 2002, California witnessed unusually high energy prices, bankrupt utility companies, rolling blackouts, and large profits by energy companies. This led to cries of foul play by many citizens and leaders, who suspected the energy marketers1 were making a profit at the consumers’ and utilities’ expense. In early 2002, the Federal Energy Regulatory Commission (FERC), which oversees the prices in jurisdictional wholesale energy markets in the U.S. to ensure that they are just and reasonable (35, p. 1), launched an investigation. It sought to discover whether any entity, to include Enron Corporation and its affiliates, had used its market position to distort electric and natural gas markets in the Western United States (35, p. 1). The investigation combed through large amounts of company data, such as memos, sales reports, correspondence, voice conversations, and emails – much of which FERC subsequently put into the public domain. This corpus of Enron data became the first large collection of real-life data, especially email data, that was widely available for public use and research (132, 133, 134). By the end of its investigation, FERC had found Enron and several other energy companies guilty of manipulating energy prices in California. These findings led to several subsequent legal cases, many of which are still underway. The purpose of this paper is to understand the process through which FERC might have searched Enron’s online data archives to answer its investigation’s questions. This process might mirror the ways that other investigative entities, such as lawyers or historians, might seek information in the digital world. The wealth of publicly accessible data in the Enron case, especially the email archives, lends itself well to this goal. Therefore, this paper seeks to reconstruct the following aspects of the Enron investigation: what FERC’s original information needs were in the investigation; what specific questions were asked; and what the answers to those questions were. In the process of this research, the iterative nature of question-answering, and the need to search multiple data sources to answer questions, become evident. It should be noted, however, that the author originally focused on the Enron email archive. Hence, any specific answers that were found or supported through email evidence are highlighted in the paper. Also, since many of FERC’s findings of purposeful market manipulation were limited to the electricity market, the author has focused much more on electricity than on gas. In order to understand FERC’s information-seeking process, however, it is first necessary to have some background on the Californian energy story. Therefore the paper has been broken down into two halves, which have a very different “look and feel” from each other. The first half of this paper will attempt to do this by giving an overview of: the energy industry and market in the United States generally, and in California specifically, at the time of the allegations; the 2000/2001 energy crisis in the West, and how it 1 An energy marketer is an independent middleman who buys and sells wholesale electricity at market prices, but who has no generation, transmission, or distribution capacity in his own right. (5, p. 7) This definition will make more sense upon reading the Physical Energy Market and Financial Energy Market sections of this paper.
9

Mara Hemminger Page 10 10/22/2005
contributed to these allegations; Enron’s role within the Californian energy market; and the specific accusations levied against Enron. The second half of the paper examines how FERC went about finding the information for its investigation. This includes a theoretical model of how people seek information in general, followed by a description FERC’s information needs, data requests, answers, and conclusions in this particular investigation. Finally, there are several appendices, which the reader might find helpful. Appendix A provides a table overview of these questions and answers. Appendices B and C show some examples of queries that the author imagines might have been posed of the email dataset during this investigation. Appendix D lists some important players (scheduling coordinators) in California’s energy market, as will be explained later in the paper. Appendix E provides general historical background on the electric and gas industries in the U.S. There is also an index, which the reader might find helpful for locating definitions of the numerous terms and acronyms, or finding the explanations of Enron’s various market strategies. The reader might find it helpful to print the index out separately, and refer to it as necessary while reading the paper.
10

Mara Hemminger Page 11 10/22/2005
PART I Background
Energy is big business. In 2004, the U.S. comprised the world’s largest electric market, consuming more than one quarter of world production. (5, p. 2) This consumption is fairly evenly divided amongst the residential, commercial, and industrial markets, with a small amount going to transportation and direct use. (84) Looking at solely the residential side, electricity accounted for approximately 60% of the U.S. household utility2 market in 2002, with 30% of that coming from natural gas. (9, pp. 2-3) With those figures in mind, it is easy to see how the energy market generally, and the electric and natural gas markets specifically, have the potential to generate great sums of money. Any successful manipulation of these markets could lead to huge profits. But what exactly is this energy market that is being discussed here? How is this energy produced? How is it harnessed for human consumption? How is its sale or flow controlled? These questions can best be answered by examining the structure of the industrial, physical, financial, and regulatory energy market.
U.S. Energy It is best to get a macro view of the energy industry and market in the United States, before narrowing in on California. What follows is a description of the U.S. energy scene.
Electricity Industry The electricity industry can be thought of as the physical space where electricity is actually produced and/or transmitted. It is not concerned with when, how, or where that energy is sold for money.3 The electricity industry has three main phases: power generation, power transmission, and power distribution. (15, p. 61) Refer to Figure 1 below to better understand this processing sequence and the explanations:
2 A utility is broadly defined as a public service. The major utility sectors are electricity, natural gas, and water. (9, p. 1) In the broader sense, utilities also include services such as sewage, telephone, and cable TV. (10, p. 1) 3 The sales side of the equation is called the energy market. This will be discussed shortly.
11

Mara Hemminger Page 12 10/22/2005
Figure 1: Electricity Industry Model, © Mara Hemminger 2005
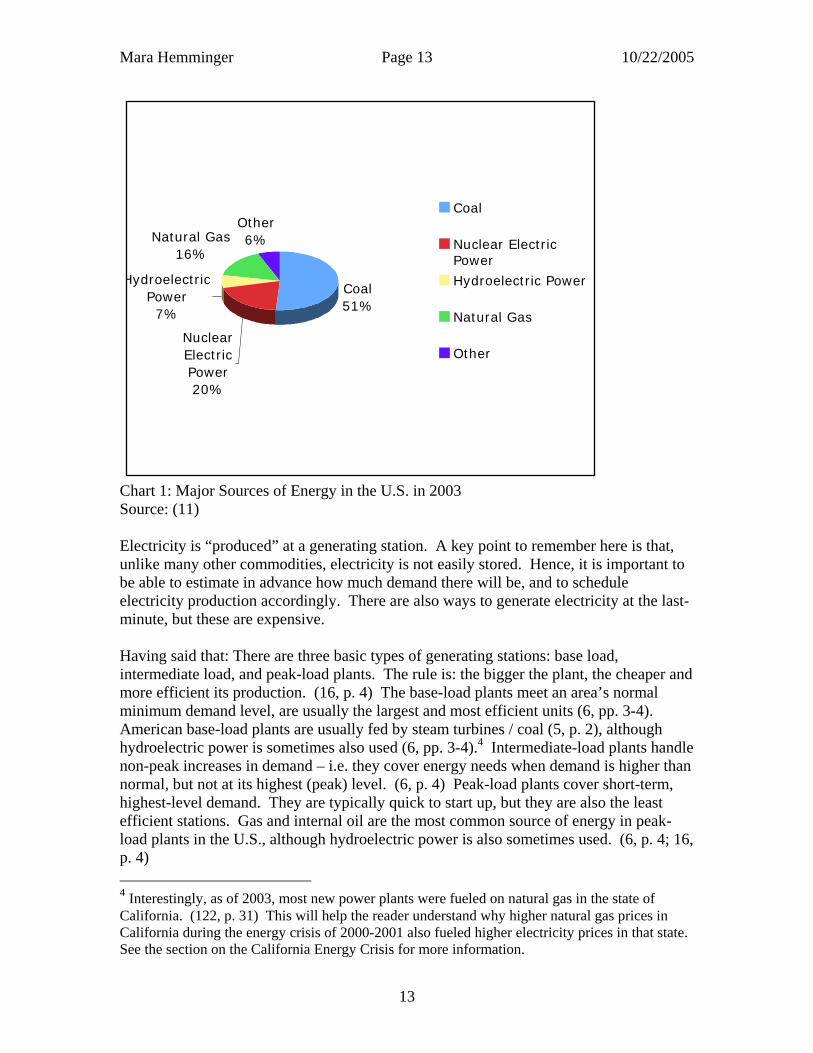
Power Generation Electric power can be generated several ways, as is evident in Chart 1 below. The most common method is to burn non-renewable fossil fuels, such as coal, petroleum, and natural gas (6, p. 4). Each of these sources has its advantages and disadvantages. Coal is cheap (16, p. 4), and so generated the majority of the world’s electricity as recently as 2004 (5, p. 2). However, it is considered fairly dirty, producing a great deal of air pollution when burned. Petroleum is popular, but worldwide reserves are dwindling (5, p. 3), and the U.S. relies more heavily on imports than national production. (84, p. 159) Natural gas claims some advantages over its fellow fossil fuels. It is generally touted as a “cleaner” solution to coal, as it emits no soot, carbon monoxide, or nitrogen oxides when burned. (5, p. 19) It also has a higher number of known but untapped reserves than petroleum. (5, p. 3) Outside of these fossil fuels, there are some “alternative” sources, such as wind, hydroelectric, and nuclear energy. These tend to be more expensive than the above, traditional methods of production. (7, p. 42.)
12
Mara Hemminger Page 13 10/22/2005
Coal51%
Nuclear Electric Power20%
Hydroelectric Power7%
Natural Gas16%
Other6%
Coal
Nuclear ElectricPower
Hydroelectric Power
Natural Gas
Other
Chart 1: Major Sources of Energy in the U.S. in 2003 Source: (11) Electricity is “produced” at a generating station. A key point to remember here is that, unlike many other commodities, electricity is not easily stored. Hence, it is important to be able to estimate in advance how much demand there will be, and to schedule electricity production accordingly. There are also ways to generate electricity at the last-minute, but these are expensive. Having said that: There are three basic types of generating stations: base load, intermediate load, and peak-load plants. The rule is: the bigger the plant, the cheaper and more efficient its production. (16, p. 4) The base-load plants meet an area’s normal minimum demand level, are usually the largest and most efficient units (6, pp. 3-4). American base-load plants are usually fed by steam turbines / coal (5, p. 2), although hydroelectric power is sometimes also used (6, pp. 3-4).4 Intermediate-load plants handle non-peak increases in demand – i.e. they cover energy needs when demand is higher than normal, but not at its highest (peak) level. (6, p. 4) Peak-load plants cover short-term, highest-level demand. They are typically quick to start up, but they are also the least efficient stations. Gas and internal oil are the most common source of energy in peak-load plants in the U.S., although hydroelectric power is also sometimes used. (6, p. 4; 16, p. 4) 4 Interestingly, as of 2003, most new power plants were fueled on natural gas in the state of California. (122, p. 31) This will help the reader understand why higher natural gas prices in California during the energy crisis of 2000-2001 also fueled higher electricity prices in that state. See the section on the California Energy Crisis for more information.
13

Mara Hemminger Page 14 10/22/2005
Electricity is measured in watts, where one watt equals 1/746th of one horsepower. Electricity is sold in kilowatt hours (kWh), where one kWh equals the amount of electric energy required to burn ten 100-watt light bulbs for one hour. (6, p. 1) Now, what happens to electricity once it is generated? It is routed to the customer. This is a two-step process, involving transmission and distribution.
Power Transmission Transmission is simply the transportation of energy from its production source (the generator) over high-powered electricity lines to substations. This is generally done via overhead or underground transmission lines. (15, p. 13) See Figure 2 for a picture of a typical transmission line.
Figure 2: Transmission Line
Power Distribution The distribution phase starts at the substation, which transforms the high-voltage power from the transmission lines to the low-voltage power appropriate for the consumer lines. It then divides and routes this energy to the “distribution” lines, which typically go underground or overhead, via the ubiquitous neighborhood electric poles, to the end customer. (15, p. 15) See Figure 3 for a picture of a typical overhead distribution line.
14

Mara Hemminger Page 15 10/22/2005
Figure 3: Distribution Line
Consumer Finally, the power arrives at the consumer’s location, be that a private residence or a large company. The electricity typically enters the premises through a fuse/electrical box. (15)
Gas Industry The gas industry looks nearly the same as the electric industry picture (Figure 1), except that gas is extracted from the earth at a gas field and is routed via pipelines. It is then either routed to electric power generators and used as fuel source to produce electricity, or routed directly to industrial, residential, or commercial consumers via another pipeline system. (84, p. 217)
Electricity Market The energy “market” is an (often virtual) place where money is exchanged for energy. In other words, it represents sales transactions. This is slightly different than the industrial side of the picture, which is merely concerned with the physical production and transportation of power. However, production and sales are two sides of the same coin. Thus, the market model can be superimposed on the industrial model, as is shown in Figures 5 and 7. The energy market has a wholesale and a retail side. The wholesale side consists of physical and financial markets. (85, p. 4) The retail market consists of simply retail sales to the final customer, who will actually use the energy. These markets are briefly described below.
15
Mara Hemminger Page 16 10/22/2005
Wholesale Market The wholesale market is comprised of the physical and financial markets. These will be examined in turn.
Physical Market In order to visualize the energy marketplace, imagine the industrial picture (shown in Figure 1) in terms of sales. How is energy bought/sold as it passes from the generator to the transmitter to the distributor? When one looks at the picture this way, one looks at energy’s “physical market,” which is defined as a marketplace where energy is bought and sold for actual delivery. Technically speaking, the physical market consists of only the “spot” or “real-time” market, where energy is sold for immediate delivery. So it can be considered a marketplace for short-term sales.5 However, day-ahead markets are often also classified as physical markets, as will be seen later in a discussion of California’s market. (86, p. 2.) Overlaying these two markets will reconfigure Figure 1 into Figure 5 below. Here, one can see that the generation / transmission transaction, wherein a generation plant sells energy to a distribution company, equates to the “wholesale” side of the physical market. Similarly, the distribution side of the equation, where the local electric company sells that energy to the consumer, equates to the “retail” side.6 This sales aspect of the energy flow can be mapped into the industrial picture thus:
5 These different wordings for the same concept can be confusing. For instance, FERC’s data requests often asked for information about short-term or long-term sales. FERC’s final report, however, generally discussed the physical and financial markets. The law that deregulated California’s electricity market, AB 1890, also addressed these as physical and financial markets. 6 Sometimes large industrial consumers may be physically located on the retail side of this equation, but may buy their energy directly from the generator on the wholesale side of the equation. (101) The author has chosen to portray the physical model as it is in Figure 5, however, for the sake of simplicity.
16

Mara Hemminger Page 17 10/22/2005
ConsumerSubstationGenerator
TransmissionLines
DistributionLines
Wholesale Market Retail Market
Figure 4: Electricity’s Physical Market, © Mara Hemminger 2005
Financial Market A financial market allows participants to buy or sell power with no actual obligation to deliver the power. This is because the participants may resell their power purchases before the delivery date arrives. (101) The objective is not to provide a commodity; it is to make money, based on that commodity’s value. Any power that is not delivered is paid for by a financial transfer. This is in contrast to the physical market, which requires actual delivery of power. Technically, any market that is not real-time can be considered a financial market. (86, p. 2) this would mean that the day-ahead market is a financial market. However, FERC classified the day-ahead market as part of the spot (physical) market in its investigation; therefore, this paper will do the same. Under this definition, then, the financial market includes the futures and forwards markets. These are discussed below.
Futures Market In the futures market, traders buy and sell standardized, transferable, exchange-traded contracts that promise delivery of a commodity, bond, currency, or stock index, at a specified price, on a specified future date. In energy futures, the delivery date is usually a month after the sales date. (46, p. 2) This is because one month is the standard delivery date written into the fixed-form futures contract. (101) Energy futures are traded at certain “hubs” around the U.S. A “hub” is a delivery point on a power grid where power can be sold and ownership can change hands. (15, p. 78) The liquid spot-trading hubs, for example, were rarely involved in the actual delivery of energy, but were capable of it. This capability was considered necessary for the hubs’ hedging activity to occur. (46, pp. 1-2) There are numerous hubs where electricity could
17
Mara Hemminger Page 18 10/22/2005
be sold in the U.S.; however, 85% of the trading is concentrated at a dozen or so locations. (91) A futures market allows both purchasers and sellers to hedge their bets on what energy prices would do in the future, and to “protect” themselves from uncertain changes. For instance, a buyer can invest in futures to protect himself from an expected price increase, while a seller can invest to protect himself from an expected price decrease. (46, pp. 1-2) This hedging, and the resulting sense of self-protection, tends to have a stabilizing effect on most markets. Buyers are more willing to commit to future purchases, because they feel safe in their negotiated future price. Sellers are more willing to invest in large undertakings, such as constructing generation plants, because they have a guaranteed flow of future income. (15, p. 78) Futures are run by a formal exchange and guaranteed by a clearinghouse.7 (87) The New York Mercantile Exchange (NYMEX) (89 and 90) and the Chicago Board of Trade (CBOT) (15, p. 78) act as the clearinghouses (exchanges8) for these hubs’ futures contracts. NYMEX runs the California-Oregon Border (COB) and Palo Verde hubs, which are the hubs closest to California. (15, p. 78) The major U.S. hubs can be seen in Figure 6 below.
7 A clearinghouse is a neutral third party that removes credit risk from the futures transactions by guaranteeing that all parties will honor their fiduciary commitments. It also oversees the operation of the market, to ensure fair and orderly transactions. For instance, it sets a daily limit, or a maximum amount that a futures price is permitted to move in one day, compared with the previous day's settlement price. This is done to protect the small speculator against the larger traders, who could conceivably distort prices over a short time period and thus cause distress liquidation. Finally, the clearinghouse is regulated by various government agencies to ensure against default. (88) 8 A clearinghouse sounds (to the author) like the same thing as an exchange.
18

Mara Hemminger Page 19 10/22/2005
Mid-Columbia
GA/FL
TVA
PJM
NEPOOL
NYPP
ComEd
PaloVerde
North SPP
COBCinergy
Entergy
Four Corners
Current and ProposedFutures Trading Hubs
Other Cash Trading Hubs*
ν SP15
ν NP15
Figure 5: U.S. Futures Energy Trading Hubs Source: (85) Note: NP15 and SP15 were Cal-ISO zones (19, p. V-7&8) When Enron collapsed, there was a significant fall-out on the futures market. However, there were no serious or long-lasting repercussions on futures prices -- perhaps thanks to the mitigating influence of the neutral parties that ran the futures exchanges (e.g. NYMEX). (46, p. 2)
Forward Market The energy market also has what is called a “forward market.” Forwards are very similar to the futures, except that futures contracts contain standardized wording, are traded on a formal exchange, are regulated by overseeing agencies,9 and are guaranteed by clearinghouses; forwards are not. (87) Forwards use non-standardized, privately negotiated, bilateral contracts, as opposed to the futures’ sales through a clearinghouse. Like futures, the forward price is the commodity’s spot price plus the “cost of carry” (foregone interest, convenience yield, storage costs, and interest/dividends). Unlike futures, each forwards party bears its counterparty’s credit risk. Therefore, forwards’ prices typically include a premium to cover the other party’s credit risk. (93) Forward
9 The NYMEX is regulated by the Commodity Futures Trading Commission (CFTC), and has been since 1974. (92. Also 101)
19

Mara Hemminger Page 20 10/22/2005
energy contracts also usually promise energy delivery farther off in the future than the futures contracts, i.e. more than one month away. (46, p. 2)
Retail Market Finally, there is the retail market. This is where the retailer/distributor sells the energy to the final consumer. This might be a private resident, a large corporation, a public agency, etc. Superimposing the above market onto the industrial picture yields the following physical/financial energy model: Figure 6: Physical and Financial Energy Market Model, © Mara Hemminger 2005
Gas Market
he gas market is reasonably different from the electricity market. Gas is traded at ity
ConsumerSubstationGenerators
Forwards
Futures
Wholesale Market Retail Market
Real-time / Spot market
Hour-ahead;Day-ahead
< 1 month1+ months
Time
Physical MarketFinancial Market
Tvarious physical and financial hubs, which are just slightly different than the electrichubs. The author would refer the reader to the Department of Energy’s Energy Information Administration (EIA) website, http://www.eia.doe.gov/, for more information.
California’s Energy
ith this basic understanding of how the industrial and market sides of energy work, one Wcan now examine the Californian energy scene in particular.
20

Mara Hemminger Page 21 10/22/2005
California’s Energy Sources California relies on several sources of energy, such as natural gas, nuclear, hydroelectric, (107, p. 3) and thermal (7. p. 8) energy. The primary source by far, however, is natural gas, followed by hydroelectric and nuclear energy. This can be seen in Chart 2 below. Chart 2: Sources of California’s Energy Production, 2002
s can be seen below, this allocation of energy sources is typical for California, and was
Coal
Petroleum
Natural Gas
Other Gases
Nuclear
Hydroelectric
Other Renewables
Other
Natural Gas: 49%Other Gases: 0.7%Nuclear: 19%
Hydro-electric: 17%
OtherRenewables : 13%
Coal: 1% Petroleum: 1%
Source of data for this chart: (107, p. 3) Anot isolated to the time period of FERC’s investigation:
Energy Source
MWh, 2002 Percentage of 2002
Generation
Percentage of 1997
Generation
Percentage of 1993
Generation Coal 2,327,809 1.3% 1.3% 1.7% Petroleum 1,961,066 1.1% 1.2% 1.9% Natural Gas 8 4 4 49,624,044 8.7% 1.1% 2.6% Other Gases 1,240,053 .7% 1.7% 1.7% Nuclear 3 18 1 14,352,340 .6% 7.7% 6.9% Hydroelectric 30,899,631 16.8% 24.3% 21.8% Other Renewables
23,680,568 12.9% 12.6% 13.4%
Other 124,520 .1% 0% 0% Total Electric Industry
184 10 10 10,210,030 0% 0% 0%
Table 1: Electric Power Generation by Primary Energy Source, California, 2002 Source: (107, p. 3)
21

Mara Hemminger Page 22 10/22/2005
California’s Electricity Industry
Generation There are numerous generation plants within the state of California, and the majority of these run on oil or gas, as can be seen in Figure 7 below. There are too many plants to name, but reader should visit the California Public Utility Commission’s website at http://www.energy.ca.gov/electricity/#powerplants for a listing all plants (and substations) in the state. These are large Excel spreadsheets, so beware.
22

Mara Hemminger Page 23 10/22/2005
Figure 7: California’s Power Plants, 2004 Source: (123)
23

Mara Hemminger Page 24 10/22/2005
Transmission Due to time constraints, the author did not research California’s transmission lines in great detail. The author will note, however, that most of California’s transmission lines ran North-South, with some East-West lines appearing in the southeastern part of the state. These lines appeared to have “Path” names, such as Path 15, Path 66, etc.10 (7, p. 1211) A map of the various companies’ transmission lines as of 2004 follows.
10 The larger transmission lines with major congestion during California’s energy crisis (2000) were Path 66, Path 15, Path 26, and Path 42. (7, p. 12) See the section on Congestion Payments for more information about congestion. 11 This source shows the most congested paths during California’s energy crisis. (7, p. 12)
24

Mara Hemminger Page 25 10/22/2005
Figure 8: California’s Electricity Transmission Lines as of 2004 Source: (124)
25

Mara Hemminger Page 26 10/22/2005
California’s Electricity Market California’s electricity market was a bit complicated at the time of Enron’s demise. This was largely due to the fact that California transitioned from a regulated monopoly structure to a deregulated market structure. The confusion surrounding this switch allowed Enron to manipulate the supply and price of electricity. Hence, this market will be examined in detail next.
California Before Deregulation As with the rest of the country, California’s energy market had originally been a monopoly. (See Appendix E for a history of the electricity and natural gas markets in the United States, to include their regulation and deregulation.) California had two types of monopolies.12 One type was the privately owned (a.k.a. investor owned or independently owned or IOU) public utility, such as a municipal corporation. This company was regulated at the appropriate level, such as the municipal level. The other type was the publicly owned public utility; this was regulated by CPUC. (99) By the 1990’s, however, this structure came under pressure to change. California was suffering from electricity prices that were significantly higher than in the rest of the nation, resulting in a reduced economic competitiveness, loss of business, and prolonged recession in the state during the early and mid-1990’s. (7, p. 2) Some blamed the high prices on the utilities’ decision in the 1970’s and 1980’s to invest in expensive alternative energy sources such as nuclear, independent, and renewable energy. (7, p. 2; 16, p. 2) Seeing the advances in generation technology and (at the time) low natural gas prices, energy consumer advocates thought that California’s energy costs could be reduced if energy companies were encouraged (through deregulation) to invest in these cheaper sources. (7, p. 2) The federal government had already passed numerous pieces of legislation encouraging / requiring energy markets across the nation to deregulate. (See Appendix E for more information.) Deregulation appeared, moreover, to be a low-risk option. The Western United States (including California) had a significant overcapacity in electricity at the time, so it was believed that competition could easily be introduced into the market. (7, p. 2) California state legislators jumped on the bandwagon, and advocated deregulation of California’s market, in the hopes that this would be more efficient than the old monopoly structure. (99)
California’s Electricity Market Deregulation: AB1890, 1996 On September 23, 1996, California Governor Pete Wilson began the deregulation of his state’s electricity market by signing Assembly Bill 1890 (AB1890). (15, p. 83) The many provisions of this bill were to take effect on March 31, 1998. These changes will be evaluated here based on their effects on the industry and on the marketplace. 12 AB 1890 appears to also refer to these former monopolies as “electrical corporations.”
26

Mara Hemminger Page 27 10/22/2005
Changes to the Electricity Industry Before California began its deregulation, its energy industry operated as a monopoly, just like the rest of the nation used to. This meant that the generators, transmission lines, substations, and distribution lines were all owned and run by monopolistic utility companies. One and only one monopoly would service a given geographic region, and it was responsible for meeting the energy demands of that region. Once the winds of deregulatory change began to blow, however, California completely changed this structure.
Generators AB1890 required the utilities to sell many of their fossil fuel generating stations, loosening the utilities’ hold on the vertical market. (7, p. 2) As a result, the three public utilities sold all of their gas-fired generators (7, p. 14) and most (if not all) of their oil-fired plants to other companies. (19, p. VI-16) These new owners were commonly called non-utility generation owners (NUGs) (19, p. VI-16). The chart below shows what percentage of California’s generation these NUGs accounted for, and which companies owned them. Importantly, these other companies had no obligation to serve a particular territory, since they did not fit the old monopolistic “serve thy area” paradigm. That meant that they could compete for any area, in keeping with the spirit of competition. However, it also meant that they had no obligation, moral or otherwise, to meet any one area’s energy needs; they only needed to make a profit to survive. (19, p. VI-16-17) As can be seen later, this profit-driven approach can lead to actions, which feed company profit, but ignore consumer needs.
Utilities15%
Qualifying Facilities & Others21%
Public Agencies22%
Other8%
AES8%
Reliant7%
Duke6%
Dynegy/NRG/Destec3%
Destec2%
Calpine2%
NUGs40%
Southern6%
Chart 3: California’s Generation Ownership after Deregulation (ca. 2000) Source: (7, p. 16)
27

Mara Hemminger Page 28 10/22/2005
Transmission Lines Although independently-operated utilities (IOU’s) used to own and run their own transmission lines, AB1890 created an entity known as the Independent System Operator, or ISO, and endowed it with the responsibility of managing the state’s transmission lines. The IOUs that had previously owned and run these lines still owned them; now, the ISO simply ran them. This arrangement ensured that the ISO could provide fair and impartial access to the transmission system. (15, p. 83) It also allowed the ISO to ensure that only as much power as a transmission line could handle was actually scheduled to traverse it. (95) This latter point will discussed in greater detail under “Congestion Payments.”
Distribution Lines Distribution lines remained in the hands of the old, monopolistic utility companies, and under the regulation of the CPUC. (99) These changes are reflected in Figure 9 below.
Figure 9: California’s Electricity Industry Model, © Mara Hemminger 2005 Source for Generator information: 7, p. 16.
Changes to the Electricity Market AB1890 affected both the wholesale and retail sides of the electricity market. These will be discussed separately.
28
Mara Hemminger Page 29 10/22/2005
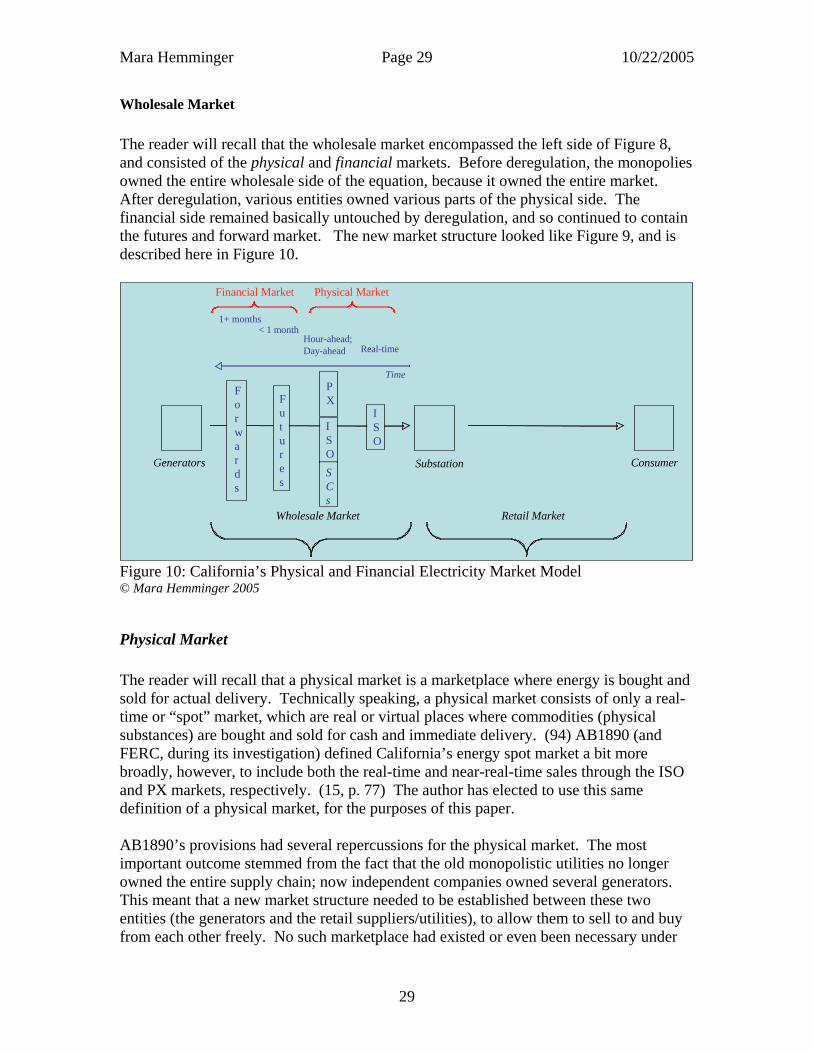
Wholesale Market The reader will recall that the wholesale market encompassed the left side of Figure 8, and consisted of the physical and financial markets. Before deregulation, the monopolies owned the entire wholesale side of the equation, because it owned the entire market. After deregulation, various entities owned various parts of the physical side. The financial side remained basically untouched by deregulation, and so continued to contain the futures and forward market. The new market structure looked like Figure 9, and is described here in Figure 10.
igure 10: California’s Physical and Financial Electricity Market Model
Physical Market
he reader will recall that a physical market is a marketplace where energy is bought and
ISO
B1890’s provisions had several repercussions for the physical market. The most er
buy
ConsumerSubstationGenerators
Forwards
Futures
ISO
Wholesale Market Retail Market
Real-timeHour-ahead;Day-ahead
< 1 month1+ months
Time
Physical MarketFinancial Market
ISOSCs
PX
F© Mara Hemminger 2005
Tsold for actual delivery. Technically speaking, a physical market consists of only a real-time or “spot” market, which are real or virtual places where commodities (physical substances) are bought and sold for cash and immediate delivery. (94) AB1890 (and FERC, during its investigation) defined California’s energy spot market a bit more broadly, however, to include both the real-time and near-real-time sales through theand PX markets, respectively. (15, p. 77) The author has elected to use this same definition of a physical market, for the purposes of this paper. Aimportant outcome stemmed from the fact that the old monopolistic utilities no longowned the entire supply chain; now independent companies owned several generators. This meant that a new market structure needed to be established between these two entities (the generators and the retail suppliers/utilities), to allow them to sell to and from each other freely. No such marketplace had existed or even been necessary under
29

Mara Hemminger Page 30 10/22/2005
the old monopolistic scheme – why would a utility need a market to buy, transmit, or distribute its own power over its own lines to its own consumers? AB1890 provided tmissing structure by creating the California independent system operator (Cal-ISO) and power exchange (Cal PX). These were to run California’s real-time and near-real-time markets, respectively, starting on March 31, 1998 (15, p. 83).
his
his new market structure also spurred the creation of other entities, such as scheduling
PX
Day-Ahead and Hour-Ahead Markets
er AB1890’s set-up, the PX was a state-chartered, non-profit entity that managed
the
is
bid
he PX made revenue from its transactions, and so appears to have been a self- charge it
Utilities Required to Use PX
theory, any generator or marketer could sell on this market, not just California rice
Tcoordinators (SCs), to help the new mechanism run smoothly. Each of these entities is discussed below.
PCalifornia’s near-real-time energy markets, namely the day-ahead and hour-ahead markets.13 It was subject to state oversight. (99, Points 335-340; also Article 4) Inday-ahead market, the PX established the market price for energy that would actually bedelivered one day later. In the hour-ahead market, the PX established the market price for energy that would actually be delivered one hour later. (15, p. 77) Operationally, thmeant that the PX would accept requests (from retailers/distributors) to buy a given quantities of electricity at a given price. It would then examine requests/bids (from generators) to sell energy at a certain price. The PX would then pick the lowest salesuntil it had enough supply to meet demand. (15, p. 84) All prices were publicly available. Tsupporting, solvent entity. (99, point 367, (a) (5) (c).) This money came from alevied against all power bought/sold through it. (101)
Incompanies. In practice, of course, a company would buy/sell here only if the PX pwere worthwhile. (101) AB1890 skewed this normal market dynamic by requiring the old monopolistic utilities14 to buy all of their needed electricity through the PX during
13 The reader might ask why it was necessary to have a day-ahead and hour-ahead market. Recall that electricity cannot be readily stored. Therefore it was necessary to price and schedule energy in advance of its actual delivery. 14 These old monopolies were California’s three largest independently-operated utilities (IOUs), namely Pacific Gas & Electric (PG&E), Southern California Edison (Edison), and San Diego Gas & Electric (SDG&E). (19, p. VI-20-21).
30

Mara Hemminger Page 31 10/22/2005
AB1890’s 4-year transition period. This was done to increase participation and liquidity in the wholesale market. (15, pp. 83, 84; 19, p. VI-4) Some claim that this forced arrangement prohibited the utilities from taking advantage of the forward/futures markets and the price-security those markets offered. (7, p. 4. Also, 13.) Others note that there were merely economic, not regulatory, disincentives for the old monopolies to participate in the financial markets. (101)
ISO The ISO was a state-chartered, non-profit entity that was responsible for California’s real-time market, ancillary services market, congestion market, (15, p. 77) and, as mentioned before, the state’s transmission grid. It, too, was subject to state oversight (99, SECTION 1. (c). Also Points 335-340. Also Article 3.) ISO’s costs were covered by charging entities for access to the state’s transmission grid. These charges were utility-specific. (99)
Real-Time Market In the real-time market, the ISO established the market price for energy that would be sold, bought, and delivered right now. Logically, this market should only have been activated if the real-time market were imbalanced – i.e. if actual demand exceeded scheduled supply, or vice-versa. If this situation arose, and if there were insufficient bids in the ISO to make up for this shortfall, the ISO had the right to purchase out-of-state energy for any price. This out-of-state price, however, did not affect the price paid to other (in-state) generators. (17, p. 4. 19, VI-17 is even better) This allowance led some marketers to withhold Californian energy on the PX market (thereby creating a shortage in the real-time market) and then sell out-of-state energy to California at a higher price on the ISO market. This will prove significant later, under the “Energy Export” section of the “FERC’s Investigation of Enron” half of this paper.
Ancillary Market The ISO also ran the ancillary market (15, p. 77), which was primarily responsible for holding production capacity in reserve, in case the ISO suddenly needed more energy in the real-time market. (19, p. VI-31) Note that the same generators that provide regular energy also provide this back-up energy. This means that an ancillary agreement may force a generator unit to sit idle during regular production, so it can actually deliver the reserve energy if needed. (81, pp 1-3) Sometimes this is referred to as “firm energy,” because orders for firm energy include ancillary services. (3, p. 7)
Congestion Market
31
Mara Hemminger Page 32 10/22/2005
The ISO further ran the congestion market. Here, the ISO would pay generators money not to send scheduled energy along a transmission line, should the ISO suddenly discover, in real-time, that it was attempting to send more energy across a line than the line could physically carry. By way of explanation: transmission lines are usually able to carry only so much energy, and that amount varies from line to line. An overloaded transmission line can heat up, sag, and then possibly hit something (like a tree branch or the ground). When it touches something, it will transmit its energy to that object, thereby shorting the line. If the transmission system is smartly organized, this will merely cause that particular line to short, as it would be immediately cut off from the rest of the system. If the system is poorly organized, this situation could cause a blackout through an entire sector. Apparently, just such an overload/short caused California’s first blackout during its “energy crisis” of 2000/2001. (101) “Congestion” occurs when more energy is passed over a line than that line can handle. The congestion payment was the money the ISO would pay generators not to send already scheduled energy over a now-congested line. The amount of the payment was determined on a daily basis as follows. Power generators submitted voluntary bids for how much money they would require to reduce their scheduled energy output, should the ISO ask them to. The ISO then used these bids to calculate a congestion cost/price for the various transmission lines. (15, p. 75-77) Note that this kind of congestion payment was not necessary under the old monopoly system. There, the utility simply did not send any extra energy - its own energy - over a congested line. Now that the utility/ISO no longer necessarily owned the energy it was transmitting, it needed to be ready to reimburse the generator/marketer/etc. for any scheduled but unsent energy. (15, p. 73)
Regulation of the PX and ISO To ensure their independence from the old monopolistic utilities, AB1890 placed the PX and ISO outside of the utilities’ control. (15, p. 83) The PX and ISO appeared to be now under state and federal control: although both were created by the California state government, and hence were beholden to state regulations, they were still subject to FERC oversight. This can be seen by the fact that FERC approved the ISO’s creation in October 1997, and the fact that FERC regulated the PX. (15, p. 83) The author posits that this dual-control arrangement might have come about because the ISO and PX linked the wholesale market (which falls under federal authority) to the retail market (which falls under state authority).
SCs
32

Mara Hemminger Page 33 10/22/2005
Now, how did the ISO know how much energy would traverse its transmission lines, so it could avoid congestion problems, etc.? This is where the Scheduling Coordinators (SCs) came in. The SCs were private entities that helped the ISO decide how much energy to transmit on a given day. They did this by submitting to the ISO a balanced schedule of expected demand and corresponding supply for their constituents for a given day.15 All uses of the ISO grid, in fact, had to be scheduled through an SC. (32, p. 28. Also, 101) Their constituents were those distributors/retailers and generators whom they represented on the market, for a fee. For instance, a distributor/retailer would let an SC have access to its historical metering data, and pay the SC to estimate how much demand for electricity (aka “load”) that distributor would typically need to meet during a given season, month, day, etc. (32, pp. 36, 41-46/UDC&ESP, 63, 69-70) Similarly, a generator would send its SC information about how much energy it could provide for a given time period, and it would pay the SC to sell enough of the generator’s energy to meet the SCs’ (i.e. their distributors) known demand. (95) There were numerous SCs in California – 108 in early 2001, to be precise. (96) (See Appendix D for a full list of the SCs that operated in California in February 2001.) The PX was the largest (19, p. VI-4) and a very powerful SC, as it ran the schedules for the three public utilities16 (19, p. VI-20). Many generators and utilities were also SCs. (101) The day before energy was to be delivered to customers in California, each SC would estimate how much energy (load) its constituent distributors would need that next day. The SC would also estimate how much supply (generation) would be available to meet that need. The SC would then balance these two estimates, so that the estimated supply equaled the estimated demand, and submit them together as one “schedule” to the ISO for approval. (This was done because the ISO required all SCs to submit balanced schedules. (19, p. VI-5)) The SC would also inform the ISO of which transmission grid would be used to transport the energy. (34, p. 14) The ISO would check that the schedule was balanced and that the proposed energy supply would not overload the proposed transmission lines, and would then approve or modify the schedule as needed. (95) The ISO would also establish the day-ahead congestion charge, as discussed earlier. (19, p.VI-5)
Financial Market Deregulation had no effect on California’s financial market for energy. California continued to use the national futures and forwards markets, just as it had before, and just like other states.
15 Only SCs could submit a schedule to the ISO for day-ahead sales/purchases. (101) 16 On December 15, 2000, FERC lifted its requirement that utilities sell their generation on the California PX market. (19, p. VI-22) That PX subsequently ceased operations in January 2001. (19, p. VI-5) It is not clear to the author how the Californian energy market worked after that, or what effect this had on the California ISO or SC’s.
33

Mara Hemminger Page 34 10/22/2005
It is perhaps worth noting that electricity forwards were traded at the following “locations”17 in the Western U.S.: SP15, NP15, COB, Mid-Columbia, and Palo Verde.18 (19, p. V-8)
Retail Market One of AB1890’s most important changes was that it allowed customers to choose their electricity provider, rather than being forced to use their local utility. This would supposedly provide free-market competition. This deregulation was to happen gradually, however, as retail prices were to be capped and regulated by the CPUC through 2002. (7, p. 2. Also, 15, p. 83, but this does not mention that caps were to be regulated.) The retail price cap was a complicated matter. One fall-out of AB1890’s requirement that the old utilities sell many of their generators was that the utilities needed to recoup their initial investment from when they had built and improved the state’s power facilities. Californian legislators did not want the average customer to bear this burden, so they placed a cap on retail prices for customers who purchased their energy through the PX. (99, point 367 (e) (2).) This cap froze retail rates at their June 10, 1996 level, and was to last for a 4-year transition period of March 31, 1998 – March 31, 2002. (15, p. 83) Since the utilities could not recoup their “stranded costs” from their customers, AB1890 allowed them to sell rate reduction bonds19 instead. (99) The reader will recall that nearly half of California’s electricity came from burning natural gas, and that some camps believed that the higher price in natural gas spurred the higher price in electricity during California’s energy crisis. Hence, it is worthwhile to cast a brief glance at California’s natural gas industry. This is done below.
California’s Natural Gas Industry For natural gas, California leans heavily on the Southwest. In 2000, 85% of California’s natural gas supplies came from out-of-state, and 15% came from in-state. (108) A fuller breakdown is shown in Chart 4 below.
17 Presumably “location” means the same thing as a trading “hub” in this context. 18 Presumably any these trades could be conducted on EnronOnline, which will be discussed under the section on Enron. 19 AB 1890 defined rate reduction bonds as “bonds, notes, certificates of participation or beneficial interest, or other evidences of indebtedness or ownership, issued pursuant to an executed indenture or other agreement of a financing entity, the proceeds of which are used to provide, recover, finance, or refinance transition costs and to acquire transition property and that are secured by or payable from transition property. (99)
34

Mara Hemminger Page 35 10/22/2005
Southwest
Rocky Mountains
Canada
California
Southwest: 47%California: 15%
Canada: 28% Rocky Mountains: 9%
Chart 4: Sources of California’s Natural Gas, ca. 2001 Source: (108) The major interstate gas pipelines serving southern California came from the following locations and belonged to the following companies (19, p. I-13 for company names; 108 for locations):
a) Southwest (47%) a. El Paso Natural Gas Company b. Transwestern Pipeline Company
b) Rocky Mountains (9%) a. Kern River
c) Canada (28%) a. PG&E
35
Mara Hemminger Page 36 10/22/2005
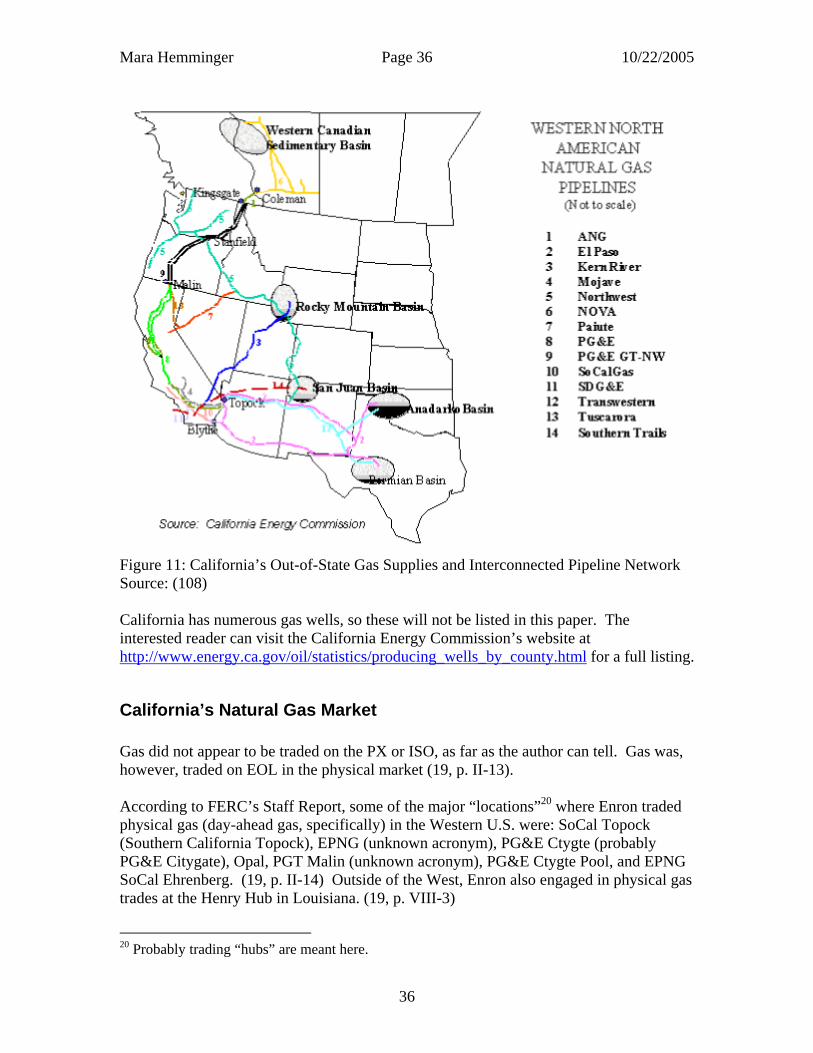
Figure 11: California’s Out-of-State Gas Supplies and Interconnected Pipeline Network Source: (108) California has numerous gas wells, so these will not be listed in this paper. The interested reader can visit the California Energy Commission’s website at http://www.energy.ca.gov/oil/statistics/producing_wells_by_county.html for a full listing.
California’s Natural Gas Market Gas did not appear to be traded on the PX or ISO, as far as the author can tell. Gas was, however, traded on EOL in the physical market (19, p. II-13). According to FERC’s Staff Report, some of the major “locations”20 where Enron traded physical gas (day-ahead gas, specifically) in the Western U.S. were: SoCal Topock (Southern California Topock), EPNG (unknown acronym), PG&E Ctygte (probably PG&E Citygate), Opal, PGT Malin (unknown acronym), PG&E Ctygte Pool, and EPNG SoCal Ehrenberg. (19, p. II-14) Outside of the West, Enron also engaged in physical gas trades at the Henry Hub in Louisiana. (19, p. VIII-3)
20 Probably trading “hubs” are meant here.
36

Mara Hemminger Page 37 10/22/2005
Also according to FERC’s Staff Report, forward gas contracts were traded at the following “locations,”21 which correspond roughly to their cousin locations for forward electricity trading: Electricity Forward Trading Hub Gas Forward Trading Hub SP15 Topock NP15 Malin COB Malin Mid-Columbia Sumas Palo Verde Permian Table 2: California’s Gas and Electricity Forward Trading Hubs Source: (19, p. V-8) The reader is referred to the California Public Utility Commission’s (CPUC’s) and Department of Energy’s Energy Information Administration (EIA) websites for more information.
Enron So, how did Enron fit into this picture? And what was “Enron,” anyway?
Enron the Corporation Enron was involved in many business ventures, as can be seen below. It was primarily known, however, for its gas and electric industry and energy marketing. Enron was originally founded out of three other companies in 1930, took the name of Northern Natural Gas Company, and placed its headquarters in Omaha, Nebraska. In 1986, it adopted the current name of “Enron Corporation,” and consolidated its headquarters in Houston. (48, pp. 1-3) Enron conducted its business operations through its subsidiaries and affiliates, which were engaged in the following (47, p. 1-2):
• Transport of natural gas through pipelines throughout the U.S. One example would be the Transwestern Pipeline Company, an Enron affiliate that transported natural gas from West Texas, Oklahoma, New Mexico, and the San Juan Basin in New Mexico/Colorado to California. (47, p. 1-2)
• Generation, transmission, and distribution of electricity to the Northwest U.S. For example, Enron purchased Portland General Electric Company (PGE), a utility in Oregon with generation transmission, and distribution capabilities, in 1996. (47, p. 1; 48, p. 4; & 47, p. 2)
• Marketing of natural gas and electricity, and related risk management services, worldwide. (47, p. 1-2)
21 Presumably “location” means the same thing as a trading “hub” in this instance.
37

Mara Hemminger Page 38 10/22/2005
• Development, acquisition, construction, and operation of power plants and pipelines worldwide. (47, p. 1-2)
• Development of intellectual network platforms. (47, p. 1-2) • Retail sales of natural gas and electricity to the residential and commercial
sectors. (47, p. 3) • Consulting services for smaller utilities. For example, acted as several utilities’
scheduling coordinator (for a fee), once deregulation made that market so complex. (19, pp. VI-37-39)
• Creation of EnronOnline for forward energy trading. (1999) (48, p. 5; 47, p. 2; 46, p. 2, 49b)
Enron’s divisions (which presumably contained its subsidiaries22) were as follows (36, p. 3):
• Enron Networks • EnronOnline (EOL) • Enron North America • Enron Power Marketing, Inc. (EPMI) • Enron Gas Marketing • Enron Generation • Enron Energy Services • Enron Broadband • Enron Transportation Services
Enron in California Enron was a presence in the Californian energy market by the time of the latter’s deregulation in 1998. (48, p. 5) In fact, Enron Board Chairman / CEO Kenneth Lay had been a big proponent of that deregulation. (48, p. 4) By the time of its demise in 2001, Enron played four roles in the Californian energy market: as a generator, forward marketplace owner, SC, and marketer. These roles are highlighted in red in Figure 12 below.
22 Author’s observation.
38

Mara Hemminger Page 39 10/22/2005
Figure 12: Enron’s Role in California’s Deregulated Energy Market, © Mara Hemminger 2005
Enron as Generator Enron did not own many physical assets (101), but it did own at least one generator23 – the production plant(s) associated with Portland General Electric Company (PGE) (47, p. 2), a utility that Enron had bought in 1996. (48, p. 4) Although Portland General was located in Oregon, it gave Enron good access to the Californian market because of its transmission lines (48, p. 4).
Enron as Forward Marketplace Owner (EOL) Enron held a powerful position in the nation-wide forward energy market - which clearly included the Californian forward market - through its founding of EnronOnline (EOL). EOL was an Internet platform that allowed online trading of gas and electric physical and forward sales.24 EOL was actually run by Enron Networks, Inc., an Enron subsidiary. 23 Enron likely owned more than one generator. (101, plus personal observation) The author was able to identify only Portland General, however. 24 EOL’s role in physical and financial, gas and electricity sales was deduced from statements in FERC’s Staff Report that indicate that many wash trades (to be defined later) occurred on EOL. These wash trades included physical and financial sales in the gas and electric markets. (19, VII-7-8) This was also deduced from FERC’s reporting that Enron marketers had attempted to manipulate next-day, physical gas prices on EOL (at the Henry Hub trading center) in order to make a profit on the financial gas market. (19, IX-14, 25) Having established this, EOL’s “physical market” was then more narrowly defined to mean the day-ahead market, per a conversation with an energy policy expert. (49) As far as the author can tell, EOL’s physical
39

Mara Hemminger Page 40 10/22/2005
(36, p. 3) Before EOL, forward energy deals had been struck via telephone, fax, etc. (36, p. 3) With the growth of the Internet, however, several online trading platforms appeared. EOL was the first of these, and was introduced in 1999 (48, p. 5). It gained popularity amongst the traders because it had a simple interface and it was quick, free, and easy to use. (19, p. IX-32; 36, p. 11 for the “free” bit) It proved to be a boon to Enron, because it reduced Enron’s transaction costs, increased its traders’ productivity, and decreased trade transaction times. (36, p. 12) Moreover, EOL used a one-to-many structure, which meant that Enron was party to every transaction, as either the buyer or the seller. (36, p. 3-4) Enron would post (on EOL) the price that it was willing to buy or sell energy for; counterparties would then click on that price to accept it and start a deal. This meant that Enron itself could not initiate a deal, only the counterparty would. (19, II, p. 26) Once a deal was completed, EOL did not display many of the sales details, such as final price, volume, or time of sale. This put marketers who had not been party to the transaction at an informational disadvantage, because, of course, Enron marketers had access to that data. This fact will be discussed in greater detail under Information Need 2, Data Request 3. EOL also provided Enron with access to the out-of-state sales market. (Recall that California imported a significant amount of its energy from out-of-state (49).) One way this would happen was that the ISO would import energy from out-of-state if it could not obtain enough supply in-state during shortages in the real-time market. Since many Western U.S. energy sales were conducted on EOL (49), and since Enron ran EOL (49), this might have provided Enron with a nice information advantage in the out-of-state market.25
Enron as SC Enron also acted as an SC in California. (19, p. VI-23) The reader will recall that there were numerous SCs in California, so Enron was only one of many. However, Enron did represent a reasonable number of generators and distributors, and so held some power as an SC. (96)
Enron as Marketer Finally, Enron acted as a marketer, buying and selling energy for resale or repurchase at all levels (physical and financial) of the wholesale market. In this capacity, as in its SC
electricity sales would not have taken place on the California PX, as the PX did not appear to use EOL (49). Rather, EOL’s physical electricity sales may have encompassed sales at hubs outside of California. EOL was, after all, a platform used by the entire Western energy market (49). The author chose not to draw EOL on the physical side of the energy market diagrams in this paper, however, in an effort to keep the reader’s attention focused on internal Californian sales, and also to keep the market model simple. 25 Author’s observation.
40

Mara Hemminger Page 41 10/22/2005
capacity, Enron never physically took control of the energy; it merely bought and sold it on others’ behalf. (101) Although Enron’s marketers did not belong to any one of Enron’s subsidiaries (101), Enron Power Marketing, Inc. (EPMI) does appear to have acted as one of the company’s main marketing arms (19, VI-39). EPMI claimed customers such as El Paso Electric, Valley Electric, Glendale, and Enron Energy Services.26 (19, pp. VI-39-40) Other possible marketing entities were Enron Energy Services, Inc. and Enron Energy Marketing Corporation. These three marketing companies all appear to have conducted short-term and long-term market services for Enron. This is based on the fact that Enron submitted information for all three of these subsidiaries in its reply to FERC’s data request 2 (DR2). (DR2 asked Enron to submit information about its short-term and long-term sales. Enron replied with data from these three subsidiaries.) (38, pp. 1-2, plus personal analysis.) Enron would sometimes use its power as an SC to facilitate its work as a marketer. (19, p. VI-38) This commingling of duties made it difficult, however, for the author to tell when Enron was acting as an SC and when it was acting as a spot-market marketer.27 It also made it unclear as to whether Enron’s short-term marketing subsidiaries (e.g. EPMI, above) also acted as SCs, in a dual-role. This problem surfaces, for instance, when reading descriptions of the Enron Services Handbook - Enron’s guidelines for business practices. According to the Handbook, Enron would build up its “clientele” slowly. Initially, it would typically charge its customers a fee for providing its “consulting services.” For example, Enron might charge a customer a certain price per MWh for scheduling energy with the PX. (This sounds like Enron is acting as an SC.) As this relationship matured, Enron would shift its charges from a fee-based structure to an equity-based structure when “marketing” wholesale power. (This sounds like Enron is acting as a marketer.) Here, both Enron and its customer would share the profits from marketing energy. In most instances, Enron used a 50%-50% profit split for its energy marketing services, and a 25%-75% split for the sale of ancillary services (where Enron received 25% of the profit, and the partner received 75%). (19, p. VI-37-38) Regardless of its role, it is easy to see how Enron would benefit from manipulating the PX and ancillary markets to make a profit, if it stood to gain a percentage of the profit made thereby, rather than receiving a simple, flat fee.
What Went Wrong with California’s Energy Market? Now the reader has a complete picture of the Californian energy market during deregulation, and of Enron’s role therein. This deregulated structure worked well enough in California for the first two years of deregulation. Wholesale electric prices dropped by nearly 50%. (7, p. 3) (Note: This may in line with CPUC’s goal (and practical guarantee) to reduce retail prices by at least 10% by mid-2002. (99) Then something 26 The reader should note that Valley Electric and Glendale appear in some of the emails that FERC cited as evidence of Enron’s manipulation of the spot market. 27 Indeed, the difference between an SC and a marketer can be confusing. Some main differences are that a marketer can be an SC, but does not need to be. Also, SCs could buy/sell only on the physical market; marketers could buy/sell on either the physical or the financial markets. (101)
41

Mara Hemminger Page 42 10/22/2005
happened in 2000 that turned California’s energy world on end, and that drew state and federal regulators’ attention to the questionable dealings of power marketers such as Enron. This event was the California energy crisis. Let us examine that now.
The California Energy Crisis, 2000-2001 In 2000, the energy market went amok in the western United States. (78, p. 7) It seemed to hit California particularly hard, where average wholesale electric prices quadrupled (7, p. 3) and natural gas prices increased six-fold. (7, p. 18) The “safe” cushion of 15% additional generating capacity that most Western states were advised to keep28 fell to 3.5% in California in the summer of 2000 and 6.8% that winter. (7, p. 4) Rolling blackouts became common throughout the state. The largest utilities declared bankruptcy. (1) The crisis became official when the ISO declared a Stage-2 emergency29 on May 22, 2000. The crisis did not end until July 3, 2001. (14, p. 1, 2) So what happened? Many people accused the new power marketers of manipulating the newly deregulated market to their own profit, and to the people’s detriment. (11, p. 6) This accusation leads to the topic of the second half of this paper. However, there were other factors at play. These will be mentioned first, to keep the story balanced. Plus, some of these factors’ existence allowed Enron to engage in the nefarious practices it was accused of. Depending upon whose story one chooses to listen to, some of the events that led to California’s energy crisis of 2000/2001 had nothing to do with Enron. Some sources point to a simple case of increased demand and reduced supply, complicated by an inefficient financial energy market that could not handle the situation. Other sources accuse Enron of wrongdoing. Let us examine the former faction first.
Increased Demand On the demand side, the summer / fall of 1999 and the spring / summer of 2000 were unseasonably hot, leading more customers to turn on their air conditioners. This obviously led to a higher demand for electricity to feed those air conditioners. (2, p. 1; 7, p. 8 for summer 2000) Per the laws of simple economics, higher demand leads to higher prices.
28 States are advised to keep a cushion of additional generating capacity, because electricity cannot be stored. Before deregulation, this cushion was at 26% in California; in 2000, it slipped to 3.5% and 6.8%. (7, p 4) 29 The California ISO issued Stage-1/2/3 Emergency warnings when the state’s stand-by generation capacity fell below an acceptable level. Stage 3 was the worst level, and was a sign that the ISO might order blackouts to keep the situation under control. (17, p. 4)
42

Mara Hemminger Page 43 10/22/2005
Reduced Supply On the supply side, the two greatest sources of wholesale energy, gas and hydroelectricity, were greatly reduced in 2000. Again, simple economics stipulates that lower supply leads to higher prices. What exactly lead to this reduced supply? Several things. The Western U.S. experienced high temperatures during the summer of 2000. This led to a drought, which reduced the water level at many of the rivers which generate hydroelectricity in the Pacific Northwest. Since California’s hydroelectric energy came predominantly from the Northwest, this significantly reduced California’s hydro supply. Estimates of this drop vary from 14% (19, p. I-10) to 28% (7, p. 8), when comparing supply levels from 1999 to 2000. Although the drought’s effect on California’s hydroelectric supply is widely accepted, some argue that it does not explain the contemporaneously high energy costs. For example, the Pacific Northwest (and the Columbia River specifically) suffered from a more severe drought in 1994, yet Californian electric prices did not rise as dramatically then as in 2000/2001.30 So the true effect of the drought is difficult to gauge. To offset this shortfall in hydroelectric energy, gas plants attempted to produce more energy. This ironically tended to drive gas prices up. (108) At the same time, as luck would have it, both the nation and California experienced a shortage of natural gas. California’s shortage appeared to be more acute, however. As noted earlier, short supply leads to higher prices. Nationwide, gas prices increased three-fold; in California, gas prices increased six-fold. (7, p. 18) One possible reason for California’s extreme shortage was an August 2002 rupture at one of the main gas pipelines into southern California, namely the El Paso Natural Gas Company’s (El Paso’s) pipeline in southeast New Mexico. (19, p. I-13) Since natural gas fuels many electricity plants, this would have had an obvious effect on electric prices as well.31 (19, p. I-13) On the other hand, there have been accusations that the El Paso Company, which owned one of the major gas pipelines into southern California, engaged in anticompetitive activities, thus driving prices up. There is also evidence that California had extra capacity along other pipelines, and so should not have experienced a shortage. (108) The reader can see why FERC suspected a manipulation of the gas market as well as the electricity market, based on these observations. Some thermal plants also tried to fill in the gap left by the Northwest’s lower hydroelectric output. As part of this effort, many thermal plants deferred their normal spring maintenance in 2000. As the drought continued through the summer, however, the plants continued to delay maintenance, until they simply started breaking down. This, then, led to a decrease in thermal production. (7, p. 8-10)
30 This is used as an argument that gas and electric prices were being manipulated instead. (14, p. 2 and 10-15) 31 However, that outage lasted only two weeks, so it is difficult to gauge its true effect. (19, p. I-13)
43

Mara Hemminger Page 44 10/22/2005
Some cite the lack of construction of new generation plants as a third problem, such that the increased demand of 2000/2001 hit a soft supply. One reason for this was that California had stringent regulations on the building of new power plants, which tended to discourage new construction. Case in point: there were at least 11 regulatory bodies (7, pp. 53-54), and their rules were continually changing (7, p. 14). Such roadblocks lead to unusually long waiting periods for permits to construct new power facilities. For instance, the average permit time was 20 months in California, but only 7 months in Texas. (7, pp. 14-16) This situation led to the dubbing of many fond acronyms in California, such as “NIMBY” (not in my backyard), “BANANAS” (build absolutely nothing anywhere near anyone), and “NOPE” (not on planet earth). (7, p. 53) Some claim that this lack of new production helped ensure that there were insufficient resources to produce the extra energy needed during the crisis. (1, p. 1) Others dispute that, noting that 1) the existing generators were not working at capacity during the crisis, and 2) the cited reason for this low generation, namely that the plants were old, was not valid. (52, pp. 2-4, 9/18/02, 14, p. 16-17)
Effect on the Utilities Someone had to feel the pinch here. Looking at the diagram below, one can clearly see that the increased demand and reduced supply hit the middleman (the utility companies) squarely between the eyes. The middleman had to pay more to buy gas in the wholesale market, due to energy shortages. At the time, the wholesale market had no price caps, as it had been stable for years. In 1999, one year before the energy crisis, the average price was $32/MWh. (79) By June 2000,32 however, the price of energy on the PX market had skyrocketed to $1,099/MWh. (78, p. 1) To pay these higher purchasing costs, the middleman needed to charge higher prices to his customers in the retail market. However, AB1890 had put a four-year price cap of $55/MWh on the retail market.33 (79) So those prices could not move. The utility company middleman had to recoup his losses. Since he couldn’t do this by adjusting his retail prices, he did it by reducing retail service. (7, p. 1) Hence the rolling brownouts and blackouts of the time. Even that was not enough, though, in the end; several utilities simply declared bankruptcy. (7, p. 1)
Price Caps Obviously, a state cannot see its citizens go without electricity. Therefore, the state of California stepped in to help the utilities out. California imposed a series of peak-hour price caps on the wholesale ISO market during the summer of 2000. (See Figure 13
32 This was the PX day-ahead price on NP15 on June 28, 2000. (78 p. 1) 33 This had been done in the belief that the wholesale prices would not rise above their traditionally stable price of less than $50/MWh. So retail prices could reasonably be capped at $55/MWh. (79)
44

Mara Hemminger Page 45 10/22/2005
below.) These ranged from $750/MWh in June to $500/MWh in July to $250/MWh in August. Note that these caps applied only to in-state ISO purchases – not to out-of-state ISO purchases. (7, p 14, 18) Theoretically, this should have helped the utilities out. In practice, however (and as will be seen later), these price caps had the unintended effect of driving energy sales during peak hours to the out-of-state market, where there was no price cap. (17, p. 4)
Figure 13: California’s Price Caps, © Mara Hemminger 2005 In conclusion, one can see that many factors were at work in 2000/2001 that wreaked havoc in the Californian energy market. It was an unstable market, with many loopholes for any marketer to take advantage of. Enron was but one marketer who recognized this opportunity.
Enron’s Demise and Investigation, 2001 Enron was a marketer in this confusing, loophole-filled market in California. And it was highly successful. At its height, Enron was the largest power trader in the United States (46, p. 2), and was touted by many as one of the most successful enterprises in the U.S. (100, p. 229) So, given all this success, what happened? Enron had posted tremendous earnings for years on end. Then suddenly, in 2001, Enron announced huge losses. (48, p. 6) Evidently, Enron had been losing money in its non-energy endeavors, and those losses had finally overtaken Enron’s tremendous profits in the energy market. (97, 100, pp. 337-343, 48, p. 5) Shortly thereafter, Enron announced that it had been misstating its earnings since 1997. In December of 2001, Enron filed for bankruptcy. (48, p. 6) And then the dirt flew. Arthur Anderson, Enron’s accounting firm, admitted to destroying potentially incriminating documents about Enron’s operations. Rumors circulated that
45

Mara Hemminger Page 46 10/22/2005
Enron had given large donations/contributions to George W. Bush’s presidential campaign and also to Attorney General John Ashcroft, to secure its interests in powerful public policy-making circles. Finally, as Enron’s stock crashed to worthless levels, Enron’s employees saw their stock-only retirement programs wither away – while the Enron executives had already sold their stock before the crash and kept their profits. (48, p. 6) According to some, the company even encouraged its employees to hold on to their stocks, while the executives sold their own holdings. (100, pp. 353-353 & 366-367) All this occurred at the same time as California’s energy crisis. People saw the huge profits Enron was making in the energy market (despite Enron’s bankruptcy from other endeavors), and compared that with the soaring energy prices and frequent shortages that existed in California. That did not sit well with many. Moreover, Enron made statements to the effect that it had benefited from the Californian energy crisis, (63, p. 1) which did not endear it to the public, or to the utilities that had declared bankruptcy. So, the complaints and investigations began. The U.S. House and Senate held hearings about the impact of Enron’s collapse on such issues as the energy, investment, and financial markets. (31, pp. CRS-12 & 13; 46) The California Public Utilities Commission (CPUC) investigated state generators to see if they had withheld supply. (52, p. 2-3) And numerous entities called for FERC to investigate Enron’s role in the West’s energy market. FERC was a logical investigator to call upon, since it has a statutory obligation to ensure that the prices in jurisdictional wholesale energy markets in the U.S. are just and reasonable. (35, p. 1) FERC is an independent regulatory agency that administers laws and regulations related to: the sale of natural gas and oil by pipeline companies engaged in interstate commerce; interstate electric transmission rates and wholesale sales of electricity; licensing and inspection of non-federal hydroelectric power projects; and oversight of related environmental matters. (109) Moreover, FERC had already, in the summer of 2000, investigated the causes of the spring 2000 energy crisis in California.34 (4, p. 89) So, FERC was the logical intermediary to turn to. Who turned to FERC? Several utilities complained that the dysfunctions in the Californian spot markets had led to unjust and unreasonable long-term contracts in the bilateral markets of California, Nevada, and Washington, and requested that FERC modify those contracts. (19, p. V-2) California Senator Maria Cantwell requested that FERC investigate Enron’s trading activities in the forward and long-term firm power markets, especially as far as EOL was involved. (72, p. 1) Senator Barbara Boxer requested that FERC investigate Enron’s potential manipulation of prices in California’s newly deregulated market, as well as all long-term contracts between the state and electric generators. (74, p. 1) Senator Dianne Feinstein asked FERC to investigate how much of the gas trading market Enron controlled through EOL, and whether Enron’s share of the natural gas trading market distorted electric prices in California. (76, p. 1) 34 Although FERC concluded at the time that the power sellers had the potential to manipulate the energy market, it found no evidence of any individual company had actually engaged in such abuse at the time. (4, p. 89)
46
Mara Hemminger Page 47 10/22/2005
Senator Gordon Smith asked FERC to examine the relationship between Enron and its wholly-owned subsidiary, Portland General Electric (PGE), as well as whether Enron forced PGE to purchase excessive amounts of spot power, especially at manipulated, overly high prices. (73, p. 1) After FERC had begun its investigation, others chimed in. Governor Gray Davis requested that FERC broaden its investigation into any market manipulation by sellers and traders in California. (61, p. 2) Senator Feinstein asked FERC to investigate reports that California generators had not produced all their available power - thus inducing many of California’s blackouts (52, p. 2). Feinstein also wanted FERC to investigate the wash trading to which several companies had, by now, admitted (57, p. 1). Finally, Feinstein asked Attorney General John Ashcroft to conduct a criminal investigation into whether any federal fraud statutes or other laws had been violated. (13, p. 4. Also, (79) for the date of Feinstein’s request (May 6, 2002).) FERC therefore began a staff investigation, entitled the “Fact-Finding Investigation of Potential Manipulation of Electric and Natural Gas Prices,” on February 13, 2002, assigned it the docket number of PA02-2-000 on February 26.35 (71, p. 1) FERC was, moreover, charged with reporting its findings to Congress. (42, p. 3) FERC did publish an Initial, Interim, and final (Staff) Report.36 Much of this paper’s findings are based on the final (Staff) Report. It is worth noting that several other companies were also investigated for market manipulation. El Paso Corporation, Reliant Energy, Duke Energy, Dynegy, and others were accused of creating artificial shortages in 2001, which led to high energy prices. (6, p. 11) In the public’s mind, however, Enron stood out above the rest.
35 FERC assigns a docket number to all its investigations; the nomenclature depends upon the topic. “PA” refers to non-financial audits by the Chief Accountant into electric, natural gas, oil, hydro, and general energy matters. Many related investigations were assigned “ER” docket numbers; ER refers to investigation into electric rate filings. (111) 36 The Initial Report was published in August 2002. 19, p. II-9) The Interim Report was also published in August 2002. (4, p. 29) The Staff Report was published in March 2003. (19, p. 1)
47

Mara Hemminger Page 48 10/22/2005
PART II FERC’s Investigation of Enron
The first half of this paper set the stage, so that the reader can understand the underpinnings of FERC’s investigation of Enron after the Californian Energy Crisis of 2000/2001. Now, the second half of the paper will attempt to recreate FERC’s investigation, including the steps FERC went through in the process. Hopefully this will give the reader a feel for the iterative, multi-source nature of FERC’s information-seeking approach specifically, and of investigative information-seeking methods generally. The author will touch on general information-seeking models, to see how FERC’s investigation fits into these. First, however, some comments should be made about the author’s methodology when researching the FERC case.
Methodology Used in This Paper The purpose of this paper is to recreate the questions that FERC asked, and the answers it found, while conducting its investigation. Within this context, the PA02-2-000 investigation can be considered an extended information-seeking session. Therefore a brief synopsis of information-seeking models in general is appropriate. This synopsis will highlight the iterative nature of question-answering, as well as the need to search different data sources/repositories. These two aspects of information-seeking are definitely visible in the FERC case.
Information-Seeking Model Used The PA02-2-000 investigation can be viewed as an extended information-seeking session. The reader may or may not be familiar with this concept, and so a mental model may prove helpful. There are several models of information-seeking behavior in information studies literature. One of the earliest and most influential was developed by Robert Taylor in the 1960’s. According to Taylor, the information-seeking process progresses through four mental stages: a barely conscious awareness that one does not understand a situation or that one needs information (visceral need); a conscious mental description of that need (conscious need); a qualified and rational statement of that need (formalized need); and a reformulated statement that will better ensure an answer, given the data sources available (compromised need). (95, p. 68) There are also several different models of how people search for information once they have crafted their compromised need statements. Most models assume an iterative process. (98, pp. 116-129) In the world of electronically searchable data, for example, one might place an initial data query (the compromised need statement), review the documents that that query retrieves, reconsider one’s mental model of the situation based on those documents, and then change/rephrase/create a new query or information need accordingly. A simplified version of this general iterative process can be drawn as follows.
48

Mara Hemminger Page 49 10/22/2005
Figure 14: Information-Seeking Model I Source: (Adapted from 102, p. 7) One can add another dimension to this model: data source. People generally have more than one source of information to search. Choosing the most appropriate sources/creates another decision layer to the above model, as shown below:
Figure 15: Information-Seeking Model II Source: (102, p. 6)
49
Mara Hemminger Page 50 10/22/2005
These models fairly depict the information-seeking process that FERC appeared to follow when investigating Enron in PA02-2-000. Looking at the Taylor model, FERC’s process basically began with the conscious need. This is because Californians had already progressed from the visceral to the conscious need before even asking FERC to intervene. FERC then rephrased the Californians’ accusations in its own words, producing its own conscious need. In this paper, this new statement is referred to as FERC’s “information need.” Once FERC began the investigation, it issued several requests for data from Enron and other energy companies. These equate to Taylor’s formalized needs, and are referred to as FERC’s “data requests” in this paper. FERC’s data requests targeted specific sources, such as Enron’s transactional databases, email archives, telephone archives, internal documents, and more. This source-selection step mirrors the information-seeking model shown in Figure 15. The reader will see how FERC selected new sources as the investigation continued, as more facts came to light or as FERC hit dead ends in one source or another. For example, in IN3b, FERC appeared to abandon its search for wash trades in Enron’s transactional databases, and asked instead for corporate admissions of guilt/innocence. In the final information-seeking phase, FERC would have created a set of compromised need statements (search queries, essentially) that it could run against the selected data set. Recreating this step, however, proved to be an intractable problem, as FERC can share neither the queries it posed against the email dataset, nor the methodology it followed while doing so. This is because the 2002 investigation led to several cases, some of which are still underway. Per the deliberative process privilege, FERC cannot share this information, or any information that would reveal its reasons or methods for investigating this case, with outside parties. Even in their absence from the public eye, however, these compromised needs make their presence known. They leave ripple effects in the investigation’s procedure. For example, FERC started with essentially three information needs. These apparently devolved into sub-information needs over the course of the investigation, as more information surfaced. These sub-information needs are denoted with the suffix of –a, -b, etc. in this paper. For example, information need 1 (IN1) spawned the sub-need IN1a: once FERC had evidence that Enron (and others) had manipulated short-term energy prices (IN1), FERC wanted to know how prevalent the illicit trading practices were in the marketplace (IN1a). In another example, IN3 spawned sub-statements IN3a through IN3c, mirroring FERC’s realization of how many different ways the long-term market could be influenced. Similarly, FERC’s data requests sometimes evolved from general to specific. This is evident, for example, in information need 3b (IN3b). Here, FERC’s first two data requests (DR1 and DR2) yielded insufficient evidence to show that Enron had engaged in wash trades. Only the third data request (DR3) provided sufficient information to prove washing.
50
Mara Hemminger Page 51 10/22/2005
Despite FERC’s inability to disclose its compromised need statements, the author has made an educated guess about what types of questions FERC might have posed of one data source, namely the email dataset. This set of hypothesized questions37 is included in Appendices B and C, and will hopefully prove useful to subsequent email archive researchers. No attempt was made to repeat that process for the other data sources.
Data Presentation There are various ways of presenting this information. One could map information needs (IN) to data requests (DR) to results to conclusions. This would emphasize broad information needs and whether/how they were answered. This method unfortunately leads to some redundancy, however, as one data request often maps to more than one information need. Alternatively, one could map data requests to information needs and to conclusions. This would emphasize whether/how specific questions were answered, and it would also show the iterative nature of question-answering sessions. It would not, however, show whether/how the initial information needs were met. One could also work backwards, and map from conclusions to data requests and to information needs. However, this would be very hard to understand or explain. The author chose to map information needs (IN) to data requests (DR) to results to conclusions, in order to emphasize the question-answering aspect of the case. Since the information need provides the overarching framework for the data requests, it is logical to present the information need first.
Data Sources The author gleaned the information need/s from FERC’s initial, February 13, 2002 announcement of the investigation, as found on FERC’s PA02-2-000 webpage.38 The
37 Any answers that FERC found to its broader information needs (conscious needs) are included in the body of this paper, not in the Appendices. Interestingly, FERC cited only ten emails (that the author noted in FERC’s Staff Report) as evidence of Enron’s illicit activities. The author could actually locate only one of these emails in the publicly available datasets, namely on FERC’s website and Carnegie Mellon’s website. Outside of these ten emails, this paper makes no relevance judgments for its hypothesized questions. That is the subject of an ongoing research project at the University of Maryland. 38 This website has changed. The original website, http://www.ferc.gov/industries/electric/indus-act/wem/pa02-2.asp, conveniently listed what the author assumed to be all of FERC’s data requests in chronological order. Now the reader must manually locate these data requests via FERC’s eLibrary at http://elibrary.ferc.gov/idmws/search/fercgensearch.asp. (To do this, the reader should query for all “Issuances” (items that FERC sent to other entities) for the PA02-2 docket, 000 subdocket, for the appropriate time frame, in the eLibrary.) In reviewing the eLibrary Issuances, the author has noticed some data requests that were not shown on FERC’s original PA02-2-000 website. The few the author has noted appear to be only repeats of previous
51

Mara Hemminger Page 52 10/22/2005
author sometimes broke this need down further, either to simplify the explanation or to reflect the different answers that surfaced in response to that question. Presumably, FERC would also have divided its original information needs in this manner, as it learned more about the situation. Data requests were obtained from FERC’s letters to various companies, asking for information. The author downloaded these from FERC’s PA02-2-000 webpage.39 Replies to these requests were gleaned in various ways. Some were selectively obtained40 from FERC’s eLibrary.41 Others were deduced, based on what would logically be provided in response to a given data request. For example, a request for a data dump would likely result in just that- a data dump. Finally, the author gleaned FERC’s conclusions from FERC’s final (Staff) Report.
Caveat One caveat should be noted regarding the author’s methodology. Some data points are factual, and can be found on the FERC website. Others, however, are inferred. The mapping of information need to request to reply to conclusion is based on the author’s own inferences. To summarize, the “hard” (actual, non-interpreted) data points are:
• The data requests o These were lifted from FERC’s letters on FERC old PA02-2-000 website.
• Some of the data replies o These were the replies that the author obtained from the companies’ letters
in eLibrary.42 requests. However, the possibility remains that this paper has not accounted for all of FERC’s data requests, as the eLibrary may contain some letters that the original listing did not. 39 The author used a FERC webpage that no longer exists, http://www.ferc.gov/industries/electric/indus-act/wem/pa02-2.asp. Now these data requests must be queried from FERC’s eLibrary (http://www.ferc.gov/industries/electric/indus-act/wec/enron/info-release.asp#elibrary). Search for “issuances” (as a category) under docket number PA02-2, subdocket number 000. 40 The eLibrary space that is dedicated to PA02-2-000 contains numerous documents that are not related to companies’ data replies. Therefore, the author focused on documents from Enron (which were largely confidential and therefore blank) or from other companies that the author readily recognized as having played a role that would link them to Enron (such as the Bloomberg publishers). The author did not examine other marketing companies’ responses, so as to stay focused on the investigation of Enron, not of other marketers. 41 The web address is: http://elibrary.ferc.gov/idmws/search/fercgensearch.asp. Search on a date range (e.g. 2/01/2002-4/01/2003, to cover FERC’s initiation of the investigation, and the date of its Staff Report), category (submittals, to indicate that these are documents that outside entities sent FERC), docket number (PA02-2), and subdocket number (000). 42 The eLibrary appears to be somewhat quirky. The author has noticed that it sometimes delivers different results for the same query, when the query is issued at a different time, on a different
52

Mara Hemminger Page 53 10/22/2005
o These were mapped to their corresponding data requests based on the data request’s date. This was possible if a reply referenced the date of the data request that it answered.
• The conclusions o These were all gleaned or inferred from FERC’s Staff Report, and so are
(in and of themselves) true representations of the case. The inferred data points are:
• The information need o Although the statement is lifted verbatim from FERC’s announcement of
the investigation, the author has interpreted and parsed this statement into three separate information needs, IN1 through IN3. These are occasionally divided further, if the investigation appeared to develop subsequent/iterated information needs (IN1a, for example).
• Some of the data replies o These were any replies that the author inferred from FERC’s Staff Report.
Or o These were any replies that the author inferred, simply because they were
the logical reply to the given request. For example, a request for a data dump would likely generate a reply with exactly that -- a data dump.
• The answers o The author interpreted some answers from the companies’ data replies. o The author inferred other answers from FERC’s Staff Report.
• The mapping of information needs to data requests to conclusions o FERC did not categorize its data requests, nor its conclusions, by
“information need,” as this paper has sought to do. Hence, some interpolation was required on the author’s part to link her interpolated “information needs” to FERC’s reported conclusions.
• Any wording contained in double parentheses ((…)). This indicates information that the author’s references did not explicitly state, but which the author inferred, based on the overall market model and described situation. Examples are the specification of the PX versus the ISO market in the “Scheduling False Demand” section. Here, the reference (FERC’s Staff Report) often referred to the “California market,” without specifying which part of the market was meant. The author deduced the PX or ISO, based on the market situation of the time.
Explanation of the Chart The reader should now refer to the chart in Appendix A. This chart maps FERC’s information needs (INs) -> FERC’s data requests (DRs) -> various companies’ data replies to these requests -> answers/evidence that the author could glean from these replies, that appeared to address the original information need -> FERC’s overall
browser, etc. Therefore, it is possible that this paper has not accounted for all of Enron’s replies to FERC’s data requests, as it is unclear whether or not the author ever saw the full data set.
53

Mara Hemminger Page 54 10/22/2005
conclusions regarding that particular information need. An explanation of each field follows.
Information Need(s) FERC stated its original information need in its February 13, 2002 announcement of its investigation: “… to gather information on whether any entity, including any Enron Corporation (through any of its affiliates or subsidiaries) manipulated short-term prices for electric energy43 or natural gas in the West, or otherwise exercised undue influence over wholesale electric prices in the West since January 1, 2000, resulting in potentially unjust and unreasonable rates in long-term power sales contracts subsequently entered into by sellers in the West.” (35, p. 1) There are a few things worth noting here. First, the reader might ask why FERC chose to investigate both the electric and the gas markets, when gas is mostly used as one of the many fossil fuels that can be burned to create electricity. The reason is gas prices increased so much in California (more so than in the rest of the nation), that many suspected that the market had been manipulated. Moreover, since gas prices influence electricity prices, an increase in one necessarily results in an increase in the other. Hence some thought that the gas price hikes may have caused the electricity hikes, at least in part. (101) A second thing that catches one’s eye about this original information need is that it expresses an interest in “any entity” that could have manipulated prices – yet it only names Enron. This leads the author to believe that Enron was initially the primary, if not only, entity being investigated. FERC did eventually expand its investigation to include other energy marketers in the West, as the reader will see later. But the initial data requests targeted Enron specifically. A third point worth mentioning is that the information need covers all contracts “in the West.” The reader will recall that much of the pressure for FERC to start the investigation came from California, following that state’s energy crisis. Much of California’s energy, however, came from neighboring (Western) states, and so those energy contracts influenced California’s prices. This paper will focus on California rather than the entire Western United States as much as possible, because California was the area of impact. The author found FERC’s original information need to be too lengthy and multi-component to deal with, and so broke it down into three parts. These will subsequently be referred to as Information Needs 1 (IN1), 2 (IN2), and 3 (IN3). They are: IN1: “… to gather information on whether any entity, including any Enron Corporation (through any of its affiliates or subsidiaries) manipulated short-term prices for electric
43 FERC appears to use the terms power and electricity interchangeably in its Staff Report, such that they mean the same thing there.
54

Mara Hemminger Page 55 10/22/2005
energy or natural gas in the West…” Note: These “short-term prices” correspond with the spot prices of the PX and ISO. (101) IN2: “… to gather information on whether any entity, including any Enron Corporation (through any of its affiliates or subsidiaries) … otherwise exercised undue influence over wholesale electric prices in the West since January 1, 2000…” Note: This wholesale market includes both short-term and long-term sales – so it includes transactions conducted via the PX, ISO, EOL (forward market), and NYMEX (futures market). IN3: … to gather information on whether any entity’s, including any Enron Corporation’s (through any of its affiliates’ or subsidiaries’) performance of 1 or 2 above resulted “in potentially unjust and unreasonable rates in long-term power sales contracts subsequently entered into by sellers in the West.” Note: These “long-term prices” correspond with the energy “financial market,” which consisted of the futures and forward markets. (101)
Data Requests The data requests come from the questions that FERC posed in its letters to various companies, asking them for information related to the investigation. The author has numbered these based on the chronology of the FERC letters, rather than by the individual questions posed within those letters. By way of explanation: one letter could request several pieces of information. Rather than keep track of each individual question by assigning each question a one-up “data request” number, the author kept track of each letter by assigning the letters one-up numbers. To do this, the author first grouped the requests by topical area (i.e. information need), and then organized them in chronological order. For example, FERC’s letter of May 7, 2002 to the California ISO contained several questions. The author assigned to that letter the one-up number of “data request 5” (DR5), and listed the individual questions that were relevant to that particular information need underneath DR5. (See Appendix A for a list of the data requests by number and by date.) The reader will further notice that an entire FERC letter (data request) could be construed to apply to more than one information need. When this was the case, the author simply listed the data request under each applicable information need, and left the data request’s DR number intact. Similarly, one question in a FERC letter (data request) might apply to one information need, whereas a different question in that same letter (data request) might apply to another information need. When this was the case, the author re-listed the appropriate data request (and its DR number) under to the appropriate information needs, but showed only the relevant question. For instance, the reader will notice that DR7 appears four times in Appendix A, yet three of these occurrences list a different question. This is because DR7 (FERC’s letter of May 8, 2002, to all wholesale and ancillary service sellers) asks several different questions, some of which apply to information need IN1a, some to IN2, and some to IN3.
55

Mara Hemminger Page 56 10/22/2005
Data Replies Data Replies are the answers that the various companies provided to FERC, in response to FERC’s data requests. These replies took various forms, such as affidavits claiming innocence / guilt for conducting a certain activity, data dumps from databases, email archives, or summaries that the companies themselves compiled of their sales/purchases history. The reader will notice that many data-reply fields on the chart in Appendix A are blank. This is due to several reasons. For one, many of Enron’s responses were confidential, and so either no reply, or only the coversheet to the reply, could be found in FERC’s eLibrary. For another, many of FERC’s data requests were addressed to all energy sellers in the West – but the author did not generally examine replies from companies other than Enron, so as to remain focused on Enron. Thirdly, the author cannot be sure she truly saw all replies, as FERC’s eLibrary occasionally yielded different results when the author ran queries on different days or through different Web browsers.
Evidence Relevant to IN(x) (Answers) This column lists answers that were contained in the companies’ data replies, that the author thought were relevant to the original information need. These answers were obtained in one of two ways. First, the author may have gleaned them from the data replies themselves, if she had full (non-confidential) access to and read those replies. Second, the author may have deduced the answers from FERC’s final (Staff) Report. The reader can tell which method was used by referring to the answer’s source: references to individual data replies indicate that the first method was used; references to FERC’s Staff Report indicate that the second method was used. Many of the fields under this column are blank. This is due to the same reasons listed under Data Replies (above). Additionally, the author might not have seen FERC draw a conclusion (in its Staff Report) that correlated to a particular data request or reply. In this case, the author could not infer or reverse-engineer an answer from that conclusion to an individual data reply.
Conclusions This column contains conclusions that FERC drew about the original information needs. The author lifted these conclusions from FERC’s final (Staff) Report.
56

Mara Hemminger Page 57 10/22/2005
The Nitty-Gritty What follows is a verbal explanation of what the chart in Appendix A contains. It will be helpful if the reader can refer occasionally to Figures 9, 12, and 13, to more fully understand how and which part of the energy market Enron manipulated.
Information Need 1 (IN1) Recall that IN1 is FERC’s need “… to gather information on whether any entity, including any Enron Corporation (through any of its affiliates or subsidiaries) manipulated short-term prices for electric energy or natural gas in the West…” (35, p. 1) Also recall that these “short-term prices” correspond with the spot prices of the PX and ISO (101) and to the physical market in Figure 9. There appear to be four data requests that directly apply to IN1. These follow.
Data Request 1 (DR1) On February 15, 2002, FERC sent Enron DR1, asking for wholesale and retail electricity sales/purchases, to include ancillary services,44 on which Enron had defaulted. (37) Since retail prices and ancillary services can be considered short-term sales, at least that aspect of DR1 fits into IN1. DR1 was FERC’s first data request in the investigation, so it would be easy to assume that FERC was just casting a wide net for information, to see what it could find. It is interesting, however, that FERC specifically asked for those contracts which Enron had not fulfilled. From this, the author infers that FERC was looking for evidence that Enron had engaged in phantom trades which might have caused higher short-term prices. Examples would be the fake provision of ancillary services or schemes to collect congestion payments,45 both of which involve an initial agreement to provide energy, but a subsequent failure to actually deliver said energy. Enron replied to this request by providing various hard-copy and PDF copies of these contracts, which are not publicly available. Since Enron had to sift through numerous (well over 100,000) contracts to do this, Enron indicated its need to answer this request in stages. Enron’s initial reply covered recent contracts that had been entered into by Enron subsidiaries Enron Power Marketing, Inc, (EPMI), Enron Energy Services (EES), and Enron Energy Marketing Corp. (EEMC), but that had subsequently been terminated due to Enron’s failing financial condition. (67) The author did not see later replies to this
44 See the section on Fake Sale of Ancillary Services for an explanation of ancillary services. 45 See the Fake Sale of Ancillary Services and Congestion Payments sections for explanations of these schemes.
57

Mara Hemminger Page 58 10/22/2005
request, and so cannot judge whether they contained information indicating phantom ancillary sales or congestion payments. Conclusion: The author also did not see FERC draw any conclusions (in its Staff Report) based on this data set.
FERC’s Data Request 2 (DR2) This data request was levied against “all jurisdictional sellers and all non-jurisdictional sellers with wholesale sales”46 in the West. DR2 contained several questions, but the one that seems applicable to IN1 was the request that the sellers indicate whether or not a given sale “went physical.” This is another way of asking whether or not the energy that was promised was actually delivered. Again, the author interprets this as a way for FERC to find out if Enron (or others) engaged in phantom trades such as the fake sale of congestion services or ancillary services. Conclusion: The author did not see Enron’s reply to this request, and so cannot infer the answer. The author also did not see FERC draw any conclusions that might have been based on this particular data request.
FERC’s Data Request 3 (DR3) On March 15, 2002, FERC sent Enron a subpoena duces tecum,47 asking for unspecified information about Enron’s physical and financial transactions,48 EOL, and other information “controlled by Enron Corp. and its affiliates and subsidiaries.” (39) For simplicity, the author has broken down Enron’s replies and FERC’s conclusions by industry – namely by electricity vs. gas.
Gas FERC also analyzed short-term gas prices using the EOL data it had gathered from DR3. Here, FERC noticed that at least one company, Reliant, used EOL to “churn.” Churning is the trading practice whereby one company buys and sells large volumes of short-term gas very quickly, with that company often being the sole buyer or the sole seller. This 46 This data request was directed towards “energy” sellers. It did not specify whether gas or electric sellers were meant. 47 A subpoena duces tecum is a court order requiring a witness to bring documents, that are in the possession or under the control of the witness, to a certain place at a certain time. It must be served personally to the person subpoenaed. It is a common way to obtain potentially useful evidence, such as documents and business records that is in the possession of a third party. Failure to respond may result in punishment for contempt of court for disobeying a court order. (110) 48 Again, FERC did not specify whether it meant gas or electricity transactions, or both.
58

Mara Hemminger Page 59 10/22/2005
results in the company’s gross trading volume exceeding its net trading volume. (19, p. II-3) FERC found only one Reliant trader and two Enron traders who actively engaged in churning (19, p. II-32), and this was always concentrated at the Topock gas hub in Southern California (19, p. II-3). Due to an average-price weighting agreement with EOL,49 Reliant had a financial incentive to churn. (19, p. II-6-7, p. II-59) This activity did, however, cause short-term gas prices to rise. (19, p. II-8-9) It is unclear to the author whether Enron realized any financial gain from Reliant’s churning, even though Enron (as EOL) would have been the counterparty to all these trades. This point, then, is mentioned only to show that FERC found some manipulation of gas prices (not just the electric prices mentioned earlier) even though Enron may not have been the manipulator in this case. FERC did also note that California’s gas price increases were due partly to an increased demand during the time, and to the limited transportation and storage capacities in southern California. (19, p. I-1-6) So churning was not considered to be the sole reason for California’s high gas prices.
Electricity The author believes, based on the timing of this and other data requests/replies, that Enron replied to DR3 on or before May 6, 200250 by providing, at the least, its infamous three (sic51) internal memoranda about the trading practices of Enron subsidiary EPMI. Enron subsequently put these memos up on its website. The genesis of these memos is worth mentioning. Once the energy crisis of 2000 had hit, Enron (headquarters) had commissioned several outside lawyers to examine the trading practices used at Enron’s trading arm EPMI. (43, p. 2) Enron may have done this in preparation for FERC’s 2000 investigation of the company (4, p. 89, for the “fact of” the 2000 investigation). The memoranda that Enron provided FERC represented two such research papers. Two of the released memos were apparently duplicates; these were dated December 6 and 8, 2000, and were co-written by Enron and the Stoel Rives law firm. The third memo (undated) was written by a different law firm, Brobeck. The third report reiterated the findings of the first two papers, and so is not often cited in this paper. These memoranda exploded FERC’s investigation. They outlined several questionable practices that EPMI had used to manipulate the Californian physical electricity market for Enron’s gain (3), and they also indicated that other marketers had cooperated and/or
49 The author refers the reader to 19, Chapter II for further details about this arrangement, which was known as the netting agreement. 50 FERC received these memos on May 6, 2002, and put them up on its website within a matter of hours. (19, p. VI-2) So Enron must have submitted the memos to FERC shortly before then. 51 The FERC website shows three memos; however, there appear to actually be only two memos. Two memos are duplicates of each other, with the same contents and originators, although slightly different dates (December 6 and 8, 2000). These December memo/s were co-written by Enron and the Stoel Rives law firm. The “third” memo (undated) was written by a different law firm, Brobeck, and has different contents. Its findings largely overlap with that of the December memo/s, however, and so it is not often cited in this paper.
59
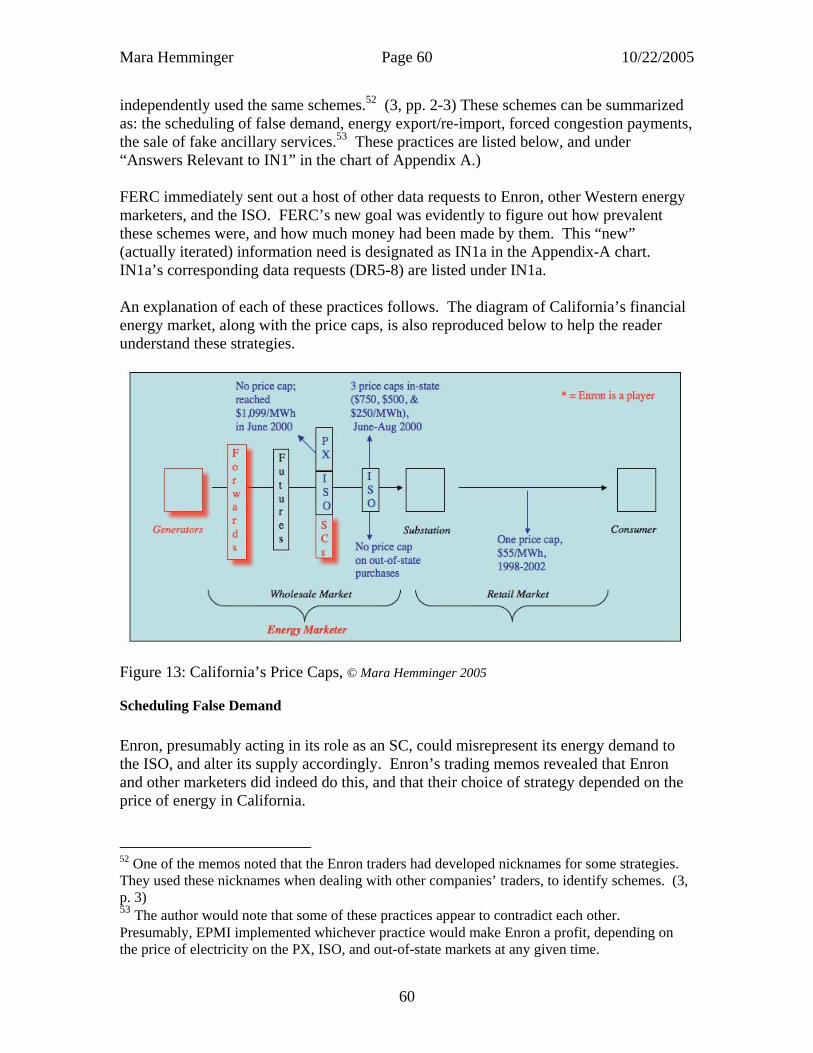
Mara Hemminger Page 60 10/22/2005
independently used the same schemes.52 (3, pp. 2-3) These schemes can be summarized as: the scheduling of false demand, energy export/re-import, forced congestion payments, the sale of fake ancillary services.53 These practices are listed below, and under “Answers Relevant to IN1” in the chart of Appendix A.) FERC immediately sent out a host of other data requests to Enron, other Western energy marketers, and the ISO. FERC’s new goal was evidently to figure out how prevalent these schemes were, and how much money had been made by them. This “new” (actually iterated) information need is designated as IN1a in the Appendix-A chart. IN1a’s corresponding data requests (DR5-8) are listed under IN1a. An explanation of each of these practices follows. The diagram of California’s financial energy market, along with the price caps, is also reproduced below to help the reader understand these strategies.
Figure 13: California’s Price Caps, © Mara Hemminger 2005
Scheduling False Demand Enron, presumably acting in its role as an SC, could misrepresent its energy demand to the ISO, and alter its supply accordingly. Enron’s trading memos revealed that Enron and other marketers did indeed do this, and that their choice of strategy depended on the price of energy in California.
52 One of the memos noted that the Enron traders had developed nicknames for some strategies. They used these nicknames when dealing with other companies’ traders, to identify schemes. (3, p. 3) 53 The author would note that some of these practices appear to contradict each other. Presumably, EPMI implemented whichever practice would make Enron a profit, depending on the price of electricity on the PX, ISO, and out-of-state markets at any given time.
60

Mara Hemminger Page 61 10/22/2005
Inc’ing / Fat Boy One strategy for scheduling false demand was called “Inc’ing” or “Fat Boy.” Here, if the California energy price ((on the PX market)) were high, Enron would schedule and sell more energy there than was needed. This practice was even outlined in the Enron Services Handbook. (19, p. VI-40) This was a tricky game, because Enron (as an SC) needed to submit a balanced schedule to the ISO. So Enron could overschedule supply only if it also overstated demand (load). (14, p. 20) However, Enron had an ace up its sleeve. It knew that most of the independently-owned utilities (IOUs) – which had to buy their needed energy on the PX market - would underestimate the demand in their day-ahead schedules, if the PX price were above the ISO price that day. (19, p, VI-21) Then the IOU’s would simply wait and buy their needed energy the next day on the ISO real-time market, at the expected lower price. (19, p. VI-21) Thus, the IOUs’ underscheduling offset Enron’s overscheduling. It should be noted that the PX-ISO price differential evidently changed over time. Per simple economic theory, increased demand leads to increased price. So the IOUs’ strategy had the (perhaps unintended) effect of increasing demand on the ISO market and decreasing demand on the PX market. This eventually drove the ISO price up higher than the PX price. (19, p. VI-22&23) This trend apparently reversed itself again, when the ISO set price caps on the ISO market during the summer of 2000. The lowest ISO price cap that summer was $250/MWh in August 2000;54 the PX price, on the other hand, had skyrocketed to $1,099/MWh on June 28, 2000. (78, p. 1) In any case, Enron and other energy marketers55 were aware of the IOUs’ underscheduling scheme, and had built that into their marketing models. (3, p. 2; 43, p. 2) Enron would then pay attention to the market, and artificially overstate its schedule’s demand/supply if the California ((PX)) prices were high. (19, p. VI-40) They wagered their artificial load would get used in the end: when market needs hit real-time, the ISO would realize that it needed more supply than it had scheduled (due to the IOU’s understated demand), and Enron would then have the opportunity to sell its overstated supply. (19, p. VI-20-24) In doing so, Enron would receive a higher price (an “inc” price) for this energy, because the ISO would have asked for it at the last minute. (3, p. 1-3) (Of course, this higher price still had to be below the ISO price cap during the summer of 2000, unless the energy came from out-of-state. See Export/Re-import for an explanation of that strategy.) Conclusion: FERC decided that Fat Boy involved 1) the deliberate submission of false information, and 2) violated the state’s energy market regulations’ (the MMIP’s) anti-gaming provision by taking unfair advantage of the ISO’s rules and making that market 54 The first cap was at $750/MWh in June; the second cap was at $500/MWh in July; the third cap was at $250/MWh in August. (78, p. 1) 55 Enron specifically stated in one of its memos that other companies also overstated demand (inc), and that Enron itself had inc’ed for other companies while acting as their SC. (3, p. 2) Enron named two companies, with no native Californian load, for whom it had inc’ed: Powerex and Puget Sound Energy (PSE). (3, p. 2)
61

Mara Hemminger Page 62 10/22/2005
inefficient. (19, p. VI-24) The MMIP will be explained later, under “FERC’s General Conclusions about DR3’s Replies: Electricity.”
Dec’ing / Thin Man This strategy was the reverse of Fat Boy. Here, Enron SC would understate load on the schedule it submitted to the ISO. (19, p. VI-40) According to the Enron Services Handbook, Enron SC would use this strategy when California ((PX)) prices were low. (9, p. VI-40) Generally, Thin Man was used as a way to understate California demand, so the SC could sell the excess supply outside of the state, for a higher price. (19, p. VI-16) Conclusion: FERC made no specific statement about Thin Man in its Staff Report. However, FERC found the IOUs to be guilty of violating the ISO and PX MMIPs when the IOUs submitted understated demand information to the ISO. This was considered gaming the market. (19, p. VI-25) Surely the same argument would apply to Enron marketers engaging in Thin Man.
Export/Re-import Strategies
Energy Export Under this strategy, Enron would sell electricity to entities outside of California for a higher price than it could sell the electricity to entities inside California. This worked as follows. First, Enron (presumably in its role as an SC) would understate the expected demand/load for power in the PX day-ahead market if the California (PX) price were lower than the price being paid in out-of-state markets. (This was the Thin Man strategy mentioned earlier.) (9, p. VI-40) Then Enron would export a corresponding amount of energy outside of the state for a higher price. (19, p. VI-15&160) (The reader will remember that California had price caps on its PX and ISO markets, but other states did not. Therefore California energy marketers and generators could make money by avoiding the PX and ISO, and selling their energy outside of the state.) The difference in these two prices could be as much as $250/MWh on the PX vs. $1200/MWh on an outside market.56 (3, p.3) Conclusion: FERC likely had a hard time drawing a conclusion about this. Legally, neither FERC, the PX, nor the ISO forbade Californian energy companies from exporting energy out-of-state. (19, p. VI-15) However, FERC held that energy export, along with all the other activities outlined in the 2000 Enron memoranda, violated the MMIP by creating anomalous market behavior and by gaming the market. (19, p. VI-12)
56 The particular outside market used in this example was known as “Mid-C.” (3, p. 3)
62

Mara Hemminger Page 63 10/22/2005
Energy Re-import: Ricochet / Megawatt Laundering Ricochet (aka Megawatt Laundering) operated very similarly to the above energy-export practice. Here, company A would buy energy on the PX day-ahead market. Then it would sell (export) that energy to company B for a fee. Then, if the ISO needed extra power in the real-time market, company B would sell that energy to the ISO, hopefully for a profit. Note that this involves some risk-taking, as the PX price is not guaranteed to be lower than the ISO price. (19, pp. VI-17&18) However, if company B were located outside of California, then money could almost certainly be made, as out-of-state prices were not capped in the ISO market. (13, p. 3) This presumably required coordination and profit-sharing arrangements between companies A and B. Conclusion: FERC held that energy re-import, along with all the other activities outlined in the 2000 Enron memoranda, violated the MMIP by creating anomalous market behavior and by gaming the market. (19, p. VI-12) The author would argue that this also clearly increased the short-term price of energy on the wholesale market.
Forced Congestion Payments The reader will recall that the ISO was responsible for checking its SCs’ schedules to make sure they did not overload any transmission lines. (95) However, this procedure did not always work, as transmission lines sometimes did end up being “congested,” or having too much energy passed over them in real-time.57 When that happened, the ISO would pay a “congestion payment” to the transmitting company/companies to either stop sending the energy, or to send it in the opposite direction (a.k.a. schedule a counterflow). (13, p. 3) This was a tidy sum of money (e.g. $750/MWh), so that it was sometimes profitable to get this congestion payment even it meant selling power at a loss. (3, p. 3) There were many different ways to make money from congestion payments, as will be outlined shortly. Conclusion: FERC found that all of the congestion schemes outlined in Enron’s memos violated the MMIP by creating anomalous market behavior and by gaming the market. (19, p. VI-30)
Scheduling Energy to Collect Congestion Charge II (CCC-II)
57 It may seem strange that the ISO would not recognize that an SC had submitted a schedule which placed more electricity on a transmission line than that line could handle. However, according to one energy company (Powerex), the ISO’s congestion management software had a flaw that prevented it from recognizing that a tie was out of service. (19, p. VI-27) The larger transmission lines with major congestion during California’s energy crisis (2000) were Path 66, Path 15, Path 26, and Path 42. (7, p. 12) See the section on California’s Electricity Industry for more information about California’s transmission paths.
63

Mara Hemminger Page 64 10/22/2005
This refers to Enron’s strategy of scheduling a counterflow for energy that it did not actually have available. The ISO would then notice that no energy had actually been passed, and would charge Enron for the amount of energy it had promised (as a counterflow) but not delivered. However, there was a loophole: the ISO would still pay Enron a congestion payment for having agreed to provide the counterflow to start with. This scam was profitable if the congestion payment were sufficiently higher than whatever the ISO charged for non-delivery (20, p. 6). Some equate that non-delivery charge to the ((ISO’s)) price cap. (3, p. 7) So, if the ISO price cap were $250/MWh, and the congestion payment were $750/MWh, Enron could earn $500/MWh by using this scheme. Conclusion: FERC issued no specific opinion about the Collect Congestion Charge II scheme (CCC-II). Perhaps FERC lumped CCC-II together with all the congestion schemes listed in the 2000 Enron memos, all of which FERC found to be in violation of the MMIP. (19, p. VI-30) Or perhaps FERC lumped the CCC-II under the Forced Congestion Payment or Death Star practices, both of which resemble CCC-II. In either case, CCC-II would likely violate the same MMIP rules as those specific practices.
Death Star In Death Star, Enron would schedule a counterflow transmission to get congestion payments, but then never send the energy. For example, Enron would schedule a counterflow to an out-of-state location. Enron would then purchase that same energy back from the other location, but route it back home via an out-of-state or some other non-ISO-controlled transmission line. This rerouting prevented the ISO from realizing what was going on. In actuality, all that energy was merely scheduled, never sent. So Enron collected the congestion payment, but never physically moved any energy. (3, p. 4) Clearly, Enron could not do this alone; it needed the participation of other entities, especially those that owned non-ISO lines. (19, p. VI-27) One such indication of others’ participation was an email sent to Enron’s Portland shift. This discusses a congestion relief scheme known as “red congo,” wherein Enron, the city of Redding (in California), and Pacificorp West worked together to move energy along North-South lines, and along Redding’s non-ISO transmission lines.58 Conclusion: As with the other congestion schemes, FERC found that this practice violated the MMIP by creating anomalous market behavior and by gaming the market.
Load Shift
58 The Staff Report provided no date for this email.
64

Mara Hemminger Page 65 10/22/2005
Here, Enron would start with a balanced schedule for a transmission line – typically a line to which it had primary transmission usage rights, or Firm Transition Rights. Before submitting this schedule to the ISO for the day-ahead market, Enron would rearrange it so that the load was overstated in one direction/flow (e.g. North-South), and understated in another (e.g. South-North). The schedule would still be balanced, just not accurate. Then, when it came time to actually transmit that energy in the real-time (ISO) market, the ISO would realize that the line was congested in one direction, and would pay Enron the congestion fee either not to send it or to counterflow it. Ironically, Load Shift did not actually work too well for Enron. This is because the three major IOUs tended to underschedule load in their ISO schedules - thus nullifying Enron’s strategy of overstating load in its schedules. (19, p. VI-14) Conclusion: FERC found Load Shift to be in violation of the MMIP for gaming the market. Enron took unfair advantage of the ISO tariffs, to the detriment of the efficiency of the ISO / PX markets. It furthermore took undue advantage of transmission constraints during great congestion. (19, p. VI-15) The author would posit that Load Shift also served to increase the short-term wholesale energy prices that FERC was investigating in IN1, as someone must bear the cost of all the added fees and payments. In describing Load Shift in Enron’s December 8, 2000 memo, the researcher even admits: “Our concern here is that, by knowingly increasing the congestion costs, Enron is effectively increasing the costs to all market participants in the real-time market.” (3, p. 5)
Wheel Out In a wheel-out, Enron would schedule energy transmission over an intertie59 that was “completely constrained” (i.e. had zero capacity) or was out of service. If the ISO did not catch this poor scheduling in advance, it would pay Enron a congestion payment in real-time not to transmit energy over that intertie. So, once again, Enron would be paid not to send energy. (19, p. VI-26) FERC also found evidence of this activity in at least one email. This will be discussed under DR7. Conclusion: Staff found Wheel Out, along with the other congestion practices, to violate the MMIP by creating anomalous market behavior and by gaming the market.
59 By examining various online energy dictionaries and FERC’s website, the author believes that an intertie is the same thing as an interconnection. If this is true, then an intertie is a connection point between two transmission systems, between two systems that serve different geographic areas (such as California and the Pacific Northwest), or between two energy supply chains. They might be located where a generating facility meets transmission facilities, where high-voltage energy transmission corridors cross, or where a utility's distribution facilities connect with the transmission grid. (114)
65

Mara Hemminger Page 66 10/22/2005
Ancillary Services Ancillary services, according to FERC, is a series of services that are “necessary to support the transmission of energy from generation sources to the consumers and to maintain reliable operations of the transmission system.” (82, p. 2) The purpose is to cover those instances when the actual energy conditions do not correspond to the expected conditions. (82, pp. 2-3) This primarily equates to the holding of reserve energy resources which can be booted up anywhere from immediately to within an hour; however, it can also include the resources needed to maintain a certain voltage level on a transmission system. (82, p. 3) It is worth noting that ancillary energy reserves are provided by the same generators as the regular electricity supply. However, since electricity cannot be stored efficiently, ancillary services provide the reliability guarantee that is necessary for an energy market to work. (82, p. 1) In California, the ISO60 specifies which entity will provide which ancillary services, and when. (82, p. 4) This reserve energy is also referred to as “firm energy.” (83, p. 2) The ancillary-service schemes that Enron used were known as “Get Shorty” and “selling non-firm energy as firm energy.”
Get Shorty Here, Enron traders would sell to the ISO ancillary services at a relatively high price in the day-ahead market. Then they would cancel that in the real-time market, and purchase the energy from another company, at a lower price, in the real-time market. (3, p. 6) In and of itself, this was a legal activity, per the MMIP. (19, p. VI-31) However, Enron traders would also do this when they did not have the ancillary services covered (on standby) to start with. This means that they lied about possessing the ancillary services when they sold them to the ISO in the day-ahead market. (19, p. VI-31) In fact, one of Enron’s internal memos basically admitted that Enron was purposefully lying in order to get the ancillary payments: “The ISO tariff requires that schedules and bids for ancillary services identify the specific generating unit or system unit … As a consequence, in order to short61 the ancillary services, it is necessary to submit false information that purports to identify the source of the ancillary services.” (3, p. 6) FERC found further evidence of this practice in several Enron emails. These are discussed under IN1a, DR7 and DR8.
60 The source of this information actually referred to this entity as the TSO/transmission system operator. (82) However, the TSO appears to be an umbrella term that contains/includes the concept of the Californian ISO. This deduction is based on the source’s description of a TSO’s duties, which look identical to the Californian ISO’s duties. 61 There appear to be several possible meanings for “short” here. The most likely definition is a “promise to sell a certain quantity of a good at a particular price in the future.” (135) Alternative but less likely meanings are: to buy a commodity at a low price, with the expectation that one can sell it later at a higher price (101), or to post more sales than purchases. (19, p. VIII-4)
66

Mara Hemminger Page 67 10/22/2005
Conclusion: FERC found this practice to be unethical, because it involved lying to the ISO about having ancillary services to sell. (19, p. VI-31) FERC also found this to violate the MMIP’s anti-gaming rules. (19, p. VI-34)
Selling Non-Firm Energy as Firm Energy Here, Enron would sell non-firm (non-reserve) energy, but claim that it was firm. So, the ISO would rely on it as firm energy, whereas it was not actually firm. It is worth noting that Enron implicated other companies in this activity, stating in one of its memos that: “Everyone does this.” (3, p. 7) Conclusion: FERC found that this practice, along with all the other practiced outlined in Enron’s memos, violated the MMIP’s anomalous market behavior and anti-gaming provisions. (19, p. VI-12)
FERC’s General Conclusions about DR3’s Replies: Electricity FERC found that all the activities listed in the 2000 memos violated the Californian ISO and PX market regulations known as the Market Monitoring and Information Protocol (MMIP62). (The ISO and PX MMIPs are very similar, and will henceforth be jointly referred to as the MMIP.) The MMIP’s work plan dictates how the ISO/PX should monitor their markets in order to prevent any abuses of power by participating entities, and any actions that would undermine the ISO/PX’s efficient functioning. (19, p. VI-6) The MMIP outlined two specific “practices subject to scrutiny” that were applicable to the practices outlined in the Enron memos. First, there was “gaming,” which was taking unfair advantage of 1) the rules and procedures set forth in the ISO/PX Tariffs, or 2) the constraints of transmission lines during periods of substantial congestion. Gaming may include taking advantage of other conditions that might affect the availability of transmission and generation capacity. This included such things as loop flow, facility outages, hydropower output level, seasonal limits on out-of-state energy imports, or any other action that would make the markets susceptible to price manipulation or inefficient operation. (33, pp. 37-38) Second, there was “anomalous market behavior,” which was behavior that either 1) deviated significantly from what would exist in a competitive market, or 2) led to unusual or unexplained market outcomes. (19, pp. VI-7-8) Examples would be withholding generation capacity, unexplained or unusual redeclarations of generator availability, unusual trades, pricing and availability patterns that are inconsistent with actual supply and demand, and unusual imports or exports to other markets or exchanges. (33, p. 38) The ISO/PX could impose sanctions or penalties on any entity that violated the MMIP, and/or refer that entity to FERC for misconduct. (19, p. VI-9) FERC could then enforce
62 Acronym expansion is from source (80).
67

Mara Hemminger Page 68 10/22/2005
the “tariff”63 (19, p. VI-9), ask the accused party to remit unjust profits to its customers (19, p. VI-10), and/or revoke the guilty party’s market-based rate authorization and blanket certificate authority (19, pp. VI-43-44).64 FERC found that all the activities listed in the 2000 memos violated the MMIP, in that they indicated both anomalous market behavior and gaming of the energy market. (19, p. VI-12) Staff also found that other marketers were either guilty of using some of the same schemes, or at least of being aware of Enron’s activities.
FERC’s Data Request 4 (DR4) On April 29, 2002, FERC asked Enron to provide a full export of the following trading, transaction, and risk-management databases: Enpower, Sitara, Enron Risk Management System (ERMS), CPR, Unify, and RiskTrac. The author is unsure if or how this data was used in the investigation. They are listed here solely for the purposes chronological purity and topical completeness.
FERC’s Information Need 1a (IN1a) Once the Enron memos surfaced, FERC issued a number of new data requests in quick succession. Most of these seemed to revolve around an unspoken need to assess how prevalent these trading practices (that had been outlined in the Enron memos) were.
FERC’s Data Requests 5 and 6 (DR5 and DR6) On May 7 and May 21, 2002, FERC asked the California ISO for several pieces of information related to the Enron memos. The author has organized these data points in terms of the strategies outlined in those memos.
• Forced Congestion Payments o FERC asked the ISO to identify the ten SCs that had received the most
congestion revenues for 2000/2001, and to show each of those SCs’ monthly congestion revenues. This was clearly an attempt to judge which companies were the most likely to have used the forced congestion payment scheme. (21)
o FERC asked the ISO for SC-level and tie-level congestion revenues/charges and flows. (25)
63 The tariff sounds like the market rules, or MMIP. 64 It is unclear what revoking these authorizations means, exactly. It sounds like the PX/ISO might have had the right to expel the guilty party from their markets. Since the ISO and PX were the only energy spot markets in California (101), that threat would have some weight.
68
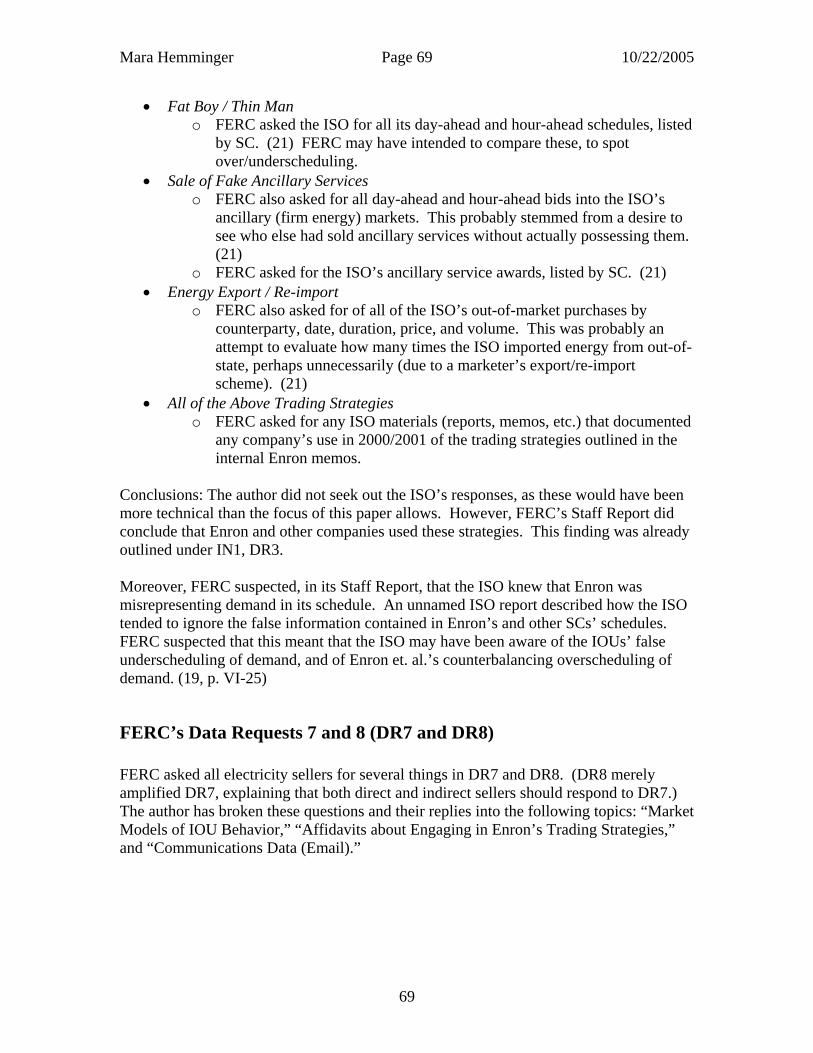
Mara Hemminger Page 69 10/22/2005
• Fat Boy / Thin Man o FERC asked the ISO for all its day-ahead and hour-ahead schedules, listed
by SC. (21) FERC may have intended to compare these, to spot over/underscheduling.
• Sale of Fake Ancillary Services o FERC also asked for all day-ahead and hour-ahead bids into the ISO’s
ancillary (firm energy) markets. This probably stemmed from a desire to see who else had sold ancillary services without actually possessing them. (21)
o FERC asked for the ISO’s ancillary service awards, listed by SC. (21) • Energy Export / Re-import
o FERC also asked for of all of the ISO’s out-of-market purchases by counterparty, date, duration, price, and volume. This was probably an attempt to evaluate how many times the ISO imported energy from out-of-state, perhaps unnecessarily (due to a marketer’s export/re-import scheme). (21)
• All of the Above Trading Strategies o FERC asked for any ISO materials (reports, memos, etc.) that documented
any company’s use in 2000/2001 of the trading strategies outlined in the internal Enron memos.
Conclusions: The author did not seek out the ISO’s responses, as these would have been more technical than the focus of this paper allows. However, FERC’s Staff Report did conclude that Enron and other companies used these strategies. This finding was already outlined under IN1, DR3. Moreover, FERC suspected, in its Staff Report, that the ISO knew that Enron was misrepresenting demand in its schedule. An unnamed ISO report described how the ISO tended to ignore the false information contained in Enron’s and other SCs’ schedules. FERC suspected that this meant that the ISO may have been aware of the IOUs’ false underscheduling of demand, and of Enron et. al.’s counterbalancing overscheduling of demand. (19, p. VI-25)
FERC’s Data Requests 7 and 8 (DR7 and DR8) FERC asked all electricity sellers for several things in DR7 and DR8. (DR8 merely amplified DR7, explaining that both direct and indirect sellers should respond to DR7.) The author has broken these questions and their replies into the following topics: “Market Models of IOU Behavior,” “Affidavits about Engaging in Enron’s Trading Strategies,” and “Communications Data (Email).”
69
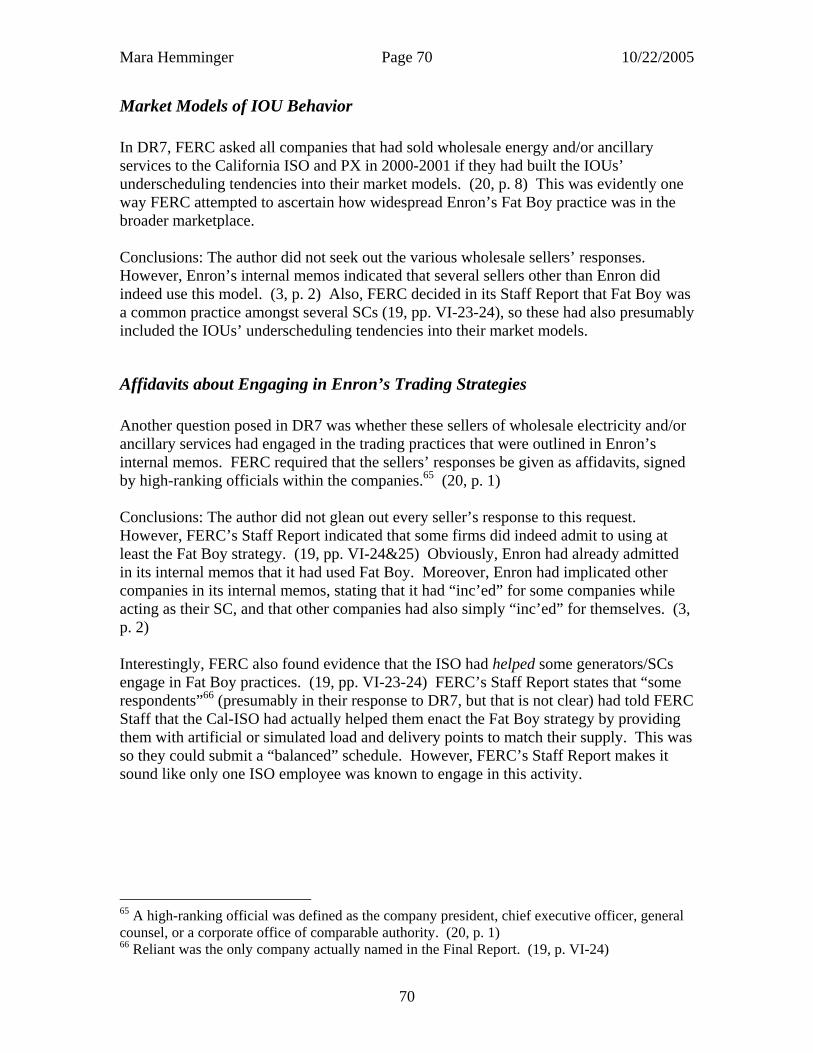
Mara Hemminger Page 70 10/22/2005
Market Models of IOU Behavior In DR7, FERC asked all companies that had sold wholesale energy and/or ancillary services to the California ISO and PX in 2000-2001 if they had built the IOUs’ underscheduling tendencies into their market models. (20, p. 8) This was evidently one way FERC attempted to ascertain how widespread Enron’s Fat Boy practice was in the broader marketplace. Conclusions: The author did not seek out the various wholesale sellers’ responses. However, Enron’s internal memos indicated that several sellers other than Enron did indeed use this model. (3, p. 2) Also, FERC decided in its Staff Report that Fat Boy was a common practice amongst several SCs (19, pp. VI-23-24), so these had also presumably included the IOUs’ underscheduling tendencies into their market models.
Affidavits about Engaging in Enron’s Trading Strategies Another question posed in DR7 was whether these sellers of wholesale electricity and/or ancillary services had engaged in the trading practices that were outlined in Enron’s internal memos. FERC required that the sellers’ responses be given as affidavits, signed by high-ranking officials within the companies.65 (20, p. 1) Conclusions: The author did not glean out every seller’s response to this request. However, FERC’s Staff Report indicated that some firms did indeed admit to using at least the Fat Boy strategy. (19, pp. VI-24&25) Obviously, Enron had already admitted in its internal memos that it had used Fat Boy. Moreover, Enron had implicated other companies in its internal memos, stating that it had “inc’ed” for some companies while acting as their SC, and that other companies had also simply “inc’ed” for themselves. (3, p. 2) Interestingly, FERC also found evidence that the ISO had helped some generators/SCs engage in Fat Boy practices. (19, pp. VI-23-24) FERC’s Staff Report states that “some respondents”66 (presumably in their response to DR7, but that is not clear) had told FERC Staff that the Cal-ISO had actually helped them enact the Fat Boy strategy by providing them with artificial or simulated load and delivery points to match their supply. This was so they could submit a “balanced” schedule. However, FERC’s Staff Report makes it sound like only one ISO employee was known to engage in this activity.
65 A high-ranking official was defined as the company president, chief executive officer, general counsel, or a corporate office of comparable authority. (20, p. 1) 66 Reliant was the only company actually named in the Final Report. (19, p. VI-24)
70
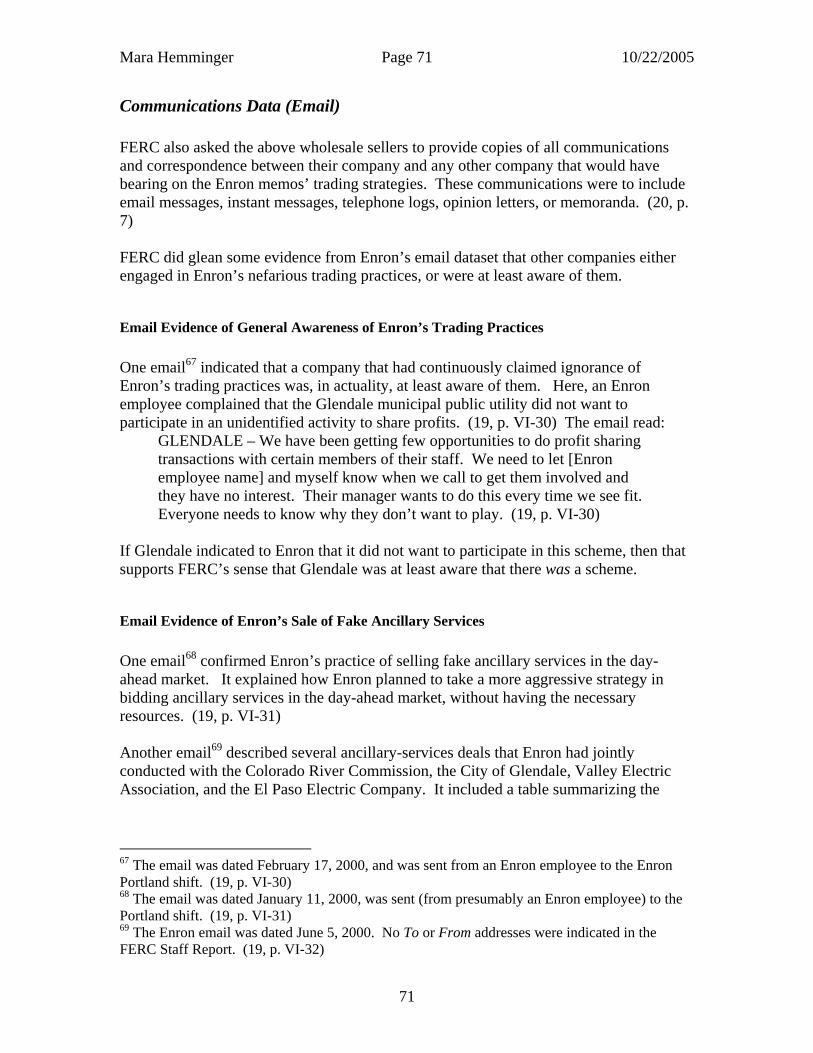
Mara Hemminger Page 71 10/22/2005
Communications Data (Email) FERC also asked the above wholesale sellers to provide copies of all communications and correspondence between their company and any other company that would have bearing on the Enron memos’ trading strategies. These communications were to include email messages, instant messages, telephone logs, opinion letters, or memoranda. (20, p. 7) FERC did glean some evidence from Enron’s email dataset that other companies either engaged in Enron’s nefarious trading practices, or were at least aware of them.
Email Evidence of General Awareness of Enron’s Trading Practices One email67 indicated that a company that had continuously claimed ignorance of Enron’s trading practices was, in actuality, at least aware of them. Here, an Enron employee complained that the Glendale municipal public utility did not want to participate in an unidentified activity to share profits. (19, p. VI-30) The email read:
GLENDALE – We have been getting few opportunities to do profit sharing transactions with certain members of their staff. We need to let [Enron employee name] and myself know when we call to get them involved and they have no interest. Their manager wants to do this every time we see fit. Everyone needs to know why they don’t want to play. (19, p. VI-30)
If Glendale indicated to Enron that it did not want to participate in this scheme, then that supports FERC’s sense that Glendale was at least aware that there was a scheme.
Email Evidence of Enron’s Sale of Fake Ancillary Services One email68 confirmed Enron’s practice of selling fake ancillary services in the day-ahead market. It explained how Enron planned to take a more aggressive strategy in bidding ancillary services in the day-ahead market, without having the necessary resources. (19, p. VI-31) Another email69 described several ancillary-services deals that Enron had jointly conducted with the Colorado River Commission, the City of Glendale, Valley Electric Association, and the El Paso Electric Company. It included a table summarizing the
67 The email was dated February 17, 2000, and was sent from an Enron employee to the Enron Portland shift. (19, p. VI-30) 68 The email was dated January 11, 2000, was sent (from presumably an Enron employee) to the Portland shift. (19, p. VI-31) 69 The Enron email was dated June 5, 2000. No To or From addresses were indicated in the FERC Staff Report. (19, p. VI-32)
71

Mara Hemminger Page 72 10/22/2005
money made on ancillary services70 for the month of May. (19, p. VI-32) These sounded like Get Shorty deals. A third email71 complained about mistakes that had been made while entering profit-sharing deals in the books. It stated, “This morning our book showed us losing $51,000 because the Redding profit sharing deal was incorrectly entered…” (19, p. VI-33) It is not readily apparent why FERC found this to be evidence of Enron’s sale of fake ancillary services; nonetheless, FERC cited it under the Ancillary Services Strategies section of its Staff Report. A fourth email72 suggested that Enron should share more of its ancillary services’ profits with a generator if Enron made a sufficient profit selling that energy on the Californian market. The email outlined a “Big Foot” deal, whereby Enron would buy energy from Washington Water Power Company and schedule it into California as a supplemental energy bid. (Supplemental energy is associated with the generation used for ancillary services.) The email suggests, “If you buy from WWP and do real well on a supplemental, you might consider giving a few more dollars for their energy.” (19, p. VI-38)
Email Evidence of Enron’s Forcing Congestion Payments One email73 announced Enron’s discovery of a new (and presumably constrained) tie, the Silverpeak intertie74 of the Sierra Pacific Power Company system, that could be used to route energy from southern to northern California.75 The email author warned against letting other marketers, such as Powerex, learn of the tie’s existence, lest they also try to schedule energy over it ((and make a profit from the congestion payment)). This was because Enron did not want any competition on this tie. (19, p. VI-27) The email stated:
Also do not sell to a marketer (especially POWEREX76) without sleeving.77 We do not want anybody else to know about the path. If
70 It is unclear to the author how a table summarizing profits from ancillary deals would be evidence that the deals were illicit. Enron would always keep a percentage of the generating companies’ ancillary sales profits, regardless of whether the energy promised was firm or not firm. That was a general business practice. 71 This email was dated November 5, 1999, and was sent (presumably from an Enron employee) to the Enron Portland shift, and bore the subject line of “DEAL ENTRY ERRORS.” (19, p. VI-33) 72 This email was dated December 24, 1999. No To or From addresses were indicated in the FERC Staff Report. (19, p. VI-38) 73 This email was dated March 15, 2001, and was sent from an Enron employee to the Enron Portland Shift. (19, p. VI-27) 74 The Silverpeak line was a “terminal” with a maximum capacity of 15 megawatts. It was located in a Nevada desert town with the same name. (18, p. 1.) 75 This sounds like a Wheel-Out transaction. 76 The ISO report (provided to FERC during this investigation) showed that Powerex was one of the largest recipients of congestion payments. (19, p. VI-27) The author presumes that this fact helped FERC decide that this email actually referred to a congestion payment scheme.
72

Mara Hemminger Page 73 10/22/2005
Powerex sees this I guarantee that they would try to schedule this and we do not want competition. (19, p. VI-27)
It is worth noting that other sources indicate that Timothy Belden, one of Enron’s traders in Portland, Oregon, used this Silverpeak line to force congestion payments. (18, p. 1.) Mr. Belden did not appear to be the author of this particular email, however. If one queries FERC’s online database of Enron emails, one will see that a person named “Geir Solberg” sent the email. Another email78 showed collaboration between Enron and the city of Redding, California, in a congestion relief scheme known as “red congo.” Red congo was a new marketing arrangement to relieve congestion, using Pacificorp West as the northwest utility to move energy from south to north. Part of the arrangement involved using Redding’s rights on a non-ISO transmission line(s), and a series of sales and purchases between the two parties. The email stated, “Redding is on board with this strategy as is Pacificorp.” (19, p. VI-30) Conclusion: Other companies engaged in Enron’s trading practices, or were at least aware of them.
FERC’s Data Request 9 (DR9) FERC directed its Data Request 9 to only the Williams gas company, and so it will not be examined further here.
FERC’s Information Need 2 FERC’s second information need was to find out whether any entity, including Enron Corporation, “otherwise exercised undue influence over wholesale electric prices in the West” from January 1, 2000 until the time of the investigation (2002). (35, p. 1) Looking back at Figure 9, the reader will see that the wholesale market covered both short-term and long-term prices, i.e. both the physical and financial markets. Since IN1 has already covered the direct manipulations of short-term prices, and IN3 covers effects on long-term prices, IN2’s clause “otherwise exercised undue influence” must be asking whether Enron indirectly controlled any aspects of the wholesale market. FERC issued several data requests in connection with IN2. These are listed below, along with any answers that the author found.
77 The author does not know what “sleeving” is. 78 This email was sent to the Enron Portland shift. No date was indicated in FERC’s Staff Report. (19, p. VI-30)
73
Mara Hemminger Page 74 10/22/2005
FERC’s Data Request 3 (DR3) DR3 of March 15, 2002, was the first data request that could be considered relevant to IN2. Unfortunately, the complete data request is unavailable on the FERC website, and so not much detail is known about it. (39, p. 2) However, in DR3, FERC did ask Enron to provide information about EOL, Enron’s physical and financial transactions, and other (unidentified) information that was controlled by Enron Corp. and its affiliates and subsidiaries. (39) Enron had provided FERC with rolling access to EOL and several other transactional databases by mid-June 2002.79 (112) The EOL database export was evidently provided on tape. (45, p. 1) Conclusion: FERC evaluated the structure of EOL, and found that EOL gave Enron-the-marketer an unfair information advantage over its competitors (19, p. IX-31) and allowed Enron to potentially manipulate that market (19, p. IX-24). To understand this finding, one should review how EOL worked. The reader may recall that EOL was a one-to-many platform. This meant that Enron was a counterparty to every trade, as either the buyer or the seller. (101. Also, 36, p. 3-4) Enron would simply post on EOL the price at which it was willing to buy or sell energy to other parties. Interested buyers and sellers would click on the posted price sale on the EOL interface to initiate a purchase/sale.80 (36, p. 12) The sale (offer) and purchase (bid) price might change, but EOL would not show the reason for that change. (36, p. 5) More importantly, once the sale was finalized, the EOL interface would not show the final price, volume, or time of the sale. Thus, non-Enron traders were kept in the dark about the final transaction. (36, p. 4) Enron knew the precise details of every trade, but outsiders could only see the current ask/bid price on the EOL interface. (19, p. IX-25) All of these factors gave Enron a tremendous information advantage over the other buyers and sellers. Remember, Enron (the corporation) could play in this market either as a marketer (buyer/seller) or as an arbiter (owner of EOL). Thus, EOL allowed Enron-the-marketer to be the first to know about forward power market transactions (46, p. 3), and also the only one to know what the final price, volume, time, and history of such sales were. Other market participants, however, did not have this information, as it was not displayed to them on the EOL interface. (19, p. VIII-7) This absence of public knowledge meant that EOL could report whatever it liked as the final sales price at a later time. Why would EOL want to do that? Well, Enron the corporation could take advantage of its position as both a marketer and an arbiter in the same market. If Enron-the-marketer made more sales than purchases on a given day, perhaps Enron-the-arbiter would report that the sales price was higher than it actually was. This would allow Enron the marketer to state that it had “sold high,” and declare higher earnings. (46, p.4, plus
79 This fact is mentioned in Enron’s June 7, 2002 reply to FERC’s data request of May 22, 2002 (DR11). (112) That data request and reply is discussed under IN3, DR10-11. 80 Non-Enron entities evidently could not initiate a sale or purchase; they could only respond to Enron’s posted price offers.
74

Mara Hemminger Page 75 10/22/2005
author’s interpretation of that passage) Clearly, Enron could not be an objective market maker, since it was also a market player. (46, p. 4) Finally, EOL’s non-disclosure of the reasons behind price changes prevented other traders from knowing if changes in the bid/offer prices were due to a legitimate trade or to something else, like a price manipulation by Enron. (19, p. VIII-7; 19, p. IX-37) EOL’s collapse had a huge impact on the forward market. EOL’s popularity had made it a virtual monopoly as market-maker in the forward market. Enron’s demise, however, meant the collapse of EOL. This created an unexpected hole in the forward market that other traders had to scramble to fill (46, p. 2-3). Such an impact gives testimony to Enron’s tremendous influence over the forward market, through EOL.
FERC’s Data Request 7 (DR7) On May 8, 2002, FERC asked all entities that had sold wholesale electricity and/or ancillary services to the ISO or PX from 2000-2001 to submit to FERC copies of the following: all communications or correspondence between themselves and other companies that might indicate their awareness of, or use of, the trading strategies that were outlined in the Enron memoranda. The communications and correspondence items were to include email messages, instant messages, telephone logs, opinion letters, memoranda, and reports. (20, p. 7) Although this request does not completely dovetail with IN2, some of the resulting emails were used to answer IN2. Hence this data request is included under IN2. The wholesale companies presumably provided the requested data dumps. (The author did not see Enron’s response.) Some of Enron’s email data contained evidence that Enron did indeed have some influence over the market, in that it controlled or colluded with other companies to conduct its schemes. For example, a December 23, 1999 email to Portland shift, entitled “Valley Electric,” indicated that Enron was about to start making Valley Electric’s scheduling and marketing decisions as of January 1, 2000. Enron would then receive 40% (of the profits). This indicated Enron’s total control over another company’s decision-making authority (19, p. VI-41), giving it greater market power. Several other emails81 showed Enron’s collusion with other companies to provide ancillary services that Enron had sold to the ISO but did not actually possess. See “Sale of Fake Ancillary Services” for a more detailed explanation of that activity. FERC came to the same conclusion – i.e. that Enron had exercised undue influence in the wholesale electricity market – by reading some of Enron’s internal documents,82 which Enron had presumably given to FERC in response to DR7. Enron’s business strategy as a
81 See email evidence cited under “Sale of Fake Ancillary Services.” Email dates are June 5, 2000, December 24, 1999, and November 5, 1999. 82 Enron Services Handbook (19, p. VI-38) and “Skilling’s ‘Enron Network’” document (19, p. VI-37).
75

Mara Hemminger Page 76 10/22/2005
marketer83 was basically to form initial relationships with energy companies by providing them with consulting services for a fee. As this relationship matured, it shifted into a comprehensive partnership with the two parties sharing any profits made from brokered transactions. (19, pp. 37&38) Enron’s charges then moved to a 50/50 split for marketing energy, and a 25/75 split for selling ancillary services. (In the 25/75 split, Enron got 25% and the other company got 75%.) (19, p. VI-38) Essentially, then, Enron developed these business relationships to the point that it wielded some control over the other company’s decision-making, to the profit of both parties. (19, p. VI-40) Conclusion: Although FERC did not specifically state in its Staff Report that Enron had exercised undue influence over the wholesale electric market, FERC did find that Enron forged business alliances and partnerships without filing the agreements that FERC required under its market-based rate authorizations.84 (19, p. VI-37) Moreover, Enron’s joint activities with other companies equated to gaming the market, in contravention of the MMIP. (19, p. VI-43)
FERC’s Information Need 3 (IN3) In IN3, FERC sought to learn whether IN1 and/or IN2 had resulted in “potentially unjust and unreasonable rates in long-term power sales contracts subsequently entered into by sellers in the West.” (35, p. 1) The author believes, by examining FERC’s conclusions about the long-term power market, that this information need shifted somewhat, and can be broken down into three revised information needs. These examined whether Enron had intentionally influenced long-term power prices (dubbed here as IN3a), or indirectly influenced them through either wash trading (IN3b) and misreporting short-term sales prices (IN3c). These iterated information needs are the author’s own interpretation, however.
FERC’s Information Need 3a (IN3a) This information need examined whether or not Enron had intentionally influenced or manipulated long-term power prices.
FERC’s Data Request 3 (DR3) On March 15, 2002, FERC asked Enron to provide information about EOL, Enron’s physical and financial transactions, and other (unidentified) information that was controlled by Enron Corp. and its affiliates and subsidiaries. (39) Enron did provide
83 The author interprets this role as that of a Scheduling Coordinator (SC). 84 It is unclear to the author whether this constituted a violation of the PX or ISO MMIP.
76
Mara Hemminger Page 77 10/22/2005
FERC with rolling access to EOL and several other transactional databases, per June 7, 2002 correspondence.85 (112) FERC analyzed the EOL data, looking specifically at Enron’s electricity and gas sales at four trading hubs, from January 1, 2000, to December 31, 2001. FERC then examined Enron’s sales/purchases on the NYMEX futures market. FERC found that Enron sustained losses in all four of the physical energy sales on EOL, but posted gains in the futures market. (19, p. VIII-7) Now, FERC evidently suspected that Enron had manipulated physical energy markets (on EOL) in order to make a profit in the financial (futures) market. (19, p. IX-2) The above transactions did not, in and of themselves, necessarily drive futures prices up. However, another strategy could accomplish this. In a real-life example,86 an Enron desk manager slowly sold physical gas at the Henry Hub trading hub87 (using EOL) during the first half of the day, bringing that price down somewhat. He then purchased the gas back quickly (in just a few minutes) on EOL that same afternoon, driving the price back up significantly. This sharp increase in the physical market price lead to a corresponding price increase in the financial market, the NYMEX futures exchange. Shortly after this entire EOL transaction had occurred, a desk trader (who worked for the above desk manager) sold numerous energy shares on NYMEX, taking advantage of the higher price before that market returned to normal. (19, pp. IX-14-18) Thus, Enron traders manipulated physical gas prices in order to reap a profit in the financial energy market. FERC equated this to arbitrage, which is the making of a riskless profit by simultaneously selling an overpriced asset (here, a futures contract) while purchasing an underpriced, substantively equivalent asset (here, on the physical market). (19, p. IX-6) Interestingly, FERC found an internal Enron memo (probably produced in response to DR3) that described the same strategy that was just described above. This memo predated the observed manipulations of June 2001, and so FERC suspected that this practice was not limited to one location or one trading desk. Further analysis revealed that at least one other company (Reliant) had engaged in similar strategies. (19, p. IX-2)
FERC’s Information Need 3b (IN3b) Here, FERC sought to discover if Enron had indirectly influenced long-term power prices through activities such as wash trading. More specifically, FERC sought to discover if Enron or other marketers had engaged in wash trading. FERC placed several iterative requests for sales transaction data, each time narrowing down what it wanted. FERC eventually used the information provided to draw a conclusion about washes. However, it is not clear whether this was what FERC was originally interested in or not. It may be that washes were just one of the things that this data lent itself to proving.
85 However, this letter (data reply) was in response to a request FERC had evidently placed on May 22. (112) The author has no record of a request from FERC on this topic on that day. 86 This real-life example took place on June 14 and 19, 2001. (19, pp. IX-14-18) 87 The Henry Hub is a gas trading hub located in Louisiana. (19, p. VIII-3)
77

Mara Hemminger Page 78 10/22/2005
So, what is a wash? Washes, or wash trades, are a prearranged pair of trades of the same good, for the same price, at the same volume, at nearly the same time, between two parties, such that no economic risk and no net change in ownership is involved. (19, pp. VII-1&2) This does not, on the surface, seem to make much sense. Why would a trader trade the same good back and forth all day long, if he were not going to make a profit on the sale or actually exchange ownership of the good? The reason is that the financial community ranked energy traders primarily by the volume of their sales. So an increased sales volume (through, say, wash trading) would increase a trader’s ranking in the financial energy world, and therefore his professional standing. (49) Wash trading had another possible effect on the financial market. Energy index prices were determined in large part by the sales volumes that traders reported to index publishers. (19, pp. III-25-26) This meant that washes, which exaggerate sales volumes, could drive up the corresponding energy price indices. These price indices, in turn, form the basis for much of financial derivative trading (such as futures or forward contracts). (19, p. III-19) This meant that a trader or his company might use wash trades to skew price indices, in order to take advantage of the changed price structure in the financial market. FERC’s initial step, however, was to prove that wash trades did actually occur. FERC asked for transactional data several different times, in several different ways, each time narrowing down what exactly it wanted. This winnowing effect can be seen in the iteration of data requests, from DR1 to DR2 to DR12 to DR10-11.
FERC’s Data Request 1 (DR1) On February 15, 2002, FERC sent Enron DR1, asking for wholesale and retail sales/purchases on which Enron had defaulted. (37) Enron responded on March 1st by providing hard-copy and PDF versions of numerous contracts.88 Information about sales that did not go physical appears to have been limited to Enron’s most recent sales, which were terminated because of Enron’s failing financial situation. Enron was apparently not able to provide all this information in tabular format, as FERC had requested, however, due to time constraints. (67, 69) FERC found this data to be insufficient to answer IN3b (38, p. 1), and so phrased its question more precisely in DR2.
FERC’s Data Request 2 (DR2) On March 5, 2002, FERC asked all sellers of wholesale energy in the Western U.S. to provide information about the following:
88 Portland General Electric responded separately, stating that it had no wholesale transactions that met FERC’s request. (70)
78

Mara Hemminger Page 79 10/22/2005
• Short-term transactions in the Western U.S. for 2000 and 2001, where “short-term” refers to sales or resales with a term of less than one week;
• Monthly transactions, where monthly refers to sales or resales made on a monthly, seasonal, or quarterly basis;
• Long-term transactions, where long-term refers to sales or resales with a term of one year or longer. (38, pp. 1-2)
This information was to include whether or not the sales went physical (i.e. whether the energy was actually delivered to the buyer). Note that a non-physical sale might indicate a wash trade. Enron apparently supplied much of the requested information for its subsidiary EPMI on April 26, 2002. (62, 65) All of this data is confidential and not publicly available. Enron planned to send electronic copies of its long-term contracts, as well as wholesales sales information for Enron Energy Services, Inc. and Enron Energy Marketing Corporation, soon after that. (65) Enron also noted that much of the requested information was generally available in the Enron Physical Transaction Database (EPTB),89 which Enron had made available to FERC on March 22nd (in response to a different data request). (66, 68) The raw EPTB data was simply not in the Excel format that FERC’s March 5th data request stipulated. (66) Unfortunately, even this more precise data did not meet FERC’s needs in this instance. In general, the wholesalers’ responses were deemed inconsistent, and could not be used to identify wash, round-trip, or sell-back transactions. (22, p. 1) FERC found Enron’s response to be especially deficient. (42, pp. 1-2) Therefore FERC proceeded to DRs 10, 11, and 12.
FERC’s Data Requests 10-11 (DR10-11) At some point, it became public knowledge that several energy marketing companies (such as Reliant and Dynegy) had engaged in washes to inflate their trade volumes. On May 14, 2002, California Governor Gray Davis urged FERC to include questionable activities such as washes in its investigation, rather than focusing solely on the market strategies outlined in the Enron memos. (61) California Senator Dianne Feinstein echoed this sentiment on May 24, 2002. (57) FERC then apparently gave up on getting useful raw transactional data for this information need. On May 21 and 22, 2002, FERC simply asked all wholesale energy companies to produce an affidavit by a high-ranking company official90 stating whether their company had or had not engaged in wash, round-trip, or sell-back transactions. If a company admitted to any of the above, it was to provide FERC with the transactional details, names of participating traders, and copies of related communications (e.g. email/instant-messaging/telephone logs). Moreover, the company was to indicate which
89 The EPTB contained information about short-term and long-term sales. (68) 90 Such as a company president, CEO, or general counsel. (22, pp. 1-2)
79

Mara Hemminger Page 80 10/22/2005
platform (e.g. EOL) it had used for these activities, and whether or not this activity had been reported to trade publishers. (22, pp. 1-3; 26, pp. 1-2) Several companies91 (not Enron) did admit publicly that they had engaged in washing (19, p. VII-1), although the author is unsure whether these admissions occurred before DR10-11 or after. Enron’s vice president and assistant general counsel, Richard Sanders, gave FERC and the Commodity Futures Trading Commission (CTFC) his deposition92 on July 9-10. This deposition was apparently not made publicly available, as Californian State Senator Joseph Dunn repeated asked for a copy of it. Dunn was still unsuccessful as of August 22, 2002. (54, 55) Enron also briefed FERC on wash trades sometime during/after late June 2002. (56) It is unclear whether or not Enron admitted to any wrongdoing in these meetings.
FERC’s Data Request 12 (DR12) Finally (and apparently out of desperation), FERC announced on April 18, 2002 that it would send two IT specialists to Enron’s office in Houston. They were to access Enron’s databases directly, to obtain the desired information. DR12 is more of an announcement than a request, but it is listed here for completeness. (42)
FERC’s Data Request 3 (DR3) FERC also examined washes from a more data-intensive angle. The reader will recall that FERC had asked for EOL data as early as March 15, 2002. (39) In examining that data, FERC concluded that wash trading was commonplace on EOL. (19, p. VII-14) FERC detected washing in both the gas and electric markets, on both the physical and financial sides. Henry Hub was the most common location for the gas washes; the Mid-Columbia, Cynergy, and California-Oregon Border hubs were the most common locations for the electricity washes. (19, p. VII-8) FERC also concluded that Enron had
91 CMS Energy, Dynegy, Reliant, and Williams. (19, p. VII-1) 92 A deposition is: “the taking and recording of testimony of a witness under oath before a court reporter in a place away from the courtroom before trial. A deposition is part of permitted pre-trial discovery (investigation), set up by an attorney for one of the parties to a lawsuit demanding the sworn testimony of the opposing party (defendant or plaintiff), a witness to an event, or an expert intended to be called at trial by the opposition. If the person requested to testify (deponent) is a party to the lawsuit or someone who works for an involved party, notice of time and place of the deposition can be given to the other side's attorney, but if the witness is an independent third party, a subpoena must be served on him/her if he/she is reluctant to testify. The testimony is taken down by the court reporter, who will prepare a transcript if requested and paid for, which assists in trial preparation and can be used in trial either to contradict (impeach) or refresh the memory of the witness, or be read into the record if the witness is not available.” (113)
80

Mara Hemminger Page 81 10/22/2005
engaged in wash trades (19, p. VII-1), even if only because Enron was, by definition, the counterparty in all EOL trades. Conclusion (to IN3b): FERC found several energy companies guilty of engaging in wash trades. Most publicly admitted to it – namely CMS Energy, Dynegy, Williams, and Reliant. (19, VII-1) FERC concluded that Enron had also conducted wash trades, based on an analysis of EOL data. (19, p. VII-1) Moreover, FERC believed that EOL was a popular platform for these trades (19, p. VII-14), and that some EOL traders used EOL to wash regularly (19, p. VII-7). FERC noted, as a counterpoint, that an EOL trader may have taken a position that favored either higher or lower energy prices; hence, it is impossible to tell if the EOL wash trades drove gas or electric prices up or down in that market. (19, p. VII-15) There were several follow-on implications to this. For one, washes clearly increased the traders’ reported trading volumes and revenues. That was, of course, one of the reasons traders did this. For another, washes might create the illusion that the energy market was liquid and active, causing it to be valued higher (and receive higher prices) than it should be in financial circles. This might cause energy to be overvalued as a commodity in general. Third, washes might send false price signals to other market participants, if the traded price differed from the prevailing market price. Finally, and most importantly, washes could skew the energy market’s price index, if the mere reporting of so many transactions served to change the wash price vis-à-vis the average index price. (19, pp. VII-1-12) This effect was discussed earlier, at the beginning of the IN3b section. Unfortunately, FERC had no regulations banning wash trades, so it had no authority to censure that activity. However, the Commodity Futures Trading Commission (CTFC) did have regulations against this. (19, p. VII-1) Although FERC’s Staff Report did not indicate whether or not FERC planned to refer this problem to the CFTC, presumably this did indeed happen, judging from the fact that Enron vice president Richard Sanders provided his July 2002 deposition about wash trading to both FERC and the CFTC. (55)
FERC’s Information Need 3c (IN3c) In IN3c, FERC analyzed whether the published energy price indices had been manipulated.
FERC’s Data Requests 13-17 FERC asked several publishers93 of energy price indices94 to describe how they gathered and reported forward electricity and natural gas price index information. (23, 24, 27, 28, 40, 41) Some of the more specific questions issued were:
93 These publishers were: Bloomberg, Energy Intelligence Group, Inc. (Natural Gas Week), Natural Gas Intelligence (daily and Weekly Gas Price Index), Platts Natural Gas Products (Gas
81

Mara Hemminger Page 82 10/22/2005
• What is the process for gathering and posting price indices? (23, 27, 28) • What were the inputs used to calculate the forward price? (E.g. number of traders
contacted, volumes of trades, number of transactions) (24) • Why did some publishers use trade data rather than bid/offer data? (24) • If northern and southern California prices were posted separately, when and why
did this start? (27, 28) • How much was EOL used (by the publishing company) in developing the posted
prices? (23, 24, 27, 28) • How much did market participants use EOL as a price-discovery mechanism?
(23, 27, 28) • What sampling procedures were used for forward trades? (40, 41)
o Were these samples based on reports from individual traders or from total trades for individual trading firms?
• What products were included in forward trades? (40, 41) o Were the terms quarterly, annual, etc.? o Were the products peak or off-peak?
• How are reporting locations treated? (40, 41) o Are only specific locations’ trades reported, or nearly all? o Are both sales and purchases from these locations reported?
• What is the basis for reported prices? (40, 41) o Does each reported time period (e.g. quarterly) always have trades? o Are traders’ estimates used, or specific reported trades?
• Are firms required to participate? (40, 41) • Is this data verified? (40)
Conclusion: The author did not sift through each company’s response to these data requests, as there were so many. However, the answers that were relevant to this investigation can be gleaned from conclusions drawn in FERC’s Staff Report. Here, FERC indicated its belief that the price indices for natural gas had significant problems,95 namely:
• FERC could not independently verify the published price data, because the publishers would not disclose the source of the raw data out of confidentiality concerns. (19, p. III-1)
• The gas index publishers did not use statistically valid sampling procedures. (19, p. III-1)
• Several companies96 (not Enron, 19, p. III-4) admitted that their gas traders or trading desks had provided false data to the trade press. (19, p. III-2&4) Typically, they would report a higher trade volume than was truly the case, or
Daily, Inside FERC Gas Markets Reports), Platts Electricity Products (maybe Power Markets Week?). (23, 24, 27, 28, 40, 41) 94 A price index is defined as “A statistical indicator providing a representation of the value of the securities which constitute it. Indices often serve as barometers for a given market or industry and benchmarks against which financial or economic performance is measured.“ (115) 95 The author saw no similar statement in FERC’s Staff Report about electric index prices. 96 Dynegy, AEP, Williams, CMS, and El Paso. (19, p. III-2&4)
82

Mara Hemminger Page 83 10/22/2005
they would change the price, or report fictitious trades. (19, p. III-5-14) The reasons for doing this were:
o To offset Enron’s perceived dominant input into the process (not further identified),
o To benefit the trader’s own position, or o To offset other companies’ inaccurate reporting. (19, p. III-5)
• Wash trades may have adversely affected the reported price data. (19, p. III-1) (The reason for this was discussed earlier, at the beginning of the IN3b section.) Remember that FERC had already concluded, by analyzing EOL data, that Enron had engaged in wash trading. (19, p. VII-1)
• Some market participants had a strong incentive to manipulate the natural gas spot market. (19, p. III-1) This is because some of the large purchasers of natural gas97 could buy gas at a fixed price, but sell it at an index price. Therefore, they might be motivated to influence the index price (i.e. raise it above the fixed price) in order to maximize their profit when buying and selling the same commodity. (19, p. III-16)
• EOL exerted an undue influence over published indices. (19, p. III-34) o EOL was a significant source of natural gas price discovery and price
formation. (19, p. III-35) o Many traders replicated EOL gas trades as their own when
misrepresenting their own trades. (19, p. III-34) o EOL was susceptible to manipulation by market participants, which could
affect the published price indices. (19, p. III-1) o Although this fact was not mentioned in the Staff Report, FERC noted in
its August 2001 inquiry into EOL that some publishers (e.g. Natural Gas Intelligence) based their indices solely on EOL data. At the time, FERC deemed this over-reliance on EOL to be ill-advised, because EOL did not post any final sales prices, volumes, or dates. Therefore there was no way to tell if an index supplied by EOL had been manipulated by Enron. (36, p. 15)
In summary, Enron did help affect long-term prices by influencing forward price indices. It did this by acting as a wash-trader, a price-information source for index-setters, a platform (through EOL) for others’ wash trading, and an enabler for others to influence price indices (by providing a forum for price discovery and price formation).
Overall Conclusion FERC concluded in its Staff Report that Enron and its affiliates had “intentionally engaged in a variety of market manipulation schemes that had profound adverse impacts on market outcomes.” (19, pp. VI-43&44) As the reader can see from the preceding
97 Some large purchasers were Coral, Duke, Dynegy, Mirant, Reliant, and Williams. FERC’s Staff Report refers to these purchasers as “generators,” presumably because generators often buy gas to produce electricity. FERC did not specifically find these companies guilty of manipulating index prices for this purpose. (19, p. III-15-17)
83

Mara Hemminger Page 84 10/22/2005
discussion, FERC found Enron to be guilty of every major accusation levied against it in the PA02-2-000 investigation. These accusations, which are reflected in this paper’s statements of information needs (INs), were that Enron had: manipulated short-term prices for electric energy or natural gas in the West, exercised undue influence over wholesale electric prices in the West, or caused potentially unjust and unreasonable rates in long-term power sales contracts subsequently entered into by sellers in the West. The manipulation schemes ranged from using Enron’s power as a scheduling coordinator or marketer to under/overstate demand and to play the PX, ISO and out-of-state prices against each other, to overloading transmission line schedules in order to obtain California’s congestion payments, to misrepresenting firm energy that it did (not) have in order to collect ancillary services payments, to using Enron’s insider knowledge in EOL trades to its own (unfair) market advantage, to manipulating physical (short-term) prices in order to arbitrage financial (long-term) prices, to conducting wash or churn trades and thereby skewing index prices. Moreover, FERC found that Enron could not have done this without the cooperation of other entities; several energy partners had to have been involved. As a result, these too were investigated. (19, p, VI-43) On the other hand, FERC did find Enron to be innocent of at least one Californians’ accusations: FERC held that Enron had not caused the California energy crisis of 2000/2001. Rather, FERC attributed that crisis to the state’s unusual weather conditions that year. (19, p. I-10) The outcomes of this investigation were many. In its Staff Report, Staff recommended that FERC require Enron to “show cause why its (Enron’s and its affiliates’) market-based rate authorizations and blanket certificate authority should not be revoked.” (19, pp. VI-43&44) This may seem weak, but it would definitely deny Enron the ability to play in the California energy market. Of course, Enron was already bankrupt by then and had sold its energy-trading division to USB Warburg,98 which refused to be held liable for the former Enron division’s violations. (13, p. 5) However, several other cases and investigations either spun off of PA02-2-000 or began independently, and many of these are still underway. (125) The state of California began many investigations into Enron’s activities. In October 2002 (128), Timothy Belden, a top energy trader at Enron’s West Power Trading Division in Portland, Oregon (17, p. 1),99 pleaded guilty100 to federal charges of fraud for his trading activities (19, p. VI-3). He was considered the mastermind behind the Enron memos released in May 2002, and described under IN1 of this paper. (128) Enron’s Chief Financial Officer Andrew Fastow pleaded guilty to federal fraud charges in January 2004, and is now working with federal authorities to provide evidence against other members of Enron’s top brass. (127) A federal court will begin its fraud cases against former Enron Chairman Kenneth Lay and Chief Executive Officer Jeffrey Skilling in January 2005. (126) 98 USB Warburg, an investment bank, bought Enron’s energy-trading division in February 2002. (13, p. 5) 99 Another source calls Belden one of Enron energy traders at Portland General (an Oregon utility that Enron had bought). (11, p. 6) 100 Belden had been accused of the following in the case “U.S. vs. Timothy Belden”:
• Artificially increasing the price that Enron received (for energy), • Receiving payment for services that Enron did not in fact provide, and • Manipulating the market prices in certain markets. (17, p, 6)
84

Mara Hemminger Page 85 10/22/2005
Of course, there are many angles to the Enron debacle that FERC’s investigation did not cover. For example, FERC’s Staff Report makes no mention of accusations101 that Enron asked electric generators to shut off supply in order to drive prices up in the California market. PA02-2-000 also did not cover accusations that Enron’s auditing firm, Arthur Andersen, destroyed documents about Enron, even as investigations into Enron’s activities were beginning. (129) PA02-2-00 also did not address accusations that Enron’s top brass sold their own stock holdings in the company before the Enron collapsed, yet encouraged their employees (whose 401K retirement savings were almost entirely comprised of Enron stocks) to keep their holdings. (100, Chapters 20 & 21) This paper will not go further into the other Enron investigation or cases, however. It will end quietly with the conclusions of PA02-2-000. The greater goal was to explain this case and its conclusions, and how FERC went about finding answers to its questions. Unraveling of the story hopefully revealed the iterative nature of the investigation’s question-answering exercise, showing how FERC often started with one set of questions or data sources, only to end up asking slightly different questions or checking different data sources. Although the author was unable to uncover the specific requests that were posed of the various datasets, she attempted to construct likely queries that could have been posed of the email dataset. These questions are included in Appendices B and C, and will hopefully aid ongoing research into the types of question-answering sessions that might be posed of that dataset.
101 This accusation was alluded to in the movie version of source (100), The Smartest Guys in the Room. The movie played voice cuts (from Enron’s transcripts) wherein Enron traders called power generators and asked them to shut down some of their energy. The author saw no mention of this is FERC’s report, and is unsure whether this particular accusation was posed in any trial.
85

Mara Hemminger Page 86 10/22/2005
Appendix A: Investigation Map Below are FERC’s data requests in PA02-2-000, ordered by data request “number”: Data Request Date Summary DR1 2/15/02 Asks Enron for info on electric sales it had
defaulted on. DR2 3/05/02 Follow-on to DR1. Asks all sellers for ST,
monthly, and LT sales info. Also asks if sales went physical.
DR3 3/15/02 EOL data; memos results DR4 4/29/02 DB exports (not EOL) DR5 5/07/02 Asks ISO for info DR6 5/21/02 Asks ISO for more info DR7 5/08/02 Asks if others also used Enron’s
marketing tactics. Also asks for companies’ communications, including email.
DR8 5/16/02 Follow-on to DR7. Explains that DR7 includes both direct and indirect sellers of energy.
DR9 6/07/02 Sends representatives to Williams Co. to review gas data.
DR10 5/21/02 Asks electricity sellers if they washed. DR11 5/22/02 Asks gas sellers if they washed. DR12 4/18/02 Sends IT specialists to Enron’s Houston
office. DR13-17 4/11/02-5/23/02 Asks index publishers who they set index
prices. Table 3: FERC’s Data Requests, Ordered by Number
86

Mara Hemminger Page 87 10/22/2005
Below are FERC’s data requests in PA02-2-000, listed in chronological order: Data Request Date Summary DR1 2/15/02 Asks Enron for info on electric sales it had
defaulted on. DR2 3/05/02 Follow-on to DR1. Asks all sellers for ST,
monthly, and LT sales info. Also asks if sales went physical.
DR3 3/15/02 EOL data; memos results DR12 4/18/02 Sends IT specialists to Enron’s Houston
office. DR4 4/29/02 DB exports (not EOL) DR5 5/07/02 Asks ISO for info DR7 5/08/02 Asks if others also used Enron’s
marketing tactics. Also asks for companies’ communications, including email.
DR8 5/16/02 Follow-on to DR7. Explains that DR7 includes both direct and indirect sellers of energy.
DR6 5/21/02 Asks ISO for more info DR10 5/21/02 Asks electricity sellers if they washed. DR11 5/22/02 Asks gas sellers if they washed. DR13-17 4/11/02-5/23/02 Asks index publishers who they set index
prices. DR9 6/07/02 Sends representatives to Williams Co. to
review gas data. Table 4: FERC’s Data Requests, Ordered by Date Table 5: Map of FERC’s Information Needs -> FERC’s Data Requests -> Enron’s Replies -> FERC’s Conclusions (The chart follows) © Mara Hemminger 2005
87

Mara Hemminger Page 88 10/22/2005
FERC's Data Request 1 (DR1)
Companies' RepliesIN1 Evidence:
Energy Export/Reimport
IN1 Evidence: Forced Congestion
Payments
IN1 Evidence: Fake Sale of Ancillary
Services
IN1 Evidence: Scheduling False
DemandFERC's Conclusions
Asks Enron to supply, as contract copies and
in tabular form, information about its
contracts for wholesale electric sales and
purchases, including ancillary services, and retail sales throughout the U.S. ?which it has defaulted on, canceled,wound down, cashed
out, or otherwise terminated early. (2/15/02) (37)
Enron provides hard-copy and PDF copies (on
CD) of some of these contracts, and lists of
other contracts that fall within the scope of the request. Most of these
contracts were terminated early
because of Enron's financial condition.
(3/01/02) (67)
FERC's Data Request 2 (DR2)
Companies' RepliesIN1 Evidence:
Energy Export/Reimport
IN1 Evidence: Forced Congestion
Payments
IN1 Evidence: Fake Sale of Ancillary
Services
IN1 Evidence: Scheduling False
DemandFERC's Conclusions
Follow-on question. Asks all gas and
electricity sellers if their sales went
physical. Answers must be provided in an
Excel spreadsheet. (3/05/02 follow-on to
2/15/02) (38)
Enron provided the requested Excel
spreadsheet info for EPMI, plus access to
many online databases. (65)
88
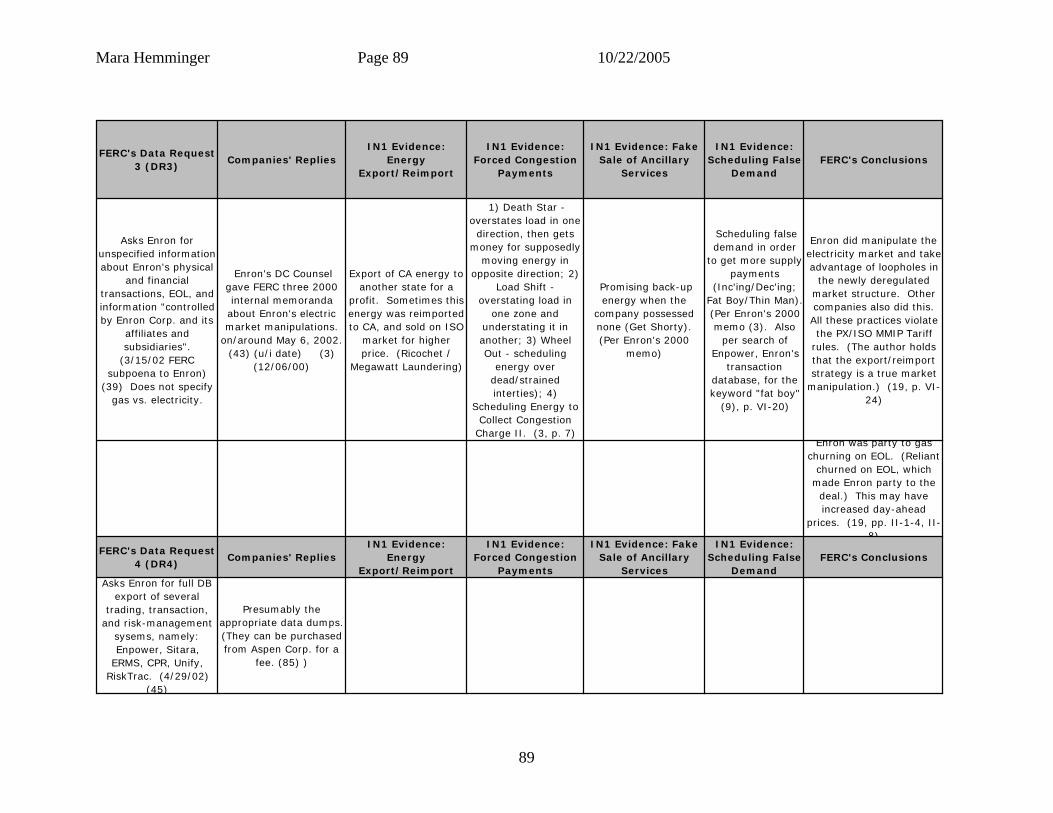
Mara Hemminger Page 89 10/22/2005
89
FERC's Data Request 3 (DR3)
Companies' RepliesIN1 Evidence:
Energy Export/Reimport
IN1 Evidence: Forced Congestion
Payments
IN1 Evidence: Fake Sale of Ancillary
Services
IN1 Evidence: Scheduling False
DemandFERC's Conclusions
Asks Enron for unspecified informationabout Enron's physical
and financial transactions, EOL, and information "controlled by Enron Corp. and its
affiliates and subsidiaries".
(3/15/02 FERC subpoena to Enron)
(39) Does not specify gas vs. electricity.
Enron's DC Counsel gave FERC three 2000 internal memoranda
about Enron's electric market manipulations.
on/around May 6, 2002. (43) (u/i date) (3)
(12/06/00)
Export of CA energy to another state for a
profit. Sometimes this energy was reimported to CA, and sold on ISO
market for higher price. (Ricochet /
Megawatt Laundering)
1) Death Star - overstates load in one
direction, then gets money for supposedly
moving energy in opposite direction; 2)
Load Shift - overstating load in
one zone and understating it in another; 3) Wheel Out - scheduling
energy over dead/strained interties); 4)
Scheduling Energy to Collect Congestion
Charge II. (3, p. 7)
Promising back-up energy when the
company possessed none (Get Shorty). (Per Enron's 2000
memo)
Scheduling false demand in order
to get more supplypayments
(Inc'ing/Dec'ing; Fat Boy/Thin Man).(Per Enron's 2000 memo (3). Also
per search of Enpower, Enron's
transaction database, for the keyword "fat boy"
(9), p. VI-20)
Enron did manipulate the electricity market and takeadvantage of loopholes in
the newly deregulated market structure. Other companies also did this. All these practices violate the PX/ISO MMIP Tariff
rules. (The author holds that the export/reimport strategy is a true market
manipulation.) (19, p. VI-24)
Enron was party to gas churning on EOL. (Reliant
churned on EOL, which made Enron party to the
deal.) This may have increased day-ahead
prices. (19, pp. II-1-4, II-8)
FERC's Data Request 4 (DR4)
Companies' RepliesIN1 Evidence:
Energy Export/Reimport
IN1 Evidence: Forced Congestion
Payments
IN1 Evidence: Fake Sale of Ancillary
Services
IN1 Evidence: Scheduling False
DemandFERC's Conclusions
Asks Enron for full DB export of several
trading, transaction, and risk-management
sysems, namely: Enpower, Sitara,
ERMS, CPR, Unify, RiskTrac. (4/29/02)
(45)
Presumably the appropriate data dumps.(They can be purchased from Aspen Corp. for a
fee. (85) )

Mara Hemminger Page 90 10/22/2005
FERC's Info Need 1a (IN1a)
FERC's Data Request 5 (DR5)
Companies' RepliesIN1a Evidence:
Energy Export/Reimport
IN1a Evidence: Forced Congestion
Payments
IN1a Evidence: Fake Sale of Ancillary
Services
IN1a Evidence: Scheduling False
DemandFERC's Conclusions
How prevalent are the energy trading practices that were outlined in Enron's
2000 memos?
Asks ISO to identify the 10 largest SC's (in terms of congestion
revenues) for 2000/2001. Show monthly congestion
revenues for each SC. (5/7/02) (21)
Asks ISO for all day-ahead and hour-ahead
bids into ISO's imbalance and
ancillary markets. (5/7/02) (21)
Asks ISO for records ofall out-of-market
purchases by counterparty, date, duration, price, and
volume. (5/7/02) (21)
Asks ISO for day-ahead and hour-ahead scheduled generation and ancillary service
awards by SC. (5/07/02) (21)
FERC's Info Need 1a (IN1a)
FERC's Data Request 5 (DR5)
Companies' RepliesIN1a Evidence:
Energy Export/Reimport
IN1a Evidence: Forced Congestion
Payments
IN1a Evidence: Fake Sale of Ancillary
Services
IN1a Evidence: Scheduling False
DemandFERC's Conclusions
Asks ISO for any materials that
demonstrate any entity's use of the market strategies
outlined in the 2000 Enron memos. (5/07/02) (21)
ISO tended to ignore false
information in the SCs' schedules. (19) p. VI-25
ISO may have been aware of Enron's (and others')
Fat Boy practice. (19) p. VI-25
90

Mara Hemminger Page 91 10/22/2005
91
FERC's Info Need 1a (IN1a)
FERC's Data Request 6 (DR6)
Companies' RepliesIN1a Evidence:
Energy Export/Reimport
IN1a Evidence: Forced Congestion
Payments
IN1a Evidence: Fake Sale of Ancillary
Services
IN1a Evidence: Scheduling False
DemandFERC's Conclusions
Asks ISO for SC and tie-level congestion
revenues/charges and flows; also asks for tie flows. (5/21/02) (25)
FERC's Info Need 1a (IN1a)
FERC's Data Request 7 (DR7)
Companies' RepliesIN1a Evidence:
Energy Export/Reimport
IN1a Evidence: Forced Congestion
Payments
IN1a Evidence: Fake Sale of Ancillary
Services
IN1a Evidence: Scheduling False
DemandFERC's Conclusions
Asks all sellers of wholesale energy and/or ancillary
services if they, like Enron, built (IOU's)
underscheduling tendencies into their
market models. (Presumably so they could counteract this
by scheduling over/false demand.)
(5/8/02) (20)
Yes, other sellers (3, p. 2) and other
SC's (19, p. VI-23&24) did this
too.
Other sellers built the IOUs' underscheduling tendencies into their
market models. (They might therefore use this
information to manipulate short-term prices.)
FERC's Info Need 1a (IN1a)
FERC's Data Request 7 (DR7)
Companies' RepliesIN1a Evidence:
Energy Export/Reimport
IN1a Evidence: Forced Congestion
Payments
IN1a Evidence: Fake Sale of Ancillary
Services
IN1a Evidence: Scheduling False
DemandFERC's Conclusions
Asks all sellers of wholesale electricity
and/or ancillary services if they
engaged in the trading strategies described in Enron's 2000 memos.
Requires affidavit. (5/8/02) (20) These
practices can be summarized as: inc'ing/dec'ing,
congestion payment manipulation, and the fake sale of ancillary
services.
Evidently some admissions of guilt. (19,
pp. VI-28&29)
Enron admitted to lying about its ability to provide ancillary
services. (19, p. VI-31. Also 3, pp. 4-6)
Some firms admitted to using Fat Boy strategy.
(Artificially overstating
load/demand on the schedule
submitted to SC, and getting paid for providing the extra supply.) (Per FERC Staff
Report (19) p. VI-24 & 25)
More companies than just Enron employed the Fat
Boy strategy.

Mara Hemminger Page 92 10/22/2005
92
FERC's Info Need 1a (IN1a)
FERC's Data Request 7 (DR7)
Companies' RepliesIN1a Evidence:
Energy Export/Reimport
IN1a Evidence: Forced Congestion
Payments
IN1a Evidence: Fake Sale of Ancillary
Services
IN1a Evidence: Scheduling False
DemandFERC's Conclusions
Asks all companies to provide all
communications or correspondence,
including email , IM, and phone logs,
between themselves and any other
company regarding the trading practices
outlined in the 2000 Enron memo.
(5/08/02) (20)
Apparently company memos, working
manuals, etc. (19, pp. VI-28&29)
1/11/2000 email from Enron employee to
Enron Portland shift, explaining how Enron
will take a more aggressive strategy to bid in the day-ahead
ancillary services market without the
necessary resources. (19) p. VI-31
Enron and several other companies did sell fake
ancillary services. (19, p. VI-31)
2/17/2000 email from Enron employee to Portland shift
complaining that the Glendale
municipal public utility does not
want to participate in a u/i activity to share profits. (19)
p. VI-30)
Other companies were at least aware of Enron's
trading practices. (19, p. VI-30)
FERC's Info Need 1a (IN1a)
FERC's Data Request 7 (DR7)
Companies' RepliesIN1a Evidence:
Energy Export/Reimport
IN1a Evidence: Forced Congestion
Payments
IN1a Evidence: Fake Sale of Ancillary
Services
IN1a Evidence: Scheduling False
DemandFERC's Conclusions
(email request) (5/08/02) (20)
3/15/2001 email from Enron employee to Enron Portland shift@ using Sierra Pacific
Power Co. to shift energy over the
Silverpeak intie btwn N/S CA. Wheel Out.
*This is the only emailthe author could
locate in the publicly-available Enron email dataset.* (19) p. VI-
27
6/05/2000 email describing ancillary money made with
other companies (e.g. Glendale, Colorado
River Commission) in May. (19) p. VI-32
Enron and other companies did sell fake ancillary services. (19,
pp. VI-28&29)
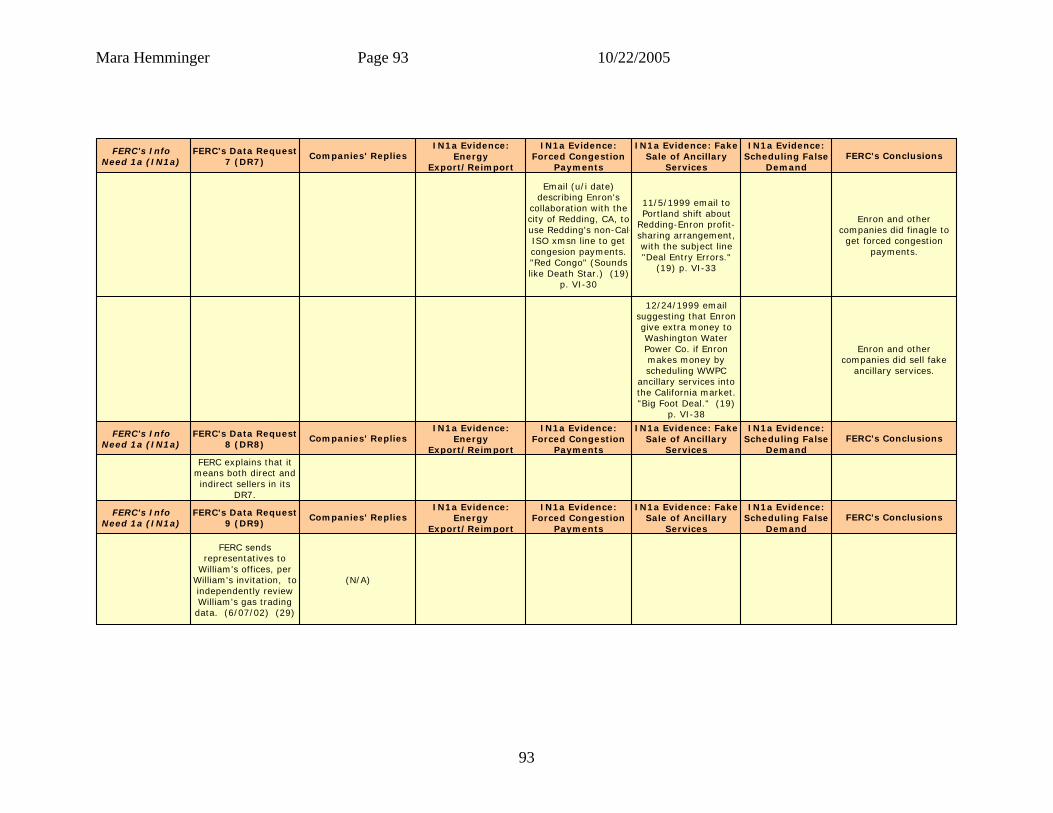
Mara Hemminger Page 93 10/22/2005
FERC's Info Need 1a (IN1a)
FERC's Data Request 7 (DR7)
Companies' RepliesIN1a Evidence:
Energy Export/Reimport
IN1a Evidence: Forced Congestion
Payments
IN1a Evidence: Fake Sale of Ancillary
Services
IN1a Evidence: Scheduling False
DemandFERC's Conclusions
Email (u/i date) describing Enron's
collaboration with the city of Redding, CA, touse Redding's non-Cal-ISO xmsn line to get congesion payments. "Red Congo" (Sounds like Death Star.) (19)
p. VI-30
11/5/1999 email to Portland shift about
Redding-Enron profit-sharing arrangement, with the subject line "Deal Entry Errors."
(19) p. VI-33
Enron and other companies did finagle to
get forced congestion payments.
12/24/1999 email suggesting that Enron give extra money to Washington Water Power Co. if Enron makes money by scheduling WWPC
ancillary services into the California market. "Big Foot Deal." (19)
p. VI-38
Enron and other companies did sell fake
ancillary services.
FERC's Info Need 1a (IN1a)
FERC's Data Request 8 (DR8)
Companies' RepliesIN1a Evidence:
Energy Export/Reimport
IN1a Evidence: Forced Congestion
Payments
IN1a Evidence: Fake Sale of Ancillary
Services
IN1a Evidence: Scheduling False
DemandFERC's Conclusions
FERC explains that it means both direct and indirect sellers in its
DR7.
FERC's Info Need 1a (IN1a)
FERC's Data Request 9 (DR9)
Companies' RepliesIN1a Evidence:
Energy Export/Reimport
IN1a Evidence: Forced Congestion
Payments
IN1a Evidence: Fake Sale of Ancillary
Services
IN1a Evidence: Scheduling False
DemandFERC's Conclusions
FERC sends representatives to
William's offices, per William's invitation, to independently review William's gas trading
data. (6/07/02) (29)
(N/A)
93

Mara Hemminger Page 94 10/22/2005
FERC's Info Need 2 (IN2)
FERC's Data Request 3 (DR3)
Companies' Replies
IN2 Evidence: UndueInfluence over Wholesale (ST)
Prices
IN2 Evidence: Information Advantage
IN2 Evidence: Undue/ Undeclared
Influence over OtherCompanies
IN2 Evidence FERC's Conclusions
Whether any entity,including Enron
Corp, (did IN1) ?or otherwise
exercised undue influence over
wholesale electric prices in the West, from 1/1/2000 -
2002?
Asks for Enron Online (EOL) data. (3/15/02
FERC subpoena to Enron) (39)
Data from EOL. This showed: EOL's 1-to-many trading model allowed EOL to show
participants only bid and offer prices and volumes (not the final transactiondetails, or time of trade)
for others' trades.
EOL gave the energy market (that was traded on EOL) no
transparency. Customers could not
discover the final price,volume, or date/time
of others' sales.
EOL gave Enron a huge information
advantage over other buyers/sellers, as
Enron knew the final price, volume, and
date/time of all sales.
EOL had no market transparency, so it gave Enron a huge information advantage vis-?vis other
gas and electricity marketers.
EOL also allowed Enronto choose whichever final price, etc., it liked, since EOL
provided a 1-to-many market (where Enron
was the "1".)
94

Mara Hemminger Page 95 10/22/2005
FERC's Info Need 2 (IN2)
FERC's Data Request 7 (DR7) Wholesale (ST)
Prices Advantage Influence over OtherCompanies
Asks all companies to provide all
communications or correspondence,
including email , IM, and phone logs,
between themselves and any other
company regarding the
Companies' Replies
IN2 Evidence: UndueInfluence over IN2 Evidence:
Information
IN2 Evidence: Undue/ Undeclared IN2 Evidence FERC's Conclusions
trading practices
outlined in the 2000 Enron memo.
(5/08/02) (20)
Presumably the appropriate data dumps.
12/23/1989 email to Portland shift
indicating that Enron controlled another
company's scheduling and marketing
decisions. Subject was"Valley Electric." (19)
p. VI-41
Enron did have significant influence over other companies' energy
marketing decisions.
6/05/2000, 11/05/1999,
12/24/1999 emails indicating that Enron colluded with other
companies to "provide"ancillary services.
(See previous email evidence under "Fake
Sale of Ancillary Services.)
Enron colluded with other energy companies to
manipulate the market for their own profit.
95

Mara Hemminger Page 96 10/22/2005
96
FERC's Info Need 3 (IN3)
FERC's Data Requests
Companies' Replies
IN3 Evidence: By Manipulating Physical and
Financial Markets
IN3 Evidence: Through Washes
IN3 Evidence: By Influencing Index
Prices
IN3 Evidence: Other FERC's Conclusions
Whether (the above actions
were) ?resulting in potentially unjust and unreasonable rates in long-term
power sales contracts
subsequently entered into by
sellers in the West.
FERC's Info Need 3a (IN3a)
FERC's Data Request 2 (DR2)
Companies' Replies
IN3 Evidence: By Manipulating Physical and
Financial Markets
IN3 Evidence: Through Washes
IN3 Evidence: By Influencing Index
Prices
IN3 Evidence: Other FERC's Conclusions
Asks all sellers in the West to provide
transactional information for their short-term, monthly, and long-term sales. Aslso asks whether these sales went
physical. Answers are due in an Excel
spreadsheet. (3/05/02 follow-on to 2/15/02)
(38)
Enron provided the requested Excel
spreadsheet info for EPMI, plus access to
many online databases. (65)
FERC did a regression analysis, and found
that there is a correlation between spot and forward
energy prices. This covers both gas and
electricity, (19, pp. V-1-9)
It is theoretically possible to manipulate long-term prices by manipulating
short-term prices. (19, p. V-18)

Mara Hemminger Page 97 10/22/2005
97
FERC's Info Need 3a (IN3a)
FERC's Data Request 3 (DR3)
Companies' Replies
IN3 Evidence: By Manipulating Physical and
Financial Markets
IN3 Evidence: Through Washes
IN3 Evidence: By Influencing Index
Prices
IN3 Evidence: Other
FERC's Conclusions
Whether these unreasonable long-term rates resulted
from Enron's intentional
manipulation of the physical and
financial energy markets.
Asks Enron for unspecified informationabout Enron's physical
and financial transactions, EOL, and information "controlled by Enron Corp. and its
affiliates and subsidiaries".
(3/15/02 FERC subpoena to Enron)
(39)
Enron sends summarized information from its EPMI subsidiary.
Also a dump of EOL data.
Enron took losses on physical gas sales on EOL, but made profits
in related financial ((forward)) markets
((through price manipulation)).
(Analysis of EOL data. Sell gas slowly ->
small price decrease. Buy gas back quickly -> large price increase. That causes gas- price
increases on NYMEX;Enron then
sells here.) (19) p. X-2
Enron did purposefully manipulate the gas
physical energy market, in order to make a profit on
the financial energy market.
Analysis of EOL data shows that Reliant also manipulated trading on
the physical gas market (through
churning), in order to gain money on the
financial gas market. (19, p. II-3) Since
Reliant used EOL for this manipulation,
Enron was automatically party to
the transaction.
FERC's Info Need 3a (IN3a)
FERC's Data Request 7 (DR7)
Companies' Replies
IN3 Evidence: By Manipulating Physical and
Financial Markets
IN3 Evidence: Through Washes
IN3 Evidence: By Influencing Index
Prices
IN3 Evidence: Other
FERC's Conclusions
Whether these unreasonable long-term rates resulted from wash trades that Enron either engaged in, or
enabled via EOL.
Asks all companies to provide all
communications or correspondence,
including email , IM, and phone logs,
between themselves and any other
company regarding the trading practices
outlined in the 2000 Enron memo.
(5/08/02) (20)
Presumably the appropriate data dumps.
Internal Enron memo described the same
hypothetical strategy for manipulating
physical gas markets in order to make
money in financial markets, that Enron
later enacted on EOL. (19, p. IX-2)
Enron did purpusefully manipulate the physical gas market, in order to make a profit on the
financial energy market. (19, pp. IX-1-2)

Mara Hemminger Page 98 10/22/2005
98
FERC's Info Need 3b (IN3b)
FERC's Data Request 1 (DR1)
Companies' Replies
IN3 Evidence: By Manipulating Physical and
Financial Markets
IN3 Evidence: Through Washes
IN3 Evidence: By Influencing Index
Prices
IN3 Evidence: Other
FERC's Conclusions
Whether these unreasonable long-term rates resulted from wash trades that Enron either engaged in, or
enabled via EOL.
Asks Enron to supply, as contract copies and
in tabular form, information about its
contracts for wholesale electricity sales and
purchases (to include ancillary services) and retail sales throughout the U.S. ?which it has defaulted on, canceled,wound down, cashed
out, or otherwise terminated early. (2/15/02) (37)
Enron provides hard-copy and PDF copies (on
CD) of some of these contracts, and lists of
other contracts that fall within the scope of the request. Most of these
contracts were terminated early
because of Enron's financial condition.
(3/01/02) (67)
The information contained in the replies to this DR
were insufficient to ascertain washes.
The information contained in the replies to this DR
were insufficient to ascertain washes.
FERC's Info Need 3b (IN3b)
FERC's Data Request 2 (DR2)
Companies' Replies
IN3 Evidence: By Manipulating Physical and
Financial Markets
IN3 Evidence: Through Washes
IN3 Evidence: By Influencing Index
Prices
IN3 Evidence: Other
FERC's Conclusions
Asks all sellers for dates, quantities, average prices,
counterparty of short-term (weekly),
monthly, and long-term (yearly) firm and
non-firm energy contracts. Also asks
for indication of whether those sales went physical or not. (3/05/02) (38) This
request does not specify gas or
electricity.
Enron provides confidential reports
reflecting short-term transactions and long-term contracts of Enron Power Marketing, Inc (EPMI) (4/26/02) (62)
Also provides confidential
spreadsheets of EPMI info, and confidential
electronic copies of long-term contracts.
(4/26/02) (65) Enron also indicates that its 3/22/02 provision of access to the Enron Physical Transaction
Database (EPTD) covers these sales as well.
(4/02/02) (66) Enron's lawyers provide a map to the EPTD (4/2/02)
(68) Others presumably also provide
this info.
Data was insufficient for FERC to ascertain
washes, sell/buybacks, or
roundtrips. (5/21/02) (22) So, FERC placed
DR10.
Data was insufficient for FERC to ascertain washes,
sell/buybacks, or roundtrips. (5/21/02) (22) So, FERC placed
DR10.

Mara Hemminger Page 99 10/22/2005
99
FERC's Info Need 3b (IN3b)
FERC's Data Request 3 (DR3)
Companies' Replies
IN3 Evidence: By Manipulating Physical and
Financial Markets
IN3 Evidence: Through Washes
IN3 Evidence: By Influencing Index
Prices
IN3 Evidence: Other FERC's Conclusions
Asks Enron for information about
Enron's physical and financial transactions, EOL, and information "controlled by Enron
Corp. and its affiliates and subsidiaries". (3/15/02 FERC
subpoena to Enron) (39)
Enron sends summarized information from its EPMI subsidiary.
Also a dump of EOL data.
FERC analysis of EOL data found that wash
trading was commonplace in the
gas and electric markets (19, pp. VI-6-9) on EOL. (19), p. VII-14 FERC also
found, though analysis of EOL data, that Enron washed in the gas and electricity markets. (19) p. VII-
1&15
Enron washed in the short-term and long-term gas
and electric markets. (19, p. VII-8) Other companies
also washed in the gas and electric markets, on
EOL. (19, p. VII-1) Wash trades in electricity and gas led to skewed price index. Possibly also led to increased ((forward))
prices, because the market appears to be more liquid than it is.
FERC's analysis of EOLshowed that Reliant (and Enron, as the
counterparty) churnedin the gas market, especially at the
Topock trading hub. This led to an increase
in gas index prices. (19, p. II1-3)
Enron and Reliant's churning in the short-term
gas market led to increased gas index
prices, which can in turn lead to increased long-
term prices. (19, p. III-19)
FERC's Info Need 3b (IN3b)
FERC's Data Requests 10-11
(DR10-11)Companies' Replies
IN3 Evidence: By Manipulating Physical and
Financial Markets
IN3 Evidence: Through Washes
IN3 Evidence: By Influencing Index
Prices
IN3 Evidence: Other
FERC's Conclusions
Asks all gas (26), electric, and ancillary-service (22) sellers for
an affidavit stating whether they had engaged in wash,
round-trip, or sell/buyback activities.
(5/21/02) (22) (5/22/02) (26)
Presumably said affidavits.
Several companies (including Enron)
admitted to washing. (19) p. VII-1 FERC believes EOL was a popular platform for
washes.
Several companies washed in the gas and
electric markets. EOL was a popular platform. (19, p.
VII-8)

Mara Hemminger Page 100 10/22/2005
100
FERC's Info Need 3b (IN3b)
FERC's Data Request 12 (DR12)
Companies' Replies
IN3 Evidence: By Manipulating Physical and
Financial Markets
IN3 Evidence: Through Washes
IN3 Evidence: By Influencing Index
Prices
IN3 Evidence: Other FERC's Conclusions
FERC says it will send two IT specialists to
Enron's Houston office, since Enron only
partially answered DR8. (4/18/02) (42)
(N/A)
FERC's Info Need 3c (IN3c)
FERC's Data Requests 10-11
(DR10-11)Companies' Replies
IN3 Evidence: By Manipulating Physical and
Financial Markets
IN3 Evidence: Through Washes
IN3 Evidence: By Influencing Index
Prices
IN3 Evidence: Other FERC's Conclusions
Whether these unreasonable long-term rates resulted
from energy marketers'
misrepresenting sales data to the
publishers of price indices.
Asks all gas (26), electric, and ancillary-service (22) sellers for
an affidavit stating whether they had engaged in wash,
round-trip, or sell/buyback activities.
(5/21/02) (22) (5/22/02) (26)
Presumably said affidavits.
Many companies (not Enron) admitted to providing false sales
data to the publishers of gas indices. (19, p.
I-18; III-4&5) Relatedly, many
traders admitted using EOL for price discovery
in gas; this helped them fabricate prices
and volumes that looked realistic. (19,
pp. III-16&22)
Several companies did provide false gas sales
prices and volumes to the index publishers. (19, pp.
III-4&15) This would affect forward prices. (19,
p. I-18)
FERC's Info Need 3c (IN3c)
FERC's Data Requests 13-17
(DR13-17)Companies' Replies
IN3 Evidence: By Manipulating Physical and
Financial Markets
IN3 Evidence: Through Washes
IN3 Evidence: By Influencing Index
Prices
IN3 Evidence: Other FERC's Conclusions
Asks several index publishers how forward
electric and natural gas price info that was
disseminated to the public was collected and forwarded from
1/1/2000-2001. (4/11/02 - 5/23/02) (23, 24, 27, 28, 41)
Letters replying to FERC's specific
questions.
Some delivery points (e.g. Topock, where churning happened)
were more significant than others in
determining inde, Some publishers used bid/offer vs. trade datato determine forward prices. (64) Index-setters did not verify
their data.
Gas publisher's poor sampling procedures may have led to undetected
errors in setting the index prices. (19, p. III-1)

Mara Hemminger Page 101 10/22/2005
101
FERC's Info Need 3c (IN3c)
FERC's Data Requests 13-17
(DR13-17)Companies' Replies
IN3 Evidence: By Manipulating Physical and
Financial Markets
IN3 Evidence: Through Washes
IN3 Evidence: By Influencing Index
Prices
IN3 Evidence: Other FERC's Conclusions
Asks several index publishers to what
extent they used EOL to develop their price indices. (4/11/02 -
5/23/02) (23, 24, 27, 28, 41)
Letters replying to FERC's specific
questions.
Some gas index-setters used EOL data
exclusively to understand prices and volumes of gas sales. This made the indices
EOL-biased. Also, Enron gave indexers only weighted sales
averages, so who can tell if that data was
correct?
EOL was a popular gas price-discovery tool for
those index-setters. This may have led to
undetected errors in the publishers' setting of index
prices.
Asks several index publishers to what extent they were
aware that traders used EOL to discover
their prices. (4/11/02 - 5/23/02) (23, 24, 27,
28, 41)
Letters replying to FERC's specific
questions.

Mara Hemminger Page 102 10/22/2005
Appendix B: Possible Email Questions The original intent behind this research was to learn what questions FERC asked of the Enron email dataset during PA02-2-000, what the answers were, and how FERC arrived at those answers. Therefore, the author has included in this Appendix (and Appendix C) a list of hypothesized investigation-related questions that might have been posed of the email dataset. Hopefully that will be of interest to other researchers interested in the problem of question-answering within large email datasets. Note: The part of this list shown in black print contains questions whose answers the author suspects might exist in the Enron email corpus, as FERC or other sources did find some answers there. The part of this list in blue contains questions to which the author expects no answers exist in the email corpus, simply because FERC found the answers in other (non-email) sources. Very general questions about the emails’ metadata and contents Enron as SC
1) Did Enron exchange emails in this dataset when it acted as an SC (“Enron-the-SC”)? (See Appendix D for the names of Enron’s subsidiaries that acted as SCs.)
2) What email addresses did Enron-the-SC use? 3) What did the content of Enron-the-SC’s emails look like? 4) Did utility companies exchange emails with Enron-the-SC in this dataset? 5) Who were Enron-the-SC’s utility customers? 6) What were the email addresses of Enron-the-SC’s utility customers? 7) What did the contents of these utility companies’ emails look like?
(modeling) 8) Did generators exchange emails with Enron-the-SC in this dataset? 9) Who were Enron-the-SC’s generator customers? 10) What were the email addresses of Enron-the-SC’s generator customers? 11) What did the contents of generators’ emails look like? (modeling) 12) Did the ISO exchange emails with Enron in this dataset? 13) What were the email addresses of the ISO? 14) What did the contents of the ISO’s emails look like? (modeling) 15) Did the PX exchange emails with Enron in this dataset? 16) What were the email addresses of the PX? 17) What did the contents of the PX’s emails look like? (modeling)
Other SCs
18) Did other SCs emails appear in this dataset? (See Appendix D for a list of the other SCs.)
19) What were those SCs’ emails? 20) Did Enron have many email exchanges with these other SCs?
102

Mara Hemminger Page 103 10/22/2005
Enron as Generator 21) Did Enron-the-generator exchange emails in this dataset? 22) Did Enron own more than the Portland General Electric generating plant? 23) Did Enron own a generating plant in California (Enron-as-CA-generator)? 24) What email addresses did Enron use when it acted as a generator?
Enron as EOL-Owner
25) Did Enron-the-EOL-owner exchange emails in this dataset? 26) What email addresses did Enron use as the owner/runner of EOL?
Enron-as-Marketer
27) Did Enron-the-marketer exchange emails in this dataset? 28) What email addresses did Enron use as an energy “marketer”? 29) Did Enron-the-marketer exchange emails with the following EPMI customers:
o El Paso Electric o Valley Electric (yes) o Glendale (yes) o Enron Energy Services
30) Portland Shift, who are you? o What was the Portland shift, and what did it do? (It sounds like it was
a physical market (PX/ISO) trading desk, possibly where Timothy Belden worked.)
o What email addresses did the Portland shift use? (Looks like it used an alias, and only received emails from this alias.)
o Who was on the Portland shift? o Does any other email group/alias resemble the Portland shift?
Note 1: Two known Enron traders (who happened to engage in illicit trading practices) were:
• Timothy Belden of Enron’s West Power Trading Division in Portland, Oregon (17, p. 1)102. Belden used the “Silverpeak” line to force congestion payments from the ISO. (Silverpeak was an intertie located in the Nevada desert, in a town named Silverpeak. It could carry only 15 megawatts.) (18, p. 1)
• Jeffrey Richter, the manager of the Short-Term California trading desk (unknown location or subsidiary) in 2000. Sometime after FERC’s Initial Report was released, Richter pleaded guilty to submitting false information to the Cal ISO for trades in the spot electricity and ancillary services markets. (19, p. VI-19)
Note 2: Enron Power Marketing, Inc. (EPMI), Enron Energy Services, Inc. and Enron Energy Marketing Corporation all appear to have conducted short-term and long-term marketing services for Enron. This observation is based on the fact that Enron submitted 102 Another source calls Belden one of Enron’s energy traders at Portland General (an Oregon utility that Enron had bought). (11, p. 6) Another source does not name Belden, but describes an Enron employee who conducted the exact same activities. This employee worked on the “Portland shift.” (19, p. VI-27) (Portland shift sounds like one of the email aliases in the Enron email dataset.)
103
Mara Hemminger Page 104 10/22/2005
information for all three of these subsidiaries in its reply to FERC’s data request 2 (DR2). (DR2 asked Enron to submit information about its short-term and long-term sales. Enron replied with data from these three subsidiaries.) (38, pp. 1-2, plus personal analysis.) Specific questions about practices outlined in IN1 / the infamous internal Enron memos: Question: Did Enron engage in Fat Boy/Inc’ing or Thin Man/Dec’ing for a profit? (i.e. Did Enron-the-SC schedule extra demand when the PX price was high, or less demand when the PX price was low?)
1) Did Enron-the-SC get information about expected demand from the utility companies it represented via email?
2) If Enron-the-SC did indeed receive information about expected demand from its represented utility companies, when would it typically receive that information? The day of the day-ahead market scheduling; the day before that; weekly; monthly; seasonally; annually?
3) Did Enron-the-SC tell the utility companies it represented how much demand Enron planned to schedule through the ISO for the day-ahead energy market?
4) Did the utility companies ever second-guess Enron-the-SC’s scheduled demand for the day-ahead market? (This could lead to accusations of the utilities’ complicity / being an accomplice in over/underscheduling demand.)
5) Did Enron-the-SC get information about available supply (from the generators it represented) via email?
6) Did Enron-the-SC tell the generators it represented how much energy supply Enron planned to schedule through the ISO for the day-ahead market?
7) Did the generators ever second-guess Enron-the-SC’s scheduled demand for the day-ahead market? (This could lead to accusations of the generators’ complicity / being an accomplice in over/underscheduling supply.)
8) Did Enron-the-SC send its day-ahead schedules to the ISO via email? 9) Did the ISO confirm Enron-the-SC’s day-ahead schedules via email? 10) Are there threads of email between Enron-the-SC, the utility companies it
represented, and the ISO that indicate that there was a greater or lesser demand (from the utilities) for energy on a certain day than what Enron told the ISO it actually needed in its day-ahead schedule? Note that these emails would likely occur within a short time interval, depending on the cadence of emails between Enron and its represented utility companies (see 2) above).
11) Is there evidence in email that Enron-the-SC made money (for itself and the generators it represented) by overstating or understating demand in the schedules it submitted to the ISO?
12) Is there evidence in email that the ISO ever knew that Enron was misrepresenting demand in its schedule? (See 19, p. 25. An unnamed Cal-ISO report described how the ISO ignored the false information contained in Enron’s and other SCs’ schedules. FERC suspects that this means that the ISO may have been aware of
104

Mara Hemminger Page 105 10/22/2005
the IOU’s false underscheduling of demand, and of Enron et. al.’s counterbalancing overscheduling of demand.)
13) Is there email evidence that the Cal-ISO helped generators/SCs engage in Fat Boy practices? (See 19, pp. VI-23&24. This states that “some respondents” (e.g. Reliant) had told FERC Staff during FERC’s investigation that the Cal-ISO actually helped them enact the Fat Boy strategy by providing them with artificial or simulated load and delivery points. This was so they could submit a “balanced” schedule. It sounds like only one known ISO employee was engaged in this practice.)
Question: Did Enron engage in Energy Export for a profit? (I.e. Did Enron-the-SC or Enron-the-CA-generator avoid selling energy on the CA market in order to sell it outside of CA for a profit?)
1) Are there threads of email between Enron-the-SC, the utility companies it represented, and the ISO that indicate that there was a greater or lesser demand (from the utilities) for energy on a certain day than what Enron told the ISO it actually needed in its day-ahead schedule? Note that these emails would likely occur within a short time interval, depending on the cadence of emails between Enron and its represented utility companies?
2) Did out-of-state marketers or utility companies exchange emails with Enron-the-SC or Enron-the-CA-generator in this dataset?
3) Did out-of-state marketers or utilities buy energy from Enron-the-SC or Enron-the-CA-generator via email in this dataset?
4) Are there threads of email between Enron-the-SC (or Enron-the-CA-generator), the California ISO, and an out-of-state marketer (or out-of-state utility, or out-of-state ISO) that indicates that Enron scheduled some energy for sale on the Californian day-ahead (PX) market through the California ISO for one price (to meet its schedule), while also selling some energy out-of-state for a higher price (possibly to make a profit)?
5) Are there threads of email between Enron-the-SC and the California ISO indicating that the ISO subsequently had insufficient supply in the real-time market to meet true demand? (This might indicate that Enron purposefully underscheduled demand in the Californian day-ahead market, so that it might sell some energy out-of-state for a higher price.)
Question: Did Enron engage in Energy Re-import / Ricochet / Megawatt Laundering for a profit? (I.e. Did Enron-the-SC or Enron-the-marketer buy energy on the day-ahead (PX) market, and then sell that energy to another company (a marketer?) for a fee. Or, did Enron-the-SC or Enron-the-marketer buy that second-sale energy with the expectation that it would be able to sell that energy on the real-time (ISO) market for a higher price? Relatedly, did Enron-the-SC/marketer avoid selling energy on the CA market in order to sell it outside of CA for a profit?
105

Mara Hemminger Page 106 10/22/2005
Author’s personal observation: Enron’s generator/utility company in Oregon - Portland General Electric - would be a likely out-of-state culprit for Enron-the-SC to sell CA energy to, and/or re-import energy back from, for a profit.
1) Did Enron-the-SC communicate with Portland General Electric via email? 2) What email address/es did Portland General Electric use? 3) Did other out-of-state utilities communicate with Enron-the-SC via email? 4) What were those utilities’ email addresses? 5) Did Enron-the-SC communicate with out-of-state generators via email? 6) What were those out-of-state generators’ email addresses? 7) Is there evidence in email that Enron sold energy to an out-of-state entity, in
hopes that that entity could subsequently resell that energy to the California market for a profit? (And that that profit was to be shared with Enron.)
Question: Did Enron engage in Forced Congestion Payments schemes? (I.e. Did Enron overschedule and then send energy over constrained ties in order to get congestion payments?)
1) Did Enron-the-SC pass information via email indicating that it knew what the loads were for any ties/interties?
2) Were the capacities for ties/interties ever passed via email? What were they? 3) Did Enron-the-SC ever send its schedules to the ISO via email? 4) Did the ISO ever indicate via email that a schedule that Enron had submitted
would overload a constrained tie/intertie? 5) Did the ISO indicate to Enron-the-SC via email that it would pay Enron-the-SC a
congestion payment not to send energy over a constrained tie/intertie, or to send the energy in the opposite direction (send a counterflow)?
6) Did Enron ever directly admit via email that it was scheduling too much energy over a tie/intertie?
7) Is there an email thread which would indicate that Enron knowingly and willingly scheduled too much energy over a tie/intertie in order to get a congestion payment?
Note: Jeffrey Richter, an Enron employee and the manager of the Short-Term California trading desk in 2000, pleaded guilty to using congestion payment and ancillary services fraud schemes. (19, pp. VI-19-20) It is therefore possible that some email evidence might bear his name.
Question: Did Enron engage in “Scheduling Energy to Collect Congestion Charge II”? (I.e. Did Enron schedule a counterflow for energy it did not actually have, not send that energy, pay a penalty for not sending that energy, and still get a congestion charge for scheduling the counterflow to start with?)
1) All of the questions from Forced Congestion Payments above. 2) Did Enron indicate via email that it was scheduling energy it did not possess?
106

Mara Hemminger Page 107 10/22/2005
3) Did Enron-the-SC indicate via email that it was scheduling energy it did not possess, in order to collect congestion payments? This would probably contain some discussion of how much the congestion payment would be, versus how much Enron-the-SC would be charged for not delivering the energy (i.e. what the ISO real-time price was, multiplied by how much energy Enron-the-SC would not be sending).
Question: Did Enron engage in the Sale of Fake Ancillary Services? (Get Shorty or Selling Non-Firm Energy as Firm) (I.e. Did Enron-as-SC/Generator sell energy that it did not possess to the ISO as firm reserve energy? It sounds like this firm energy was typically sold on the day-ahead market.)
1) Does Enron indicate in its emails which generator/s it used to provide firm energy?
2) What were the email addresses of the generator/s that Enron used to provide firm energy?
3) Did Enron act as an SC or a generator in this capacity? 4) Which email addresses did Enron use in this capacity? 5) Did the ISO negotiate contracts with Enron via email to provide this firm energy? 6) Did Enron ever admit/indicate in email that it was scheduling firm energy that it
did not have? 7) Did Enron ever reveal via email how much money it was making by scheduling
firm energy that it did not have?
Note: Jeffrey Richter, an Enron employee and the manager of the Short-Term California trading desk in 2000, pleaded guilty to using congestion payment and ancillary services fraud schemes. (19, pp. VI-19-20)
~~~~~~~~~~~~’ Specific questions about practices outlined in IN2: Did Enron otherwise exercise undue influence over wholesale prices? General questions:
1) Did Enron-the-EOL-owner use email? 2) What were Enron-the-EOL-owner’s email addresses? 3) Who were the Enron-the-EOL-marketers? (The author suspects EPMI.) 4) Did Enron-the-EOL-marketer use email? 5) What were Enron-the-EOL-marketer’s email addresses?
Question: Will the real EOL sales price please stand up?
1) Did Enron-the-EOL-owner ever reveal the final forward sales price via email? 2) Did Enron-the-EOL-owner ever reveal the final forward sales volume via email? 3) Did Enron-the-EOL-owner ever reveal the final forward sales date/time via
email?
107

Mara Hemminger Page 108 10/22/2005
4) Did Enron-the-EOL-owner ever reveal, via email, that it had misrepresented sales’ bid/offer prices, volumes, or times on EOL?
5) Is there other email evidence that the sales prices, volumes, or dates posted on EOL were different than the actual prices, volumes, or dates?
~~~~~~~~~~~~’ Specific questions about practices outlined in IN3: Did any of Enron’s activities result in unjust long-term power rates? Question: Did Enron engage in wash trades?
1) Did Enron-the-EOL-marketer use email? 2) What were Enron-the-EOL-marketer’s email addresses? 3) Did Enron-the EOL-marketer talk with non-Enron EOL marketers via email? 4) What were the email addresses of these other EOL marketers? 5) Did Enron-the-EOL-marketer arrange for wash trades with other EOL marketers
via email? Note: Pre-arranging wash trades would likely involve setting a day and timeframe for selling, and a price range that is acceptable to both parties. Question: Did Enron marketers on EOL and NYMEX coordinate their sales/purchases so that Enron-the-corporation could make money on NYMEX by manipulating the sales price on the EOL market?
1) Did Enron-the-NYMEX-market-player use email to discuss its transactions? 2) What were the email addresses of Enron-the-NYMEX-market-player? 3) Who were the Enron-the-EOL-marketers? 4) Did Enron-the-EOL-marketers use email? 5) What were Enron-the-EOL-marketers’ email addresses? 6) Did Enron-the-EOL-marketers indicate via email that they planned to sell energy
on EOL slowly, and then buy it back quickly in the same day? 7) Was there an email thread indicating that Enron-the-EOL-marketers and Enron-
the-NYMEX-marketers planned to coordinate their energy sales/purchases? 8) Was there an email thread indicating that Enron-the-NYMEX-marketers planned
to make money on the NYMEX based on the trades conducted on EOL by Enron-the-EOL-marketers?
~~~~~~~~~~~~’ Specific Questions That Are Unrelated to the PA02-2-000 Investigation Question: How nasty was Enron to its employees in the 401K scam?
1) Did Enron-the-corporation/HQ communicate with Arthur Anderson (Enron’s accounting firm) via email?
2) What email addresses did Enron’s “big guys” (president, CEO, etc.) use?
108

Mara Hemminger Page 109 10/22/2005
3) What email addresses did Arthur Anderson use when communicating with Enron? With Enron’s “big guys”?
4) When did the Enron “big guys” (president, CEO, etc.) know that Enron’s stocks were tanking?
5) Juxtapose the date in 4) above with the date that Enron publicly announced it had actually been losing money since 1999. (That announcement came sometime during/after the third quarter of 2001.) (48, p. 67).)
6) Did Enron-the-corporation encourage its employees to hold on to their 401K stock options, via email?
7) If the answer to 6) is Yes, when did Enron-the-corporation encourage its employees to hold on to their 401K stock options, via email?
8) Did the Enron “big guys” indicate in emails to each other (or to anyone else) that they planned to sell their Enron stocks early?
9) If the answer to 8) is Yes, when did the “big guys” plan to sell their stocks? 10) Is there a difference between the dates in 7) and 9)? 11) Is there evidence/admissions in email that the Enron “big guys” sold their Enron
stocks for a profit, before Enron tanked, while still encouraging their employees to hold on to those same stocks?
Note: There are accusations that Enron’s top executives started selling their holdings while Enron’s stocks still looked good, despite the company’s actual business losses. At the same time, they evidently encouraged their employees to hold on to their own stock options, much of which constituted the employees’ 401K retirement plans. Soon, Enron’s stock tumbled. (100, Ch. 20 & 21) The authors of The Smartest Guys in the Room cite several sources, including email (100, pp. 366-367), as evidence of this deception.
109

Mara Hemminger Page 110 10/22/2005
Appendix C: Possible TREC Topics One of the goals of this paper and its associated research was to create a list of “TREC-like” questions that could be posed of the Enron email dataset. This is probably a confusing statement to any reader not familiar with current information-retrieval research efforts. By way of explanation: TREC stands for the “Text REtrieval Conference.” This is actually a series of annual (117) conferences sponsored by the National Institute of Standards and Technology (NIST) and several U.S. Department of Defense research centers. (116) These conferences began in the late 1990’s as part of an umbrella attempt to advance state-of-the-art technologies for text handling - such as text retrieval, summarization, and the extraction of factual information from documents. (117) TREC was specifically geared towards researching text retrieval methods against large test collections. (118) For each TREC conference, NIST provides a test collection (a set of documents from one data source), a set of topics (questions that can be posed of that collection), and relevance judgments (an annotation of whether a given document answers a given question or not). (118, 199) TREC participants develop their own retrieval systems, which they run against this dataset. They then give NIST a list of their top-ranked retrieved documents. Finally, NIST judges the retrieved documents for correctness, and evaluates the results. (118) One of the possible outcomes of these conferences is an assessment of which retrieval system and/or which methodology performs the best. (119) What follows is the author’s attempt to isolate some of the questions in Appendix B, and turn them into TREC topics. They can be run against any publicly available dataset of Enron emails.103 (That dataset would equate to a TREC test collection.) There are currently no relevance judgments for these topics and this collection, but that is the subject of follow-on research at the University of Maryland. Note 1: The suggestions on computer queries were made assuming that any indexing done on this dataset would not include stemming. If stemming were done, then many of these queries can be simplified - for example, by getting rid of plurals. Note 2: An asterisks (*) represents a wildcard symbol. Note 3: The questions are broken down based on the various roles that Enron played in California’s energy market. To any aspiring designers of information-retrieval systems for specifically the Enron email dataset, the author would suggest breaking the Enron email dataset down into “roles,” and then searching for answers/evidence within those role realms. That prevents looking through the entire dataset for evidence of a scheme that Enron used only while it played a certain role.
103 There are various versions of the Enron email dataset. The original dataset (minus emails that FERC has redacted, due to privacy concerns) can be obtained from Aspen, FERC’s information management contractor for the Enron investigation. (120) Carnegie Mellon University offers a revised dataset, which corrects some of the integrity problems found in the original dataset. This can be found here: http://www.cs.cmu.edu/~enron/. (121)
110

Mara Hemminger Page 111 10/22/2005
Enron as Marketer TREC Topic Number: 1 Title: Marketers or Traders of Electricity on the Financial Market Description: Identify Enron employees who bought and sold electricity on California’s financial (long-term sales) energy market, solely for the purpose of re-buying/re-selling this energy later for a profit. Narrative: A relevant document must at a minimum identify the name and email address of the marketer, as well as the Enron subsidiary to which he/she belonged. The marketer’s phone number would be helpful as well, to help analysis of the corresponding Enron voice dataset. Hint: Enron Power Marketing, Inc. (EPMI), Enron Energy Services, Inc. and Enron Energy Marketing Corporation all appear to have conducted long-term marketing services for Enron. This observation is based on the fact that Enron submitted information for all three of these subsidiaries in its reply to FERC’s data request 2 (DR2). (DR2 asked Enron to submit information about its short-term and long-term sales. Enron replied with data from these three subsidiaries.) (38, pp. 1-2, plus personal analysis.) It would be good, however, to know for sure which entities or persons did marketing at Enron. Query Possibilities:
• (marketer or marketers or “Enron Power Marketing” or EPMI or “Enron Energy Services” or “Enron Energy Marketing Corporation”)
• (marketer or marketers or “Enron Power Marketing” or EPMI or “Enron Energy Services” or “Enron Energy Marketing Corporation”) and (MW or KW or watt* or MwH or KwH)
o This is to target electricity sales rather than natural gas sales. All the subsequent electricity queries can be similarly modified.
• (marketer or marketers or EPMI) and (short or long) o As in have a long or short position in sales/purchases.
• (marketer or marketers or EPMI) and (NYMEX or CBOT or “Mid-Columbia” or COB or “California-Oregon Border” or “Four Corners” or “Palo Verde” or EOL)
o The electricity futures hubs were Mid-Columbia, COB, Four Corners, and Palo Verde, as best the author can tell. (85) NYMEX and CBOT ran these. (89; 15, p. 78)
o EOL was the forward market trading place. (36, p. 3) ~~~~~~~~~~~~~~~~~~~~~~’
111

Mara Hemminger Page 112 10/22/2005
TREC Topic Number: 2 Title: Marketers or Traders of Electricity on the Physical Market Description: Identify Enron employees who bought and sold electricity on California’s physical (short-term sales) energy market, solely for the purpose of re-buying/re-selling this energy later, for a profit. Narrative: A relevant document must at a minimum identify the name and email address of the marketer/trader, as well as the Enron subsidiary to which he/she belonged. The marketer’s phone number would be helpful as well, to help analysis of the corresponding Enron voice dataset. Hints: 1) Two known physical-market Enron traders (who happened to engage in illicit trading practices) were:
• Timothy Belden of Enron’s West Power Trading Division in Portland, Oregon. (17, p. 1104) Belden used the “Silverpeak” line to force congestion payments from the ISO. (Silverpeak was an intertie located in the Nevada desert, in a town named Silverpeak. It could carry only 15 megawatts.) (18, p. 1)
• Jeffrey Richter, the manager of the Short-Term California trading desk (unknown location or subsidiary) in 2000. Sometime after FERC’s Initial Report was released, Richter pleaded guilty to submitting false information to the Cal ISO for trades in the spot electricity and ancillary services markets. (19, p. VI-19)
2) Enron Power Marketing, Inc. (EPMI), Enron Energy Services, Inc. and Enron Energy Marketing Corporation all appear to have conducted short-term marketing services for Enron. This observation is based on the fact that Enron submitted information for all three of these subsidiaries in its reply to FERC’s data request 2 (DR2). (DR2 asked Enron to submit information about its short-term and long-term sales. Enron replied with data from these three subsidiaries.) (38, pp. 1-2, plus personal analysis.) It would be good, however, to know for sure which entities or persons did marketing at Enron. Query Possibilities:
• (marketer or marketers or trader or traders) • (marketer or marketers or trader or traders) • (marketer or marketers or trader or traders) and (“Enron Power Marketing” or
EPMI or “Enron Energy Services” or “Enron Energy Marketing Corporation”)
104 Another source calls Belden one of Enron’s energy traders at Portland General (an Oregon utility that Enron had bought). (11, p. 6) Another source does not name Belden, but describes an Enron employee who conducted the exact same activities. This employee worked on the “Portland shift.” (19, p. VI-27) (Portland shift sounds like one of the email aliases in the Enron email dataset.)
112

Mara Hemminger Page 113 10/22/2005
• (marketer or marketers or trader or traders) and (“Enron Power Marketing” or EPMI or “Enron Energy Services” or “Enron Energy Marketing Corporation”) and (MW or KW or watt* or MwH or KwH)
o This is to target electricity sales rather than natural gas sales. All the subsequent electricity queries can be similarly modified.
• (marketer or marketers or trader or traders) and (“Enron Power Marketing” or EPMI or “Enron Energy Services” or “Enron Energy Marketing Corporation”) and (ISO or PX)
~~~~~~~~~~~~~~~~~~~~~~’
Enron as Scheduling Coordinator (SC) TREC Topic Number: 3 Title: Scheduling Coordinator (SC) Description: Determine whether or not Enron exchanged emails in this dataset when Enron acted as a Scheduling Coordinator (SC). (Enron was an SC: 19, p. VI-23) An SC submitted electricity demand/supply schedules to the California ISO for the electricity day-ahead market. The SC did this (for a fee) on behalf of other generators/distributors/marketers. (32, pp. 28-70) Narrative: A relevant document must at a minimum be a document from Enron in which Enron discusses electricity schedules for the day-ahead market. Ideally, the document would also identify the name and email address of the Scheduling Coordinator, as well as the Enron subsidiary to which he/she belonged. The Scheduler’s phone number would be helpful as well, to help analysis of the corresponding Enron voice dataset. Hint: The author suspects that Enron’s short-term marketers might also have worked as SCs. EPMI and Enron Energy Services acted as Enron SCs, according to Appendix D (96). At the same time, EPMI, Enron Energy Services, Inc. and Enron Energy Marketing Corporation acted as marketing entities for Enron. There is a significant overlap there. Query Possibilities:
• “scheduling coordinator” or SC • ISO • (“scheduling coordinator” or SC) and schedule • (“scheduling coordinator” or SC) and ISO • “scheduling coordinator” or SC) and schedule and ISO • (“scheduling coordinator” or SC) and (MW or KW or watt* or MwH or KwH) • (“scheduling coordinator” or SC) and (MW or KW or watt* or MwH or KwH)
and schedule and ISO ~~~~~~~~~~~~~~~~~~~~~~’
113

Mara Hemminger Page 114 10/22/2005
TREC Topic Number: 5 Title: Scheduling Coordinator (SC) and Generators Identify employees at generating plants whom Enron represented in its role as a Scheduling Coordinator (SC). An SC submitted electricity demand/supply schedules to the California ISO in the electricity day-ahead market. The SC did this (for a fee) on behalf of other generators/distributors/marketers. Narrative: A relevant document must at a minimum identify the name and email address of the employee at the generating plant which Enron represented. The generator-employee’s phone number would be helpful as well, to help analysis of any corresponding voice datasets. Note that this topic could be answered by any hits against the previous topic as well. Hint: The author wonders if Enron’s short-term marketers might also have worked as SCs. EPMI and Enron Energy Services acted as Enron SCs, according to Appendix D (96). At the same time, EPMI, Enron Energy Services, Inc. and Enron Energy Marketing Corporation acted as marketing entities for Enron. There is a significant overlap there. Query Possibilities:
• “scheduling coordinator” or SC • ISO • (“scheduling coordinator” or SC) and schedule • (“scheduling coordinator” or SC) and ISO • “scheduling coordinator” or SC) and schedule and ISO • (“scheduling coordinator” or SC) and (MW or KW or watt* or MwH or KwH) • (“scheduling coordinator” or SC) and (MW or KW or watt* or MwH or KwH)
and schedule and ISO ~~~~~~~~~~~~~~~~~~~~~~’ TREC Topic Number: 6 Title: Scheduling Coordinator (SC) and ISO Identify employees at the ISO with whom Enron dealt when Enron acted in its role as a Scheduling Coordinator (SC). An SC submitted electricity demand/supply schedules to the California ISO in the electricity day-ahead market. The SC did this (for a fee) on behalf of other generators/distributors/marketers. Narrative: A relevant document must at a minimum identify the name and email address of the employee at the ISO with whom Enron-the-SC dealt. The ISO-employee’s phone
114

Mara Hemminger Page 115 10/22/2005
number would be helpful as well, to help analysis of any corresponding voice datasets. Note that this topic could be answered by any hits against the previous topic as well. Hint: The author wonders if Enron’s short-term marketers might also have worked as SCs. EPMI and Enron Energy Services acted as Enron SCs, according to Appendix D (96). At the same time, EPMI, Enron Energy Services, Inc. and Enron Energy Marketing Corporation acted as marketing entities for Enron. There is a significant overlap there. Query Possibilities:
• “scheduling coordinator” or SC • ISO • (“scheduling coordinator” or SC) and schedule • (“scheduling coordinator” or SC) and ISO • “scheduling coordinator” or SC) and schedule and ISO • (“scheduling coordinator” or SC) and (MW or KW or watt* or MwH or KwH) • (“scheduling coordinator” or SC) and (MW or KW or watt* or MwH or KwH)
and schedule and ISO ~~~~~~~~~~~~~~~~~~~~~~’ TREC Topic Number: 7 Title: Scheduling Coordinator (SC) and PX Identify employees at the PX with whom Enron dealt when Enron acted in its role as a Scheduling Coordinator (SC). (If indeed Enron, in its role as an SC, did interact with the PX. The author is not actually sure if the SCs represented their constituent generators/distributors to the PX, so this relationship might not exist.) In this capacity, Enron would have indicated to the PX what price the generators that Enron represented would be willing to sell electricity in the day-ahead market, and what price the distributors/utilities would be willing to buy electricity in the same market. Narrative: A relevant document must at a minimum identify the name and email address of the employee at the PX with whom Enron-the-SC dealt. The PX-employee’s phone number would be helpful as well, to help analysis of any corresponding voice datasets. Note that this topic could be answered by any hits against the previous topic as well. Hint: The author wonders if Enron’s short-term marketers might also have worked as SCs. EPMI and Enron Energy Services acted as Enron SCs, according to Appendix D (96). At the same time, EPMI, Enron Energy Services, Inc. and Enron Energy Marketing Corporation acted as marketing entities for Enron. There is a significant overlap there. Query Possibilities:
• “scheduling coordinator” or SC
115

Mara Hemminger Page 116 10/22/2005
• PX • (“scheduling coordinator” or SC) and PX • (“scheduling coordinator” or SC) and (MW or KW or watt* or MwH or KwH) • (“scheduling coordinator” or SC) and (MW or KW or watt* or MwH or KwH)
and PX ~~~~~~~~~~~~~~~~~~~~~~’
Enron Manipulating the Market as an SC or Marketer TREC Topic Number: 8 Title: Fat Boy / Thin Man Description: Find evidence that Enron’s SCs or spot marketers knowingly and purposefully misstated the expected amount of electricity needed on their day-ahead schedules to the ISO, in an effort to make a profit (through a price differential) in the real-time market. Narrative: A relevant document must at a minimum show that Enron expected the next day’s demand to be Y, when Enron submitted a schedule to the ISO for Z, where Z is either greater than Y (Fat Boy scheme: 19, pp. VI-21&40; 3, pp. 1-3) or less than Y (Thin Man scheme: 19, pp. VI-16&40). Preferentially, a relevant document will also indicate that Enron submitted this false schedule in order to make money the following day, on the real-time market. (19, p. VI-24) It would be helpful if the document also named the Enron SC/marketer and the counterparty involved, so that further research could be done on these entities. (The counterparty should be a generator, distributor/utility company, or another marketer.) Hint: FERC did find evidence that Enron used these schemes. (19, p. VI-24) Also, just pulling on the cover terms “Fat Boy” and “Thin Man” should generate some hits. FERC found evidence of Enron’s Fat Boy dealings in one of Enron’s transactional databases, simply by pulling on the term “Fat Boy.” Query Possibilities:
• “Fat Boy” • “Thin Man” • (“Fat Boy” or “Thin Man”) and ISO • (“Fat Boy” or “Thin Man”) and (ISO or PX)
~~~~~~~~~~~~~~~~~~~~~~’
116

Mara Hemminger Page 117 10/22/2005
TREC Topic Number: 9 Title: Transmission Line Loads Description: Find evidence that Enron’s SCs or spot marketers knew what the loads were for transmission lines or ties/interties before they submitted their day-ahead electricity schedules to the ISO. Narrative: A relevant document must at a minimum show that Enron knew that a transmission line or intertie could only carry X wattage of energy. The document would optimally show that Enron knew this capacity before submitting a schedule to the ISO in the day-ahead market. Hint: FERC did find evidence in email that Enron purposefully overscheduled (to the ISO) energy over constrained lines/ties. (13, p. 3; 3, p. 3; 19, p. VI-30) The Silverpeak is one intertie for which there is evidence of Enron’s congestion schemes. (19, p. VI-27) Also, Paths 15, 26, 42, and 66 were known to be congested during the energy crisis (17, p. 12); Enron was likely to try to manipulate those lines. See the section on Congestion Payments for more details. Query Possibilities:
• “transmission line” tie or intertie • “transmission line” tie or intertie and (load or loads) • (“transmission line” tie or intertie) and (max or maximum or constrained) and
(MW or KW or watt* or MwH or KwH) • ISO and (max or maximum or constrained) and (MW or KW or watt* or MwH or
KwH) • ISO and (max or maximum or constrained) and (MW or KW or watt* or MwH or
KwH) and schedule ~~~~~~~~~~~~~~~~~~~~~~’ TREC Topic Number: 10 Title: Electricity Schedules to the ISO Description: Determine whether or not Enron, in its role as an SC, ever sent its schedules to the ISO via email. Narrative: A relevant document must at a minimum contain an electricity demand-supply schedule that Enron would have passed to the California ISO in the day-ahead market. Ideally, Enron would also have proposed, in this email, which transmission lines or interties that energy would traverse.
117

Mara Hemminger Page 118 10/22/2005
Hint: FERC did find evidence that Enron purposefully overscheduled (in its day-ahead schedule to the ISO) energy over constrained lines/ties. (13, p. 3; 3, p. 3; 19, p. VI-30) The Silverpeak is one intertie for which there is evidence of Enron’s congestion schemes. (19, p. VI-27) Also, Paths 15, 26, 42, and 66 were known to be congested during the energy crisis (17, p. 12); Enron was likely to try to manipulate those lines. See the section on Congestion Payments for more details. Query Possibilities:
• ISO and schedul* and (electricity or MW or KW or watt* or MwH or KwH) • ISO and schedul* and (electricity or MW or KW or watt* or MwH or KwH) and
(demand or supply) • ISO and schedul* and (electricity or MW or KW or watt* or MwH or KwH) and
(demand or supply) and (“transmission line” or tie or intertie)
~~~~~~~~~~~~~~~~~~~~~~’ TREC Topic Number: 11 Title: Congestion Payments Description: Find evidence that Enron’s SCs or spot marketers knowingly and purposefully submitted to the ISO day-ahead electricity schedules which proposed passing more electricity over a transmission line (or intertie) than that line could carry. This would have been done in an effort to collect congestion payments. Narrative: A relevant document must at a minimum show that Enron knew that a transmission line or intertie could only carry X wattage of energy, and yet Enron proposed that the ISO allow Y wattage to pass over that line the next day, where Y > X. The document would optimally also show that Enron expected to make a profit by doing this, knowing that the ISO would likely pay Enron a congestion payment not to send the extra energy over that line in real time, or to send the energy in the opposite direction (counterflow). Hint: FERC did find evidence in email of Enron’s congestion payment schemes, although many of these are missing from the email dataset we have access to. (13, p. 3; 3, p. 3; 19, p. VI-30) The Silverpeak is one intertie for which there is email evidence of Enron’s congestion schemes. (19, p. VI-27) Also, Paths 15, 26, 42, and 66 were known to be congested during the energy crisis (17, p. 12); Enron was likely to try to manipulate those lines. See the section on Congestion Payments for more details. Query Possibilities:
• congest* • congest* or overload or constrained or counterflow • “congestion payment” or “congestion payments” • “Wheel Out” or “Death Star” or “Load Shift”
118

Mara Hemminger Page 119 10/22/2005
• ISO and (max or maximum) and (MW or KW or watt* or MwH or KwH) • ISO and (max or maximum) and (MW or KW or watt* or MwH or KwH) and
schedule • ISO and (max or maximum) and (MW or KW or watt* or MwH or KwH) and
schedule and (congest* or overload or constrained or counterflow) • ISO and (max or maximum) and (MW or KW or watt* or MwH or KwH) and
schedule and (“congestion payment” or “congestion payments”) • ISO and (max or maximum) and (MW or KW or watt* or MwH or KwH) and
(line or transmission or intertie or tie) • ISO and (max or maximum) and (MW or KW or watt* or MwH or KwH) and
(line or transmission or intertie or tie) and schedule • ISO and (max or maximum) and (MW or KW or watt* or MwH or KwH) and
(line or transmission or intertie or tie) and schedule and (congest* or overload or constrained or counterflow)
~~~~~~~~~~~~~~~~~~~~~~’ TREC Topic Number: 12 Title: Ancillary Services Description: Determine whether or not Enron discussed the sale of ancillary services, specifically firm energy, via email. Narrative: A relevant document must at a minimum show that Enron discussed the sale of ancillary services or firm energy via email. Firm energy is the sale to the ISO of a generator’s “reserve” energy production capacity, in case the ISO needed extra energy in the real-time market. (82, pp. 2-3) Ideally, a relevant document would also produce the names, email addresses, and/or phone numbers of the Enron employees, generation plant employees, and ISO who would be involved in this kind of sale. Hint: FERC did find evidence in Enron’s email dataset that Enron had sold to the ISO firm energy which Enron did not actually possess at the time of sale. (3, pp. 6-7; 19, pp. VI-12&31) See the section on Ancillary Services in for more details. Query Possibilities:
• Ancillary or “firm energy” • (ancillary or “firm energy”) and ISO • “Get Shorty”
~~~~~~~~~~~~~~~~~~~~~~’
119

Mara Hemminger Page 120 10/22/2005
TREC Topic Number: 13 Title: Ancillary Services and Generators Description: Determine whether or not Enron discussed the sale of ancillary services, specifically firm energy, with generators via email. Narrative: A relevant document must at a minimum show that Enron discussed, via emails with generators, the sale of ancillary services or firm energy. Firm energy is the sale to the ISO of a generator’s “reserve” energy production capacity, in case the ISO needs extra energy in the real-time market. Ideally, a relevant document would also produce the names, email addresses, and/or phone numbers of Enron employees, generation plant employees, and the ISO who would all be involved in this kind of sale. Hint: FERC did find evidence in Enron’s email dataset that Enron had sold to the ISO the right to firm energy, which Enron did not actually possess at the time of sale. (3, pp. 6-7; 19, pp. VI-12&31) See the section on Ancillary Services for more details. Query Possibilities:
• Ancillary or “firm energy” • (ancillary or “firm energy”) and generat* • (ancillary or “firm energy”) and generat* and ISO • “Get Shorty”
~~~~~~~~~~~~~~~~~~~~~~’ TREC Topic Number: 14 Title: Ancillary Services and the ISO Description: Determine whether or not Enron discussed the sale of ancillary services, specifically firm energy, with the ISO via email. Narrative: A relevant document must at a minimum show that Enron discussed, via email with the ISO, the sale of ancillary services or firm energy to the ISO. Firm energy is the sale to the ISO of a generator’s “reserve” energy production capacity, in case the ISO needs extra energy in the real-time market. Ideally, a relevant document would also produce the names, email addresses, and/or phone numbers of Enron employees, generation plant employees, and the ISO who would all be involved in this kind of sale. Hint: FERC did find evidence in Enron’s email dataset that Enron had sold to the ISO the right to firm energy which Enron did not actually possess at the time of sale. (3, pp. 6-7; 19, pp. VI-12&31) See the section on Ancillary Services for more details.
120

Mara Hemminger Page 121 10/22/2005
Query Possibilities: • Ancillary or “firm energy” • (ancillary or “firm energy”) and ISO • “Get Shorty”
~~~~~~~~~~~~~~~~~~~~~~’ TREC Topic Number: 15 Title: Ancillary Services and Intent Description: Determine whether or not Enron indicated, via email, its intent to sell ancillary services, specifically firm energy, which it did not have available. The purpose would be to make money off of firm energy contracts that might never be used. Narrative: A relevant set of documents must at a minimum contain an admission on Enron’s part that it was selling firm energy which it did not have available to the ISO, or some indication that Enron knowingly did this. This will likely require comparing emails between Enron and generators, and between Enron and the ISO. Hint: FERC did find evidence in Enron’s email dataset that Enron had sold to the ISO the right to firm energy which Enron did not actually possess at the time of sale. (3, pp. 6-7; 19, pp. VI-12&31) See the section on Ancillary Services for more details. Query Possibilities:
• Ancillary or “firm energy” • (ancillary or “firm energy”) and ISO • (ancillary or “firm energy”) and generat* • (ancillary or “firm energy”) and ISO and generat* • “Get Shorty”
~~~~~~~~~~~~~~~~~~~~~~’ Note: Another excellent TREC-like topic would cover Enron’s 401K scandal. (See source 100, Chapters 20 and 21, especially Chapter 21. One email is cited as evidence of this scandal on pp. 366-367.) See the final set of questions in Appendix B for ideas about how to formulate TREC questions for that topic.
121

Mara Hemminger Page 122 10/22/2005
Appendix D: Scheduling Coordinators
This is a list of the Scheduling Coordinators in California as of February 15, 2002. Note: The source of this information (the California ISO) did not know which generators or distributors these SCs represented. The ISO recommended contacting each individual SC to find out which companies it represented. The author did not attempt to do this. El Paso Merchant Energy Enron Energy Services Enron Power Marketing, Inc. Entergy Koch Energy Trading (aka: Axia and Koch Energy Trading, Inc.)Exelon Generation Company, LLC FPL Energy Power Marketing, Inc. Hafslund Energy Trading Idaho Power Company Illinova Energy Partners, Inc. J Aron & Company L.A. Dept. of Water & Power Lassen MUD LG & E Energy Merchant Energy Group MEGA- Merrill Lynch Metropolitan Water District Midway Sunset Cogeneration Company MIECO,Inc. Mirant Americas Energy Marketing, LP Modesto Irrigation District Morgan Stanley Capital Group Mountain View Power Partners, LLC Nevada Power Northern California Power Agency Occidential Power Services, Inc. PacificCorp PG&E PG&E - PTO PG&E - Transmission Svcs. PG&E - UEPM Pilot Power Group, Inc. Portland General Electric Power Resource Managers Powerex PPM Energy, Inc. PP&L Montana, L.L.C.
122

Mara Hemminger Page 123 10/22/2005
Public Service Company of Colorado (Xcel Energy) Public Service of New Mexico Puget Sound Energy Quiet, LLC Redding Electricity Utility Reliant Energy Services Roseville Electric Sacramento Municipal Utilities District Salt River Project San Diego Gas & Electric Merchant San Diego Gas & Electric-PTO Sempra Energy Solutions Sempra Energy Trading Sierra Pacific Power Southern California Edison Southern California Edison-PTO Strategic Energy Ltd. TECO Energy Source, Inc. Tractebel Energy Marketing Inc. TransAlta Energy Marketing California- Inc. TransCanada Trans Electric Tucson Electric Power Turlock Irrigation District TXU Energy Trading Company, LP UBS AG Viasyn, Inc. Williams Power Company, Inc. Western Area Lower Colorado Western Area Power Administration (WAPA) Table 6: California Scheduling Coordinators (SCs) in February 2002. Source: (96)
123

Mara Hemminger Page 124 10/22/2005
Appendix E: History of the Gas and Electricity Markets This is a brief history of the gas and electric markets in the United States.
Gas Market History Although the gas market existed before the electric market, it is generally considered a secondary source of energy, and so will be discussed more briefly. According to the history annals, natural gas was first discovered in Iran between 6000 and 2000 BC. The fire-worshipping Persians honored certain spots of “eternal fire,” which are now believed to have been natural gas seeps that had been struck by lightning. Various other societies “discovered” and used gas for utilitarian purposes, such as the Chinese, who burned gas to dry rock salt. In 1609, manufactured gas made its debut, when a Belgian chemist discovered that gas escapes heated coal. Progress continued until London boasted the first public streetlights to use gas in 1807. In 1812, the first U.S. gas company was established to provide streetlights to Baltimore. The first long-distance pipeline was built in the 1870’s, transporting gas 25 miles within New York State. (5, pp. 16-17) Edison’s invention of the electric light in the 1880’s, however, and the ensuing growth of the electric industry, nearly killed the gas industry. Most gas markets remained localized around known gas fields. This trend began to change somewhat as more gas reserves were discovered in the U.S. in the first half of the 1900’s, and as a method for making longer-distance pipelines was developed in the 1920’s. (5, p. 17) Like the electric industry, gas remained a monopolistic market until it was deregulated in the late twentieth century. (5, p. 19) In 1978, the federal government passed the Natural Gas Policy Act, which eliminated wellhead price controls. (130) In 1985, FERC ordered pipelines to become open-access carriers for both producers and users. In 1993, FERC Order 633 forced pipeline companies to use a marketing unit, rather than sell directly to customers. With the increasing popularity of gas as an energy source, and with the stiffer market competition from deregulation, utilities began searching for other ways to achieve economies of scale at the turn of the twenty-first century. This led to a consolidation of the gas and electric utilities (5, p. 21), with many gas companies’ buying up electric utilities in the late 1990’s and providing multiple services to end users. (6, p. 10) Today, interstate trade is regulated at the federal level, and intrastate trade and retail sales are regulated at the state level. (131)
124

Mara Hemminger Page 125 10/22/2005
Electric Market History The U.S. electric market has undergone several changes since its inception. Originally conceived as a monopolistic structure, this industry moved from municipal franchise control to state regulatory control to split state/federal regulatory control. Then it underwent gradual deregulation from the 1970’s to 1990’s. By the time FERC investigated Enron in 2002, the market was fully deregulated (in at least California), and the states and federal government shared regulatory control of the industry. Closer details of this history follow.
The Birth of the Electric Power Industry The electric power industry’s first roots date back to the discovery of the induction principle, which enabled the development of the electric generator, in 1831. Improvements ensued, and in 1882, New York City built the world’s first permanent, commercial central power system using electricity. It could not carry the electricity very far, however, as it used only direct current (DC). By 1891, Germany boasted the world’s first operating alternating-current (AC) generator. The AC systems could carry electricity significantly further than DC systems, so this enabled long-distance power transmission. (5, pp. 11-13) Thus was born the electric industry. As might be suspected, the industry lent itself well to a monopolistic structure, because the initial investment in building a generating plant and setting up a transmission and distribution system was great. Thus the industry began as a monopoly, and remained that way until deregulation efforts began in the late twentieth century.
Regulation of the Electric Power Industry Before the turn of the twentieth century (1900), the electric industry was in the hands of small number of private utilities. These operated as franchises of the municipal governments. The reason for this arrangement was that the utilities tended to use public streets (which were municipally owned) for their transmission/distribution system. However, businesses were legally required to obtain special permits/franchises to use public land, so the utilities were forced to come under municipal control. This arrangement did not work out very well, however, as the municipalities often arranged for overlapping franchises (to encourage competition), which led to numerous complaints of high prices, unsafe systems, and poor service. To remedy these problems, several state governments began creating state public utility regulatory commissions. By the 1920’s, most of the power over the electric industry had switched from the cities to the states through this arrangement. The state regulatory bodies began giving each utility a monopoly over a given geographic area. In exchange,
125

Mara Hemminger Page 126 10/22/2005
the utilities accepted a price-setting schedule.105 This eliminated duplicate transmission systems and service areas – thereby allowing the utility companies to take advantage of the cost efficiencies of having no competition in their areas - and provided guaranteed, reasonable prices to the public. The result was several vertically integrated106 monopolies which owned and ran the generation, transmission, and distribution facilities within their jurisdiction, and whose rate-of-return was regulated by state regulatory commissions. (10, p. 4; 6, p. 5; 16, p. 3) See Figure 16 for a view of this monopolistic market, and the division of its regulation. The times continued to change. By the mid-1920’s, many of these utilities had been acquired by holding companies (6, p. 5),107 which were later found to be corrupt (10, p. 4; 8, p. 1). Moreover, most of the highly leveraged108 holding companies collapsed in the U.S. stock market crash of 1929,109 as they could not service their debt. (8, p. 1) The corruption and failure of the holding companies led to the federal government’s involvement. In 1935, Congress passed the Public Utility Holding Company Act (PUHCA), which required major electric holding companies to provide detailed financial information to the Securities and Exchange Commission (SEC). (10, p. 5; 8, p. 1) Also in 1935, Congress amended the Federal Power Act of 1920. The 1920 Act had created the Federal Power Commission (the predecessor to FERC) and given it the power to regulate the licensing of non-federal hydroelectric ventures. (6, p. 6) The 1935 amendment gave the Federal Power Commission the right to regulate interstate transmission and to monitor wholesale electric power rates. (6, p. 6) Meanwhile, state public utility commissions (PUC’s) maintained jurisdiction over the intrastate trade of electricity, and regulated retail rates for customers. (15, p. 13) The net result was that the federal government gained regulatory control over the left side of Figure 3 below (i.e. the wholesale market), and state gained control over the right side (i.e. the retail market). This division of regulatory duties continues today. (15, p. 3)
105 In a regulated environment, these prices are calculated based on the utility’s embedded costs, plus a negotiated rate of return on the investment. (15, p. 63) 106 Vertical integration refers to the situation wherein one company owns all the aspects of a product’s manufacture, from the raw materials to the distribution system. (104) For the electric industry, then, this would mean that one company would own the generation, transmission, and distribution elements. Some authors argue, however, that vertical integration just means owning the generation and transmission facilities (16, p. 1). 107 A holding company is a company that owns enough voting stock in another firm to control the latter’s management and operations by influencing or electing its board of directors. (103) 108 Leverage is “the degree to which an investor or business is utilizing borrowed money. Companies that are highly leveraged may be at risk of bankruptcy if they are unable to make payments on their debt; they may also be unable to find new lenders in the future.” (105) 109 For more information about (and the dates of) the Crash, see (106).
126
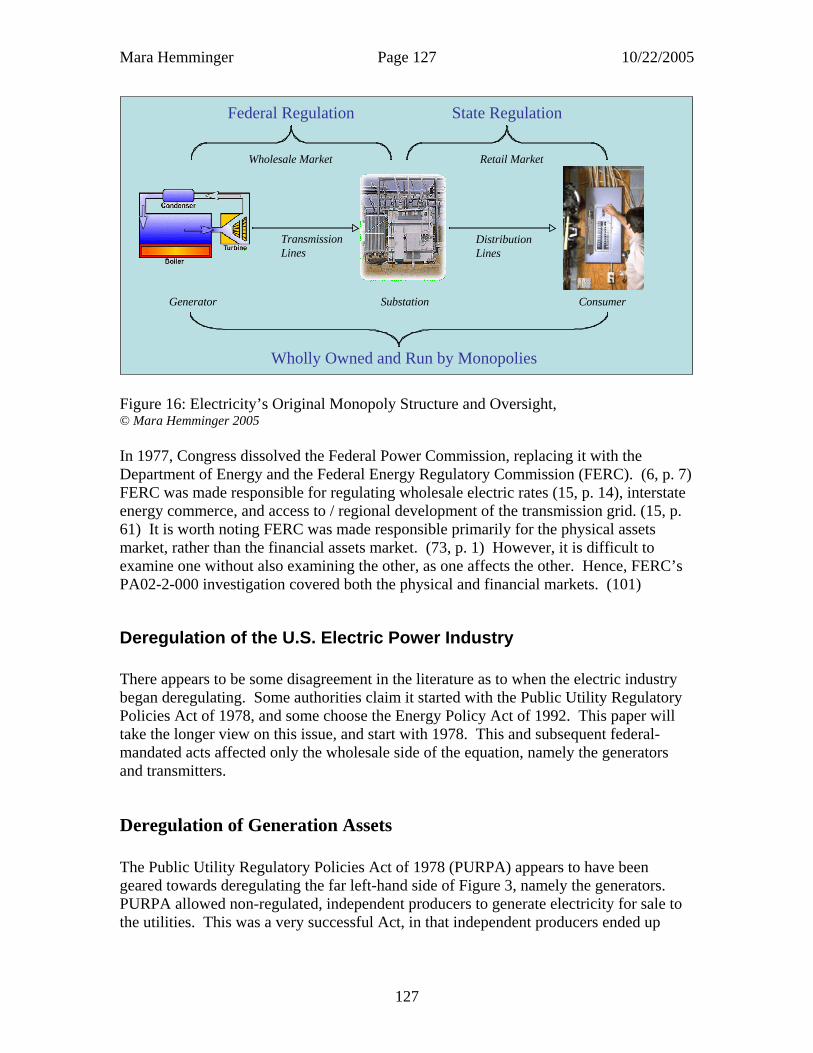
Mara Hemminger Page 127 10/22/2005
ConsumerSubstationGenerator
TransmissionLines
DistributionLines
Federal Regulation State Regulation
Wholesale Market Retail Market
Wholly Owned and Run by Monopolies Figure 16: Electricity’s Original Monopoly Structure and Oversight, © Mara Hemminger 2005 In 1977, Congress dissolved the Federal Power Commission, replacing it with the Department of Energy and the Federal Energy Regulatory Commission (FERC). (6, p. 7) FERC was made responsible for regulating wholesale electric rates (15, p. 14), interstate energy commerce, and access to / regional development of the transmission grid. (15, p. 61) It is worth noting FERC was made responsible primarily for the physical assets market, rather than the financial assets market. (73, p. 1) However, it is difficult to examine one without also examining the other, as one affects the other. Hence, FERC’s PA02-2-000 investigation covered both the physical and financial markets. (101)
Deregulation of the U.S. Electric Power Industry There appears to be some disagreement in the literature as to when the electric industry began deregulating. Some authorities claim it started with the Public Utility Regulatory Policies Act of 1978, and some choose the Energy Policy Act of 1992. This paper will take the longer view on this issue, and start with 1978. This and subsequent federal-mandated acts affected only the wholesale side of the equation, namely the generators and transmitters.
Deregulation of Generation Assets The Public Utility Regulatory Policies Act of 1978 (PURPA) appears to have been geared towards deregulating the far left-hand side of Figure 3, namely the generators. PURPA allowed non-regulated, independent producers to generate electricity for sale to the utilities. This was a very successful Act, in that independent producers ended up
127

Mara Hemminger Page 128 10/22/2005
being responsible for half of the generating capacity that the U.S. actually used in the 1980’s. (5, p. 4)
Deregulation of Transmission Assets In 1992, Congress passed the Energy Policy Act, which largely deregulated the middle- and left-hand sides of Figure 3, namely the wholesale/transmission market. This Act granted all participants in the industry wholesale transmission rights, or “wheeling of power”110 rights. In effect, this granted the independent power producers access to the utilities’ transmission lines. (6, p. 9) The Energy Policy Act also allowed utilities to buy power from each other across state lines (5, p. 5), and to operate independent generating plants outside of their home service territories (8, p. 2). It continued to leave the regulation of retail electric sales, however, in the hands of the states. (8, p. 2) In April 1996, FERC passed Order No. 888 (15, p. 66). This required public utilities to offer to sell their electric power to other providers or utilities at the same rates that they charged themselves. Although the transmitting (wheeling) utility would be compensated for the use of its line, (6, p. 9) it was now basically required to offer non-discriminatory access to its power grid – even to its competitors. (8, p. 2) FERC also passed Order No. 889 in April 1996 (15, p. 66). This Order required electric utilities to establish electronic systems for sharing information about their available transmission capacity. This further opened up access to utilities’ transmission lines. (6, p. 9) FERC Order 2000, passed in December 1999, encouraged the voluntary creation of regional transmission organizations (RTO’s), which would bring the nation’s transmission systems under regional control. (15, p. 67) (This effort seems to have floundered somewhat.) It also allowed each region to decide whether or not to create a (regional) power exchange (PX) to help with this. (15, p. 71) A power exchange was indeed created in California, and it played a vital role in Enron’s marketing schemes and in FERC’s investigation thereof. Hopefully that broad overview of the national scene will help the reader put California’s deregulation efforts into a more informed context.
110 Wheeling occurs when a transmission-owning entity (a utility) permits another energy entity (a utility or independent power producer) to move (wheel) power over its transmission lines. (15, p. 63)
128
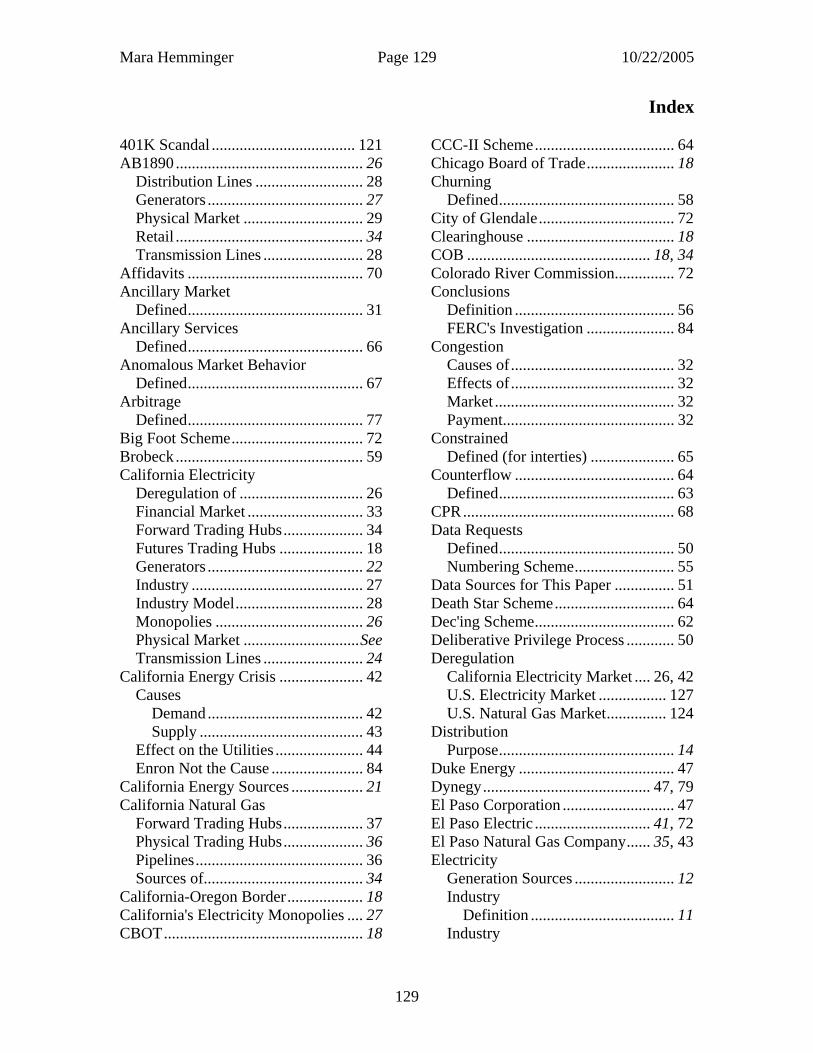
Mara Hemminger Page 129 10/22/2005
Index 401K Scandal .................................... 121 AB1890 ............................................... 26
Distribution Lines ........................... 28 Generators ....................................... 27 Physical Market .............................. 29 Retail ............................................... 34 Transmission Lines ......................... 28
Affidavits ............................................ 70 Ancillary Market
Defined............................................ 31 Ancillary Services
Defined............................................ 66 Anomalous Market Behavior
Defined............................................ 67 Arbitrage
Defined............................................ 77 Big Foot Scheme................................. 72 Brobeck ............................................... 59 California Electricity
Deregulation of ............................... 26 Financial Market ............................. 33 Forward Trading Hubs.................... 34 Futures Trading Hubs ..................... 18 Generators ....................................... 22 Industry ........................................... 27 Industry Model................................ 28 Monopolies ..................................... 26 Physical Market .............................See Transmission Lines ......................... 24
California Energy Crisis ..................... 42 Causes
Demand ....................................... 42 Supply ......................................... 43
Effect on the Utilities ...................... 44 Enron Not the Cause ....................... 84
California Energy Sources .................. 21 California Natural Gas
Forward Trading Hubs.................... 37 Physical Trading Hubs.................... 36 Pipelines.......................................... 36 Sources of........................................ 34
California-Oregon Border................... 18 California's Electricity Monopolies .... 27 CBOT.................................................. 18
CCC-II Scheme................................... 64 Chicago Board of Trade...................... 18 Churning
Defined............................................ 58 City of Glendale.................................. 72 Clearinghouse ..................................... 18 COB .............................................. 18, 34 Colorado River Commission............... 72 Conclusions
Definition ........................................ 56 FERC's Investigation ...................... 84
Congestion Causes of......................................... 32 Effects of......................................... 32 Market ............................................. 32 Payment........................................... 32
Constrained Defined (for interties) ..................... 65
Counterflow ........................................ 64 Defined............................................ 63
CPR..................................................... 68 Data Requests
Defined............................................ 50 Numbering Scheme......................... 55
Data Sources for This Paper ............... 51 Death Star Scheme.............................. 64 Dec'ing Scheme................................... 62 Deliberative Privilege Process ............ 50 Deregulation
California Electricity Market .... 26, 42 U.S. Electricity Market ................. 127 U.S. Natural Gas Market............... 124
Distribution Purpose............................................ 14
Duke Energy ....................................... 47 Dynegy.......................................... 47, 79 El Paso Corporation ............................ 47 El Paso Electric ............................. 41, 72 El Paso Natural Gas Company...... 35, 43 Electricity
Generation Sources ......................... 12 Industry
Definition .................................... 11 Industry
129

Mara Hemminger Page 130 10/22/2005
Model .......................................... 12 ISO Price Cap ................................. 45 Market Regulation ........................ 126 Measurement Units ......................... 14 Retail Price Cap .............................. 44
eLibrary............................................... 51 Email
Evidence.......................................... 71 Energy Export Scheme ....................... 62
Questions of the ISO....................... 69 Energy Policy Act ..................... 127, 128 Energy Re-import Scheme.................. 63
Questions of the ISO....................... 69 Enpower .............................................. 68 Enron
Business Strategy............................ 76 Business Structure........................... 37 Demise ............................................ 45 Roles within the California Energy
Market ......................................... 39 Subsidiaries ..................................... 38
Enron Broadband ................................ 38 Enron Energy Marketing Corporation 41,
79 Enron Energy Services............ 38, 41, 79 Enron Gas Marketing.......................... 38 Enron Generation................................ 38 Enron Networks .................................. 38
Runs EOL........................................ 39 Enron North America.......................... 38 Enron Physical Transaction Database. 79 Enron Power Marketing, Inc......... 38, 41 Enron Services Handbook....... 41, 61, 62 Enron Transportation Services............ 38 EnronOnline........................................ 38
FERC Gains Access to.................... 77 Founding ......................................... 39 Functioning ..................................... 74 Structure.......................................... 40
EOL..................................................... 38 FERC Gains Access to.................... 77 Founding ......................................... 39 Functioning ..................................... 74 Structure.......................................... 40
EPMI............................................. 38, 41 EPTB................................................... 79
ERMS.................................................. 68 Evidence
Definition ........................................ 56 Explanation of Appendix A ................ 53 Fake Ancillary Services Scheme
Questions of the ISO....................... 69 Fat Boy Scheme .................................. 61
Questions of the ISO....................... 69 Federal Power Act............................. 126 Federal Power Commission .............. 126 FERC
Complaints Sent to FERC............... 46 Duties .......................................... 9, 46 Order 633 ...................................... 124 Order No. 2000 ............................. 128 Order No. 888 ............................... 128 Order No. 889 ............................... 128 Predecessor to ............................... 126
Financial Market Definition ........................................ 17 Model .............................................. 20
Firm Energy Defined............................................ 66
Firm Transition Rights Defined............................................ 65
Forced Congestion Payments Scheme 63 Questions of the ISO....................... 68
Forward Market Definition ........................................ 19 Enron's Role in................................ 39
Futures Market Definition ........................................ 17
Futures Trading Hubs ......................... 19 Gaming
Defined............................................ 67 Gas Industry ........................................ 15 Generating stations
Enron............................................... 39 Purpose............................................ 13 Types............................................... 13
Get Shorty Scheme ....................... 66, 72 Glendale ........................................ 41, 71 Henry Hub..................................... 77, 81 Hub
Definition ........................................ 17 Inc’ing Scheme ................................... 61
130
Mara Hemminger Page 131 10/22/2005
Index Prices How Determined............................. 78
Industry Definition ........................................ 11
Information Need Defined............................................ 50 FERC's original Information Need . 54
Information-Seeking Models....................................... 48, 49
Interconnection ................................... 65 Intertie ................................................. 65 IOUs
Defined............................................ 61 Underscheduling Scheme................ 61
ISO Creation........................................... 31 Definition ........................................ 31 Regulation....................................... 32 Schedules ........................................ 33
Kenneth Lay........................................ 38 Kern River........................................... 35 Load Shift Scheme.............................. 65 Market
Definition ........................................ 15 Market Monitoring and Information
Protocol ........................................... 67 Marketer
Definition .......................................... 9 Enron as .......................................... 41
Megawatt Laundering Scheme ........... 63 Memoranda of 2000............................ 59 Methodology
For this Paper .................................. 52 Mid-Columbia..................................... 34 MMIP.................................................. 67
Enron's Violations of ...................... 68 Penalties .......................................... 68
National Institute of Standards and Technology ................................... 110
Natural Gas Policy Act ..................... 124 New York Mercantile Exchange......... 18 NIST.................................................. 110 NP15 ................................................... 34 NYMEX........................................ 18, 77 PA02-2-000......................................... 47 Pacificorp ...................................... 64, 73
Palo Verde..................................... 18, 34 Path ..................................................... 24 PG&E
Natural Gas Pipelines...................... 35 PGE..................................................... 39 Physical Market
Definition ........................................ 16 Model .............................................. 20
Physical Sales...................................... 79 Portland General Electric Company ... 39 Portland Shift ................................ 64, 72 Powerex......................................... 63, 72 Price Caps
ISO .................................................. 45 Retail ............................................... 44
Price Index Enron's Effect on............................. 83 Publishers of.................................... 82 Questions Surrounding.................... 82
Public Utility Holding Company Act 126 Public Utility Regulatory Policies Act
....................................................... 127 PUC
Defined.......................................... 126 PUHCA............................................. 126 PURPA.............................................. 127 PX
Creation........................................... 30 Creation Nationwide ..................... 128 Definition ........................................ 30 Regulation....................................... 32
Real-Time Market Defined............................................ 31
Red Congo .................................... 64, 73 Redding ................................... 64, 72, 73 Regional Transmission Organizations
....................................................... 128 Reliant ..................................... 47, 58, 79 Retail Market
Definition ........................................ 20 Ricochet Scheme................................. 63 RiskTrac.............................................. 68 Round-Trip Transactions .................... 79 RTO................................................... 128 SC
Defined............................................ 33
131

Mara Hemminger Page 132 10/22/2005
Enron as .................................... 40, 41 List of ............................................ 122
Scheduling Coordinators Defined............................................ 33 Enron as .................................... 40, 41 List of ............................................ 122
Scheduling Energy to Collect Congestion Charge II Scheme ........ 64
SEC ................................................... 126 Securities and Exchange Commission
....................................................... 126 Sell-Back Transactions ....................... 79 Selling Non-Firm Energy as Firm
Energy Scheme ............................... 67 Sierra Pacific Power Company ........... 72 Silverpeak ........................................... 72 Sitara ................................................... 68 Sleeving............................................... 73 SP15 .................................................... 34 Stage-2 Emergency ............................. 42 Stoel Rives .......................................... 59 Subpoena Duces Tecum
Defined............................................ 58 Text REtrieval Conference
Defined.......................................... 110 Thin Man Scheme............................... 62
Questions of the ISO....................... 69
Timothy Belden ............................ 73, 84 Topock ................................................ 59 Transmission
Purpose............................................ 14 Transwestern Pipeline Company ........ 35 TREC
Defined.......................................... 110 Unify ................................................... 68 USB Warburg...................................... 84 Valley Electric ........................ 41, 72, 75 Wash Trading
At Electricity Hubs ......................... 81 At Gas Hubs.................................... 81 Definition ........................................ 78 Effects Of ........................................ 81 Enron............................................... 81 On EOL........................................... 80 Reasons For Doing.................... 78, 81 Who Did.................................... 79, 80
Washington Water Power Company... 72 West Power Trading Division............. 84 Wheeling
Defined.......................................... 128 Wheet-Out Scheme ............................. 65 Wholesale Market
Definition ........................................ 16 WWP................................................... 72
132

Mara Hemminger Page 133 10/22/2005
Bibliography 1) Yes, Virginia, Electricity Markets Can Work. (2002, December 19). Retrieved on November 2004, from the Frontier Centre for Public Policy’s website, http://www.fcpp.org/publication_detail.php?PubID=480. 2) California Power Crisis: Billions of Dollars and Thousands of Jobs. (u/i date). Retrieved on November 22, 2004 from the Bay Area Council’s website, http://www.bayareacouncil.org/ppi/enp/enp_mid.html. 3) Traders’ Strategies in the California Wholesale Power Markets / ISO Sanctions. (2000, December 6). Memo from Christian Yoder (in-house EPMI counsel) and Stephen Hall (of Stoel Rives LLP, Enron’s contract researchers for this memo) to Richard Sanders, Esq. (of Enron Corporation). Retrievable from http://www.ferc.gov/industries/electric/indus-act/wec/rev-chron.asp, under Enron Trading Memos, December 6, 2000. 4) Asleep at the Switch: FERC’s Oversight of Enron Corp. – Vol. 1. (2002, November 12). Hearing before the Committee on Governmental Affairs, Senate, 107th Congress, 2nd session. Retrieved on u/i date from u/i website. 5) Energy. (2005). In Encyclopedia of Global Industries, online edition. Retrieved on December 13, 2004 from the Business and Company Resource Center of the University of Maryland’s School of Business, http://galenet.galegroup.com/servlet/BCRC. 6) Electric Services. (2004) In Encyclopedia of American Industries, online edition. Retrieved on December 13, 2004 from the Business and Company Resource Center of the University of Maryland’s School of Business, http://galenet.galegroup.com/servlet/BCRC. 7) The Bay Area. A Knowledge Economy Needs Power. (2001, April). Retrieved on December 13, 2004 from http://www.bayareacouncil.org/ppi/emp/emp_mid.html. Or at http://www.bayeconfor.org/keypub.html. 8) Electric and Other Services Combined. (2004). In Encyclopedia of American Industries, online edition. Retrieved on December 13, 2004 from the Business and Company Resource Center of the University of Maryland’s School of Business, http://galenet.galegroup.com/servlet/BCRC. 9) United States – Utilities. (2004, January 1). In Data Monitor Industry Market Research. Retrieved on December 13, 2004 from the Business and Company Resource Center of the University of Maryland’s School of Business, http://galenet.galegroup.com/servlet/BCRC. 10) Regulation and Administration of Communications, Electric, Gas, and Other Utilities. (2004). In Encyclopedia of American Industries, online edition. Retrieved on December
133

Mara Hemminger Page 134 10/22/2005
13, 2004 from the Business and Company Resource Center of the University of Maryland’s School of Business, http://galenet.galegroup.com/servlet/BCRC. 11) Ginzl, D. (2004, June). Dumb, dumber, and dumbest: what went wrong at Enron. Excerpt from The Smartest Guys in the Room. In Bank Accounting and Finance, 17, pp. 48-55. 12) Heuer, J. (1999, February 10). California Summary. Last edited on February 12, 2001. Retrieved on December 11, 2004 from the NARUC Energy Regulatory Database, http://www.naruc.whatsup.net/clients/naruc/naruc.nsf/wwwRegionSummaries/California. (Not cited in paper) 13) Isaacs, J. (2002, May 10). Enron defrauded California out of billions during energy crisis. Retrieved on December 11, 2004, from the World Socialist Web Site, http://www.wsws.org/articles/2002/may2002/enro-m10_prn.shtml. 14) McCullough, R. (2003, January 15). California Electricity Price Spikes: Factual Evidence. Retrieved on November 22, 2004, from http://republican.sen.ca.gov/web/38/Pubs/03_McCullough_Rebuttal.pdf. 15) Liggett, W., McNerney, R., & Hankey, R. (2000, October). The Changing Structure of the Electric Power Industry 2000: An Update. Retrieved on January 8, 2005 from the Energy Information Administration (part of the Department of Energy) website, http://www.eia.doe.gov/cneaf/electricity/chg_stru_update2000.pdf. 16) Van Doren, P. (1998, October 6). The Deregulation of the Electricity Industry. Retrieved on January 7, 2004 from the Cato Institute’s website, http://www.cato.org/pubs/pas/pa-320es.html. 17) U.S. vs. Timothy Belden. Draft of charges in violation of 18 U.S.C. 371, Conspiracy to Commit Wire Fraud. US District Court, Northern District of California, San Francisco Division. Retrieved on January 10, 2005 from http://news.findlaw.com/hdocs/docs/enron/usbelden101702inf.pdf. 18) Ekbia, H. (2004, October 13). How IT Mediates Organizations: Enron and the California Energy Crisis [Electronic version]. Journal of Digital Information, 5, 4. Retrieved on January 10, 2005 from Journal of Digital Information website, http://jodi.ecs.soton.ac.uk/Articles/v05/i04/Ekbia/#A1. 19) Final Report on Price Manipulation in Western Markets. Fact-Finding Investigation of Potential Manipulation of Electric and Natural Gas Prices. (2003, March). Retrieved on January 11, 2005 from the FERC Staff Reports website, http://www.ferc.gov/legal/staff-rep-elec.asp. Also available at http://www.ferc.gov/industries/electric/indus-act/wec/rev-chron.asp.
134

Mara Hemminger Page 135 10/22/2005
20) Letter from Donald Gelinas, FERC Associate Director of the Office of Markets, Tariffs and Rates, to sellers of wholesale electricity and/or ancillary services to the Cal ISO and/or Cal PX during the years 2000-2001. (2002, May 8). Retrieved on November 18, 2004 from FERC’s old website on the PA02-2-000 investigation. The reader must now retrieve this letter by querying FERC’s eLibrary, http://elibrary.ferc.gov/idmws/search/fercgensearch.asp. 21) Letter from Donald Gelinas, FERC Associate Director of the Office of Markets, Tariffs and Rates, to Charles Robinson, General Counsel of the Cal ISO. (2002, May 7). Retrieved on November 18, 2004 from FERC’s old website on the PA02-2-000 investigation. The reader must now retrieve this letter by querying FERC’s eLibrary, http://elibrary.ferc.gov/idmws/search/fercgensearch.asp. 22) Letter from Donald Gelinas, FERC Associate Director of the Office of Markets, Tariffs and Rates, to sellers of wholesale electricity and/or ancillary services in the United States portion of the Western Systems Coordinating Council during the years 2000-2001. (2002, May 21). Retrieved on November 18, 2004 from FERC’s old website on the PA02-2-000 investigation. The reader must now retrieve this letter by querying FERC’s eLibrary, http://elibrary.ferc.gov/idmws/search/fercgensearch.asp. 23) Letter from Donald Gelinas, FERC Associate Director of the Office of Markets, Tariffs and Rates, to Larry Foster, Editorial Director of Platts Natural Gas Products. (2002, May 21). Retrieved on November 18, 2004 from FERC’s old website on the PA02-2-000 investigation. The reader must now retrieve this letter by querying FERC’s eLibrary, http://elibrary.ferc.gov/idmws/search/fercgensearch.asp. 24) Letter from Donald Gelinas, FERC Associate Director of the Office of Markets, Tariffs and Rates, to Brian Jordan, Editorial Director of Platts Natural Gas Products. (2002, May 21). Retrieved on November 18, 2004 from FERC’s old website on the PA02-2-000 investigation. The reader must now retrieve this letter by querying FERC’s eLibrary, http://elibrary.ferc.gov/idmws/search/fercgensearch.asp. 25) Letter from Donald Gelinas, FERC Associate Director of the Office of Markets, Tariffs and Rates, to Beth Ann Burns, Litigation Counsel at the Cal ISO. (2002, May 21). Retrieved on November 18, 2004 from FERC’s old website on the PA02-2-000 investigation. The reader must now retrieve this letter by querying FERC’s eLibrary, http://elibrary.ferc.gov/idmws/search/fercgensearch.asp. 26) Letter from Donald Gelinas, FERC Associate Director of the Office of Markets, Tariffs and Rates, to sellers of natural gas in the U.S. portion of the Western Systems Coordinating Council and/or Texas during the years 2000-2001. (2002, May 22). Retrieved on November 18, 2004 from FERC’s old website on the PA02-2-000 investigation. The reader must now retrieve this letter by querying FERC’s eLibrary, http://elibrary.ferc.gov/idmws/search/fercgensearch.asp.
135

Mara Hemminger Page 136 10/22/2005
27) Letter from Donald Gelinas, FERC Associate Director of the Office of Markets, Tariffs and Rates, to Mark Curran, Managing Price Editor of Natural Gas Intelligence. (2002, May 23). Retrieved on November 18, 2004 from FERC’s old website on the PA02-2-000 investigation. The reader must now retrieve this letter by querying FERC’s eLibrary, http://elibrary.ferc.gov/idmws/search/fercgensearch.asp. 28) Letter from Donald Gelinas, FERC Associate Director of the Office of Markets, Tariffs and Rates, to Scott Speaker, Editor of Energy Intelligence Group, Inc. (2002, May 23). Retrieved on November 18, 2004 from FERC’s old website on the PA02-2-000 investigation. The reader must now retrieve this letter by querying FERC’s eLibrary, http://elibrary.ferc.gov/idmws/search/fercgensearch.asp. 29) Letter (reply) from Donald Gelinas, FERC Associate Director of the Office of Markets, Tariffs and Rates, to Alex Goldberg, Assistant General Counsel of The Williams Companies, Inc. (2002, June 7). Retrieved on November 18, 2004 from FERC’s old website on the PA02-2-000 investigation. The reader must now retrieve this letter by querying FERC’s eLibrary, http://elibrary.ferc.gov/idmws/search/fercgensearch.asp. (Not cited in paper) 30) 107 FERC 61,108. Order on Rehearing. (2004, May 5). Retrieved on January 8, 2004 from a u/i website. (Not cited in paper) 31) Anderson, J. Enron: A Select Chronology of Congressional, Corporate, and Government Activities. (2002, April 9). Retrieved on January 16, 2004, from the Congressional Research Service website via the University of Maryland’s online library system, http://www.lib.umd.edu 32) California Energy Commission Staff. (1997, July 15). Retail Settlements and Information Flow (RSIF), Draft Workshop Report. Retrieved on January 16, 2005 from the Cal ISO website, http://ora.ca.gov/wk-group/dai/dai4/RSIF1.doc. 33) Smith, R. (2000, October 13). California Independent System Operator Corporation: FERC Electric Tariff, First Replacement Volume No. 1. Retrieved on January 16, 2005 from the Cal ISO website, http://www.caiso.com. Run a search for “list of scheduling coordinators,” and pick the hit labeled “Microsoft Word - 9185044_1.DOC.” (Not cited in paper) 34) Lawsuit Filed on Behalf of San Diego Electric Customers. (2000, November 29). Retrieved from the UCAN (Utility Consumers’ Action Network, a San Diegan consumer energy watchdog group) website, http://www.ucan.org/law_policy/energydocs/energyclass.htm. 35) Order Directing Staff Investigation. (2002, February 13). Retrieved on November 19, 2005 from the old FERC website on PA02-2-000. The reader must now retrieve this letter by querying FERC’s eLibrary, http://elibrary.ferc.gov/idmws/search/fercgensearch.asp.
136
Mara Hemminger Page 137 10/22/2005
36) Report on EnronOnline. (2001, August 16). Retrieved on November 19, 2004 from old FERC website on PA02-2-000. The reader can now retrieve this letter from FERC’s new website on PA02-2-000, http://www.ferc.gov/industries/electric/indus-act/wec/rev-chron.asp. Go to “FERC Staff Report on EnronOnline.” 37) Letter from Donald Gelinas, FERC Associate Director of the Office of Markets, Tariffs and Rates, to Sam Behrends, Esq. and Catherine McCarthy, Esq. of LeBoeuf, Lamb, Greene, & MacRae, LLP. (2002, February 15.) Retrieved on November 19, 2004 from the old FERC website on PA02-2-000. The reader must now retrieve this letter by querying FERC’s eLibrary, http://elibrary.ferc.gov/idmws/search/fercgensearch.asp. 38) Letter from Donald Gelinas, FERC Associate Director of the Office of Markets, Tariffs and Rates, to all jurisdictional sellers and all non-jurisdictional sellers in the West. (2002, March 5). Retrieved on November 19, 2004 from the old FERC website on PA02-2-000. The reader must now retrieve this letter by querying FERC’s eLibrary, http://elibrary.ferc.gov/idmws/search/fercgensearch.asp. 39) Letter from Donald Gelinas, FERC Associate Director of the Office of Markets, Tariffs and Rates, to Sam Behrends, Esq. and Catherine McCarthy, Esq. of LeBoeuf, Lamb, Greene, & MacRae, LLP. (2002, March 15). Retrieved on November 19, 2004 from the old FERC website on PA02-2-000. The reader must now retrieve this letter by querying FERC’s eLibrary, http://elibrary.ferc.gov/idmws/search/fercgensearch.asp. 40) Letter from Donald Gelinas, FERC Associate Director of the Office of Markets, Tariffs and Rates, to Michael Kovaks, Product Manager of Bloomberg Energy Services. (2002, April 11). Retrieved on November 19, 2004 from the old FERC website on PA02-2-000. The reader must now retrieve this letter by querying FERC’s eLibrary, http://elibrary.ferc.gov/idmws/search/fercgensearch.asp. 41) Letter from Donald Gelinas, FERC Associate Director of the Office of Markets, Tariffs and Rates, to Brian Jordan, Editorial Director of Platts Natural Gas Products. (2002, April 11). Retrieved on November 19, 2004 from the old FERC website on PA02-2-000. The reader must now retrieve this letter by querying FERC’s eLibrary, http://elibrary.ferc.gov/idmws/search/fercgensearch.asp. 42) Letter from Donald Gelinas, FERC Associate Director of the Office of Markets, Tariffs and Rates, to Sam Behrends, Esq. of LeBoeuf, Lamb, Greene, & MacRae, LLP. (2002, April 18). Retrieved on November 19, 2004 from the old FERC website on PA02-2-000. The reader must now retrieve this letter by querying FERC’s eLibrary, http://elibrary.ferc.gov/idmws/search/fercgensearch.asp. 43) Fergus, G. & Frizzell, J. (u/i date) Status Report on Further Investigation and Analysis of EPMI Trading Practices. (Memo from Gary Fergus and Jean Frizzell of Brobeck Attorneys at Law to Richard Sanders, Esq of Enron Corporation.) Retrieved on November 19, 2004 from the old FERC website on PA02-2-000. The reader must now
137

Mara Hemminger Page 138 10/22/2005
retrieve this letter by querying FERC’s eLibrary, http://elibrary.ferc.gov/idmws/search/fercgensearch.asp. 44) Economist’s Paper Argues that Overall, Enron’s Strategies Helped CA Market. (2002, June 17). Retrieved on November 21, 2004 from the NERA (National Economic Research Associates) website, http://www.nera.com/MediaCoverage.asp?pr_ID=1473. (Not cited in this paper) 45) Letter from Donald Gelinas, FERC Associate Director of the Office of Markets, Tariffs and Rates, to Richard Sanders, Esq. of Enron Corporation, and Sam Behrends, Esq. of LeBoeuf, Lamb, Greene, & MacRae, LLP. (2002, April 29). Retrieved on November 19, 2004 from the old FERC website on PA02-2-000. The reader must now retrieve this letter by querying FERC’s eLibrary, http://elibrary.ferc.gov/idmws/search/fercgensearch.asp. 46) Makovich, L. Impact of Enron (sic) Collapse on Energy Markets. (2002, January 29). Hearing before the Committee on Energy and Natural Resources, Senate, 107th Congress, 2nd session. Retrieved on December 10, 2004 from the U.S. Senate Committee on Energy and Natural Resources website, http://energy.senate.gov/hearings/testimony.cfm?id=146&wit_id=118. 47) Enron Corporation: Business Description. (u/i date). Retrieved on January 12, 2005 from Mergent Online, http://www.mergentonline.com. Search on “Enron Corporation” and select the Business menu option. 48) Enron Corporation. (u/i date). Retrieved on January 12, 2005 from the University of Maryland’s Virtual Business Information Center, http://www.vbic.umd.edu. Go to the Gale Group’s Business and Company Resource Center, select Company, and search on “Enron” in the Company Name field. Go to the Histories section. 49) Telephone interview with Dr. Lawrence Makovich, Senior Director of Cambridge Energy Research Associates (CERA). (2005, January 24). 50) Enron Corp. (u/i date). Retrieved on January 12, 2005, from Mergent Online, via the University of Maryland’s Virtual Business Information Center, http://www.vbic.umd.edu. (Not cited in this paper) 51) (Not cited in this paper) 52) Letter from Dianne Feinstein, U.S. Senator from California, to FERC Chairman Pat Wood. (2002, September 18). Retrieved on February 26, 2005, from FERC’s eLibrary, http://elibrary.ferc.gov/idmws/search/fercgensearch.asp. 53) (Not cited in this paper)
138

Mara Hemminger Page 139 10/22/2005
54) Letter from Californian State Senator Joseph Dunn to FERC Chairman Pat Wood. (2002, August 22). Retrieved on February 26, 2005, from FERC’s eLibrary, http://elibrary.ferc.gov/idmws/search/fercgensearch.asp. 55) Letter from Californian State Senator Joseph Dunn to FERC Chairman Pat Wood. (2002, August 27). Retrieved on February 26, 2005, from FERC’s eLibrary, http://elibrary.ferc.gov/idmws/search/fercgensearch.asp. 56) Letter from Californian State Senator Joseph Dunn to FERC Chairman Pat Wood. (2002, June 27). Retrieved on February 26, 2005, from FERC’s eLibrary, http://elibrary.ferc.gov/idmws/search/fercgensearch.asp. 57) Letter from Dianne Feinstein, U.S. Senator from California, to FERC Chairman Pat Wood. (2002, May 24). Retrieved on February 26, 2005, from FERC’s eLibrary, http://elibrary.ferc.gov/idmws/search/fercgensearch.asp. 58) Letter from Californian Senator Dianne Feinstein to FERC Chairman Pat Wood. (2002, June 6). Retrieved on February 26, 2005, from FERC’s eLibrary, http://elibrary.ferc.gov/idmws/search/fercgensearch.asp. 59) (Not cited in this paper) 60) Letter from Californian State Senator Joseph Dunn to FERC Chairman Pat Wood. (2002, May 21). Note: This letter references phone conversations between the Cal-ISO and a California Energy Resources Scheduling (CERS) trader that indicate withheld generation capacity and alteration of load schedules for transmission lines. Retrieved on February 26, 2005, from FERC’s eLibrary, http://elibrary.ferc.gov/idmws/search/fercgensearch.asp. (Not cited in this paper) 61) Letter from Californian Governor Gray Davis to FERC Chairman Pat Wood. (2002, May 14). Retrieved on February 26, 2005, from FERC’s eLibrary, http://elibrary.ferc.gov/idmws/search/fercgensearch.asp. 62) Email from Catherine McCarthy, Esq. of LeBoeuf, Lamb, Greene, & MacRae, LLP, to William Booth of Enron’s OSEC (Office of the Secretary). (2002, May 14). Retrieved on February 26, 2005, from FERC’s eLibrary, http://elibrary.ferc.gov/idmws/search/fercgensearch.asp. 63) Letter from Barbara Boxer, U.S. Senator from California, to FERC Chairman Pat Wood. (2002, May 13). Retrieved on February 26, 2005, from FERC’s eLibrary, http://elibrary.ferc.gov/idmws/search/fercgensearch.asp. 64) (Not cited in this paper) 65) Email from Catherine McCarthy, Esq. of LeBoeuf, Lamb, Greene, & MacRae, LLP, to William Booth of Enron’s OSEC (Office of the Secretary). (2002, April 26).
139

Mara Hemminger Page 140 10/22/2005
Retrieved on February 26, 2005, from FERC’s eLibrary, http://elibrary.ferc.gov/idmws/search/fercgensearch.asp. 66) Letter from Sam Behrends, Esq. of LeBoeuf, Lamb, Greene, & MacRae, LLP to Donald Gelinas, Associate Director of FERC’s Office of Markets, Tariffs and Rates. (2002, April 2). Retrieved on February 26, 2005, from FERC’s eLibrary, http://elibrary.ferc.gov/idmws/search/fercgensearch.asp. 67) Letter from Sam Behrends, Esq. and Catherine McCarthy, Esq. of LeBoeuf, Lamb, Greene, & MacRae, LLP, to Donald Gelinas, Associate Director of FERC’s Office of Markets, Tariffs and Rates. (2002, March 1). Retrieved on February 26, 2005, from FERC’s eLibrary, http://elibrary.ferc.gov/idmws/search/fercgensearch.asp. 68) Letter from Sam Behrends, Esq. and Catherine McCarthy, Esq. of LeBoeuf, Lamb, Greene, & MacRae, LLP, to Donald Gelinas, Associate Director of FERC’s Office of Markets, Tariffs and Rates. (2002, April 2). Retrieved on February 26, 2005, from FERC’s eLibrary, http://elibrary.ferc.gov/idmws/search/fercgensearch.asp. 69) Letter from Sam Behrends, Esq. and Catherine McCarthy, Esq. of LeBoeuf, Lamb, Greene, & MacRae, LLP, to Donald Gelinas, Associate Director of FERC’s Office of Markets, Tariffs and Rates. (2002, March 1). Retrieved on February 26, 2005, from FERC’s eLibrary, http://elibrary.ferc.gov/idmws/search/fercgensearch.asp. 70) (Not cited in this paper) 71) Watson, L. (2002, February 26). Notice of Docket Designation. Retrieved on February 26, 2005, from FERC’s eLibrary, http://elibrary.ferc.gov/idmws/search/fercgensearch.asp. 72) Letter from FERC Chairman Pat Wood to Maria Cantwell, U.S. Senator from California. (2002, February 28). Retrieved on February 26, 2005, from FERC’s eLibrary, http://elibrary.ferc.gov/idmws/search/fercgensearch.asp. 73) Letter from FERC Chairman Pat Wood to Gordon Smith, U.S. Senator from California. (2002, February 28). Retrieved on February 26, 2005, from FERC’s eLibrary, http://elibrary.ferc.gov/idmws/search/fercgensearch.asp. 74) Letter from FERC Chairman Pat Wood to Barbara Boxer, U.S. Senator from California. (2002, February 28). Retrieved on February 26, 2005, from FERC’s eLibrary, http://elibrary.ferc.gov/idmws/search/fercgensearch.asp. 75) Letter from FERC Chairman Pat Wood to California Governor Gray Davis. (2002, March 6). Retrieved on February 26, 2005, from FERC’s eLibrary, http://elibrary.ferc.gov/idmws/search/fercgensearch.asp. (Not cited in this paper)
140
Mara Hemminger Page 141 10/22/2005
76) Letter from FERC Chairman Pat Wood to Dianne Feinstein, U.S. Senator from California. (2002, February 28). Retrieved on February 26, 2005, from FERC’s eLibrary, http://elibrary.ferc.gov/idmws/search/fercgensearch.asp. 77) (Not cited in this paper) 78) Summer 2000 – Present in California. (u/i date). Retrieved on March 25, 2005, from UCLA’s Department of Economics’ Business Economics website, http://www.econ.ucla.edu/bizecon/CalPower.ppt. 79) Royan, L. (2001, August). Erisk Case Study: The California Power Crisis of 2000-2001. Retrieved on March 26, 2005 from the Erisk Learning Center’s Case Studies website, http://www.erisk.com/Learning/CaseStudies/ref_case_californiacrisis.asp. 80) (Not cited in this paper) 81) Hirst, E. & Kirby, B. (1999, March). Electricity Journal, 12, 2. Retrieved on March 26, 2005 from LexisNexis, which was accessed via the University of Maryland’s online library system, http://www.lib.umd.edu. 82) Goceliakova, Z. (2003, May). Interim Report IR-03-016, Real Options Model for Energy and Ancillary Services Markets. Retrieved on March 26, 2005 from the International Institute for Applied Systems Analysis website, http://www.iiasa.ac.at/Publications/Documents/IR-03-016.pdf.
83) Modeling Energy and Ancillary Service Markets. (2005) Retrieved on March 26, 2005 from the LCG Consulting website, http://www.energyonline.com/eolm/workshop.asp.
84) Annual Energy Review 2003. (2004, September). Retrieved on May 17, 2005 from the Energy Information Administration website, http://www.eia.doe.gov/emeu/aer/contents.html. 85) Energy Finance and Risk Management. Retrieved on May 17, 2005 from 128.100.139.22/seco/LectureNotes/energy.ppt. 86) Counsell, K., Evans, L. Day-Ahead Electricity Markets: Is There a Place for a Day-Ahead Market in the NZEM? Draft v. 1. Retrieved on May 17, 2005 from the New Zealand Institute for the Study of Competition and Regulation’s website, www.iscr.org.nz/documents/day-ahead_markets.pdf 87) Futures contract. (2005). Retrieved on March 12, 2005, from the InvestorWords.Com online dictionary website, http://www.investorwords.com/2136/futures_contracts.html.
141

Mara Hemminger Page 142 10/22/2005
88) The trading process. (2005). Retrieved on March 12, 2005 from Timing.Net, http://www.timing.net/trading-process.php. 89) What We Trade. (2005). Retrieved on March 7, 2005 from the NYMEX website, http://www.nymex.com/jsp/home/what_we_trade.jsp. 90) Leach, B. (2001). NYMEX Energy Markets and the Use of Environmental Data. Retrieved on March 12, 2005, from Data for Science and Society, The Second National Conference on Scientific and Technical Data (National Research Council, U.S. National Committee for CODATA), http://stills.nap.edu/html/codata_2nd/ch7.html. 91) Derivatives and Risk Management in the Petroleum, Natural Gas, and Electricity Industries. Retrieved on May 17, 2005 from http://www.eia.doe.gov/oiaf/servicerpt/derivative/chapter4.html. 92) Role of the CFTC. (2005). Retrieved on May 17, 2005 from the NYMEX website, http://www.nymex.com/jsp/about/ss_main.jsp?pg=10. 93) Forward contract. (2005). Retrieved on March 12, 2005, from the InvestorWords.Com online dictionary website, http://www.investorwords.com/2060/forward_contract.html. 94) Spot Market. (2005.) Retrieved on March 12, 2005, from the InvestorWords.Com online dictionary website, http://www.investorwords.com/4661/spot_market.html 95) Conversation 1 with Cal-ISO, January 18, 2005. 96) Conversation 2 with, Cal-ISO, January 18, 2005. 97) Morgenstein, S. Conversation on March 16, 2005. (Morgenstein is the Vice-President and Managing Director of Commercial Litigation Support (iCite) Division within Aspen Systems Corporation. ICite built FERC’s search tools for FERC to plunge the Enron email and telephone conversation datasets.) 98) Case, D.O. (2002). Looking for Information: A Survey of Research on Information Seeking, Needs, and Behavior. Boston, MA: Academic Press. (Consulting Editor: Harold Borko.) 99) Bill Number: AB1890 Chartered, Bill Text. Retrieved on May 23, 2005, from the CPUC website, http://info.sen.ca.gov/pub/95-96/bill/asm/ab_1851-1900/ab_1890_bill_960924_chaptered.html. 100) McLean, B., Elkind, P. (2004). The Smartest Guys in the Room: The Amazing Rise and Scandalous Fall of Enron. New York, NY: Penguin.
142

Mara Hemminger Page 143 10/22/2005
101) Makovich, L. Phone interview on May 27, 2005. Dr. Makovich is an energy policy researcher with the Cambridge Energy Research Associates (CERA). 102) Search Engines. (2003, November 10). Retrieved on May 26, 2005 from Dr. Douglas Oard’s Information Technology (LBSC-690) class notes, http://www.glue.umd.edu/~oard/teaching/690/fall03/notes/690f0310/. 103) Holding company. (2005). Retrieved on February 27, 2005, from the InvestorWords.Com online dictionary website, http://www.investorwords.com/2327/holding_company.html. 104) Vertical integration. (2003). Princeton University. Retrieved on February 27, 2005 from WordNet’s website, www.dictionary.com. 105) Leverage. (u/i date). Retrieved on February 27, 2005 from the InvestorWords.Com online dictionary website, http://www.investorwords.com/2786/leverage.html. 106) Rempel, G. (2000). The Great Depression. Retrieved on February 27, 2005 from Dr. Rempel’s Western Civilization course website, http://mars.acnet.wnec.edu/~grempel/courses/wc2/lectures/depression.html. 107) California: Electric: Summary. (2002). Retrieved on May 26, 2005, from the Energy Information Administration website, http://www.eia.doe.gov/emeu/states/main_ca.html, under Electric -> Summary. 108) California Natural Gas Infrastructure Outlook, 2002-2006. (2001, November). Retrieved on May 24, 2005, from the CPUC website, http://www.cpuc.ca.gov/published/report/natural_gas_report.htm#P80_3511. 109) Spring 2005 Career Fair. (2005). Retrieved on March 10, 2005 from the University of Maryland’s Spring Career Fair website, http://www.careercenter.umd.edu/employer/emp_events/springcareerfair2005.asp. Go to Spring Career Fair 2005 Registration, then to Spring Career Fair 2005 Participants, and search on “FERC.” 110) Subpoena duces tecum. (2005) Retrieved on March 23, 2005, from Per Law.Com Dictionary’s website, http://dictionary.law.com/. 111) eLibrary: Docket Prefix Information. (2005). Retrieved on March 23, 2005 from the FERC eLibrary’s Background information webpage, http://www.ferc.gov/docs-filing/eLibrary/docket-prefix.asp. 112) Letter from Catherine McCarty of LeBoeuf, Lamb, Greene, & MacRae (Enron’s lawyers) to Donald Gelinas, Associate Director of FERC’s Office of Markets, Tariffs and Rates. (2002, June 7).
143
Mara Hemminger Page 144 10/22/2005
113) Deposition. (2005). Retrieved on May 30, 2005, from Per Law.Com Dictionary’s website, http://dictionary.law.com/. 114) Interconnections, interconnects. (u/i date). Retrieved on March 27, 2005, from EnergyVortex.com’s online dictionary, http://www.energyvortex.com/frameset.cfm?source=/energydictionary/energyvortex.htm. 115) Index. (u/i date). Retrieved on June 7, 2005, from the InvestorWords.Com online dictionary website, http://www.investorwords.com/2426/Index.html. 116) Text REtrieval Conference (TREC). (u/i date). Retrieved on June 20, 2005, from the TREC website, http://trec.nist.gov/. 117) Frequently Asked Questions. (u/i date). Retrieved on June 20, 2005, from the TREC website, http://trec.nist.gov/faq.html. 118) Overview. (u/i date). Retrieved on June 20, 2005, from the TREC website, http://trec.nist.gov/overview.html. 119) Oard, D. (Spring 2004). Information Retrieval Systems class at the University of Maryland’s College of Information Studies. For more information about this course, see Dr. Oard’s LBSC 796 website, http://www.glue.umd.edu/~oard/teaching/796/spring04/. 120) Addressing the 2000-2001 Western Energy Crisis. (April 29, 2005). Retrieved on June 20, 2005 from the FERC website dedicated to PA02-2-000, http://www.ferc.gov/industries/electric/indus-act/wec/enron/enrondata.asp#skipnavsub. 121) Cohen, W. (2005, April 4). Enron email dataset. Retrieved on June 20, 2005, from Dr. Cohen’s website about the Enron email dataset, http://www-2.cs.cmu.edu/~enron/. 122) Brown, D., Giovanna, M., Grau, J., & Vidaver, D. (2003, February 11). Preliminary Electricity and Natural Gas Infrastructure Assumptions. Retrieved on June 21, 2005 from the California Energy Commission website, http://www.energy.ca.gov/2003_energypolicy/documents/2003-02-25+26_workshop/2003-02-13_100-03-004SD.PDF. Or go to the California Energy Commission website, http://www.energy.ca.gov/index.html, search for “electricity transmission lines,” and look for a document with the above PDF address. 123) Map of Electricity Market in California. (2001, April). Last updated in September 2004. Retrieved on June 21, 2005 from the California Energy Commission website, http://www.energy.ca.gov/maps/electricity_market.html. 124) California’s Major Electric Transmission Lines. (2004, July 1). Retrieved on June 21, 2005 from the California Energy Commission website, http://www.energy.ca.gov/maps/transmission_lines.html. 125) Conversation with FERC, January 31 and February 25, 2005.
144

Mara Hemminger Page 145 10/22/2005
126) Flood, Mary. (2005, February 25). Ex-Enron execs’ trial won’t start until 2006. Houston Chronicle. Retrieved on September 3, 2005, from the HoustonChronicle.com website, http://www.chron.com/cs/CDA/ssistory.mpl/special/enron/3056397. 127) Rogers, Jen. (2004, January 14). Fastow and his wife plead guilty. CNNMoney. Retrieved on September 3, 2005, from the CNNMoney website, http://money.cnn.com/2004/01/14/news/companies/enron_fastows/. 128) Enron ‘Mastermind’ Pleads Guilty. (2002, October 31). CBS News. Retrieved on September 3, 2005 from the CBS News website, http://www.cbsnews.com/stories/2002/10/17/national/main526018.shtml. 129) Arthur Anderson LLP v. United States. (2005, May 31). Supreme Court Online. Retrieved on September 3, 2005, from Kuke Law website, http://www.law.duke.edu/publiclaw/supremecourtonline/editedCases/artvuni.html. 130) California Natural Gas Infrastructure Outlook. (2002, November). Retrieved on September 8, 2005, from the California Public Utilities Commission website, http://www.cpuc.ca.gov/published/report/natural_gas_report.htm#P89_3811ref. 131) What FERC Does. (2005, January 4). Retrieved on May 26, 2005 from the FERC website, http://www.ferc.gov/about/ferc-does.asp. 132) Conversation with Dr. Douglas Oard, Associate Professor of Information Studies, University of Maryland at College Park, MD. (Fall, 2004). 133) Language Use in a Social Network: The Enron Email Dataset. (2001). Retrieved on September 10, 2005, from the Syracuse University’s Center for Natural Language Processing website, http://www.cnlp.org/presentations/present.asp?abstract=116. 134) Manning, C. & Raghavan, P. (2005, Winter). Web Search and Mining class, CS-276B/LING-239J. Retrieved on September 10, 2005, from Stanford University’s CS-276B/LING-239J class website, http://www.stanford.edu/class/cs276b/handouts/studentplans2.pdf. 135) Short position. (2005). Retrieved on September 12, 2005, from the InvestorWords.Com online dictionary website, http://www.investorwords.com/4554/short_position.html.
145