mapping customer needs to engineering...
TRANSCRIPT

Mapping Customer Needs to Engineering Characteristics: An
Aerospace Perspective for Conceptual Design
M.H. Eres a, M. Bertoni b, M. Kossmann c, and J.P. Scanlan a
a Faculty of Engineering and the Environment, University of Southampton,
Southampton, UK
b School of Engineering, Blekinge Institute of Technology, Sweden
c Airbus, Bristol, UK

Mapping Customer Needs to Engineering Characteristics: An
Aerospace Perspective for Conceptual Design
Designing complex engineering systems, such as an aircraft or an aero-engine, is
immensely challenging. Formal Systems Engineering (SE) practices are widely
used in the aerospace industry throughout the overall design process to minimise
the overall design effort, corrective re-work, and ultimately overall development
and manufacturing costs. Incorporating the needs and requirements from
customers and other stakeholders into the conceptual and early design process is
vital for the success and viability of any development programme. This paper
presents a formal methodology, the Value-Driven Design (VDD) methodology
that has been developed for collaborative and iterative use in the Extended
Enterprise (EE) within the aerospace industry, and that has been applied using the
Concept Design Analysis (CODA) method to map captured Customer Needs
(CNs) into Engineering Characteristics (ECs) and to model an overall ‘design
merit’ metric to be used in design assessments, sensitivity analyses, and
engineering design optimisation studies. Two different case studies with
increasing complexity are presented to elucidate the application areas of the
CODA method in the context of the VDD methodology for the EE within the
aerospace sector.
Keywords: aerospace conceptual design; customer needs; design merit; design
optimisation; value-driven design; extended enterprise
1. Introduction
The Advisory Council for Aeronautics Research in Europe (ACARE 2002) research
agenda firmly states that world aeronautics now stands at the threshold of a third age of
aviation. After the Pioneering Age and the Commercial Age, the sector is approaching a
“bright with opportunity, but heavy with risk” Age of Sustainable Growth, requiring
“more affordable, cleaner, quieter, safer and more secure air travel”. This age is
characterised by the relentless increase in aviation traffic (IATA 2010) and by the
evolution of the passengers’ travel behaviour and core values. Hence it requires a
fundamental change in the way engineering design activities are initiated, to balance the

upward demand and the broader needs of the society for economic and social benefits.
These issues raise the order of magnitude and complexity of engineering tasks to
a level that cannot be tackled only by improving existing design practices. Modern
aircraft development programmes, such as the Airbus A350 XWB (eXtra Wide Body)
program (AIRBUS 2012), feature about one hundred major work packages that are
contracted to risk sharing partners and key suppliers; these major work packages are
further sub-contracted to a large variety of other suppliers and sub-contractors in the
‘Extended Enterprise’ (EE). One should no longer speak about a ‘supply chain’,
because this would falsely imply a relatively simple structure; rather the term ‘supply
network’ should be used, as it describes more accurately the complexity and global
nature of the EE.
Systems Engineering (SE) (Sage 1992) standards, such as ISO 15288 (ISO/IEC
2008) and the INCOSE SE Handbook (INCOSE 2011), help in structuring the necessary
activities when dealing with a design problem of such complexity. One key discipline of
SE is Requirements Management (RM) (Nuseibeh and Easterbrook 2000), in which
contractual requirements are signed off between directly interfacing partners within the
EE (Browne and Zhang 1999) and Virtual Enterprises (VE) (Davidow and Malone
1993). They represent the main reference for any work at any level of the EE and VE,
ensuring robustness and quality of the development process outcome. However, to
reduce development cycles and times-to-market, companies have to start working ever
earlier in a programme context, long before mature requirements from the super system
are made available to them.
Such organisations traditionally have a number of options regarding how they
could deal with their situation: (1) they could wait and only start working after they
have received their validated input requirements from the aircraft level; (2) using
previous experience and a number of assumptions, they could start working at their
level, without exactly knowing what their input requirements will be; or (3) they could
ask for preliminary versions of their input requirements, in order to start their particular
work based on those.
All of these options have some serious drawbacks. The first one ensures that the
organisation will work on a sound basis, but it will not have much time to develop long
lead items, thus resulting in delays for the overall aircraft programme. The second
option is much riskier, prone to corrective rework that could lead to unplanned costs and
delays, and would potentially lead to conservative rather than innovative design
solutions. The third one implies a high degree of risk, as the development efforts would
be based on immature input requirements, invariably leading to high levels of corrective
rework, which in turn will lead to unplanned costs and delays, as well as conservative
rather than innovative design solutions.
In order to mitigate the effects of these drawbacks and to gain competitive edge,
aerospace manufacturers need to understand early on what drives the generation of
customer and other stakeholder value in a given business context. Hence, context
specific, multi-dimensional value considerations should be in the focus of early,
conceptual work for a new product or technology.
Within SE, “Value” is an interesting concept to indicate early stage solution
strategies. Value, in fact, could be used to communicate the “intent” of a design
throughout the supply network or EE, preceding, enhancing and complementing
requirements-based information. However, in the current SE standards “value” is not
covered in much detail yet and it is usually rather considered in monetary terms only
(INCOSE 2011). The ambition of the research work is, therefore, to enhance the way in
which context-specific, multi-dimensional “value” is used as the criterion to guide
preliminary design assessments across the aerospace supply network. This encompasses
the identification, development and testing of new methodological and technological
enablers to make “value” a clear and well-understood driver of early decision-making
activities.
The objective of this paper is to present the Value-Driven Design (VDD)
methodology, and the supporting Concept Design Analysis (CODA) method (Woolley
et al. 2000, Woolley et al. 2001, Feneley et al. 2003) to map customer needs (CNs) -
and in fact any other internal and external stakeholder needs - to high-level engineering
characteristics (ECs) during conceptual and preliminary design phases of aerospace
systems and components. The CODA method offers an enhancement of Quality
Function Development (QFD), providing a more sophisticated mapping between
requirements and key product attributes (Woolley et al. 2000, Woolley et al. 2001,
Feneley et al. 2003). This paper, therefore, describes: 1) the theoretical foundations of
the CODA approach that makes it suitable to establish the link between CNs and ECs;
2) the application of the approach within an aerospace development problem context;
and 3) the results of the validation activities conducted in collaboration with major
players in the European aerospace industry.
2. Literature Review
The engineering design process, within the overall context of product development,
continues to draw interest from academia and industry, and a number of reference
works describe systematic approaches to engineer designs in great detail (Hubka and
Eder 1988, Pugh 1991, Pahl and Beitz 1996, Otto and Wood 2001, Ulrich and Eppinger
2008, Ullman 2009). These methodologies have been in use in manufacturing industries
for decades and they certainly improved and expedited the design iterations during
product development.

Implementing a systematic engineering design process is vitally important for
large enterprises developing immensely complex products, such as in the aerospace
industry. Structured guidelines are particularly crucial in early design: according to
Blanchard (Blanchard 1978) about 75% of the life-cycle costs of any product are
determined by the design decisions made during the conceptual design stages; also,
implementing design changes later in the development program gets more difficult and
costly (Dowlatshahi 1992, Miles and Swift 1998). Hence, taking a decision on the best
concept (or a small set of top ranking concepts) which will be developed further in
detailed design for manufacturing is one of the most difficult, sensitive and critical
problems when approaching engineering design (Pugh 1991).
Decision making in engineering design
Decision making is a central concept in the design of engineering systems. On
one end, decision making is considered by some as the ‘fundamental construct of
engineering design’ (Chen et al. 2013). On the other end, engineering design is
sometime spelled out as “the set of decision-making processes and activities used to
determine the form of an object given the functions desired by the customer” (Eggert
2005).
Such a decision making process, however, it is often disconnected. As
elaborated by Chen and others traditional engineering design is conducted primarily
with an engineering-centric viewpoint, in which the objective is to achieve the best
performance constrained by the available budget (Chen et al. 2013). In general, this is
true for each of the major functional domains within a firm, which seek to optimise a
domain-specific objective with limited input from the other functional domains. This
way of working, they conclude, “cannot assure optimal decisions for an engineering
system at the enterprise level: the engineering-centric approach does not consider
customer demand, whereas the market-centric approach does not consider the intricacies
of engineering attribute coupling, and the resulting influence upon cost, for a product or
system design” (Chen et al. 2013).
Decision-Based Design (DBD) methodology is proposed as an enterprise-driven,
collaborative and interdisciplinary approach that embraces decision theory, and its
underlying mathematical principles, for making rigorous design decisions (Chen et al.
2013). DBD includes a number of methods to systematically integrate heterogeneous
consumer preference into engineering design. When it comes to purchasing a product,
many decisions are based on other attributes rather than solely on the purchase price.
For instance, when choosing a car, comfort, performance, reliability, size, safety, style,
image, equipment, handling, noise, running costs are just a few of the attributes the
customer value when making a purchasing decision (Donndelinger and Cook 1997,
Pozar and Cook 1997). DBD is intended to facilitate the integration of such
heterogeneous dimensions, to guide the selection of the preferred alternative in a
rigorous manner.
Among the opportunities for enhancing DBD, Chen and others propose to
investigate the intersection and interaction between engineering and marketing with
social science, to cope with the inherent challenges related to modelling consumer
choice behaviour early in the design process (Chen et al. 2013). Similar considerations
led the authors of this paper to develop an approach that links customer satisfaction with
a product’s engineering characteristics.
Decision making for concept selection
The conceptual design stage is the juncture in the entire design process, where
vital decisions for the success of any design or mission tend to go wrong (Mattson et al.
2009). A plethora of Concept Selection Methods (CSMs) are then proposed in literature
to mitigate such a problem, CSMs are broadly classified into four categories by Okudan
and Tauhid (Okudan and Tauhid 2008); however, the majority of the CSMs reported
tend to use a blend of these in order to encapsulate the best of each, these are:
• CSMs based on Decision Matrices, e.g. Pugh Charts (Pugh 1991) and Quality
Function Deployment (QFD) (Hauser and Clausing 1988, Akao 1990, Hjort et
al. 1992, Park et al. 2008, Sorensen et al. 2010, Mayyas et al. 2011),
• CSMs based on Analytic Hierarchy Process (AHP) (Zavbi and Duhovnik 1996,
Saaty and Vargas 2001, Saaty 2005a, Saaty 2005b, Ayag and Ozdemir 2007,
Afacan and Demirkan 2010, Mayyas et al. 2011, Remery et al. 2012),
• CSMs based on uncertainty modelling, e.g. probabilistic methods, sensitivity
analysis (Reddy and Mistree 1992),
• CSMs based on Decision Theory/Economics models, e.g. the Thurston-Locascio
methodology (Thurston and Locascio 1994),
• CSMs based on optimisation concepts, e.g. Pareto optimality concept (Mattson
and Messac 2005).
Tools and methods to support concept selection
One of the most widely accepted CSMs is the Quality Function Deployment
(QFD) method. QFD originated in 1972 at Mitsubishi’s Kobe shipyard site (Hauser and
Clausing 1988). Since its conception by Joji Akao and his colleagues, the QFD method
has been widely used in the fields of product development, quality management,
customer needs analysis, product design, planning, engineering, decision-making, and
management (Chan and Wu 2002). QFD is arguably the most popular framework for
the implementation of company or enterprise level design decision tools and it is
basically a set of hierarchical matrices where the internal and external CNs are mapped
into measurable or quantifiable ECs. There are a large number of review articles on the
QFD method and recent developments in terms of QFD research, spanning more than
four decades (Chan and Wu 2002, Sharma et al. 2008, Xu et al. 2010).
Quite a number of studies and various techniques have been attempted to
investigate the modelling of the relationship between CNs and ECs in QFD. It is widely
recognised that QFD involves substantial subject judgment while constructing a house
of quality; thus existence of fuzziness in QFD is unavoidable (Verma et al. 1998,
Bouchereau and Rowlands 2000, Song et al. 2013). In order to address the fuzziness of
the modelling, quite a few previous studies have adopted the fuzzy set theory on
modelling the relationships between CNs and ECs (Thurston and Carnahan 1992, Fung
et al. 1998, Park and Kim 1998, Verma et al. 1998, Wang 2001). As an alternative,
stepwise regression analysis method has been utilised to produce second-order
polynomials to model the functional relationships between CNs and ECs in QFD
(Dawson and Askin 1999).
More recently, these relationships have been modelled by employing a fuzzy
rule-based systems approach with an asymmetric triangular fuzzy coefficient (Fung et
al. 2003); by adopting a fuzzy rule-based approach to build models relating CNs to ECs
(Chen et al. 2004, Park and Han 2004, Fung et al. 2006); or by using a multi-criteria
decision-making framework based on a fuzzy logic-based composite structure
methodology on the evaluation of a marine and offshore engineering design proposals
(Sii et al. 2004). More recent examples include a multi-layer graph model that not only
resolves the conflict of experts’ opinion but also aggregates the layers corresponding to
decision criteria into a single graph (Erginel 2010, Jenab et al. 2013).
However, fuzzy logic is a rather lengthy methodology which offers a limited
advantage when used as a design concept evaluation method (Ayag and Ozdemir 2007)
as it makes decisions with mathematical equations (King and Sivaloganathan 1999),
which are usually not known during the early stage of product development (Song et al.
2013). These limitations hinder the application of fuzzy approaches, asking for a more
qualitative approach that fits within the time constraints, as well as with data availability
restrictions of preliminary design activities.
It is also widely recognized that the behaviour of the relationships between CNs
and ECs is extremely complex and the dependencies can be non-linear (Thurston 2001,
Duck Young and Xirouchakis 2010, Erginel 2010). Most of the aforementioned CSMs
can only be used to develop models with linear terms, and generation of interaction
terms and/or higher-order terms of models cannot be addressed (Chan et al. 2011).
QFD, for instance, uses a linear relationship (positive or negative) to map CNs to ECs,
which simply makes it impossible to model more complex behaviours. For instance, the
relationship between the CN of “Ease of reading in the cockpit” and the EC of
“Illumination level [lux]” can only be modelled by using an optimisation type function,
which describes an optimum level of illumination in the cockpit at which the customer
satisfaction level with respect to reading will be higher compared to both lower and
higher levels of illumination.
Artificial neural networks have been used to develop non-linear models in other
domains (Tong et al. 2004); however, they normally require a large amount of precise
and objective information regarding product concepts, which is not easily available at
the early stage of the new product design process (Rosenman 1993), as the amount and
the quality of data sets for developing these models are usually very limited (Fung et al.
2006, Xu and Yan 2006, Kwong et al. 2007, Song et al. 2013). This also hinders the
application of methods that use real values (from appropriate databases) to model the
relationship between the CNs and ECs (Brackin and Colton 2002). The lack of precise

engineering data results in a more intuitive and less data-consuming approach to model
the non-linearity in the functional relationships. Hence, the approach introduces non-
linear optimisation type functions, which are also intended to solve one of the major
issues related to the use of QFD in design optimisation problems, i.e. the fact that QFD
does not accommodate negatives - alternatives that detract from an attribute rather than
contribute to it (Collopy 2009).
Another limitation of the QFD method is that the overall implication of design
changes by varying ECs is not easily apparent; therefore, QFD is not really suitable for
engineering design optimisation, trade-off studies, and sensitivity analyses. In order to
alleviate these shortcomings, the CODA method was identified as a suitable candidate
to link CNs to ECs during the representative preliminary design phases of aircraft
development programmes.
3. Methodology
The paper’s findings – which are the methodological and technological enablers for
value assessment - have been developed within an European Commission’s Seventh
Framework (FP7) Programme project entitled “Collaborative and Robust Engineering
using Simulation Capability Enabling Next Design Optimisation” (CRESCENDO
2012).
Empirical and qualitative data have been mainly collected through the authors’
active participation in physical and virtual work-meetings involving major European
aircraft, aero-engine and sub-systems manufacturers (Airbus, Rolls-Royce, and GKN
Aerospace Engine Systems Sweden, respectively) between May 2009 and October
2012. The definition and clarification of the problem domain have been conducted in
close collaboration with the industrial partners, featuring regular (bi-annual), multi-day
physical workshops, which have involved a total of 35 participants from 12 different
partners including manufacturers (aircraft, aero-engine and sub-system), universities,
research centres and software vendors.
The gathering and analysing of the user needs as well as the definition of the
methodological and technological enablers have been aided by regular multi-day visits
to Airbus, Rolls-Royce, and GKN Aerospace Engine Systems Sweden. Data have been
gathered through semi-structured interviews with managers, engineers and information
technology (IT) experts involved in the development of hardware, software and services
related to aerospace products.
Reflective learning has been aided by the continuous participation in regular
debriefing activities, which have taken the form of weekly virtual meetings. The
findings have been iteratively discussed and validated with the project partners, which
have actively participated with their knowledge and expertise to the development of a
preliminary mock-up for value assessment.
The validation of the research outcomes has been aided by three multi-day
project reviews involving key stakeholders from a wide range of companies in the
European aeronautical industry. Dissemination activities have also contributed in
validating the generalizability of the approach, through the contribution of companies
and universities that were not directly involved with the CRESCENDO project.
Within the CRESCENDO research project, an integrated scenario was used to
apply and validate the Value-Driven Design (VDD) methodology (Kossmann et al.
2012, Isaksson et al. 2013). Figure 1 shows three simplified levels of the EE, i.e. the
aircraft level, the engine level and the sub-system level. The VDD methodology is a
generic, upfront, add-on (to the traditional RM process) activity that takes place
iteratively, potentially across all levels of the EE to provide early context-specific,
multi-dimensional value information throughout the EE, in order to:

• Enable the selection of early concepts and designs that represent the highest
contribution in terms of their value;
• Enable the optimisation of the final product or system at the highest integration
level (in terms of the overall value contribution) as opposed to local optimisation
at one or different levels;
• Enhance the development of high quality and value-driven requirements based
on these value generation activities.
Figure 1: Enhancing the traditional requirements management process.
For the purpose of validating the VDD methodology in the context of
CRESCENDO, two iterations across the above mentioned three simplified levels of the
EE were considered. In reality, of course, there would be many more levels (vertical
dimension) and teams in parallel (horizontal dimension), as well as multiple iterations.
Figure 2 displays the integrated scenario over the three levels and two iterations.
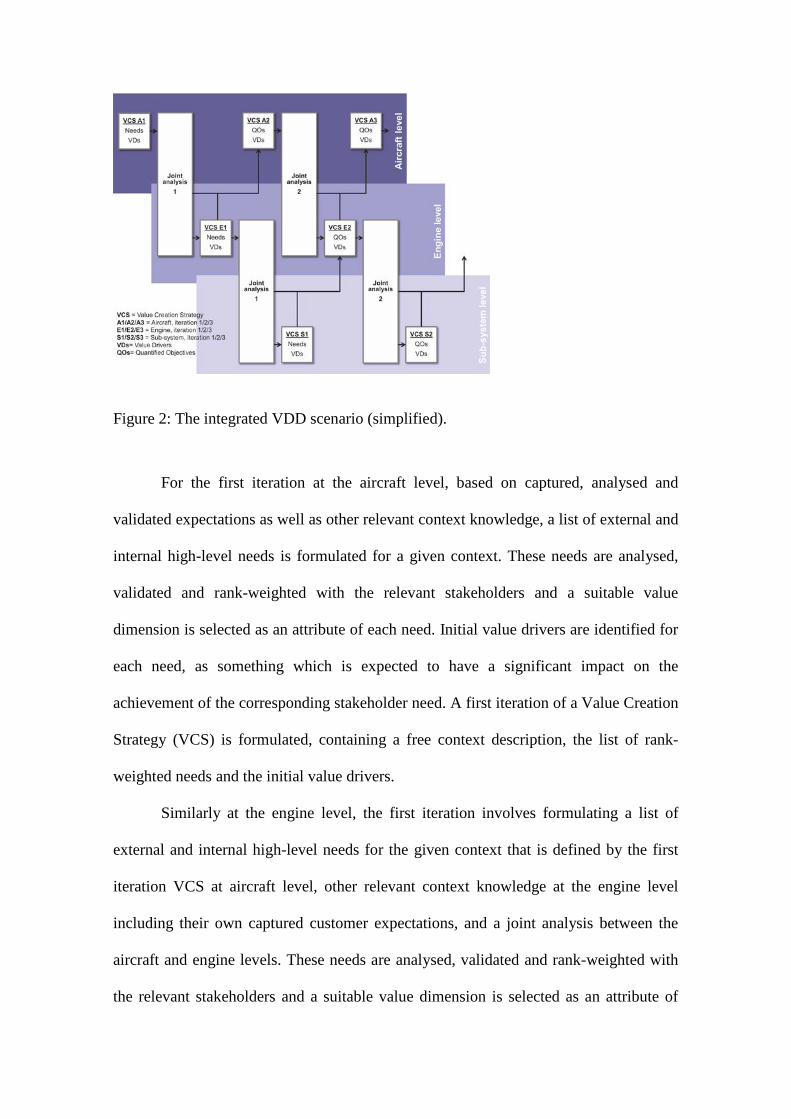
Figure 2: The integrated VDD scenario (simplified).
For the first iteration at the aircraft level, based on captured, analysed and
validated expectations as well as other relevant context knowledge, a list of external and
internal high-level needs is formulated for a given context. These needs are analysed,
validated and rank-weighted with the relevant stakeholders and a suitable value
dimension is selected as an attribute of each need. Initial value drivers are identified for
each need, as something which is expected to have a significant impact on the
achievement of the corresponding stakeholder need. A first iteration of a Value Creation
Strategy (VCS) is formulated, containing a free context description, the list of rank-
weighted needs and the initial value drivers.
Similarly at the engine level, the first iteration involves formulating a list of
external and internal high-level needs for the given context that is defined by the first
iteration VCS at aircraft level, other relevant context knowledge at the engine level
including their own captured customer expectations, and a joint analysis between the
aircraft and engine levels. These needs are analysed, validated and rank-weighted with
the relevant stakeholders and a suitable value dimension is selected as an attribute of

each need. Initial value drivers are identified for each need. These value drivers are
likely to differ at least partly from the value drivers defined at the aircraft level. Then, a
first iteration VCS is formulated, at the engine level, containing a free context
description, the list of rank-weighted needs and the initial value drivers.
The first iteration at the sub-system level is similar to the process at the engine
level. Again, at least some of the value drivers at the sub-system level are likely to
differ from the value drivers defined at the engine level regarding content and level of
granularity and detail. Then a first iteration VCS is formulated, at the sub-system level,
containing a free context description, the list of rank-weighted needs and the initial
value drivers.
During the second iteration at the aircraft level, based on feedback from the joint
analysis and in light of the first iteration of the VCS at engine level, relevant quantified
objectives are elaborated based on the previously identified value drivers that are
expected to jointly satisfy the set of rank-weighted stakeholder needs. This set of
quantified objectives will be subject to specific value modelling activities by means of
suitable methods and tools, in order to optimise the overall value contribution of the
entire set of quantified objectives. Also, the initial set of value drivers is either
confirmed or modified in light of the above value modelling activities. A second
iteration VCS is then formulated at the aircraft level, containing a refined free context
description, the list of rank-weighted needs, the confirmed or updated value drivers, and
the set of rank-weighted quantified objectives.
Similarly during the second iteration at the engine level, based on feedback from
the joint analysis and in light of the second iteration of the VCS at aircraft level,
relevant quantified objectives are elaborated that are expected to jointly satisfy the rank-
weighted stakeholder needs. Again, this set of quantified objectives will be subject to

specific value modelling activities by means of suitable methods and tools, in order to
optimise the overall value contribution of the entire set of quantified objectives. The
initial set of value drivers is either confirmed or modified in light of the above value
modelling activities. Then, a second iteration VCS is formulated at the engine level,
containing a refined free context description, the list of rank-weighted needs, the
confirmed or updated value drivers, and the set of rank-weighted quantified objectives.
Finally, during the second iteration at the sub-system level, based on feedback
from the joint analysis and in light of the second iteration of the VCS at engine level,
relevant quantified objectives are elaborated that are expected to jointly satisfy the rank-
weighted stakeholder needs. Again, this set of quantified objectives will be subject to
specific value modelling activities by means of suitable methods and tools, in order to
optimise the overall value contribution of the entire set of quantified objectives. The
initial set of value drivers is either confirmed or modified in light of the above value
modelling activities. Finally, a second iteration VCS is formulated at sub-system level,
containing a refined free context description, the list of rank-weighted needs, the
confirmed or updated value drivers, and the set of rank-weighted quantified objectives.
The Value-Driven Design (VDD) methodology as described in this section of
the paper is independent from the methods and tools that are used to carry out the
described value-modelling activities. In the following section, the CODA method will
be described in more detail, which was used as one of the suitable methods to support
the VDD methodology.
4. Theoretical Foundations
The CODA method can be used in assessing the value generated by improving customer
satisfaction level during the conceptual design phase of a new product. A CODA model
allows the designers to systematically modify tangible and measurable ECs and to

immediately see their effects on the customer satisfaction level of the product. This
approach enables designers to perform a wide range of analyses, such as trade-off and
what-if studies, sensitivity analysis, and engineering design optimisation.
In order to calculate the overall value of a new design two orthogonal measures
are usually needed. These are:
1. The total cost of the product: For disposable products the total cost involves
just the development and manufacturing costs; on the other hand, for a
repairable and revenue generating product, the total cost may also involve
operating costs, maintenance costs, and attrition costs. The calculation of unit
costs is relatively straightforward and a wide range of parametric costing tools
exists in the manufacturing industry. Similarly, high fidelity models on
operating, maintenance and life-cycle costs are commonly used in the aerospace
industry.
2. Performance: This is not merely the physical performance of the product, but
how well the product meets the needs of the customers. Compared to total costs,
many performance measures are less tangible and more difficult to quantify for
early product designers.
The CODA method employs three different merit functions to calculate a performance
metric (or a customer satisfaction level) of a new product. These are:
1. Maximising function
2. Minimising function
3. Optimising function
Representative merit functions for various ECs are presented in Figure 3. The
maximum take-off weight of an aircraft or the sea level static thrust of engines can be
modelled with a maximising function as higher values of these ECs correspond to

higher customer satisfaction levels. On the contrary, specific fuel consumption of
engines or the cabin noise level of an aircraft need to use a minimising function as
lower levels of these ECs are more desirable. For some other ECs, such as the cockpit
illumination level or the legroom in the economy class cabin, a target setting may be
more appropriate and the optimising function offers a more viable alternative than
minimising and maximising functions.
Figure 3: Representative merit functions for various engineering characteristics showing
their effects on customer satisfaction levels.
The maximising function describes the increasing nature of the customer
satisfaction level with increasing EC and it has the following mathematical form:
𝑓Max(𝜌) = 1 − 1
2𝜌𝜂 (1)
Here, 𝜌 is the value of the EC and 𝜂 is the neutral point of the EC. When the value of
the EC is equal to the neutral point value, the merit function has the value of 0.5 (See
Figure 4) representing a 50% customer satisfaction level. When the EC value 𝜌 for a

design alternative is greater than the neutral point 𝜂 the customer satisfaction level
increases.
Figure 4: The effect of neutral point 𝜂 on the merit value for the maximising function.
Conversely, the minimising function describes the decreasing nature of the
customer satisfaction level with increasing EC and it has the following mathematical
form:
𝑓Min(𝜌) = 1 − 1
2𝜂𝜌 (2)
In the minimising function, when the value of the EC, i.e. 𝜌, is equal to the neutral point
value, i.e. 𝜂, the merit function has the value of 0.5 (See Figure 5). In contrast to the
maximising function, when the EC value 𝜌 for a design alternative is smaller than the
neutral point 𝜂 the customer satisfaction level reaches values above 50%.
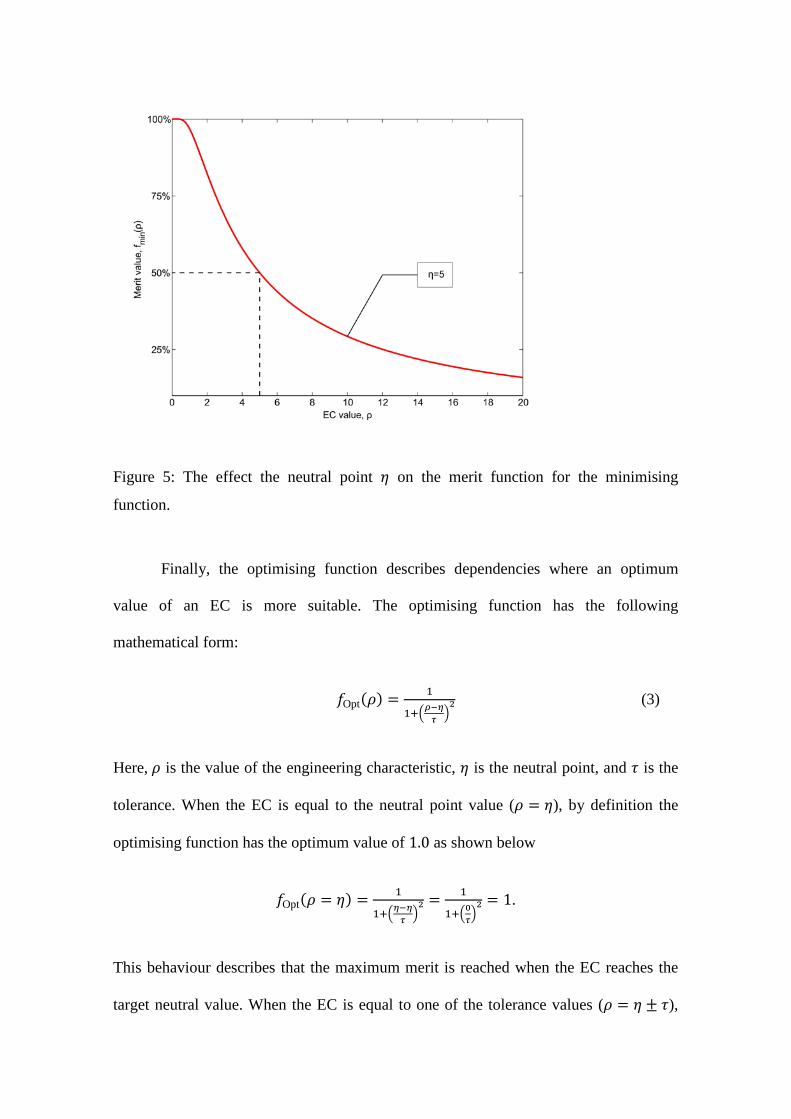
Figure 5: The effect the neutral point 𝜂 on the merit function for the minimising
function.
Finally, the optimising function describes dependencies where an optimum
value of an EC is more suitable. The optimising function has the following
mathematical form:
𝑓Opt(𝜌) = 1
1+�𝜌−𝜂𝜏 �2 (3)
Here, 𝜌 is the value of the engineering characteristic, 𝜂 is the neutral point, and 𝜏 is the
tolerance. When the EC is equal to the neutral point value (𝜌 = 𝜂), by definition the
optimising function has the optimum value of 1.0 as shown below
𝑓Opt(𝜌 = 𝜂) = 1
1+�𝜂−𝜂𝜏 �2 = 1
1+�0𝜏�2 = 1.
This behaviour describes that the maximum merit is reached when the EC reaches the
target neutral value. When the EC is equal to one of the tolerance values (𝜌 = 𝜂 ± 𝜏),
again, by definition the optimising function has the value of 0.5 as shown below
𝑓Opt(𝜌 = 𝜂 ± 𝜏) = 1
1+�𝜂±𝜏−𝜂𝜏 �
2 = 1
1+�±𝜏𝜏 �
2 = 0.5.
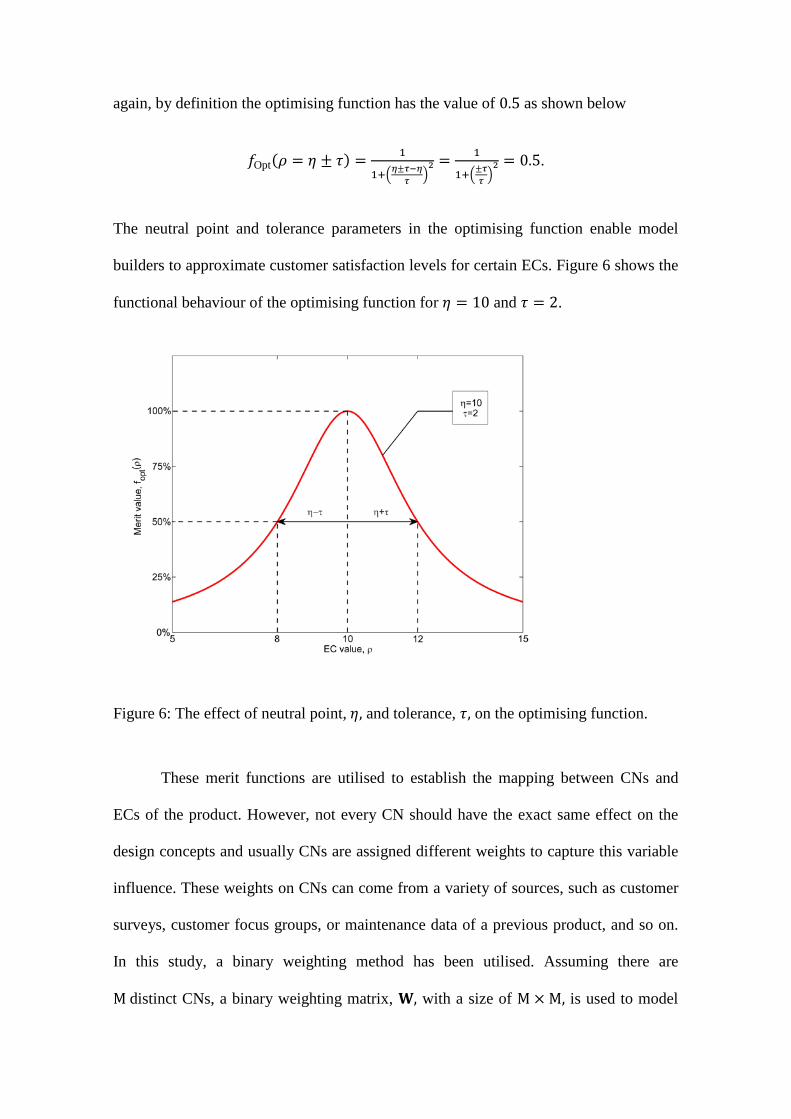
The neutral point and tolerance parameters in the optimising function enable model
builders to approximate customer satisfaction levels for certain ECs. Figure 6 shows the
functional behaviour of the optimising function for 𝜂 = 10 and 𝜏 = 2.
Figure 6: The effect of neutral point, 𝜂, and tolerance, 𝜏, on the optimising function.
These merit functions are utilised to establish the mapping between CNs and
ECs of the product. However, not every CN should have the exact same effect on the
design concepts and usually CNs are assigned different weights to capture this variable
influence. These weights on CNs can come from a variety of sources, such as customer
surveys, customer focus groups, or maintenance data of a previous product, and so on.
In this study, a binary weighting method has been utilised. Assuming there are
M distinct CNs, a binary weighting matrix, 𝐖, with a size of M × M, is used to model

the relative importance of every CN to each other. By definition the binary weighting
matrix W is an upper triangular square matrix, and if the CN on the row is inherently
more important than the one in the column, a numerical value of one is used. Similarly,
when the CN on a row is decided to be less important than the one in the column, a
numerical value of zero is used. This method allows the designer to assess the
importance of CNs in pairs and the overall process requires M × (M − 1)/2 number of
decisions to be made. Hence, if the number of CNs in the analysis becomes very large,
the management of binary weighting model can be demanding. A simplified example of
a binary weighting model for an aircraft is presented in Figure 7.
Figure 7: A simplified version of an aircraft level binary weighting model.
When all the pairwise decisions on all of the customer needs are performed, the
overall normalised weights, 𝑵𝒊, can be calculated by using the following formula.
𝑁𝑖 = 𝑋𝑖+𝑌𝑖+1∑ (𝑋𝑖+𝑌𝑖+1)𝑀𝑖=1
(4)
Here, 𝑋𝑖 values are the total number of ones for each row of customer needs and they
are calculated as follows:

𝑋𝑖 = ∑ 𝑊𝑖𝑗 for 𝑖 = 1⋯ (𝑀− 1) and 𝑋𝑀 ≡ 0𝑀𝑗=𝑖+1 (5)
Similarly, 𝑌𝑖 values are the total number of zeroes for each column of customer needs
and they are calculated as follows:
𝑌1 ≡ 0 and 𝑌𝑖 = ∑ �1 −𝑊𝑗𝑖� for 𝑖 = 2⋯𝑀𝑖−1𝑗=1 (6)
Note that, in Figure 7 the 𝑌𝑖 scores (highlighted row at the bottom) are transposed next
to the scores in order to calculated the biased scores 𝑋𝑖 + 𝑌𝑖 + 1. Finally each biased
score is normalised with the sum of all biased scores to yield a percentage weight for
each customer need. These normalised scores are then transferred to the main overall
design merit calculation model as shown in Figure 8.
In order to model the overall design merit, a functional relationship between each
EC and corresponding customer need is assumed. These functional relationships are in
the form of minimisation, maximisation, or optimisation form and they are functions of
each EC’s parameter value. If there are 𝑁 engineering characteristics and 𝑀 customer
needs, the individual customer satisfaction level for each customer need 𝐶𝑆𝑖, is
calculated by using the following formula:
𝐶𝑆𝑖 = 𝑁𝑖𝑆𝐶𝐹𝑖
∑ 𝑀𝑉𝑖𝑗 ∙ 𝐶𝐹𝑖𝑗𝑁𝑗=1 (7)
Here, 𝑀𝑉𝑖𝑗 = 𝐹𝑖𝑗�𝜌𝑗� is a function of each EC’s parameter value, 𝐶𝐹𝑖𝑗 is the correlation
matrix between ECs and customer needs (A numeric value 0.1, 0.3, and 0.9 are used for
weak, medium and strong correlations), and 𝑆𝐶𝐹𝑖 is the sum of all correlation factors for
each customer need. Finally, the overall design merit (ODM) is simply the sum of all
design merits corresponding to each customer need:

𝑂𝐷𝑀 = ∑ 𝐶𝑆𝑖𝑀𝑖=1 (8)
Here, it is assumed that the CNs are sufficiently analysed and they meet the
independence conditions (Zhang et al. 2013). For a step-by-step example the user is
referred to our first case study in Section 5.
Figure 8: An excerpt from the overall design merit calculation model for an aircraft.
The proposed CODA method involves the following steps:
1. Identify the needs of the customers and other stakeholders. These can be
done by employing individual surveys, customer focus groups, expert
panels, and similar processes.
2. Calculate the percentage weights of each identified customer or other
stakeholder need. In this paper a binary weighting method is used; however,
other analytical models, such as the AHP (Saaty 2005a, Saaty and
Sodenkamp 2010), can be employed.
3. Identify ECs of the design along with their lower and upper limits that have
an effect on any number of customer needs. The “Engineering characteristics

should describe the product in measurable terms and should directly affect
customer perceptions.” (Hauser and Clausing 1988)
4. Decide on the functional relationships between each CN and the
corresponding EC. This step requires the following steps:
a. Is there a strong (0.9), medium (0.3), weak (0.1), or no correlation?
b. If there is a correlation, decide which relationship function
(minimisation, maximisation, or optimisation type) to use.
c. Depending on the functional relationship, decide the values of neutral
point, optimal point, and tolerance.
d. Calculate the individual merit value.
5. Repeat step 4 for each customer need and EC. Note that, if there is an EC
which has no effect on any of the customer needs, it may be removed from
the model. Similarly, if there is a customer need which is not affected by any
EC, step 3 is used to find further possible ECs to improve the model.
6. Calculate the overall design merit by adding individual merit values.
Note that it is not always possible to map every EC to a customer need and there will be
entries with zero correlation values in the mapping. However, after following the step 4
in the aforementioned methodology, if there is an EC which cannot be mapped to any
customer need, it is either redundant or a customer need might have been overlooked at
step 1 (Hauser and Clausing 1988). Similarly, there might be a case of a customer need
that cannot be mapped from any EC. In this case, it is very likely that the step 3 in the
method is incomplete and further analysis is needed in order to identify at least one EC
that can influence that particular customer need (Hauser and Clausing 1988).
After successfully building and verifying the CODA model, the mappings
between the ECs and customer needs are frozen and the model becomes a scalar
function of 𝑁 ECs, 𝑂𝐷𝑀(𝜌1,𝜌2, … ,𝜌𝑁), that calculates the overall design merit (or
customer satisfaction level) on a normalised scale from zero to unity. This 𝑁-
dimensional merit function can easily be used as a scalar metric in assessing different
design options. Furthermore, the design merit function can be used in design
optimisation studies and sensitivity analyses.
5. Case Studies
Case Study 1: A bicycle wheel design selection model
In order to elucidate the CODA method and the practical aspects of the modelling
effort, a simple bicycle wheel selection model is selected. For the sake of brevity, this
model has five simple CNs with equal importance weights, i.e. 20% and they are: 1)
Stiffness, 2) Friction, 3) Weight, 4) Manufacturability, and 5) Repairability. These CNs
are identified through the CODA steps 1 and 2. Next, there are four relevant ECs
identified for these CNs (CODA step 3), and these are: 1) Tyre diameter, 2) Tyre width,
3) Spoke thickness, and 4) Use of composites. Sample values, lower and upper limits,
and units of these ECs are given in Table 1.
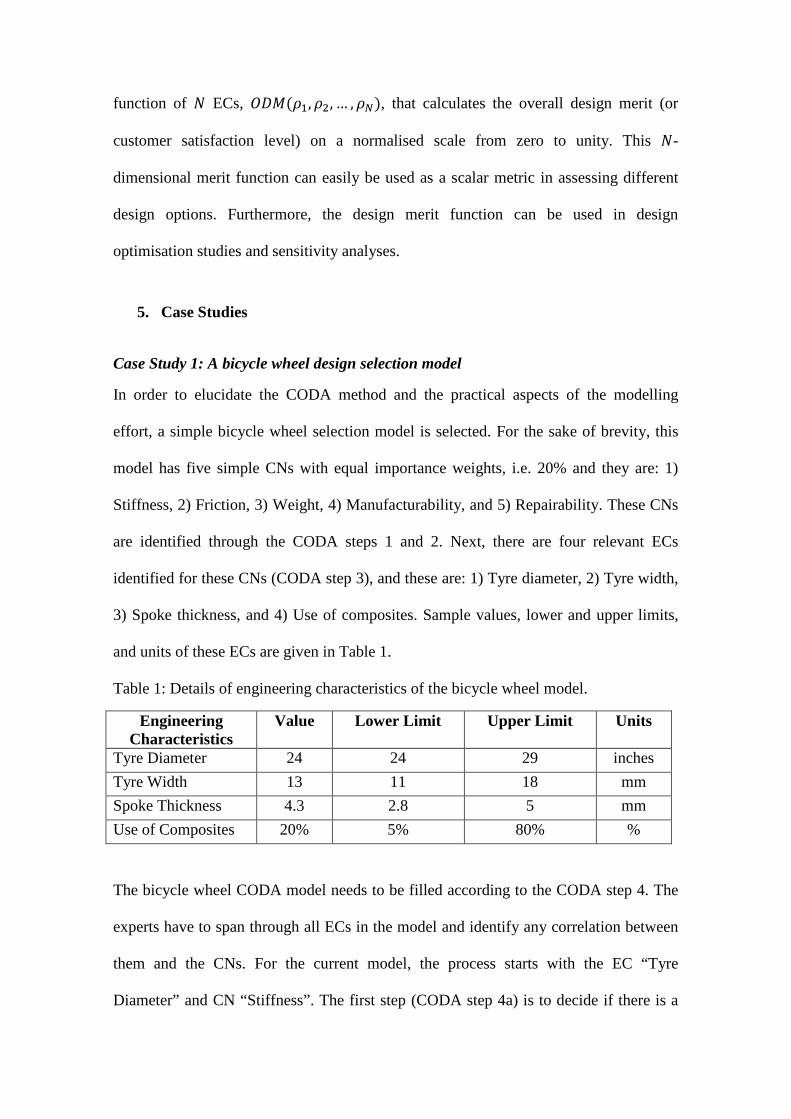
Table 1: Details of engineering characteristics of the bicycle wheel model.
Engineering Characteristics
Value Lower Limit Upper Limit Units
Tyre Diameter 24 24 29 inches Tyre Width 13 11 18 mm Spoke Thickness 4.3 2.8 5 mm Use of Composites 20% 5% 80% %
The bicycle wheel CODA model needs to be filled according to the CODA step 4. The
experts have to span through all ECs in the model and identify any correlation between
them and the CNs. For the current model, the process starts with the EC “Tyre
Diameter” and CN “Stiffness”. The first step (CODA step 4a) is to decide if there is a

correlation between “Tyre Diameter” and “Stiffness” and if so, to decide the level of the
correlation (weak, medium, or high). For this particular case, a strong (0.9) correlation
between the “Tyre Diameter” and “Stiffness” is chosen. If a stiffer wheel is preferred
for the design, smaller tyre diameters will generate a better customer satisfaction.
Hence, a minimisation type relationship is chosen (CODA step 4b) which only needs a
neutral point to identify where in the solution domain 50% customer satisfaction is
achieved (CODA step 4c). For this example the neutral point is chosen to be 29 inches.
Using the minimisation function from equation 2
𝑓Min(24 inches) = 1 − 1
2�29 inches24 inches�
= 57%,
the individual merit value or customer satisfaction for a specific “Tyre Diameter” of 24
inches can be found. This process is repeated for all CN and EC combination in the
model. As expected some ECs do not have any effect on some of the CNs, and the
correlation value for those are set to be zero. These mappings are also highlighted
yellow (see “Tyre Diameter” on “Manufacturability” and “Reparability” in Figure 9) as
a graphical feedback to the users.
After all of the sub-steps in the CODA step 4 have been finished, the sums of
correlation factors, 𝑆𝐶𝐹𝑖, for each CN can be calculated. For instance, the 𝑆𝐶𝐹1 for
“Stiffness” simply is
𝑆𝐶𝐹1 = 0.9 + 0.3 + 0.9 + 0.3 = 2.4.
This process is repeated for the rest of the CNs to populate the “Sums of Correlations”
row in the model (see Figure 9).

Figure 9: Simple CODA model for a bicycle wheel design selection (example).
The sums of design merits, 𝐶𝑆𝑖, for each CN are calculated by using equation 7.
Again, for the “Stiffness” column, the sum of design merits is as follows:
𝐶𝑆1 = 𝑁1𝑆𝐶𝐹1
∑ 𝑀𝑉1𝑗 ∙ 𝐶𝐹1𝑗4𝑗=1 ,
𝐶𝑆1 = 20%2.4
(0.9 × 57% + 0.3 × 53% + 0.9 × 63% + 0.3 × 31%) = 11.07%.
This calculation is performed for the remainder of all CNs in the model. And, finally,
the overall design merit is the sum of all individual design merits for each CN as given
in equation 8. For the current model the ODM is:
𝑂𝐷𝑀 = 11.07% + 10.82% + 9.55% + 15.17% + 11.26% = 57.88%.
When all of the correlation factors, functional relationships, and relevant parameters in
the CODA model have been decided upon, the CODA model becomes a function of the
actual values of the ECs. For the current model, the designers can vary the values for
tyre diameter and thickness, spoke thickness, and use of composites in design decisions

or engineering design optimisation studies. For example, the non-linear dependencies
between the ECs and the overall design merit (see Figure 10) and surrogate models of
the design landscape (see Figure 11) provide valuable information to early concept
designers.
Figure 10: Main effects graph showing the non-linear dependencies between ECs and
the overall design merit for the following baseline values: spoke thickness 5 mm, tire
diameter of 28 inches, tire width of 15 millimetres, and use of composites 66%. The
actual ranges (±10% of the baseline values) of the ECs on the horizontal axis are
marked as ‘Low’ and ‘High’.
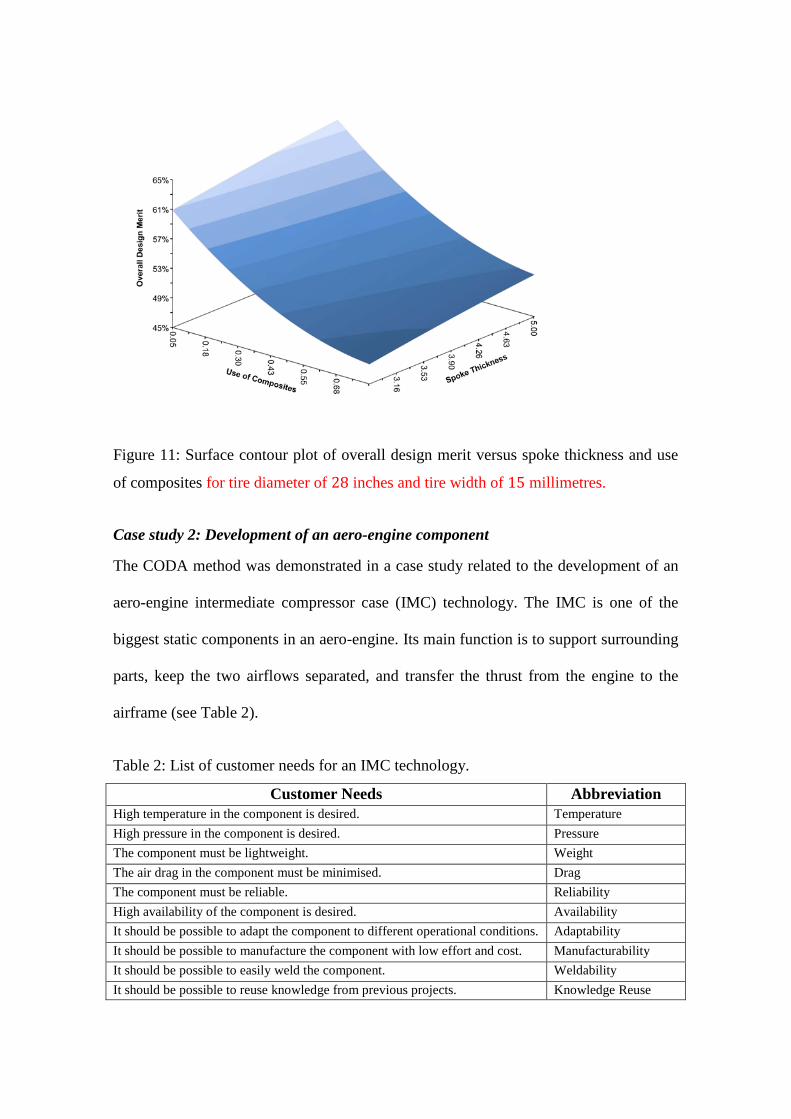
Figure 11: Surface contour plot of overall design merit versus spoke thickness and use
of composites for tire diameter of 28 inches and tire width of 15 millimetres.
Case study 2: Development of an aero-engine component
The CODA method was demonstrated in a case study related to the development of an
aero-engine intermediate compressor case (IMC) technology. The IMC is one of the
biggest static components in an aero-engine. Its main function is to support surrounding
parts, keep the two airflows separated, and transfer the thrust from the engine to the
airframe (see Table 2).
Table 2: List of customer needs for an IMC technology.
Customer Needs Abbreviation High temperature in the component is desired. Temperature High pressure in the component is desired. Pressure The component must be lightweight. Weight The air drag in the component must be minimised. Drag The component must be reliable. Reliability High availability of the component is desired. Availability It should be possible to adapt the component to different operational conditions. Adaptability It should be possible to manufacture the component with low effort and cost. Manufacturability It should be possible to easily weld the component. Weldability It should be possible to reuse knowledge from previous projects. Knowledge Reuse

These CNs are identified in the very early beginning of the design process, and
represent the main criteria upon which the value of an IMC concept will be assessed.
The number of 10 needs was considered as a good trade-off between simplicity and
detail, allowing the drivers to be managed without being overwhelmed with too many
details. A binary weighting was used to model the relative importance of these needs,
on the basis of the information provided by the aero-engine manufacturer.
The purpose of the demonstration activity was to benchmark two innovative
design concepts against an existing product baseline. Option #1 embodied a fully-casted
design featuring 8-10 inner struts and 16-20 outer struts. It also included also a casted
hub that implements a bleed off-take function. Option #2 featured a more radical design,
characterised by an increased use of composite material, but not featuring a bleed air
off-take function.
To detail the engineering characteristics of these options (and of the baseline
design), the IMC was split into 6 main constituent parts (see Figure 12): Mount Lugs
(ML), Outer Fan Case (OFC), Outlet Guide Vanes (OGV), Thrust Lugs Support (TLS),
Hub Outer Wall (HOW) and Hub Inner Wall (HIW).
Figure 12: Main parts used to define the IMC engineering characteristics.
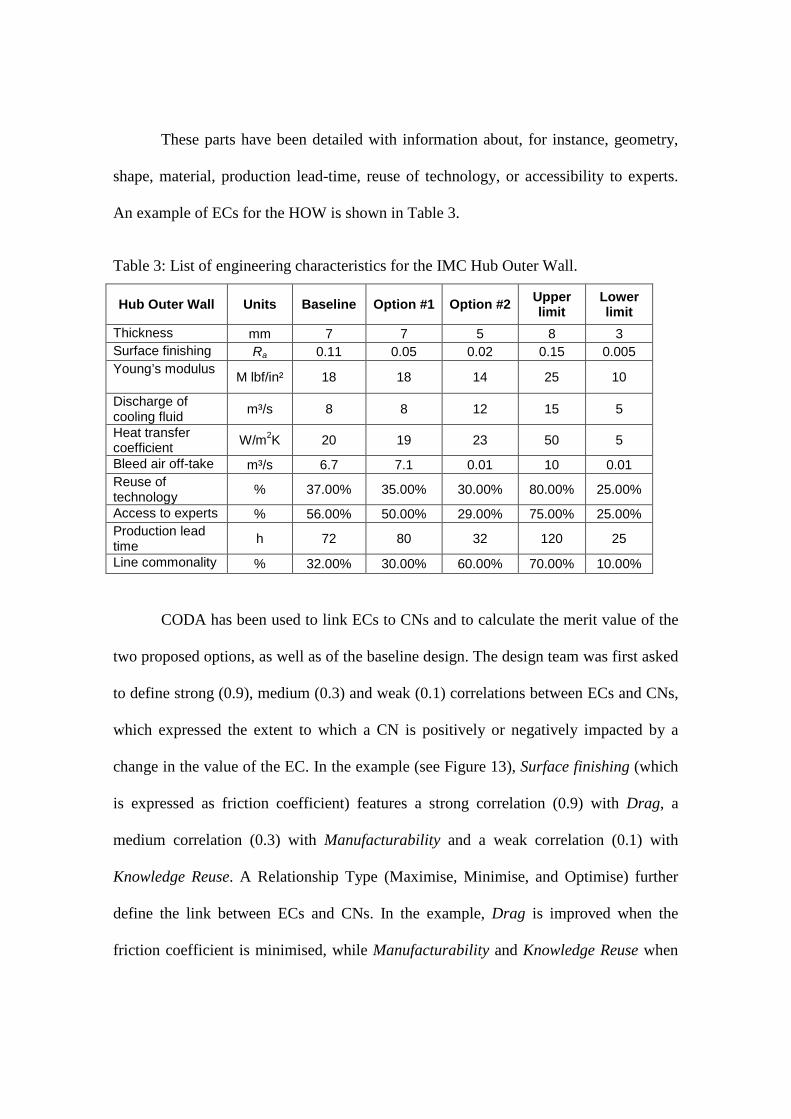
These parts have been detailed with information about, for instance, geometry,
shape, material, production lead-time, reuse of technology, or accessibility to experts.
An example of ECs for the HOW is shown in Table 3.
Table 3: List of engineering characteristics for the IMC Hub Outer Wall.
Hub Outer Wall Units Baseline Option #1 Option #2 Upper limit
Lower limit
Thickness mm 7 7 5 8 3 Surface finishing Ra 0.11 0.05 0.02 0.15 0.005 Young’s modulus M lbf/in² 18 18 14 25 10
Discharge of cooling fluid m³/s 8 8 12 15 5
Heat transfer coefficient W/m2K 20 19 23 50 5
Bleed air off-take m³/s 6.7 7.1 0.01 10 0.01 Reuse of technology % 37.00% 35.00% 30.00% 80.00% 25.00%
Access to experts % 56.00% 50.00% 29.00% 75.00% 25.00% Production lead time h 72 80 32 120 25
Line commonality % 32.00% 30.00% 60.00% 70.00% 10.00%
CODA has been used to link ECs to CNs and to calculate the merit value of the
two proposed options, as well as of the baseline design. The design team was first asked
to define strong (0.9), medium (0.3) and weak (0.1) correlations between ECs and CNs,
which expressed the extent to which a CN is positively or negatively impacted by a
change in the value of the EC. In the example (see Figure 13), Surface finishing (which
is expressed as friction coefficient) features a strong correlation (0.9) with Drag, a
medium correlation (0.3) with Manufacturability and a weak correlation (0.1) with
Knowledge Reuse. A Relationship Type (Maximise, Minimise, and Optimise) further
define the link between ECs and CNs. In the example, Drag is improved when the
friction coefficient is minimised, while Manufacturability and Knowledge Reuse when

is maximised, because a better surface finishing cause longer production lead time and
requires a higher level of expertise to be executed.
Figure 13: Extract from the CODA model developed in Case Study 2.
Eventually, the CODA method rendered an Overall Design Merit for each
option. These Overall Design Merits are the sums of the merits calculated for the
different parts (of each Design Option) and for the different CNs. Figure 14 summarises
the outcome of the CODA model for the considered IMC configurations. It is also
possible to further define a Target option, which expresses the desirable outcome of the
design task. The empirical study has shown that such target reflects a vision emerging
from long-term forecasts. In the example shown in Figure 14, the Target option value is
calculated as 120% of the baseline value contribution.
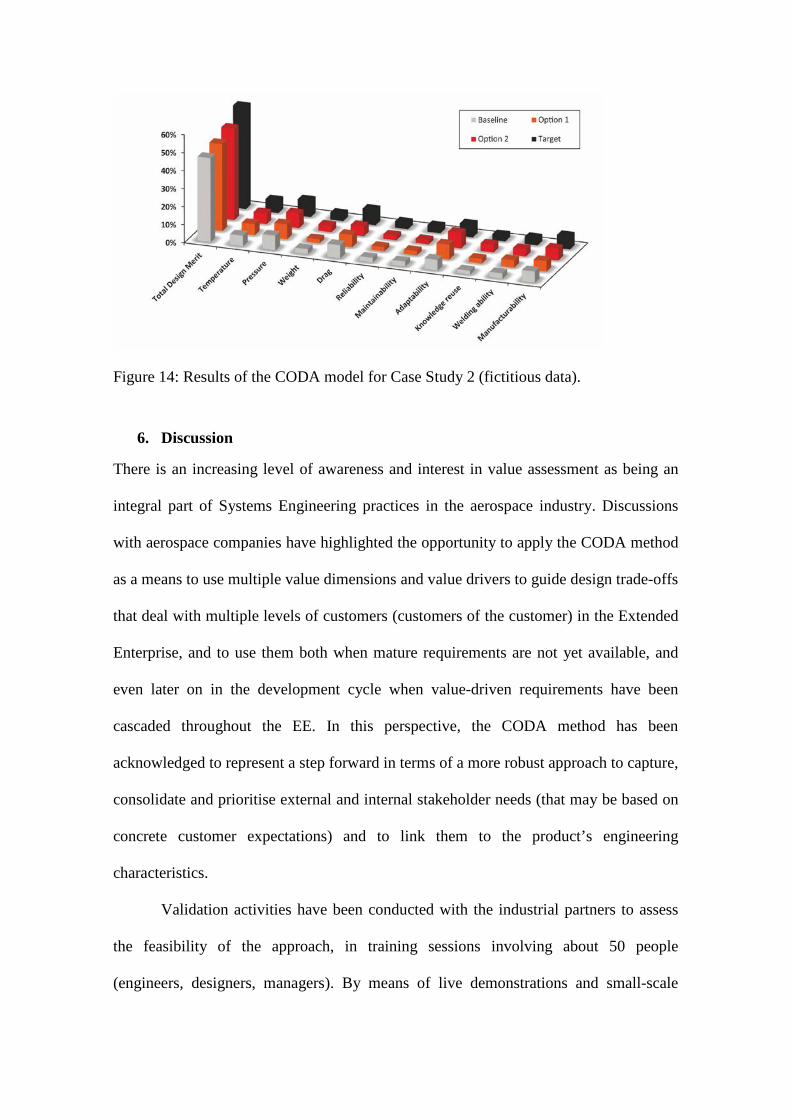
Figure 14: Results of the CODA model for Case Study 2 (fictitious data).
6. Discussion
There is an increasing level of awareness and interest in value assessment as being an
integral part of Systems Engineering practices in the aerospace industry. Discussions
with aerospace companies have highlighted the opportunity to apply the CODA method
as a means to use multiple value dimensions and value drivers to guide design trade-offs
that deal with multiple levels of customers (customers of the customer) in the Extended
Enterprise, and to use them both when mature requirements are not yet available, and
even later on in the development cycle when value-driven requirements have been
cascaded throughout the EE. In this perspective, the CODA method has been
acknowledged to represent a step forward in terms of a more robust approach to capture,
consolidate and prioritise external and internal stakeholder needs (that may be based on
concrete customer expectations) and to link them to the product’s engineering
characteristics.
Validation activities have been conducted with the industrial partners to assess
the feasibility of the approach, in training sessions involving about 50 people
(engineers, designers, managers). By means of live demonstrations and small-scale
exercises, which were followed up by a questionnaire, the authors have received
qualitative feedback from engineers and project stakeholders about strengths and
opportunities related to the implementation of CODA for aero-engine component
design. As main findings from these activities, the authors observed that the approach
can enhance awareness on:
• The relative importance of the needs cascaded down from the system
integrators, enabling the design teams to better identify the most important
dimension to prioritise from the beginning of the design activity and thereby
reduce corrective rework in later design phases.
• The relations between system-level needs and the engineering characteristics of
the specific components to be designed, mainly because non-linear merit
functions are believed to better approximate the customer response to changes in
product attributes compared to QFD or other approaches.
• The reliability of the value analysis, through the use of knowledge maturity
assessments as part of the conceptual trade-off analysis.
In the long run, the implementation of approaches like CODA that emphasise
and support the early exchange of value related information between organisations
within the EE, need to be followed by radical changes in the way in which such
companies collaborate, including legal aspects of their relationships. A higher degree of
openness and trust between the collaborating partners is a pre-requisite to prepare the
necessary context for the effective and efficient application of such value models for the
benefit of all participating organisations. From a technological perspective, the degree
of interoperability between systems has to be improved to enable access to value models
at different levels of the EE in order to support overall value optimisation at the
integrated product or system level, based on joint value analyses with different parts of
the supply network.
The Behavioural Digital Aircraft (BDA) developed in the EU FP7
CRESCENDO project (CRESCENDO 2012) is a significant step forward in this
direction. The BDA can be viewed as a federated information system that, among other
purposes, can be used by the partners in the EE in order to interact with value models
across the network with seamless interoperability, including hierarchical, cross-
functional and contextual associativity.
Last but not least, all these changes will have to be accompanied by a deep
cultural shift. Nowadays, design and development activities are challenged by a
company culture that encourages working with structured information only. The
qualitative nature of the value analysis is a main obstacle for its widespread adoption in
product development activities; hence the actors in the design process have to become
more acquainted to working with qualitative inputs and have to be prepared to deal with
ambiguities better than is often the case today.
7. Conclusions
Value models were a curiosity in this sector in the 1990’s, while nowadays they
seem to have become a standard feature of aerospace programs. Meanwhile, a plethora
of value-driven approaches have been described, with the majority focusing on the
economic aspects of value only. Very few real-life examples, however, can be observed,
and most of the approaches remain only at a conceptual level of maturity.
The Value-Driven Design (VDD) methodology described in this paper is a
multi-dimensional, value-driven, iterative, context-specific approach to optimising the

overall value contributions of an integrated system or product at the highest integration
level as opposed to local levels.
This paper further presented the CODA method, one example of a suitable method that
is capable of supporting the described VDD methodology. The CODA was described in
detail and its applicability demonstrated in two different case studies of increasing
complexity. The method requires a number of educated guesses, group decisions and
assumptions to be made during the mapping of CNs into ECs. If there are 𝑁 engineering
characteristics and 𝑀 customer needs in a model, there will be 𝑀 × (𝑀 − 1)/2
decisions to be made while calculating the normalised weights of the CNs in the binary
weighting method and potentially 4 × 𝑁 × 𝑀 decisions during the mapping process.
However, the number of decisions to be made for a CODA model is comparable to any
QFD model with similar number of CNs and ECs. And, the CODA method provides a
single normalised scalar output (i.e. the Overall Design Merit) which is a function of 𝑁
ECs of the design. This overall design merit metric simply becomes the objective
function and it can easily be used in design assessments, trade-off studies, sensitivity
analyses, and engineering design optimisation studies.
One of the biggest obstacles to the implementation of innovative approaches
such as the VDD methodology – that enables the early, iterative and concurrent
development of context specific, multi-dimensional, value-driven requirements
throughout the EE – is the current way companies relate to each other at least in the
aerospace industry. In other words, the proposed way of working depends to a large
extend on the presence of ‘strategic’ partnerships between companies of the EE because
sensitive information has to be exchanged across several levels of the EE very early in a
development program; whereas such exchanges were previously not possible before
detailed contracts including requirements had been signed.

Acknowledgements
The work presented in this paper was performed in the framework of Work Package 2.2 of the
European Community’s Seventh Framework Programme (FP7/2007-2013) (www.crescendo-
fp7.eu) under grant agreement n◦234344. The authors would like to express their gratitude to all
Work Package 2.2 partners for their invaluable contributions during the CRESCENDO project.
References
ACARE, 2002. European aeronautics: A vision for 2020 [online]. Advisory Council for Aeronautics Research in Europe. Available from: http://www.acare4europe.com/docs/Vision%202020.pdf [Accessed Access Date 14 May 2012].
Afacan, Y. & Demirkan, H., 2010. A priority-based approach for satisfying the diverse users' needs, capabilities and expectations: A universal kitchen design case. Journal of Engineering Design, 21 (2-3), 315-343.
AIRBUS, 2012. A350 XWB [online]. http://www.airbus.com/aircraftfamilies/passengeraircraft/a350xwbfamily/ [Accessed Access Date 14 May 2012].
Akao, Y., 1990. Quality function deployment: Integrating customer requirements into product design: Productivity Press.
Ayag, Z. & Ozdemir, R.G., 2007. An analytic network process-based approach to concept evaluation in a new product development environment. Journal of Engineering Design, 18 (3), 209-226.
Blanchard, B.S., 1978. Design and manage to life cycle cost Oregon, USA: M/A Press. Bouchereau, V. & Rowlands, H., 2000. Methods and techniques to help quality function
deployment (qfd). Benchmarking: An International Journal, 7 (1), 8-20. Brackin, P. & Colton, J.S., 2002. Using genetic algorithms to set target values for
engineering characteristics in the house of quality. Journal of Computing and Information Science in Engineering, 2 (2), 106-114.
Browne, J. & Zhang, J., 1999. Extended and virtual enterprises - similarities and differences. International Journal of Agile System and Management, 1 (1), 30-36.
Chan, K., Kwong, C.K. & Wong, T.C., 2011. Modelling customer satisfaction for product development using genetic programming. Journal of Engineering Design, 22 (1), 55-68.
Chan, L.K. & Wu, M.L., 2002. Quality function deployment: A literature review. European Journal of Operational Research, 143 (3), 463-497.
Chen, W., Hoyle, C. & Wassenaar, H.J., 2013. Decision-based design: Integrating consumer preferences into engineering design London: Springer-Verlag.
Chen, Y., Tang, J., Fung, R.Y.K. & Ren, Z., 2004. Fuzzy regression-based mathematical programming model for quality function deployment. International Journal of Production Research, 42 (5), 1009-1027.
Collopy, P., 2009. Aerospace system value models: A survey and observations. AIAA Space Conference and Exhibition. Pasadena, CA.
CRESCENDO, 2012. Collaborative and robust engineering using simulation capability enabling next design optimisation [online]. http://www.crescendo-fp7.eu/ [Accessed Access Date 14 May 2012].

Davidow, W.H. & Malone, M.S., 1993. The virtual corporation: Structuring and revitalizing the corporation for the 21st century New York: Harper Business.
Dawson, D. & Askin, R.G., 1999. Optimal new product design using quality function deployment with empirical value functions. Quality and Reliability Engineering International, 15 (1), 17-32.
Donndelinger, J. & Cook, H., 1997. Methods for analyzing the value of vehicles. SAE Transactions. Journal of Passanger Cars, 106, 1263-1281.
Dowlatshahi, S., 1992. Product design in a concurrent engineering environment - an optimization approach. International Journal of Production Research, 30 (8), 1803-1818.
Duck Young, K. & Xirouchakis, P., 2010. Co2de: A decision support system for collaborative design. Journal of Engineering Design, 21 (1), 31-48.
Eggert, R.J., 2005. Engineering design: Pearson Prentice Hall. Erginel, N., 2010. Construction of a fuzzy qfd failure matrix using a fuzzy multiple-
objective decision model. Journal of Engineering Design, 21 (6), 677-692. Feneley, R.C.L., Parkin, J., Scanlan, J. & Woolley, M., 2003. Developing alternative
devices to the long-term urinary catheter for draining urine from the bladder. Proceedings of the Institution of Mechanical Engineers Part H-Journal of Engineering in Medicine, 217 (H4), 297-303.
Fung, R.Y.K., Chen, Y.Z. & Tang, J.F., 2006. Estimating the functional relationships for quality function deployment under uncertainties. Fuzzy Sets and Systems, 157 (1), 98-120.
Fung, R.Y.K., Popplewell, K. & Xie, J., 1998. An intelligent hybrid system for customer requirements analysis and product attribute targets determination. International Journal of Production Research, 36 (1), 13-34.
Fung, R.Y.K., Tang, J.F., Tu, P.Y. & Chen, Y.Z., 2003. Modelling of quality function deployment planning with resource allocation. Research in Engineering Design-Theory Applications and Concurrent Engineering, 14 (4), 247-255.
Hauser, J.R. & Clausing, D., 1988. The house of quality. Harvard Business Review, 66 (3), 63-73.
Hjort, H., Hananel, D. & Lucas, D., 1992. Quality function deployment and integrated product development. Journal of Engineering Design, 3 (1), 17-29.
Hubka, V. & Eder, W.E., 1988. Theory of technical systems: A total concept theory for engineering design: Springer-Verlag.
IATA, 2010. Airline industry forecast 2010-2014 [online]. http://www.iata.org/ps/publications/Pages/airline-industry-forecast.aspx [Accessed Access Date 14/05/2012].
INCOSE, 2011. Systems engineering handbook v3.2.2. Isaksson, O., Kossmann, M., Bertoni, A., Eres, H., Monceaux, A., Bertoni, A., Wiseall,
S. & Zhang, X., 2013. Value-driven design - a methodology to link expectations to technical requirements in the extended enterprise. INCOSE International Symposium 2013. Philadelphia, PA, USA.
ISO/IEC, 2008. Systems and software engineering - system life cycle processes (15288).
Jenab, K., Sarfaraz, A. & Ameli, M.T., 2013. A conceptual design selection model considering conflict resolution. Journal of Engineering Design, 24 (4), 293-304.
King, A.M. & Sivaloganathan, S., 1999. Development of a methodology for concept selection in flexible design strategies. Journal of Engineering Design, 10 (4), 329-349.
Kossmann, M., Isaksson, O., Bertoni, M., Monceaux, A., Auneau, M., Zhang, X., Eres, H., Scanlan, J., Wiseall, S., Bertoni, A. & Ndrianarilala, R., 2012. D2.2.4 - validation of the system to link expectations to technical requirements (CRESCENDO internal report).
Kwong, C.K., Chen, Y., Bai, H. & Chan, D.S.K., 2007. A methodology of determining aggregated importance of engineering characteristics in qfd. Computers & Industrial Engineering, 53 (4), 667-679.
Mattson, C.A. & Messac, A., 2005. Pareto frontier based concept selection under uncertainty, with visualization. Optimization and Engineering, 6 (1), 85-115.
Mattson, C.A., Mullur, A.A. & Messac, A., 2009. Case studies in concept exploration and selection with s-pareto frontiers. International Journal of Product Development, 9 (1-3).
Mayyas, A., Shen, Q., Mayyas, A., Abdelhamid, M., Shan, D., Qattawi, A. & Omar, M., 2011. Using quality function deployment and analytical hierarchy process for material selection of body-in-white. Materials & Design, 32 (5), 2771-2782.
Miles, B.L. & Swift, K., 1998. Design for manufacture and assembly. Manufacturing Engineer, 77 (5), 221-224.
Nuseibeh, B. & Easterbrook, S., 2000. Requirements engineering: A roadmap. Proceedings of International Conference on Software Engineering (ICSE-2000). Limerick, Ireland.
Okudan, G.E. & Tauhid, S., 2008. Concept selection methods - a literature review from 1980 to 2008. International Journal of Design Engineering, 1 (3).
Otto, K.N. & Wood, K.L., 2001. Product design: Techniques in reverse engineering and new product development: Prentice Hall.
Pahl, G. & Beitz, W., 1996. Engineering design: A systematic approach: Springer-Verlag.
Park, J. & Han, S.H., 2004. A fuzzy rule-based approach to modeling affective user satisfaction towards office chair design. International Journal of Industrial Ergonomics, 34 (1), 31-47.
Park, J., Shin, D., Insun, P. & Hyemi, H., 2008. A product platform concept development method. Journal of Engineering Design, 19 (6), 515-532.
Park, T. & Kim, K.J., 1998. Determination of an optimal set of design requirements using house of quality. Journal of Operations Management, 16 (5), 569-581.
Pozar, M. & Cook, H., 1997. On determining the relationship between vehicle value and interior noise. SAE Transactions. Journal of Passenger Cars, 106, 391-401.
Pugh, S., 1991. Total design: Integrated methods for successful product engineering: Addison-Wesley Publishers Ltd.
Reddy, R. & Mistree, F., 1992. Modeling uncertainty in selection using exact interval arithmetic. In Stauffer, L.A. & Taylor, D.L. eds. Design Theory and Methodology 92. New York: ASME, 193-201.
Remery, M., Mascle, C. & Agard, B., 2012. A new method for evaluating the best product end-of-life strategy during the early design phase. Journal of Engineering Design, 23 (6), 419-441.
Rosenman, M.A., 1993. Qualitative evaluation for topological specification in conceptual design. Applications and Techniques of Artificial Intelligence in Engineering, 2, 311–326.
Saaty, T.L., 2005a. The analytic hierarchy and analytic network processes for the measurement of intangible criteria and for decision-making. In Figueira, J.G.S.E.M. ed. Multiple criteria decision analysis: State of the art surveys. 345-407.

Saaty, T.L., 2005b. Theory and applications of the analytic network process: Decision making with benefits, opportunities, costs and risks Pittsburgh, Pennsylvania: RWS Publications.
Saaty, T.L. & Sodenkamp, M., 2010. The analytic hierarchy and analytic network measurement processes: The measurement of intangibles decision making under benefits, opportunities, costs and risks. In Zopounidis, C.P.P.M. ed. Handbook of multicriteria analysis. 91-166.
Saaty, T.L. & Vargas, L.G., 2001. Models, methods, concepts & applications of the analytic hierarchy process New York: Springer Science+Business Media.
Sage, A.P., 1992. Systems engineering: John Wiley and Sons, Inc. Sharma, J.R., Rawani, A.M. & Barahate, M., 2008. Quality function deployment: A
comprehensive literature review. International Journal of Data Analysis Techniques and Strategies, 1 (1), 78-103.
Sii, H.S., Wang, J., Jenkinson, I., Yang, J.B. & Liu, L., 2004. A design-decision support framework for evaluation of design options/proposals using a fuzzy-logic-based composite structure methodology. Journal of Engineering Design, 15 (5), 493-514.
Song, W., Ming, X. & Wu, Z., 2013. An integrated rough number-based approach to design concept evaluation under subjective environments. Journal of Engineering Design, 24 (5), 320-341.
Sorensen, C.G., Jorgensen, R.N., Maagaard, J., Bertelsen, K.K., Dalgaard, L. & Norremark, M., 2010. Conceptual and user-centric design guidelines for a plant nursing robot. Biosystems Engineering, 105 (1), 119-129.
Thurston, D.L., 2001. Real and misconceived limitations to decision based design with utility analysis. Journal of Mechanical Design, 123 (2), 176-182.
Thurston, D.L. & Carnahan, J.V., 1992. Fuzzy ratings and utility analysis in preliminary design evaluation of multiple attributes. Journal of Mechanical Design, 114 (4), 648-658.
Thurston, D.L. & Locascio, A., 1994. Decision theory for design economics. The Engineering Economist, 40 (1), 41-71.
Tong, K.W., Kwong, C.K. & Yu, K.M., 2004. Intelligent process design system for the transfer moulding of electronic packages. International Journal of Production Research, 42 (10), 1911-1931.
Ullman, D.G., 2009. The mechanical design process: McGraw-Hill Higher Education. Ulrich, K. & Eppinger, S., 2008. Product design and development, 4th ed.: McGraw-
Hill/Irwin Press. Verma, D., Chilakapati, R. & Fabrycky, W.J., 1998. Analyzing a quality function
deployment matrix: An expert system-based approach to identify inconsistencies and opportunities. Journal of Engineering Design, 9 (3), 251-261.
Wang, J., 2001. Ranking engineering design concepts using a fuzzy outranking preference model. Fuzzy Sets and Systems, 119 (1), 161-170.
Woolley, M., Scanlan, J.P. & Eveson, W., 2000. The use of formal design techniques in the development of a medical device. IMechE International Engineering Design Conference 2000 Brunel University, Uxbridge, UK.
Woolley, M., Scanlan, J.P. & Eveson, W., 2001. Optimising the development of a medical device using formal engineering design techniques and the coda-system. ICE 7th International Conference on Concurrent Engineering. Bremen, Germany.

Xu, D. & Yan, H.S., 2006. An intelligent estimation method for product design time. International Journal of Advanced Manufacturing Technology, 30 (7-8), 601-613.
Xu, J., Xun, X. & Xie, S.Q., 2010. A comprehensive review on recent developments in quality function deployment. International Journal of Productivity and Quality Management, 6 (4), 457-94.
Zavbi, R. & Duhovnik, J., 1996. The analytic hierarchy process and functional appropriateness of components of technical systems. Journal of Engineering Design, 7 (3), 313-327.
Zhang, X.W., Auriol, G., Eres, H. & Baron, C., 2013. A prescriptive approach to qualify and quantify customer value for value-based requirements engineering. International Journal of Computer Integrated Manufacturing, 26 (4), 327-345.