maponya mall shopper profilepage 5 shopper media consumption lifestyle statements: shopping sa...
TRANSCRIPT

Shopper profile

Page 1
Contents
The value of the data 1Mall demographic profile 2Shopper media consumption 4
The following data has been collected and verified by Ask Afrika Group, the copyright license holder for Target Group Index (TGI).
Ask Afrika Group is the largest independent South African market research company with fieldwork capabilities in 95% of Sub-Saharan Africa. They are backed by the power of TGI Research, the only SA population database with psychographics that cover over 600 lifestyle and attitude statements.
TGI is South Africa’s broadest consumer/shopper profiling tool in sampling 24 000 nationally representative respondents aged 15+, living in communities 8 000+. Insights are tailor-suited for malls, which link demographic, psychographic, brand and media insights. TGI supports strategic and informed decision making.
The value of the data
Sample size: 620 Weighted to SA shopper: 438 000
RET
AIL

Page 2
65+
45-64
35-44
25-34
15-24
Motivated Experiencers Independents Utopians Virtuous Materialists IndifferentTraditionalists Comfort zone dwellers
Black
White
Coloured
Indian/ Asian
SA shopper
Mall demographic profile
Age Race
Most important media used*
Life values
6.8%7.1%
90%
31.1% 4%
20.3% 4.8%
24.6% 1.2%
17.3%
73.1%
23.2% 10.6%
12.2%22.5%
29.1% 4.2%
18%
Gender
48.9%
49.8%
51.1%
50.2%
LSM
4 5 6 7 8 9 10
3.1%
7% 41.5
%
24.7
% 6.9%
13% 3.
7%
2.3%
10.2
%13
.3%
9%
7.6%
13.4
%
36.4
%
9.3%
8.8%
25.6
%
9.9%
8.4%
10.2
%
20.8
%14
.6%
12.7
%8.
7%
8.5%
11.3
%
12.6
%
14.1
%12
.7%
3.9%
7% 8.9%
SA shopper vs Maponya Mall shopper
1.3%
3.6%
MagazinesInternet(Desktop)
Internet(Mobile)
Outdoor (Billboards and posters)
In-store
46.6%
42.8%
TVNewspapers
5.6%
7.9%
15.9%
14.4%
Radio
3.3%
3.7%
21.5%
20.6%
Cinema
0.6%
0.6%
*Based on those that have visited a mall in the past three months/*2018C TGI Data.
3%
5.2%
3.5%
2.3%
RET
AIL

Page 3
Marital status Life stages Income
5.6%6.6%
5%5.9%
3%3.4%3.6%4.9%
35.9%29%
1.3%2.4%
3.1%2.4%
32.4%35%
English Afrikaans Any Sotho Language
Sepedi Sesotho Xitsonga Setswana Tshivenda Any Nguni Language
Siswati IsiZuluIsindebele IsiXhosa Hindi/ Urdu
Language
8.7% 15
.7%
5.9% 14
.3%
7.3%
6.1%
38%
28% 4.
9%3.
1%
14.2
%11
.1%
0.4%
1%
7.8% 14
%
0.2% 1.7%
43.2
%40
.3%
0% 0.2%
34.8
%23
.8%
3.3%
1.1%
11.7
%7.
6%
9.4%
12.5%
0%
5%
11.3%
5.7%
13.8%
0%
5%
37.4%
5.1%
9.1%
3.1%
1.7%
9.6%
5.1%
2.7%
2%
5.9%
33.6%
37.3%42.3%27.7%31.3%
9.6%11%
8.6%5.7%
49.1%47%
4.3%2.7%
5%5.1%
4.3%3.01%
Married/ living together
as partners
Married
Living together as partners
Single - divorced/
separated
Single - divorced
Single - separated
Single - never married
Single - widowed
Dependent singles
Breaking out
Settled singles
Nest builders
Play school/ pre-teen/
teen parents
Single parents
Empty nesters
All alone
SA shopper vs Maponya Mall shopper
Up to R999
R1 000 - R1 999
R2 000 - R2 499
R2 500 - R2 999
R3 000 - R5 999
R6 000 - R9 999
R10 000 - R13 999
R14 000 - R17 999
R18 000 +
Refused to share
SA shopper
Mall demographic profile RET
AIL

Page 4
Most important factors when shopping Do they look out for sales promotions?
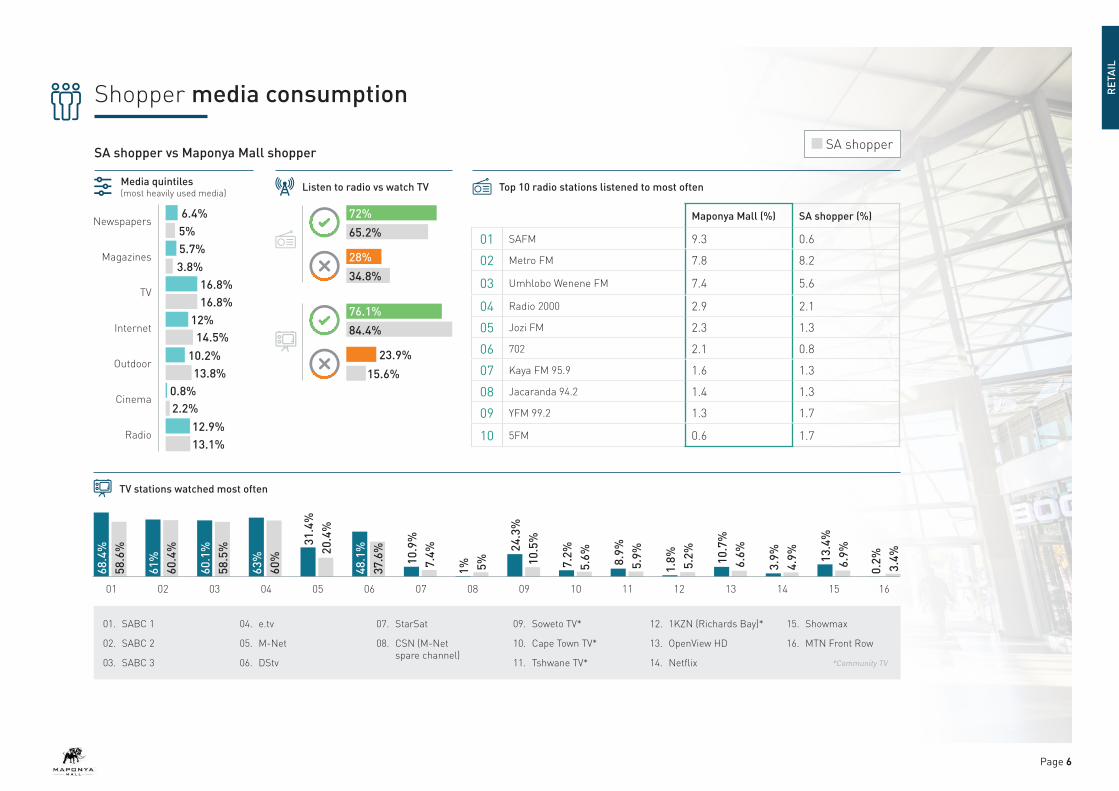
Shopper media consumption
SA shopper vs Maponya Mall shopper
Yes, always
Yes, sometimes
42.4%
39%
33%
36.5%
Yes, occasionally
Never
11.4%
10.8%
13.3%
12.9%
Type of in-store advertising noticed
On-shelf
Aisle-end advertising
Floor advertising
Trolley advertising
Poster advertising
60.5%
51.8%
36.4%
34.3%
37.3%
36.1%
33.9%
35.6%
37.1%
26.8%
Do they ever notice in-store advertising?
81%
82.1%
19%
17.9%
Maponya Mall (%) SA shopper (%)
01 Advertising 4.4 4.4
02 Availability 6.3 6.4
03 Comfort 6.5 9.1
04 Consumer or user reviews 2.7 1.2
05 Durability 4.9 3.8
06 Ease of care/ease to care for 1.2 1.7
07 Fashion 5.2 3.7
08 Friends/family recommendations 1.1 1.9
09 Material/fabric 0.9 1.9
10 Origin (ethically produced, country of manufacturer) 1.4 0.8
11 Price 23.2 27.4
12 Professional recommendations 1.2 1
13 Promotions 5.3 3.9
14 Quality 28.1 22.8
15 Store layout 1.5 1.2
16 The item is on sale 2.9 2.3
17 The manufacturer’s brand 2.1 1
18 Versatility 0.8 1.1
SA shopper
RET
AIL

Page 5
Shopper media consumption
Lifestyle statements: shopping
SA shopper vs Maponya Mall shopper
01. When I see a new brand I often buy it to see what it’s like
02. When doing household shopping I budget for every cent
03. I always look out for special offers
04. I always buy brands my domestic prefers
05. It’s worth paying more for organic food
06. I really enjoy any kind of shopping
07. Once I find a brand I like, I tend to stick to it
08. I only shop at supermarkets that sell good quality fresh food
09. I’m tempted to buy products I’ve seen advertised
10. When buying toiletries the brand I choose is very important to me
11. I tend to buy the cheapest household cleaning products
12. I often try new household cleaning products
13. I feel reassured using products recommended by an expert
14. I ask people’s advice before buying new things
15. Store ambience is important in my selection of a fast food/quick service restaurant or outlet
16. I am prepared to pay a higher price for a meal offering when eating out/ordering a take-away meal, as long as the quality is good
17. Home/office delivery is important to me in deciding which fast food/ quick service outlet to use
18. My children decide where to go for take away food
19. People come to me for advice before buying new things
20. I expect quick and efficient service when going out for a quick meal
21. I always buy brands my children prefer
22. I usually only go shopping when I have something I really need
23. I tend to hold out on buying things I want until they go on sale
24. I generally do my bulk and top-up shopping at different food retailers
25. The location of stores will determine whether or not I shop there
26. I am open to using a smartphone application to scan and pay for items I am purchasing in-store/online
27. Celebrities influence my purchase decisions
28. Even though I have a favourite brand, if another brand is on special offer I buy it instead
29. I prefer to buy local brands when I can
01 05 0902 06 1003 07 1104 08 12 13 14 15
16
28.9
%32
.4%
13.1
%7.
3%
22
21.5
% 11.4
%
13.4
%9.
2%
18
8.4%
8.4%
18.2
%10
.7%
24
15.8
%9.
5%
14.7
%12
.1%
16%
20%
20
30.1
%22
.7%
15.9
%14
.3%
26
11.2
%19
.4%
24%
22.6
%
17
27.3
%20
.4%
12.5
%10
.2%
23
13.7
%8.
5%
22.7
% 11.5
%
29
21% 11
%
9.3%
8.2%
19
10%
7%
22%
16.6
%
25
18% 10
.3%
34.2
%26
.6%
2131
.8%
22.7
%
12.3
%8.
3%27
10.5
%11
.1%
22.2
%21
.4%
28
30%
26.6
%
17%
19.4
%
SA shopper
RET
AIL
Page 6
SA shopper vs Maponya Mall shopper
Newspapers
Magazines
TV
Internet
Outdoor
Cinema
Radio
Media quintiles (most heavily used media)
TV stations watched most often
6.4%
5.7%
16.8%
12%
0.8%
10.2%
12.9%
5%
3.8%
16.8%
14.5%
2.2%
13.8%
13.1%
Top 10 radio stations listened to most oftenListen to radio vs watch TV
72%
76.1%
65.2%
84.4%
28%
23.9%
34.8%
15.6%
68.4
%58
.6%
60.1
%58
.5% 31
.4%
20.4
%
61%
60.4
%
63%
60%
48.1
%37
.6%
10.9
%7.
4%
1% 5%
24.3
%10
.5%
8.9%
5.9% 10
.7%
6.6%
7.2%
5.6%
1.8% 5.2%
3.9%
4.9% 13
.4%
6.9%
0.2%
3.4%
01. SABC 1
02. SABC 2
03. SABC 3
04. e.tv
05. M-Net
06. DStv
07. StarSat
08. CSN (M-Net spare channel)
09. Soweto TV*
10. Cape Town TV*
11. Tshwane TV*
12. 1KZN (Richards Bay)*
13. OpenView HD
14. Netflix
15. Showmax
16. MTN Front Row
*Community TV
01 05 0902 06 1003 07 1104 08 12 13 14 15 16
Shopper media consumption
SA shopper
Maponya Mall (%) SA shopper (%)
01 SAFM 9.3 0.6
02 Metro FM 7.8 8.2
03 Umhlobo Wenene FM 7.4 5.6
04 Radio 2000 2.9 2.1
05 Jozi FM 2.3 1.3
06 702 2.1 0.8
07 Kaya FM 95.9 1.6 1.3
08 Jacaranda 94.2 1.4 1.3
09 YFM 99.2 1.3 1.7
10 5FM 0.6 1.7
RET
AIL

Page 7
SA shopper vs Maponya Mall shopper
Internet frequency: desktop (%)
Internet usage: desktop (%)
Internet frequency: mobile (%)
Internet usage: mobile (%)
Maponya Mall (%) SA shopper (%)
Several times a day 4.9 5.7
Once a day 6.4 5.9
Three to five times a week 4.6 4.6
Once or twice a week 2.7 2.6
Two or three times a month 0.2 1.6
Once a month 0.5 0.7
Less often 4.8 4.2
Maponya Mall (%) SA shopper (%)
Communication 22.9 26.4
Information 7.3 10
Shopping, retail and finance 4.6 3.8
Entertainment 7.7 6.3
Downloads 7.3 5.8
Apps 0.1 0.2
Other activities 5.9 5.2
Maponya Mall (%) SA shopper (%)
Several times a day 6.9 13.4
Once a day 7.4 7.5
Three to five times a week 5.2 6
Once or twice a week 5.6 3.9
Two or three times a month 1.9 1.5
Once a month 0 0.4
Less often 3.5 3.8
Maponya Mall (%) SA shopper (%)
Communication 26.4 33.9
Information 9.8 12.5
Shopping, retail and finance 5.9 4.5
Entertainment 7.6 8
Downloads 6.7 6.8
Apps 1.1 0.3
Other activities 5.9 5.3
Shopper media consumption
SA shopper
RET
AIL