manual on codes, volume i volume i.1 – international codes part a – alphanumeric codes page...
TRANSCRIPT

2011 edition
Updated in 2012
www.wmo.int
Manual on CodesInternational CodesVOLUME I.1
PART A – Alphanumeric Codes
WMO-No. 306
P-O
BS
_121
173

Manual on Codes
International Codes
Volume I.1 (Annex II to WMO Technical Regulations)
Part A – Alphanumeric Codes
WMO-No. 306
2011 edition Updated in 2012

WMO-No. 306
© World Meteorological Organization, 2011
The right of publication in print, electronic and any other form and in any language is reserved by WMO. Short extracts from WMO publications may be reproduced without authorization, provided that the complete source is clearly indicated. Editorial correspondence and requests to publish, reproduce or translate this publication in part or in whole should be addressed to:
Chair, Publications Board World Meteorological Organization (WMO) 7 bis, avenue de la Paix Tel.: +41 (0) 22 730 84 03 P.O. Box 2300 Fax: +41 (0) 22 730 80 40 CH-1211 Geneva 2, Switzerland E-mail: [email protected]
ISBN 978-92-63-10306-2
NOTE
The designations employed in WMO publications and the presentation of material in this publication do not imply the expression of any opinion whatsoever on the part of WMO concerning the legal status of any country, territory, city or area, or of its authorities, or concerning the delimitation of its frontiers or boundaries.
The mention of specific companies or products does not imply that they are endorsed or recommended by WMO in preference to others of a similar nature which are not mentioned or advertised.

PUBLICATION REVISION TRACK RECORD
Date Part/
chapter/ section
Purpose of amendment Proposed by Approval Resolution or other
2012 Part A, Section C, b. Code tables
Consolidation of amendments approved by the procedure for adoption of amendments in May 2012
CBS/OPAG-ISS/IPET-DRC Procedure for adoption of amendments between CBS sessions (OBS/WIS/DRMM/DRC (PR-6630))

EDITORIAL NOTE
As a general rule, standard coding practices are printed in semi-bold roman in order to distinguish them from explanations.
Section A: Regulations are printed in semi-bold roman; explanatory notes relating to these regulations are printed in smaller type and preceded by the indication: Note.
Sections B and C: Specifications of symbolic letters and standard coding procedures relating to the specification concerned are printed in semi-bold roman. Definitions and explanations relating to these specifications are printed in light-face roman.

PREFACE
Coded messages are used for the international exchange of meteorological information comprising observational data provided by the WWW Global Observing System and processed data provided by the WWW Global Data-processing and Forecasting System. Coded messages are also used for the international exchange of observed and processed data required in specific applications of meteorology to various human activities and for exchanges of information related to meteorology.
The codes are composed of a set of CODE FORMS and BINARY CODES made up of SYMBOLIC LETTERS (or groups of letters) representing meteorological or, as the case may be, other geophysical elements. In messages, these symbolic letters (or groups of letters) are transcribed into figures indicating the value or the state of the elements described. SPECIFICATIONS have been defined for the various symbolic letters to permit their transcription into figures. In some cases, the specification of the symbolic letter is sufficient to permit a direct transcription into figures. In other cases, it requires the use of CODE FIGURES, the specifications of which are given in CODE TABLES. Furthermore, a certain number of SYMBOLIC WORDS and SYMBOLIC FIGURE GROUPS have been developed for use as code names, code words, symbolic prefixes or indicator groups.
Rules concerning the selection of code forms to be exchanged for international purposes, and the selection of their symbolic words, figure groups and letters, are laid down in the Technical Regulations (WMO- No. 49), Volume I, Chapter A.2.3 (1988 edition). These code forms are contained in Volume I of the Manual on Codes, issued as Volume I.1 – Part A, and Volume I.2 – Part B and Part C.
Apart from these international codes, several sets of regional codes exist which are intended only for exchanges within a given WMO Region. These codes are contained in Volume II of the Manual on Codes. This volume also contains descriptions of:
– Regional coding procedures for the use of international code forms;
– National coding practices in the use of international or regional codes of which the Secretariat has been informed;
– National code forms.
A number of special codes which are used in messages exchanged over the WWW Global Telecommunication System circuits, and which comprise ice and satellite ephemeris codes, are included in Volume II as an appendix.
This edition of Volume I.1 of the Manual on Codes replaces the 2010 edition.


CONTENTS
VOLUME I.1 – INTERNATIONAL CODES
Part A – Alphanumeric Codes
Page
Introduction .................................................................................................................................. ix
Definitions .................................................................................................................................... xv
Section A – Code forms ............................................................................................................ A–1
a. FM system of numbering code forms ............................................................................. A–3
b. List of code forms with notes and regulations................................................................. A–9
Section B – Specifications of symbolic letters (or groups of letters) .................................. A–167
Symbolic letters and remarks as to the methods of coding ................................................ A–169
Section C – Specifications of code figures (code tables) ..................................................... A–235
a. Numbering system of international code tables .............................................................. A–237
b. Code tables..................................................................................................................... A–241
Section D – System of station index numbers ........................................................................ A–371
a. Meteorological observing stations................................................................................... A–373
b. Hydrological observing stations ...................................................................................... A–375
Section E – Beaufort scale of wind .......................................................................................... A–377
Appendix – National practices regarding the coding of certain elements in reports, analyses or forecasts for international exchange .............................. A–381
Attachments ............................................................................................................................... A–389
I. Common code tables to binary and alphanumeric codes (copy of Volume I.2, Part C/c: Common Features to Binary and Alphanumeric Codes) ........................... A–391
II. List of alphanumeric code tables related to BUFR Table B ...................................... A–415
III. International Seismic Code ....................................................................................... A–419


Volume I.1
INTRODUCTION
Volume I of the Manual on Codes contains WMO international codes for meteorological data and other geophysical data relating to meteorology; it constitutes Annex II of the WMO Technical Regulations and has therefore the status of a Technical Regulation. It is issued in two volumes: Volume I.1, containing PART A, and Volume I.2, containing PART B and PART C.
VOLUME I.1:
Part A – Alphanumeric Codes consists of five sections.
Section A contains lists of international code forms and corresponding standard coding procedures. The format and wording conventions used in this section are as follows:
Code forms: Groups in brackets are drop-out items and may or may not be included, depending on specified conditions. The absence of round brackets means that the inclusion of the group concerned is determined by international decision; these decisions are indicated in the regulations appearing under each code form.
Parts and sections of code forms: Code forms may have been built up from a number of well-defined components, each comprising a different type of coded information. Components which can be transmitted as a separate report are called parts and carry special identification groups. Code forms, or their parts, can be divided into sections which may be omitted from the report under certain conditions and therefore carry a symbolic indicator figure or group.
Notes: Brief explanations of the code form are included in a number of notes under the code form.
Regulations: The regulations, which follow the notes, contain standard coding procedures in the sense given to these procedures in the Technical Regulations. The standard coding procedures are distinguished by the use of the term “shall” in the English text, and by suitable equivalent terms in the French, Russian and Spanish texts. Where national practices do not conform with these regulations, Members concerned shall formally notify the Secretary-General of WMO for the benefit of other Members. Explanatory notes are sometimes added to regulations.
Section B contains the list of symbolic letters which are to be replaced, generally by figures in coded reports, analyses or forecasts with their specifications. Definitions and standard coding procedures relating to the specification concerned are added, where appropriate, to the specifications in the form of notes. Notes indicating standard coding procedures are distinguished from notes containing a definition by a difference in typographical practice and by the use of the word “shall” in the English text, and by suitable equivalents in the French, Russian and Spanish texts. Where symbolic letters represent coded information, i.e. not just the scale of values as measured, the reference to the tables containing specifications of the code figures is added between brackets.
Section C contains the specifications of code figures in the form of code tables. The tables are preceded by a description of the numbering system of international code tables included in the part concerned.
Section D contains a description of the system of station index numbers.
Section E contains the Beaufort scale of wind for ease of reference and in order to provide the equivalent wind speeds for Beaufort numbers used in some codes.
Attachments II and III (yellow background) to Volume I.1 do not have the status of WMO Technical Regulations and are given for information only.

x INTRODUCTION
Volume I.1
VOLUME I.2:
Part B – Binary Codes consists of the list of binary codes with their specifications and associated code tables.
Part C – Common Features to Binary and Alphanumeric Codes consists of table-driven alphanumeric codes and of common code tables to binary and alphanumeric codes.
PROCEDURES FOR AMENDING THE MANUAL ON CODES
1. General validation and implementation procedures
1.1 Proposal of amendments
Amendments to the Manual on Codes must be proposed in writing to the WMO Secretariat. The proposal shall specify the needs, purposes and requirements and include information on a contact point for technical matters.
1.2 Drafting recommendation
The Inter-Programme Expert Team on Data Representation and Codes (IPET-DRC),1 supported by the Secretariat, shall validate the stated requirements (unless it is consequential to an amendment to the WMO Technical Regulations) and develop a draft recommendation to respond to the requirements, as appropriate.
1.3 Date of implementation
The IPET-DRC should define a date of implementation in order to give sufficient time to WMO Members to implement the amendments after the date of notification; the IPET-DRC should document the reasons to propose a time span of less than six months except for the fast-track procedure.
1.4 Procedures for approval
After a draft recommendation of the IPET-DRC is validated in accordance with the procedure given in section 6 below, depending on the type of amendments, the IPET-DRC may select one of the following procedures for the approval of the amendments: • Fast-track procedure (see section 2 below); • Procedure for the adoption of amendments between CBS sessions (see section 3 below); • Procedure for the adoption of amendments during CBS sessions (see section 4 below).
1.5 Urgent introduction
Regardless of the above procedures, as an exceptional measure, the following procedure accommodates urgent user needs to introduce new entries in BUFR/CREX tables A, B and D, code and flag tables of BUFR, CREX and GRIB edition 2 and Common Code tables. (a) A draft recommendation developed by IPET-DRC shall be validated according to 6.1, 6.2 and 6.3
below; (b) The draft recommendation for pre-operational use, which can be used in operational data and
products, shall be approved by the chairs of IPET-DRC and the Open Programme Area Group on Information Systems and Services (OPAG-ISS), and the president of CBS. The list of pre-operational entries is kept online on the WMO Web server;
(c) Pre-operational entries need to be approved by one of the procedures in 1.4 for operational use.
1.6 Version number
The version number of the master table will be incremented.
1.7 Issuing the updated version
Once amendments to the Manual on Codes are adopted, an updated version of the relevant part of the Manual shall be issued in the four languages: English, French, Russian and Spanish. The Secretariat
1 The IPET-DRC, the ICT-ISS and the OPAG-ISS are the current bodies dealing with data representation and codes within CBS. If
they were replaced by other bodies performing the same function, the same rules would apply, by replacing the names of the entities appropriately.

INTRODUCTION xi
Volume I.1
will inform all WMO Members of the availability of a new updated version of that part at the date of notification mentioned in 1.3.
2. Fast-track procedure
2.1 Scope
The fast-track procedure can be used for additions to BUFR or CREX Tables A, B, and D with associated code tables or flag tables, to code or flag tables or templates in GRIB and to common tables C.
2.2 Endorsement
Draft recommendations developed by the IPET-DRC, including a date of implementation of the amendments, must be endorsed by the chair of OPAG-ISS.
2.3 Approval 2.3.1 Minor adjustments
The filling of reserved and unused entries in the existing code and flag tables and Common Code tables is considered as a minor adjustment, and will be done by the Secretary-General in consultation with the president of CBS.
2.3.2 Other types of amendments For other types of amendments, the English version of the draft recommendation, including a date of implementation, should be distributed to the focal points for codes and data representation matters for comments, with a deadline of two months for the reply. It should then be submitted to the president of CBS for adoption on behalf of the Executive Council (EC).
2.4 Frequency
The implementation of amendments approved through the fast-track procedure can be twice a year in May and November.
IPET-DRC Chair of OPAG-ISS
President of CBS
Focal points for codes and data representation
matters
IPET-DRC Chair of OPAG-ISS
President of CBS
or
Figure 1. Adoption of amendments by fast-track procedure
3. Procedure for the adoption of amendments between CBS sessions
3.1 Approval of draft recommendation For the direct adoption of amendments between CBS sessions, the draft recommendation developed by the IPET-DRC, including a date of implementation of the amendments, shall be submitted to the chair of OPAG-ISS and president and vice-president of CBS for approval.
3.2 Circulation to Members Upon approval of the president of CBS, the Secretariat sends the recommendation in the four languages (English, French, Russian and Spanish), including a date of implementation of the amendments, to all WMO Members for comments to be submitted within two months following the dispatch of the amendments.

xii INTRODUCTION
Volume I.1
3.3 Agreement Those WMO Members not having replied within the two months following the dispatch of the amendments are implicitly considered as having agreed with the amendments.
3.4 Coordination WMO Members are invited to designate a focal point responsible to discuss any comments/ disagreements with the IPET-DRC. If the discussion between the IPET-DRC and the focal point cannot result in an agreement on a specific amendment by a WMO Member, this amendment will be reconsidered by the IPET-DRC.
3.5 Notification Once amendments are agreed by WMO Members, and after consultation with the chair of the OPAG-ISS and the president and vice-president of CBS, the Secretariat notifies at the same time the WMO Members and the members of the Executive Council of the approved amendments and of the date of their implementation.
IPET-DRCChair of
OPAG-ISS andpresident/
vice-president of CBS
Agreed by WMO
Members
WMO Membersand EC informed
Figure 2. Adoption of amendments between CBS sessions
4. Procedure for the adoption of amendments during CBS sessions For the adoption of amendments during CBS sessions, the IPET-DRC submits its recommendation, including a date of implementation of the amendments, to the Implementation/Coordination Team on Information Systems and Services (ICT-ISS) of OPAG-ISS. The recommendation is then submitted to a CBS session and thereafter to an EC session.
IPET-DRC Meeting of the ICT-ISS
CBS session EC session
Figure 3. Adoption of amendments during a CBS session
5. Procedure for the correction of existing entries in the BUFR and CREX tables
5.1 Introducing a new descriptor If an erroneous specification of an entry is found in an operational BUFR or CREX element descriptor or sequence descriptor, a new descriptor should preferably be added to the appropriate table through the fast-track procedure or the procedure for adoption of amendments between CBS sessions. The new descriptor should be used instead of the old one for encoding (especially if it concerns data width). An appropriate explanation shall be added to the notes of the table to clarify the practice along with the date of the change. This situation is considered a minor adjustment according to 2.3.1 above.
5.2 Correcting erroneous specification As an exceptional measure for erroneous entries in Table B, if it is found absolutely necessary to correct an erroneous specification of an existing entry by changing its specification, the following rules shall apply:
5.2.1 The name and unit of an element descriptor shall remain unchanged except for minor clarifications.
5.2.2 Scale, reference value and bit width may be corrected to required values.
5.2.3 Such a change will be submitted through the fast-track procedure.

INTRODUCTION xiii
Volume I.1
6. Validation procedure
6.1 Documentation of need and purpose The need for, and the purpose of, the proposal for changes should be documented.
6.2 Documentation of result This documentation must include the results of validation testing of the proposal as described below.
6.3 Testing with encoder/decoder For new or modified WMO code and data representation forms, proposed changes should be tested by the use of at least two independently developed encoders and two independently developed decoders which incorporated the proposed change. Where the data originated from a necessarily unique source (for example, the data stream from an experimental satellite), the successful testing of a single encoder with at least two independent decoders would be considered adequate. Results should be made available to the IPET-DRC with a view to verifying the technical specifications.
_____________

Volume I.1
DEFINITIONS
Actual time of observation
(1) In the case of a surface synoptic observation, the time at which the barometer is read.
(2) In the case of upper-air observations, the time at which the balloon, parachute or rocket is actually released.
Alpine glow
Pink or yellow colouring assumed by mountain tops opposite the Sun when it is only just below the horizon before it rises and after it sets. This phenomenon vanishes after a brief interval of blue colouring, when the Earth’s shadow reaches these summits.
Anomalous propagation
Propagation of radio energy in abnormal conditions of vertical distribution of refractive index, in association with abnormal distribution of atmospheric temperature and humidity. Use of the term is mainly confined to conditions in which abnormally large distances of propagation are attained.
Atmospheric – Sferic
Electromagnetic wave resulting from an electric discharge (lightning) in the atmosphere.
Automatic station
Meteorological station at which instruments make and transmit observations, the conversion to code form for international exchange being made either directly or at an editing station.
Aviation routine weather report
A statement of the observed meteorological conditions related to a specified time and location, issued on a routine basis for use in international air navigation.
BUFR – Binary universal form for the representation of meteorological data
BUFR is the name of a binary code for the exchange and storage of data.
BUFR message
A single complete BUFR entity.
Category
The lists of sequence descriptors tabulated in BUFR or CREX Table D are categorized according to their application; categories are provided for non-meteorological sequences, for various types of meteorological sequences, and for sequences which define reports, or major subsets of reports.
Class
A set of elements tabulated together in BUFR/CREX Table B.
Condensation trails (contrails)
Clouds which form in the wake of an aircraft when the atmosphere at flying level is sufficiently cold and humid.
Coordinate class
Classes 0–9 inclusive in BUFR/CREX Table B define elements which assist in the definition of elements from subsequent classes; each of these classes is referred to as a coordinate class.

xvi DEFINITIONS
Volume I.1
CREX – Character form for the representation and exchange of data
CREX is the name of a table-driven alphanumeric code for the exchange and storage of data.
Data description operator
Operators which define replication or the operations listed in BUFR or CREX Table C.
Data entity
A single data item.
Data subset
A set of data corresponding to the data description in a BUFR or CREX message; for observational data, a data subset usually corresponds to one observation.
Day darkness
Sky covered with clouds with very strong optical thickness (dark clouds) having a threatening appearance.
Descriptor
An entity entered within the Data description section to describe or define data; a descriptor may take the form of an element descriptor, a replication operator, an operator descriptor, or a sequence descriptor.
Dry thunderstorm
A thunderstorm without precipitation reaching the ground (distinct from a nearby thunderstorm with precipitation reaching the ground but not at the station at the time of observation).
Dust wall or sand wall
Front of a duststorm or sandstorm, having the appearance of a gigantic high wall which moves more or less rapidly.
Element descriptor
A descriptor containing a code figure reference to BUFR/CREX Table B; the referenced entry defines an element, together with the units, scale factor, reference value and data width to be used to represent that element as data.
Equatorial regions
For the purpose of the analysis codes, the region between 30°N and 30°S latitudes.
Geometric altitude
Vertical distance (Z) of a level, a point or an object considered as a point, measured from mean sea level.
Geopotential
That potential with which the Earth’s gravitational field is associated. It is equivalent to the potential energy of unit mass relative to a standard level (mean sea level by convention) and is numerically equal to the work which would be done against gravity in raising the unit mass from sea level to the level at which the mass is located.
Geopotential ø at geometric height z is given by
�
φ = g dzo
z∫
where g is the acceleration of gravity.
DEFINITIONS xvii
Volume I.1
Geopotential height
Height of a point in the atmosphere expressed in units (geopotential metres) proportional to the geopotential at that height. Geopotential height expressed in geopotential metres is approximately equal to times the geometric height expressed in (geometric) metres, g being the local acceleration of gravity.
Haboob
A strong wind and duststorm or sandstorm in the northern and central Sudan. Its average duration is three hours; the average maximum wind velocity is over 15 m s–1. The dust or sand forms a dense whirling wall which may be 1 000 m high; it is often preceded by isolated dust whirls. Haboobs usually occur after a few days of rising temperature and falling pressure.
Ice crust (ice slick)
(1) A type of snow crust; a layer of ice, thicker than a film crust, upon a snow surface. It is formed by the freezing of melt water or rain water which has flowed into it.
(2) See Ice rind.
Ice rind
A thin but hard layer of sea ice, river ice or lake ice. Apparently this term is used in at least two ways: (a) for a new encrustation upon old ice; and (b) for a single layer of ice usually found in bays and fjords where fresh water freezes on top of slightly colder sea water.
Instrumental wave data
Data on measured characteristics relating to period and height of the wave motion of the sea surface.
Inversion (layer)
Atmospheric layer, horizontal or approximately so, in which the temperature increases with increasing height.
Isothermal layer
Atmospheric layer through which there is no change of temperature with height.
Jet stream
Flat tubular current of air, quasi-horizontal, whose axis is along a line of maximum speed and which is characterized not only by great speeds but also by strong transverse gradients of speed.
Line squall
Squall which occurs along a squall line.
Lithometeor
Meteor consisting of an ensemble of particles most of which are solid and non-aqueous. The particles are more or less suspended in the air, or lifted by the wind from the ground.
Mountain waves
Oscillatory motions of the atmosphere induced by flow over a mountain; such waves are formed over and to the lee of the mountain or mountain chain.
Normals
Period averages computed for over a uniform and relatively long period comprising at least three consecutive 10-year periods.
xviii DEFINITIONS
Volume I.1
Obscured sky
Occasions of hydrometeors or lithometeors which are so dense as to make it impossible to tell whether there is cloud above or not.
Ocean weather station
A station aboard a suitably equipped and staffed ship that endeavours to remain at a fixed sea position and that makes and reports surface and upper-air observations and may also make and report subsurface observations.
Operator descriptor
A descriptor containing a code figure reference to BUFR or CREX Table C, together with data to be used as an operand.
Past weather
Predominant characteristic of weather which had existed at the station during a given period of time.
Persistent condensation trail
Long-lived condensation trails which have spread to form clouds having the appearance of cirrus or patches of cirrocumulus or cirrostratus. It is sometimes impossible to distinguish such clouds from other cirrus, cirrocumulus or cirrostratus.
Present weather
Weather existing at the time of observation, or under certain conditions, during the hour preceding the time of observation.
Prevailing visibility
The greatest visibility value, observed in accordance with the definition of “visibility”, which is reached within at least half the horizon circle or within at least half of the surface of the aerodrome. These areas could comprise contiguous or non-contiguous sectors.
Note: This value may be assessed by human observation and/or instrumented systems. When instruments are installed, they are used to obtain the best estimate of the prevailing visibility.
Purple light
Glow with a hue varying between pink and red, which is to be seen in the direction of the Sun before it rises and after it sets and is about 3° to 6° below the horizon. It takes the form of a segment of a more or less large luminous disc which appears above the horizon.
Reference value
All data are represented within a BUFR or CREX message by positive integers; to enable negative values to be represented, suitable negative base values are specified as reference values. The true value is obtained by addition of the reference value and the data as represented.
Replication descriptor
A special descriptor is reserved to define the replication operation; it is used to enable a given number of subsequent descriptors to be replicated a given number of times.
Runway visual range
The range over which the pilot of an aircraft on the centre line of the runway can see the runway markings or the lights delineating the runway or identifying its centre line.
Sea station
An observing station situated at sea. Sea stations include ships, ocean weather stations and stations on fixed or drifting platforms (rigs, platforms, lightships and buoys).

DEFINITIONS xix
Volume I.1
Section
A logical subdivision of a BUFR or CREX message, to aid description and definition.
Sequence descriptor
A descriptor used as a code figure to reference a single entry in BUFR or CREX Table D; the referenced entry contains a list of descriptors to be substituted for the sequence descriptor.
Severe line squall
Severe squall which occurs along squall line (see Line squall).
Snow haze
A suspension in the air of numerous minute snow particles, considerably reducing the visibility at the Earth’s surface (visibility in snow haze often decreases to 50 m). Snow haze is observed most frequently in Arctic regions, before or after a snowstorm.
Squall
Atmospheric phenomenon characterized by a very large variation of wind speed: it begins suddenly, has a duration of the order of minutes and decreases rather suddenly in speed. It is often accompanied by a shower or thunderstorm.
Squall line
Fictitious moving line, sometimes of considerable extent, along which squall phenomena occur.
Sun pillar
Pillar of white light, which may or may not be continuous, which may be observed vertically above or below the Sun. Sun pillars are most frequently observed near sunrise or sunset; they may extend to about 20° above the Sun, and generally end in a point. When a sun pillar appears together with a well-developed parhelic circle, a sun cross may appear at their intersection.
Synoptic hour
Hour, expressed in terms of UTC, at which, by international agreement, meteorological observations are made simultaneously throughout the globe.
Synoptic observation
A surface or upper-air observation made at standard time.
Synoptic surface observation
Synoptic observation, other than an upper-air observation, made by an observer or an automatic weather station on the Earth’s surface.
Tropical (Tropic)
Pertaining to that region of the Earth’s surface lying between the Tropic of Cancer and Tropic of Capricorn at 23°30´N and S, respectively.
Tropical cyclone
Cyclone of tropical origin of small diameter (some hundreds of kilometres) with minimum surface pressure in some cases less than 900 hPa, very violent winds and torrential rain; sometimes accompanied by thunderstorms. It usually contains a central region, known as the “eye” of the storm, with a diameter of the order of some tens of kilometres, and with light winds and more or less lightly clouded sky.

xx DEFINITIONS
Volume I.1
Tropical revolving storm
Tropical cyclone.
Tropopause
(1) Upper limit of the troposphere. By convention, the “first tropopause” is defined as the lowest level at which the lapse rate decreases to 2°C km–1 or less, provided also the average lapse rate between this level and all higher levels within 2 km does not exceed 2°C km–1.
(2) If, above the first tropopause, the average lapse rate between any level and all higher levels within 1 km exceeds 3°C km–1, then a “second tropopause” is defined by the same criterion as under (1). This second tropopause may be either within or above the 1-km layer.
Twilight glow
See Purple light.
Twilight glow in the mountains (Alpenglühen)
See Alpine glow.
Unit of geopotential (Hm´)
1 standard geopotential metre = 0.980 665 dynamic metre
Hm´ =
where g(z) = acceleration of gravity, in m s–2, as a function of geometric height;
z = geometric height, in metres;
Hm´ = geopotential, in geopotential metres.
Vertical visibility
Maximum distance at which an observer can see and identify an object on the same vertical as himself, above or below.
Visibility (for aeronautical purposes)
Visibility for aeronautical purposes is the greater of:
(a) The greatest distance at which a black object of suitable dimensions, situated near the ground, can be seen and recognized when observed against a bright background;
(b) The greatest distance at which lights in the vicinity of 1000 candelas can be seen and identified against an unlit background.
Note: The two distances have different values in air of a given extinction coefficient, and the latter (b) varies with the background illumination. The former (a) is represented by the meteorological optical range (MOR).
Whiteout
Uniformly white appearance of the landscape when the ground is snow covered and the sky is uniformly covered with clouds. An atmospheric optical phenomenon of the polar regions in which the observer appears to be engulfed in a uniformly white glow. Neither shadows, horizon, nor clouds are discernible; sense of depth and orientation are lost; only very dark, nearby objects can be seen. Whiteout occurs over an unbroken snow cover and beneath a uniformly overcast sky, when, with the aid of the snowblink effect, the light from the sky is about equal to that from the snow surface. Blowing snow may be an additional cause. The phenomenon is experienced in the air as well as on the ground.
g (z) dz

DEFINITIONS xxi
Volume I.1
Wind (mean wind, spot wind)
Air motion relative to the Earth’s surface. Unless it is otherwise specified, only the horizontal component is considered.
(1) Mean wind: For the purpose of upper air reports from aircraft, mean wind is derived from the drift of the aircraft when flying from one fixed point to another or obtained by flying on a circuit around a fixed observed point and an immediate wind deduced from the drift of the aircraft.
(2) Spot wind: For the purpose of upper-air reports from aircraft, the wind velocity, observed or predicted, for a specified location, height and time.
Zodiacal light
White or yellowish light which spreads out, in the night sky, more or less along the zodiac from the horizon on the side on which the Sun is hidden. It is observed when the sky is sufficiently dark and the atmosphere sufficiently clear.
_____________


Section A
CODE FORMS
a. FM system of numbering code forms
b. List of code forms with notes and regulations
_____________


Volume I.1 A–3
a. FM SYSTEM OF NUMBERING CODE FORMS
Each code form bears a number, preceded by the letters FM. This number is followed by a Roman numeral to identify the session of CSM or (from 1974 onwards) of CBS which either approved the code form as a new one or made the latest amendment to its previous version. A code form approved or amended by correspondence after a session of CSM/CBS receives the number of that session.
Furthermore, an indicator term is used to designate the code form colloquially and is therefore called a “code name”. In some cases, this code name is included as a symbolic prefix in the code form and during transmission ensures ready identification of the type of report (e.g. CLIMAT).
The FM system of numbering the code forms, together with the corresponding code names and their reference list of CBS approved decisions, is the following:
FM SYSTEM OF CODE FORMS
FM 12–XIV Ext. SYNOP Report of surface observation from a fixed land station
Res. 5 (EC-XXXI), Res. 4 (EC-XXXVIII), Res. 1 (EC-XL), Res. 8 (EC-XLIII), Res. 4 (EC-XLV), Res. 4 (EC-XLVII), Res. 4 (EC-XLIX), Res. 8 (EC-LI), Res. 8 (EC-LV), Res. 7 (EC-LXI) and amendments between CBS sessions (2011)
FM 13–XIV Ext. SHIP Report of surface observation from a sea station
Res. 5 (EC-XXXI), Res. 4 (EC-XXXVIII), Res. 1 (EC-XL), Res. 8 (EC-XLIII), Res. 4 (EC-XLV), Res. 4 (EC-XLIX), Res. 8 (EC-LI), Res. 8 (EC-LV), Res. 7 (EC-LXI) and amendments between CBS sessions (2011)
FM 14–XIV Ext. SYNOP MOBIL Report of surface observation from a mobile land station
Res. 4 (EC-XLVII), Res. 4 (EC-XLIX), Res. 8 (EC-LI), Res. 8 (EC-LV), Res. 7 (EC-LXI) and amendments between CBS sessions (2011)
FM 15–XIV Ext. METAR Aerodrome routine meteorological report (with or without trend forecast)
Res. 13 (EC-XVIII), paragraph 4.10.10 of the general summary of EC-XXI, Res. 15 (EC-XXII), Res. 4 (EC-XXXVIII), Res. 8 (EC-XLIII), Rec. 14 (CBS-95), approved by the President of WMO, Res. 4 (EC-LIII), Res. 8 (EC-LV), Res. 2 (EC-LVII), Res. 10 (EC-LIX), Res. 7 (EC-LXI), amendments between CBS sessions (2010) and Res. 4 (Cg-XVI)
FM 16–XIV Ext. SPECI Aerodrome special meteorological report (with or without trend forecast)
Res. 13 (EC-XVIII), paragraph 4.10.10 of the general summary of EC-XXI, Res. 15 (EC-XXII), Res. 4 (EC-XXXVIII), Res. 8 (EC-XLIII), Rec. 14 (CBS-95), approved by the President of WMO, Res. 4 (EC-LIII), Res. 8 (EC-LV), Res. 2 (EC-LVII), Res. 10 (EC-LIX), Res. 7 (EC-LXI), amendments between CBS sessions (2010) and Res. 4 (Cg-XVI)
FM 18–XII BUOY Report of a buoy observation
Res. 8 (EC-XLIII), Res. 4 (EC-XLV), Rec. 16 (CBS-94), approved by the President of WMO, Res. 4 (EC-XLIX), Rec. 9 (CBS-97), approved by the President of WMO, and Res. 4 (EC-LIII)
FM 20–VIII RADOB Report of ground radar weather observation
Res. 15 (EC-XXII) and Res. 4 (EC-XXXV)

FM SYSTEM OF NUMBERING CODE FORM
A–4 Volume I.1
FM 22–IX Ext. RADREP Radiological data r1eport (monitored on a routine basis and/or in case of accident)
Res. 8 (EC-XLIII)
FM 32–XI Ext. PILOT Upper-wind report from a fixed land station
Res. 21 (EC-IV), Res. 22 (EC-X), Res. 34 (EC-XIV), Res. 13 (EC-XVIII), Res. 15 (EC-XXII), Res. 1 (EC-XL), Rec. 22 (CBS-89), approved by the President of WMO and Res. 8 (EC-LI)
FM 33–XI Ext. PILOT SHIP Upper-wind report from a sea station
Res. 21 (EC-IV), Res. 22 (EC-X), Res. 34 (EC-XIV), Res. 13 (EC-XVIII), Res. 15 (EC-XXII), Res. 1 (EC-XL) and Res. 8 (EC-LI)
FM 34–XI Ext. PILOT MOBIL Upper-wind report from a mobile land station
Rec. 22 (CBS-89), approved by the President of WMO and Res. 8 (EC-LI)
FM 35–XI Ext. TEMP Upper-level pressure, temperature, humidity and wind report from a fixed land station
Res. 21 (EC-IV), Res. 22 (EC-X), Res. 34 (EC-XIV), Res. 13 (EC-XVIII), Res. 15 (EC-XXII), Res. 1 (EC-XL), Rec. 22 (CBS-89), approved by the President of WMO, Res. 8 (EC-XLIII), Res. 4 (EC-XLVII) and Res. 8 (EC-LI)
FM 36–XI Ext. TEMP SHIP Upper-level pressure, temperature, humidity and wind report from a sea station
Res. 21 (EC-IV), Res. 22 (EC-X), Res. 34 (EC-XIV), Res. 13 (EC-XVIII), Res. 15 (EC-XXII), Res. 1 (EC-XL), Res. 8 (EC-XLIII), Res. 4 (EC-XLVII) and Res. 8 (EC-LI)
FM 37–XI Ext. TEMP DROP Upper-level pressure, temperature, humidity and wind report from a sonde released by carrier balloons or aircraft
Res. 4 (EC-XXXI), Res. 8 (EC-XLIII), Res. 4 (EC-XLVII) and Res. 8 (EC-LI)
FM 38–XI Ext. TEMP MOBIL Upper-level pressure, temperature, humidity and wind report from a mobile land station
Rec. 22 (CBS-89), approved by the President of WMO, Res. 8 (EC-XLIII), Res. 4 (EC-XLVII) and Res. 8 (EC-LI)
FM 39–VI ROCOB Upper-level temperature, wind and air density report from a land rocketsonde station
Paragraph 2.1.4 of the general summary of EC-XVI, Res.15 (EC-XXII) and Res. 3 (EC-XXVI)
FM 40–VI ROCOB SHIP Upper-level temperature, wind and air density report from a rocketsonde station on a ship
Paragraph 2.1.4 of the general summary of EC-XVI, Res. 15 (EC-XXII) and Res. 3 (EC-XXVI)
FM 41–IV CODAR Upper-air report from an aircraft (other than weather reconnaissance aircraft)
Res. 13 (EC-XVIII)
FM SYSTEM OF NUMBERING CODE FORMS
Volume I.1 A–5
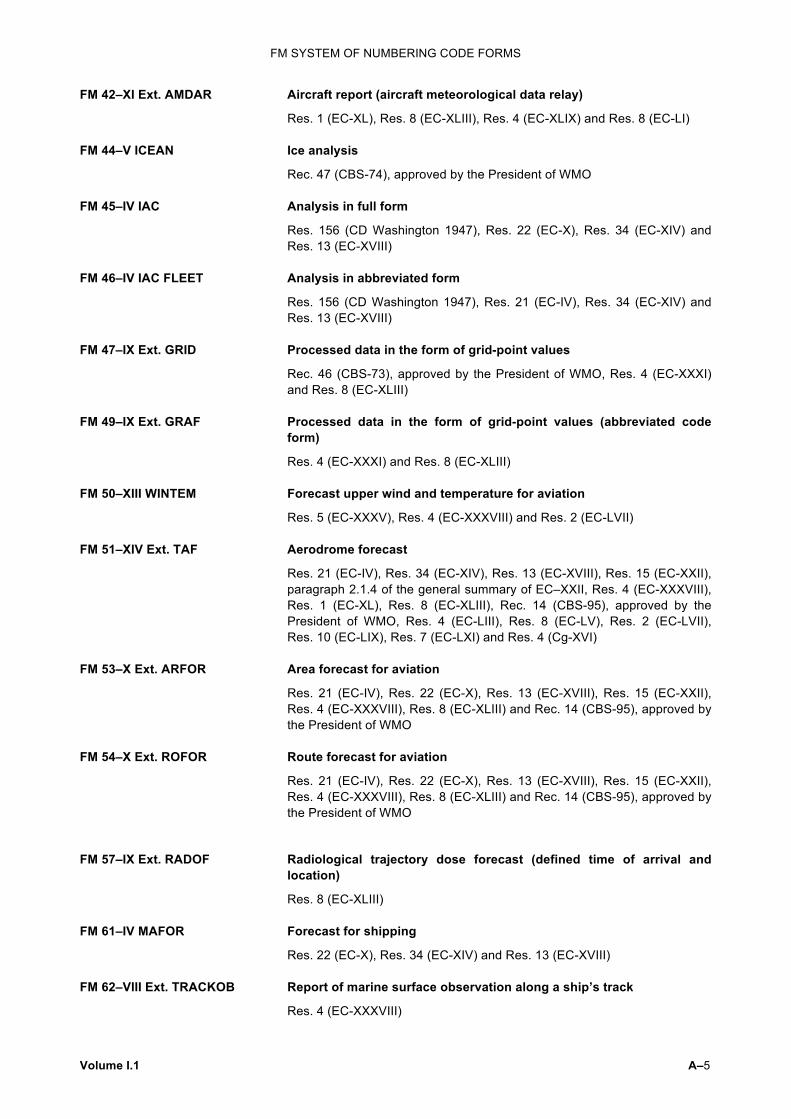
FM 42–XI Ext. AMDAR Aircraft report (aircraft meteorological data relay)
Res. 1 (EC-XL), Res. 8 (EC-XLIII), Res. 4 (EC-XLIX) and Res. 8 (EC-LI)
FM 44–V ICEAN Ice analysis
Rec. 47 (CBS-74), approved by the President of WMO
FM 45–IV IAC Analysis in full form
Res. 156 (CD Washington 1947), Res. 22 (EC-X), Res. 34 (EC-XIV) and Res. 13 (EC-XVIII)
FM 46–IV IAC FLEET Analysis in abbreviated form
Res. 156 (CD Washington 1947), Res. 21 (EC-IV), Res. 34 (EC-XIV) and Res. 13 (EC-XVIII)
FM 47–IX Ext. GRID Processed data in the form of grid-point values
Rec. 46 (CBS-73), approved by the President of WMO, Res. 4 (EC-XXXI) and Res. 8 (EC-XLIII)
FM 49–IX Ext. GRAF Processed data in the form of grid-point values (abbreviated code form)
Res. 4 (EC-XXXI) and Res. 8 (EC-XLIII)
FM 50–XIII WINTEM Forecast upper wind and temperature for aviation
Res. 5 (EC-XXXV), Res. 4 (EC-XXXVIII) and Res. 2 (EC-LVII)
FM 51–XIV Ext. TAF Aerodrome forecast
Res. 21 (EC-IV), Res. 34 (EC-XIV), Res. 13 (EC-XVIII), Res. 15 (EC-XXII), paragraph 2.1.4 of the general summary of EC–XXII, Res. 4 (EC-XXXVIII), Res. 1 (EC-XL), Res. 8 (EC-XLIII), Rec. 14 (CBS-95), approved by the President of WMO, Res. 4 (EC-LIII), Res. 8 (EC-LV), Res. 2 (EC-LVII), Res. 10 (EC-LIX), Res. 7 (EC-LXI) and Res. 4 (Cg-XVI)
FM 53–X Ext. ARFOR Area forecast for aviation
Res. 21 (EC-IV), Res. 22 (EC-X), Res. 13 (EC-XVIII), Res. 15 (EC-XXII), Res. 4 (EC-XXXVIII), Res. 8 (EC-XLIII) and Rec. 14 (CBS-95), approved by the President of WMO
FM 54–X Ext. ROFOR Route forecast for aviation
Res. 21 (EC-IV), Res. 22 (EC-X), Res. 13 (EC-XVIII), Res. 15 (EC-XXII), Res. 4 (EC-XXXVIII), Res. 8 (EC-XLIII) and Rec. 14 (CBS-95), approved by the President of WMO
FM 57–IX Ext. RADOF Radiological trajectory dose forecast (defined time of arrival and location)
Res. 8 (EC-XLIII)
FM 61–IV MAFOR Forecast for shipping
Res. 22 (EC-X), Res. 34 (EC-XIV) and Res. 13 (EC-XVIII)
FM 62–VIII Ext. TRACKOB Report of marine surface observation along a ship’s track
Res. 4 (EC-XXXVIII)

FM SYSTEM OF NUMBERING CODE FORM
A–6 Volume I.1
FM 63–XI Ext. BATHY Report of bathythermal observation
Res. 15 (EC-XXII), Res. 4 (EC-XXXV), Res. 4 (EC-XXXVIII), Res. 1 (EC-XL), Res. 8 (EC-XLIII), Res. 4 (EC-XLVII) and Res. 8 (EC-LI)
FM 64–XI Ext. TESAC Temperature, salinity and current report from a sea station
Res. 15 (EC-XXII), Res. 4 (EC-XXXV), Res. 4 (EC-XXXVIII), Res. 1 (EC-XL), Res. 8 (EC-XLIII) and Res. 8 (EC-LI)
FM 65–XI Ext. WAVEOB Report of spectral wave information from a sea station or from a remote platform (aircraft or satellite)
Res. 1 (EC-XL), Res. 4 (EC-XLIX) and Res. 8 (EC-LI)
FM 67–VI HYDRA Report of hydrological observation from a hydrological station
Res. 3 (EC-XXVI)
FM 68–VI HYFOR Hydrological forecast
Res. 3 (EC-XXVI)
FM 71–XII CLIMAT Report of monthly values from a land station
Res. 71 and 72 (CD Washington 1947), Res. 13 (EC-XVIII), paragraph 2.1.4 of the general summary of EC–XXII, Res. 3 (EC-XXVI), Res. 4 (EC-XLV), Res. 4 (EC-XLIX) and Res. 4 (EC-LIII)
FM 72–XII CLIMAT SHIP Report of monthly means and totals from an ocean weather station
Res. 71 and 72 (CD Washington 1947), Res. 22 (EC-X), Res. 13 (EC-XVIII), paragraph 2.1.4 of the general summary of EC-XXII, Res. 3 (EC-XXVI) and Res. 4 (EC-LIII)
NACLI CLINP SPCLI CLISA
FM 73-VI
INCLI
Report of monthly means for an oceanic area Res. 22 (IMC Salzburg 1937), Res. 71 (CD Washington 1947) and Res. 3 (EC-XXVI)
FM 75–XII Ext. CLIMAT TEMP Report of monthly aerological means from a land station
Res. 71 (CD Washington 1947), paragraph 5.11 of the general summary of EC-XV, Res. 13 (EC-XVIII), Res. 3 (EC-XXVI), Res. 4 (EC-XLV), Res. 4 (EC-LIII) and Res. 8 (EC-LV)
FM 76–XII Ext. CLIMAT TEMP SHIP Report of monthly aerological means from an ocean weather station
Res. 71 (CD Washington 1947), paragraph 5.11 of the general summary of EC-XV, Res. 13 (EC-XVIII), Res. 3 (EC-XXVI), Res. 4 (EC-XLV), Res. 4 (EC-LIII) and Res. 8 (EC-LV)
FM 81–I SFAZI Synoptic report of bearings of sources of atmospherics
Res. 21 (EC-IV)
FM 82–I SFLOC Synoptic report of the geographical location of sources of atmospherics
Res. 21 (EC-IV)

FM SYSTEM OF NUMBERING CODE FORMS
Volume I.1 A–7
FM 83–I SFAZU Detailed report of the distribution of sources of atmospherics by bearings for any period up to and including 24 hours
Res. 21 (EC-IV)
FM 85–IX SAREP Report of synoptic interpretation of cloud data obtained by a meteorological satellite
Res. 15 (EC-XXII), Res. 3 (EC-XXVI) and Res. 1 (EC-XL)
FM 86–XI SATEM Report of satellite remote upper-air soundings of pressure, temperature and humidity
Rec. 2 (CBS-Ext.(76)), approved by the President of WMO, Res. 4 (EC-XXXVIII) and Res. 4 (EC-XLIX)
FM 87–XI SARAD Report of satellite clear radiance observations
Rec. 3 (CBS-Ext.(76)), approved by the President of WMO, 4 (EC–XXXVIII) and Res. 4 (EC-XLIX)
FM 88–XI SATOB Report of satellite observations of wind, surface temperature, cloud, humidity and radiation
Rec. 4 (CBS-Ext.(76)), approved by the President of WMO, Res. 4 (EC-XLV) and Res. 4 (EC-XLIX)
_____________


Volume I.1 A–9
b. LIST OF CODE FORMS WITH NOTES AND REGULATIONS
FM 12–XIV Ext. SYNOP Report of surface observation from a fixed land station
FM 13–XIV Ext. SHIP Report of surface observation from a sea station
FM 14–XIV Ext. SYNOP MOBIL Report of surface observation from a mobile land station
C O D E F O R M :
SECTION 0 MiMiMjMj D . . . . D****
or A1bwnbnbnb**
YYGGiw
IIiii* or 99LaLaLa QcLoLoLoLo****
MMMULaULo*** h0h0h0h0im***
SECTION 1 iRixhVV Nddff (00fff) 1snTTT 2snTdTdTd
or 29UUU
3P0P0P0P0
4PPPP
or 4a3hhh
5appp 6RRRtR
7wwW1W2 or 7wawaWa1Wa2
8NhCLCMCH 9GGgg
SECTION 2 222Dsvs (0ssTwTwTw) (1PwaPwaHwaHwa) (2PwPwHwHw) ((3dw1dw1dw2dw2)
(4Pw1Pw1H w1H w1) (5Pw2Pw2H w2H w2)) (
6IsEsEsRs or ICING + plain language
)
(70HwaHwaHwa) (8swTbTbTb) (ICE + ciSibiDizi
or plain language
)
SECTION 3 333 (0 . . . .) (1snTxTxTx) (2snTnTnTn) (3Ejjj) (4E´sss) (5j1j2j3j4 (j5j6j7j8j9)) (6RRRtR) (7R24R24R24R24) (8NsChshs) (9SPSPspsp) (80000 (0 . . . .) (1 . . . .) . . . .) SECTION 4 444 N´C´H´H´Ct SECTION 5 555 Groups to be developed nationally ––––––––––
* Used in FM 12 only.
** Used in FM 13 only.
*** Used in FM 14 only.
**** Used in FM 13 and FM 14 only.

FM 12 SYNOP, FM 13 SHIP, FM 14 SYNOP MOBIL
A–10 Volume I.1
Notes:
(1) The code form FM 12 SYNOP is used for reporting synoptic surface observations from a fixed land station, manned or automatic. The code form FM 13 SHIP is used for the same kind of observations from a sea station, manned or automatic. The code form FM 14 SYNOP MOBIL is used for surface observations from an automatic or manned land station not at a fixed location.
(2) A SYNOP report from a fixed land station is identified by the symbolic letters MiMiMjMj = AAXX.
(3) A SHIP report from a sea station is identified by the symbolic letters MiMiMjMj = BBXX.
(4) A SYNOP MOBIL report from a mobile land station is identified by the symbolic letters MiMiMjMj = OOXX.
(5) The code form is made up of figure groups arranged by sections in ascending order of their numerical indicators with the exception of the following:
(a) All the groups of Section 0 and for the first two groups of Section 1, which are always included in the report of any surface observing station;
(b) The first data group of Section 2 – 222Dsvs, which is always included in the report of a sea station if data are available;
(c) The data group of Section 4, which is clearly identified by a three-figure indicator group.
As a result, the following features are achieved:
(d) The loss of information due to the accidental loss of any one of these groups is strictly limited to the information content of that group;
(e) The rules of inclusion or omission of sections or of groups between brackets can be laid down for each specific case of station type or of data requirements;
(f) The length of the report can be kept to a strict minimum by dropping out some groups whenever their information content is considered insignificant or when that information content is not normally available.
It is to be noted that the code word ICE of Section 2 plays the role of a numerical indicator for the last data group of the section or for the equivalent plain language information.
(6) The code form is divided into a number of sections as follows:
Section number Symbolic figure group Contents
0 — Data for reporting identification (type, ship’s call sign/buoy identifier, date, time, location) and units of wind speed used
1 — Data for global exchange which are common to the SYNOP, SHIP and SYNOP MOBIL code forms
2 222 Maritime data for global exchange pertaining to a sea, or to a coastal station
3 333 Data for regional exchange
4 444 Data for national use for clouds with base below station level, included by national decision
5 555 Data for national use
FM 12 SYNOP, FM 13 SHIP, FM 14 SYNOP MOBIL
Volume I.1 A–11
R E G U L A T I O N S :
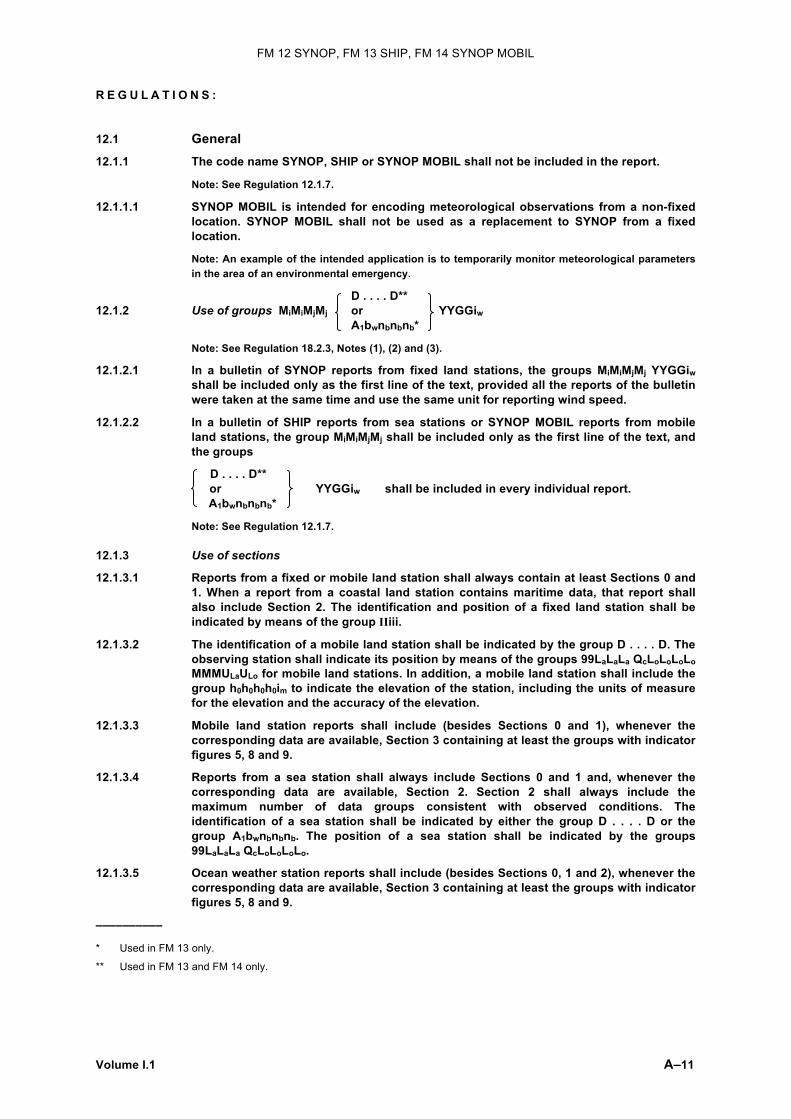
12.1 General 12.1.1 The code name SYNOP, SHIP or SYNOP MOBIL shall not be included in the report.
Note: See Regulation 12.1.7.
12.1.1.1 SYNOP MOBIL is intended for encoding meteorological observations from a non-fixed location. SYNOP MOBIL shall not be used as a replacement to SYNOP from a fixed location.
Note: An example of the intended application is to temporarily monitor meteorological parameters in the area of an environmental emergency.
D . . . . D** 12.1.2 Use of groups MiMiMjMj or YYGGiw A1bwnbnbnb*
Note: See Regulation 18.2.3, Notes (1), (2) and (3).
12.1.2.1 In a bulletin of SYNOP reports from fixed land stations, the groups MiMiMjMj YYGGiw shall be included only as the first line of the text, provided all the reports of the bulletin were taken at the same time and use the same unit for reporting wind speed.
12.1.2.2 In a bulletin of SHIP reports from sea stations or SYNOP MOBIL reports from mobile land stations, the group MiMiMjMj shall be included only as the first line of the text, and the groups
D . . . . D** or YYGGiw shall be included in every individual report. A1bwnbnbnb*
Note: See Regulation 12.1.7.
12.1.3 Use of sections
12.1.3.1 Reports from a fixed or mobile land station shall always contain at least Sections 0 and 1. When a report from a coastal land station contains maritime data, that report shall also include Section 2. The identification and position of a fixed land station shall be indicated by means of the group IIiii.
12.1.3.2 The identification of a mobile land station shall be indicated by the group D . . . . D. The observing station shall indicate its position by means of the groups 99LaLaLa QcLoLoLoLo MMMULaULo for mobile land stations. In addition, a mobile land station shall include the group h0h0h0h0im to indicate the elevation of the station, including the units of measure for the elevation and the accuracy of the elevation.
12.1.3.3 Mobile land station reports shall include (besides Sections 0 and 1), whenever the corresponding data are available, Section 3 containing at least the groups with indicator figures 5, 8 and 9.
12.1.3.4 Reports from a sea station shall always include Sections 0 and 1 and, whenever the corresponding data are available, Section 2. Section 2 shall always include the maximum number of data groups consistent with observed conditions. The identification of a sea station shall be indicated by either the group D . . . . D or the group A1bwnbnbnb. The position of a sea station shall be indicated by the groups 99LaLaLa QcLoLoLoLo.
12.1.3.5 Ocean weather station reports shall include (besides Sections 0, 1 and 2), whenever the corresponding data are available, Section 3 containing at least the groups with indicator figures 5, 8 and 9.
––––––––––
* Used in FM 13 only.
** Used in FM 13 and FM 14 only.

FM 12 SYNOP, FM 13 SHIP, FM 14 SYNOP MOBIL
A–12 Volume I.1
12.1.3.6 In reports from supplementary ships, Section 1 shall contain at least:
iRixhVV Nddff 1snTTT 4PPPP 7wwW1W2 8NhCLCMCH
where
(a) iR shall be set to code figure 4;
(b) ix shall be coded as 1 or 3 as the case may be.
12.1.3.7 In reports from auxiliary ships, Section 1 shall contain at least:
iRixhVV Nddff 1snTTT 4PPPP 7wwW1W2
where
(a) iR shall be set to code figure 4;
(b) ix shall be coded as 1 or 3 as the case may be.
Notes:
(1) The above-mentioned version of Section 1 is considered suitable for any ship which is not supplied with tested instruments and may be requested to report in areas where shipping is relatively sparse, or on request, and especially when storm conditions threaten or prevail. These ships may report in plain language if the use of code is impracticable.
(2) If the ship does not report cloud data, h should be coded with a solidus (/).
(3) If the ship is not equipped with tested instruments permitting the determination of tenths of degrees of air temperature and/or tenths of hectopascals of pressure, a solidus should be coded for the tenths of degrees and/or tenths of hectopascals, as appropriate.
12.1.4 In reports from automatic stations, mandatory group elements specified by symbolic letters shall be coded with solidi (/) if the station is not equipped to report the relevant data, taking into account that iR, ix, and N = 0, N = 9, N = / provide for omission of groups 6RRRtR, 7wawaWa1Wa2 and 8NhCLCMCH, as the case may be.
12.1.5 A fixed sea station (other than an ocean weather station or a moored buoy), which is considered by the Member operating it to be in the same category as a fixed land station, shall report its identification and position by means of the group IIiii.
12.1.6 The actual time of observation shall be the time at which the barometer is read.
12.1.7 (a) The identification of stations located at sea on a drilling rig or an oil- or gas-production platform shall be indicated by the group A1bwnbnbnb.
(b) In reports of sea stations other than buoys, drilling rigs and oil- or gas-production platforms, and in the absence of a ship's call sign, the word SHIP shall be used for D . . . . D.
(c) In reports from a mobile land station, only in the absence of a suitable call sign, the word MOBIL shall be used for D . . . . D.
12.2 Section 1
12.2.1 Group iRixhVV
12.2.1.1 This group shall always be included in the report.
12.2.1.2 Base of lowest cloud: h
When the station is in fog, a sandstorm or a duststorm or in blowing snow but the sky is discernible, h shall refer to the base of the lowest cloud observed, if any. When, under the above conditions, the sky is not discernible, h shall be reported as /.
Note: See regulations relative to the use of Section 4.
12.2.1.3 Visibility: VV
12.2.1.3.1 When the horizontal visibility is not the same in different directions, the shortest distance shall be given for VV.
12.2.1.3.2 In reporting visibility at sea, the decile 90–99 shall be used for VV.

FM 12 SYNOP, FM 13 SHIP, FM 14 SYNOP MOBIL
Volume I.1 A–13
12.2.2 Group Nddff
12.2.2.1 This group shall always be included in the report.
12.2.2.2 Total cloud cover: N
12.2.2.2.1 N shall be reported as actually seen by the observer during the observation.
12.2.2.2.2 Altocumulus perlucidus or Stratocumulus perlucidus (“mackerel sky”) shall be reported using N = 7 or less (unless overlying clouds appear to cover the whole sky) since breaks are always present in this cloud form even if it extends over the whole celestial dome.
12.2.2.2.3 N shall be coded as 0 when blue sky or stars are seen through existing fog or other analogous phenomena without any trace of cloud being seen.
12.2.2.2.4 When clouds are observed through fog or analogous phenomena, their amount shall be evaluated and reported as if these phenomena were non-existent.
12.2.2.2.5 The total cloud cover shall not include the amount resulting from rapidly dissipating condensation trails.
12.2.2.2.6 Persistent condensation trails and cloud masses which have obviously developed from condensation trails shall be reported as cloud, using the appropriate CH or CM code figure.
12.2.2.3 Wind direction and speed: ddff
12.2.2.3.1 The mean direction and speed of the wind over the 10-minute period immediately preceding the observation shall be reported for ddff. However, when the 10-minute period includes a discontinuity in the wind characteristics, only data obtained after the discontinuity shall be used for reporting the mean values, and hence the period in these circumstances shall be correspondingly reduced.
12.2.2.3.2 In the absence of wind instruments, the wind speed shall be estimated on the basis of the Beaufort wind scale. The Beaufort number obtained by estimation is converted into metres per second or knots by the use of the wind speed equivalent columns of the Beaufort scale, and this speed is reported for ff.
12.2.2.3.3 When the wind speed, in units indicated by iw, is 99 units or more:
(a) ff in the group Nddff shall be encoded 99;
(b) The group 00fff shall be included immediately following the group Nddff.
Note: The apparent wind speed measured on board a moving ship is to be corrected for the course and the speed of the ship, in order to obtain the speed of the true wind, which is to be reported. The correction can be made on the basis of the parallelogram of velocities or by means of special tables.
12.2.3 Groups 1snTTT, 2snTdTdTd, 4PPPP, 5appp
12.2.3.1 Groups 1snTTT, 2snTdTdTd and 4PPPP shall be included whenever the corresponding data are available, unless stated otherwise in specific regulations.
Note: See Regulation 12.2.3.5 relative to group 5appp.
12.2.3.2 Group 1snTTT
When the data are not available as a result of a temporary instrument failure, automatic weather stations programmed to transmit this group shall either omit the group altogether or include it in their reports in the form 1////.
12.2.3.3 Group 2snTdTdTd
12.2.3.3.1 Under unusual conditions, when the dew-point temperature is temporarily unavailable (e.g. because of instrument failure) but relative humidity is available, the group 29UUU shall replace the group 2snTdTdTd. Every attempt shall first be made, however, to convert relative humidity to dew-point temperature, and the relative humidity included only as a last resort.
12.2.3.3.2 Regulation 12.2.3.2 shall apply to this group, which shall in that case either be omitted or encoded as 2////.

FM 12 SYNOP, FM 13 SHIP, FM 14 SYNOP MOBIL
A–14 Volume I.1
12.2.3.4 Group 4PPPP
12.2.3.4.1 Whenever air pressure at mean sea level can be computed with reasonable accuracy, this pressure shall be reported in the 4PPPP group.
Notes:
(1) For a station situated in a region of normal synoptic network density, the pressure at mean sea level is considered not to be computed with reasonable accuracy when it introduces a deformation into the analysis of the horizontal pressure field which is purely local and recurring.
(2) For a station lying in a data-sparse area of the synoptic network, reasonable accuracy will be obtained when using a reduction method which has proved to be satisfactory in a region of normal network density and under similar geographical conditions.
12.2.3.4.2 By regional decision, a high-level station which cannot give pressure at mean sea level to a satisfactory degree of accuracy shall report both the station-level pressure group 3P0P0P0P0 and the geopotential height of an agreed standard isobaric surface. In that case, the group 4PPPP shall be replaced by the group 4a3hhh.
Note: The level chosen for each station is indicated in Weather Reporting (WMO-No. 9), Volume A.
12.2.3.5 Group 5appp
12.2.3.5.1 Unless specified otherwise by regional decision, this group shall be included whenever the three-hourly pressure tendency is available.
12.2.3.5.2 The pressure tendency over the past three hours, a, shall, wherever possible, be determined on the basis of pressure samplet at equi-spaced intervals not exceeding one hour.
Note: Algorithms for selecting the appropriate code figure are included in the Guide to Meteorological Instruments and Methods of Observation (WMO-No. 8).
12.2.3.5.3 Where it is not possible to apply the algorithms specified in Regulation 12.2.3.5.2 in reports from automatic weather stations, a shall be coded as 2 when the tendency is positive; as 7 when the tendency is negative; and as 4 when the atmospheric pressure is the same as three hours before.
12.2.4 Group 3P0P0P0P0
This group shall be included in reports for global exchange from land stations, together with either the group 4PPPP or, in accordance with Regulation 12.2.3.4.2, the group 4a3hhh.
Note: Inclusion of this group at other times is left to the decision of individual Members.
12.2.5 Group 6RRRtR
12.2.5.1 When precipitation data are to be exchanged in time periods of six hours at main standard times (i.e. to report the amount of precipitation over the preceding 6, 12, 18 and 24 hours), this group shall be included in Section 1.
12.2.5.2 When precipitation data are to be exchanged in time periods of three hours or other periods required for regional exchange, this group shall be included in Section 3.
12.2.5.3 For lightships reporting in the SHIP code form and for ocean weather stations, the use of this group shall be fixed regionally or nationally. In the case of mobile ship stations which make precipitation observations, the group shall be included in each SHIP report.
12.2.5.4 This group shall:
(a) Coded with RRR = 000 (3 zeros) when precipitation is measured but no precipitation occurred during the reference period;
(b) Coded with RRR = /// (3 solidi) when precipitation is normally measured but is not available for the current report;
(c) Omitted when precipitation is not normally measured. In this case, iR should be coded as 4;
FM 12 SYNOP, FM 13 SHIP, FM 14 SYNOP MOBIL
Volume I.1 A–15
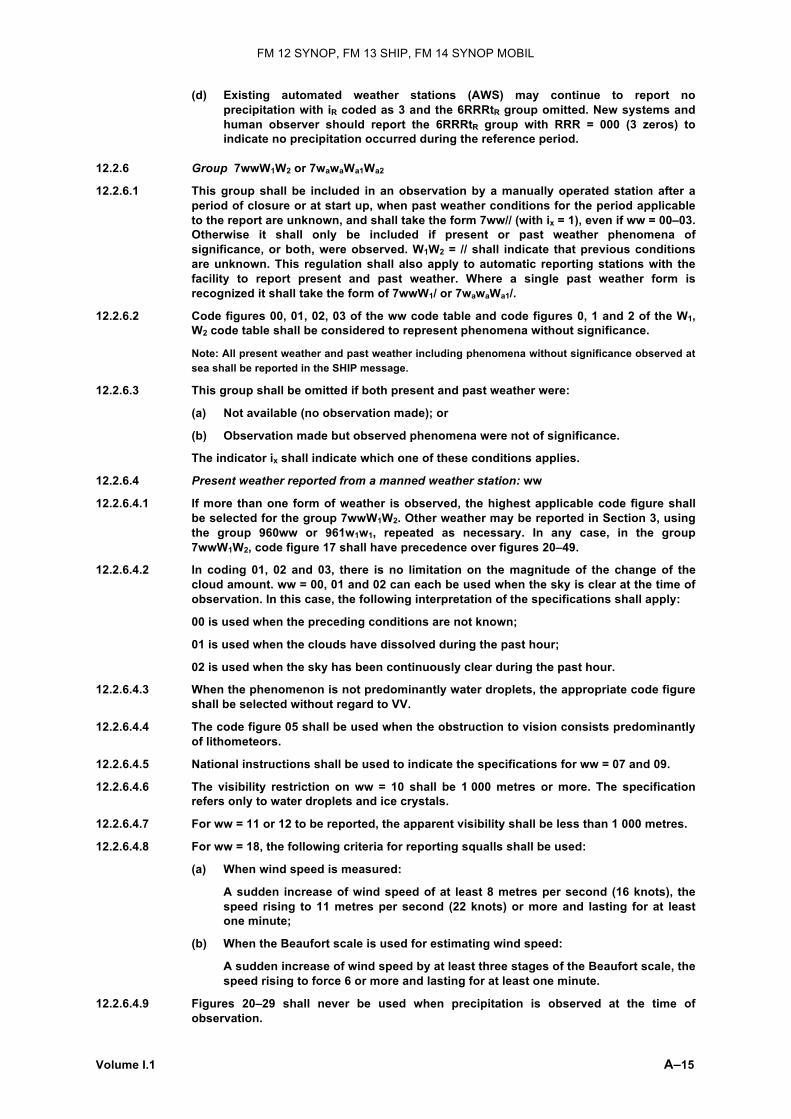
(d) Existing automated weather stations (AWS) may continue to report no precipitation with iR coded as 3 and the 6RRRtR group omitted. New systems and human observer should report the 6RRRtR group with RRR = 000 (3 zeros) to indicate no precipitation occurred during the reference period.
12.2.6 Group 7wwW1W2 or 7wawaWa1Wa2
12.2.6.1 This group shall be included in an observation by a manually operated station after a period of closure or at start up, when past weather conditions for the period applicable to the report are unknown, and shall take the form 7ww// (with ix = 1), even if ww = 00–03. Otherwise it shall only be included if present or past weather phenomena of significance, or both, were observed. W1W2 = // shall indicate that previous conditions are unknown. This regulation shall also apply to automatic reporting stations with the facility to report present and past weather. Where a single past weather form is recognized it shall take the form of 7wwW1/ or 7wawaWa1/.
12.2.6.2 Code figures 00, 01, 02, 03 of the ww code table and code figures 0, 1 and 2 of the W1, W2 code table shall be considered to represent phenomena without significance.
Note: All present weather and past weather including phenomena without significance observed at sea shall be reported in the SHIP message.
12.2.6.3 This group shall be omitted if both present and past weather were:
(a) Not available (no observation made); or
(b) Observation made but observed phenomena were not of significance.
The indicator ix shall indicate which one of these conditions applies.
12.2.6.4 Present weather reported from a manned weather station: ww
12.2.6.4.1 If more than one form of weather is observed, the highest applicable code figure shall be selected for the group 7wwW1W2. Other weather may be reported in Section 3, using the group 960ww or 961w1w1, repeated as necessary. In any case, in the group 7wwW1W2, code figure 17 shall have precedence over figures 20–49.
12.2.6.4.2 In coding 01, 02 and 03, there is no limitation on the magnitude of the change of the cloud amount. ww = 00, 01 and 02 can each be used when the sky is clear at the time of observation. In this case, the following interpretation of the specifications shall apply:
00 is used when the preceding conditions are not known;
01 is used when the clouds have dissolved during the past hour;
02 is used when the sky has been continuously clear during the past hour.
12.2.6.4.3 When the phenomenon is not predominantly water droplets, the appropriate code figure shall be selected without regard to VV.
12.2.6.4.4 The code figure 05 shall be used when the obstruction to vision consists predominantly of lithometeors.
12.2.6.4.5 National instructions shall be used to indicate the specifications for ww = 07 and 09.
12.2.6.4.6 The visibility restriction on ww = 10 shall be 1 000 metres or more. The specification refers only to water droplets and ice crystals.
12.2.6.4.7 For ww = 11 or 12 to be reported, the apparent visibility shall be less than 1 000 metres.
12.2.6.4.8 For ww = 18, the following criteria for reporting squalls shall be used:
(a) When wind speed is measured:
A sudden increase of wind speed of at least 8 metres per second (16 knots), the speed rising to 11 metres per second (22 knots) or more and lasting for at least one minute;
(b) When the Beaufort scale is used for estimating wind speed:
A sudden increase of wind speed by at least three stages of the Beaufort scale, the speed rising to force 6 or more and lasting for at least one minute.
12.2.6.4.9 Figures 20–29 shall never be used when precipitation is observed at the time of observation.
FM 12 SYNOP, FM 13 SHIP, FM 14 SYNOP MOBIL
A–16 Volume I.1
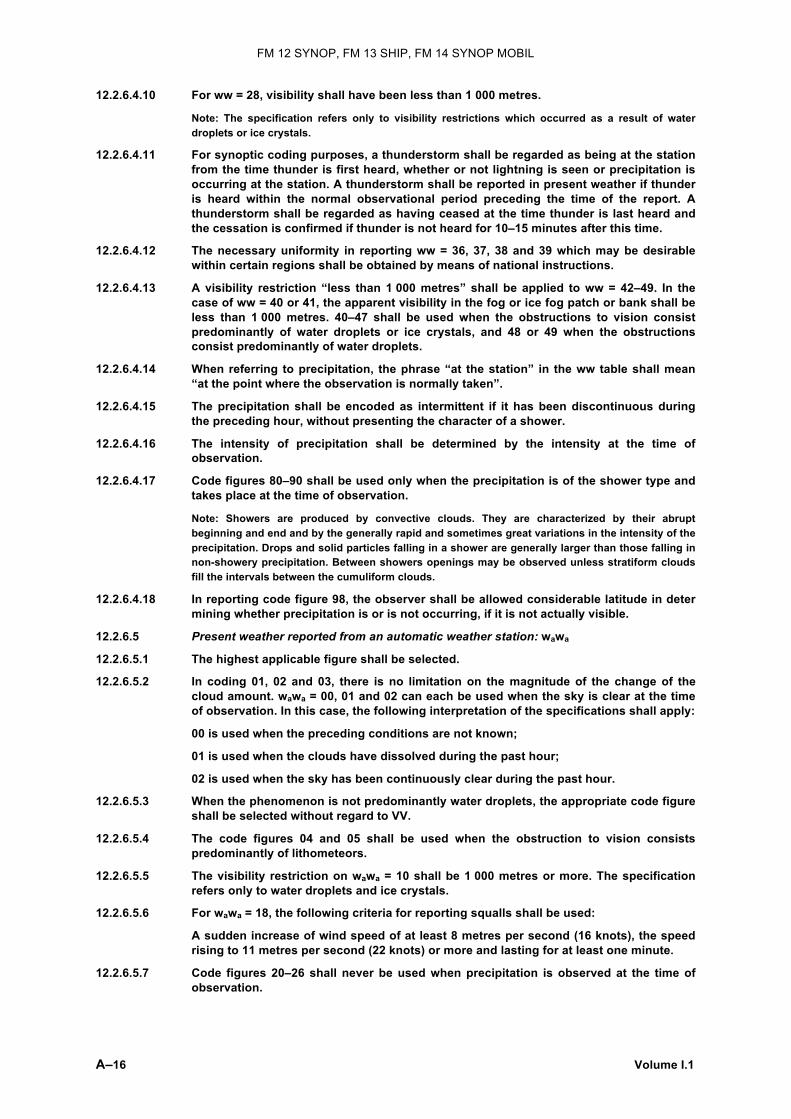
12.2.6.4.10 For ww = 28, visibility shall have been less than 1 000 metres.
Note: The specification refers only to visibility restrictions which occurred as a result of water droplets or ice crystals.
12.2.6.4.11 For synoptic coding purposes, a thunderstorm shall be regarded as being at the station from the time thunder is first heard, whether or not lightning is seen or precipitation is occurring at the station. A thunderstorm shall be reported in present weather if thunder is heard within the normal observational period preceding the time of the report. A thunderstorm shall be regarded as having ceased at the time thunder is last heard and the cessation is confirmed if thunder is not heard for 10–15 minutes after this time.
12.2.6.4.12 The necessary uniformity in reporting ww = 36, 37, 38 and 39 which may be desirable within certain regions shall be obtained by means of national instructions.
12.2.6.4.13 A visibility restriction “less than 1 000 metres” shall be applied to ww = 42–49. In the case of ww = 40 or 41, the apparent visibility in the fog or ice fog patch or bank shall be less than 1 000 metres. 40–47 shall be used when the obstructions to vision consist predominantly of water droplets or ice crystals, and 48 or 49 when the obstructions consist predominantly of water droplets.
12.2.6.4.14 When referring to precipitation, the phrase “at the station” in the ww table shall mean “at the point where the observation is normally taken”.
12.2.6.4.15 The precipitation shall be encoded as intermittent if it has been discontinuous during the preceding hour, without presenting the character of a shower.
12.2.6.4.16 The intensity of precipitation shall be determined by the intensity at the time of observation.
12.2.6.4.17 Code figures 80–90 shall be used only when the precipitation is of the shower type and takes place at the time of observation.
Note: Showers are produced by convective clouds. They are characterized by their abrupt beginning and end and by the generally rapid and sometimes great variations in the intensity of the precipitation. Drops and solid particles falling in a shower are generally larger than those falling in non-showery precipitation. Between showers openings may be observed unless stratiform clouds fill the intervals between the cumuliform clouds.
12.2.6.4.18 In reporting code figure 98, the observer shall be allowed considerable latitude in deter mining whether precipitation is or is not occurring, if it is not actually visible.
12.2.6.5 Present weather reported from an automatic weather station: wawa
12.2.6.5.1 The highest applicable figure shall be selected.
12.2.6.5.2 In coding 01, 02 and 03, there is no limitation on the magnitude of the change of the cloud amount. wawa = 00, 01 and 02 can each be used when the sky is clear at the time of observation. In this case, the following interpretation of the specifications shall apply:
00 is used when the preceding conditions are not known;
01 is used when the clouds have dissolved during the past hour;
02 is used when the sky has been continuously clear during the past hour.
12.2.6.5.3 When the phenomenon is not predominantly water droplets, the appropriate code figure shall be selected without regard to VV.
12.2.6.5.4 The code figures 04 and 05 shall be used when the obstruction to vision consists predominantly of lithometeors.
12.2.6.5.5 The visibility restriction on wawa = 10 shall be 1 000 metres or more. The specification refers only to water droplets and ice crystals.
12.2.6.5.6 For wawa = 18, the following criteria for reporting squalls shall be used:
A sudden increase of wind speed of at least 8 metres per second (16 knots), the speed rising to 11 metres per second (22 knots) or more and lasting for at least one minute.
12.2.6.5.7 Code figures 20–26 shall never be used when precipitation is observed at the time of observation.

FM 12 SYNOP, FM 13 SHIP, FM 14 SYNOP MOBIL
Volume I.1 A–17
12.2.6.5.8 For wawa = 20, visibility shall have been less than 1 000 metres.
Note: The specification refers only to visibility restrictions which occurred as a result of water droplets or ice crystals.
12.2.6.5.9 For synoptic coding purposes, a thunderstorm shall be regarded as being at the station from the time thunder is first detected, whether or not lightning is detected or precipitation is occurring at the station. A thunderstorm shall be reported in present weather if thunder is detected within the normal observational period preceding the time of the report. A thunderstorm shall be regarded as having ceased at the time thunder is last detected and the cessation is confirmed if thunder is not detected for 10–15 minutes after this time.
12.2.6.5.10 A visibility restriction “less than 1 000 metres” shall be applied to wawa = 30–35.
12.2.6.5.11 The precipitation shall be encoded as intermittent if it has been discontinuous during the preceding hour, without presenting the character of a shower.
12.2.6.5.12 The intensity of precipitation shall be determined by the intensity at the time of observation.
12.2.6.5.13 Code figures 80–89 shall be used only when the precipitation is intermittent or of the shower type and takes place at the time of observation.
Note: Showers are produced by convective clouds. They are characterized by their abrupt beginning and end and by the generally rapid and sometimes great variations in the intensity of the precipitation. Drops and solid particles falling in a shower are generally larger than those falling in non-showery precipitation. Between showers openings may be observed unless stratiform clouds fill the intervals between the cumuliform clouds.
12.2.6.6 Past weather reported from a manned weather station: W1W2
12.2.6.6.1 The period covered by W1 and W2 shall be:
(a) Six hours for observations at 0000, 0600, 1200 and 1800 UTC;
(b) Three hours for observations at 0300, 0900, 1500 and 2100 UTC;
(c) Two hours for intermediate observations if taken every two hours;
(d) One hour for intermediate observations if taken every hour.
12.2.6.6.2 The code figures for W1 and W2 shall be selected in such a way that W1W2 and ww together give as complete a description as possible of the weather in the time interval concerned. For example, if the type of weather undergoes a complete change during the time interval concerned, the code figures selected for W1 and W2 shall describe the weather prevailing before the type of weather indicated by ww began.
12.2.6.6.3 When W1 and W2 are used in hourly reports other than those covered by Regulation 12.2.6.6.1 (a) and (b), they cover a short period of time and Regulation 12.2.6.6.2 shall apply.
12.2.6.6.4 If, using Regulation 12.2.6.6.2, more than one code figure may be given to W1 with regard to the past weather, the highest figure shall be reported for W1 and the second highest code figure shall be reported for W2.
12.2.6.6.5 If the weather during the period has not changed so that only one code figure may be selected for the past weather, then that code figure shall be reported for both W1 and W2. For example, rain during the entire period shall be reported as W1W2 = 66.
12.2.6.7 Past weather reported from an automatic weather station: Wa1Wa2
12.2.6.7.1 The period covered by Wa1Wa2 shall be:
(a) Six hours for observations at 0000, 0600, 1200 and 1800 UTC;
(b) Three hours for observations at 0300, 0900, 1500 and 2100 UTC;
(c) Two hours for intermediate observations if taken every two hours;
(d) One hour for intermediate observations if taken every hour.

FM 12 SYNOP, FM 13 SHIP, FM 14 SYNOP MOBIL
A–18 Volume I.1
12.2.6.7.2 The code figures for Wa1Wa2 shall be selected so that the maximum capability of the automatic station to discern past weather is utilized, and so that Wa1Wa2 and wawa together give as complete a description as possible of the weather in the time interval concerned.
12.2.6.7.3 In cases where the automatic station is capable only of discerning very basic weather conditions, the lower code figures representing basic and generic phenomena may be used. If the automatic station has higher discrimination capabilities, the higher code figures representing more detailed explanation of the phenomena shall be used. For each basic type of phenomenon, the highest code figure within the discrimination capability of the automatic station shall be reported.
12.2.6.7.4 If the type of weather during the time interval concerned undergoes complete and discernible changes, the code figures selected for Wa1 and Wa2 shall describe the weather prevailing before the type of weather indicated by wawa began. The highest figure shall be reported for Wa1, and the second highest code figure shall be reported for Wa2.
12.2.6.7.5 If a discernible change in weather has not occurred during the period, so that only one code figure may be selected for the past weather, then that code figure shall be reported for both Wa1 and Wa2. For example, rain during the entire period shall be reported as Wa1 Wa2 = 44 in the case of an automatic station incapable of differentiating types of precipitation, or Wa1Wa2 = 66 in the case of a station with the higher discrimination capability.
12.2.7 Group 8NhCLCMCH
12.2.7.1 This group shall be omitted in the following cases:
(a) When there are no clouds (N = 0);
(b) When the sky is obscured by fog and/or other meteorological phenomena (N = 9);
(c) When the cloud cover is indiscernible for reasons other than (b) above, or observation is not made (N = /).
Note: All cloud observations at sea including no cloud observation shall be reported in the SHIP message.
12.2.7.2 Certain regulations concerning the coding of N shall also apply to the coding of Nh.
12.2.7.2.1 (a) If there are CL clouds then the total amount on all CL clouds, as actually seen by the observer during the observation, shall be reported for Nh;
(b) If there are no CL clouds but there are CM clouds, then the total amount of the CM clouds shall be reported for Nh;
(c) If there are no CL clouds and there are no CM level clouds, but there are CH clouds, then Nh shall be coded as 0.
12.2.7.2.2 If the variety of the cloud reported for Nh is perlucidus (stratocumulus perlucidus for a CL cloud or altocumulus perlucidus for a CM cloud) then Nh shall be coded as 7 or less.
Note: See Regulation 12.2.2.2.2.
12.2.7.2.3 When the clouds reported for Nh are observed through fog or an analogous phenomenon their amount shall be reported as if these phenomena were not present.
12.2.7.2.4 If the clouds reported for Nh include contrails, then Nh shall include the amount of persistent contrails. Rapidly dissipating contrails shall not be included in the value for Nh.
Note: See Regulation 12.5 concerning the use of Section 4.
12.2.7.3 The coding of CL, CM and CH clouds shall be as specified in the International Cloud Atlas (WMO-No. 407), Volume I.
Note: It is recommended that the pictorial guides included at the end of Chapter II.8 in the International Cloud Atlas, Volume I, be fully utilized in determining the priority of reporting the code figures for CL, CM and CH.

FM 12 SYNOP, FM 13 SHIP, FM 14 SYNOP MOBIL
Volume I.1 A–19
12.2.8 Group 9GGgg
This group shall be included: (a) When the actual time of observation differs by more than 10 minutes from the
standard time GG reported in Section 0; (b) When additionally specified by regional decision. Note: See Regulation 12.1.6.
12.3 Section 2 General
The inclusion of the groups of Section 2 in reports of merchant ships shall be determined by the Member who recruits the ship. The same rule shall be applied for automatic sea stations.
Note: Members are recommended to encourage the inclusion of the maximum possible number of data groups in Section 2 in accordance with Regulation 12.1.3.4.
12.3.1 Group 222Dsvs
12.3.1.1 This group shall always be included in reports from stations which have observed maritime conditions and in reports from ships being requested to include Dsvs as a routine procedure.
12.3.1.2 This group shall be encoded as:
(a) 22200 for a stationary sea station;
(b) 222// for:
(i) A coastal land station which reports maritime conditions;
(ii) A supplementary or auxiliary ship, except when reporting from an area for which the ship report collecting centre, in order to meet a requirement of a search and rescue centre, has requested inclusion of Dsvs as a routine procedure.
12.3.2 Group (0ssTwTwTw)
This group shall always be included in reports from ocean weather stations, when data are available.
12.3.3 Groups (1PwaPwaHwaHwa), (2PwPwHwHw), (70HwaHwaHwa)
12.3.3.1 Regulation 12.3.2 shall apply to these groups.
12.3.3.2 The group 1PwaPwaHwaHwa shall be used to report instrumental wave data in units of 0.5 metre.
12.3.3.3 The group 2PwPwHwHw shall be used to report wind waves, when instrumental wave data are not available.
12.3.3.4 (a) When the sea is calm (no waves and no swell) PwaPwaHwaHwa, or PwPwHwHw as the case may be, shall be reported as 0000;
(b) When the estimation of the period is impossible owing to confused sea, PwPw shall be reported as 99. When, for the same reason, the height of the waves cannot be determined, HwHw shall be encoded as //;
(c) In a report from a station that includes instrumental wave data, if data are not available for any other reason for either period or height of waves, PwaPwa or HwaHwa, as the case may be, shall be encoded as //. If data are not available for either period or height of waves, Regulation 12.2.3.2 shall apply and the group 1PwaPwaHwaHwa shall either be omitted or encoded as 1////;
(d) In a report from a station that does not include instrumental wave data, if data are not available for any other reason for either period or height of waves, PwPw or HwHw, as the case may be, shall be encoded as //. If data are not available for either period or height of waves, the group 2PwPwHwHw shall be omitted.

FM 12 SYNOP, FM 13 SHIP, FM 14 SYNOP MOBIL
A–20 Volume I.1
12.3.3.5 The group 70HwaHwaHwa shall be reported in addition to the group 1PwaPwaHwaHwa when the following conditions have been met:
(a) The sea is not calm (e.g. PwaPwaHwaHwa has not been reported as 0000);
(b) HwaHwa has not been reported as //;
(c) The station has the capability of accurately measuring instrumental wave height in units of 0.1 metre.
12.3.4 Groups ((3dw1dw1dw2dw2) (4Pw1Pw1Hw1Hw1) (5Pw2Pw2Hw2Hw2))
12.3.4.1 These groups shall be used to report swell data only when swell can be distinguished from wind waves.
12.3.4.2 If only one system of swell is observed:
(a) Its direction, period and height shall be indicated, respectively, by dw1dw1, Pw1Pw1, Hw1 Hw1;
(b) dw2dw2 shall be encoded as //;
(c) Group 5Pw2Pw2Hw2Hw2 shall be omitted.
12.3.4.3 If a second system of swell is observed:
(a) Its direction, period and height shall be indicated, respectively, by dw2dw2, Pw2Pw2, Hw2Hw2;
(b) The corresponding data for the first system of swell shall be reported as prescribed by Regulation 12.3.4.2 (a).
12.3.4.4 Ocean weather stations shall always include swell data when data are available.
12.3.5 Group (6IsEsEsRs)
When the ice accretion on ships is reported in plain language, it shall be preceded by the word ICING.
12.3.6 Group (8swTbTbTb)
When the wet bulb is used to derive dew-point value in a SHIP report, the group 8swTbTbTb shall be included to report the wet-bulb temperature measurement.
ciSibiDizi 12.3.7 Groups (ICE + or )
plain language
12.3.7.1 The reporting of sea ice and ice of land origin in FM 13 shall not supersede the reporting of sea ice and icebergs in accordance with the International Convention for the Safety of Life at Sea.
12.3.7.2 The group ciSibiDizi shall be reported whenever sea ice and/or ice of land origin are observed from the ship’s position at the time of observation, unless the ship is required to report ice conditions by means of a special sea-ice code.
12.3.7.3 When an ice edge is crossed or sighted between observation hours, it shall be reported as a plain-language addition in the form “ice edge lat. long.” (with position in degrees and minutes).
12.3.7.4 If the ship is in the open sea reporting an ice edge, the concentration ci and stage of development Si shall be reported only if the ship is close to the ice (i.e. within 0.5 nautical mile).
12.3.7.5 The situation in which the ship is in an open lead more than 1.0 nautical mile wide shall be coded as ci = 1 and Di = 0. The situation in which the ship is in fast ice with ice boundary beyond limit of visibility shall be coded as ci = 1 and Di = 9.
12.3.7.6 If no sea ice is visible and the code group is used to report ice of land origin only, the group shall be coded as 0/bi/0; e.g. 0/2/0 would mean 6–10 icebergs in sight, but no sea ice.
12.3.7.7 In coding concentration or arrangement of sea ice (code ci), that condition shall be reported which is of the most navigational significance.

FM 12 SYNOP, FM 13 SHIP, FM 14 SYNOP MOBIL
Volume I.1 A–21
12.3.7.8 The bearing of the principal ice edge reported shall be to the closest part of that edge.
Note: The requirements for sea-ice reporting are covered in the following way by the associated code tables:
Symbolic code letter ci
(a) The purpose of the first code figure (0) is to establish in relation to code zi (code figure 0) and code bi whether the floating ice that is visible is only ice of land origin;
(b) The possible variations in sea-ice concentration and arrangement within an area of observation are almost infinite. However, the field of reasonably accurate observation from a ship’s bridge is limited. For this reason, and also because minor variations are of temporary significance, the choice of concentrations and arrangements has been restricted for reporting purposes to those representing significantly different conditions from a navigational point of view. The code figures 2–9 have been divided into two sections depending on:
(i) Whether sea-ice concentration within the area of observation is more or less uniform (code figures 2–5); or
(ii) Whether there are marked contrasts in concentration or arrangement (code figures 6–9).
Symbolic code letter Si
(a) This table represents a series of increasing navigational difficulties for any given concentration; i.e. if the concentration is, for example, 8/10ths, then new ice would hardly have any effect on navigation while predominantly old ice would provide difficult conditions requiring reductions in speed and frequent course alterations;
(b) The correlation between the stage of development of sea ice and its thickness is explained in the Guide to Meteorological Instruments and Methods of Observation (WMO-No. 8).
Symbolic code letter bi
(a) This code provides a scale of increasing navigational hazard;
(b) Growlers and bergy bits, being much smaller and lower in the water than icebergs, are more difficult to see either by eye or radar. This is especially so if there is a heavy sea running. For this reason, code figures 4 and 5 represent more hazardous conditions than code figures 1 to 3.
Symbolic code letter Di
There is no provision in this code for the reporting of distance from the ice edge. It will be assumed by those receiving the report that the bearing has been given to the closest part of the ice edge. From the reported code figures for concentration and stage of development, it will be clear whether the ship is in ice or within 0.5 nautical mile of the ice edge. If the ship is in open water and more than 0.5 nautical mile from the ice edge, the ice edge will be assumed to be aligned at right angles to the bearing which is reported.
Symbolic code letter zi
(a) The purpose of this element in the code is to establish: (i) Whether the ship is in pack ice or is viewing floating ice (i.e. sea ice and/or
ice of land origin) from the open sea; and (ii) A qualitative estimate, dependent on the sea-ice navigation capabilities of
the reporting ship, of the penetrability of the sea ice and of the recent trend in conditions;
(b) The reporting of the conditions represented by code figures 1–9 in Code table 5239 can be used to help in the interpretation of reports from the two code tables (concentration ci and stage of development Si).

FM 12 SYNOP, FM 13 SHIP, FM 14 SYNOP MOBIL
A–22 Volume I.1
12.4 Section 3 This section shall be used for regional exchange.
12.4.1 The inclusion of groups with indicator figures 1 to 6, 8 and 9 shall be decided regionally. However group 7R24R24R24R24 shall be included by all stations (with the exception of stations situated in the Antarctic) capable of doing so, once a day at one appropriate time of the main standard times (0000, 0600, 1200 or 1800 UTC).
12.4.2 The symbolic form of the group with indicator figure 0 shall be developed regionally, as well as the rules for its inclusion in Section 3.
12.4.3 Other figure groups shall be developed regionally in order to cover requirements which cannot be satisfied by the existing groups. In order to avoid ambiguities, these other groups shall be:
(a) Provided with indicator figures 0, 1, 2, etc.;
(b) Preceded by an indicator group 80000 located after the last of the existing figure groups that was included in the report.
Notes:
(1) For example, if three supplementary groups are developed, a report including state of the ground, precipitation and cloud data would present Section 3 as 333 3Ejjj 6RRRtR 8NsChshs 80000 0 . . . . 1 . . . . 2 . . . .
(2) See Regulation 12.1.3.5.
12.4.4 Groups (1snTxTxTx), (2snTnTnTn)
The period of time covered by the maximum and the minimum temperature and the synoptic hour at which these temperatures are reported shall be determined by regional decision.
12.4.5 Group (3Ejjj)
The use of the parameter(s) jjj shall be fixed regionally.
12.4.6 Group (4E´sss)
12.4.6.1 The measurement shall include snow, ice and all other forms of solid precipitation on the ground at the time of observation.
12.4.6.2 When the depth is not uniform, the average depth over a representative area shall be reported.
12.4.7 Groups (5j1j2j3j4 (j5j6j7j8j9))
12.4.7.1 Symbolic expression
12.4.7.1.1 When the group 5j1j2j3j4 is used in the form 55j2j3j4, 553j3j4, 554j3j4 or 555j3j4, the supplementary group j5j6j7j8j9 shall be added to report net radiation, global solar radiation, diffused solar radiation, long-wave radiation, short-wave radiation, net short-wave radiation or direct solar radiation if data are available. The group shall be repeated as often as necessary.
Note: If sunshine duration is not available, the group shall be reported as 55///, 553//, 55407, 55408, 55507 or 55508 whenever the group j5j6j7j8j9 is required to report radiation data.
12.4.7.1.2 When the group 5j1j2j3j4 is used, one or more of the following symbolic expressions shall be adopted: (a) 5EEEiE to report the daily amount of either evaporation or evapo-
transpiration; (b) 54g0sndT to report temperature change data in period covered by W1W2; (c) 55SSS to report the daily hours of sunshine; (d) 553SS to report the duration of sunshine in the past hour; (e) 55407 to indicate that the supplementary group 4FFFF, which follows
immediately, is used to report net short-wave radiation during the previous hour, in kJ m–2;

FM 12 SYNOP, FM 13 SHIP, FM 14 SYNOP MOBIL
Volume I.1 A–23
(f) 55408 to indicate that the supplementary group 4FFFF, which follows immediately, is used to report direct solar radiation during the previous hour, in kJ m–2;
(g) 55507 to indicate that the supplementary group 5F24F24F224F24, which follows immediately, is used to report net short-wave radiation during the preceding 24 hours, in J cm–2;
(h) 55508 to indicate that the supplementary group 5F24F24F224F24, which follows immediately, is used to report direct solar radiation during the preceding 24 hours, in J cm–2;
(i) 56DLDMDH to report data on direction of cloud drift;
(j) 57CDaeC to report data on direction and elevation of cloud;
(k) 58p24p24p24 to report positive or zero change of surface pressure over the last 24 hours;
(l) 59p24p24p24 to report negative change of surface pressure over the last 24 hours.
12.4.7.1.3 When more than one group 5j1j2j3j4 is used, these groups shall be included in the order as listed in Regulation 12.4.7.1.2 with the supplementary groups j5j6j7j8j9 at the appropriate place.
12.4.7.2 Daily evaporation or evapotranspiration
12.4.7.2.1 The symbolic expression 5EEEiE shall be used to report either daily evaporation or evapotranspiration.
12.4.7.2.2 EEE shall indicate the amount of either evaporation or evapotranspiration, in tenths of a millimetre, during the preceding 24 hours at either 0000, 0600 or 1200 UTC.
12.4.7.3 Temperature change
For a change of temperature to be reported, the change shall be equal to or more than 5°C and occur in less than 30 minutes during the period covered by W1W2.
Note: The reporting of this information is restricted by regional or national decision to islands or other widely separated stations.
12.4.7.4 Duration of sunshine and radiation data
12.4.7.4.1 The symbolic expression SSS shall be used to report the daily sunshine, in hours and tenths of an hour. The symbolic expression SS (in group 553SS) shall be used to report the duration of sunshine in the past hour, in tenths of an hour.
12.4.7.4.2 In the form 55SSS, this group shall, by regional decision, be reported by all stations capable of doing so and included at either 0000, 0600, 1200 or 1800 UTC.
12.4.7.4.3 When the group 5j1j2j3j4 has the form 553SS, the supplementary group(s) j5FFFF may take one or more of the following forms:
j5 = 0 FFFF = positive net radiation during the previous hour, in kJ m–2;
j5 = 1 FFFF = negative net radiation during the previous hour, in kJ m–2;
j5 = 2 FFFF = global solar radiation during the previous hour, in kJ m–2;
j5 = 3 FFFF = diffused solar radiation during the previous hour, in kJ m–2;
j5 = 4 FFFF = downward long-wave radiation during the previous hour, in kJ m–2;
j5 = 5 FFFF = upward long-wave radiation during the previous hour, in kJ m–2;
j5 = 6 FFFF = short-wave radiation during the previous hour, in kJ m–2.
Note: For reporting net short-wave and direct solar radiation during the previous hour, see Regulation 12.4.7.1.2 (e) and (f), respectively.
12.4.7.4.4 When the group 5j1j2j3j4 has the form 55SSS, the supplementary group(s) j5F24F24F24F24 may take one or more of the following forms:
j5 = 0 F24F24F24F24 = positive net radiation during the preceding 24 hours, in J cm–2;
j5 = 1 F24F24F24F24 = negative net radiation during the preceding 24 hours, in J cm–2;
FM 12 SYNOP, FM 13 SHIP, FM 14 SYNOP MOBIL
A–24 Volume I.1
j5 = 2 F24F24F24F24 = global solar radiation during the preceding 24 hours, in J cm–2;
j5 = 3 F24F24F24F24 = diffused solar radiation during the preceding 24 hours, in J cm–2;
j5 = 4 F24F24F24F24 = downward long-wave radiation during the preceding 24 hours, in J cm–2;
j5 = 5 F24F24F24F24 = upward long-wave radiation during the preceding 24 hours, in J cm–2;
j5 = 6 F24F24F24F24 = short-wave radiation during the preceding 24 hours, in J cm–2.
Note: For reporting net short-wave and direct solar radiation during the preceding 24 hours, see Regulation 12.4.7.1.2 (g) and (h), respectively.
12.4.7.4.5 FFFF shall indicate the absolute value of the amount of solar or terrestrial radiation as appropriate, in kJ m–2, during the preceding hour. F24F24F24F24 shall indicate the absolute value of the amount of solar or terrestrial radiation as appropriate, in J cm–2, during the preceding 24 hours at either 0000, 0600, 1200 or 1800 UTC.
12.4.7.5 Direction, drift and elevation of cloud
Note: This information is required from land stations and fixed ship stations, mainly in the tropics.
12.4.8 Group (6RRRtR)
12.4.8.1 This group shall be included in Section 3 only when Regulation 12.2.5.2 applies.
12.4.8.2 The decision to implement Regulation 12.2.5.2 shall be taken at the regional level.
12.4.9 Group (7R24R24R24R24)
This group shall be used to report the total amount of precipitation during the 24-hour period ending at the time of observation, in tenths of a millimetre (coded 9998 for 999.8 mm or more, and coded 9999 for trace).
12.4.10 Group (8NsChshs)
12.4.10.1 This group shall be repeated to report a number of different layers or masses of cloud. When reported from a manned station, the number of such groups shall in the absence of Cumulonimbus clouds not exceed three. Cumulonimbus clouds, when observed, shall always be reported, so that the total number of groups can be four. When the station operates in the automatic mode, the total number of groups shall not exceed four.
The selection of layers (masses) to be reported shall be made in accordance with the following criteria:
(a) The lowest individual layer (mass) of any amount (Ns equals 1 or more);
(b) The next higher individual layer (mass) the amount of which is greater than two oktas (Ns equals 3 or more);
(c) The next higher individual layer (mass) the amount of which is greater than four oktas (Ns equals 5 or more);
(d) Cumulonimbus clouds, whenever observed and not reported under (a), (b) and (c) above by means of a group referring exclusively to Cb.
12.4.10.2 The order of reporting the groups shall always be from lower to higher levels.
12.4.10.3 In determining the cloud amounts to be reported for individual layers or masses in the 8-group, the observer shall estimate, by taking into consideration the evolution of the sky, the cloud amounts of each layer or mass at the different levels, as if no other clouds existed.
12.4.10.4 When the sky is clear (N = 0), the 8-group shall not be used.

FM 12 SYNOP, FM 13 SHIP, FM 14 SYNOP MOBIL
Volume I.1 A–25
12.4.10.5 When the sky is obscured (Ns = 9), the 8-group shall read 89/hshs, where hshs is the vertical visibility. When the observation of clouds is not made (N = /), the 8-group shall not be included.
Note: The vertical visibility is defined as the vertical visual range into an obscuring medium.
12.4.10.6 If two or more types of cloud occur with their bases at the same level and this level is one to be reported in accordance with Regulation 12.4.10.1, the selection for C and Ns shall be made in accordance with the following criteria:
(a) If these types do not include cumulonimbus then C shall refer to the cloud type that represents the greatest amount, or if there are two or more types of cloud all having the same amount, the highest applicable code figure for C shall be reported. Ns shall refer to the total amount of cloud whose bases are all at the same level;
(b) If these types do include cumulonimbus then one group shall be used to describe only this type with C reported as 9 and Ns as the amount of cumulonimbus. If the total amount of the remaining type(s) of cloud (excluding cumulonimbus) whose bases are all at the same level is greater than that required by Regulation 12.4.10.1, then another group shall be reported with C being selected in accordance with (a) and Ns referring to the total amount of the remaining cloud (excluding cumulonimbus).
12.4.10.7 Regulations 12.2.2.2.3 to 12.2.2.2.6, inclusive, shall apply.
12.4.11 Group (9SPSPsPsP)
The use of this group and the specifications for the supplementary information shall be as specified in Code table 3778.
12.5 Section 4 12.5.1 The inclusion of this section shall be fixed nationally.
12.5.2 Clouds with tops below station level shall be reported only by this section and any coexistent clouds with bases above station level shall be reported in group 8NhCLCMCH of Section 1.
12.5.3 CL clouds with bases below and tops above station level shall be reported in both 8NhCLCMCH and Section 4, provided that the station is out of cloud sufficiently frequently to enable the various features to be recognized. In this case:
(a) Nh shall correspond with N´ and CL with C´ while h shall be coded as /;
(b) If the upper surface of the clouds with tops above station level can be observed, it shall be reported by means of H´H´. If the upper surface cannot be observed, H´H´ shall be coded as //;
(c) Other CL clouds present with tops below station level shall be reported in a second N´C´H´H´Ct group;
(d) Other CL clouds present with bases above station level shall be reported in plain language after the N´C´H´H´Ct group.
12.5.4 If the station is in almost continuous cloud, Regulation 12.2.7.1 shall apply and Section 4 shall be omitted.
12.5.5 When two or more cloud layers with their bases below station level occur at different levels, two or more groups N´C´H´H´Ct shall be used. Ct shall be reported as 9 in the groups indicating the layer of the smaller cloud amount and, in the remaining group, Ct shall be coded in Code table 0552.
12.5.6 Rapidly dissipating condensation trails shall not be reported in Section 4.
Note: See Regulation 12.2.2.2.5.
12.5.7 The top of persistent condensation trails and cloud masses which have obviously developed from condensation trails shall be reported, using the appropriate Ct code figure.

FM 12 SYNOP, FM 13 SHIP, FM 14 SYNOP MOBIL
A–26 Volume I.1
12.5.8 Regulations 12.2.2.2.1 to 12.2.2.2.6, inclusive, shall apply.
12.5.9 Spaces occupied by mountains emerging from the cloud layers shall be counted as occupied by cloud.
12.6 Section 5 12.6.1 The use of this section, the symbolic form of groups and the specifications of symbolic
letters shall be determined by national decision.
12.6.2 Preference shall be given to symbolic 5-figure groups identified by numerical indicator figures.
_____________

Volume I.1 A–27
FM 15–XIV Ext. METAR Aerodrome routine meteorological report (with or without trend forecast
FM 16–XIV Ext. SPECI Aerodrome special meteorological report (with or without trend forecast
C O D E F O R M : METAR or SPECI
COR CCCC YYGGggZ NIL AUTO dddffGfmfm
KT or MPS
dndndnVdxdxdx
VVVV or CAVOK
VNVNVNVNDv
RDRDR/VRVRVRVRi or RDRDR/VRVRVRVRVVRVRVRVRi
w´w´
NsNsNshshshs or VVhshshs or NSC or NCD
T´T´/T´dT´d QPHPHPHPH REw´w´ WS RDRDR
or WS ALL RWY
(WTsTs/SS´) (RDRDR/ERCReReRBRBR)
(TTTTT or NOSIG)
TTGGgg
dddffGfmfm
KT or MPS
VVVV or CAVOK
w´w´ or NSW
NsNsNshshshs or VVhshshs or NSC
(RMK . . . . . . . . . . )
Notes:
(1) METAR is the name of the code for an aerodrome routine meteorological report. SPECI is the name of the code for an aerodrome special meteorological report. A METAR report and a SPECI report may have a trend forecast appended.
(2) The groups contain a non-uniform number of characters. When an element or phenomenon does not occur, the corresponding group, or the extension of a group, is omitted from a particular report. Detailed instructions are given for each group in the following Regulations. The groups enclosed in brackets are used in accordance with regional or national decisions. Groups may have to be repeated in accordance with the detailed instructions for each group. The code words COR and NIL shall be used, as appropriate, for corrected and missing reports, respectively.
(3) The code form includes a section containing the trend forecast identified either by a change indicator (TTTTT = BECMG or TEMPO as the case may be), or by the code word NOSIG.
(4) The governing criteria for issuing SPECI reports are specified in the Technical Regulations (WMO-No. 49), Volume II, [C.3.1].

FM 15 METAR, FM 16 SPECI
A–28 Volume I.1
R E G U L A T I O N S :
15.1 General 15.1.1 The code name METAR or SPECI shall be included at the beginning of each individual
report.
15.1.2 When a deterioration of one weather element is accompanied by an improvement in another element (for example, lowering of clouds and an improvement in visibility), a single SPECI report shall be issued.
15.2 Group CCCC The identification of the reporting station in each individual report shall be indicated by means of the ICAO location indicator.
15.3 Group YYGGggZ 15.3.1 The day of the month and the time of observation in hours and minutes UTC followed,
without a space, by the letter indicator Z shall be included in each individual METAR report.
15.3.2 This group shall be included in each individual SPECI report. In SPECI reports, this group shall indicate the time of occurrence of the change(s) which justified the issue of the report.
15.4 Code word AUTO The optional code word AUTO shall be inserted before the wind group when a report contains fully automated observations without human intervention. The ICAO requirement is that all of the specified elements shall be reported. However, if any element cannot be observed, the group in which it would have been encoded shall be replaced by the appropriate number of solidi. The number of solidi depends on the number of symbolic letters for the specific group which is not able to be reported; i.e. four for the visibility group, two for the present weather group and three or six for the cloud group, as appropriate.
KT 15.5 Groups dddffGfmfm or dndndnVdxdxdx
MPS
15.5.1 The mean true direction in degrees rounded off to the nearest 10 degrees from which the wind is blowing and the mean speed of the wind over the 10-minute period immediately preceding the observation shall be reported for dddff followed, without a space, by one of the abbreviations KT or MPS, to specify the unit used for reporting wind speed. Values of wind direction less than 100° shall be preceded by 0 and a wind from true north shall be reported as 360. Values of wind speed less than 10 units shall be preceded by 0. However, when the 10-minute period includes a marked discontinuity in the wind characteristics, only data after the discontinuity shall be used for obtaining mean wind speed and maximum gust values, and mean wind direction and variations of the wind direction, hence the time interval in these circumstances shall be correspondingly reduced.
Notes:
(1) KT and MPS are the standard ICAO abbreviations for knots and metres per second, respectively.
(2) The primary unit prescribed in ICAO Annex 5 for wind speed is the metre per second (MPS), with the knot (KT) permitted for use as a non-SI alternative unit until a termination date is decided.
(3) A marked discontinuity occurs when there is an abrupt and sustained change in wind direction of 30° or more, with a wind speed of 5 m s–1 (10 KT) or more before or after the change, or a change in wind speed of 5 m s–1 (10 KT) or more, lasting at least two minutes.

FM 15 METAR, FM 16 SPECI
Volume I.1 A–29
15.5.2 In the case of variable wind direction, ddd shall be encoded as VRB when the mean wind speed is less than 1.5 m s–1 (3 knots). A variable wind at higher speeds shall be reported only when the variation of wind direction is 180° or more or when it is impossible to determine a single wind direction, for example when a thunderstorm passes over the aerodrome.
15.5.3 If, during the 10-minute period preceding the observation, the total variation in wind direction is 60° or more but less than 180° and the mean wind speed is 1.5 m s–1 (3 knots) or more, the observed two extreme directions between which the wind has varied shall be given for dndndnVdxdxdx in clockwise order. Otherwise this group shall not be included.
15.5.4 “Calm” shall be coded as 00000 followed immediately, without a space, by one of the abbreviations KT or MPS to specify the unit, used normally for reporting wind.
15.5.5 If, during the 10-minute period preceding the observation, the maximum wind gust speed exceeds the mean speed by 5 m s–1 (10 knots) or more, this maximum speed shall be reported as Gfmfm immediately after dddff, followed immediately, without a space, by one of the abbreviations KT or MPS to specify the units used for reporting wind speed. Otherwise the element Gfmfm shall not be included.
Note: It is recommended that the wind measuring systems should be such that peak gusts should represent a three-second average.
15.5.6 For wind speeds of 100 units or greater, the exact number of wind speed units shall be given in lieu of the two-figure code ff or fmfm. When the wind speed is 50 m s–1 (100 knots) or more, the groups ff and fmfm shall be preceded by the letter indicator P and reported as P49MPS (P99KT).
Note: There is no aeronautical requirement to report surface wind speeds of 50 m s–1 (100 KT) or more; however, provision has been made for reporting wind speeds up to 99 m s–1 (199 KT) for non-aeronautical purposes, as necessary.
15.6 Groups VVVV VNVNVNVNDv Note: The coding of visibility is based on the use of the metre and kilometre, in accordance with the units specified in ICAO Annex 5.
15.6.1 The group VVVV shall be used to report prevailing visibility. When the horizontal visibility is not the same in different directions and when the visibility is fluctuating rapidly and the prevailing visibility cannot be determined, the group VVVV shall be used to report the lowest visibility.
15.6.2 Directional variation in visibility VNVNVNVNDv
When the horizontal visibility is not the same in different directions and when the minimum visibility is different from the prevailing visibility, and less than 1 500 metres or less than 50% of the prevailing visibility, and less than 5 000 metres, the group VNVNVNVNDv shall also be used to report the minimum visibility and, when possible, its general direction in relation to the aerodrome reference point indicated by reference to one of the eight points of the compass. If the minimum visibility is observed in more than one direction, the Dv shall represent the most operationally significant direction.
15.6.3 Visibility shall be reported using the following reporting steps:
(a) Up to 800 metres rounded down to the nearest 50 metres;
(b) Between 800 and 5 000 metres rounded down to the nearest 100 metres;
(c) Between 5 000 metres up to 9 999 metres rounded down to the nearest 1 000 metres;
(d) With 9999 indicating 10 km and above.

FM 15 METAR, FM 16 SPECI
A–30 Volume I.1
15.6.4 Code word CAVOK
Regulation 15.10 shall apply.
RDRDR/VRVRVRVRi 15.7 Groups or RDRDR/VRVRVRVRVVRVRVRVRi
Note: The coding of runway visual range is based on the use of the metre in accordance with the unit specified in ICAO Annex 5.
15.7.1 During periods when either the horizontal visibility reported in the group VVVV or the runway visual range for one or more runways available for landing is observed to be less than 1 500 metres, one or more groups under Regulation 15.7 shall be included in the report. The letter indicator R followed immediately, without a space, by the runway designator DRDR shall always precede the RVR reports.
15.7.2 The groups shall be repeated to report runway visual range values for each runway, up to a maximum of four, which is available for landing and for which runway visual range is determined.
15.7.3 Runway designator DRDR
The designator of each runway for which runway visual range is reported shall be indicated by DRDR. Parallel runways should be distinguished by appending to DRDR letters L, C or R indicating the left, central or right parallel runway, respectively. The letter(s) shall be appended to DRDR as necessary in accordance with the standard practice for runway designation, as laid down by ICAO in Annex 14 – Aerodromes, Volume I – Aerodrome design and operations, paragraphs 5.2.2.4 and 5.2.2.5.
15.7.4 Mean value and tendency of runway visual range over the 10-minute period immediately preceding the observation VRVRVRVRi
15.7.4.1 The runway visual range values to be reported shall be representative of the touchdown zone of the active landing runway(s) up to a maximum of four.
15.7.4.2 The mean value of the runway visual range over the 10-minute period immediately preceding the observation shall be reported for VRVRVRVR. However, when the 10-minute period includes a marked discontinuity in the RVR (for example, sudden advection of fog, rapid onset or cessation of an obscuring snow shower), only data after the discontinuity shall be used for obtaining mean RVR values and variations thereof, hence the time interval in these circumstances shall be correspondingly reduced.
Notes:
(1) See Regulation 15.7.5.
(2) Any observed value which does not fit the reporting scale in use should be rounded down to the nearest lower step in the scale.
(3) A marked discontinuity occurs when there is an abrupt and sustained change in runway visual range, lasting at least two minutes, consistent with the issuance of aerodrome special meteorological reports (SPECI) given in the Technical Regulations (WMO-No. 49), Volume II, [C.3.1.] 4.3.3.
15.7.4.3 If the runway visual range values during the 10-minute period preceding the observation show a distinct upward or downward tendency such that the mean during the first five minutes varies by 100 metres or more from the mean during the second five minutes of the period, this shall be indicated by i = U for upward and i = D for downward tendency of runway visual range values. When no distinct change in runway visual range is observed, i = N shall be used. When it is not possible to determine the tendency, i shall be omitted.
FM 15 METAR, FM 16 SPECI
Volume I.1 A–31
15.7.5 Significant variations of runway visual range RDRDR/VRVRVRVRVVRVRVRVRi
When the RVR at a runway varies significantly and when during the 10-minute period preceding the nominal observation time the one-minute mean extreme values assessed vary from the mean value by more than 50 metres or more than 20% of the mean value, whichever is greater, the one-minute mean minimum and the one-minute mean maximum values shall be given in that order in the form RDRDR/VRVRVRVRVVRVRVRVRi instead of the 10-minute mean. Extreme RVR values shall be reported in accordance with Regulation 15.7.6 and the tendency shall be indicated in accordance with Regulation 15.7.4.3.
15.7.6 Extreme values of runway visual range
When actual RVR values are outside the measuring range of the observing system in use, the following procedure shall apply:
(a) When the RVR, to be reported in accordance with the Technical Regulations, is greater than the maximum value which can be assessed with the system in use, the group VRVRVRVR shall be preceded by the letter indicator P (PVRVRVRVR) in which VRVRVRVR is the highest value which can be assessed. When the RVR is assessed to be more than 2 000 metres, it shall be reported as P2000;
(b) When the RVR is below the minimum value which can be assessed with the system in use, the group VRVRVRVR shall be preceded by the letter indicator M (MVRVRVRVR) in which VRVRVRVR is the lowest value which can be assessed. When the RVR is assessed to be less than 50 metres, it shall be reported as M0050.
15.8 Group w´w´ 15.8.1 One or more groups w´w´, but not more than three, shall be used to report all present
weather phenomena observed at or near the aerodrome and of significance to aeronautical operations in accordance with Code table 4678.
Appropriate intensity indicators and letter abbreviations (Code table 4678) shall be combined in groups of two to nine characters to indicate present weather phenomena.
15.8.2 If the observed present weather cannot be reported by use of Code table 4678, the group w´w´ shall be omitted from the report.
15.8.3 The w´w´ groups shall be ordered as follows:
(a) First, if appropriate, the qualifier for intensity or for proximity, followed without a space by;
(b) If appropriate, the abbreviation for the descriptor followed without a space by;
(c) The abbreviation for the observed weather phenomenon or combinations thereof.
15.8.4 Intensity shall be indicated only with precipitation, precipitation associated with showers and/or thunderstorms, funnel cloud, duststorm or sandstorm. If the intensity of the phenomena reported in the group is either light or heavy, this shall be indicated by the appropriate sign (see Code table 4678 and specially Note (5)). No indicator shall be included in the group when the intensity of the reported phenomenon is moderate.
15.8.5 The intensity of present weather phenomena reported in the group w´w´ shall be determined by the intensity at the time of observation.
15.8.6 If more than one significant weather phenomenon is observed, separate w´w´ groups shall be included in the report in accordance with Code table 4678. However, if more than one form of precipitation is observed, the appropriate letter abbreviations shall be combined in a single group with the dominant type of precipitation being reported first. In such a single group, the intensity shall refer to the total precipitation and be reported with one or no indicator as appropriate.
When an automatic observing system is used and when the type of the precipitation cannot be identified by this system, the abbreviation UP shall be used for precipitation. The abbreviation UP may be combined, as necessary, with the following characteristics of present weather: FZ, SH and TS.

FM 15 METAR, FM 16 SPECI
A–32 Volume I.1
15.8.7 The qualifier SH shall be used to indicate precipitation of the shower type. When associated with the indicator VC, the type and intensity of precipitation shall not be specified.
Note: Showers are produced by convective clouds. They are characterized by their abrupt beginning and end and by the generally rapid and sometimes great variations in the intensity of the precipitation. Drops and solid particles falling in a shower are generally larger than those falling in non-showery precipitation. Between showers, openings may be observed unless stratiform clouds fill the intervals between the cumuliform clouds.
15.8.8 The qualifier TS shall be used whenever thunder is heard or lightning is detected at the aerodrome within the 10-minute period preceding the time of observation. When appropriate, TS shall be followed immediately, without a space, by relevant letter abbreviations to indicate any precipitation observed. The letter abbreviation TS on its own shall be used when thunder is heard or lightning detected at the aerodrome but no precipitation observed.
Note: A thunderstorm shall be regarded as being at the aerodrome from the time thunder is first heard, whether or not lightning is seen or precipitation is observed at the aerodrome. A thunderstorm shall be regarded as having ceased or being no longer at the aerodrome at the time thunder is last heard, and the cessation is confirmed if thunder is not heard for 10 minutes after this time.
15.8.9 The qualifier FZ shall be used only to indicate supercooled water droplets or supercooled precipitation.
Notes:
(1) Any fog consisting predominantly of water droplets at temperatures below 0°C shall be reported as freezing fog (FZFG) whether it is depositing rime ice or not.
(2) Whether or not the supercooled precipitation is of the shower type shall not be specified.
15.8.10 The qualifier VC shall be used to indicate the following significant weather phenomena observed in the vicinity of the aerodrome: TS, DS, SS, FG, FC, SH, PO, BLDU, BLSA, BLSN and VA. Regulations referring to the combination of VC and FG are given in Regulation 15.8.17.
Notes:
(1) Such weather phenomena should be reported with the qualifier VC only when observed between approximately 8 km and 16 km from the aerodrome reference point. The actual range for which the qualifier VC is to be applied will be determined locally, in consultation with aeronautical authorities.
(2) See Regulation 15.8.7.
15.8.11 The letter abbreviation GR shall be used to report hail only when the diameter of the largest hailstones observed is 5 mm or more. The letter abbreviation GS shall be used to report small hail (diameter of the hailstones less than 5 mm) and/or snow pellets.
15.8.12 The letter abbreviation IC shall be used to indicate the phenomenon ice crystals (diamond dust). For w´w´ = IC to be reported, the visibility shall be reduced by this phenomenon to 5 000 metres or less.
15.8.13 The letter abbreviations FU, HZ, DU and SA (except DRSA) shall be used only when the obstruction to vision consists predominantly of lithometeors and the visibility is reduced by the reported phenomenon to 5 000 metres or less.
15.8.14 The letter abbreviation BR shall be used when the obstruction to vision consists of water droplets or ice crystals. For w´w´= BR to be reported, the visibility reported in the group VVVV shall be at least 1 000 metres but not more than 5 000 metres.
15.8.15 The letter abbreviation FG shall be used when the obstruction to vision consists of water droplets or ice crystals (fog or ice fog). For w´w´= FG to be reported without the qualifiers MI, BC, PR or VC, the visibility reported in the group VVVV shall be less than 1 000 metres.
15.8.16 For w´w´= MIFG to be reported, the visibility at two metres above ground level shall be 1 000 metres or more and the apparent visibility in the fog layer shall be less than 1 000 metres.

FM 15 METAR, FM 16 SPECI
Volume I.1 A–33
15.8.17 The letter abbreviation VCFG shall be used to report any type of fog observed in the vicinity of the aerodrome.
15.8.18 The letter abbreviation BCFG shall be used to report fog patches and the letter abbreviation PRFG to report fog covering part of the aerodrome; the apparent visibility in the fog patch or bank shall be less than 1 000 metres, the fog extending to at least 2 metres above ground level.
Note: BCFG should be used only when the visibility in parts of the aerodrome is 1 000 metres or more although, when the fog is close to the observing point, the minimum visibility reported by VNVNVNVNDv will be less than 1 000 metres.
15.8.19 The letter abbreviation SQ shall be used to report squalls when a sudden increase in wind speed is observed of at least 8 m s–1 (16 knots), the speed rising to 11 m s–1 (22 knots) or more and lasting for at least one minute.
15.8.20 Regulation 15.10 shall apply.
NsNsNshshshs or VVhshshs 15.9 Group or NSC or NCD
15.9.1 Cloud amount and cloud height NsNsNshshshs
15.9.1.1 Cloud amount, cloud type and height of cloud base shall be reported to describe only the clouds of operational significance, i.e., clouds with the height of base below 1 500 meters (5 000 ft) or below the highest minimum sector altitude, whichever is greater, or cumulonimbus or towering cumulus at any height. The cloud amount NsNsNs shall be reported as few (1 to 2 oktas), scattered (3 to 4 oktas), broken (5 to 7 oktas) or overcast (8 oktas), using the three-letter abbreviations FEW, SCT, BKN and OVC followed, without a space, by the height of the base of the cloud layer (mass) hshshs. If there are no clouds below 1 500 m (5 000 ft) or below the highest minimum sector altitude, whichever is greater, no cumulonimbus and no towering cumulus and no restriction on vertical visibility, and the abbreviations CAVOK is not appropriate, then the abbreviation NSC shall be used. When an automatic observing system is used and no clouds are detected by that system, the abbreviation NCD shall be used.
15.9.1.2 The amount of each cloud layer (mass) shall be determined as if no other clouds were existing.
15.9.1.3 The cloud group shall be repeated to report different layers or masses of cloud. The number of groups shall not exceed three, except that significant convective clouds, when observed, shall always be reported.
Note: The following clouds shall be reported as significant convective clouds:
(1) Cumulonimbus cloud (CB);
(2) Cumulus congestus of great vertical extent (TCU). The contraction TCU, taken from the term “towering cumulus”, is an ICAO abbreviation used in aeronautical meteorology to describe this cloud.
15.9.1.4 The selection of layers or masses of cloud to be reported shall be made in accordance with the following criteria:
1st group: the lowest individual layer (mass) of any amount, to be reported as FEW, SCT, BKN or OVC;
2nd group: the next individual layer (mass) covering more than two oktas, to be reported as SCT, BKN or OVC;
3rd group: the next higher individual layer (mass) covering more than four oktas, to be reported as BKN or OVC;
Additional groups: significant convective clouds (CB or TCU) when observed and not already reported in one of the three groups above.
The order of reporting the groups shall be from lower to higher levels.

FM 15 METAR, FM 16 SPECI
A–34 Volume I.1
15.9.1.5 The height of cloud base shall be reported in steps of 30 m (100 ft) up to 3 000 m (10 000 ft). Any observed value which does not fit the reporting scale in use shall be rounded down to the nearest lower step in the scale.
Note: See Note (2) to Regulation 15.7.4.2.
15.9.1.6 When cumulonimbus clouds or towering cumulus clouds are detected by the automatic observing system and the cloud amount and the height of cloud base cannot be observed, the cloud amount and the height of cloud base should be replaced by //////.
15.9.1.7 Types of cloud other than significant convective clouds shall not be identified. Significant convective clouds, when observed, shall be identified by appending the letter abbreviations CB (cumulonimbus) or TCU (cumulus congestus of great vertical extent), as appropriate, to the cloud group without a space. When an automatic observing system is used and the cloud type cannot be observed by that system, the cloud type in each cloud group shall be replaced by ///.
Note: When an individual layer (mass) of cloud is composed of cumulonimbus and towering cumulus clouds with a common cloud base, the type of cloud should be reported as cumulonimbus only and the amount of clouds shall be encoded as the sum of the CB and TCU amounts.
15.9.2 Vertical visibility VVhshshs
When the sky is obscured and information on vertical visibility is available, the group VVhshshs shall be reported, where hshshs is the vertical visibility in units of 30 metres (hundreds of feet). When information on vertical visibility is not available, the group shall read VV///.
Notes:
(1) The vertical visibility is defined as the vertical visual range into an obscuring medium.
(2) See Note (2) to Regulation 15.7.4.2.
15.9.3 Regulation 15.10 shall apply.
15.10 Code word CAVOK The code word CAVOK shall be included in place of the groups under Regulations 15.6, 15.8 and 15.9, when the following conditions occur simultaneously at the time of observation:
(a) Visibility reported in the group VVVV is 10 km or more and criteria for inclusion of the group VNVNVNVNDV are not met;
(b) No cloud below 1 500 metres (5 000 ft) or below the highest minimum sector altitude, whichever is greater, and no cumulonimbus and no towering cumulus;
(c) No significant weather phenomena (see Code table 4678).
Note: Highest minimum sector altitude is defined in ICAO PANS-OPS, Part 1 – Definitions, as the lowest altitude which may be used under emergency conditions which will provide a minimum clearance of 300 metres (1 000 ft) above all objects located in an area contained within a sector of a circle of 46 km (25 nautical miles) radius centred on a radio aid to navigation.
15.11 Group T´T´/T´dT´d 15.11.1 The observed air temperature and dew-point temperature rounded to the nearest whole
degree Celsius shall be given for T´T´/T´dT´d. Observed values involving 0.5°C shall be rounded up to the next higher Celsius degree.
15.11.2 Rounded whole degree values of air temperature and dew-point temperature of –9°C to +9°C shall be preceded by 0; for example, +9°C shall be reported as 09.
15.11.3 Temperatures below 0°C shall be immediately preceded by M, that is minus; for example, –9°C shall be reported as M09 and –0.5°C shall be reported as M00.

FM 15 METAR, FM 16 SPECI
Volume I.1 A–35
15.12 Group QPHPHPHPH 15.12.1 The observed QNH value rounded down to the nearest whole hectopascal shall be given
for PHPHPHPH preceded, without a space, by the letter indicator Q.
15.12.2 If the value of QNH is less than 1 000 hPa, it shall be preceded by 0; for example, QNH 995.6 shall be reported as Q0995.
Notes:
(1) When the first digit following the letter indicator Q is either 0 or 1, the QNH value is reported in the unit hectopascal (hPa).
(2) The unit prescribed by ICAO Annex 5 for pressure is the hectopascal.
15.13 Supplementary information – groups
WS RDRDR REw´w´ or (WTsTs/SS´) (RDRDR/ERCReReRBRBR) WS ALL RWY
15.13.1 For international dissemination, the section on supplementary information shall be used only to report recent weather phenomena of operational significance, available information on wind shear in the lower layers and, subject to regional air navigation agreement, sea-surface temperature and state of the sea, and also subject to regional air navigation agreement, the state of the runway.
15.13.2 Recent weather phenomena of operational significance REw´w´
15.13.2.1 Up to three groups of information on recent weather shall be given by the indicator letters RE followed, without a space, by the appropriate abbreviations, in accordance with Regulation 15.8 (but no intensity of the recent weather phenomena shall be indicated) if the following weather phenomena were observed during the period since the last routine report, or last hour, whichever is shorter, but not at the time of observation:
– Freezing precipitation; – Moderate or heavy drizzle, rain or snow; – Moderate or heavy: ice pellets, hail, small hail and/or snow pellets; – Blowing snow; – Sandstorm or duststorm; – Thunderstorm; – Funnel cloud(s) (tornado or waterspout); – Volcanic ash.
When an automatic observing system is used and when the type of the precipitation cannot be identified by this system, the abbreviation REUP shall be used for recent precipitation. It may be combined with the characteristics of the present weather in accordance with Regulation 15.8.6.
WS RDRDR 15.13.3 Wind shear in the lower layers or WS ALL RWY
Information on the existence of wind shear along the take-off path or approach path between one runway level and 500 metres (1 600 ft) significant to aircraft operations shall be reported whenever available and if local circumstances so warrant, using the group set WS RDRDR repeated as necessary. If the wind shear along the take-off path or approach path is affecting all runways in the airport, WS ALL RWY shall be used.
Note: Concerning runway designator DRDR, Regulation 15.7.3 applies.
15.13.4 Supplementary information other than specified by Regulations 15.13.2 and 15.13.3 shall be added only in accordance with regional decision.

FM 15 METAR, FM 16 SPECI
A–36 Volume I.1
15.13.5 Sea-surface temperature and the state of the sea (WTsTs/SS')
15.13.5.1 The sea-surface temperature shall, by regional agreement, be reported according to the regional ICAO Regulation 15.11. The state of the sea shall be reported in accordance with Code table 3700.
15.13.6 State of the runway (RDRDR/ERCReReRBRBR)
15.13.6.1 Subject to regional air navigation agreement, information on the state of the runway provided by the appropriate airport authority shall be included. The runway deposits ER, the extent of runway contamination CR, the depth of deposit eReR and the friction coefficient/braking action BRBR shall be indicated in accordance with code tables 0919, 0519, 1079 and 0366, respectively. The state of the runway group shall be replaced by the abbreviation SNOCLO when the aerodrome is closed due to extreme deposit of snow. If contaminations on a single runway or on all runways at an aerodrome have ceased to exist, this should be reported by replacing the last six digits of the group by CLRD//.
Note: Concerning runway designator DRDR, Regulation 15.7.3 applies. Additional code figures 88 and 99 are reported in accordance with the European Air Navigation Plan, FASID, Part III-AOP, Attachment A: Code figure 88 indicates “all runways”; code figure 99 shall be used if a new runway state report is not available in time for dissemination of the appropriate METAR message, in which case the previous runway state report will be repeated.
15.14 Trend forecasts Note: The governing criteria for issuing trend forecasts are specified in the Technical Regulations (WMO-No. 49), Volume II, [C.3.1].
15.14.1 When included in METAR or SPECI reports, the trend forecasts shall be in coded form.
15.14.2 When a change, required to be indicated in accordance with the governing criteria for significant changes, is expected for one or several of the observed elements – wind, horizontal visibility, present weather, clouds or vertical visibility – one of the following change indicators shall be used for TTTTT: BECMG or TEMPO.
Note: Where possible, values corresponding to the local operating minima should be selected to indicate changes.
15.14.3 The time group GGgg, preceded without a space by one of the letter indicators TT = FM (from), TL (until) or AT (at), shall be used as appropriate, to indicate the beginning (FM) or the end (TL) of a forecast change, or the time (AT) at which specific forecast condition(s) is (are) expected.
15.14.4 The change indicator BECMG shall be used to describe expected changes to meteorological conditions which reach or pass specified threshold criteria at either a regular or irregular rate.
15.14.5 Changes in meteorological conditions which reach or pass specified threshold criteria for trend forecasts shall be indicated as follows:
(a) When the change is forecast to begin and end wholly within the trend forecast period: by the change indicator BECMG followed by the letter indicators FM and TL respectively with their associated time groups, to indicate the beginning and end of the change (for example, for a trend forecast period from 1000 to 1200 UTC in the form: BECMG FM1030 TL1130);
(b) When the change is forecast to occur from the beginning of the trend forecast period and be completed before the end of that period: by the change indicator BECMG followed only by the letter indicator TL and its associated time group (the letter indicator FM and its associated time group being omitted), to indicate the end of the change (for example: BECMG TL1100);
(c) When the change is forecast to begin during the trend forecast period and be completed at the end of that period: by the change indicator BECMG followed only by the letter indicator FM and its associated time group (the letter indicator TL and its associated time group being omitted), to indicate the beginning of the change (for example: BECMG FM1100);

FM 15 METAR, FM 16 SPECI
Volume I.1 A–37
(d) When it is possible to specify a time for the change to occur during the trend forecast period: by the change indicator BECMG followed by the letter indicator AT and its associated time group, to indicate the time of the change (for example: BECMG AT1100);
(e) When changes are forecast to take place at midnight UTC, the time shall be indicated:
(i) By 0000 when associated with FM and AT;
(ii) By 2400 when associated with TL.
15.14.6 When the change is forecast to commence at the beginning of the trend forecast period and be completed by the end of that period, or when the change is forecast to occur within the trend forecast period but the time of the change is uncertain (possibly shortly after the beginning of the trend forecast period, or midway or near the end of that period), the change shall be indicated by only the change indicator BECMG (letter indi-cator(s) FM and TL or AT and associated time group(s) being omitted).
15.14.7 The change indicator TEMPO shall be used to describe expected temporary fluctuations to meteorological conditions which reach or pass specified threshold criteria and last for a period of less than one hour in each instance and in the aggregate cover less than half of the forecast period during which the fluctuations are expected to occur.
15.14.8 Periods of temporary fluctuations to meteorological conditions which reach or pass specified threshold criteria shall be indicated as follows:
(a) When the period of temporary fluctuations is forecast to begin and end wholly within the trend forecast period: by the change indicator TEMPO followed by the letter indicators FM and TL respectively with their associated time groups, to indicate the beginning and end of the fluctuations (for example, for a trend forecast period from 1000 to 1200 UTC in the form: TEMPO FM1030 TL1130);
(b) When the period of temporary fluctuations is forecast to occur from the beginning of the trend forecast period but cease before the end of that period: by the change indicator TEMPO followed only by the letter indicator TL and its associated time group (the letter indicator FM and its associated time group being omitted), to indicate the cessation of the fluctuations (for example: TEMPO TL1130);
(c) When the period of temporary fluctuations is forecast to begin during the trend forecast period and cease by the end of that period: by the change indicator TEMPO followed only by the letter indicator FM and its associated time group (the letter indicator TL and its associated time group being omitted), to indicate the beginning of the fluctuation (for example: TEMPO FM1030).
15.14.9 When the period of temporary fluctuations to meteorological conditions is forecast to occur from the beginning of the trend forecast period and cease by the end of that period, the temporary fluctuations shall be indicated by only the change indicator TEMPO (letter indicators FM and TL and associated time groups being omitted).
15.14.10 Following the change groups TTTTT TTGGgg, only the group(s) referring to the element(s) which is (are) forecast to change significantly shall be included. However, in the case of significant changes of the clouds, all cloud groups, including any significant layer(s) or masses not expected to change, shall be given.
15.14.11 Regulation 15.5.6 shall apply.
15.14.12 Inclusion of significant forecast weather w’w’, using the appropriate abbreviations in accordance with Regulation 15.8, shall be restricted to indicate:
(1) The onset, cessation or change in intensity of the following weather phenomena: – Freezing precipitation; – Moderate or heavy precipitation (including showers); – Duststorm; – Sandstorm – Thunderstorm (with precipitation); – Other weather phenomena – given in Code table 4678 as agreed by the
meteorological authority and air traffic services authority and operators concerned.

FM 15 METAR, FM 16 SPECI
A–38 Volume I.1
(2) The onset or cessation of the following weather phenomena: – Freezing fog; – Ice crystals; – Low drifting dust, sand or snow; – Blowing dust, sand or snow; – Thunderstorm (without precipitation); – Squall; — Funnel cloud (tornado or waterspout).
15.14.13 To indicate the end of significant weather phenomena w´w´, the abbreviation NSW (Nil Significant Weather) shall replace the group w´w´.
15.14.14 When no cloud below 1 500 metres (5 000 ft) or the highest minimum sector altitude, whichever is greater, and no cumulonimbus and no towering cumulus are forecast, and CAVOK is not appropriate, the abbreviation NSC shall be used.
15.14.15 When none of the elements listed in Regulation 15.14.2 is expected to change significantly as to require a change to be indicated, this shall be indicated by the code word NOSIG. NOSIG (no significant change) shall be used to indicate meteorological conditions which do not reach or pass specified threshold criteria.
15.15 Group (RMK . . . . . . . . . . ) The indicator RMK denotes the beginning of a section containing information included by national decision which shall not be disseminated internationally.
_____________

Volume I.1 A–39
FM 18–XII BUOY Report of a buoy operation
C O D E F O R M : SECTION 0 MiMiMjMj A1bwnbnbnb YYMMJ GGggiw QcLaLaLaLaLa LoLoLoLoLoLo (6QlQtQA/) SECTION 1
(111QdQx 0ddff 1snTTT 2snTdTdTd or 29UUU
3P0P0P0P0
4PPPP 5appp) SECTION 2 (222QdQx 0snTwTwTw 1PwaPwaHwaHwa 20PwaPwaPwa 21HwaHwaHwa) SECTION 3 (333Qd1Qd2 (8887k2 2z0z0z0z0 3T0T0T0T0 4S0S0S0S0 . . . . . . . . . . . . . . . 2znznznzn 3TnTnTnTn 4SnSnSnSn) (66k69k3 2z0z0z0z0 d0d0c0c0c0 . . . . . . . . . . 2znznznzn dndncncncn))
SECTION 4 (444 1QPQ2QTWQ4 2QNQLQAQZ (QcLaLaLaLaLa or (YYMMJ
LoLoLoLoLoLo) GGgg/)
(3ZhZhZhZh 4ZcZcZcZc) (5BtBtXtXt) (6AhAhAhAN) (7VBVBdBdB) (8ViViViVi) 9/ZdZdZd)) SECTION 5 (555 Groups to be developed nationally) Notes:
(1) BUOY is the name of the code for reporting buoy observations.
(2) A BUOY report, or a bulletin of BUOY reports, is identified by the group MiMiMjMj = ZZYY.
(3) The inclusion of the group 9/ZdZdZd is strongly recommended for buoys which have been deployed with drogues.
(4) The group 9/ZdZdZd should not be used in reports from a buoy on which a drogue has never been installed.
(5) The code form is divided into six sections, the first being mandatory in its entirety, except group 6QlQtQA/, and the remainder optional as data are available:
Section number Symbolic figure group Contents
0 — Identification, time and position data
1 111 Meteorological and other non-marine data
2 222 Surface marine data
3 333 Temperatures, salinity and current (when available) at selected depths
4 444 Information on engineering and technical parameters, including quality control data
5 555 Data for national use

FM 18 BUOY
A–40 Volume I.1
R E G U L A T I O N S :
18.1 General The code name BUOY shall not be included in the report.
18.2 Section 0 18.2.1 All groups in Section 0 are mandatory, except group 6QlQtQA/, and shall be included in
each report, even if no other data are reported.
18.2.2 Each individual BUOY report, even if included in a bulletin of such reports, shall contain as the first group the identification group MiMiMjMj.
18.2.3 Group A1bwnbnbnb
Only buoy numbers (nbnbnb) 001 through 499 are assigned. In the case of a drifting buoy, 500 shall be added to the original nbnbnb number.
Notes:
(1) A1bw normally corresponds to the maritime zone in which the buoy was deployed. The WMO Secretariat allocates to Members, who request and indicate the maritime zone(s) of interest, a block or blocks of serial numbers (nbnbnb) to be used by their environmental buoy stations.
(2) The Member concerned registers with the WMO Secretariat the serial numbers actually assigned to individual stations together with their geographical positions of deployment.
(3) The Secretariat informs all concerned of the allocation of serial numbers and registrations made by individual Members.
18.2.4 Groups QcLaLaLaLaLa LoLoLoLoLoLo
Position shall be reported in tenths, hundredths or thousandths of a degree, depending on the capability of the positioning system. When the position is in tenths of a degree, the groups shall be encoded as QcLaLaLa// LoLoLoLo//. When the position is in hundredths of a degree, the groups shall be encoded as QcLaLaLaLa/ LoLoLoLoLo/.
18.2.5 Group (6QlQtQA/)
QlQtQA are quality control indicators. Ql and QA apply to position and Qt to time.
18.3 Section 1 18.3.1 Each of the groups in Section 1 shall be included for all parameters that have been
measured, when data are available.
18.3.2 When data are missing for all groups, the entire section shall be omitted from the report.
18.3.3 Group 111QdQx
Qd is a quality control indicator for the section. If all data groups have the same quality control flag value, Qd shall be coded with that value and Qx shall be set to 9. If only one data group in the section has a quality control flag other than 1, Qd shall be coded with that flag and Qx shall indicate the position of this group within the section. If more than one data group have a quality control flag greater than 1, Qd shall be set to the greater flag value and Qx shall be set to 9.
Note: When Qx shows the position of the data group, it should be relative to the group containing Qx. For example, Qx = 1 refers to the data group immediately following.
18.4 Section 2 18.4.1 Each of the groups in Section 2 shall be included for all parameters that have been
measured, when data are available.
18.4.2 When data are missing for all groups, the entire section shall be omitted from the report.

FM 18 BUOY
Volume I.1 A–41
18.4.3 Group 222QdQx
Regulation 18.3.3 shall apply.
18.5 Section 3
18.5.1 General
Section 3 is in two parts. The first part, identified by the indicator group 8887k2, shall be used to report temperatures and/or salinity at selected depths. The second part, identified by the indicator group 66k69k3, shall be used to report current at selected depths. Either or both parts shall be transmitted, depending on the availability of the temperature and/or salinity data for the first part and of the current data for the second part.
18.5.2 Temperatures shall be reported in hundredths of a degree Celsius. When accuracy is limited to tenths of a degree, data shall be encoded using the general form 3TnTnTn/.
18.5.3 Group 333Qd1Qd2
Qd1Qd2 are two quality control indicators. Qd1 is used to indicate the quality of the temperature and salinity profile and Qd2 is used to indicate the quality of the current speed and direction profile.
18.6 Section 4
18.6.1 General
Additional groups in this section shall be included as data are available or required.
18.6.2 Group (1QPQ2QTWQ4)
When QP, Q2, QTW and Q4 = 0, the corresponding group shall not be transmitted. Its absence thus indicates a satisfactory general operation.
18.6.3 Group (2QNQLQAQz)
QN gives the quality of the satellite transmission. QL and QA are indicators on the quality of location. Qz indicates whether or not probe depths as reported in Section 3 are corrected using hydrostatic pressure.
18.6.4 In Section 4, pressure of fields (QcLaLaLaLaLa LoLoLoLoLoLo) and (YYMMJ GGgg/) is driven by the value of the QL indicator:
(a) Group 2QNQLQAQz absent: fields (QcLaLaLaLaLa LoLoLoLoLoLo) and (YYMMJ GGgg/) not coded;
(b) QL = 1: fields YYMMJ GGgg/ coded (fields QcLaLaLaLaLa LoLoLoLoLoLo absent);
(c) QL = 2: fields QcLaLaLaLaLa LoLoLoLoLoLo coded (fields YYMMJ GGgg/ absent).
18.6.5 Group (QcLaLaLaLaLa)
This group shall be transmitted only when QL = 2 (location over one pass only). It gives the latitude of the second possible solution (symmetrical to the satellite subtrack).
Note: Same coding as in Section 0.
18.6.6 Group (LoLoLoLoLoLo)
This group shall be transmitted only when QL = 2 and it gives the longitude of the second possible position, the latitude being indicated by the previous group.
Note: Same coding as in Section 0.
18.6.7 Groups (YYMMJ GGgg/)
The groups YYMMJ GGgg/ give the exact time of the last known position and shall be transmitted only when QL = 1 together with the following group 7VBVBdBdB.

FM 18 BUOY
A–42 Volume I.1
18.6.8 Group (3ZhZhZhZh)
Hydrostatic pressure of lower end of cable. Pressure is expressed in units of kPa (kilopascal, i.e. centibars). If group (3ZhZhZhZh) is present, then group (4ZcZcZcZc) is mandatory.
18.6.9 Group (4ZcZcZcZc)
Length of cable in metres (thermistor strings).
18.6.10 Group (5BtBtXtXt)
Group (5BtBtXtXt) should be omitted if buoy-type and drogue-type information is not available.
18.6.11 Group (6AhAhAhAN)
Group 6 (6AhAhAhAN) should be omitted if the buoy is not reporting wind or if the information is not available for both anemometer height and anemometer type. AhAhAh is the anemometer height above station level. Height is expressed in decimetres. For drifting and moored buoys, station level is assumed to be sea level. /// shall be used for unknown values. A value of 999 shall be used to say that anemometer height is artificially corrected to 10 metres by applying a formula.
18.6.12 Group (7VBVBdBdB)
This group shall be transmitted only when QL = 1.
Example: At the last location, the true direction of the buoy is 47° and its speed is 13 cm s–1 – the group is coded 71304.
18.6.13 Group (8ViViViVi)
The number of groups 8ViViViVi containing information on the engineering status of the buoy shall not exceed three.
Notes:
(1) The physical equivalent of the value ViViViVi will be different from one buoy to another.
(2) Interpretation of these groups will not be necessary to permit use of the meteorological data.
_____________

Volume I.1 A–43
FM 20–VIII RADOB Report of ground radar weather observations
C O D E F O R M : Part A
MiMiMjMj YYGGg
IIiii or 99LaLaLa
QcLoLoLoLo
4RwLaLaLa QcLoLoLoLo ACSCWCaCrt tedsdsfsfs
D . . . . D
Part B
SECTION 1 MiMiMjMj YYGGg IIiii
or 99LaLaLa
QcLoLoLoLo
NeNeWRHeIe . . . . . . . . NeNeWRHeIe
/555/ NeNeaeDefe . . . . NeNeaeDefe
SECTION 2 51515 Code groups to be developed regionally
SECTION 3 61616 Code groups to be developed nationally
D . . . . D Notes:
(1) RADOB is the name of the code for reporting ground radar weather observations. (2) A RADOB report from a land station is identified by MiMi = FF, a RADOB report from a sea station by MiMi
= GG. (3) The code form is divided into two parts: Part Identifier letters (MjMj) Contents A AA Information on tropical cyclone B BB Information on significant features Each part can be transmitted separately. (4) Part B is divided into three sections: Section number Symbolic figure group Contents 1 — Identification and position data; information on significant
features 2 51515 Code groups to be developed regionally 3 61616 Code groups to be developed nationally

FM 20 RADOB
A–44 Volume I.1
R E G U L A T I O N S :
20.1 General 20.1.1 The code name RADOB shall not be included in the report.
20.1.2 The call sign D . . . . D shall be included only in RADOB reports from sea stations.
20.2 Part A 20.2.1 Part A shall be used whenever the observed echo pattern is recognized as relating to a
tropical cyclone.
20.2.2 Groups 4RwLaLaLa QcLoLoLoLo
The position of the centre, or the eye, of the tropical cyclone shall be reported by means of the groups 4RwLaLaLa QcLoLoLoLo.
20.2.3 Group ACSCWCaCrt
20.2.3.1 The characteristics as regards size, development and relative location of the centre or the eye of the tropical cyclone shall be reported by the group ACSCWCaCrt.
20.2.3.2 Whenever doubt exists as to the location of the eye or whether the outermost spiral band is indeed visible on the radar scope, rt shall be coded as /.
20.2.4 Group tedsdsfsfs
20.2.4.1 Information on the movement of the centre, or eye, of the tropical cyclone shall be included in the report by means of the group tedsdsfsfs.
20.2.4.2 If no information on the movement of the centre, or eye, of the tropical cyclone is available, the group tedsdsfsfs shall be coded as /////.
20.3 Part B 20.3.1 In Part B, one series of groups NeNeWRHeIe shall be used to report the location of
phenomena and/or clouds and their characteristics. Group NeNeWRHeIe shall be repeated as necessary for a full description of the spatial distribution of the echo on the radar scope in 60 × 60 km squares.
20.3.2 Group NeNeWRHeIe
20.3.2.1 Characteristics concerning the location, type of phenomena and/or clouds and the elevation and intensity of their echoes shall be reported by groups NeNeWRHeIe.
20.3.2.2 Groups NeNeWRHeIe shall be included in the report in the rising order of the squares’ sequential numbers NeNe.
20.3.2.3 If several weather phenomena were observed in a single 60 × 60 km square, the most dangerous phenomenon shall be reported in WR, the highest echo elevation in He and the greatest echo intensity in Ie.
20.3.2.4 Cloud type data (WR) shall be reported only if no weather phenomena were observed in the 60 × 60 km square.
20.3.2.5 Data on stratiform cloud without precipitation shall be reported if it occupies no less than 1/4 of the 60 × 60 km square´s area.
20.3.2.6 Data on convective cloud shall be reported irrespective of the centres’ dimensions within the limits of the 60 × 60 km square.
20.3.2.7 If, in the 60 × 60 km square, convective and stratiform clouds were observed, only data on the convective clouds shall be reported.
20.3.2.8 Cloud echo intensity (Ie) shall be coded as /.

FM 20 RADOB
Volume I.1 A–45
20.3.3 Group NeNeaeDefe
20.3.3.1 Characteristics concerning change and movement of the echo pattern shall be reported by groups NeNeaeDefe, preceded by the identifier group /555/.
20.3.3.2 Group NeNeaeDefe shall be used to report the evolutionary characteristics of no more than three echo patterns. The identifier group /555/ shall not be repeated.
20.3.3.3 NeNe shall be used to report the number of the 60 × 60 km square in which the radar operator placed the origin of the speed vector characterizing the direction of movement De of the echo pattern. If only the tendency of the echo pattern ae has been estimated, the number of any square covered by the pattern shall be reported in NeNe.
20.3.3.4 The tendency of the echo pattern ae shall be estimated over a period of approximately one hour, but not longer than 90 minutes and not shorter than 30 minutes. The echo area shall be considered as increasing or diminishing if it changes by more than 25 per cent over a period of time not exceeding 90 minutes.
20.3.3.5 If no information is available on the change and movement of the echo, groups /555/ and NeNeaeDefe shall not be included in the report.
20.3.3.6 The movement of individual echoes in the echo pattern shall not be reported.
20.3.4 Reporting of inoperative equipment, anomalous propagation and absence of an echo
In the case of inoperative equipment, anomalous propagation or absence of an echo on the radar scope, groups NeNeWRHeIe, /555/ and NeNeaeDefe shall be replaced by one of the following groups, as appropriate:
0/0/0 Radar equipment inoperative;
or 0//// Anomalous propagation; or
00000 No echo visible on radar scope.
_____________


Volume I.1 A–47
FM 22–IX Ext. RADREP Radiological data report (monitored on a routine basis and/or in case of accident)
C O D E F O R M :
SECTION 0 RADREP
IIiii* or D . . . . D** or A1bwnbnbnb
YrYrGrGra5 LaLaLaLaA LoLoLoLoLoB hrhrhrhrih
SECTION 1 111AA MMJJJ YaYaGaGagaga La1La
1La1La
1A Lo1Lo
1Lo1Lo
1Lo1B
4AaBTRcRcRcRc 5AcAeEcEsEe 6RePaDPaDPaDPaDPa (7hahahaha) or (7hehehehe)
(8dtadtadtaftafta) (9dtwdtwdtwftwftw) (0qqq0aa)
SECTION 2 222 YsYsGsGsgsgs YeYeGeGegege (5nnnIS) 6XXXsnaa (7XXXsnaa)
SECTION 3 333 GGggiw (ddfff) (5nnnIS) 6XXXsnaa
SECTION 4 444 GGggiw (Nddff) (00fff) (1snTTT) (2snTdTdTd) (3P0P0P0P0) (6RRRtR) (7wwW/) (80000 0dadadcdc)
SECTION 5 555 TTGGgg 4AaBTRcRcRcRc 5AcAeEcEsEe 6RePaDPaDPaDPaDPa (7hahahaha)
or (7hehehehe)
(8dtadtadtaftafta) (9dtwdtwdtwftwftw) (0qqq0aa) 122RpIn
SECTION 6 666 YsYsGsGsgsgs YeYeGeGegege (5nnnIS) 6XXXsnaa (7XXXsnaa)
SECTION 7 777 TTGGgg (Nddff) (00fff) (1snTTT) (6RRRtR) (7ww//) Notes:
(1) RADREP is the name of the code for reporting radiological data monitored on a routine basis and/or in case of an accident. A RADREP report may have a trend forecast appended.
(2) A RADREP report, or a bulletin of RADREP reports, is identified by the word RADREP.
(3) Relevant groups of Section 0, the first three groups and the group 6XXXsnaa of Section 2 are always included in a report of radiological data from a surface observing station. Section 1 is only included when data on accident notification is reported.
(4) Relevant groups of Section 0, the first two groups and the group 6XXXsnaa of Section 3 are always included in a report of radiological data from an airborne observing station.
_____________ * Included in a fixed land station report only.
** Included in a sea or mobile land station report only.

FM 22 RADREP
A–48 Volume I.1
(5) The code form is divided into seven sections:
Section number Symbolic figure group Contents
0 — Identification and position data (ship’s call sign/buoy identifier, date and reporting time, location and elevation/altitude), type of report and unit of reported radiological quantity
1 111AA Data on accident notification: activity or facility involved, date and time of accident, location of accident, early notification convention article applicable, type and composition of release, cause and evolution of incident, characteristics, state and evolution of release, possible health effect, protective measures taken with its radius, actual or effective release height, main transport in atmosphere and/or water, and discharge of receiving water body
2 222 Data on date and time of start and end of monitoring (when relevant, isotope mass and element name), observed radiological quantity, dose on land surface and density of deposits from a surface observing station
3 333 Data on time of monitoring, unit of wind speed, upper wind (when relevant, isotope mass and element name) and observed radiological quantity from an airborne observing station
4 444 Data on time of observed meteorological conditions, unit of wind speed, total cloud cover, surface wind, temperature, dew point, station pressure, precipitation and related duration, weather and variation of surface wind direction
5 555 Data on forecast trend of accident in next six hours: time or period of expected change, early notification convention article applicable, type and composition of release, cause and evolution of incident, characteristics, state and evolution of release, possible health effect, protective measures to be taken and its radius, actual or effective release height, main transport in atmosphere and/or water, discharge of receiving water body, and possibility that plume will encounter precipitation and/or change in wind
6 666 Data on forecast trend of radiological quantity in next six hours: date and time (when relevant, isotope mass and element name), expected radiological quantity, expected dose on land surface and density of deposits
7 777 Data on forecast trend in surface meteorological conditions in next six hours: time or period of expected change, total cloud cover, surface wind, temperature, precipitation and related duration, and weather
R E G U L A T I O N S :
22.1 General 22.1.1 The code name RADREP shall be included at the beginning of an individual RADREP
report. In the case of a bulletin, which may consist of more than one RADREP report, the code name RADREP shall be included in the first line of the text of the bulletin, and the identification, date, reporting time, type of report and position groups shall be included in every individual report.
Note: See Regulation 12.1.7.

FM 22 RADREP
Volume I.1 A–49
IIiii* or 22.1.2 Groups D . . . . D** YrYrGrGra5 LaLaLaLaA LoLoLoLoLoB hrhrhrhrih or A1bwnbnbnb
Note: See Regulation 18.2.3, Notes (1), (2) and (3).
The identification and position of a fixed land station shall be indicated by means of the group IIiii. The identification of a sea or mobile land station shall be indicated by the group D . . . . D or A1bwnbnbnb. The position and elevation/altitude of fixed and mobile land stations, sea stations or airborne observing stations shall be indicated by the groups LaLaLaLaA LoLoLoLoLoB hrhrhrhrih.
22.1.3 Use of sections
22.1.3.1 Accident notification reports shall always contain at least Sections 0 and 1. When the report contains environmental (on site) radiological monitoring results and/or meteorological monitoring results, that report shall also include Sections 2 and/or 4, respectively.
22.1.3.2 Environmental radiological data monitoring results reports from surface observing stations of a routine nature or activated following an accident shall always contain at least Sections 0 and 2. When in addition the report contains meteorological monitoring results, that report shall also include Section 4.
22.1.3.3 In radiological data monitoring results reports of gamma dose in air along the main transport path (defined location and time period), Section 2 shall contain the groups 222 YsYsGsGsgsgs YeYeGeGegege 6XXXsnaa.
22.1.3.4 In radiological data monitoring results reports of air concentration (of named isotope type including gross beta), Section 2 shall contain the groups 222 YsYsGsGsgsgs YeYeGeGegege 5nnnIS 6XXXsnaa.
22.1.3.5 In radiological data monitoring results reports of concentration in precipitation (of named isotope type), Section 2 shall contain the groups 222 YsYsGsGsgsgs YeYeGeGegege 5nnnIS 6XXXsnaa, and Section 4 at least the groups 444 6RRRtR.
22.1.3.6 When relevant forecast data are available, Sections 5, 6 and/or 7 shall be appended as appropriate to an accident notification report or an environmental radiological data monitoring report, to indicate expected changes in radiological and/or meteorological conditions in the next six hours.
22.2 Section 1 – Data on accident notification
22.2.1 Group 111AA
This group shall always be included in accident notification reports. AA shall be encoded in accordance with Code table 0177 – Activity or facility involved in incident.
22.2.2 Groups MMJJJ YaYaGaGagaga La1La
1La1La
1A Lo1Lo
1Lo1Lo
1Lo1B
These groups shall always be included in accident notification reports to give the date, time and location of the accident: month, three last digits of year, day of the month, hours and minutes in UTC, latitude and longitude in degrees and minutes.
_____________
* Included in a fixed land station report only. ** Included in a sea or mobile land station report only.

FM 22 RADREP
A–50 Volume I.1
22.2.3 Group 4AaBTRcRcRcRc
This group shall always be included in accident notification reports. Aa shall be encoded in accordance with Code table 0131 – Accident early notification – article applicable. BT shall be encoded in accordance with Code table 0324 – Type of release. RcRcRcRc shall be encoded such that each Rc is in accordance with Code table 3533 – Composition of release, so that a combination of up to four elements shall be reported in order of significance. If less than four elements are to be reported, the group shall be completed with solidi (/).
22.2.4 Group 5AcAeEcEsEe
This group shall always be included in accident notification reports. Ac shall be encoded in accordance with Code table 0133 – Cause of incident; Ae in accordance with Code table 0135 – Incident situation; Ec in accordance with Code table 0933 – Characteristics of release; Es in accordance with Code table 0943 – State of current or expected release; and Ee in accordance with Code table 0935 – Release behaviour over time.
22.2.5 Group 6RePaDPaDPaDPaDPa
This group shall always be included in accident notification reports. Re shall be encoded in accordance with Code table 3535 – Possibility of significant chemical toxic health effect; and Pa in accordance with Code table 3131 – Countermeasures taken near border.
Note: This group may be repeated as necessary, e.g. if more than one protective measure is to be indicated.
(7hahahaha) 22.2.6 Groups or (8dtadtadtaftafta) (7hehehehe)
If release is not ground-level release and relevant data are available, these groups shall be included in accident notification reports to give either the actual release height or the effective release height, in metres, the main transport direction in atmosphere, in degrees from north, and the main transport speed in atmosphere, in metres per second.
22.2.7 Groups (9dtwdtwdtwftwftw) (0qqq0aa)
If release is to water and relevant data are available, these groups shall be included in accident notification reports to give the main transport direction in water, in degrees from north, and the main transport speed in water, in metres per second, and the discharge of the main receiving water body, in cubic metres per second, as appropriate.
22.3 Section 2 – Radiological monitoring data from a surface observing station
22.3.1 Groups 222 YsYsGsGsgsgs YeYeGeGegege
These groups shall always be included in radiological data monitoring result reports or accident reports to give the day and time of start and day and time of end, in hours and minutes UTC, of monitoring operations or release.
22.3.2 Group (5nnnIS)
22.3.2.1 The group 5nnnIS shall be included in either radiological data monitoring result reports of air concentration of named isotope type including gross beta or to give the isotope mass and element name.
Notes:
(1) This group may be repeated as necessary, e.g. if more than one isotope is to be included.
(2) See Regulation 22.1.3.5.
22.3.2.2 The group 5nnnIS shall be omitted from the report in radiological data monitoring results of gamma dose in air along the main transport path for defined location and time.

FM 22 RADREP
Volume I.1 A–51
22.3.3 Group 6XXXsnaa
This group shall always be included in radiological data monitoring results reports or accident reports to give the three most significant digits of the reported monitored radiological quantity or estimated release quantity followed, without a space, by the sign of the exponent (sn) and the decimal exponent (aa). The type of report and the unit of the reported radiological quantity shall be indicated by a5 in the group YrYrGrGra5 of Section 0.
Note: See Note (1) to Regulation 22.3.2.1.
22.3.4 Group (7XXXsnaa)
If relevant data are available, this group shall be included in reports of radiological data monitoring results to give the dose of gamma radiation or the density of deposits (total beta activity) on land surface.
22.4 Section 3 – Radiological monitoring data from an airborne observing station 22.4.1 Inclusion of groups of Section 3 shall be determined by national decision.
22.4.2 Section 3 shall always be preceded by Section 0.
22.4.3 Group (5nnnIS)
This group shall be included in radiological data monitoring results of air concentration of named isotope type followed by the group 6XXXsnaa (radiological quantity of the isotope).
Note: See Note (1) to Regulation 22.3.2.1.
22.4.4 Group 6XXXsnaa
Regulation 22.3.3 shall apply.
22.5 Section 4 – Meteorological monitoring data 22.5.1 If meteorological data are available, relevant groups of this section shall be included in
a radiological data report.
Note: See Regulation 22.1.3.5.
22.5.2 Group (6RRRtR)
22.5.2.1 When no precipitation occurred during the reference period, RRR shall be encoded 000.
22.5.2.2 When precipitation occurred during the reference period but the amount of precipitation has not been measured, RRR shall be encoded ///.
22.5.3 Groups (80000 0dadadcdc)
If relevant data are available, these groups shall be included in addition to the group Nddff or the groups Nddff 00fff, as the case may be, to give the variation in wind direction.
Note: Variation and mean wind direction are measured over the 10-minute period immediately preceding the observation.
22.6 Section 5 – Accident behaviour over time
22.6.1 Group TTGGgg
The time group GGgg, preceded without a space by one of the letter indicators TT = FM (from) or AT (at), shall be used, as appropriate, to indicate the beginning (FM) of a forecast change, or the time (AT) at which specific forecast conditions are expected.
FM 22 RADREP
A–52 Volume I.1
22.6.2 Group 122RpIn
This group shall be included to indicate the possibility that a plume will encounter precipitation in the State in which the incident occurred and whether the plume will encounter a change in wind direction and/or speed. Rp shall be encoded in accordance with Code table 3548, and In in accordance with Code table 1743.
_____________

Volume I.1 A–53
FM 32–XI Ext. PILOT Upper-wind report from a fixed land station
FM 33–XI Ext. PILOT SHIP Upper-wind report from a sea station
FM 34–XI Ext. PILOT MOBIL Upper-wind report from a mobile land station
C O D E F O R M :
Part A
SECTION 1 MiMiMjMj D . . . . D** YYGGa4
IIiii* or 99LaLaLa
QcLoLoLoLo MMMULaULo** h0h0h0h0im***
SECTION 2 44nP1P1 or 55nP1P1
ddfff ddfff . . . . etc.
SECTION 3 77PmPmPm
or 66PmPmPm or
dmdmfmfmfm
(4vbvbvava)
7HmHmHmHm or 6HmHmHmHm or 77999
dmdmfmfmfm
(4vbvbvava)
SECTION 5 51515
52525 . . . . . 59595
Code groups to be developed regionally
SECTION 6 61616 62626 . . . . . 69696
Code groups to be developed nationally
Part B
SECTION 1 MiMiMjMj D . . . . D** YYGGa4
IIiii* or 99LaLaLa
QcLoLoLoLo
MMMULaULo**
h0h0h0h0im***
_____________ * Used in FM 32 only.
** Used in FM 33 and FM 34 only.
*** Used in FM 34 only.

FM 32 PILOT, FM 33 PILOT SHIP, FM 34 PILOT MOBIL
A–54 Volume I.1
SECTION 4 9 or 8
tnu1u2u3 ddfff ddfff ddfff
. . . . . . . . . . . . . . . . . . . . 9
or 8 or
tnu1u2u3
ddfff
ddfff
ddfff
21212 n0n0P0P0P0 n1n1P1P1P1 . . . . . nnnnPnPnPn
d0d0f0f0f0 d1d1f1f1f1 . . . . . dndnfnfnfn
SECTION 5 51515 52525 . . . . . 59595
Code groups to be developed regionally
SECTION 6 61616 62626 . . . . . 69696
Code groups to be developed nationally
Part C
SECTION 1 MiMiMjMj D . . . . D** YYGGa4
IIiii* or 99LaLaLa
QcLoLoLoLo
MMMULaULo**
h0h0h0h0im***
SECTION 2 44nP1P1 or 55nP1P1
ddfff ddfff . . . . . etc.
SECTION 3 77PmPmPm or 66PmPmPm or
dmdmfmfmfm (4vbvbvava)
7HmHmHmHm or 6HmHmHmHm or 77999
dmdmfmfmfm (4vbvbvava)
SECTION 5 51515 52525 . . . . . 59595
Code groups to be developed regionally
SECTION 6 61616 62626 . . . . . 69696
Code groups to be developed nationally
_____________ * Used in FM 32 only.
** Used in FM 33 and FM 34 only.
*** Used in FM 34 only.
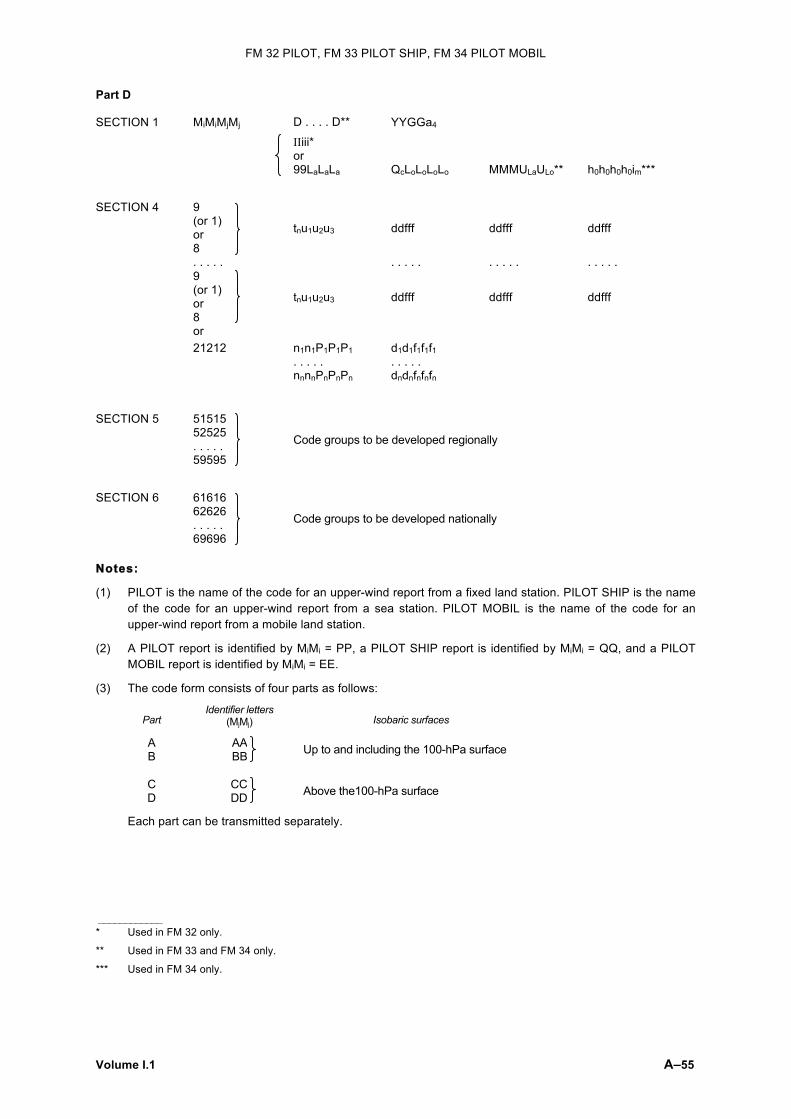
FM 32 PILOT, FM 33 PILOT SHIP, FM 34 PILOT MOBIL
Volume I.1 A–55
Part D SECTION 1 MiMiMjMj D . . . . D** YYGGa4
IIiii* or 99LaLaLa QcLoLoLoLo MMMULaULo** h0h0h0h0im***
SECTION 4 9 (or 1) or 8
tnu1u2u3 ddfff ddfff ddfff
. . . . . . . . . . . . . . . . . . . . 9
(or 1) or 8 or
tnu1u2u3 ddfff ddfff ddfff
21212 n1n1P1P1P1 . . . . . nnnnPnPnPn
d1d1f1f1f1 . . . . . dndnfnfnfn
SECTION 5 51515 52525 . . . . . 59595
Code groups to be developed regionally
SECTION 6 61616 62626 . . . . . 69696
Code groups to be developed nationally
Notes:
(1) PILOT is the name of the code for an upper-wind report from a fixed land station. PILOT SHIP is the name of the code for an upper-wind report from a sea station. PILOT MOBIL is the name of the code for an upper-wind report from a mobile land station.
(2) A PILOT report is identified by MiMi = PP, a PILOT SHIP report is identified by MiMi = QQ, and a PILOT MOBIL report is identified by MiMi = EE.
(3) The code form consists of four parts as follows:
Part Identifier letters
(MjMj) Isobaric surfaces
A B
AA BB Up to and including the 100-hPa surface
C D
CC DD
Above the100-hPa surface
Each part can be transmitted separately.
____________ * Used in FM 32 only.
** Used in FM 33 and FM 34 only.
*** Used in FM 34 only.

FM 32 PILOT, FM 33 PILOT SHIP, FM 34 PILOT MOBIL
A–56 Volume I.1
(4) The code form is divided into a number of sections as follows:
Section number
Indicator figures or symbolic figure groups Contents
1 — Identification and position data
2 44 or 55 Data for standard isobaric surfaces
3 6, 7, 66 or 77 Data for maximum wind level(s), with altitudes given in pressure units or tens of geopotential metres, and data for vertical wind shear
4 8, 9 (or 1) or 21212
Data for fixed regional levels and/or significant levels, with altitudes given either in geopotential units or in pressure units
5 51515 52525 . . . . . 59595
Code groups to be developed regionally
In parts A and C, identifier 55555 should not be used in Section 5.
6 61616 62626 . . . . . 69696
Code groups to be developed nationally
In parts A and C, identifier 66666 should not be used in Section 6 R E G U L A T I O N S :
32.1 General 32.1.1 The code name PILOT, PILOT SHIP or PILOT MOBIL shall not be included.
32.1.2 Parts A and B shall contain data, in so far as available, only for levels up to and including the 100-hPa level.
32.1.3 Parts C and D shall contain data, in so far as available, only for levels above the 100-hPa level.
32.1.4 For example, if data at or below 100 hPa are not included in either Part A or B, as appropriate, they shall not be included in Part C or D. In this instance the non-included data shall be transmitted separately in the form of a correction report.
32.2 Parts A and C
32.2.1 Section 1 – Identification and position
The identification of a sea station or a mobile land station shall be indicated by the group D . . . . D. The observing station shall indicate its position by means of the group IIiii for a fixed land station, or the groups 99LaLaLa QcLoLoLoLo MMMULaULo for a sea station or a mobile land station. In addition, a mobile land station shall include the group h0h0h0h0im to indicate the elevation of the station (including units of elevation) and the accuracy of the elevation.
32.2.2 Section 2 – Standard isobaric surfaces
32.2.2.1 Section 2 shall contain data, in ascending order with respect to altitude, for the standard isobaric surfaces of 850, 700, 500, 400, 300, 250, 200, 150 and 100 hPa in Part A and for the standard isobaric surfaces of 70, 50, 30, 20 and 10 hPa in Part C.
32.2.2.2 When pressure measurements are not available, wind data shall be reported using geopotential approximations to the standard isobaric surfaces.

FM 32 PILOT, FM 33 PILOT SHIP, FM 34 PILOT MOBIL
Volume I.1 A–57
32.2.2.3 All standard isobaric surfaces within the sounding shall be represented in Section 2 of the report by either a data group or a group of solidi (/////).
32.2.2.4 Indicator figures 44 shall be used when the standard isobaric surfaces are located by means of pressure equipment. Indicator figures 55 shall be used for the reporting of winds at altitudes approximating the standard isobaric surfaces. If the pressure element failed during the ascent, indicator figures 55 shall replace the indicator figures 44 for the remaining standard isobaric surfaces to be reported.
32.2.2.5 In the report, no more than three wind groups shall follow a 44nP1P1 or 55nP1P1 group. The latter groups shall therefore be repeated as often as necessary.
32.2.3 Section 3 – Maximum wind level(s) and vertical wind shear
32.2.3.1 For coding purposes, a maximum wind level:
(a) Shall be determined by consideration of the list of significant levels for wind speed, as obtained by means of the relevant recommended or equivalent national method (see Note under Regulation 32.3.1) and not by consideration of the original wind-speed curve;
(b) Shall be located above the 500-hPa isobaric surface and shall correspond to a speed of more than 30 metres per second.
Note: A maximum wind level is defined as a level at which the wind speed is greater than that observed immediately above and below that level.
32.2.3.2 Whenever more than one maximum wind level exists, these levels shall be reported as follows:
(a) The level of greatest maximum wind speed shall be transmitted first;
(b) The other levels shall be classified in descending order of speed and be transmitted only if their speed exceeds those of the two adjacent minimals by at least 10 metres per second;
(c) The levels of maximum wind with the same speed shall be encoded successively, beginning with the lowest one;
(d) Furthermore, the highest level attained by the sounding shall be transmitted, provided:
(i) It satisfies the criteria set forth in Regulation 32.2.3.1 above;
(ii) It constitutes the level of the greatest speed of the whole sounding.
32.2.3.3 When more than one level of maximum wind is observed, data for each level shall be reported by repeating Section 3.
32.2.3.4 Indicator figures
32.2.3.4.1 When a maximum wind occurred within the sounding and its level was determined by means of pressure, the indicator figures 77 shall be used in the first group of Section 3, i.e. 77PmPmPm.
32.2.3.4.2 When a maximum wind occurred within the sounding and its altitude was expressed in tens of standard geopotential metres, the indicator figure 7 shall be used in the first group of Section 3, i.e. 7HmHmHmHm.
32.2.3.4.3 When the greatest wind speed observed throughout the sounding occurred at the top of the sounding and the level of the greatest wind was determined by means of pressure, the indicator figures 66 shall be used in the first group of Section 3, i.e. 66PmPmPm.
32.2.3.4.4 When the greatest wind speed observed throughout the sounding occurred at the top of the sounding and the altitude of the greatest wind was expressed in tens of standard geopotential metres, the indicator figure 6 shall be used in the first group of Section 3, i.e. 6HmHmHmHm.
32.2.3.4.5 When a maximum wind is not observed or not reported, the group 77999 shall be reported in lieu of the maximum wind section, i.e. Section 3.

FM 32 PILOT, FM 33 PILOT SHIP, FM 34 PILOT MOBIL
A–58 Volume I.1
32.2.3.5 Group (4vbvbvava)
The group 4vbvbvava shall be included only if data for vertical wind shear are computed and are required to be reported.
32.2.4 Section 5 – Regional groups
Inclusion of groups of Section 5 shall be determined by regional decision.
32.2.5 Section 6 – National groups
Inclusion of groups of Section 6 shall be determined by national decision.
32.3 Parts B and D
32.3.1 Section 4 – Fixed regional levels and/or significant levels
32.3.1.1 Significant levels
The reported significant data alone shall make it possible to reconstruct the wind profile with sufficient accuracy for practical use. Care shall be taken that:
(a) The direction and speed curves (in function of the log of pressure or altitude) can be reproduced with their prominent characteristics;
(b) These curves can be reproduced with an accuracy of at least 10° for direction and five metres per second for speed;
(c) The number of significant levels is kept strictly to a necessary minimum.
Note: To satisfy these criteria, the following method of successive approximations is recommended, but other methods of attaining equivalent results may suit some national practices better and may be used:
(1) The surface level and the highest level attained by the sounding constitute the first and the last significant levels.
The deviation from the linearly interpolated values between these two levels is then considered. If no direction deviates by more than 10° and no speed by more than five metres per second, no other significant level need be reported. Whenever one parameter deviates by more than the limit specified in paragraph (b) above, the level of greatest deviation becomes a supplementary significant level for both parameters.
(2) The additional significant levels so introduced divide the sounding into two layers. In each separate layer, the deviations from the linearly interpolated values between the base and the top are then considered. The process used in paragraph (1) above is repeated and yields other significant levels. These additional levels in turn modify the layer distribution, and the method is applied again until any level is approximated to the above-mentioned specified values.
For the purpose of computational work, it should be noted that the values derived from a PILOT report present two different resolutions:
(a) Winds at significant levels are reported to the resolution of 5° in direction and one metre per second in speed;
(b) Any interpolated wind at a level between two significant levels is implicitly reported to the resolution of ± 10° in direction and ± 5 metres per second in speed.
32.3.1.2 Fixed levels
32.3.1.2.1 The fixed levels reported in Section 4 shall be determined by regional decision.
32.3.1.2.2 In Section 4, the data groups for the fixed and significant levels within the sounding shall appear in ascending order with respect to altitude.
32.3.1.3 Indicator figures
32.3.1.3.1 When the altitudes of regional fixed levels and/or significant levels are given in units of 300 metres, the indicator figure 9 shall be used in Section 4 up to and including the height of 29 700 metres. Above that level, the indicator figure 1 shall be used to specify that 30 000 metres be added to the heights indicated by tnu1u2u3.

FM 32 PILOT, FM 33 PILOT SHIP, FM 34 PILOT MOBIL
Volume I.1 A–59
32.3.1.3.2 When the altitudes of regional fixed levels and/or significant levels are given in units of 500 metres, the indicator figure 8 shall be used in Section 4.
32.3.1.3.3 To indicate that the first wind group refers to station level, u1 shall be coded / (solidus), and appropriate values shall be reported for tn, u2 and u3.
32.3.1.4 Altitudes
The altitudes of fixed regional and significant levels shall be reported either in geopotential units or in pressure units. Only one of the units shall be used in a coded report.
32.3.1.5 Missing data
32.3.1.5.1 If altitude is given in geopotential units in Parts B and D, a layer for which data are missing shall be indicated by reporting the boundary levels of the layer and a level in between with a height value somewhere in between the boundary heights and a group ddfff of solidi (/////) to indicate the layer of missing data, provided that the layer is at least 1 500 geopotential metres thick. The boundary levels are the levels closest to the bottom and the top of the layer for which the observed data are available. The boundary levels are not required to meet “significant level” criteria. For example:
9226/ 27025 28030 9329/ ///// 29035
where 28030 and 29035 are the boundary level winds in 7 800 and 11 700 gpm altitude. The fictitious altitude 9 600 gpm together with the group of solidi indicates the layer for which data are missing.
32.3.1.5.2 If altitude is given in pressure units in Parts B and D, a layer for which data are missing shall be indicated by reporting the boundary levels of the layer and a level of solidi (/////) to indicate the layer of missing data, provided that the layer is at least 50 hPa thick. The boundary levels are the levels closest to the bottom and the top of the layer for which the observed data are available. The boundary levels are not required to meet “significant level” criteria. The boundary levels and the missing data level groups will be identified by appropriate nn numbers. For example:
33P3P3P3 d3d3f3f3f3 44/// ///// 55P5P5P5 d5d5f5f5f5
where the levels 33 and 55 are the boundary levels and 44 indicates the layer for which data are missing.
32.3.2 Section 5 – Regional groups
Inclusion of groups of Section 5 shall be determined by regional decision.
32.3.3 Section 6 – National groups
Inclusion of groups of Section 6 shall be determined by national decision.
_____________


Volume I.1 A–61
FM 35–XI Ext. TEMP Upper-level pressure, temperature, humidity and wind report from a fixed land station
FM 36–XI Ext. TEMP SHIP Upper-level pressure, temperature, humidity and wind report from a sea station
FM 37–XI Ext. TEMP DROP Upper-level pressure, temperature, humidity and wind report from a sonde released by carrier balloons or aircraft
FM 38–XI Ext. TEMP MOBIL Upper-level pressure, temperature, humidity and wind report from a mobile land station
C O D E F O R M :
Part A SECTION 1 MiMiMjMj D . . . . D**
YYGGId
IIiii* or 99LaLaLa
QcLoLoLoLo
MMMULaULo***
h0h0h0h0im****
SECTION 2 99P0P0P0 P1P1h1h1h1 . . . . . PnPnhnhnhn
T0T0Ta0D0D0 T1T1Ta1D1D1 . . . . . TnT1TanDnDn
d0d0f0f0f0 d1d1f1f1f1 . . . . . dndnfnfnfn
SECTION 3 88PtPtPt or 88999
TtTtTatDtDt dtdtftftft
SECTION 4 77PmPmPm or 66PmPmPm or 77999
dmdmfmfmfm (4vbvbvava)
SECTION 7 31313 srrarasasa 8GGgg (9snTwTwTw)
SECTION 9 51515 52525 . . . . . 59595
Code groups to be developed regionally
SECTION 10 61616 62626 . . . . . 69696
Code groups to be developed nationally
_____________ * Used in FM 35 only.
** Used in FM 36 and FM 38 only.
*** Used in FM 36, FM 37 and FM 38 only.
**** Used in FM 38 only.

FM 35 TEMP, FM 36 TEMP SHIP, FM 37 TEMP DROP, FM 38 TEMP MOBIL
A–62 Volume I.1
Part B
SECTION 1 MiMiMjMj D . . . . D** YYGGa4 IIiii*
or 99LaLaLa QcLoLoLoLo MMMULaULo*** h0h0h0h0im****
SECTION 5 n0n0P0P0P0 n1n1P1P1P1 . . . . . nnnnPnPnPn
T0T0Ta0D0D0 T1T1Ta1D1D1 . . . . . TnTnTanDnDn
SECTION 6 21212 n0n0P0P0P0 n1n1P1P1P1 . . . . . nnnnPnPnPn
d0d0f0f0f0 d1d1f1f1f1 . . . . . dndnfnfnfn
SECTION 7 31313 srrarasasa 8GGgg (9snTwTwTw)
SECTION 8 41414 NhCLhCMCH
SECTION 9 51515 52525 . . . . . 59595
Code groups to be developed regionally
SECTION 10 61616 62626 . . . . . 69696
Code groups to be developed nationally
Part C
SECTION 1 MiMiMjMj D . . . . D** YYGGId IIiii*
or 99LaLaLa QcLoLoLoLo MMMULaULo*** h0h0h0h0im****
SECTION 2 P1P1h1h1h1 . . . . . PnPnhnhnhn
T1T1Ta1D1D1 . . . . . TnTnTanDnDn
d1d1f1f1f1 . . . . . dndnfnfnfn
SECTION 3 88PtPtPt or 88999
TtTtTatDtDt dtdtftftft
SECTION 4 77PmPmPm or 66PmPmPm or 77999
dmdmfmfmfm
(4vbvbvava)
–––––––––– * Used in FM 35 only.
** Used in FM 36 and FM 38 only.
*** Used in FM 36, FM 37 and FM 38 only.
**** Used in FM 38 only.

FM 35 TEMP, FM 36 TEMP SHIP, FM 37 TEMP DROP, FM 38 TEMP MOBIL
Volume I.1 A–63
Part C (continued)
SECTION 7 31313 srrarasasa 8GGgg (9snTwTwTw)
SECTION 9 51515 52525 . . . . . 59595
Code groups to be developed regionally
SECTION 10 61616 62626 . . . . . 69696
Code groups to be developed nationally
Part D
SECTION 1 MiMiMjMj D . . . . D** YYGGId IIiii*
or 99LaLaLa QcLoLoLoLo MMMULaULo*** h0h0h0h0im****
SECTION 5 n1n1P1P1P1 . . . . . nnnnPnPnPn
T1T1Ta1D1D1 . . . . . TnTnTanDnDn
SECTION 6 21212 n1n1P1P1P1 . . . . . nnnnPnPnPn
d1d1f1f1f1 . . . . . dndnfnfnfn
SECTION 7 31313 srrarasasa 8GGgg (9snTwTwTw)
SECTION 9 51515 52525 . . . . . 59595
Code groups to be developed regionally
SECTION 10 61616 62626 . . . . . 69696
Code groups to be developed nationally
_____________ * Used in FM 35 only.
** Used in FM 36 and FM 38 only.
*** Used in FM 36, FM 37 and FM 38 only.
**** Used in FM 38 only.

FM 35 TEMP, FM 36 TEMP SHIP, FM 37 TEMP DROP, FM 38 TEMP MOBIL
A–64 Volume I.1
Notes:
(1) TEMP is the name of the code for an upper-level pressure, temperature, humidity and wind report from a fixed land station. TEMP SHIP is the name of the code for an upper-level pressure, temperature, humidity and wind report from a sea station. TEMP DROP is the name of the code for an upper-level pressure, temperature, humidity and wind report from a sonde released by a carrier balloon or aircraft equipped with dropsondes. TEMP MOBIL is the name of the code for an upper-level pressure, temperature, humidity and wind report from a mobile land station.
(2) A TEMP report is identified by MiMi = TT, a TEMP SHIP report is identified by MiMi = UU, a TEMP DROP report is identified by MiMi = XX, and a TEMP MOBIL report is identified by MiMi = II.
(3) The code form consists of four parts as follows:
Part Identifier letters (MjMj) Isobaric surfaces
A B
AA BB
Up to and including the 100-hPa surface
C D
CC DD
Above the 100-hPa surface
Each part can be transmitted separately.
(4) The code form is divided into a number of sections as follows:
Section number
Indicator figures or symbolic figure groups Contents
1 — Identification and position data
2 — Data for standard isobaric surfaces
3 88 Data for tropopause level(s)
4 66 or 77 Data for maximum wind level(s) and data for vertical wind shear
5 — Data for significant levels, with respect to temperature and/or relative humidity
6 21212 Data for significant levels, with respect to wind
7 31313 Data on sea-surface temperature and sounding system
8 41414 Cloud data
9 51515 52525 . . . . .
59595
Code groups to be developed regionally
10 61616 62626 . . . . .
69696
Code groups to be developed nationally
In parts A and C, identifier 66666 should not be used in Section 10.

FM 35 TEMP, FM 36 TEMP SHIP, FM 37 TEMP DROP, FM 38 TEMP MOBIL
Volume I.1 A–65
R E G U L A T I O N S :
35.1 General 35.1.1 The code names TEMP, TEMP SHIP, TEMP DROP or TEMP MOBIL shall not be included
in the report.
35.1.2 Parts A and B shall contain data, in so far as available, only for levels up to and including the 100-hPa level.
35.1.3 Parts C and D shall contain data, in so far as available, only for levels above the 100-hPa level.
35.1.4 The instructions regarding Parts A and B of the report with respect to the inclusion of data up to and including 100 hPa and regarding Parts C and D with respect to the inclusion of data above 100 hPa shall not be contravened. For example, if data at or below 100 hPa are not included in either Part A or B, as appropriate, they shall not be included in Part C or D. In this instance, the non-included data shall be transmitted separately in the form of a correction report.
35.1.5 When during an ascent the pressure data can no longer be obtained but wind data can be obtained, the wind data so obtained shall not be reported in TEMP, TEMP SHIP and TEMP MOBIL reports.
Note: These wind data so obtained may be reported in PILOT, PILOT SHIP or PILOT MOBIL.
35.1.6 Only wind data obtained from the radiosonde ascent by either visual or electronic means shall be included in the TEMP, TEMP SHIP and TEMP MOBIL reports. Wind data obtained by means other than a radiosonde-type ascent shall not be included in TEMP, TEMP SHIP and TEMP MOBIL reports.
35.1.7 Only wind data obtained from the radiosonde descent by electronic means shall be included in the TEMP DROP reports. Wind data obtained by means other than a radiosonde-type descent shall not be included in TEMP DROP reports.
35.2 Parts A and C
35.2.1 Section 1 – Identification and position
The identification of a sea station or a mobile land station shall be indicated by the group D . . . . D. The observing station shall indicate its position by means of the group IIiii for a fixed land station, or the groups 99LaLaLa QcLoLoLoLo MMMULaULo for a sea station, aircraft or a carrier balloon, or a mobile land station. In addition, a mobile land station shall include the group h0h0h0h0im to indicate the elevation of the station (including units of elevation) and the accuracy of the elevation.
35.2.2 Section 2 – Standard isobaric surfaces
35.2.2.1 In section 2, the data groups for the surface level and the standard isobaric surfaces of 1 000, 925, 850, 700, 500, 400, 300, 250, 200, 150 and 100 hPa in Part A, and of 70, 50, 30, 20 and 10 hPa in Part C shall appear in ascending order with respect to altitude.
35.2.2.2 When the geopotential of a standard isobaric surface is lower than the altitude of the reporting station, the air temperature-humidity group for that surface shall be included. Solidi (/////) shall be reported for these groups. The wind groups for these levels shall be included as specified by the value reported for symbol Id.
35.2.2.3 When wind data are available for all levels, the wind group shall be included for each level as indicated in the symbolic code form. If wind data are not available for all levels, the procedures given below shall be followed:
(a) When wind data are missing for one or more standard isobaric surfaces but are available for other standard isobaric surfaces below and above the level of missing wind data, the wind group(s), i.e. dndnfnfnfn, shall be coded by means of solidi (/////);

FM 35 TEMP, FM 36 TEMP SHIP, FM 37 TEMP DROP, FM 38 TEMP MOBIL
A–66 Volume I.1
(b) When wind data are missing for a standard isobaric surface and are also missing for all succeeding standard isobaric surfaces up to the termination of the ascent, the wind group shall be omitted for all these levels and the symbol Id reported accordingly.
35.2.2.4 Whenever it is desired to extrapolate a sounding for the computation of the geopotential at a standard isobaric surface, the following rules shall apply:
(a) Extrapolation is permissible if, and only if, the pressure difference between the minimum pressure of the sounding and the isobaric surface for which the extrapolated value is being computed does not exceed one quarter of the pressure at which the extrapolated value is desired, provided the extrapolation does not extend through a pressure interval exceeding 25 hPa;
(b) For the purpose of geopotential calculation, and for this purpose only, the sounding will be extrapolated, using two points only of the sounding curve on a T-log p diagram, namely that at the minimum pressure reached by the sounding and that at the pressure given by the sum of this minimum pressure and the pressure difference, mentioned in (a) above.
35.2.3 Section 3 – Tropopause level(s)
35.2.3.1 When more than one tropopause is observed, each shall be reported by repeating section 3.
Note: For a definition of tropopause, the International Meteorological Vocabulary (see WMO- No. 182).
35.2.3.2 When no tropopause data are observed, the group 88999 shall be reported for section 3.
35.2.4 Section 4 – Maximum wind level(s) and vertical wind shear
35.2.4.1 When more than one maximum wind level is observed, each shall be reported by repeating section 4.
Note: Criteria for determining maximum wind levels are given in Regulations 32.2.3.1 and 32.2.3.2.
35.2.4.2 When no maximum wind level is observed, the group 77999 shall be reported for section 4.
35.2.4.3 Indicator figures 77 shall be used when the level(s) for which maximum wind data are reported does (do) not coincide with the top of the wind sounding. Indicator figures 66 shall be used in the opposite case, i.e. whenever the top of the wind sounding corresponds to the highest wind speed observed throughout the ascent.
Note: For the purpose of the above regulation, the “top of the wind sounding” is to be understood as the highest level for which wind data are available.
35.2.4.4 Group (4vbvbvava)
Group 4vbvbvava shall be included only if data for vertical wind shear are computed and required.
35.2.5 Section 7 – Sounding system indication, radiosonde, system status, launch time, sea- surface temperature groups
Section 7 is a mandatory section and shall always be reported. The groups srrarasasa and 8GGgg are mandatory for all TEMP reports: TEMP, TEMP SHIP, TEMP DROP and TEMP MOBIL. In TEMP SHIP reports, the group 9snTwTwTw shall also be included.
35.2.6 Section 9 – Regional groups
Inclusion of groups of Section 9 shall be determined by regional decision.
35.2.7 Section 10 – National groups
Inclusion of groups of Section 10 shall be determined by national decision.
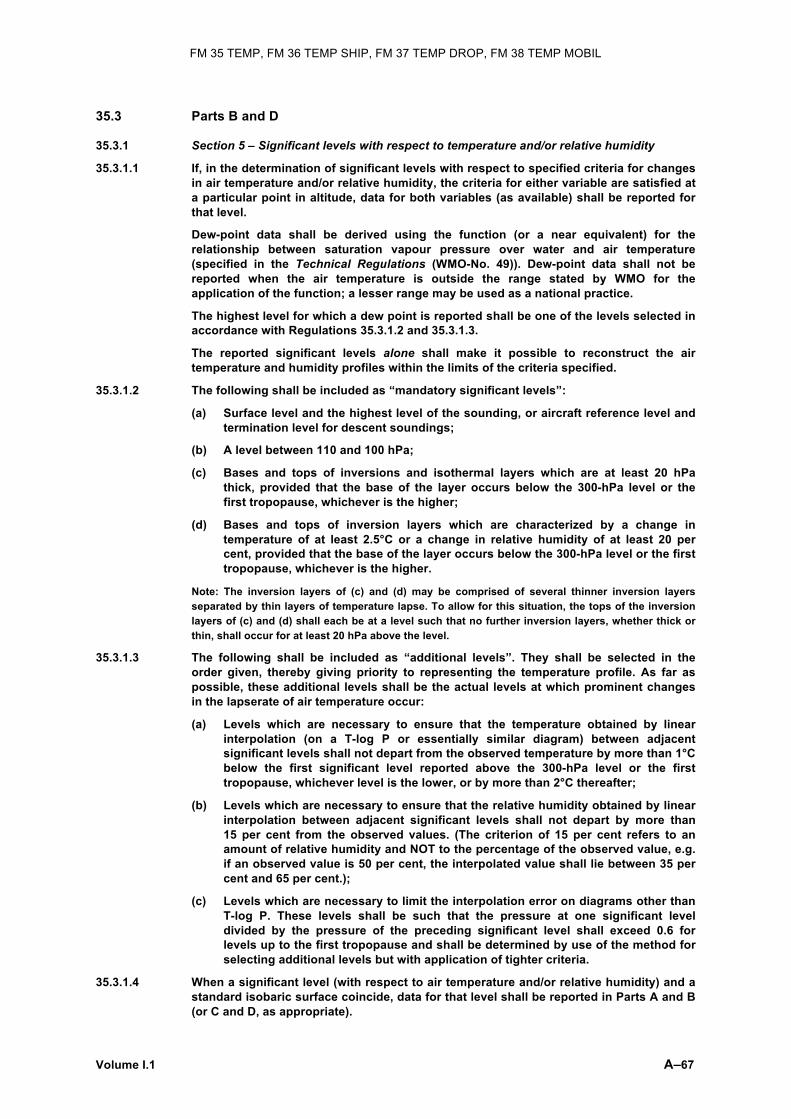
FM 35 TEMP, FM 36 TEMP SHIP, FM 37 TEMP DROP, FM 38 TEMP MOBIL
Volume I.1 A–67
35.3 Parts B and D
35.3.1 Section 5 – Significant levels with respect to temperature and/or relative humidity
35.3.1.1 If, in the determination of significant levels with respect to specified criteria for changes in air temperature and/or relative humidity, the criteria for either variable are satisfied at a particular point in altitude, data for both variables (as available) shall be reported for that level.
Dew-point data shall be derived using the function (or a near equivalent) for the relationship between saturation vapour pressure over water and air temperature (specified in the Technical Regulations (WMO-No. 49)). Dew-point data shall not be reported when the air temperature is outside the range stated by WMO for the application of the function; a lesser range may be used as a national practice.
The highest level for which a dew point is reported shall be one of the levels selected in accordance with Regulations 35.3.1.2 and 35.3.1.3.
The reported significant levels alone shall make it possible to reconstruct the air temperature and humidity profiles within the limits of the criteria specified.
35.3.1.2 The following shall be included as “mandatory significant levels”:
(a) Surface level and the highest level of the sounding, or aircraft reference level and termination level for descent soundings;
(b) A level between 110 and 100 hPa;
(c) Bases and tops of inversions and isothermal layers which are at least 20 hPa thick, provided that the base of the layer occurs below the 300-hPa level or the first tropopause, whichever is the higher;
(d) Bases and tops of inversion layers which are characterized by a change in temperature of at least 2.5°C or a change in relative humidity of at least 20 per cent, provided that the base of the layer occurs below the 300-hPa level or the first tropopause, whichever is the higher.
Note: The inversion layers of (c) and (d) may be comprised of several thinner inversion layers separated by thin layers of temperature lapse. To allow for this situation, the tops of the inversion layers of (c) and (d) shall each be at a level such that no further inversion layers, whether thick or thin, shall occur for at least 20 hPa above the level.
35.3.1.3 The following shall be included as “additional levels”. They shall be selected in the order given, thereby giving priority to representing the temperature profile. As far as possible, these additional levels shall be the actual levels at which prominent changes in the lapserate of air temperature occur:
(a) Levels which are necessary to ensure that the temperature obtained by linear interpolation (on a T-log P or essentially similar diagram) between adjacent significant levels shall not depart from the observed temperature by more than 1°C below the first significant level reported above the 300-hPa level or the first tropopause, whichever level is the lower, or by more than 2°C thereafter;
(b) Levels which are necessary to ensure that the relative humidity obtained by linear interpolation between adjacent significant levels shall not depart by more than 15 per cent from the observed values. (The criterion of 15 per cent refers to an amount of relative humidity and NOT to the percentage of the observed value, e.g. if an observed value is 50 per cent, the interpolated value shall lie between 35 per cent and 65 per cent.);
(c) Levels which are necessary to limit the interpolation error on diagrams other than T-log P. These levels shall be such that the pressure at one significant level divided by the pressure of the preceding significant level shall exceed 0.6 for levels up to the first tropopause and shall be determined by use of the method for selecting additional levels but with application of tighter criteria.
35.3.1.4 When a significant level (with respect to air temperature and/or relative humidity) and a standard isobaric surface coincide, data for that level shall be reported in Parts A and B (or C and D, as appropriate).

FM 35 TEMP, FM 36 TEMP SHIP, FM 37 TEMP DROP, FM 38 TEMP MOBIL
A–68 Volume I.1
35.3.1.5 In Part B, the successive significant levels shall be numbered 00 (station level), the first level 11, the second level 22, . . . etc. . . . 99, 11, 22, . . . etc. In Part D, the first level above 100 hPa shall be numbered 11, the second 22, . . . etc. . . . 99, 11, 22, . . . etc. The code figure 00 for n0n0 in Part B shall never be used to indicate any level other than station level.
35.3.1.6 In Parts B and D, a layer for which data are missing shall be indicated by reporting the boundary levels of the layer and a level of solidi (/////) to indicate the layer of missing data, provided that the layer is at least 20 hPa thick. The boundary levels are the levels closest to the bottom and the top of the layer for which the observed data are available. The boundary levels are not required to meet “significant level” criteria. The boundary levels and the missing data level groups will be identified by appropriate nn numbers. For example:
33P3P3P3 T3T3Ta3D3D3 44/// ///// 55P5P5P5 T5T5Ta5D5D5
where the levels 33 and 55 are the boundary levels and 44 indicates the layer for which data are missing.
35.3.2 Section 6 – Significant levels with respect to wind
35.3.2.1 Significant levels shall be chosen so that the data from them alone shall make it possible to reconstruct the wind profile with sufficient accuracy for practical use.
Note: Criteria for determining significant levels with respect to changes in wind speed and direction are given in Regulation 32.3.1.
35.3.2.2 In Parts B and D, a layer for which data are missing shall be indicated by reporting the boundary levels of the layer and a level of solidi (/////) to indicate the layer of missing data, provided that the layer is at least 50 hPa thick. The boundary levels are the levels closest to the bottom and the top of the layer for which the observed data are available. The boundary levels are not required to meet “significant level” criteria. The boundary levels and the missing data level groups will be identified by appropriate nn numbers. For example:
33P3P3P3 d3d3f3f3f3 44/// ///// 55P5P5P5 d5d5f5f5f5
where the levels 33 and 55 are the boundary levels and 44 indicates the layer for which data are missing.
35.3.3 Section 7 – Sounding system indication, radiosonde, system status, launch time, sea-surface temperature groups
Section 7 is a mandatory section and shall always be reported. The groups srrarasasa and 8GGgg are mandatory for all TEMP reports: TEMP, TEMP SHIP, TEMP DROP and TEMP MOBIL. In TEMP SHIP reports, the group 9snTwTwTw shall also be included.
35.3.4 Section 8 – Cloud data
35.3.4.1 In TEMP, TEMP SHIP and TEMP MOBIL reports, this section shall be used to report cloud data. Nh, h, CL, CM and CH shall be coded in accordance with the regulations in FM 12 SYNOP (12.2.1.2, 12.2.7.2 and 12.2.7.3).
35.3.4.2 This section shall not be included in TEMP DROP reports.
35.3.5 Section 9 – Regional groups
Inclusion of groups of Section 9 shall be determined by regional decision.
35.3.6 Section 10 – National groups
Inclusion of groups of Section 10 shall be determined by national decision.
_____________

Volume I.1 A–69
FM 39–VI ROCOB Upper-level temperature, wind and air density report from a land rocketsonde station
FM 40–VI ROCOB SHIP Upper-level temperature, wind and air density report from a rocketsonde station on a ship
C O D E F O R M :
SECTION 1 MiMiMjMj YYGGg MMJJJ IIiii*
or 99LaLaLa QcLoLoLoLo MMMULaULo**
a1eTeTcTmr rmewewcwmr
SECTION 2 HHZTTT HHZTTT . . . . .
ddfff ddfff . . . . .
(9dpp1p1p1) (9dpp1p1p1)
SECTION 3 (11ZTT1T1 . . . . . 11ZTTnTn 22ZTT1T1 . . . . . 22ZTTnTn 33ZTT1T1 . . . . . 33ZTTnTn 44ZTT1T1 . . . . . 44ZTTnTn 55ZTT1T1 . . . . . 55ZTTnTn 66ZTT1T1 . . . . . 66ZTTnTn
P1P1h1h1h1 . . . . . PnPnhnhnhn P1P1h1h1h1 . . . . . PnPnhnhnhn P1P1h1h1h1 . . . . . PnPnhnhnhn P1P1h1h1h1 . . . . . PnPnhnhnhn P1P1h1h1h1 . . . . . PnPnhnhnhn P1P1h1h1h1 . . . . . PnPnhnhnhn
d1d1f1f1f1 . . . . . dndnfnfnfn d1d1f1f1f1 . . . . . dndnfnfnfn d1d1f1f1f1 . . . . . dndnfnfnfn d1d1f1f1f1 . . . . . dndnfnfnfn d1d1f1f1f1 . . . . . dndnfnfnfn d1d1f1f1f1 . . . . . dndnfnfnfn)
Notes:
(1) ROCOB is the name of the code for an upper-level (for altitudes greater than 20 km) temperature, wind and air density report of a rocketsonde observation from a land station. ROCOB SHIP is the name of the code of a rocket-sonde report from a ship.
(2) A ROCOB report is identified by = RRXX. A ROCOB SHIP report is identified by MiMiMjMj = SSXX.
(3) The code form is divided into three sections as follows:
Section number Contents 1 Identification data 2 Data for specified geometric altitudes 3 Data for isobaric surfaces (optional) ––––––––––
* Used in FM 39 only.
** Used in FM 40 only.

FM 39 ROCOB, FM 40 ROCOB SHIP
A–70 Volume I.1
R E G U L A T I O N S :
39.1 General The code name ROCOB or ROCOB SHIP shall not be included in the report.
39.2 Section 1 – Identification 39.2.1 The land rocketsonde station shall indicate its position by means of the group IIiii. The
ship rocketsonde station shall indicate its position by means of the groups 99LaLaLa QcLoLoLoLo MMMULaULo.
39.2.2 Section 1 shall not be transmitted as a separate report.
39.2.3 The group MMJJJ shall be used to indicate, together with the group YYGGg, the year (JJJ), month (MM), day (YY) and time (GGg) of the firing of the rocket.
39.3 Section 2 – Specified geometric altitudes
39.3.1 Mandatory levels
39.3.1.1 Data shall be reported for each 5 km vertical interval, beginning at 20 km, up to the top of the ascent, and for the lowest level of the ascent for which data are available, provided its altitude is higher than 20 km.
39.3.1.2 If data are not available for one or more of the mandatory altitudes specified in Regulation 39.3.1.1, the code groups for those levels shall be inserted in the report in their altitude sequence order with solidi (/, // or ///) reported for the missing elements.
39.3.2 Significant levels
39.3.2.1 All data shall be reported for those non-mandatory levels at which significant changes in wind speed or direction or temperature occur. The mandatory and significant levels shall be intermixed in the report in ascending order with respect to altitude.
39.3.2.2 The reported significant data shall make it possible to reconstruct the wind and temperature curves between consecutive mandatory levels with sufficient accuracy for practical use.
39.3.2.3 The criteria for significant changes shall be as follows:
(a) A departure of the wind speed of 5 or more metres per second from a linear interpolation between any two consecutive levels selected to be reported;
(b) A departure of the wind direction from a linear interpolation between any two consecutive levels selected to be reported, thus:
60° or more – when the average wind speed for the layer is 8 to 15 metres per second;
30° or more – when the average wind speed for the layer is 16 to 30 metres per second;
20° or more – when the average wind speed for the layer is 31 metres per second or more;
(c) A temperature change of 3°C from a linear interpolation between any two consecutive levels selected to be reported.
Note: To satisfy these criteria, the following method of approximation is recommended:
(1) The bottom level and the top level of the 5 km stratum between two consecutive mandatory levels constitute the base lines for determining the significant levels in that stratum. If the wind and temperature criteria are not exceeded, no significant level need be reported. Whenever one of the parameters deviates by more than the limit specified in Regulation 39.3.2.3, the level of greatest deviation becomes a significant level, and data for all three parameters are reported for that level.

FM 39 ROCOB, FM 40 ROCOB SHIP
Volume I.1 A–71
(2) The additional significant levels so introduced divide the stratum into several layers. In each separate layer, the deviations from the linearly interpolated values between the base and the top are then considered. The process used in paragraph (1) above is repeated and yields other significant levels. These additional levels in turn modify the layer distribution, and the method is applied again until any level is approximated to the specified criteria values.
39.3.3 Group ddfff
The thickness of the layer through which wind direction and speed are determined shall be 2 km for both mandatory and significant levels, i.e. from 1 km below to 1 km above the altitude reported.
39.3.4 Group (9dpp1p1p1)
Group 9dpp1p1p1 shall be included only when data are available. If temperature data are missing for a stratum of more than 3 km in depth, the 9dpp1p1p1 group shall be omitted for the remainder of the ascent.
39.4 Section 3 – Isobaric surfaces 39.4.1 Section 3 shall be included only when data are available for any of the isobaric surfaces
of 70, 50, 30, 20, 10, 7, 5, 3, 2, 1, 7.10–1, 5.10–1, 4.10–1, 3.10–1, 2.10–1, 1.10–1, 7.10–2, 5.10–2, 3.10–2, 2.10–2, 1.10–2, 7.10–3, 5.10–3, 3.10–3, 2.10–3, 1.10–3, 7.10–4, 5.10–4, 3.10–4, 2.10–4, 1.10–4, 7.10–5, 5.10–5, 3.10–5, 2.10–5 and 1.10–5 hPa.
39.4.2 In Section 3, indicator figures 11, 22, 33, 44, 55 and 66 specify the following values for PP and hhh:
Indicator figures 11 shall be used when P1P1, P2P2, . . . PnPn are reported in whole hectopascals and h1h1h1, h2h2h2, . . . hnhnhn in hundreds of standard geopotential metres;
Indicator figures 22 shall be used when P1P1, P2P2, . . . PnPn are reported in tenths of a hectopascal and h1h1h1, h2h2h2, . . . hnhnhn in hundreds of standard geopotential metres;
Indicator figures 33 shall be used when P1P1, P2P2, . . . PnPn are reported in hundredths of a hectopascal and h1h1h1, h2h2h2, . . . hnhnhn in hundreds of standard geopotential metres;
Indicator figures 44 shall be used when P1P1, P2P2, . . . PnPn are reported in thousandths of a hectopascal and h1h1h1, h2h2h2, . . . hnhnhn in hundreds of standard geopotential metres;
Indicator figures 55 shall be used when P1P1, P2P2, . . . PnPn are reported in ten-thousandths of a hectopascal and h1h1h1, h2h2h2, . . . hnhnhn in hundreds of standard geopotential metres;
Indicator figures 66 shall be used when P1P1, P2P2, . . . PnPn are reported in hundred-thousandths of a hectopascal and h1h1h1, h2h2h2, . . . hnhnhn in thousands of standard geopotential metres.
_____________


Volume I.1 A–73
FM 41–IV CODAR Upper-air report from an aircraft (other than weather reconnaissance aircraft)
C O D E F O R M : MiMiMjMj
YYGGg 99LaLaLa QcLoLoLoLo PaPaPaBzSh TTTansnm
(40LaLaLa QcLoLoLoLo) ddfff
(41LaLaLa QcLoLoLoLo ddfff)
. . . . . . . . . . . . . . .
(49LaLaLa QcLoLoLoLo ddfff)
(6HHHH)
Notes:
(1) CODAR is the name of the code for an upper-air report from aircraft (other than weather reconnaissance aircraft) in figure code.
(2) A CODAR report is identified by MiMiMjMj = LLXX.
R E G U L A T I O N S :
41.1 General 41.1.1 The code name CODAR shall not be included in the report.
41.1.2 The identifier group MiMiMjMj shall be included as the first line of the text of a meteorological bulletin of CODAR reports. Individual reports in the bulletin shall not contain the group MiMiMjMj.
41.2 Wind data 41.2.1 If both spot and mean winds are available, spot winds shall always be reported first.
41.2.2 If one spot wind only is reported, it shall refer to the position given at the beginning of the report. If more than one spot wind is reported, the positions of the points where the second and the following spot winds were measured shall be included immediately before the relevant ddfff group(s).
41.2.3 In the case of mean wind, the position of the midpoint of the sector over which it was calculated shall always be included immediately before the relevant ddfff group.
_____________


Volume I.1 A–75
FM 42–XI Ext. AMDAR Aircraft report (aircraft meteorological data relay)
C O D E F O R M : SECTION 1 AMDAR YYGG
SECTION 2 ipipip IA . . . IA LaLaLaLaA LoLoLoLoLoB YYGGgg ShhIhIhI
SSTATATA
SSTdTdTd or UUU
ddd/fff TBBA Ss1s2s3
SECTION 3 333 Fhdhdhd VGfgfgfg Notes:
(1) AMDAR is the name of the code for an automatic meteorological report from an aircraft.
(2) Observations are made at specified levels, time intervals or when the highest wind is encountered, and shall be included in individual reports.
(3) Data transmitted from the aircraft are encoded in binary code and are translated into the quasi-AIREP format for the convenience of human users.
R E G U L A T I O N S :
42.1 General 42.1.1 In a bulletin of AMDAR reports, the contents of Section 1 (the code name AMDAR and
the group YYGG) shall be included only as the first line of the bulletin.
42.1.2 Reporting data groups
42.1.2.1 Subject to Regulation 42.1.2.2, an AMDAR report shall include Section 2 containing at least the phase of flight indicator, the aircraft identifier, its geographical location and the day and time of observation, as well as the observed temperature and wind.
42.1.2.2 An AMDAR report from an ASDAR system shall include all data groups contained in Section 2 and shall not include Section 3.
42.1.2.3 An AMDAR report from an ACARS system shall include Section 3.
42.1.2.4 Use of solidi
Data shall be encoded as solidi when not available, when the data collection platform cannot acquire correct data, or in the event of parity errors.
42.1.3 Frequency of observations
The frequency of observations shall vary according to the phase of the flight (ascent, level flight or descent).
42.1.3.1 Observations during ascent
During ascent, observations shall be made as the aircraft passes through certain pressure levels, as follows. The first level shall be the nearest multiple of 10 hPa less than pressure at take-off. The next nine observations shall be at intervals of 10 hPa. The eleventh level shall be the first multiple of 50 hPa less than the tenth level. Observations shall continue at 50-hPa intervals until ascent is completed.
Note: For example, if the pressure at take-off was 1 012 hPa, the first level to be reported would be 1 010 hPa.

FM 42 AMDAR
A–76 Volume I.1
42.1.3.2 Observations during level flight
42.1.3.2.1 Routine observations
Routine observations during level flight shall be made at set intervals of time. The first observation shall be made at the first integral minute after the level flight phase has been continuously occupied for at least 15 seconds. Subsequent observations shall be made at seven-minute intervals. If level flight is interrupted by unsteady flight, the timing sequence shall begin again upon resumption of level flight.
42.1.3.2.2 Highest wind encountered
Highest wind encountered shall be reported when the aircraft is in level flight at a pressure level less than 600 hPa, according to the following scheme. Smoothed wind speed shall be sampled at one-second intervals, and a wind speed maximum shall be reported if and only if the wind speed:
(a) Is greater than 60 knots;
(b) Exceeds the observed wind speed at the previous routine observation by 10 knots or more; and
(c) Exceeds the observed wind speed at the subsequent routine observation by 10 knots or more.
42.1.3.3 Observations during descent
During descent, observations shall be made as the aircraft passes through certain pressure levels, as follows. The first level shall be the nearest multiple of 50 hPa greater than the pressure at the last observation before descent. Subsequent observations shall be at intervals of 50 hPa, until a pressure level of 700 hPa is reached. From that level, observations shall continue at 50-hPa intervals, but supplemented by observations at intervals of 10 hPa.
42.2 Section 2
42.2.1 Phase of flight indicator ipipip
42.2.1.1 An indicator shall be included in each report, to show both phase of flight (unsteady, level, ascent or descent) and, in the case of level flight, the type of observation (routine or maximum wind).
42.2.1.2 Whenever a predetermined roll threshold has been exceeded, the phase of flight shall be considered to be unsteady.
42.2.1.3 A routine observation in level flight shall be indicated by encoding the phase of flight indicator as LVR.
42.2.1.4 Highest wind encountered in level flight shall be indicated by encoding the phase of flight indicator as LVW.
42.2.1.5 An observation during ascent shall be indicated by encoding the phase of flight indicator as ASC.
42.2.1.6 An observation during descent shall be indicated by encoding the phase of flight indicator as DES.
42.2.1.7 An observation during an unsteady phase of flight shall be indicated by encoding the phase of flight indicator as UNS.
42.2.2 Meteorological data
42.2.2.1 Temperature
Each observation shall include the air temperature at the given pressure altitude. The precision of the temperature shall be indicated by s3. If observed, either dew-point temperature or relative humidity at the given pressure altitude shall be included. s3

FM 42 AMDAR
Volume I.1 A–77
42.2.2.2 Wind
Each observation shall include a value for the observed wind. Direction, relative to true north, shall be reported in whole degrees. Wind speed shall be reported in whole knots.
42.2.2.3 Turbulence
Each observation from an ASDAR system shall include a report of turbulence, encoded by the indicator letters TB followed by a single digit value for the turbulence.
42.3 Section 3
42.3.1 Group Fhdhdhd
This group shall be used in an AMDAR report from an ACARS system to report the pressure altitude.
Note: Reports up to and including 700 hPa are considered to be above the aerodrome with height derived from the QNH value and the elevation of the aerodrome concerned. Heights above 700 hPa are included in accordance with the ICAO standard atmosphere.
42.3.2 Group VGfgfgfg
This group shall be used in an AMDAR report from an ACARS system to report the maximum derived equivalent vertical gust.
Notes:
(1) The qualitative severity of turbulence can be related approximately to values of derived equivalent gust velocity as follows:
Ude < 2 m s–1 2–4.5 m s–1 4.5–9 m s–1 > 9 m s–1
Severity Nil Light Heavy Severe
(2) The derived equivalent vertical gust, Ude, is defined by aircraft design codes such as the US Federal Aviation Regulations – Part 25.341, or the Engineering Sciences Data Unit (London, United Kingdom) – Data Item 69023.
_____________


Volume I.1 A–79
FM 44–V ICEAN Ice analysis
C O D E F O R M : SECTION 1 ICEAN
(Preamble 1) 20002 or
33399 0YYGcGc (2YsYsGsGs)
(Preamble 2) 75557 33399 0YYGcGc (2YsYsGsGs) 000GpGp
SECTION 2 (44111 6LiLiLjLj QcLaLaLaLa LoLoLoLoLo QcLaLaLaLa LoLoLoLoLo . . . . . . . . . . CFpCpS1C1 (2FsCsS2C2) (3FeCeS3C3) (4FqCqS4C4) (5FuCuS5C5) (6T1T2ReRh) (7WtDwtEms) (8aIDriri) (9nGnGnBnB))
SECTION 3 (4422K QcLaLaLaLa LoLoLoLoLo QcLaLaLaLa LoLoLoLoLo . . . . . . . . . .)
SECTION 4 (4433K QcLaLaLaLa LoLoLoLoLo QcLaLaLaLa LoLoLoLoLo
19191 . . . . . . . . . .)
Notes:
(1) ICEAN is the name of the code describing actual or predicted ice conditions.
(2) An ICEAN analysis or prognosis is identified by the word ICEAN.
(3) The code form is divided into four sections:
Section Symbolic figure group Contents number 1 20002 Identification of time groups or 75557
2 44111 Description of ice conditions
3 4422 Areas with defined navigability
4 4433 Recommended track Sections 2, 3 and/or 4 are not transmitted separately.
R E G U L A T I O N S :
44.1 General 44.1.1 The code name ICEAN shall always appear as a prefix to an individual coded analysis or
prognosis.
4.4.1.2 When the position groups delineate an enclosed area, they shall appear in the coded analysis or prognosis in clockwise sequence. The first position group(s) shall be repeated as the last position group(s) to complete closure of the area.
44.1.3 Each analysis or prognosis shall end with the group 19191.
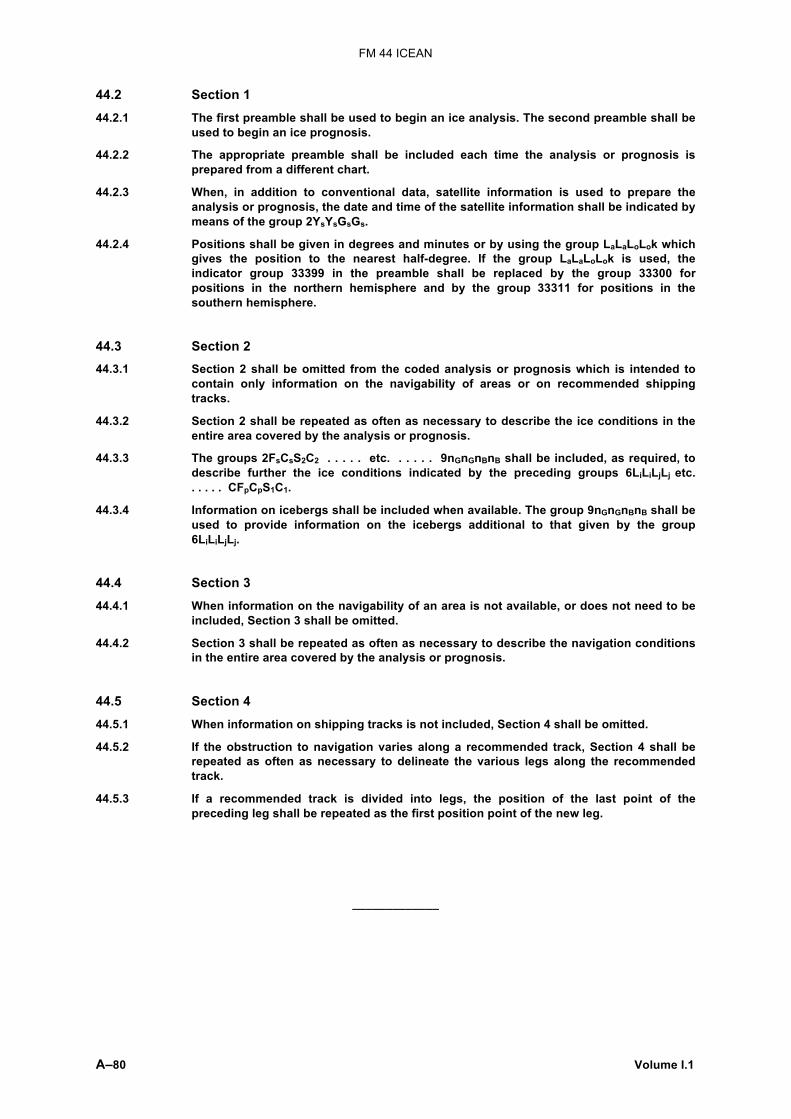
FM 44 ICEAN
A–80 Volume I.1
44.2 Section 1 44.2.1 The first preamble shall be used to begin an ice analysis. The second preamble shall be
used to begin an ice prognosis.
44.2.2 The appropriate preamble shall be included each time the analysis or prognosis is prepared from a different chart.
44.2.3 When, in addition to conventional data, satellite information is used to prepare the analysis or prognosis, the date and time of the satellite information shall be indicated by means of the group 2YsYsGsGs.
44.2.4 Positions shall be given in degrees and minutes or by using the group LaLaLoLok which gives the position to the nearest half-degree. If the group LaLaLoLok is used, the indicator group 33399 in the preamble shall be replaced by the group 33300 for positions in the northern hemisphere and by the group 33311 for positions in the southern hemisphere.
44.3 Section 2 44.3.1 Section 2 shall be omitted from the coded analysis or prognosis which is intended to
contain only information on the navigability of areas or on recommended shipping tracks.
44.3.2 Section 2 shall be repeated as often as necessary to describe the ice conditions in the entire area covered by the analysis or prognosis.
44.3.3 The groups 2FsCsS2C2 . . . . . etc. . . . . . 9nGnGnBnB shall be included, as required, to describe further the ice conditions indicated by the preceding groups 6LiLiLjLj etc. . . . . . CFpCpS1C1.
44.3.4 Information on icebergs shall be included when available. The group 9nGnGnBnB shall be used to provide information on the icebergs additional to that given by the group 6LiLiLjLj.
44.4 Section 3 44.4.1 When information on the navigability of an area is not available, or does not need to be
included, Section 3 shall be omitted.
44.4.2 Section 3 shall be repeated as often as necessary to describe the navigation conditions in the entire area covered by the analysis or prognosis.
44.5 Section 4 44.5.1 When information on shipping tracks is not included, Section 4 shall be omitted.
44.5.2 If the obstruction to navigation varies along a recommended track, Section 4 shall be repeated as often as necessary to delineate the various legs along the recommended track.
44.5.3 If a recommended track is divided into legs, the position of the last point of the preceding leg shall be repeated as the first position point of the new leg.
_____________

Volume I.1 A–81
FM 45–IV IAC Analysis in full form
C O D E F O R M : PREAMBLES 10001
or 333x1x1 0YYGcGc
10001 or
333x1x1 0YYGcGc 8x2x2x28 00x3x3x3
65556 or
333x1x1 0YYGcGc 000GpGp
65556 333x1x1 0YYGcGc 000GpGp 8x2x2x28 00x3x3x3
SECTION 0 99900 (9NNSS) 8PtPcPP or 8hthchaha yyyyy . . . . . (mdsdsfsfs) (00C100) . . . . . . . . . . . . . . . . . . . . . . . . . . . . . . . . . . .
9PtPcPP or
or 9hthchaha yyyyy . . . . .
7PtPcPP or 7hthchaha yyyyy . . . . . (mdsdsfsfs) (00C100)) Subsection 0–1 (000gpgp
. . . . . . . . . . . . . . . . . . . . . . . . . . . . . .
SECTION 1 99911 (9NNSS) 66FtFiFc yyyyy . . . . . (mdsdsfsfs) (00C100) . . . . . . . . . . . . . . . . . . . . . . . . . . . . . .
69FtFiFc or
yyyyy yyyyy . . . . .
67FtFiFc yyyyy yyyyy . . . . . (mdsdsfsfs) (00C100) ) Subsection 1–1 (000gpgp
. . . . . . . . . . . . . . . . . . . . . . . . . . . . . .
SECTION 2 99922 4e1uuu yyyyy . . . . . (00C100) . . . . . . . . . . . . . . . . . . . .
SECTION 3 99933 33MhMsMt yyyyy . . . . . (00C100) . . . . . . . . . . . . . . . . . . . .
SECTION 4 99944 989wei or 988ww or 987wsws
yyyyy . . . . . (mdsdsfsfs) (00C100)
. . . . . . . . . . . . . . . . . . . . . . . . .
SECTION 5 99955 (9NNSS) (55TtTiTc) (555PP) (5555Ti) yyyyy . . . . . (mdsdsfsfs) (00C100) . . . . . . . . . . . . . . . . . . . . . . . . . . . . . . . . . . . . . . . .
SECTION 6 99966 2CsS1S2Z1 yyyyy . . . . . (mdsdsfsfs) (00C100) . . . . . . . . . . . . . . . . . . . . . . . . . (9CHbHbHb
or 8NHtHtHt yyyy . . . . . . . . . .)
(7CHbHbHb 6NHtHtHt yyyy . . . . . . . . . .)

FM 45 IAC
A–82 Volume I.1
SECTION 7 99977 (000gpgp) yyyyy 8ddff 7ddff 5ddff 4ddff 3ddff 2ddff 1ddff (00C100) . . . . . . . . . . . . . . . . . . . . . . . . . . . . . . . . . . . . . . . . . . . . . SECTION 8 99988 9ijHjHjHj
and/or yyyyy djdjfjfjfj yyyyy djdjfjfjfj . . . . . . . . . . . . . . . . . . . . (00C100)
9ijPsPsPs and/or
yyyyy djdjfjfjfj yyyyy djdjfjfjfj . . . . . . . . . . . . . . . . . . . . (00C100)
4e1uuu yyyyy yyyyy . . . . . . . . . . SECTION 9 99999 4e1uuu (42uuu) yyyyy . . . . . (00C100) (00000 42uuu yyyyy . . . . . . . . . .) (. . . . . . . . . . . . . . . . . . . . . . . . .) SECTION 10 88800 77e2uu (9dwdwPwPw) yyyyy (9dwdwPwPw) yyyyy . . . . . . . . . . (00C100)
Subsection 10-1 (000gpgp 79e2uu
or 76e2uu
(9dwdwPwPw) . . . . .
yyyyy . . . . .
(9dwdwPwPw) . . . . .
yyyyy . . . . .
. . . . .
. . . . . (00C100) . . . . . )
SECTION 11 88822 44vvv
or yyyyy yyyyy . . . . .
444vvv yyyyy yyyyy . . . . . SECTION 12 77744 . . . . . . . . . . . . . . . . . . . . . . . . Vocabulary groups . . . . . . . . . . . . . . . . . . . . .
. . 44777
19191
Notes:
(1) IAC is the name of the code comprising a set of the International Analysis Codes.
(2) The code form consists of a set of alternative preambles and a number of sections as follows:
(a) Alternative preambles Line To be used for First line Surface analysis Second line Analysis other than surface Third line Surface prognosis Fourth line Prognosis other than surface
(b) Sections Section Symbolic figure group Contents number 0 99900 Pressure or topography systems 1 99911 Frontal systems 2 99922 Isopleth values 3 99933 Air-mass particulars 4 99944 Weather 5 99955 Tropical systems 6 99966 Cloud systems 7 99977 Upper winds 8 99988 Jet-stream characteristics 9 99999 Tropopause characteristics 10 88800 Sea temperature and waves 11 88822 Vertical wind shear 12 77744 Vocabulary groups
A section cannot be transmitted without the appropriate preamble.

FM 45 IAC
Volume I.1 A–83
(3) Sections 0, 1 and 10 each contain a subsection which can be used when greater detail is required about past or future positions and characteristics of any pressure, front or wave system or sea-temperature configuration. Whereas the section itself refers to the time indicated in the preamble of the message, the past or future times of the subsection are indicated by means of the group 000gpgp. A subsection can be repeated, with insertion of the appropriate group 000gpgp, when information on both past and future conditions is to be included.
(4) The Sections 0 to 11 and the subsections each describe delineations, by means of the position groups yyyyy, of given values of a parameter or given states of an element. The section thus consists of a regular succession of sets of groups, each set starting with a group giving the new value of the parameter or element. The position groups of each set may be followed by additional information in the optional groups mdsdsfsfs and 00C100 on the movement of systems or fronts and about the confidence of the preceding information, as specified in the code form.
(5) Section 6 provides for the inclusion of reported conditions by means of groups with indicator figures 9 and 8, and forecast conditions by groups with indicator figures 7 and 6.
(6) Section 7 provides for the coding of upper winds in vertical profile for selected standard isobaric surfaces, at each position yyyyy and either at the time given in the preamble of the message or at a later time indicated by the group 000gpgp.
(7) Section 8 provides for the coding of actual or forecast winds for a number of positions along the jet-stream core or along the line of maximum wind speed on the standard constant-pressure charts immediately above or below the jet core. This section will be restricted normally to winds exceeding 60 knots or 30 m s–1 or 100 km h–1
(depending on the value selected for ij).
(8) Section 9 provides for the coding of tropopause temperature data in relation to isopleths of the level of the tropopause. The 4e1uuu group gives the value of the isobar or the isohypse described by all the yyyyy groups which follow up to the next 4e1uuu group in the message. Along a given isobar or isohypse, each of the 42uuu groups gives the temperature at the points indicated by the following yyyyy groups. When the temperature changes along the tropopause isopleth, an indicator group 00000 is included, followed by a 42uuu group and the yyyyy groups. In the 42uuu group, uuu gives the temperature in whole degrees Celsius.
(9) Section 10 provides for indicating, as an optional feature, direction and period of waves for each point of a sea-surface isotherm. Each group 9dwdwPwPw refers to the position yyyyy which follows.
(10) Section 11 provides for the coding of vertical wind shear in knots per 1 000 metres, by using the group 44vvv, and for the coding of vertical wind shear in knots per 300 metres by using the group 444vv.
(11) Section 12 provides for the addition of information in plain language, for instance to emphasize the existence of a line squall.
R E G U L A T I O N S :
45.1 General The code name IAC shall not be included in the coded analysis or prognosis.
45.2 Preamble 45.2.1 The appropriate preamble shall be included each time the analysis or prognosis is made
up from a different chart, whether it be for sea level or any other level, and for each different type.
45.2.2 Each analysis or prognosis defined in Regulation 45.2.1 shall end with the group 19191.
45.2.3 Additional groups shall be inserted in the preambles under the following conditions, as described in Code table 4892:
(a) When x2x2x2 = 555, the group 85558 shall be followed by two 00x3x3x3 groups;
(b) When x2x2x2 = 666, the group 86668 shall be followed by either the 81118 or the 82228 group, as appropriate.
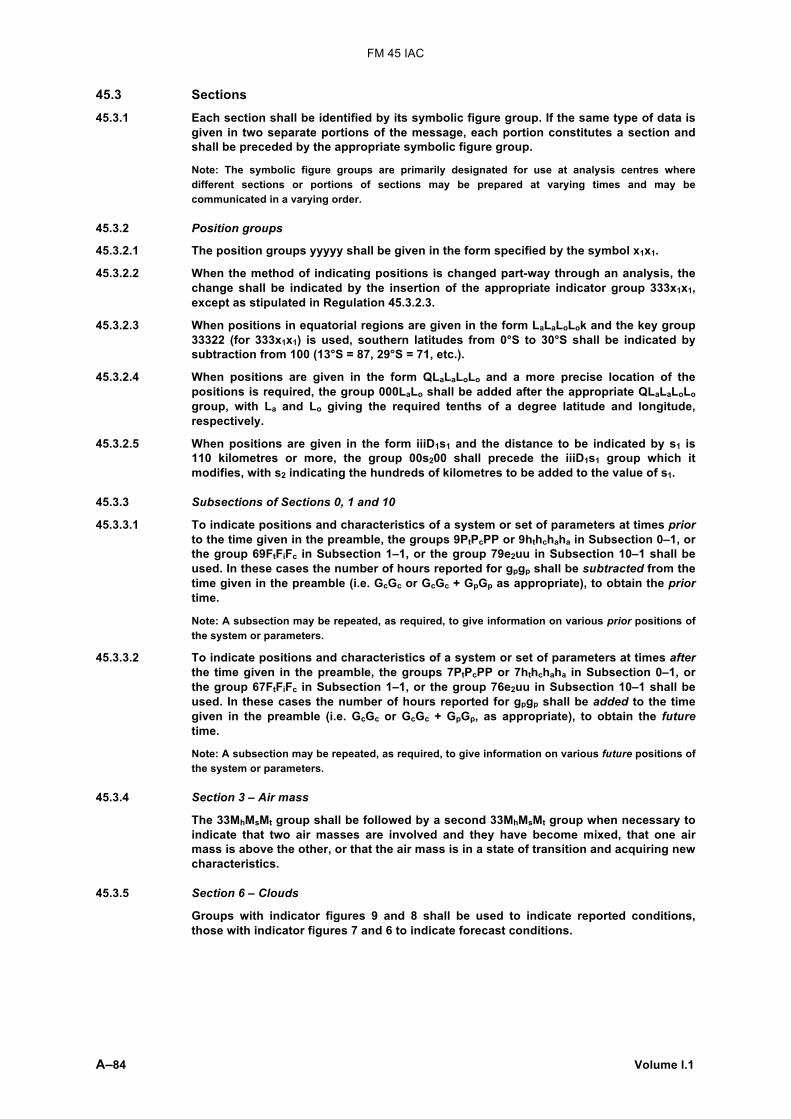
FM 45 IAC
A–84 Volume I.1
45.3 Sections 45.3.1 Each section shall be identified by its symbolic figure group. If the same type of data is
given in two separate portions of the message, each portion constitutes a section and shall be preceded by the appropriate symbolic figure group.
Note: The symbolic figure groups are primarily designated for use at analysis centres where different sections or portions of sections may be prepared at varying times and may be communicated in a varying order.
45.3.2 Position groups
45.3.2.1 The position groups yyyyy shall be given in the form specified by the symbol x1x1.
45.3.2.2 When the method of indicating positions is changed part-way through an analysis, the change shall be indicated by the insertion of the appropriate indicator group 333x1x1, except as stipulated in Regulation 45.3.2.3.
45.3.2.3 When positions in equatorial regions are given in the form LaLaLoLok and the key group 33322 (for 333x1x1) is used, southern latitudes from 0°S to 30°S shall be indicated by subtraction from 100 (13°S = 87, 29°S = 71, etc.).
45.3.2.4 When positions are given in the form QLaLaLoLo and a more precise location of the positions is required, the group 000LaLo shall be added after the appropriate QLaLaLoLo group, with La and Lo giving the required tenths of a degree latitude and longitude, respectively.
45.3.2.5 When positions are given in the form iiiD1s1 and the distance to be indicated by s1 is 110 kilometres or more, the group 00s200 shall precede the iiiD1s1 group which it modifies, with s2 indicating the hundreds of kilometres to be added to the value of s1.
45.3.3 Subsections of Sections 0, 1 and 10
45.3.3.1 To indicate positions and characteristics of a system or set of parameters at times prior to the time given in the preamble, the groups 9PtPcPP or 9hthchaha in Subsection 0–1, or the group 69FtFiFc in Subsection 1–1, or the group 79e2uu in Subsection 10–1 shall be used. In these cases the number of hours reported for gpgp shall be subtracted from the time given in the preamble (i.e. GcGc or GcGc + GpGp as appropriate), to obtain the prior time.
Note: A subsection may be repeated, as required, to give information on various prior positions of the system or parameters.
45.3.3.2 To indicate positions and characteristics of a system or set of parameters at times after the time given in the preamble, the groups 7PtPcPP or 7hthchaha in Subsection 0–1, or the group 67FtFiFc in Subsection 1–1, or the group 76e2uu in Subsection 10–1 shall be used. In these cases the number of hours reported for gpgp shall be added to the time given in the preamble (i.e. GcGc or GcGc + GpGp, as appropriate), to obtain the future time.
Note: A subsection may be repeated, as required, to give information on various future positions of the system or parameters.
45.3.4 Section 3 – Air mass
The 33MhMsMt group shall be followed by a second 33MhMsMt group when necessary to indicate that two air masses are involved and they have become mixed, that one air mass is above the other, or that the air mass is in a state of transition and acquiring new characteristics.
45.3.5 Section 6 – Clouds
Groups with indicator figures 9 and 8 shall be used to indicate reported conditions, those with indicator figures 7 and 6 to indicate forecast conditions.

FM 45 IAC
Volume I.1 A–85
45.3.6 Section 7 – Upper winds
45.3.6.1 Wind data for the standard isobaric surfaces of 850, 700, 500, 400, 300, 200 and 100 hPa, or a selection of these surfaces, shall be given in the ddff groups with indicator figures 8, 7, 5, 4, 3, 2 and 1, respectively. The number of hours given for gpgp shall be added to the time given for GcGc to specify the time of forecast winds.
45.3.6.2 Wind speeds of 100 knots or more shall be encoded as follows:
(a) Wind speeds of 100 knots or more, but not exceeding 199 knots, shall be reported as follows:
(i) 50 shall be added to dd;
(ii) The number of knots in excess of 100 shall be indicated for ff;
(b) Wind speeds of 200 knots or more, but not exceeding 299 knots, shall be reported as follows:
(i) The code group 00200 shall be inserted after the group to which it refers;
(ii) The number of knots in excess of 200 shall be indicated for ff;
(c) Wind speeds of 300 knots or more, but not exceeding 399 knots, shall be reported as follows:
(i) The code group 00300 shall be inserted after the group to which it refers;
(ii) The number of knots in excess of 300 shall be indicated for ff.
45.4 Additional groups and supplementary information If additional supplementary sections of the analysis code are used for national purposes, the above code form shall be used in so far as it is applicable and the supplementary sections shall be placed at the end of the coded analysis and prognosis or sent separately from each other.
45.5 Correction When it is necessary to send a correction to the analysis or prognosis, the correction shall commence with the groups 11133 0YYGcGc. The corrections shall follow, preceded by the key group indicators pertinent to the sections, and the coded analysis or prognosis shall end with the 19191 group.
_____________


Volume I.1 A–87
FM 46–IV IAC FLEET Analysis in abbreviated form
C O D E F O R M : PREAMBLES 10001
or 33388 0YYGcGc
65556 33388 0YYGcGc 000GpGp
SECTION 0 99900 8PtPcPP QLaLaLoLo . . . . . mdsdsfsfs Subsection 0–1 (000gpgp
9PtPcPP or 7PtPcPP
QLaLaLoLo
QLaLaLoLo
. . . . . . . . . .
mdsdsfsfs
)
SECTION 1 99911 66FtFiFc QLaLaLoLo QLaLaLoLo . . . . . mdsdsfsfs
Subsection 1–1 (000gpgp 69FtFiFc
or 67FtFiFc
QLaLaLoLo
QLaLaLoLo
. . . . . . . . . .
mdsdsfsfs
)
SECTION 2 99922 44PPP QLaLaLoLo QLaLaLoLo . . . . .
SECTION 3 (Reserved)
SECTION 4 99944 987wsws QLaLaLoLo QLaLaLoLo . . . . .
SECTION 5 99955 (55TtTiTc) (555PP) QLaLaLoLo QLaLaLoLo . . . . . mdsdsfsfs
SECTION 6 88800 77e2uu (9dwdwPwPw) QLaLaLoLo (9dwdwPwPw) QLaLaLoLo . . . . . . . . . . (00C100)
79e2uu or
(9dwdwPwPw) QLaLaLoLo (9dwdwPwPw) QLaLaLoLo . . . . . Subsection 6–1 (000gpgp
76e2uu (9dwdwPwPw) QLaLaLoLo (9dwdwPwPw) QLaLaLoLo . . . . .
. . . . . (00C100))
SECTION 7 77744 . . . . . . . . . . . . . . . . . . . . . . . . . Vocabulary groups . . . . . . . . . . . . . . . . . . . . . 44777 19191

FM 46 IAC FLEET
A–88 Volume I.1
Notes:
(1) IAC FLEET is the name of the abbreviated code of the International Analysis Code used for marine purposes.
(2) The code form consists of a set of alternative preambles and a number of sections as follows:
(a) Alternative preambles Line To be used for First line Surface analysis Second line Surface prognosis (b) Sections Section
number Symbolic figure group Contents
0 99900 Pressure systems 1 99911 Frontal systems 2 99922 Isobar values 3 — (Reserved) 4 99944 Weather 5 99955 Tropical systems 6 88800 Sea temperature and waves 7 77744 Vocabulary groups
(3) Each analysis or prognosis section may be repeated as many times as necessary. Any section may be omitted from the code form.
(4) The basic code forms for Sections 0, 1 and 6 give details on pressure systems, fronts, waves and sea-surface temperatures at the time specified in the preamble. Each of these sections contains a subsection which can be used when greater detail is required on past and future positions and characteristics of those systems or parameters. These subsections are identified by the group 000gpgp; hence, they can be repeated within the section as often as necessary in order to provide information on either past or future conditions, or both.
(5) Sections 0 to 6 and the subsections each describe delineations, by means of the position groups QLaLaLoLo (or variants thereof), of given values of a parameter or given states of an element. The section thus consists of a regular succession of sets of groups, each beginning with an indicator group giving the new value of the parameter or element. In some cases the position groups of each set are followed by the movement group mdsdsfsfs and the optional group 00C100 which contains the confidence factor for the preceding information.
(6) The use of Section 5 (tropical section) does not preclude the use in the same general area of other sections, where applicable.
(7) Section 6 provides for indicating, as an optional feature, direction and period of waves for each point of a sea-surface isotherm. Each group 9dwdwPwPw refers to the position QLaLaLoLo which follows.
(8) Section 7 provides for the inclusion of amplifying phrases from a vocabulary code within the message. Section 7 also provides for including plain-language remarks at the end of the analysis or of the prognosis when this is considered necessary to emphasize the existence of a line squall.
R E G U L A T I O N S :
46.1 General The code name IAC FLEET shall not be included in the coded analysis or prognosis.
46.2 Preamble 46.2.1 The appropriate preamble shall be included each time the analysis or prognosis is made
up from a different chart for each different type.

FM 46 IAC FLEET
Volume I.1 A–89
46.2.2 Each analysis or prognosis as defined in Regulation 46.2.1 shall end with the indicator group 19191.
Note: See Regulation 46.4.3 regarding the use of replacement groups for group 33388 in the preambles.
46.3 Sections 46.3.1 Each section shall be identified by its symbolic figure group. If the same type of data is
given in two separate portions of the message, each portion constitutes a section and it shall be preceded by the appropriate symbolic figure group.
Note: When different sections, or portions of sections, are prepared at varying times, it may be necessary for an analysis centre to issue more than one coded analysis or prognosis in order to include all of the data required for its area of responsibility.
46.3.2 When included, the sections shall be given in the following order of sequence: Sections 0, 1, 2, 4, 5, 6 and 7.
46.3.3 In coding Sections 0, 1, 2, 4 and 5, the sequence order of the data, in so far as practicable, shall be as follows:
Section 0 – Pressure systems: to be given in order of occurrence from west to east.
Section 1 – Frontal information: to be given in a general run, in so far as possible, from west to east.
Section 2 – Isobar delineation: points on an isobar encircling a LOW shall be given first and progressively in cyclonic direction. Points on an isobar encircling a HIGH shall be given last and progressively in an anticyclonic direction.
Section 4 – Areas of weather: to be given in order of occurrence from west to east.
Section 5 – Tropical systems: to be given in the same order as pressure systems or frontal information, according to which one the tropical system more closely resembles.
46.4 Position groups 46.4.1 When the group 33388 is used in the preamble, point position groups shall be given in
the form QLaLaLoLo for all sections included.
46.4.2 When point positions are given in the QLaLaLoLo and a more precise location of the positions is required, the group 000LaLo shall be added after the appropriate QLaLaLoLo group, with La and Lo giving the required tenths of a degree of latitude and longitude, respectively.
46.4.3 When point positions are given to the nearest half-degree of latitude and longitude, the group 33300, 33311 or 33322, as appropriate, shall be used instead of the group 33388 in the preamble. In these cases, the group LaLaLoLok shall be substituted for the group QLaLaLoLo in the code form of all the sections included.
46.4.4 When positions in equatorial areas are given in the form LaLaLoLok (i.e. group 33322 is used), southern latitudes from 0°S to 30°S shall be indicated by subtraction from 100 (13°S = 87, 29°S = 71, etc.).
46.4.5 The position group for each pressure system (Section 0) shall be repeated, when required. Position points on fronts (Section 1), isobars (Section 2), boundaries of areas of significant weather (Section 4) and tropical systems resembling fronts (Section 5) shall be given only once.
46.4.6 If a pressure (Section 0) or tropical (Section 5) system is elongated and open, two or more position points shall be given to locate the axis of the system. The first position point and the pressure (when given in Section 5) shall refer to the vortex of the system.
Note: The position points delineating the axis of the system may be repeated, if required.

FM 46 IAC FLEET
A–90 Volume I.1
46.5 Movement groups 46.5.1 The movement group shall be given for each pressure (Section 0), frontal (Section 1) or
tropical (Section 5) system included in the message. When the system is stationary, the mdsdsfsfs group shall be coded 10000.
46.5.2 When the pressure (Section 0) or tropical (Section 5) system is elongated and open, the mdsdsfsfs group shall refer to the axis of the system.
46.5.3 When fronts (Section 1) or tropical systems resembling fronts (Section 5) are given, the mdsdsfsfs group shall refer to the central portion of the type indicated. When two or more mdsdsfsfs groups are required to indicate the movement, the front or system shall be subdivided into segments by repeating the group 66FtFiFc or 55TtTiTc, as appropriate.
46.5.4 The mdsdsfsfs group shall always indicate the movement of the system or front from the last given position.
46.6 Subsections of Sections 0, 1 and 6 46.6.1 To indicate positions and characteristics of a system or set of parameters at times prior
to the time given in the preamble, the group 9PtPcPP in Subsection 0–1, or the group 69FtFiFc in Subsection 1–1, or the group 79e2uu in Subsection 6–1 shall be used. In these cases the number of hours coded for gpgp shall be subtracted from the time given in the preamble (i.e. GcGc or GcGc + GpGp, as appropriate), to obtain the prior time.
Note: A subsection may be repeated, as required, to give information on various prior positions of the system or parameters.
46.6.2 To indicate positions and characteristics of a system or set of parameters at times after the time given in the preamble, the group 7PtPcPP in Subsection 0–1, or the group 67FtFiFc in Subsection 1–1, or the group 76e2uu in Subsection 6–1 shall be used. In these cases the number of hours coded for gpgp shall be added to the time given in the preamble (i.e. GcGc or GcGc + GpGp, as appropriate), to obtain the future time.
Note: A subsection may be repeated, as required, to give information on various future positions of the system or parameters.
46.7 Section 6 When included in Section 6 and Subsection 6–1, the group 9dwdwPwPw shall give the direction and period of the waves at the position specified by the QLaLaLoLo group which follows.
46.8 Additional groups and supplementary information 46.8.1 Amplifying phrases from a vocabulary code shall be preceded and terminated by the
appropriate indicator groups 77744 and 44777, respectively.
Note: These amplifying phrases may be inserted within the message as required.
46.8.2 If additional supplementary sections of the IAC FLEET are used for national purposes, the above code form shall be used in so far as it is applicable and the supplementary sections shall be placed at the end of the coded analysis or prognosis or sent separately.
46.9 Correction When it is necessary to send a correction to the analysis or the prognosis, the correction shall commence with the groups 11133 0YYGcGc. The corrections which follow shall be preceded by the appropriate indicators (8. . . ., 66. . ., 44. . ., etc.) and end with the 19191 group.
_____________

Volume I.1 A–91
FM 47–IX Ext. GRID Processed data in the form of grid-point values
C O D E F O R M : SECTION 0 GRID F1F2NNN 1nnntnt (2nTnTa1a2)
SECTION 1 111 1a1a1a2a2 (2p1p1p2p2) (3H1H1H1H1) (4H2H2H2H2) (5b1b1b2b2) 6JJMM 7YYGcGc (8utttt) (9ubtbtbtb) (0mmgrgr)
2QcLaLaLa 3LoLoLoLo 4QcLaLaLa 5LoLoLoLo SECTION 2 (222 1nininjnj
6QcLoLoLo (7iiii sxjjjj) (88LaLaLa QcLoLoLoLo)
9didididi 0djdjdjdj)
SECTION 3 333 1nananpis 2n1n2q1q2 (3usnrr rrrrr) (4usnrr rrrrr) (5QcLaLaLa 6LoLoLoLo) (999I0I0) k1k1ngng iaiaiajajaja (sx)II . . . I (sx)II . . . I . . . . . . . . . . (sx)II . . . I . . . . . . . . . . . . . . . . . . . . . . . . . . . . . . . . . . . (999I0I0) k1k1ngng iaiaiajajaja (sx II . . . I (sx)II . . . I . . . . . . . . . . (sx)II . . . I . . . . . . . . . . . . . . . . . . . . . . . . . . . . . . . . . . .
SECTION 4 (444 1CsCsCsCs 2CsCsCsCs 3CsCsCsCs 4CsCsCsCs 5CsCsCsCs 6CsCsCsCs)
SECTION 5 555 F1F2NNN 1nnntnt (2nTnTa1a2) 666 777
Notes:
(1) GRID is the name of the code for the transmission of processed data (analyses and forecasts of meteorological and other geophysical parameters) in the form of numerical values given for a set of regularly spaced points on a chart. The code is suitable for computer use and also for decoding by manual handling.
(2) A GRID coded analysis or forecast is identified by the word GRID.
(3) The code form is divided into six sections:
Section number Symbolic figure group Contents
0 — Identification of the coded analysis or forecast 1 111 Identification of the processed data included in the coded analysis or
forecast 2 222 Geometry of grids not published in Weather Reporting (WMO-No. 9),
Volume B (optional) 3 333 Data format specification and data content 4 444 Check sums (optional) 5 555 Redundant identification of the coded analysis or forecast and
indicator figures 666 or 777 (see Regulation 47.1.4)

FM 47 GRID
A–92 Volume I.1
(4) Definitions
Data field: The horizontal distribution of one (or several) parameter(s) and/or of the occurrence of weather phenomena described by means of grid-point values for a given geographical area.
Data group: Group that contains only meteorological or other geophysical information relative to one grid point or several consecutive grid points of a data line.
Data line: Set of consecutive grid points on a grid line for which data are reported. A grid line may contain several data lines.
Data location groups relative to a data line: Groups which indicate the serial number of the data line, the number of associated data groups and the coordinates of the grid point from which the scanning of the data line starts.
Grid line: Line connecting all grid points having the same latitude in a geographical grid or the same ordinate value in a cartesian grid (when normal scanning mode is used).
Mesh width values:
(a) Constant amount of grid-point spacing along the grid lines (on the map);
(b) Constant amount of grid-line spacing in the grid itself (on the map).
didididi and djdjdjdj represent the actual distances corresponding on the Earth’s surface to the mesh-width values when taken at a latitude of true scale. In Cartesian grids, both values are generally identical, which results in using only one mesh-width value. In geographical grids, however, these values may differ from one another. (Example: 10° spacing of longitude along parallels and 5° spacing of latitude along meridians.)
Normal scanning mode: Occurs when the sequence of grid points in the message is organized as follows:
(a) The data line(s) which correspond(s) to the smallest “j” coordinate (or to the smallest latitude difference with the reference point) within the data field (or part of it) is (are) considered first;
(b) The grid points of this (these) data line(s) are examined in the order of increasing “i” coordinate (or of increasing longitude difference with the reference point; in the special case of a geographical grid covering a circumpolar area, the longitude difference with the reference point is taken to be increasing when moving from the meridian of the reference point to the east);
(c) The grid points of the remaining data line(s) within the data field (or part of it) are examined as in (b) above, taking into account that data lines are dealt with one after the other in increasing order of their “j” coordinates (or of their latitude differences with the reference point).
Reference point in a geographical grid: Point which serves as the origin for grid-point coordinates. It is chosen in such a way as to prevent these coordinates from being negative.
(5) Section 0 is used for the identification of the coded analysis or forecast. In addition to the identifier word GRID, it contains an indication of the data-processing centre (F1F2) originating the product, of the number of parts into which the complete analysis or prognosis has been split up for transmission purposes (ntnt), as well as of the serial number of that part which is included in the coded analysis or forecast (nn), and an indication (nTnT) whether the type of parameter of the following analysis or prognosis is given by the international Code table 0291 or by a national code table. The section provides, furthermore, a reference to the grid system used (NNN). The grid identifier NNN will normally refer to Weather Reporting (WMO-No. 9), Volume B, in which full details of the grid system used will be given. It is, however, possible to provide a complete description of the grid system within the GRID message itself. Section 2 of the code form serves this purpose but it is stressed that the use of Section 2 should be reserved for the rare cases when a new grid is being introduced (e.g. for special purposes) before its complete description is published in the appropriate WMO publication.
(6) Section 1 contains information relating to the processed data transmitted in the coded analysis or forecast. This consists of:
– Meteorological or other geophysical parameters (a1a1a1, a2a2a2);
– The level(s) or layer to which the parameters refer (p1p1, p2p2, H1H1H1H1, H2H2H2H2, b1b1, b2b2);
– Time identifiers relating to the product (JJ, MM, YY, GcGc);

FM 47 GRID
Volume I.1 A–93
– The validity of prognoses (ut, ttt) and the period of data averaging or data change, as the case may be (ub, tbtbtb);
– The procedure or model used to generate the data field (mm);
– A very general description of the grid used (grgr).
(7) Section 2 is devoted entirely to the detailed description of the grid system used, whenever that description cannot be found in the appropriate WMO publication. In the GRID code, two different types of grid may be used: either geographical or cartesian. In both cases a reference point is identified and grid points are set up which are defined with respect to the reference point and to known mesh-width values. The values of the parameter(s) given in Section 3 refer to the grid points so determined. Section 2 provides for the indication of the size of the grid system (nini, njnj), the mesh widths of the grid (didididi, djdjdjdj), the boundaries of the grid system (groups with indicator figures 2, 3, 4 and 5), the coordinates of the reference point which serves for the determination of the position of the other grid points in the case of a geographical grid (groups with indicator figures 2 and 3), the origin of the cartesian coordinate system (groups 88LaLaLa, QcLoLoLoLo or groups 7iiii sxjjjj with group 6QcLoLoLo), and the direction of the axes of the cartesian coordinate system (group 6QcLoLoLo).
(8) Section 3 includes the actual data content of the coded analysis or forecast, symbolized by the data groups (sx)II . . . I. There is normally a spacing between these data groups for the convenience of manual decoding; but the spacing between these groups may be omitted if the data are exchanged only between computer centres. The characteristics of the form of the data groups, their number and the way they are arranged in the coded analysis or forecast are indicated by the first two groups of this section. It should be noted that, while the length of the data groups may vary in different coded analyses or forecasts, it remains the same within any given coded analysis or forecast.
(9) The code provides for the possibility of reporting data for grid points spaced at larger intervals than the mesh widths didididi and djdjdjdj. An increase in the mesh width didididi is indicated by the factor l0l0, while in the other direction the spacing may be increased by simply not including data for some grid lines.
(10) Furthermore, values of a parameter may not exist, may be missing or may not need to be reported at each point of a grid. For instance, the data field of sea temperatures in a grid which also covers islands in an ocean shows an empty spot (hole) at the place of an island. To avoid the inclusion of meaningless data groups for a number of grid points in such cases, the concept of "data line" was introduced. The data lines are numbered (by the symbol k1k1) and the data groups (sx)II . . . I are arranged per data line. The number of data lines per grid line and the number of data groups per data line are generally fixed if data for all grid points are reported. They may vary greatly if only parts of a data field are coded.
(11) The position of the first grid point of a data line is given by its coordinates (iaiaiajajaja) with respect to an initial point of reference. The initial point of reference in a cartesian grid is fixed. The initial point of reference in a geographical grid, as contained in Section 2 or in the appropriate WMO publication, may change in another part of the data field. For geographical grids therefore this change can be indicated by means of the groups with indicator figures 5 and 6 in Section 3.
(12) A method to reduce as much as possible the length of data groups consists in the elimination of the sign indicator of the parameters concerned. Negative signs can be eliminated by selecting another reference value as the new zero (sn, rrrrrrr), for example, when temperatures in the data field fluctuate between –20° and +20°C, the addition of 30°C to these temperatures would make them all positive. Another possibility to reduce the length of the data groups is to include the sign of the parameter(s), if necessary, in the values of the parameter(s) by a proper rule. The sign indicator may also be excluded if all values of the parameter(s) are negative. The symbolic letter is in the group with indicator 1 in Section 3 provides for these possibilities.
(13) The reporting of parameter values is generally based on the use of conventional units as indicated in the a1a1a1/a2a2a2 code table. A departure from these units can be realized, however, by using the scale factor (u) as follows: modified unit = conventional unit multiplied by the scale factor. For example, a scale factor of 0.1 can be applied to the unit for geopotential height of an isobaric topography, changing it into the standard geopotential metre.
(14) Section 4 is relevant only to computer operations. It provides numerical checks of the different sections and of the whole coded analysis or prognosis, with the object of detecting errors.
(15) Section 5 gives a redundant identification of the coded analysis or forecast.

FM 47 GRID
A–94 Volume I.1
R E G U L A T I O N S :
47.1 General 47.1.1 The groups GRID F1F2NNN 1nnntnt (2nTnTa1a2) shall be included as the first line of the
text of the coded meteorological analysis or forecast.
Note: When, in the optional group 2nTnTa1a2, nTnTa1a2 is 0000, the group shall be omitted.
47.1.2 If the complete analysis or prognosis described by the grid has to be transmitted in a number of parts separately, the text of each coded analysis or forecast shall contain Sections 0, 1, 3, 4 and 5 (see Regulations 47.2 and 47.5.1 below). The truncation shall be made in Section 3 after a suitable data line.
Note: In the case of geographical grids, the data location groups k1k1ngng iaiaiajajaja can be preceded by the groups with indicator figures 5 and 6 when a change of reference point is needed and by the group 999I0I0 as necessary.
47.1.3 If several complete analyses or forecasts are transmitted one after another in the same bulletin, each of them shall contain Sections 0, 1, 3 and 5. Sections 2 and 4 shall also be included, as required.
47.1.4 Each coded analysis or forecast shall end with the group 666 if further parts are to follow and with the group 777 if all parts have been transmitted.
47.2 Section 1 – Identification of the processed data included in the coded analysis or forecast
47.2.1 The groups with indicator figures 1, 6 and 7 shall always be included in the coded analysis or forecast; the groups with indicator figures 2, 3, 4, 5, 8, 9 and 0 are optional in the sense that none of them is necessarily included in the coded analysis or forecast. One of the groups 2p1p1p2p2, 3H1H1H1H1, 5b1b1b2b2 or the pair of groups (3H1H1H1H1 4H2H2H2H2) shall, however, always be included in the coded analysis or forecast to indicate the level(s) or the layer to which the parameter(s) given in the data content refer(s). When parameters a1a1a1/a2a2a2 = 080 to 090 are reported, the indication of the level(s) or layer is not mandatory.
47.2.2 If the parameter(s) given in the data content refer(s) to a pressure level or to a layer between two pressure levels, the group 2p1p1p2p2 shall be used to identify this (these) pressure level(s). If the parameter(s) refer(s) to a height level, the group 3H1H1H1H1 shall be used to identify this height level. If the parameter(s) refer(s) to a layer between two height levels, the groups 3H1H1H1H1 and 4H2H2H2H2 shall be used to identify these height levels. If the parameter(s) refer(s) to special level(s), the group 5b1b1b2b2 shall be used to identify this/these special level(s).
47.2.3 If only one constant pressure surface is indicated by the group 2p1p1p2p2, p2p2 shall be coded 99 and p1p1 shall specify the pressure surface concerned.
47.2.4 The group 4H2H2H2H2 shall be included only when data are transmitted for a layer between two levels of given altitude.
47.2.5 If only one special level is indicated by the group 5b1b1b2b2, b2b2 shall be coded 00 and b1b1 shall specify the special level concerned.
47.2.6 The group 8utttt shall be included only in the case of a forecast, the group 9ubtbtbtb shall be included in the case of an analysis of a mean data field or of a data-field change and in the case of a forecast of a mean data field or of a data-field change.
Note: Quantity accumulation (for instance, accumulation of precipitation) over a certain period of time is interpreted as a data-field change where the initial value is equal to zero.
47.2.7 If both mm and grgr correspond to code figure 99, the group 0mmgrgr shall not be included in the coded analysis or forecast.

FM 47 GRID
Volume I.1 A–95
47.3 Section 2 – Geometry of grids not published in Weather Reporting (WMO-No. 9), Volume B
47.3.1 Section 2 shall be included only if the grid geometry used is not defined in Weather Reporting (WMO-No. 9), Volume B.
47.3.2 Code figure 99 shall be used for grgr in Section 1 to indicate that Section 2 is not included.
47.3.3 If the complete analysis or forecast is transmitted in separate parts and Section 2 is used in the first part, this section shall not be repeated in the other parts.
47.3.4 To define a geographical grid the groups with indicator figures 1, 2, 3, 4, 5, 9 and 0 shall be used.
47.3.5 To define a cartesian grid on Mercator projection with true scale at 22°30´, the groups with indicator figures 1, 2, 3, 4, 5, 9 and 0 shall be used.
47.3.6 To define a cartesian grid, on polar stereographic projection with true scale at 60°, or on Lambert conformal projection with true scale at 30° and 60°, or at 10° and 40°, the groups with indicator figures 1, 6, 9 and 0, and the groups 7iiii sxjjjj shall be used if the origin is specified by means of the cartesian coordinates of the Pole; whenever the origin is specified by means of its geographical coordinates, the groups with indicator figures 1, 6, 9 and 0, and the groups 88LaLaLa QcLoLoLoLo shall be used.
47.3.7 In the case of a geographical grid when the area covered does not include the Pole, and in the case of a cartesian grid on Mercator projection, the groups 2QcLaLaLa and 3LoLoLoLo shall define the northern and western borders of the grid, and the groups 4QcLaLaLa and 5LoLoLoLo the southern and eastern borders of the grid. The point defined by the groups 2QcLaLaLa and 3LoLoLoLo shall be the origin of the coordinate system in the case of a cartesian grid on Mercator projection; the same point shall be the reference point in the case of a geographical grid.
47.3.8 In the case of a geographical grid covering a circumpolar area around the North Pole, the group 2QcLaLaLa shall be coded as 21900 or 27900 and the group 3LoLoLoLo shall be used to define the reference point together with the group 4QcLaLaLa; the group 4QcLaLaLa shall define also the southern border of the grid, and the group 5LoLoLoLo shall be coded as 59999. In the case of a geographical grid covering a circumpolar area around the South Pole, the group 2QcLaLaLa shall define the northern border of the grid; the group 3LoLoLoLo shall be used, together with the group 2QcLaLaLa, to define the reference point; the group 4QcLaLaLa shall be coded as 43900 or 45900; and the group 5LoLoLoLo shall be coded as 59999.
47.3.9 In the case of a cartesian grid on polar stereographic or Lambert conformal projection, the group 6QcLoLoLo shall define the quadrant and longitude in degrees of the meridian which is parallel to the j-axis of the grid, the j-axis being positive in the direction from North Pole to South Pole along this meridian. The actual longitude value should be coded for LoLoLo to indicate that the cartesian coordinate system is left-handed.* The actual longitude value increased by 500 shall be coded for LoLoLo to indicate that the cartesian coordinate system is right-handed.*
47.3.10 In the case of a cartesian grid on polar stereographic or Lambert conformal projection, the groups 7iiii and sxjjjj shall define respectively the “i” and the “j” coordinate of the Pole in grid units and tenths. The origin of the coordinate system i, j shall be placed at a corner of the rectangle, with sides parallel to the grid lines to be scanned, which encompasses all possible points in the grid.
47.3.11 The group 9didididi shall define the grid spacing in a cartesian grid along the i-axis at the latitude of true scale in km, and in a geographical grid along the latitude circles, in tenths of a degree. The group 0djdjdjdj shall similarly define the grid spacing, in a cartesian grid along the j-axis, and in a geographical grid along the meridians.
* When moving in the positive direction of the j-axis, positive “i” coordinates are situated to the left in a left-handed
coordinate system. They are found to the right in a right-handed system.

FM 47 GRID
A–96 Volume I.1
47.4 Section 3 – Data format specification and data content 47.4.1 If the complete analysis or forecast described by the grid has to be transmitted in
several parts by means of several coded meteorological analyses or forecasts of optimum length each, the groups 1nananpis and 2n1n2q1q2 and, if required, the groups with indicator figures 3 and 4 shall be included in each part.
(a) Groups 3usnrr rrrrr shall be used to indicate the scaled unit and reference value of the parameter indicated by a1a1a1 and shall be included only if the scaled unit and/or reference value used are different from those specified in Code table a1a1a1/a2a2a2 (0291).
(b) Groups 4usnrr rrrrr shall be used to indicate the scaled unit and reference value of the parameter indicated by a2a2a2 and shall be included only if the scaled unit and/or reference value used are different from those specified in Code table a1a1a1/a2a2a2 (0291).
47.4.2 When a1a1a1/a2a2a2 represent weather phenomena (code figures 080–090 of Code table 0291), the code figure for n1/n2 shall be 1, and the data content for each grid point and for each phenomenon reported shall contain one digit chosen out of (0, 1) or (0, 1 and 2) as specified in Code table 0291, to indicate the occurrence and/or the intensity of the phenomenon.
47.4.3 Whenever a change of mesh width didididi is required, a group 999l0l0 shall be inserted before the data-location groups k1k1ngng iaiaiajajaja of the data line where the change is required. In a printout of the coded analysis or forecast, the group 999l0l0 shall be printed on a separate line.
47.4.4 The values reported in the data groups II . . . I for each grid point may refer to one or two parameters and to one or two levels or to one layer. The various possible combinations and the manner in which the parameter(s) is (are) coded and the level(s) or layer defined are listed in the table on the opposite page.
47.5 Section 4 – Check sums 47.5.1 Check sum groups shall be included only by centres using computers for coding.
47.5.2 Group 1CsCsCsCs shall indicate the check sum of all digits appearing in Section 1, including the indicator figures 111.
47.5.3 Group 2CsCsCsCs shall indicate the check sum of all digits of Section 2, including the indicator figures 222.
47.5.4 Group 3CsCsCsCs shall indicate the check sum of all digits of groups 333 1nananpis together with the groups with indicator figures 2 to 6 of Section 3.

FM 47 GRID
Volume I.1 A–97
Number of parameters
reported
Number of levels to which the parameters
reported refer
Number of layers to which the parameters
reported refer
Significance of the values given in the data groups II . . . I
for each grid point
1. 1 (defined by a1a1a1)
1 (defined by p1p1 or H1H1H1H1 or b1b1)
— The value of the parameter for the level is given by n1 digits
2. 1 (defined by a1a1a1)
— 1 (defined by p1p1 and p2p2 or H1H1H1H1 and H2H2H2H2)
The value of the parameter for the layer is given by n1 digits
3. 1 (defined by a1a1a1)
2 (defined by b1b1 and b2b2)
— The value of the parameter for the level defined by b1b1 is given by n1 digits, followed by the value of the parameter for the level defined by b2b2, by n2 digits
4. 2 (defined by a1a1a1 and a2a2a2)
1 (defined by p1p1 or H1H1H1H1 or b1b1)
— The value of the parameter defined by a1a1a1 for the level is given by n1 digits, followed by the value of the parameter defined by a2a2a2 for the level, by n2 digits
5. 2 (defined by a1a1a1 and a2a2a2)
— 1 (defined by p1p1 and p2p2 or H1H1H1H1 and H2H2H2H2)
The value of the parameter defined by a1a1a1 for the layer is given by n1 digits, followed by the value of the parameter defined by a2a2a2 for the layer, by n2 digits
6. 2 (defined by a1a1a1 and a2a2a2)
2 (defined by b1b1 and b2b2)
— The value of the parameter defined by a1a1a1 for the level defined by b1b1 is given by n1 digits, followed by the value of the parameter defined by a2a2a2 for the level defined by b2b2, by n2 digits
47.5.5 Group 4CsCsCsCs shall indicate the check sum of the digits of all groups 999l0l0, k1k1ngng and iaiaiajajaja which appear in Section 3.
47.5.6 Group 5CsCsCsCs shall indicate the check sum of the digits of all data groups (sx)II . . . I which appear in Section 3.
47.5.7 Group 6CsCsCsCs shall indicate the check sum of all digits which precede this group in Section 4.
47.6 Section 5 – Redundant identification of the coded analysis or forecast and indicator figures 666 or 777
Section 5 shall always be included in the coded analysis or forecast or in parts thereof.
_____________


Volume I.1 A–99
FM 49–IX Ext. GRAF Processed data in the form of grid-point values (abbreviated code form)
C O D E F O R M : SECTION 0 GRAF F1F2NNN 1nnntnt (2nTnTa10)
SECTION 1 111 1a1a100 (2p1p1p2p2) (3H1H1H1H1) (5b1b100) 6JJMM 7YYGcGc (81ttt)
SECTION 3 333 1nana12 2n10q1q2 3usnrr rrrrr k1k1(ngng) (iaiaiajajaja) II . . . I II . . . I . . . . . . . . . . II . . . I . . . . . . . . . . . . . . . . . . . . . . . . . . . . . . . . . . . k1k1(ngng) (iaiaiajajaja) II . . . I II . . . I . . . . . . . . . . II . . . I . . . . . . . . . . . . . . . . . . . . . . . . . . . . . . . . . . .
SECTION 5 555 F1F2NNN 1nnntnt (2nTnTa10) 666 777
Notes:
(1) GRAF is the name of the abbreviated code for the transmission of processed data (analyses and prognoses of meteorological and other geophysical parameters) in the form of numerical values given for a set of regularly spaced points on a chart. The code is suitable for computer use and also for decoding by manual handling.
(2) The GRAF code form is derived from the GRID code form (FM 47) by means of a series of simplifying assumptions, i.e.:
(a) To include data for one parameter only;
(b) To relate these data to one pressure surface, or to one height level or to one special level, or to a layer between two pressure levels;
(c) Each data group refers to one grid point only;
(d) To include grids that are published in Weather Reporting (WMO-No. 9), Volume B;
(e) The terms data line and grid line are used interchangeably in the code.
(3) A GRAF coded analysis or prognosis is identified by the word GRAF.
(4) The code form is divided into four sections:
Section number Symbolic figure group Contents
0 — Identification of the coded analysis or prognosis 1 111 Identification of the processed data included in the coded analysis
or prognosis 3 333 Data format specification and data content 5 555 Redundant identification of the coded analysis or prognosis and
indicator figures 666 or 777 (see Regulation 49.1.4)
(5) Definitions – See Note (4) under FM 47 GRID.
(6) Section 0 is used for the identification of the coded analysis or prognosis. In addition to the identifier word GRAF, it contains an indication of the data-processing centre (F1F2) originating the product, of the number of parts into which the complete analysis or prognosis has been split for transmission purposes (ntnt), as well as of the serial number of that part which is included in the coded analysis or prognosis (nn), and an indication (nTnT) whether the type of parameter of the following analysis or prognosis is given by the

FM 49 GRAF
A–100 Volume I.1
international Code table 0291 or by a national code table. The section provides, furthermore, a reference to the grid system used (NNN). The grid identifier NNN will normally refer to Weather Reporting (WMO-No. 9), Volume B, in which full details of the grid system used will be given.
(7) Section 1 contains information relating to the processed data transmitted in the coded analysis or prognosis. This consists of: – One meteorological or other geophysical parameter (a1a1a1); – The level or layer to which the parameter refers (p1p1, p2p2, H1H1H1H1, b1b1); – Time identifiers relating to the product (JJ, MM, YY, GcGc); – The time of validity of prognoses that is (ttt) hours after GcGc.
(8) Section 3 includes the actual data content of the coded analysis or prognosis, symbolized by the data groups II . . . I. There is normally a space between these data groups for the convenience of manual decoding; but the space between these groups may be omitted. The characteristics of the form of the data groups and the way they are arranged in the coded analysis or prognosis are indicated by the first two groups of this section. It should be noted that, while the length of the data groups may vary in different coded analyses or prognoses, it remains the same within any given coded analysis or prognosis.
(9) The data lines are numbered (by the symbol k1k1) and the data groups II . . . I are arranged in the sequence for normal scanning.
(10) In the case of a non-rectangular grid, the position of the first grid point of a data line is given by its coordinates (iaiaiajajaja) with respect to a point of reference. The point of reference in a cartesian grid is fixed. In the case of the GRAF code, the point of reference in a geographical grid, as contained in the appropriate WMO publication, is assumed to remain fixed throughout the whole message.
(11) The reporting of parameter values is generally based on the use of conventional units as indicated in the a1a1a1 code table. A departure from these units can be realized, however, by using the scale factor (u) as follows: modified unit = conventional unit multiplied by the scale factor. For example, a scale factor of 0.1 can be applied to the conventional unit for geopotential height of an isobaric topography, changing it into the standard geopotential metre.
(12) Section 5 gives a redundant identification of the coded analysis or prognosis.
R E G U L A T I O N S :
49.1 General 49.1.1 The groups GRAF F1F2NNN 1nnntnt (2nTnTa10) shall be included as the first line of the
text of the coded meteorological analysis or prognosis.
Note: When, in the optional group 2nTnTa10, nTnTa10 is 0000, the group shall be omitted.
49.1.2 If the complete analysis or prognosis described by the grid has to be transmitted in a number of parts separately, the text of each coded analysis or prognosis shall contain Sections 0, 1, 3 and 5. The truncation shall be made in Section 3 at the end of a suitable data line.
49.1.3 If several complete analyses or prognoses are transmitted one after the other in one meteorological bulletin, each of them shall contain Sections 0, 1, 3 and 5.
49.1.4 Each coded analysis or prognosis shall end with the group 666 if further parts are to follow, and with the group 777 if all parts have been transmitted.
49.2 Section 1 – Identification of the processed data included in the coded analysis or prognosis
49.2.1 The groups with indicator figures 1, 6 and 7 shall always be included in the coded analysis or prognosis. One of the groups 2p1p1p2p2, 3H1H1H1H1 or 5b1b100 shall always be included in the coded analysis or prognosis to indicate the level or the layer to which the parameter given in the data content refers. When parameters a1a1a1 = 080 to 090 are reported, the indication of the level can be meaningless and therefore is not mandatory.

FM 49 GRAF
Volume I.1 A–101
49.2.2 If the parameter given in the data content refers to a pressure level, the group 2p1p1p2p2 shall be used; p1p1 shall indicate the level and p2p2 shall be coded 99.
49.2.3 If the parameter given in the data content refers to a layer between two pressure levels, the group 2p1p1p2p2 shall be used. The upper level shall be indicated by p1p1 and the lower level by p2p2.
49.2.4 If the parameter given in the data content refers to a special level, the group 5b1b100 shall be used and b1b1 shall indicate the special level.
49.2.5 The group 81ttt shall be included only in the case of a prognosis.
49.3 Section 3 – Data format specification and data content 49.3.1 If the complete analysis or prognosis described by the grid has to be transmitted in
several parts by means of several coded meteorological analyses or prognoses of optimum length each, the four groups 1nana12, 2n10q1q2, 3usnrr and rrrrr shall be included in each part.
49.3.2 Each data group shall refer to one grid point only. As a result, the fourth figure of the group with indicator figure 1 shall always be 1.
49.3.3 The grid points shall always be scanned in the normal mode, and q1 shall only take values 0 (spaces included between data groups) or 2 (no spaces included).
49.3.4 For a rectangular grid, each data line shall begin with k1k1 immediately followed, as the case may be, by one of the following:
(a) The data groups (q2 shall be encoded by means of code figure 2); or
(b) The number of data groups per data line, and the data groups (q2 shall be encoded by means of code figure 4); or
(c) The number of data groups per data line, the coordinates of the first grid point on the data line, and the data groups (q2 shall be encoded by means of code figure 5).
49.3.5 When a1a1a1 represents a weather phenomenon (code figures 080–090 of Code table 0291), the code figure for n1 shall be 1, and the data content for each grid point and for each phenomenon reported shall contain one digit chosen out of (0, 1) or (0, 1 and 2) as specified in Code table 0291, to indicate the occurrence and/or the intensity of the phenomenon.
49.3.6 The groups 3usnrr rrrrr shall always be included; u indicates the scaled unit of the parameter indicated by a1a1a1 and snrr rrrrr are used for the reference value. All values in the data content shall always be positive. As a result, the last figure of the group with indicator figure 1 shall always be 2. Negative values shall be eliminated by selecting an appropriate reference value. The reference values shall be chosen in order to minimize the number of digits in the data content.
Note: To illustrate this regulation, consider a temperature field in which values vary between –27°C and +11°C. The reference value can be chosen between –27°C and –88°C, inclusive. The choice of a lower temperature value would increase the number of digits to be reported (for example, –89°C, as a reference value, would convert 11°C into 100°C). For practical reasons, the choice of –30°C would be made in this case, and values to be reported would range between +3 and +41.
49.4 Section 5 – Redundant identification of the coded analysis or prognosis and indicator figures 666 or 777
Section 5 shall always be included in the coded analysis or prognosis or in parts thereof.
_____________


Volume I.1 A–103
FM 50–XIII WINTEM Forecast upper wind and temperature for aviation
C O D E F O R M : SECTION 0
WINTEM
YFYFGFGFgFgF
KMH or KT or MPS
SECTION 1 La1La
1la1A Lo1Lo
1Lo1Io1B Lo
2Lo2Lo
2Io2B . . . . . LoiLo
iLoiIoiB
(TROP ntntnt ntntnt . . . . . ntntnt)
(MAXW nmnmnmdmdmfmfmfm nmnmnmdmdmfmfmfm . . . . . nmnmnmdmdmfmfmfm)
Fn1n1n1 ddfffSTT ddfffSTT . . . . . ddfffSTT Fn2n2n2 ddfffSTT ddfffSTT . . . . . ddfffSTT . . . . . . . . . . . . . . . . . . . . . . . . .
Fnknknk ddfffSTT ddfffSTT . . . . . ddfffSTT La
2La2la2A
(TROP ntntnt ntntnt . . . . . ntntnt)
(MAXW nmnmnmdmdmfmfmfm nmnmnmdmdmfmfmfm . . . . . nmnmnmdmdmfmfmfm) Fn1n1n1 ddfffSTT ddfffSTT . . . . . ddfffSTT
Fn2n2n2 ddfffSTT ddfffSTT . . . . . ddfffSTT . . . . . . . . . . . . . . . . . . . . . . . . .
Fnknknk ddfffSTT ddfffSTT . . . . . ddfffSTT . . . . . . . . . . . . . . . . . . . . . . . . .
. . . . . . . . . . . . . . . . . . . . . . . . .
LajLa
jlajA (TROP ntntnt ntntnt . . . . . ntntnt) (MAXW nmnmnmdmdmfmfmfm nmnmnmdmdmfmfmfm . . . . . nmnmnmdmdmfmfmfm) Fn1n1n1 ddfffSTT ddfffSTT . . . . . ddfffSTT
Fn2n2n2 ddfffSTT ddfffSTT . . . . . ddfffSTT . . . . . . . . . . . . . . . . . . . . . . . . .
Fnknknk ddfffSTT ddfffSTT . . . . . ddfffSTT
Notes:
(1) WINTEM is the name of the code used to provide forecast upper wind and temperature for aviation.
(2) The forecast data are valid at the points of a rectangular geographical grid.
(3) A WINTEM message is identified by the word WINTEM.
(4) The code form is divided in two sections as follows:
Section number Contents
0 Identification and time of validity of forecast data
1 Grid-point coordinates and data groups for tropopause height, level of maximum wind and specified flight levels
(5) No aeronautical requirement for this code form is stated by ICAO for international air navigation in ICAO Annex 3/WMO Technical Regulations (WMO-No. 49), Volume II, [C.3.1].

FM 50 WINTEM
A–104 Volume I.1
R E G U L A T I O N S :
50.1 General 50.1.1 The code name WINTEM shall always be included in the message.
50.1.2 When in printed form, the format of the WINTEM message shall present the characteristics of a direct reading data table.
50.2 Section 0 50.2.1 The groups of this section shall constitute the first line of the message.
50.2.2 The group YFYFGFGFgFgF shall be immediately followed, with a space, by the unit of wind speed used and indicated by one of the letter code indicators KMH, KT or MPS, as the case may be.
Notes:
(1) KMH, KT and MPS are the standard ICAO abbreviations for kilometres per hour, knots and metres per second, respectively.
(2) The unit of wind speed used is determined by national decision. However, the primary unit prescribed in ICAO Annex 5 for wind speed is the kilometre per hour (KMH), with the knot (KT) permitted for use as a non-SI alternative unit until a termination date is decided – subject to a decision which is currently under review by ICAO.
50.3 Section 1 50.3.1 The geographical grid used shall be rectangular, i.e. its boundaries shall be delineated
by means of two meridians and two parallel circles.
50.3.2 In the message, the latitudes of grid points shall always be included at the beginning of a line and they shall follow each other in a regular sequence, starting with the northernmost grid-point latitude.
50.3.3 The longitudes of the grid points shall be included only in the first line of Section 1 and they shall be ordered from left to right in a continuous sequence corresponding to an eastward direction.
50.3.4 The nth figure group of a given line of the message, which contains forecast data, shall always refer to the grid point determined by:
(a) The latitude included in the nearest preceding line of the data group;
(b) The nth longitude included on the first line of Section 1.
50.3.5 The maximum number of grid-point longitudes included in the first line of Section 1 (i.e. index i of Lo
iLoiLo
iIoiB) shall not exceed seven.
Note: There is no limitation to the number of grid-point latitudes included in the message, except for telecommunication reasons.
50.3.6 Whenever the need arises to include more than seven grid-point longitudes in the first line of Section 1, the message shall be split up in parts, each one satisfying Regulation 50.3.5 above.
50.3.7 The data associated with a given grid point shall be included in the following order:
(a) Tropopause height;
(b) Maximum wind level;
(c) Specified flight levels arranged in decreasing order.
50.3.8 Tropopause height and/or maximum wind-level data shall be omitted whenever these data are not required for operational purposes.
50.3.9 The number of specified flight levels to be included shall be determined by the issuing centre on the basis of operational requirements.
_____________

Volume I.1 A–105
FM 51–XIV Ext. TAF Aerodrome forecast
C O D E F O R M : TAF AMD or TAF COR or TAF
CCCC
YYGGggZ
NIL or Y1Y1G1G1/Y2Y2G2G2
dddffGfmfm or CNL
KT or MPS
VVVV w’w’ or CAVOK
NsNsNshshshs or VVhshshs or NSC
(TXTFTF/YFYFGFGFZ TNTFTF/YFYFGFGFZ) PROB C2C2 or PROB C2C2 TTTTT or TTTTT or TTYYGGgg
YYGG/YeYeGeGe
dddffGfmfm
KT or MPS
VVVV or
CAVOK
w’w’ or NSW
NsNsNshshshs or VVhshshs or NSC
Notes:
(1) TAF is the name of the code for an aerodrome forecast.
(2) Owing to the variability of meteorological elements in space and time, to limitations of forecasting techniques and to limitations caused by the definitions of some of the elements, the specific value of any of the elements given in a forecast shall be understood by the recipient to be the most probable value which the element is likely to assume during the period of the forecast. Similarly, when the time of occurrence or change of an element is given in a forecast, this time shall be understood to be the most probable time.
(3) The groups enclosed in brackets are used in accordance with regional air navigation agreements.
(4) Aerodrome forecasts are dealt with in the Technical Regulations (WMO-No. 49), Volume II, [C.3.1].
(5) The code words “AMD”, “CNL”, “COR” and “NIL” shall be included, as appropriate, for amended, cancelled, corrected and missing forecasts, respectively.
R E G U L A T I O N S :
51.1 General 51.1.1 The code name TAF shall be included at the beginning of each individual aerodrome
forecast.
51.1.2 The group YYGGggZ shall be included in each individual forecast to report the date and time of origin of forecast.
51.1.3 The description of forecast conditions shall contain at least information about wind, visibility, weather and cloud or vertical visibility.
51.1.4 The forecast shall cover the period Y1Y1G1G1 to Y2Y2G2G2. The forecast period may be divided into two or more self-contained parts by the use of the time indicator group TTYYGGgg in the form of FMYYGGgg. A complete description of the forecast prevailing conditions shall be given at the beginning of the forecast or the self-contained parts designated by FMYYGGgg. If any element is expected to change significantly during the forecast period or a self-contained part thereof, one or more sets of change groups TTTTT YYGG/YeYeGeGe shall be added after the complete description of the conditions prevailing before the change. Each change group shall be followed by the modified elements subject to Regulation 51.1.5.

FM 51 TAF
A–106 Volume I.1
Notes:
(1) The governing criteria for inclusion of change groups are specified in the Technical Regulations (WMO-No. 49), Volume II, [C.3.1].
(2) See Regulation 51.8.1.
51.1.5 The group w´w´ and/or the group NsNsNshshshs or VVhshshs shall be omitted if the corresponding element(s) is (are) expected to be absent or not significant. After change groups TTTTT YYGG/YeYeGeGe, elements shall be omitted if they are not expected to differ significantly from the preceding values they possessed in the coded forecast (see Regulations 51.5.2, 51.6.1.7 and 51.6.3). However, in case of significant change of the clouds, all cloud groups, including any significant layer(s) or masses not expected to change, shall be given.
51.2 Group CCCC 51.2.1 ICAO location indicators shall be used.
51.2.2 When the same forecast in a TAF bulletin applies to more than one aerodrome, a separate forecast shall be issued for each aerodrome concerned. Only one indicator CCCC shall prefix each coded forecast.
KT 51.3 Group dddffGfmfm or MPS
51.3.1 The mean direction and speed of the forecast wind shall be indicated by dddff immediately followed, without a space, by one of the letter code indicators KT or MPS, as the case may be.
Notes:
(1) KT and MPS are the standard ICAO abbreviations for knots and metre per second, respectively.
(2) The primary unit prescribed in ICAO Annex 5 for wind speed is the metre per second (MPS), with the knot (KT) permitted for use as a non-SI alternative unit until a termination date is decided.
51.3.2 Regulations 15.5.2 and 15.5.4 shall apply.
51.3.3 ddd shall normally be encoded as VRB only when the mean wind speed is less than 1.5 m s–1 (3 knots). A variable wind at higher speeds shall be indicated only when it is impossible to forecast a single wind direction.
51.3.4 When it is forecast that the maximum wind speed will exceed the mean speed by 5 m s–1 (10 knots) or more, the maximum wind speed shall be indicated by adding Gfmfm immediately after dddff.
Note: If after a change group the wind is reported again, Gfmfm should be included, or not, in accordance with these same criteria.
51.3.5 Regulation 15.5.6 shall apply.
51.4 Group VVVV Note: The coding of visibility is based on the use of the metre and kilometre, in accordance with the units specified in ICAO Annex 5.
51.4.1 When the horizontal visibility is forecast not to be the same in different directions, the prevailing visibility shall be given for VVVV. When the prevailing visibility cannot be forecast, the group VVVV shall be used to forecast the minimum visibility.
51.4.2 Regulation 51.7 shall apply.
51.4.3 Values to indicate forecast visibility shall be in conformity with those set out in Regulation 15.6.3.

FM 51 TAF
Volume I.1 A–107
w´w´ 51.5 Group or NSW
51.5.1 Inclusion of significant forecast weather w'w', using the appropriate abbreviations in accordance with Regulation 15.8, shall be restricted to indicate:
(1) The occurrence, cessation or change in intensity of the following weather phenomena: – Freezing precipitation; – Moderate or heavy precipitation (including showers); – Duststorm; – Sandstorm; – Thunderstorm (with precipitation);
(2) The occurrence or cessation of the following weather phenomena: – Ice crystals; – Freezing fog; – Low drifting dust, sand or snow; – Blowing dust, sand or snow; – Thunderstorm (without precipitation); – Squall; – Funnel cloud (tornado or waterspout); – Other weather phenomena – given in Code table 4678 shall be included as
agreed by the meteorological authority with the air traffic services authority and operators concerned.
51.5.2 To indicate the end of significant weather phenomena w´w´, the abbreviation NSW (Nil Significant Weather) shall replace the group w´w´.
Note: See Regulation 51.8.3.
51.5.3 Regulation 51.7 shall apply.
NsNsNshshshs or 51.6 Group VVhshshs or NSC
51.6.1 Cloud amount and cloud height NsNsNshshshs
51.6.1.1 The cloud amount NsNsNs shall be given as few (1 to 2 oktas), scattered (3 to 4 oktas), broken (5 to 7 oktas) or overcast (8 oktas), using the three-letter abbreviations FEW, SCT, BKN and OVC followed, without a space, by the height of the base of the cloud layer (mass) hshshs.
51.6.1.2 Subject to Regulation 51.6.1.4, in any cloud group, NsNsNs shall be the total amount of cloud that the forecaster expects to be at the level given by hshshs.
51.6.1.3 The cloud group shall be repeated to indicate different layers or masses of cloud forecast. The number of groups shall not exceed three, except that cumulonimbus clouds and/or towering cumulus clouds, when forecast, shall always be included.
51.6.1.4 The selection of forecast layers or masses of cloud to be included shall be made in accordance with the following criteria:
1st group: the lowest individual layer (mass) of any amount, to be indicated as FEW, SCT, BKN or OVC;
2nd group: the next individual layer (mass) covering more than two oktas, to be indicated as SCT, BKN or OVC;
3rd group: the next higher individual layer (mass) covering more than four oktas, to be indicated as BKN or OVC;

FM 51 TAF
A–108 Volume I.1
Additional groups: Cumulonimbus clouds (CB) and/or towering cumulus clouds when forecast, if not already included in one of the three groups above.
The order of inclusion of the groups shall be from lower to higher levels.
51.6.1.5 The height of the base of forecast cloud layer (mass) shall be coded in units of 30 metres (100 ft) in the form hshshs.
51.6.1.6 Types of forecast clouds other than cumulonimbus clouds and towering cumulus clouds shall not be given. Cumulonimbus clouds and towering cumulus clouds when expected shall be indicated by appending the letter abbreviations CB and TCU, respectively, to the cloud group without a space. In case CB and TCU are forecast with the same height of cloud base, the cloud amount shall be the sum of the CB and TCU amounts and the cloud type given as CB.
51.6.2 Vertical visibility VVhshshs
When the sky is expected to be obscured and clouds cannot be forecast and information on vertical visibility is available, the group VVhshshs shall be used in lieu of NsNsNshshshs, where hshshs shall be the vertical visibility in units of 30 metres (hundreds of feet).
Note: See Note (1) to Regulation 15.9.2.
51.6.3 Cloud information shall be limited to cloud of operational significance, i.e. cloud below 1 500 metres (5 000 ft) or below the highest minimum sector altitude, whichever is greater, and cumulonimbus and/or towering cumulus whenever forecast. In applying this limitation, when no cumulonimbus and no towering cumulus and no cloud below 1 500 m (5 000 ft) or below the highest minimum sector altitude, whichever is greater, are forecast, and CAVOK is not appropriate, the abbreviation NSC shall be used.
51.6.4 Regulation 51.7 shall apply.
51.7 Code word CAVOK When it is expected that the following conditions will apply simultaneously, the code word CAVOK shall be included in place of the groups VVVV, w´w´ and NsNsNshshshs or VVhshshs:
(a) Visibility: 10 km or more;
(b) No cloud below 1 500 metres (5 000 ft) or below the highest minimum sector altitude, whichever is greater, and no cumulonimbus and no towering cumulus;
(c) No significant weather phenomena (see Code table 4678).
Note: See note under Regulation 15.10.
TTTTT YYGG/YeYeGeGe 51.8 Groups or TTYYGGgg
51.8.1 These groups shall be used when, during the period Y1Y1G1G1 to Y2Y2G2G2, a change in some or all of the elements forecast is expected to occur at some intermediate time YYGGgg or during the period YYGG to YeYeGeGe. Such groups shall not be introduced until all the data groups necessary to describe the elements forecast in the period Y1Y1G1G1 to Y2Y2G2G2 or YYGGgg have been given.
Notes:
(1) If the end of the forecast period is midnight, YeYe should be the date before midnight and GeGe should be indicated as 24.
(2) See Note (1) to Regulation 51.1.4.
51.8.2 The time indicator group TTYYGGgg in the form of FMYYGGgg (from YYGGgg) shall be used to indicate the beginning of a self-contained part of the forecast indicated by YYGGgg. When the group FMYYGGgg is used, all forecast conditions given before the group FMYYGGgg are superseded by the conditions indicated after the group.

FM 51 TAF
Volume I.1 A–109
51.8.3 The change groups TTTTT YYGG/YeYeGeGe in the form of BECMG YYGG/YeYeGeGe shall indicate a change in forecast meteorological conditions expected to occur at either a regular or irregular rate at an unspecified time within the period YYGG to YeYeGeGe. The duration of the period YYGG to YeYeGeGe shall normally not exceed two hours and in any case shall not exceed four hours. The change groups shall be followed by a description of all the elements for which a change is forecast. When an element is not described in data groups which follow the change groups, the description of this element for the period between Y1Y1G1G1 and Y2Y2G2G2 shall be considered to remain valid subject to Regulation 51.1.5.
Note: The conditions described after the groups BECMG YYGG/YeYeGeGe are those expected to prevail from YeYeGeGe until Y2Y2G2G2, unless a further change is expected, in which case a further set of change groups BECMG YYGG/YeYeGeGe or FMYYGGgg must be used.
51.8.4 The change groups TTTTT YYGG/YeYeGeGe in the form of TEMPO YYGG/YeYeGeGe shall indicate frequent or infrequent temporary fluctuations in forecast meteorological conditions which are expected to last less than one hour in each instance and, in the aggregate cover, less than half of the period indicated by YYGG/YeYeGeGe.
Notes:
(1) If the modified forecast condition is expected to last one hour or more, Regulation 51.8.2 or 51.8.3 applies, i.e. the change groups BECMG YYGG/YeYeGeGe or FMYYGGgg must be used at the beginning and end of the period during which conditions are expected to depart from those forecast prior to YYGG or YYGGgg.
(2) To keep forecasts clear and unambiguous, the use of change indicators should be carefully considered and kept to a minimum. In particular, the overlapping of change periods should be avoided. At any time during the period of validity of the TAF, only one possible variation in the prevailing forecast conditions should normally be indicated. The subdivision of the forecast period by FMYYGGgg should be used to avoid too complex forecasts in cases where many significant changes in weather conditions are expected to occur throughout the forecast period.
51.9 Groups PROBC2C2 YYGG/YeYeGeGe 51.9.1 In order to indicate the probability of occurrence of alternative value(s) of forecast
element(s) during a defined period of time, the groups PROBC2C2 YYGG/YeYeGeGe shall be placed directly before the alternative value(s). For C2C2, only the values 30 and 40 shall be used to indicate the probabilities 30 and 40%, respectively.
Note: A probability of less than 30% of actual values deviating from those forecast is not considered to justify the use of the group PROB. When the possibility of an alternative value is 50% or more, this should be indicated by the use of BECMG, TEMPO or FM as appropriate.
51.9.2 A probability statement may also be related to the occurrence of temporary fluctuations. In this case, the group PROBC2C2 shall be placed immediately before the change group TEMPO and the group YYGG/YeYeGeGe shall be placed after TEMPO (for example PROB30 TEMPO 2922/3001).
51.9.3 The group PROBC2C2 shall not be used in combination with the change indicator group BECMG or the time indicator group FMYYGGgg.
51.10 Group (TXTFTF/YFYFGFGFZ TNTFTF/YFYFGFGFZ) 51.10.1 To indicate forecast maximum and minimum temperatures expected to occur at the time
indicated by YFYFGFGFZ, the letter indicator TX for the maximum forecast temperature and TN for the minimum forecast temperature shall precede TFTF without a space. Up to a maximum of four temperatures shall be included, i.e., two maximum temperatures and two minimum temperatures.
51.10.2 Temperatures between –9°C and +9°C shall be preceded by 0; temperatures below 0°C shall be preceded by the letter M, that is, minus.

FM 51 TAF
A–110 Volume I.1
51.11 Amended aerodrome forecast An amended aerodrome forecast in code form shall be identified by the use of the prefix TAF AMD in place of TAF, and it shall cover the whole remaining validity period of the original TAF.
_____________
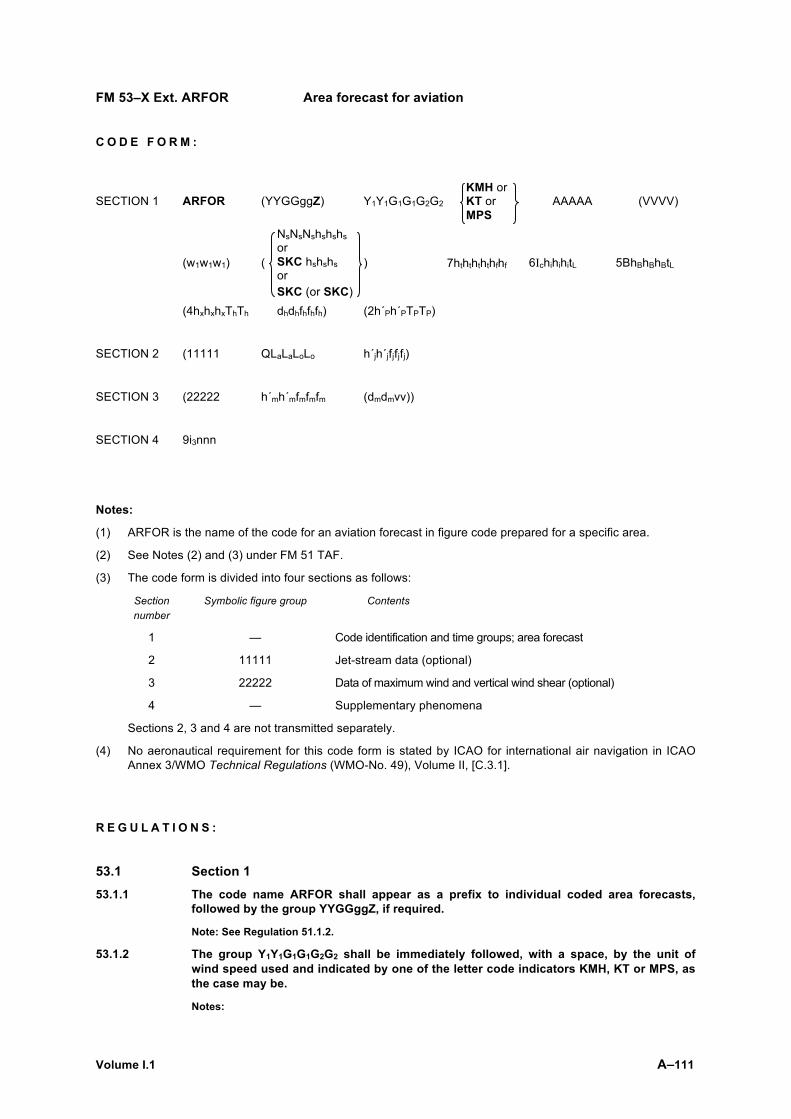
Volume I.1 A–111
FM 53–X Ext. ARFOR Area forecast for aviation
C O D E F O R M :
SECTION 1 ARFOR (YYGGggZ) Y1Y1G1G1G2G2 KMH or
KT or MPS
AAAAA (VVVV)
(w1w1w1) (
NsNsNshshshs or SKC hshshs or SKC (or SKC)
) 7hththththfhf 6IchihihitL 5BhBhBhBtL
(4hxhxhxThTh dhdhfhfhfh) (2h´Ph´PTPTP)
SECTION 2 (11111 QLaLaLoLo h´jh´jfjfjfj)
SECTION 3 (22222 h´mh´mfmfmfm (dmdmvv))
SECTION 4 9i3nnn
Notes:
(1) ARFOR is the name of the code for an aviation forecast in figure code prepared for a specific area.
(2) See Notes (2) and (3) under FM 51 TAF.
(3) The code form is divided into four sections as follows:
Section Symbolic figure group Contents number
1 — Code identification and time groups; area forecast
2 11111 Jet-stream data (optional)
3 22222 Data of maximum wind and vertical wind shear (optional)
4 — Supplementary phenomena
Sections 2, 3 and 4 are not transmitted separately.
(4) No aeronautical requirement for this code form is stated by ICAO for international air navigation in ICAO Annex 3/WMO Technical Regulations (WMO-No. 49), Volume II, [C.3.1].
R E G U L A T I O N S :
53.1 Section 1 53.1.1 The code name ARFOR shall appear as a prefix to individual coded area forecasts,
followed by the group YYGGggZ, if required.
Note: See Regulation 51.1.2.
53.1.2 The group Y1Y1G1G1G2G2 shall be immediately followed, with a space, by the unit of wind speed used and indicated by one of the letter code indicators KMH, KT or MPS, as the case may be.
Notes:
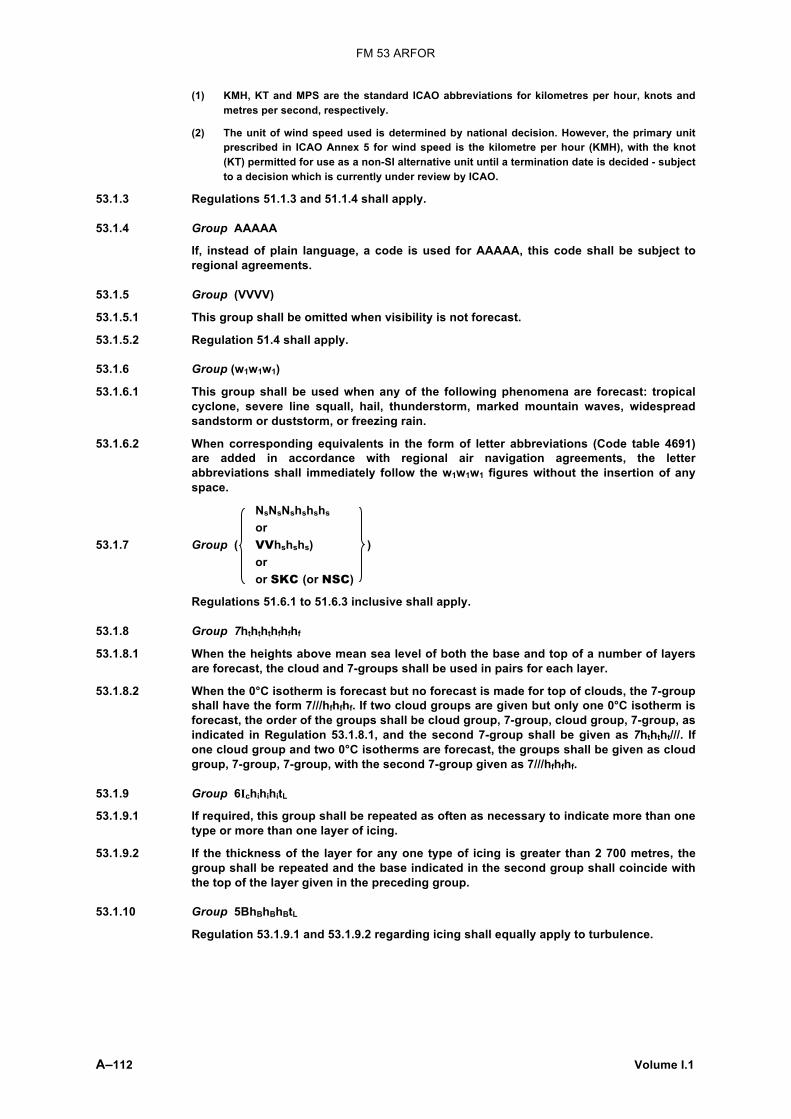
FM 53 ARFOR
A–112 Volume I.1
(1) KMH, KT and MPS are the standard ICAO abbreviations for kilometres per hour, knots and metres per second, respectively.
(2) The unit of wind speed used is determined by national decision. However, the primary unit prescribed in ICAO Annex 5 for wind speed is the kilometre per hour (KMH), with the knot (KT) permitted for use as a non-SI alternative unit until a termination date is decided - subject to a decision which is currently under review by ICAO.
53.1.3 Regulations 51.1.3 and 51.1.4 shall apply.
53.1.4 Group AAAAA
If, instead of plain language, a code is used for AAAAA, this code shall be subject to regional agreements.
53.1.5 Group (VVVV)
53.1.5.1 This group shall be omitted when visibility is not forecast.
53.1.5.2 Regulation 51.4 shall apply.
53.1.6 Group (w1w1w1)
53.1.6.1 This group shall be used when any of the following phenomena are forecast: tropical cyclone, severe line squall, hail, thunderstorm, marked mountain waves, widespread sandstorm or duststorm, or freezing rain.
53.1.6.2 When corresponding equivalents in the form of letter abbreviations (Code table 4691) are added in accordance with regional air navigation agreements, the letter abbreviations shall immediately follow the w1w1w1 figures without the insertion of any space.
NsNsNshshshs
or 53.1.7 Group ( VVhshshs) ) or or SKC (or NSC)
Regulations 51.6.1 to 51.6.3 inclusive shall apply.
53.1.8 Group 7hthththfhfhf
53.1.8.1 When the heights above mean sea level of both the base and top of a number of layers are forecast, the cloud and 7-groups shall be used in pairs for each layer.
53.1.8.2 When the 0°C isotherm is forecast but no forecast is made for top of clouds, the 7-group shall have the form 7///hfhfhf. If two cloud groups are given but only one 0°C isotherm is forecast, the order of the groups shall be cloud group, 7-group, cloud group, 7-group, as indicated in Regulation 53.1.8.1, and the second 7-group shall be given as 7hththt///. If one cloud group and two 0°C isotherms are forecast, the groups shall be given as cloud group, 7-group, 7-group, with the second 7-group given as 7///hfhfhf.
53.1.9 Group 6IchihihitL
53.1.9.1 If required, this group shall be repeated as often as necessary to indicate more than one type or more than one layer of icing.
53.1.9.2 If the thickness of the layer for any one type of icing is greater than 2 700 metres, the group shall be repeated and the base indicated in the second group shall coincide with the top of the layer given in the preceding group.
53.1.10 Group 5BhBhBhBtL
Regulation 53.1.9.1 and 53.1.9.2 regarding icing shall equally apply to turbulence.

FM 53 ARFOR
Volume I.1 A–113
53.1.11 Groups (4hxhxhxThTh dhdhfhfhfh)
These groups shall always be used together and repeated for each level for which temperature and wind are forecast.
53.1.12 Group (2h´Ph´PTPTP)
This group shall be omitted when tropopause data are not forecast.
53.2 Section 2 53.2.1 Section 2 shall be omitted when jet-stream data are not forecast.
53.2.2 The groups QLaLaLoLo h´jh´jfjfjfj shall be repeated as often as necessary to indicate the position of the jet core and the wind to be encountered in the core of a jet which extends through a large portion of the area or through several zones.
53.3 Section 3 53.3.1 When the maximum wind is forecast but no forecast is made for the vertical wind shear,
the last group of the section shall have the form dmdm//.
53.3.2 When only information for vertical wind shear is to be provided, the group h´mh´mfmfmfm is omitted from the coded forecast and the group dmdmvv shall have the form //vv.
53.4 Section 4 – Group 9i3nnn 53.4.1 The groups 91P2P2P2, 92FtLaLa, 93FtLoLo, 94FtGG, if required, shall always be placed at
the end of the relevant part of the message. The groups 92FtLaLa, 93FtLoLo, 94FtGG shall only be used to indicate the type of front, together with the position or time of passage. The type of weather during the frontal passage shall be indicated separately, e.g. by separating the forecasts into different periods, or by using the groups 96GGGp and 97GGGp, or by a combination of both methods.
53.4.2 A forecast shall cover the period extending from G1G1 to G2G2. A change group 96GGGp or 97GGGp shall be introduced when a change in some or all of the elements forecast is expected to occur at some intermediate time GG. Such a change group shall not be introduced until all the data groups necessary to describe the elements forecast in the period G1G1 to GG have been given. The change group shall be followed by a description of all the elements for which a change is forecast during the period Gp beginning at GG. When an element is not described in the data groups which follow the change group, the description of this element for the period between G1G1 and GG shall be considered to remain valid. When a group 96GGGp is used, the conditions described in the data groups which follow shall be considered to remain valid after the expiration of the time Gp. When necessary, a second change group referring to conditions at a later time GG shall be used.
Note: Plain-language equivalents which are used for the change group 9i3nnn, in accordance with regional air navigation agreements, shall be those specified in Code table 1864.
53.4.3 Group 96GGGp
53.4.3.1 The group 96GGGp, with Gp set to zero (96GG0), shall be used to indicate the beginning of a self-contained part of the forecast indicated by GG. In this case, all forecast conditions given before the group 96GG0 are superseded by the conditions indicated after the group.
53.4.3.2 The group 96GGGp, with Gp coded 1 to 4, shall be used to indicate a change in forecast meteorological conditions expected to occur at either a regular or irregular rate at an unspecified time within the period beginning at GG and indicated by Gp. The duration of the period Gp shall normally not exceed two hours and in any case shall not exceed four hours.

FM 53 ARFOR
A–114 Volume I.1
53.4.4 Group 97GGGp
The group 97GGGp, with Gp coded 1 to 9, shall be used to indicate frequent or infrequent temporary fluctuations to forecast meteorological conditions which are expected to last less than one hour in each instance and, in the aggregate cover, less than half of the period indicated by Gp. If there is a requirement for Gp greater than GG plus nine hours, the forecast period shall be divided.
Notes:
(1) If the modified forecast condition is expected to last one hour or more, Regulation 53.4.3.1 or 53.4.3.2 applies: i.e. the change group 96GGGp must be used at the beginning and end of the period during which conditions are expected to depart from those forecast prior to GG.
(2) To keep forecasts clear and unambiguous, the use of change indicators should be carefully considered and kept to a minimum. In particular, the overlapping of change periods should be avoided. At any time during the validity of the ARFOR, only one possible variation to the prevailing forecast conditions should normally be indicated. The subdivision of the forecast period by 96GG0 should be used to avoid too complex forecasts in cases where many significant changes to weather conditions are expected to occur throughout the forecast period.
53.4.5 Group 9999C2
53.4.5.1 The group 9999C2 shall be used to indicate the probability of either the occurrence of an alternative value of a forecast element or the occurrence of temporary fluctuations.
Note: A probability of less than 30% of actual values deviating from those forecast is not considered to justify the use of the group 9999C2. When the possibility of an alternative value is 50% or more, this should be indicated by the use of a group 96GGGp as appropriate.
53.4.5.2 When used to indicate the probability of occurrence of an alternative value of a forecast element, the group 9999C2 shall be followed immediately by an associated time group 99GGGp. The groups 9999C2 99GGGp, directly placed after the forecast element concerned, shall be followed immediately by the alternative value of that element.
Note: See Regulation 53.4.6.
53.4.5.3 When used to indicate the probability of occurrence of temporary fluctuations, the group 9999C2 shall be placed immediately before the change group 97GGGp.
53.4.5.4 The group 9999C2 shall not be used in combination with the change group 96GGGp.
53.4.6 Group 99GGGp
The group 99GGGp, used in combination with the probability group 9999C2, shall indicate the time period Gp beginning at GG that the alternative value of a forecast element may occur.
53.4.7 Plain-language equivalents which are used for change group 9i3nnn, in accordance with regional air navigation agreements, shall be those specified in Code table 1864.
53.5 Amended area forecast An amended area forecast in code form shall be identified by the use of the prefix ARFOR AMD in place of ARFOR, and it shall cover the whole remaining validity period of the original ARFOR.
_____________

Volume I.1 A–115
FM 54–X Ext. ROFOR Route forecast for aviation
C O D E F O R M :
SECTION 1 ROFOR (YYGGggZ) Y1Y1G1G1G2G2 KMH or
KT or MPS
CCCC (QLaLaLoLo) CCCC 0i2zzz (VVVV) (w1w1w1) NsNsNshshshs 7hthththfhfhf 6IchihihitL 5BhBhBhBtL (4hxhxhxThTh dhdhfhfhfh) (2h´Ph´PTPTP)
SECTION 2 (11111 QLaLaLoLo h´jh´jfjfjfj)
SECTION 3 (22222 h´mh´mfmf mfm (dmdmvv))
SECTION 4 9i3nnn
Notes:
(1) ROFOR is the name of the code for an aviation forecast in figure code prepared for a route between two specified aerodromes.
(2) See Notes (2) and (3) under FM 51 TAF.
(3) The code form is divided into four sections as follows:
Section Symbolic figure group Contents number
1 — Code identification and time groups; route forecast
2 11111 Jet-stream data (optional)
3 22222 Data of maximum wind and vertical wind shear (optional)
4 — Supplementary phenomena
Sections 2, 3 and 4 are not transmitted separately.
(4) No aeronautical requirement for this code is stated by ICAO for international air navigation in ICAO Annex 3/WMO Technical Regulations, Volume II, [C.3.1].
R E G U L A T I O N S :
54.1 Section 1 54.1.1 The code name ROFOR shall appear as a prefix to individual coded route forecasts,
followed by the group YYGGggZ, if required.
Note: See Regulation 51.1.2.
54.1.2 The forecast shall be considered as valid between the hours G1G1 and G2G2 at all points or in all sections along the route.
54.1.3 The group Y1Y1G1G1G2G2 shall be immediately followed, with a space, by the unit of wind speed used and indicated by one of the letter code indicators KMH, KT or MPS, as the case may be.
Notes:
(1) KMH, KT and MPS are the standard ICAO abbreviations for kilometres per hour, knots and metres per second, respectively.

FM 54 ROFOR
A–116 Volume I.1
(2) The unit of wind speed used is determined by national decision. However, the primary unit prescribed in ICAO Annex 5 for wind speed is the kilometre per hour (KMH), with the knot (KT) permitted for use as a non-SI alternative unit until a termination date is decided – subject to a decision which is currently under review by ICAO.
54.1.4 Regulations 51.1.3 and 51.1.4 shall apply.
54.1.5 In describing forecast conditions, one of the two following methods shall be used:
(a) By dividing the route into sections (i2 = 0 to 5 inclusive) and giving the details of conditions expected during the period over the extent of each section. Five-degree zones (i2 = 5) may be combined if weather elements are sufficiently uniform;
(b) By selecting series of points along the route (i2 = 6 to 9 inclusive) and forecasting the conditions at these points. Sufficient points must be selected to provide an adequate sampling of the various weather and wind conditions expected along the route.
54.1.6 Route designation
54.1.6.1 The route to which the forecast applies shall be given by the international four-letter location indicators CCCC of the aerodromes at either end of the route. Where it is desirable to specify the route in greater detail, group(s) QLaLaLoLo shall be included between CCCC groups to identify a sufficient number of additional points.
54.1.6.2 The forecast detail shall be given starting from the aerodrome of departure indicated by the first CCCC group.
54.1.6.3 The group 0i2zzz shall be used at the beginning of the forecast for each section or point.
54.1.6.4 Regulation 51.2.1 shall apply.
54.1.7 Forecast elements
Relevant aspects of Regulations 53.1.5 to 53.1.12 inclusive shall apply.
54.2 Section 2 Regulations 53.2.1 and 53.2.2 shall apply.
54.3 Section 3 Regulations 53.3.1 and 53.3.2 shall apply.
54.4 Section 4 – Group 9i3nnn 54.4.1 Regulation 53.4.1 shall apply.
54.4.2 In addition to Regulation 53.4, the groups 951//, 952LaLa, 953LaLa, 954LoLo, 955LoLo, or the corresponding plain-language alternative terminology (see Code table 1864), shall be used if it is necessary to indicate changes along the route.
54.4.3 Regulations 53.4.2 to 53.4.7 inclusive shall apply.
54.5 Amended route forecast An amended route forecast in code form shall be identified by the use of the prefix ROFOR AMD in place of ROFOR, and it shall cover the whole remaining validity period of the original ROFOR.
_____________

Volume I.1 A–117
FM 57–IX Ext. RADOF Radiological trajectory dose forecast (defined time of arrival and location)
C O D E F O R M :
SECTION 0
RADOF
F1F2YrYrGrGr AAMMJJJ hrhrhrhrih
Y0Y0G0G0
YaYaGaGagaga
Y1Y1G1G1GpGp LaLaLaLaA
IIiii* or D . . . . D** LoLoLoLoLoB
SECTION 1 11101 Y1Y1G1G1g1g1 (5nnnIS)
La1La
1La1La
1A 6XXXsnaa
Lo1Lo
1Lo1Lo
1Lo1B
(7XXXsnaa) h1h1h1h1
11102 . . . . .
Y2Y2G2G2g2g2 (5nnnIS) . . . . . . . . . .
La2La
2La2La
2A 6XXXsnaa . . . . . . . . . .
Lo2Lo
2Lo2Lo
2Lo2B
(7XXXsnaa) . . . . . . . . . .
h2h2h2h2 . . . . .
111jj YjYjGjGjgjgj (5nnnIS)
LajLa
jLajLa
jA 6XXXsnaa
LojLo
jLojLo
jLojB
(7XXXsnaa) hjhjhjhj
SECTION 2 22201 Y1Y1G1G1g1g1 izsnsisisp)
La1La
1La1La
1A Lo1Lo
1Lo1Lo
1Lo1B (hmhmhmhm
22202 . . . . .
Y2Y2G2G2g2g2 izsnsisisp) . . . . . . . . . .
La2La
2La2La
2A . . . . .
Lo2Lo
2Lo2Lo
2Lo2B
. . . . .
(hmhmhmhm . . . . .
222jj YjYjGjGjgjgj izsnsisisp)
LajLa
jLajLa
jA LojLo
jLojLo
jLojB (hmhmhmhm
Notes:
(1) RADOF is the name of the code used to provide forecast radiological trajectory dose for defined expected time of arrival and location.
(2) A RADOF message is identified by the word RADOF.
(3) The code form is divided into three sections:
Section Symbolic figure group Contents number
0 — Indications of the data-processing centre originating the forecast and time of issue, initial time of analyses/forecasts used to produce the trajectory, period of validity of radiological trajectory forecast data, and identification of incident (activity or facility involved, time and location) to which trajectory is associated
1 111jj Definition of arrival times of radiological contamination and trajectory locations (when relevant, isotope mass and element name), associated forecast radiological quantity, and data on radioactive substance concentration (total beta activity) in surface layer for each location
2 222jj Definition of times and trajectory locations, associated mixing height, stability index and category for each location
–––––––––– * Included in a fixed land station report only.
** Included in a sea or mobile land station report only.

FM 57 RADOF
A–118 Volume I.1
R E G U L A T I O N S :
57.1 General 57.1.1 The code name RADOF shall always be included at the beginning of a RADOF message.
57.1.2 When in printed form, the format of the RADOF message shall present the characteristics of a direct reading data table.
57.1.3 Use of sections
57.1.3.1 Radiological trajectory forecasts shall always contain at least Section 0 and the first five groups of Section 1.
57.1.3.2 In radiological trajectory forecasts of gamma dose in air, Section 1 shall in addition to the first five groups include the group 6XXXsnaa to give the expected radiological quantity at the forecast time and point position, in millisieverts (mSv).
57.1.3.3 In radiological trajectory forecasts of air concentration of named isotope type including gross beta, Section 1 shall in addition to the first five groups include the groups 5nnnIS 6XXXsnaa to give the isotope mass and element name and the expected radiological quantity at the forecast time and point position, in becquerels per cubic metre (Bq m–3).
57.1.3.4 When relevant data are available, the group 7XXXsnaa shall also be included to give the radioactive substance concentration (total beta activity) in the surface layer, in becquerels per cubic metre (Bq m–3).
57.1.3.5 When relevant forecast data are available, Section 2 shall be included in radiological trajectory forecasts to give the mixing height and/or stability index and category, as appropriate, for defined times and trajectory locations.
Note: Since the density of information required to be given on mixing height and stability index and category is generally more widespread, the sequence of times and forecast point positions to be included in Section 2 is not necessarily the same as in Section 1.
57.2 Section 0 57.2.1 The groups of this section shall constitute the first line of the text of the message.
57.2.2 Groups F1F2YrYrGrGr Y0Y0G0G0
The data-processing centre originating the forecast shall be indicated by F1F2 and is followed by the date and time of issue of the forecast (YrYrGrGr) and the initial date and time of analyses/forecasts used to produce the trajectory (Y0Y0G0G0) respectively.
57.2.3 Group Y1Y1G1G1GpGp
The trajectory forecast shall cover the period GpGp beginning at Y1Y1G1G1.
IIiii* 57.2.4 Groups or AAMMJJJ YaYaGaGagaga LaLaLaLaA LoLoLoLoLoB hrhrhrhrih D . . . . D**
These groups shall be included to identify the incident (activity or facility involved, time and location) to which the trajectory forecast is associated.
–––––––––– * Included in a fixed land station report only.
** Included in a sea or mobile land station report only.

FM 57 RADOF
Volume I.1 A–119
57.3 Section 1 57.3.1 The indicator of group 111jj, the expected time of arrival of contamination YjYjGjGjgjgj
and the forecast point position groups in the form LajLa
jLajLa
jA LojLo
jLojLo
jLojB hjhjhjhj
giving the latitude and longitude, in degrees and minutes, and the height above mean sea level, in metres, shall be included as the first five groups in the subsequent lines of the text of the message.
Note: Sequence number jj = 01–99 indicates the data line(s) of subsequent forecast point positions given.
57.3.2 The forecast radiological quantity 6XXXsnaa, when relevant preceded by the isotope mass and element name (5nnnIS) and followed by data on radioactive substance concentration (total beta activity) in the surface layer (7XXXsnaa), shall be included in the same data line following the point position groups.
57.3.3 If several isotopes are forecast for the same time and point position, groups 5nnnIS 6XXXsnaa shall be repeated as required.
Note: In order to keep the characteristics of a direct reading data table, in that case the time and position groups should not be repeated and be replaced by blank spaces.
57.3.4 A data line consisting of relevant groups of this section shall be repeated for different forecast trajectory point positions, as required.
57.4 Section 2 57.4.1 When relevant data are available, the indicator group 222jj, the expected time of arrival
of contamination and the forecast point position groups shall be included as the first four groups in the subsequent lines of the text of the message.
Note: See note to Regulation 57.3.1.
57.4.2 Data on mixing height (hmhmhmhm) and/or stability index and category (izsnsisisp) shall be included in the same data line following the point position groups. iz shall be encoded in accordance with Code table 1859 – Stability index, which forecast value is given by sisi modified by sn for the sign of the value; sp shall be encoded in accordance with Code table 3847 – Pasquill–Gifford stability category.
57.4.3 Regulation 57.3.4 shall apply.
_____________


Volume I.1 A–121
FM 61–IV MAFOR Forecast for shipping
C O D E F O R M : MAFOR YYG1G1/ 0AAAam GDFmWm (2VSTxTn) (3DKPwHwHw)
Note: MAFOR is the name of the code for a forecast for shipping.
R E G U L A T I O N S :
61.1 Section 1 61.1.1 The code name MAFOR shall appear as a prefix to individual coded forecasts for
shipping.
61.1.2 The code name MAFOR shall be included as the first line of the text of a meteorological bulletin of MAFOR forecasts. Individual coded forecasts in the bulletin shall not contain the code name MAFOR.
61.2 Group YYG1G1/ This group, indicating the date (day of month) and time (UTC) of the beginning of the period for which the whole forecast or set of forecasts is valid, shall not be repeated if forecasts for several areas (AAA) are given in the one message.
61.3 Group 0AAAam 61.3.1 This group shall indicate the maritime area to which the whole forecast or set of forecasts
refers.
61.3.2 If the geographical name for the forecast region is used instead of the indicator AAAam, it shall be inserted at the place of this group.
61.4 Groups 1GDFmWm (2VSTxTn) (3DKPwHwHw) 61.4.1 This set of groups shall be repeated as many times as necessary to describe the changes
in the meteorological conditions forecast in a given area, due attention being given to the need for strict economy in the number of groups used. The first group 1GDFmWm in which G = 1–8, and the following optional group(s), if used, then shall refer to the forecast weather commencing at the time given in the group YYG1G1/ and continuing through the period indicated by G. Subsequent groups 1GDFmWm (G = 1–8) shall give the period of time that the described weather is forecast to persist commencing at the end of the period covered by the preceding group 1GDFmWm (G = 1–8). If a phenomenon is forecast to occur occasionally in the same period, any set 1GDFmWm (2VSTxTn) (3DKPwHwHw) (G = 1–8) shall be followed by a group 1GDFmWm (G = 9).
Note: The specific value of any of the elements given in the forecast should be understood to be necessarily approximate and the value of the element in question should accordingly be interpreted as representing the most probable mean of a range of values which the element may assume during the period of the forecast concerned and over the area concerned.
61.4.2 Group 1GDFmWm
This group shall indicate the period of time covered by the forecast, the direction and the force of the forecast wind and the forecast weather.
61.4.3 Group (2VSTxTn)

FM 61 MAFOR
A–122 Volume I.1
This optional group shall indicate the forecasts of visibility, state of sea and extreme air temperatures.
61.4.4 Group (3DKPwHwHw)
61.4.4.1 This group shall indicate, as an optional feature, the direction, the period and the height of the forecast waves.
61.4.4.2 The direction from which the wave of longest period is travelling shall be given when waves from several directions are forecast.
_____________

Volume I.1 A–123
FM 62–VIII Ext. TRACKOB Report of marine surface observation along a ship’s track
C O D E F O R M : SECTION 1 MiMiMjMj YYMMJ SECTION 2 GGgg/
4mTmSmcic (9d0d0c0c0)
QcLaLaLaLa (6snTwTwTw)
LoLoLoLoLo
(8S0S0S0S0)
SECTION 3 D . . . . D
Notes:
(1) TRACKOB is the name of the code for reporting consecutive marine surface observations along a ship’s track.
(2) A TRACKOB report containing observations taken on the same date along a ship’s track during one day is identified by MiMiMjMj = NNXX and the group YYMMJ, and terminated by the ship’s call sign D . . . . D.
(3) A bulletin may contain several TRACKOB reports.
(4) The code is divided into three sections:
Section Symbolic figure group Contents number
1 — Data for reporting identification and date
2 — Data for reporting time, location, averaging periods, and marine surface parameters
3 — Ship’s call sign
R E G U L A T I O N S :
62.1 General The code name TRACKOB shall not be included in the report.
62.2 Section 1 Section 1 shall be included as the first line of the text in every individual report.
62.3 Section 2 62.3.1 The groups GGgg/ QcLaLaLaLa LoLoLoLoLo shall always be included in each individual
observation within a report. The ship’s position shall refer to its position at mid-point of beginning and end of observation.
62.3.2 In a TRACKOB report, the group 4mTmSmcic shall be included only for the first observation and omitted for subsequent observations for which the averaging procedures are the same. Whenever any subsequent change occurs in the averaging procedures, the first observation using the subsequent averaging procedures shall include this group.
62.3.3 When data are available, the group 9d0d0c0c0 shall be encoded 90000 if the sea-surface current speed is less than 0.05 metre per second (0.1 knot).
62.3.4 Section 2 shall be repeated as often as observations are available for a given date.

FM 62 TRACKOB
A–124 Volume I.1
62.4 Section 3 The ship’s call sign D . . . . D shall be entered at the end of a TRACKOB report and shall terminate an individual report. In the absence of a ship’s call sign, the word SHIP shall be used for D . . . . D.
62.5 A bulletin of TRACKOB reports In a bulletin of several TRACKOB reports from either the same ship or different ships, every individual TRACKOB report shall always include Sections 1, 2 and 3, and Section 2 shall conform to Regulation 62.3.4.
_____________

Volume I.1 A–125
FM 63–XI Ext. BATHY Report of bathythermal observation
C O D E F O R M : SECTION 1 MiMiMjMj YYMMJ GGgg/ QcLaLaLaLaLa LoLoLoLoLoLo (iuddff) (4snTTT)
SECTION 2 8888k1 IXIXIXXRXR z0z0T0T0T0
999zz (00000)
z1z1T1T1T1
z1z1T1T1T1 . . . . . . . .
znznTnTnTn
znznTnTnTn
SECTION 3 (66666 (1ZdZdZdZd) (k5DcDcVcVc))
SECTION 4 D . . . . D or 99999
A1bwnbnbnb
Notes:
(1) BATHY is the name of the code for reporting bathythermal observations.
(2) A BATHY report, or a bulletin of BATHY reports, is identified by MiMiMjMj (See Code table 2582).
(3) The code form is divided into four sections:
Section Symbolic figure group Contents number
1 — Identification and position data. Wind and air temperature (optional)
2 8888 Type of instrumentation and temperatures at either significant or selected depths
3 66666 Total water depth and surface current (optional)
4 — Ship’s call sign or station identification group A1bwnbnbnb or 99999
R E G U L A T I O N S :
63.1 The code name BATHY shall not be included in the report.
63.2 Section 1 63.2.1 Each individual BATHY report, even if included in a bulletin of such reports, shall
contain as the first group the identification group MiMiMjMj.
63.2.2 Groups QcLaLaLaLaLa LoLoLoLoLoLo
Position shall be reported in tenths, hundredths or thousandths of a degree, depending on the capability of the positioning system. When the position is in tenths of a degree, the groups shall be encoded as QcLaLaLa// LoLoLoLo//. When the position is in hundredths of a degree, the groups shall be encoded as QcLaLaLaLa/ LoLoLoLoLo/.
63.2.3 For the reporting of the value of the direction and speed of the wind, regulations for FM 13 SHIP shall apply.
Note: The unit of wind speed is indicated by iu (Code table 1853).

FM 63 BATHY
A–126 Volume I.1
63.3 Section 2 63.3.1 The group IXIXIXXRXR is mandatory and shall follow immediately after the 8888k1 group.
63.3.2 If temperatures are reported at significant depths, the values shall:
(a) Be sufficient to reproduce basic features of the temperature profile;
(b) Define the top and the bottom of isothermal layers;
(c) In the upper 500 metres, never be more and usually less than 20 in number, even at the cost of loss of detail.
63.3.3 The group 00000 shall be included only when the temperature at the lowest depth of the sounding, which is reported in the last temperature group, is actually the bottom layer temperature.
63.4 Section 3 63.4.1 The inclusion of this section shall be determined by national decision.
63.4.2 Group 1ZdZdZdZd shall be omitted when group 00000 is included in Section 2.
63.5 Section 4 The ship’s call sign D . . . . D, or identifier group 99999 together with the station identification group A1bwnbnbnb if not already included in the report, shall be added by the coastal radio station receiving the report, or by the national collecting centre when preparing the report for inclusion in bulletins, as appropriate and required.
Notes:
(1) See Regulation 12.1.7.
(2) See Regulation 18.2.3, Notes (1), (2) and (3).
_____________

Volume I.1 A–127
FM 64–XI Ext. TESAC Temperature, salinity and current report from a sea station
C O D E F O R M : SECTION 1 MiMiMjMj YYMMJ GGgg/ QcLaLaLaLaLa LoLoLoLoLoLo (iuddff) (4snTTT)
SECTION 2 888k1k2 IXIXIXXRXR 2z0z0z0z0 2z1z1z1z1 . . . . 2znznznzn
3T0T0T0T0
3T1T1T1T1
. . . . 3TnTnTnTn
4S0S0S0S0
4S1S1S1S1
. . . . 4SnSnSnSn
(00000)
SECTION 3 (66k6k4k3 2z0z0z0z0
2z1z1z1z1 . . . . 2znznznzn
d0d0c0c0c0
d1d1c1c1c1 . . . . . dndncncncn)
SECTION 4 (55555 1ZdZdZdZd)
SECTION 5 D . . . . D or 99999
A1bwnbnbnb
Notes:
(1) TESAC is the name of the code for reporting observations of temperature, salinity and current from a sea station.
(2) A TESAC report, or a bulletin of TESAC reports, is identified by MiMiMjMj (See Code table 2582).
(3) The code form is divided into five sections:
Section Symbolic figure group Contents number
1 — Identification and position data. Wind and air temperature (optional)
2 888 Temperatures and salinity at either significant or selected depths
3 66 Current at selected and/or significant depths (optional)
4 55555 Total water depth (optional)
5 — Ship’s call sign or station identification group A1bwnbnbnb or 99999
R E G U L A T I O N S :
64.1 The code name TESAC shall not be included in the report.
64.2 Section 1 64.2.1 Each individual TESAC report, even if included in a bulletin of such reports, shall
contain as the first group the identification group MiMiMjMj.
64.2.2 Groups QcLaLaLaLaLa LoLoLoLoLoLo
Position shall be reported in tenths, hundredths or thousandths of a degree, depending on the capability of the positioning system. When the position is in tenths of a degree, the groups shall be encoded as QcLaLaLa// LoLoLoLo//. When the position is in hundredths of a degree, the groups shall be encoded as QcLaLaLaLa/ LoLoLoLoLo/.

FM 64 TESAC
A–128 Volume I.1
64.2.3 For the reporting of the value of the direction and speed of the wind, regulations for FM 13 SHIP shall apply.
Note: The unit of wind speed is indicated by iu (Code table 1853).
64.3 Section 2
64.3.1 Group IXIXIXXRXR
This group is mandatory and shall follow immediately after the 888k1k2 group.
64.3.2 If temperatures and salinity are reported at significant depths, the values shall:
(a) Be sufficient to reproduce basic features of the temperature and salinity profile;
(b) Define the top and the bottom of isothermal/isohaline layers;
(c) In the upper 500 metres, never be more and usually less than 20 in number, even at the cost of loss of detail.
64.3.3 Both temperature and salinity shall be reported for each significant depth selected. The criteria for selecting a significant depth may be based on the characteristics of the temperature profile or the characteristics of the salinity profile. When the measurement of one of the elements at any particular depth is not available, the corresponding group shall be omitted from the report.
64.3.4 The group 00000 shall be included only when the temperature (salinity) at the lowest depth of the sounding, which is (are) reported in the last groups of the section, is (are) actually the bottom layer temperature (salinity).
64.4 Section 3 The inclusion of this section shall be determined by national decision.
64.5 Section 4 64.5.1 The inclusion of this section shall be determined by national decision.
64.5.2 This section shall be omitted when group 00000 is included in Section 2.
64.6 Section 5 The ship’s call sign D . . . . D, or identifier group 99999 together with the station identification group A1bwnbnbnb if not already included in the report, shall be added by the coastal radio station receiving the report, or by the national collecting centre when preparing the report for inclusion in bulletins, as appropriate and required.
Notes:
(1) See Regulation 12.1.7.
(2) See Regulation 18.2.3, Notes (1), (2) and (3).
_____________

Volume I.1 A–129
FM 65–XI Ext. WAVEOB Report of spectral wave information from a sea station or from a remote platform (aircraft or satellite)
C O D E F O R M :
SECTION 0 MiMiMjMj
D . . . . D or A1bwnbnbnb
or I6I6I6//
** YYMMJ GGgg/
IIiii* or QcLaLaLaLa LoLoLoLoLo**
00IaImIp 1hhhh 2HsHsHsHs 3PpPpPpPp (4HmHmHmHm) (5PaPaPaPa) (6HseHseHseHse) (7PspPspPspPsp) (8PsaPsaPsaPsa) (9dddddsds) SECTION 1 (111BTBT SSSS/
BB/// D´D´D´D´/ nfnfnfnx
BB/// nfdfdfdx)
1f1f1f1x 1fdfdfdx . . . . .
SECTION 2 (2222x CmCmCmnmnm
(or ncncn//) 1c1c1c2c2 3c3c3c4c4 . . . . . n–1cn–1cn–1cncn
SECTION 3 (3333x CsmCsmCsmnsmnsm
n–1csn–1csn–1csncsn 1cs1cs1cs2cs2 (or ncsncsn//))
3cs3cs3cs4cs4 . . . . .
SECTION 4 (4444 1da1da1da2da2
nda1da1da2da2 1r1r1r2r2 nr1r1r2r2)
2da1da1da2da2 2r1r1r2r2 . . . . .
SECTION 5 (5555Ib 1A1A1A1x
nAnAnAnx (1d1d1dsds) (ndndndsds))
2A2A2A2x (2d2d2dsds) . . . . .
Notes:
(1) WAVEOB is the name of the code for reporting spectral wave data from a sea station, or from an aircraft or satellite platform.
(2) A WAVEOB report is identified by MiMiMjMj = MMXX.
(3) The code form is divided into six sections (Sections 1 to 5 are optional). However, if any of Sections 2, 3, 4 or 5 are present, Section 1 must be present:
Section Symbolic figure group Contents number
0 — Data for reporting identification (type, buoy identifier, date, time, location), indication of frequency or wave number, method of calculation, type of station, water depth, significant wave height and spectral peak period, or wave length, and optional wave parameters
1 111 Sampling interval and duration (or length) of record, and description of measurement system bands
2 2222 Maximum non-directional spectral density from heave sensor, and ratios of individual spectral densities to the maximum value
3 3333 Maximum non-directional spectral density from slope sensor, and ratios of individual spectral densities to the maximum value
4 4444 Directional wave functions. Mean and principle wave directions and first and second normalized polar Fourier coefficients, for bands described in Section 1
5 5555 Directional or non-directional spectral estimates by frequency or wave number, as indicated, and direction with directional spread
––––––––––
* Included in a fixed sea station report only.
** Included in a sea station or remote platform report only.

FM 65 WAVEOB
A–130 Volume I.1
R E G U L A T I O N S :
65.1 General 65.1.1 The code name WAVEOB shall not be included in the report.
D . . . . D 65.1.2 Use of groups or IIiii* MiMiMjMj A1bwnbnbnb ** YYMMJ GGgg/ or or QcLaLaLaLa LoLoLoLoLo** I6I6I6//
Note: See Regulation 18.2.3, Notes (1), (2) and (3).
65.1.2.1 Each individual WAVEOB report, whether or not included in a bulletin of such reports, shall contain as the first group the identification group MiMiMjMj.
65.1.2.2 A sea station shall be indicated by either the group D . . . . D or A1bwnbnbnb. The position of a sea station shall be indicated by the groups QcLaLaLaLa LoLoLoLoLo. A satellite shall be indicated by the group I6I6I6// and an aircraft shall report ///// for I6I6I6//. A fixed sea station (other than an ocean weather station and a moored buoy), which is considered by the Member operating it to be in the same category as a land station, shall report its identification and position by means of the group IIiii.
Note: Data may be transmitted from a sea station or from a remote platform (aircraft or satellite).
65.1.2.3 In a report from a sea station (including an ocean weather station and a moored buoy), the latitude and longitude shall be encoded with the actual location of the station. In a satellite or aircraft report, the latitude and longitude shall indicate the (approximate) centre of the area observed.
65.1.3 Use of Sections 0 and 1
65.1.3.1 The first three data groups in Section 0, after the location, shall contain indicators showing if data are expressed as frequency or wave number, the method of calculation of data and type of platform, data on the water depth in metres, significant wave height in centimetres (or tenths of a metre) and spectral peak period in tenths of a second or spectral peak wave length in metres. Optional groups, when included, shall contain data on the maximum wave height, average wave period or average wave length, estimate of significant wave height from slope sensors, spectral peak wave period or peak wave length derived from slope sensors, average wave period or average wave length derived from slope sensors, and dominant wave direction and directional spread.
65.1.3.2 When used, Section 1 shall contain the section identifier, the total number of bands described in the section, the sampling interval (in tenths of a second or in metres), the duration in seconds of record of the wave or the length in tens of metres, the number (BB) of bands described in the next two groups, the first centre frequency (Hz) or first centre wave number (metres)–1, and the increment added to obtain the next centre frequency (Hz) or the next centre wave number (metres)–1 and their associated exponents.
Note: In deriving the value of the first centre frequency or wave number and increment from the groups nfnfnfnx nfdfdfdx, decimal points are assumed at the left of the numeric values. For example, for centre frequency, the groups 13004 11004 would be interpreted as a first centre frequency of 0.300 x 10⁻¹ Hz and an increment of 0.100 x 10⁻¹ Hz. (The maximum spectral density value CmCmCm
in Section 2, or CsmCsmCsm in Section 3, is coded in a similar fashion.)
65.1.3.3 Except when BB = 00, the two groups for the first centre frequency or first centre wave number, and the increment added to obtain the next centre frequency or the next centre wave number (each time preceded by BB) shall be repeated (n) times as required to describe band distribution.
Note: If sets of data groups are greater than 9, the group identifier (n) for the tenth set will be 0, the group identifier for the eleventh will be 1, etc.
––––––––––
* Included in a fixed sea station report only.
** Included in a sea station or remote platform report only.

FM 65 WAVEOB
Volume I.1 A–131
65.1.3.4 BB shall be encoded BB = 00 when no increments are given and the following (n) groups are actual centre frequencies or actual centre wave numbers.
Note: The note under Regulation 65.1.3.3 applies if data groups are greater than 9.
65.1.4 Use of Sections 2 and 3
65.1.4.1 When used, Section 2 shall contain the section identifier, an exponent associated with the first data group on the maximum value for non-directional spectra (CmCmCm) in m2 Hz–1 for frequencies or m3 for wave numbers from wave heave sensors, given as a three-digit number. The band number (nmnm) in which the maximum value for non-directional spectra occurs shall be included in the same group as the value. Subsequent groups shall contain ratios of individual spectra to the maximum (c1c1 to cncn) as a percentage (00–99), with 00 meaning either zero or 100 per cent.
Notes:
(1) See note under Regulation 65.1.3.2.
(2) Confusion between a zero ratio and the maximum ratio (100 per cent) should not arise since the band number (nmnm) for the maximum has already been identified.
65.1.4.2 Each group containing ratios shall begin with an odd number representing the unit value of the first band in the group. Thus, the number 1 shall identify values for the first and second or eleventh and twelfth or twenty-first and twenty-second, etc., bands. The last group shall contain two ratios for even numbers of bands and one ratio for odd numbers of bands. In the case of odd numbers of bands, the last two characters in the group shall be encoded as //.
65.1.4.3 When used, Section 3 shall contain the section identifier, and non-directional spectral data derived from wave slope sensors, analogous to Section 2. Regulations 65.1.4.1, with the exception of the section identifier, and 65.1.4.2 shall apply.
65.1.5 Use of Section 4
When used, Section 4 shall contain the section identifier and pairs of data groups of mean direction and principal direction from which waves are coming for the band indicated, relative to true north, in units of 4 degrees, and the first and second normalized polar coordinates derived from Fourier coefficients. The pairs of groups shall be repeated (n) times as required to describe the total number of bands given in Section 1.
Notes:
(1) The note under Regulation 65.1.3.3 applies if pairs of data groups are greater than 9.
(2) The mean direction and principal direction from which waves are coming will range from 00 (actual value 358° to less than 2°) to 89 (actual value from 354° to less than 358°). A value of 99 indicates the energy for the band is below a given threshold.
(3) Placing da1da1 and da2da2 for each band in the same group, with r1r1 and r2r2 for the same band in the next group, allows a quick visual check of the state of the sea.
(4) If da1da1 ≈ da2da2 and r1r1 > r2r2, there is a single wave train in the direction given by the common value of da1da1 and da2da2.
(5) If the coded value of | da1da1 – da2da2 | > 2 and r1r1 < r2r2, a confused sea exists and no simple assumption can be made about the direction of the wave energy.
65.1.6 Use of Section 5
When used, this section shall contain the section identifier, an indicator (Ib) indicating whether the section includes directional or non-directional data, pairs of data groups of spectral estimates of the first to the nth frequencies or wave numbers and the direction from which waves are coming in units of 4 degrees for spectral estimates (1) to (n) and their directional spread in whole degrees.
Notes:
(1) When non-directional spectra are transmitted, the group containing direction and directional spread may be omitted.

FM 65 WAVEOB
A–132 Volume I.1
(2) Complete directional spectra may be coded by repeating as many duplets as needed to define the entire spectrum. A partial directional spectrum may be coded by selecting the largest spectral estimate for any one frequency or wave number band over all directions and coding this for each frequency or wave number band. Secondary peaks may not be coded unless the full directional spectrum is transmitted.
(3) For non-directional frequency spectra, the spectral estimates are in m2 Hz–1. For non-directional wave number spectra, the spectral estimates are in m3. For a complete directional frequency spectrum, spectral estimates are in m2 Hz–1 radian–1. For a complete directional wave number spectrum, the spectral estimates are in m4. For incomplete directional spectra, whether in frequency or wave number, the units of the spectral estimates should be m2 Hz–1 or m3. That is, the total integrated energy within a frequency band is given rather than just that of the peak. If the spectral estimate is less than 0.100 x 10⁻⁵, the value of 0 must be used. The exception to this occurs when all subsequent estimates at higher frequencies are also 0, in which case only the zero immediately after the last non-zero spectral estimate need be included; all others need not be coded.
(4) There may be cases when spectral estimates are given in integrated units, such as m2, and it is necessary to convert these to the units of the code. This is done by calculating the bandwidth at a frequency by determining the frequency difference between midpoints on either side of the frequency in question. The integrated spectral estimate is then divided by this computed bandwidth.
_____________

Volume I.1 A–133
FM 67–VI HYDRA Report of hydrological observation from a hydrological station
C O D E F O R M :
SECTION 1 MiMiMjMj YYGG (000ACi) BBiHiHiH SECTION 2 22 XHsHsHsHs . . . . . . . . . . (GGgg) SECTION 3 33 XQQQeQ . . . . . . . . . . (GGgg) SECTION 4 44 tpRRRR . . . . . . . . . . SECTION 5 55 tsnTtTtTt . . . . . . . . . . SECTION 6 66 E1E1E2E2E3 DDDss
Notes:
(1) HYDRA is the name of the code for reporting hydrological observations from a hydrological observing station.
(2) A HYDRA report, or a bulletin of HYDRA reports, is identified by MiMiMjMj = HHXX.
(3) The HYDRA code form consists of six sections:
Section 1 : Identification letters, day and hour of observation, station identification (using one or two groups);
Section 2 : Hydrological data relating to stage;
Section 3 : Hydrological data relating to discharge;
Section 4 : Data relating to precipitation and snow cover;
Section 5 : Data relating to air and water temperature;
Section 6 : Data on the state of ice on the river, lake or reservoir.
Regional associations may decide which of the Sections 2, 3, 4, 5 and 6 of the code form are mandatory for the transmission of hydrological data for the international basins in the Region. Otherwise national Services may define such mandatory sections.
(4) Use of bracketed groups:
The bracketed groups are optional under certain conditions. They may or may not be included in the report as follows:
(000ACi) — The use of this group is optional when the report is destined for national needs. For international exchange the inclusion of this group in the report is mandatory;
(GGgg) — The inclusion of this group is fixed regionally, or nationally when necessary.
R E G U L A T I O N S :
67.1 General 67.1.1 The code name HYDRA shall not be included in the report.
67.1.2 The identifier groups MiMiMjMj YYGG 000ACi shall be included as the first line of the text of the bulletin consisting of HYDRA reports of observations which were made at the same time, in the same Region and country.

FM 67 HYDRA
A–134 Volume I.1
67.1.3 Identification of hydrological observing stations:
(a) In an international report the two groups 000ACi BBiHiHiH shall be used for full identification of the hydrological observing station;
(b) In a national report, the group 000ACi may be omitted.
67.1.4 In each individual report, whether it is separate or included in a bulletin, the location of the hydrological observing station shall always be defined by the group BBiHiHiH in which BB is the international indicator of the basin and iHiHiH is the identification number of the station. In addition, if the report is intended for international exchange, the group BBiHiHiH shall be preceded by the group 000ACi in the first line of the bulletin.
67.1.5 When data for a particular section are not transmitted, the indicator group of the section shall be omitted.
67.2 Sections 67.2.1 Within Sections 2, 3, 4 and 5, the groups shall be arranged in order of increasing figures of
X, tp and t.
67.2.2 If the ice condition refers to only one phenomenon, the same code figures shall be used for groups E1E1 and E2E2. If the ice condition refers to two phenomena, two different code figures shall be used for groups E1E1 and E2E2.
_____________

Volume I.1 A–135
FM 68–VI HYFOR Hydrological forecast
C O D E F O R M :
SECTION 1 HYFOR (000ACi) BBiHiHiH SECTION 2 22 FHHs1Hs1Hs1Hs1 FHHs2Hs2Hs2Hs2 M1Y1Y1G1G1 (M2Y2Y2G2G2)
SECTION 3 33 FHQ1Q1Q1eQ FHQ2Q2Q2eQ M1Y1Y1G1G1 (M2Y2Y2G2G2)
SECTION 4 44 1PiM1Y1Y1 2PiM2Y2Y2
Notes:
(1) HYFOR is the name of the code for the transmission of hydrological forecasts.
(2) The HYFOR code form consists of four sections:
Section 1 : Code name, station identification (using one or two groups);
Section 2 : Stage forecasts, and date-time of occurrence or date-times of the beginning and the end of the period for which forecasts are valid;
Section 3 : Discharge forecasts, and date-time of occurrence or date-times of the beginning and the end of the period for which forecasts are valid;
Section 4 : Forecasts of ice phenomena and dates of beginning and end of the period for which forecasts are valid.
Regional associations may decide which of the Sections 2, 3 and 4 of the code form are mandatory for the transmission of forecasts for international basins under their jurisdiction. Otherwise national Services may define such mandatory sections.
(3) Use of bracketed groups:
The bracketed groups are optional under certain conditions. They may or may not be included in the coded forecast as follows:
(000ACi) — The use of this group is optional when the forecast is destined for national needs. For international exchange the inclusion of this group in the coded forecast is mandatory;
(M2Y2Y2G2G2) — This group is used only when a hydrological forecast applies to a given period.
R E G U L A T I O N S :
68.1 General 68.1.1 The code name HYFOR shall appear as a prefix to individual forecasts.
68.1.2 The identifier groups HYFOR 000ACi shall be included as the first line of the text of the bulletin consisting of HYFOR forecasts established for the hydrological observation stations situated in the same Region and country.
68.1.3 Regulation 67.1.3 shall apply.
68.1.4 Regulation 67.1.4 shall apply.
68.1.5 When forecasts for a particular section are not transmitted, the indicator group of the section shall be omitted.

FM 68 HYFOR
A–136 Volume I.1
68.2 Sections 68.2.1 In Sections 2, 3 and 4, the groups shall be arranged in order of increasing code figures
of FH and Pi.
68.2.2 In Sections 2 and 3 and for FH = 8 or 9, one group M1Y1Y1G1G1 only shall be used to define the date of occurrence of the forecast. For FH = 1, 2, 3, 4, 5, 6 or 7, two groups M1Y1Y1G1G1, M2Y2Y2G2G2 define the beginning and the end of the period for which the forecast is expected to occur.
68.2.3 In Sections 2 and 3, the forecast value of the variable (level or discharge) is given by two successive groups beginning with the same code figure of FH. The first group shall indicate the lower and the second shall indicate the upper limits of the forecast value.
_____________

Volume I.1 A–137
FM 71-XII CLIMAT Report of monthly values from a land station
C O D E F O R M :
Notes:
(1) CLIMAT is the name of the code for reporting monthly values from a land station.
(2) The CLIMAT code form consists of five sections:
Section Symbolic figure group Contents number
0 — Code name and groups MMJJJ IIiii
1 111 Monthly data of the month referred to in MMJJJ including number of days missing from the records. This section is mandatory
2 222 Monthly normals corresponding to the month referred to in MMJJJ including number of years missing from the calculation
3 333 Number of days in the month with parameters beyond certain thresholds during the month referred to in MMJJJ
4 444 Extreme values during the month referred to in MMJJJ and occurrence of thunderstorms and hail
R E G U L A T I O N S :
71.1 General 71.1.1 When one or several parameters of a group are not available, the missing parameter(s)
shall be coded with a set of solidi (/). If all parameters of a group are not available, the group shall be omitted from the report.
71.1.2 When all parameters of a section are missing, except for Section 0 and Section 1, which are mandatory, the section shall be omitted.
71.1.3 The monthly data shall be coded in the code form which is in force during the month to which the data refer (e.g. if the CLIMAT code change is effective on 1 November, the CLIMAT data for October, transmitted in November, will be in the old code form; the first CLIMAT message in the new code form will be for November data, transmitted in December).
SECTION 0 CLIMAT MMJJJ IIiii SECTION 1 111 1P0P0P0P0 2PPPP 3snTTTststst 4snTxTxTxsnTnTnTn 5eee 6R1R1R1R1nrnr 7S1S1S1pSpSpS 8mPmPmTmTmTxmTn 9mememRmRmSmS SECTION 2 (222 0YbYbYcYc 1P0P0P0P0 2PPPP 3snTTTststst 4snTxTxTxsnTnTnTn 5eee 6R1R1R1R1nrnr 7S1S1S1 8yPyPyTyTyTxyTx 9yeyeyRyRySyS) SECTION 3 (333 0T25T25T30T30 1T35T35T40T40 2Tn0Tn0Tx0Tx0 3R01R01R05R05 4R10R10R50R50 5R100R100R150R150 6s00s00s01s01 7s10s10s50s50 8f10f10f20f20f30f30 9V1V1V2V2V3V3) SECTION 4 (444 0snTxdTxdTxdyxyx 1snTndTndTndynyn 2snTaxTaxTaxyaxyax 3snTanTanTanyanyan 4RxRxRxRxyryr 5iwfxfxfxyfxyfx 6DtsDtsDgrDgr 7iyGxGxGnGn)

FM 71 CLIMAT
A–138 Volume I.1
71.1.4 A CLIMAT bulletin shall contain reports for one specific month only.
71.2 Section 0 71.2.1 The code name CLIMAT and the groups MMJJJ IIiii shall appear as the prefix to an
individual report.
71.2.2 The code name CLIMAT and the group MMJJJ shall be included as the first line of the text of a meteorological bulletin of CLIMAT reports. In this case, individual CLIMAT reports in the bulletin shall contain neither the code name CLIMAT nor the group MMJJJ, but shall begin with the group IIiii.
71.3 Section 1 71.3.1 Group 3snTTTststst
This group shall contain both the average air temperature and the standard deviation of the daily values.
71.3.2 Group 6R1R1R1R1Rdnrnr
If for a particular month the total amount of precipitation is zero, R1R1R1R1 shall be given as 0000 and Rd given by the highest number of quintile which has 0.0 as lower limit (e.g. in months with no rainfall in the 30-year period, Rd = 5).
71.3.3 Group 7S1S1S1pSpSpS
This group shall be coded to report the total duration of sunshine in whole hours, and the percentage of the normal that that value represents (pSpSpS).
Notes:
(a) If the percentage of the normal is 1% or less but greater than zero, pSpSpS shall be coded as 001.
(b) If the normal is zero hours, pSpSpS shall be coded as 999.
(c) If the normal is not defined, pSpSpS shall be coded as 3 solidi (///).
71.4 Section 2 71.4.1 Meteorological Services shall submit to the Secretariat, for distribution to the Members,
complete normal data of the elements for stations to be included in CLIMAT bulletins. CLIMAT reports for the two months following the submission of such complete normal data to the Secretariat shall include the normals for the months in question, in the form given in Section 2. The same procedure shall be followed when Services consider it necessary to make amendments to previously published normal values.
Note: When normal data are included in the bulletins, the number of stations per bulletin may be reduced if necessary.
71.4.2 The normal data reported shall be deduced from observations made over a specific period defined by Technical Regulations.
Note: Section 2 of the code supplies the means to specify the start and finish years, and those years missing from the calculations where it is not possible to supply data for the full recommended period.
71.4.3 Group 3snTTTststst
The standard deviation ststst in this group shall be the normal of the standard deviation of the daily values.
71.4.4 Group 6R1R1R1R1nrnr
If the normal precipitation for the month is zero, the entire group shall be coded as 6000000.

FM 71 CLIMAT
Volume I.1 A–139
71.5 Section 3 If the data portion of any group is equal to zero, that group shall be omitted from the report. For example, during one 30-day month the maximum is less than 25°C on 10 days, from 25°C to 29°C on 10 days, and from 30°C to 34°C on 10 days, the first group in Section 3 shall be coded as 02010 and the second group shall not be included in the report.
71.6 Section 4 71.6.1 In groups 0, 1, 2, 3, 4 and 5, if the extreme value occurred on only one day, the day of
occurrence shall be coded as the last two digits in the group. If the extreme value occurred on more than one day, 50 shall be added to the first day and that value be coded as the last two digits in the group.
71.6.2 Group 7iyGxGxGnGn
This group shall be included only when a change in practice has occurred, that is when the time of reading of maximum temperature (GxGx) or the time of reading of minimum temperature (GnGn) has changed.
_____________

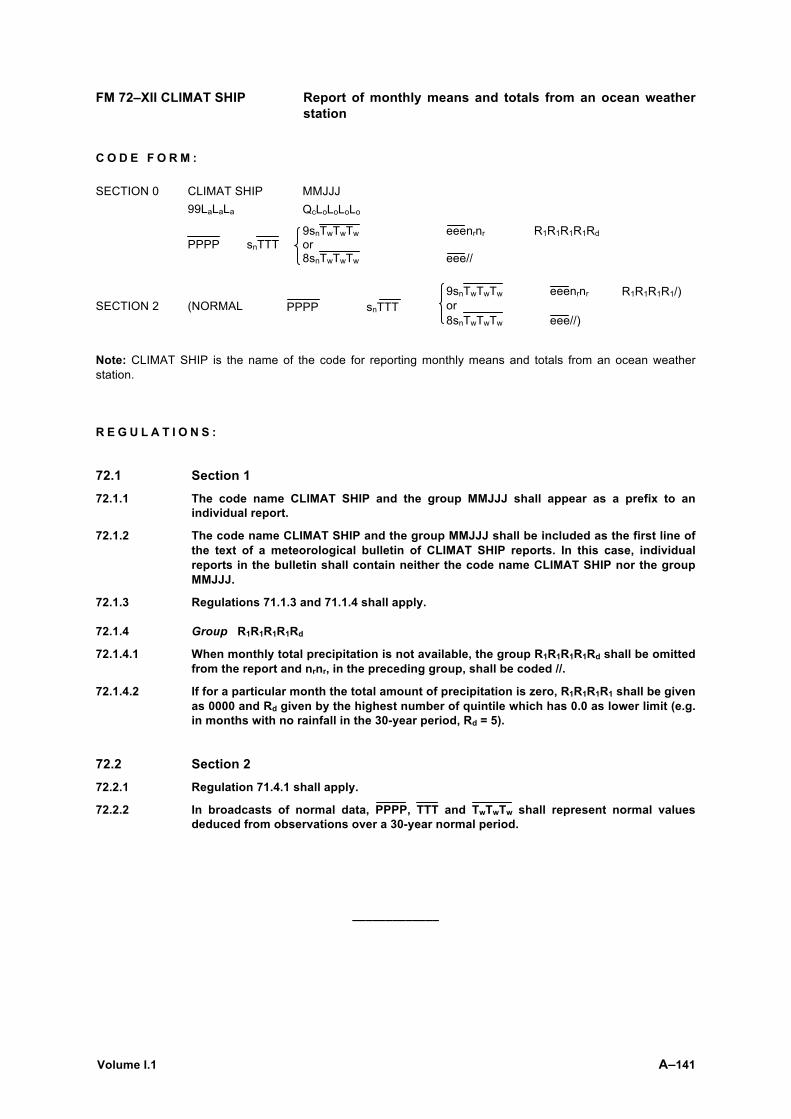
Volume I.1 A–141
FM 72–XII CLIMAT SHIP Report of monthly means and totals from an ocean weather station
C O D E F O R M :
Note: CLIMAT SHIP is the name of the code for reporting monthly means and totals from an ocean weather station.
R E G U L A T I O N S :
72.1 Section 1 72.1.1 The code name CLIMAT SHIP and the group MMJJJ shall appear as a prefix to an
individual report.
72.1.2 The code name CLIMAT SHIP and the group MMJJJ shall be included as the first line of the text of a meteorological bulletin of CLIMAT SHIP reports. In this case, individual reports in the bulletin shall contain neither the code name CLIMAT SHIP nor the group MMJJJ.
72.1.3 Regulations 71.1.3 and 71.1.4 shall apply.
72.1.4 Group R1R1R1R1Rd
72.1.4.1 When monthly total precipitation is not available, the group R1R1R1R1Rd shall be omitted from the report and nrnr, in the preceding group, shall be coded //.
72.1.4.2 If for a particular month the total amount of precipitation is zero, R1R1R1R1 shall be given as 0000 and Rd given by the highest number of quintile which has 0.0 as lower limit (e.g. in months with no rainfall in the 30-year period, Rd = 5).
72.2 Section 2 72.2.1 Regulation 71.4.1 shall apply.
72.2.2 In broadcasts of normal data, PPPP, TTT and TwTwTw shall represent normal values deduced from observations over a 30-year normal period.
_____________
SECTION 0 CLIMAT SHIP MMJJJ 99LaLaLa QcLoLoLoLo
PPPP snTTT
9snTwTwTw or 8snTwTwTw
eeenrnr
eee//
R1R1R1R1Rd
SECTION 2 (NORMAL PPPP snTTT 9snTwTwTw or 8snTwTwTw
eeenrnr eee//)
R1R1R1R1/)


Volume I.1 A–143
NACLI CLINP FM 73–VI SPCLI Report of monthly means for an oceanic area CLISA INCLI
C O D E F O R M : NACLI or CLINP or SPCLI or CLISA or INCLI
MMJJJ
LaLaLoLon P1P1P2P2P3 P3P4P4P5P5 . . . . . . . . . .
L´aL´aL´oL´on´ P´1P´1P´2P´2P´3 P´3P´4P´4P´5P´5 . . . . . . . . . .
L´´aL´´aL´´oL´´on´´ P´´1P´´1P´´2P´´2P´´3 P´´3P´´4P´´4P´´5P´´5 . . . . . . . . . .
. . . . . . . . . . . . . . .
Note: The code names NACLI, CLINP, SPCLI, CLISA and INCLI are the names of the code for reporting monthly means for the following oceanic areas:
NACLI for the North Atlantic; CLINP for the North Pacific; SPCLI for the South Pacific; CLISA for the South Atlantic; INCLI for the Indian Ocean.
R E G U L A T I O N S :
73.1 The appropriate code name (NACLI, CLINP, etc.) and the group MMJJJ shall appear as a prefix to individual reports.
73.2 The appropriate code name (NACLI, CLINP, etc.) and the group MMJJJ shall be included as the first line of the text of a meteorological bulletin of such reports. Individual reports in the bulletin shall contain neither the code names nor the group MMJJJ.
73.3 When monthly means for oceanic areas are issued, they shall be reported in the form above as soon as possible after the end of the month.
73.4 The monthly mean data shall be coded in the code form which is in force during the month to which the data refer.
73.5 Groups P1P1P2P2P3 P3P4P4P5P5 73.5.1 For the zone between latitudes 20°N and 20°S, the pressure shall be given in tenths of a
hectopascal; for other zones, it shall be given in whole hectopascals.
73.5.2 Every position group LaLaLoLon, L´aL´aL´oL´on´, etc., shall be followed by groups of the form P1P1P2P2P3, P3P4P4P5P5, . . . , P´1P´1P´2P´2P´3, P´3P´4P´4P´5P´5, . . . , etc.
74.5.3 The first pressure P1P1 shall be the mean monthly pressure at mean sea level for the point of intersection of the parallel and the meridian specified by LaLa and LoLo in the preceding position group.

FM 73 NACLI, CLINP, SPCLI, CLISA, INCLI
A–144 Volume I.1
73.5.4 The pressures following, i.e. P2P2, P3P3, . . . , etc., shall be the values of the mean monthly pressure on the same parallel LaLa, but at points LoLo ± 5°, LoLo ± 10°, . . . , etc. The number given for n shall specify the number of the points on the parallel for which pressure is given.
Note: The succession of points for which pressures are given is in the direction east-west or west-east, the convenient direction for the ocean concerned being chosen. In Weather Reporting (WMO-No. 9), Volume C, this direction is specified in every case.
_____________

Volume I.1 A–145
FM 75–XII Ext. CLIMAT TEMP Report of monthly aerological means from a land station
FM 76–XII Ext. CLIMAT TEMP SHIP Report of monthly aerological means from a ocean weather station
C O D E F O R M : CLIMAT TEMP CLIMAT TEMP SHIP
MMJJJ MMJJJ
IIiii* or 99LaLaLa
QcLoLoLoLo**
gP0P0P0T0 T0T0D0D0D0
H1H1H1H1nT1 nT1T1T1T1D1 D1D1nv1rf1rf1 dv1dv1dv1fv1fv1
H2H2H2H2nT2 nT2T2T2T2D2 D2D2nv2rf2rf2 dv2dv2dv2fv2fv2
. . . . . . . . . . . . . . . . . . . .
HnHnHnHnnTn nTnTnTnTnDn DnDnnvnrfnrfn dvndvndvnfvnfvn
Note: CLIMAT TEMP is the name of the code for reporting monthly aerological mean values from a land station. CLIMAT TEMP SHIP is the name of the code for reporting monthly aerological means from an ocean weather station.
R E G U L A T I O N S :
75.1 The code name CLIMAT TEMP or CLIMAT TEMP SHIP and the group MMJJJ shall appear as a prefix to an individual report.
Note: MM shall be used to indicate the unit of wind speed in addition to indicating the month. When wind speeds are given in knots, 50 shall be added to MM. When the speed is given in metres per second, MM shall not be modified.
75.2 The code name CLIMAT TEMP or CLIMAT TEMP SHIP together with the group MMJJJ shall be included as the first line of the text of a meteorological bulletin of CLIMAT TEMP or CLIMAT TEMP SHIP reports. In this case, individual reports in the bulletin shall contain neither the code names nor the code group MMJJJ.
75.3 The monthly mean data shall be coded in the code form which is in force during the month to which the data refer.
75.4 The monthly mean values of the upper-level element shall include information for station level and for the isobaric surfaces of 850, 700, 500, 300, 200, 150, 100, 50 and 30 hPa, if available. Solidi (/////) shall be reported for any missing value in the groups of a level for which any element or all are not available. No group shall be omitted at any level. Any missing element shall be reported by solidi.
75.5 The mean values of station-level pressure, temperature and dew-point depression shall be the monthly mean values at the time of release of the radiosonde.
––––––––––
* Used in FM 75 only.
** Used in FM 76 only.

FM 75 CLIMAT TEMP, FM 76 CLIMAT TEMP SHIP
A–146 Volume I.1
H1H1H1H1nT1 75.6 Groups H2H2H2H2nT2 . . . . . HnHnHnHnnTn
In the case of geopotentials above 9999 standard geopotential metres, the figures indicating the number of tens of thousands shall be omitted.
dv1dv1dv1fv1fv1 75.7 Groups dv2dv2dv2fv2fv2 . . . . . dvndvndvnfvnfvn
75.7.1 The mean vector wind group shall be included in the message for all the reported isobaric surfaces. Solidi (/////) shall be reported for this group if the monthly mean vector wind is not computed for a reported isobaric surface.
75.7.2 To indicate wind speeds of three digits, i.e. of 100 to 199 knots inclusive, 500 shall be added to dv1dv1dv1, etc.
75.8 A CLIMAT TEMP or CLIMAT TEMP SHIP bulletin shall contain reports for one specific month only.
_____________

Volume I.1 A–147
FM 81–I SFAZI Synoptic report of bearings of sources of atmospherics
C O D E F O R M :
SFAZI (999II) iiiGG F1IjD1D1D1 F2IjD2D2D2 . . . . . Note: SFAZI is the name of the code for reporting the bearings of sources of atmospherics.
R E G U L A T I O N S :
81.1 The code name SFAZI shall appear as a prefix to an individual report.
81.2 The code name SFAZI shall be included as the first line of the text of a meteorological bulletin of SFAZI reports. In this case, individual reports in the bulletin shall not contain the code name.
81.3 Groups F1IjD1D1D1 F2IjD2D2D2 . . . . . 81.3.1 As many groups as necessary shall be included to describe the different sources.
Note: Stations are grouped into appropriate networks, each network with a coordinating centre, by arrangement among the Members concerned.
81.3.2 The centre axis shall be reported to the nearest degree.
81.4 Reports shall refer to observation periods terminating at the hours 0000, 0300, 0600, 0900, 1200, 1500, 1800 and 2100 UTC and data shall be transmitted for as many of these periods as possible, in addition to any daily summary (FM 83).
81.5 Reports shall be transmitted not later than three hours after the time to which the observations refer.
_____________


Volume I.1 A–149
FM 82–I SFLOC Synoptic report of the geographical location of sources of atmospherics
C O D E F O R M :
SFLOC
66600 or 66611 or 66666
GGx4aiAi
9nfx4aiAi LaLaLoLok LaLaLoLok
. . . . .
. . . . .
Note: SFLOC is the name of the code for reporting geographical location of sources of atmospherics.
R E G U L A T I O N S :
82.1 The code name SFLOC shall appear as a prefix to an individual report.
82.2 The code name SFLOC shall be included as the first line of the text of a meteorological bulletin of SFLOC reports. In this case, individual reports in the bulletin shall not contain the code name.
82.3 The first group shall indicate the method used for observations as follows:
66600 shall indicate that atmospherics are located by means of a network of several direction-finders operating on the same individual atmospherics;
66611 shall indicate that atmospherics are located by means of a network of several arrival-time stations operating on the same individual atmospherics;
66666 shall indicate that atmospherics are located by means of a single-station range-bearing technique.
82.4 As many sections as necessary, beginning with 9-indicator groups, are included to describe the different sources.
82.5 Regulations 81.3.1, 81.4 and 81.5 shall apply.
_____________


Volume I.1 A–151
FM 83–I SFAZU Detailed report of the distribution of sources of atmospherics by bearings for any period up to and including 24 hours
C O D E F O R M : SFAZU IIiii YG1G1G2G2
999NI g1g1D´1D´1D´1 g2g2D´2D´2D´2
999NI g1g1D´1D´1D´1 g2g2D´2D´2D´2 . . . . .
Note: SFAZU is the name of the code for reporting the distribution of sources of atmospherics by bearings for any period of time up to and including 24 hours.
R E G U L A T I O N S :
83.1 The code name SFAZU shall appear as a prefix to an individual report.
83.2 The code name SFAZU shall be included as the first line of the text of a meteorological bulletin of SFAZU reports. In this case, individual reports in the bulletin shall not contain the code name.
83.3 As many sections, beginning with 999-indicator groups, as necessary shall be included to describe the different sources.
83.4 Regulation 81.3.1 shall apply.
83.5 Summaries referring to the preceding 24-hour period shall be issued once daily.
_____________


Volume I.1 A–153
FM 85–IX Ext. SAREP Report of synoptic interpretation of cloud data obtained by a meteorological satellite
C O D E F O R M :
Part A
MiMiMjMj
YYGGg
Iliii or 99LaLaLa
QcLoLoLoLo
Name of cyclone ntntLaLaLa
D . . . . D
QcLoLoLoLo 1AtWfattm 2StSt// (9dsdsfsfs)
Part B
SECTION 1
MiMiMjMj
YYGsGsgs
Iliii or 99LaLaLa
QcLoLoLoLo
Name of satellite QLaLaLoLo QLaLaLoLo . . . . . . . . . .
SECTION 2 4SfSfCmWf QLaLaLoLo . . . . . (9dsdsfsfs)
SECTION 3 (96/// /Lddf QLaLaLoLo /Lddf QLaLaLoLo
. . . . . . . . . . /Lddf QLaLaLoLo)
SECTION 4 (97//sc QLaLaLoLo QLaLaLoLo . . . . . etc.)
SECTION 5 51515 Code groups to be developed regionally
D . . . . D
Notes:
(1) SAREP is the name of the code for reporting synoptic interpretation of cloud data obtained by a meteorological satellite.
(2) A SAREP report from a land station is identified by MiMi = CC, a SAREP report from a sea station by MiMi = DD.
(3) The code form is divided into two parts:
Part Identifier letters (MjMj) Contents
A AA Information on tropical cyclone
B BB Information on significant features
Each part can be transmitted as a separate message.
(4) Part B is divided into five sections:
Section Indicator figures or Contents number symbolic figure
1 — Identification and position data
2 4 Synoptic interpretation of cloud
3 96 Wind information derived from the movement of cloud elements (optional)
4 97 Snow or ice information (optional)
5 51515 Code groups to be developed regionally

FM 85 SAREP
A–154 Volume I.1
R E G U L A T I O N S :
85.1 General 85.1.1 The code name SAREP shall not be included in the report.
85.1.2 The satellite read-out station which originates the report shall indicate its position by means of the group IIiii or the groups 99LaLaLa QcLoLoLoLo.
85.1.3 The ship’s call sign D . . . . D shall be included only in SAREP reports from a satellite readout station at sea.
85.2 Part A 85.2.1 For the reporting of the interpretation of cloud mass which is recognized as pertaining
to a tropical cyclone, Part A shall be used.
85.2.2 The time of the picture of the cyclone(s) shall be encoded by the group YYGGg.
85.2.3 Whenever available the name of the cyclone shall be included.
85.2.4 Tropical cyclones shall be numbered by successive numerals ntnt. The station originating SAREP reports shall maintain the number assigned to the cyclone as long as it exists or can be identified.
85.2.5 The position of the centre of the cloud mass or the tropical cyclone or the eye of the cyclone, as appropriate, shall be reported by means of the groups ntntLaLaLa QcLoLoLoLo.
85.2.6 The movement of the centre of the tropical cyclone, when known, shall be included in the report by means of the group 9dsdsfsfs.
85.2.7 When two or more tropical cyclones are detected on the same photograph and thereby given the same time, the groups ntntLaLaLa QcLoLoLoLo 1AtWfattm 2StSt// (9dsdsfsfs) shall be repeated for each cyclone, preceded by the name whenever it is known.
85.3 Part B
85.3.1 Section 1 – Identification and position data
85.3.1.1 The name of the satellite on which the SAREP report is based shall be included in Section 1.
85.3.1.2 The groups QLaLaLoLo shall be used to delineate, in clockwise sequence, the analysed area.
85.3.1.3 The first position group shall be repeated.
85.3.2 Section 2 – Synoptic interpretation of cloud
85.3.2.1 Code groups beginning with the indicator figure 4 shall be used for a description of the synoptic interpretation of significant features.
85.3.2.2 The groups QLaLaLoLo shall be used to delineate the significant features SfSf, except when SfSf is coded as 99. In this case, the position groups shall refer to the cloud pattern indicated by Cm.
85.3.2.3 For delineating areas in Section 2, the same rules shall be followed as indicated under Section 1. When it is used in conjunction with Wf, the position group may refer to a nearly circular cloud mass or cloud band. In the case of a nearly circular cloud mass, the position group refers to the centre of the mass. In the case of a cloud band, the position groups refer to a line centrally located along the length of the band.
85.3.2.4 The movement of the system under consideration, when known, shall be included in the report by means of the group 9dsdsfsfs.
85.3.2.5 Section 2 shall be used only to describe major synoptic-scale significant features or cloud masses. Mesoscale or more detailed descriptions shall be included in Section 5, their reporting being left to regional decision.

FM 85 SAREP
Volume I.1 A–155
85.3.3 Section 3 – Wind information derived from the movement of cloud elements
Section 3 shall be used only by centres or stations having highly trained staff and computer facilities.
85.3.4 Section 4 – Snow or ice information
85.3.4.1 Section 4 shall be included only once a week or when major changes in snow cover or ice extension are observed, provided snow or ice information is available.
85.3.4.2 For delineating areas in Section 4, the same rules shall be followed as indicated under Section 1.
85.3.5 Section 5 – Code groups to be developed regionally
Detailed or mesoscale description of cloud information which is required to be reported shall be included in Section 5.
_____________


Volume I.1 A–157
FM 86–XI SATEM Report of satellite remote upper-air soundings of pressure, temperature and humidity
C O D E F O R M :
Part A
SECTION 1 MiMiMjMj YYGG/ I6I6I6I3I4 F3F3F3F4F4F4
SECTION 2 222 QLaLaLoLo (NcNcPcPcPc)
SECTION 3 (333 PAPAnLnLq P1P1tL1tL1tL1
P2P2tL2tL2tL2
. . . . PnPntLntLntLn)
SECTION 4 (444 PAPAnLnLq P1P1wL1wL1wL1
P2P2wL2wL2wL2 . . . . PnPnwLnwLnwLn)
SECTION 5 (555 snT0T0TtTt (PtPtPtI5At))
Part B
SECTION 1 MiMiMjMj YYGG/ I6I6I6I3I4 F3F3F3F4F4F4
SECTION 2 222 QLaLaLoLo (NcNcPcPcPc)
SECTION 5 (555 snT0T0TtTt (PtPtPtI5At))
SECTION 6 (666 P1P1PnPnup
P1P1PnPnup nuATTTTa
nuATTTTa
nuATTTTa
. . . . )
SECTION 7 (777 P1P1PnPnup nuAwwww nuAwwww . . . . )
Part C
SECTION 1 MiMiMjMj YYGG/ I6I6I6I3I4 F3F3F3F4F4F4
SECTION 2 222 QLaLaLoLo
SECTION 3 333 PAPAnLnLq P1P1tL1tL1tL1
P2P2tL2tL2tL2 . . . . PnPntLntLntLn
Part D
SECTION 1 MiMiMjMj YYGG/ I6I6I6I3I4 F3F3F3F4F4F4
SECTION 2 222 QLaLaLoLo
SECTION 6 666 P1P1PnPnup nuATTTTa
nuATTTTa
. . . .

FM 86 SATEM
A–158 Volume I.1
Notes:
(1) SATEM is the name of the code for reporting satellite remote upper-air soundings of pressure, temperature and humidity
(2) A SATEM report is identified by MiMi = VV
(3) The SATEM code form consists of four parts as follows
Part Identifier letters (MjMj) Isobaric surfaces
A AA Up to and including the 10-hPa surface B BB
C CC Above the 10-hPa surface D DD
Each part can be transmitted separately.
(4) The code form is divided into a number of sections as follows:
Section Symbolic figure Contents number group
1 — Identification, input data and processing
2 222 Position data and cloud data
3 333 Data for thickness between given reference level and identified standard isobaric surfaces
4 444 Data for precipitable water content between given reference level and standard isobaric surfaces
5 555 Data for tropopause and surface temperature
6 666 Data for (mean) temperature between non-standard pressure levels
7 777 Data for precipitable water between non-standard pressure levels
R E G U L A T I O N S :
86.1 General 86.1.1 The code name SATEM shall not be included in the report.
86.1.2 Parts A and B shall contain data, in so far as available, only for levels up to and including the 10-hPa level. A report for Part A shall consist of Sections 1 and 2 plus one or more Sections 3, 4 and 5. A report for Part B shall consist of Sections 1 and 2 plus one or more Sections 5, 6 and 7.
86.1.3 Parts C and D shall contain data, in so far as available, only for levels above the 10-hPa level, up to and including the 0.1-hPa level.
86.2 Parts A and C
86.2.1 Section 1
86.2.1.1 The identification of the satellite shall be reported by means of I6I6I6. I6I6I6 defines the satellite name and one group contains F3F3F3 (originating/generating centre) and F4F4F4 (originating/generating sub-centre). If F4F4F4 is not coded, it is replaced by three solidi (///).
86.2.1.2 The type of sensor used shall be indicated by means of I3. The type of processing performed shall be indicated by means of I4. The code table for I3 will vary with each type of satellite.

FM 86 SATEM
Volume I.1 A–159
86.2.1.3 Satellite operators, where appropriate, shall therefore inform the WMO Secretariat, as early as possible before launch, of the proposed national coding procedures and code table for I3 for each satellite to be launched. The Secretariat shall then inform all countries by suitable advance information of the specifications of the code table for I3 and shall include this information in Volume II of the Manual on Codes.
86.2.2 Section 2
86.2.2.1 The geographical location of the sounding shall be indicated by means of the group QLaLaLoLo.
86.2.2.2 When included in Section 2 of Part A, the group NcNcPcPcPc shall contain data on the cloud cover in the area of the sounding. To describe cloud layers, the group shall be repeated as required.
86.2.2.3 The group NcNcPcPcPc shall be included in the report whenever the information on cloud cover (including nil when appropriate) is available and reliable.
86.2.3 Section 3
Section 3 shall contain the thickness between a standard reference level given by the pressure indicator PAPA and the standard isobaric surfaces indicated by P1P1 . . . PnPn.
86.2.4 Section 4
Section 4 shall contain the amount of precipitable water in a layer between a standard reference level indicated by PAPA and the standard isobaric surfaces indicated by P1P1 . . . PnPn.
86.3 Parts B and D 86.3.1 Section 2
Regulation 86.2.2.2 shall apply, mutatis mutandis, to Part B.
86.3.2 Section 6
Section 6 shall contain mean temperature data for one or more specified layers indicated by pressure indicators P1P1 and PnPn. Each of these layers shall be divided from P1P1 into adjacent sublayers of variable thicknesses (nu multiplied by up hPa), as required by the vertical locations of temperature measurement.
Note: A redundancy check can be performed on each layer P1P1 and PnPn of Section 6. The sum of code figures nu for the layer, multiplied by the unit layer (indicated by up), must be equal to the pressure difference between P1P1 and PnPn.
_____________


Volume I.1 A–161
FM 87–XI SARAD Report of satellite clear radiance observations
C O D E F O R M :
SECTION 1 MiMiMjMj YYGG/ I6I 6I 6I 3I 4 F3F3F3F4F4F4
SECTION 2 222 QLaLaLoLo (NcNcPcPcPc) //A2A2A2
6c1c1cncn 1uR1R1R1 2uR2R2R2 . . . . . nuRnRnRn SECTION 3 or SECTION 4 7c1c1cncn 1qT1T1Ta1 2qT2T2Ta2 . . . . . nqTnTnTan
Notes:
(1) SARAD is the name of the code for reporting satellite clear radiance.
(2) A SARAD report is identified by the symbolic letters MiMiMjMj = WWXX.
(3) The code form is divided into a number of sections as follows:
Section Indicator figures or Contents number symbolic figure group
1 — Identification, date and time
2 222 Position, optional cloud information and zenith angle
3 6 Clear radiance data, directly expressed in energy units
4 7 Clear radiance data, indirectly expressed in equivalent blackbody temperature units
(4) Part B is divided into five sections:
c1v3 R =
c2v
exp T
± 1
where R Radiance in mW/(s.cm2.sr.cm–1)
T Equivalent blackbody temperature in K ν Wave number in cm–1
c1 1.191 066 x 10–5 mW/(s.cm2.sr.cm–4) c2 1.438 833 K/(cm–1).
R E G U L A T I O N S :
87.1 General 87.1.1 The code name SARAD shall not be included in the report.
87.1.2 Whenever it is not possible to report clear radiance data, directly expressed in energy units, with sufficient precision to achieve the temperature sounding accuracies needed (for example, to the nearest degree Celsius), Section 3 shall be omitted and Section 4 shall be used to report clear radiance data, indirectly expressed in equivalent blackbody temperature units.

FM 87 SARAD
A–162 Volume I.1
87.1.3 Except for the case where Regulation 87.1.2 applies, Section 3 shall be used, and Section 4 shall not be included in the report.
87.2 Section 1 Regulation 86.2.1 shall apply.
87.3 Section 2 Regulations under 86.2.2 shall apply.
87.4 Section 3 87.4.1 Section 3 shall contain clear radiance data corresponding to the sounding identified by
means of Section 1 for filter channel numbers arranged in the order of decreasing spectral wave length.
87.4.2 When clear radiance values are not available for filter channel numbers smaller than a given filter channel number, the clear radiance values relative to the filter channels for which no data are available shall not be included in the report. The lowest filter channel number for which data are included shall in all cases be indicated by means of c1c1 in group 6c1c1cncn.
87.4.3 When clear radiance values are not available for filter channel numbers greater than a given filter channel number, the clear radiance values relative to the filter channels for which no data are available shall not be included in the report. The highest filter channel number for which data are included shall in all cases be indicated by means of cncn in group 6c1c1cncn.
87.4.4 When use is made of Regulations 87.4.2 and 87.4.3 to report abbreviated soundings, data for all filter channel numbers between c1c1 and cncn shall be included in the report.
87.4.5 If the number of filter channels in operation exceeds a multiple of 10, the serial indicator figure preceding the clear radiance values in the report shall be reset to 1, 2, etc.
87.5 Section 4 87.5.1 Section 4 shall contain clear radiance data corresponding to the sounding identified by
means of Section 1 for filter channel numbers arranged in the order of decreasing spectral wave length.
87.5.2 When clear radiance values are not available for filter channel numbers smaller than a given filter channel number, the clear radiance values relative to the filter channels for which no data are available shall not be included in the report. The lowest filter channel number for which data are included shall in all cases be indicated by means of c1c1 in group 7c1c1cncn.
87.5.3 When clear radiance values are not available for filter channel numbers greater than a given filter channel number, the clear radiance values relative to the filter channels for which no data are available shall not be included in the report. The highest filter channel number for which data are included shall in all cases be indicated by means of cncn in group 7c1c1cncn.
87.5.4 When use is made of Regulations 87.5.2 and 87.5.3 to report abbreviated soundings, data for all filter channel numbers between c1c1 and cncn shall be included in the report.
87.5.5 Regulation 87.4.5 shall apply.
_____________

Volume I.1 A–163
FM 88–XI SATOB Report of satellite observations of wind, surface temperature, cloud, humidity and radiation
C O D E F O R M :
SECTION 1 MiMiMjMj YYMMJ GGggwi I6I6I6// F3F3F3F4F4F4
SECTION 2 (222 B1B2B3nn . . . . .
ULaULoULaULo/
. . . . .
. . . . .
. . . . .
PcPcTcTcTa
. . . . .
. . . . .
. . . . .
ddfff . . . . . . . . . . . . . . . )
SECTION 3 (333 B1B2B3nn
. . . . .
ULaULoPePe/ . . . . . . . . . . . . . . .
ddfff . . . . . . . . . . . . . . . )
SECTION 4 (444 B1B2B3nn . . . . .
ULaULoTsTsTa . . . . . . . . . . . . . . . )
SECTION 5 (555 B1B2B3nn . . . . .
ULaULoPdPd/ . . . . . . . . . . . . . . .
NcNcTcTcTa
. . . . .
. . . . .
. . . . . )
SECTION 6 (666 B1B2B3nn ULa1ULo1ULa2ULo2ULa3 ULo3ULa4ULo4ULa5ULo5 H1H2H3H4H5
. . . . . . . . . . . . . . . . . . . .
. . . . .
. . . . .
. . . . .
. . . . . . . . . . . . . . .)
SECTION 7 (777 PbPb/// B1B2B3nn ULa1ULo1ULa2ULo2ULa3 ULo3ULa4ULo4ULa5ULo5 U1U2U3U4U5
. . . . . . . . . . . . . . . . . . . . . . . . . . . . . . . . . . .
. . . . .
. . . . .
. . . . .
. . . . . . . . . . . . . . .)
SECTION 8 (888 B1B2B3nn ULa1ULo1ULa2ULo2/ . . . . .
1uFLFLFL
. . . . . 2uFiFiFi
. . . . . 3uFsFsFs
. . . . .)
Notes:
(1) SATOB is the name of the code for reporting satellite observations of wind, surface temperature, cloud, humidity and radiation.
(2) A SATOB report is identified by the symbolic letters MiMiMjMj = YYXX
(3) The code form is divided into a number of sections as follows:
Section Symbolic figure Contents number group
1 — Time and identification data
2 222 Data for wind and cloud or water-vapour temperature at specified pressure levels
3 333 Data for wind at specified pressure levels
4 444 Data for surface temperatures
5 555 Data for clouds

FM 88 SATOB
A–164 Volume I.1
Section Symbolic figure Contents number group
6 666 Data for maximum cloud-top altitude
7 777 Data for troposphere humidity
8 888 Data for radiation balance
(4) It is recommended that, within each section, a report should be confined to one geographical area. Proper transmission of each report is thereby ensured and the amount of data to be transmitted to individual users is reduced.
R E G U L A T I O N S :
88.1 General 88.1.1 The code name SATOB shall not be given in the report.
88.1.2 The report shall consist of Section 1 plus Section 8 or Section 1 plus one or more of Sections 2 to 7.
88.1.3 The data shall be arranged in 10-degree squares.
88.2 Section 1 Section 1 shall indicate the satellite name (Regulation 86.2.1.1 applies) and the time of the observation, except when Regulation 88.9.2 applies.
88.3 Section 2 Section 2 shall be included in the report when data on cloud or water-vapour temperature and winds computed from cloud movement or water-vapour motion are available.
88.4 Section 3 Section 3 shall be included in the report when data for winds computed from cloud movement or water-vapour motion are available, while cloud or water-vapour temperature data are not available.
88.5 Section 4 Section 4 shall be included in the report when surface temperature data are available.
88.6 Section 5 Section 5 shall contain data giving the individual percentage cloud cover of the various cloud layers and the temperature at the top of each layer. If available, the pressure at the top of the layer (in tens of hectopascals) shall be given by PdPd. If pressure is not available, PdPd shall be coded as //.
88.7 Section 6 Section 6 shall be included in the report when data on maximum cloud-top altitude are available.

FM 88 SATOB
Volume I.1 A–165
88.8 Section 7 Section 7 shall be included in the report when humidity data from a given level up to the tropopause are available. The group PbPb/// shall specify the lower level.
88.9 Section 8 88.9.1 Section 8 shall be included in the report when data for total radiation (for 24 hours) are
available (outgoing: long-wave and short-wave; incoming: short-wave).
88.9.2 When Section 8 is included in the report, GGgg in Section 1 shall be coded as a series of solidi (////), while YY refers to the day over which the total radiation is integrated.
_____________


Section B
SPECIFICATIONS OF SYMBOLIC LETTERS (or groups of letters)
Symbolic letters and remarks as to the methods of coding
_____________
Note: General information about methods of observation will be found in the Guide to Meteorological Instruments and Methods of Observation (WMO–No. 8).


Volume I.1 A–169
SYMBOLIC LETTERS AND REMARKS AS TO THE METHODS OF CODING
REMARK: When coding a value which can be directly transcribed into figures, and when the number of significant figures of this value (expressed in the units given in the relevant specification) is lower than the number of symbolic letters reserved for this element, one or more zeros, as appropriate, must be inserted at the left of the significant figure(s) of the reported value.
Example: If the altitude of the cloud base is 3 600 metres and must be reported in the cloud section of the FM 45 IAC code form, where the symbolic letters HbHbHb (altitude of cloud base in hundreds of metres) are reserved for this purpose, the code figure will be 036. Similarly, if the altitude of the cloud base is 800 metres, the code figure will be 008.
A Mirage. (Code table 0101) (9-group in Section 3 of FM 12, FM 13 and FM 14)
— Direction of latitude (N = North, S = South). (FM 22, FM 42, FM 50, FM 57)
— WMO Regional Association in which the hydrological observing station is located (1 – Region I; 2 – Region II, etc.).
(FM 67, FM 68)
AC Accuracy of the position of the centre or the eye of the tropical cyclone. (Code table 0104) (FM 20)
AN Type of anemometer. (Code table 0114) (FM 18)
AT Index of accuracy of layer mean air temperature data (supplied by operator). (FM 86)
Aa Accident early notification – article applicable. (Code table 0131) (FM 22)
Ac Cause of incident. (Code table 0133) (FM 22)
Ae Incident situation. (Code table 0135) (FM 22)
Ai Accuracy of the fix and repetition rate of atmospherics. (Code table 0139) (FM 82)
At Accuracy of determination of the geographical position of the tropical cyclone. (Code table 0152)
(FM 85)
— Index of accuracy of tropopause data (supplied by operator). (FM 86)

SPECIFICATIONS OF SYMBOLIC LETTERS
A–170 Volume I.1
Aw Index of accuracy of precipitable water in the layer (supplied by operator). (FM 86)
A1 WMO Regional Association area in which buoy, drilling rig or oil- or gas-production platform has been deployed (1 – Region I; 2 – Region II, etc.). (Code table 0161)
(FM 13, FM 18, FM 22, FM 63, FM 64, FM 65)
A3 Day darkness, worst in direction Da. (Code table 0163) (9-group in Section 3 of FM 12, FM 13 and FM 14)
AA Activity or facility involved in incident. (Code table 0177) (FM 22, FM 57)
AAA Maritime area. (FM 61)
AhAhAh Anemometer height expressed in decimetres. (FM 18)
A1A1A1 Spectral estimates of the first to nth frequencies (or wave numbers if so indicated). A2A2A2 (FM 65) . . . AnAnAn (1) The use of frequency or wave number is indicated by symbolic letter Ia.
A2A2A2 Zenith angle, in tenths of a degree. (FM 87)
AAAAA Area. (FM 53)
a Characteristic of pressure tendency during the three hours preceding the time of observation. (Code table 0200)
(FM 12, FM 13, FM 14, FM 18)
aC Change in character of the eye during the 30 minutes preceding the time of observation. (Code table 0204)
(FM 20)
aI Trend in behaviour of ice. (Code table 0210) (FM 44)
ae Tendency of echo pattern. (Code table 0235) (FM 20)
ai Distribution of atmospherics. (Code table 0239) (FM 82)
am Portion of the maritime area. (Code table 0244) (FM 61)

SPECIFICATIONS OF SYMBOLIC LETTERS
Volume I.1 A–171
at Apparent 24-hour change in intensity of the tropical cyclone. (Code table 0252) (FM 85)
a1 Reason for no report or ground equipment employed. (Code table 0262) (FM 39, FM 40)
a1 Hundreds figure of a1a1a1, a2a2a2. a2 (FM 47, FM 49)
a3 Standard isobaric surface for which the geopotential is reported. (Code table 0264) (FM 12, FM 14)
a4 Type of measuring equipment used. (Code table 0265) (FM 32, FM 33, FM 34, FM 35, FM 36, FM 37, FM 38)
a5 Type of report and unit of reported radiological quantity. (Code table 0266) (FM 22)
aa Decimal exponent of radiological quantity or discharge of the main receiving water body. (FM 22, FM 57)
a1a1 Tens and units figures of a1a1a1, a2a2a2. a2a2 (FM 47, FM 49)
a1a1a1 Type of parameter. (Code table 0291) a2a2a2 (FM 47, FM 49)
(1) In the case of FM 49 GRAF, a2a2a2 is replaced by 000 in the code form.
B Direction of longitude (E = East, W = West). (FM 22, FM 42, FM 50, FM 57)
— Turbulence. (Code table 0300) (FM 51, FM 53, FM 54)
BA Turbulence. (Code table 0302) (FM 42)
BT Type of release. (Code table 0324) (FM 22)
Bz High-level turbulence. (Code table 0359) (FM 41)
(1) High-level turbulence refers to the type of aircraft turbulence which is normally found above about 6 km, exclusive of turbulence in Cumulonimbus cloud. High-level turbulence is sometimes referred to as clear-air turbulence but does not exclude turbulence in Cirrus cloud.
BB Number of bands described by the next two groups, except that BB = 00 indicates each of the following groups represents only a centre frequency or wave number.
(FM 65)

SPECIFICATIONS OF SYMBOLIC LETTERS
A–172 Volume I.1
BB (continued)
— International indicator for basin in a given WMO Region (A). (FM 67, FM 68)
(1) This indicator defines the basin, or group of basins, in which the hydrological observing station is situated. This basin or group of basins may be international or national.
(2) The list of international indicators for basins is given in Volume II of the Manual on Codes.
BRBR Friction coefficient/braking action. (Code table 0366) (FM 15, FM 16)
BTBT Total number of bands described. (FM 65)
BtBt Type of buoy. (Code table 0370) (FM 18)
B1B2B3 Number designating a 10° x 10° square in the geographical grid formed by the intersection of two meridians and two parallels of latitude. These four lines correspond to geographical coordinates which are in pairs of consecutive multiples of 10° and can therefore be expressed as follows:
Ia x 10°, (Ia + 1) x 10° (latitude) Io x 10°, (Io + 1) x 10° (longitude). In the above expressions, Ia and Io are positive integers that may vary between 0 and 8
and between 0 and 17 respectively. Both latitudes are either N or S and both longitudes are either E or W.
The square number is obtained by using the specifications below: B1 = Q – Octant of the globe. (Code table 3300) B2 = Ia. B3 = Units figure of integer Io.
(FM 88)
(1) That corner of square B1B2B3 which corresponds to the geographical coordinates Ia x 10° and Io x 10° is used as a reference point to obtain the coordinates of any point lying inside the square:
(a) To the nearest degree, by adding up to 9° to the coordinates of the corner in question;
(b) To the nearest tenth of a degree, by adding up to 9.9° to the coordinates of the corner in question.
(2) Points lying on the 180° meridian will be encoded by using B3 = 8 and B1 = 1 in the northern hemisphere and B1 = 6 in the southern hemisphere.
(3) Each Pole will be encoded by B2 = 9, B3 = 0 and B1 = 1 for the North Pole and B1 = 6 for the South Pole.
(4) Between 80° latitude and each of the Poles, the squares are reduced to triangles which nevertheless are covered by the above system.
(5) The numbering system of squares is given in Code table 0371.
bi Ice of land origin. (Code table 0439) (FM 12, FM 13, FM 14)

SPECIFICATIONS OF SYMBOLIC LETTERS
Volume I.1 A–173
bw Sub-area belonging to the area indicated by A1. (Code table 0161) (FM 13, FM 18, FM 22, FM 63, FM 64, FM 65)
b1 b1 Type of special level. (Code table 0491) b2b2 (FM 47, FM 49)
(1) In the case of FM 49 GRAF, b2b2 is replaced by 00 in the code form
C Genus of cloud. (Code table 0500) (FM 12, FM 13, FM 14)
(1) The genus of the cloud of the reported layers shall be determined on the basis of the 10 genera of cloud and of their illustrations given in the International Cloud Atlas.
— Total concentration of all ice. (Code table 0501) (FM 44)
— Genus of cloud predominating in the layer. (Code table 0500) (FM 45)
CH Clouds of the genera Cirrus, Cirrocumulus and Cirrostratus. (Code table 0509) (FM 12, FM 13, FM 14, FM 35, FM 36, FM 38)
(1) The figure to be reported for CH shall be determined on the basis of the detailed description of CH clouds and illustrations of them in the International Cloud Atlas in conjunction with specifications in Code table 0509.
(2) The figure CH = 9 shall be used when the predominant CH clouds are Cirrocumulus although small amounts of Cirrocumulus may be present in the CH cloud system reported under CH = 1 to 8.
CL Clouds of the genera Stratocumulus, Stratus, Cumulus and Cumulonimbus. (Code table 0513)
(FM 12, FM 13, FM 14, FM 35, FM 36, FM 38)
(1) The figure to be reported for CL shall be determined on the basis of the detailed description of the low clouds and illustrations of them in the International Cloud Atlas in conjunction with specifications in Code table 0513.
CM Clouds of the genera Altocumulus, Altostratus and Nimbostratus. (Code table 0515) (FM 12, FM 13, FM 14, FM 35, FM 36, FM 38)
(1) The figure to be reported for CM shall be determined on the basis of the detailed description of CM clouds and illustrations of them in the International Cloud Atlas in conjunction with specifications in Code table 0515.
CR Extent of runway contamination. (Code table 0519) (FM 15, FM 16)
CS Special clouds. (Code table 0521) (9-group in Section 3 of FM 12, FM 13 and FM 14)
Ca Nature of clouds of vertical development. (Code table 0531) (9-group in Section 3 of FM 12, FM 13 and FM 14)

SPECIFICATIONS OF SYMBOLIC LETTERS
A–174 Volume I.1
Cc Coloration and/or convergence of clouds associated with a tropical disturbance. (Code table 0533)
(9-group in Section 3 of FM 12, FM 13 and FM 14)
Ce Concentration of the tertiary form of ice. (Code table 0501) (FM 44)
Ci Indicator of the country for each basin (BB) in which the hydrological observing station is situated.
(FM 67, FM 68)
(1) The list of indicators for countries is given in Volume II of the Manual on Codes.
Cm Major cloud configuration. (Code table 0544) (FM 85)
Cp Concentration of the predominant form of ice. (Code table 0501) (FM 44)
Cq Concentration of the quaternary form of ice. (Code table 0501) (FM 44)
Cs Concentration of the secondary form of ice. (Code table 0501) (FM 44)
— Cloud system. (Code table 0551) (FM 45)
Ct Description of the top of cloud whose base is below the level of the station. (Code table 0552)
(FM 12, FM 14)
Cu Concentration of the quintary form of ice. (Code table 0501) (FM 44)
C0 Orographic clouds. (Code table 0561) (9-group in Section 3 of FM 12, FM 13 and FM 14)
C1 Concentration of the predominant stage of development of ice. (Code table 0501) (FM 44)
— Confidence figure. (Code table 0562) (FM 45, FM 46)
C2 Concentration of the secondary stage of development of ice. (Code table 0501) (FM 44)
— Probability in tens of per cent. (FM 53, FM 54)
(1) C2 cannot exceed 5 = 50 per cent. (If the probability of occurrence of an element exceeds 50 per cent, then that occurrence shall be the predominant feature of the forecast.)

SPECIFICATIONS OF SYMBOLIC LETTERS
Volume I.1 A–175
C3 Concentration of the tertiary stage of development of ice. (Code table 0501) (FM 44)
C4 Concentration of the quaternary stage of development of ice. (Code table 0501) (FM 44)
C5 Concentration of the quintary stage of development of ice. (Code table 0501) (FM 44)
C´ Genus of cloud whose base is below the level of the station. (Code table 0500) (FM 12, FM 14)
C2C2 Probability in per cent rounded off to whole tens. (FM 51)
(1) C2C2 cannot exceed 50 = 50 per cent. (If the probability of occurrence of an element exceeds 50 per cent, then that occurrence shall be the predominant feature of the forecast.)
CmCmCm Maximum non-directional spectral density derived from heave sensors, in m2 Hz–1 for frequencies and m3 for wave numbers.
(FM 65)
CsmCsmCsm Maximum non-directional spectral density derived from slope sensors, in m2 Hz–1 for frequencies and m3 for wave numbers.
(FM 65)
CCCC ICAO international four-letter location indicator. (FM 15, FM 16, FM 51, FM 54)
CsCsCsCs Four last digits of check sum. (FM 47)
cT Thermodynamic correction technique. (Code table 0659) (FM 39, FM 40)
ci Concentration or arrangement of sea ice. (Code table 0639) (FM 12, FM 13, FM 14)
cw Wind correction technique. (Code table 0659) (FM 39, FM 40)
The ratio of the spectral density derived from slope sensors for a given band, to the maximum spectral density given by CsmCsmCsm.
(FM 65)
cs1cs1 cs2cs2 . . . csncsn
(1) A coded value of 00 may indicate either zero, or that the band contains the maximum spectral density. Since the band containing the maximum value will have been identified, it will be obvious which meaning should be assigned.

SPECIFICATIONS OF SYMBOLIC LETTERS
A–176 Volume I.1
c0c0 Sea-surface current speed, in tenths of a metre per second or tenths of a knot, in units indicated by ic.
(FM 62)
(1) d0d0c0c0 is encoded 0000 if the current speed is less than 0.05 metre per second (0.1 knot).
The ratio of the spectral density derived from heave sensors for a given band, to the maximum spectral density given by CmCmCm.
(FM 65)
c1c1 c2c2 . . . cncn
(1) See Note (1) under cs1cs1, cs2cs2, . . . csncsn
— Number of filter channel which corresponds to the data included in the first (to R1R1R1) and in the last (to RnRnRn) positions.
(FM 87)
(1) Filter channel numbers range from 01 to a value determined by the instrumental characteristics.
Speed of the current, in centimetres per second, at selected and/or significant depths starting with sea surface.
c0c0c0 c1c1c1 . . . cncncn
(FM 18, FM 64)
D True direction from which surface wind is blowing. (Code table 0700) (FM 61)
— True direction towards which ice has drifted in the past 12 hours. (Code table 0700) (FM 44)
DH True direction from which CH clouds are moving. (Code table 0700) (FM 12, FM 13, FM 14)
DK True direction from which swell is moving. (Code table 0700) (FM 61)
DL True direction from which CL clouds are moving. (Code table 0700) (FM 12, FM 13, FM 14)
DM True direction from which CM clouds are moving. (Code table 0700) (FM 12, FM 13, FM 14)
Da True direction in which orographic clouds or clouds with vertical development are seen. (Code table 0700)
(FM 12, FM 13, FM 14)
— True direction in which the phenomenon indicated is observed or in which conditions specified in the same group are reported. (Code table 0700)
(9-group in Section 3 of FM 12, FM 13 and FM 14)
De True direction towards which an echo pattern is moving. (Code table 0700) (FM 20)
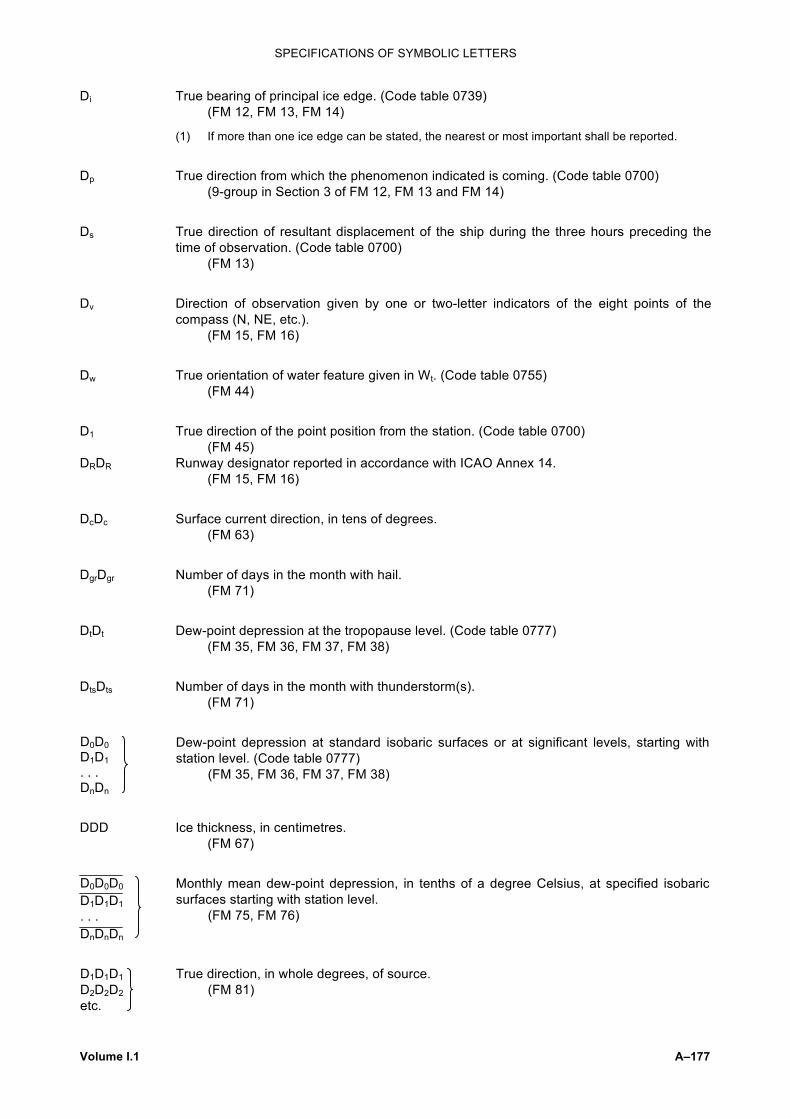
SPECIFICATIONS OF SYMBOLIC LETTERS
Volume I.1 A–177
Di True bearing of principal ice edge. (Code table 0739) (FM 12, FM 13, FM 14)
(1) If more than one ice edge can be stated, the nearest or most important shall be reported.
Dp True direction from which the phenomenon indicated is coming. (Code table 0700) (9-group in Section 3 of FM 12, FM 13 and FM 14)
Ds True direction of resultant displacement of the ship during the three hours preceding the time of observation. (Code table 0700)
(FM 13)
Dv Direction of observation given by one or two-letter indicators of the eight points of the compass (N, NE, etc.).
(FM 15, FM 16)
Dw True orientation of water feature given in Wt. (Code table 0755) (FM 44)
D1 True direction of the point position from the station. (Code table 0700) (FM 45)
DRDR Runway designator reported in accordance with ICAO Annex 14. (FM 15, FM 16)
DcDc Surface current direction, in tens of degrees. (FM 63)
DgrDgr Number of days in the month with hail. (FM 71)
DtDt Dew-point depression at the tropopause level. (Code table 0777) (FM 35, FM 36, FM 37, FM 38)
DtsDts Number of days in the month with thunderstorm(s). (FM 71)
Dew-point depression at standard isobaric surfaces or at significant levels, starting with station level. (Code table 0777)
D0D0 D1D1 . . . DnDn
(FM 35, FM 36, FM 37, FM 38)
DDD Ice thickness, in centimetres. (FM 67)
Monthly mean dew-point depression, in tenths of a degree Celsius, at specified isobaric surfaces starting with station level.
D0D0D0
D1D1D1 . . . DnDnDn
(FM 75, FM 76)
True direction, in whole degrees, of source. D1D1D1 D2D2D2 etc.
(FM 81)

SPECIFICATIONS OF SYMBOLIC LETTERS
A–178 Volume I.1
True direction, in whole degrees, of the axis of the centre corresponding to g1g1, g2g2, etc. D´1D´1D´1 D´2D´2D´2 etc.
(FM 83)
DPaDPaDPaDPa Radius of protective action (to be) taken, in kilometres. (FM 22)
D´D´D´D´ Duration of record of wave, in seconds, or length of record of wave, in tens of metres. (FM 65)
(1) The use of frequency or wave number is indicated by symbolic letter Ia.
D . . . . D Ship’s call sign consisting of three or more alphanumeric characters. (FM 13, FM 20, FM 33, FM 36, FM 62, FM 63, FM 64, FM 65, FM 85)
— Call sign, consisting of three or more alphanumeric characters, for mobile land station making surface or upper-air observations or issuing a radiological report on a routine basis and/or in case of accident.
(FM 14, FM 22, FM 34, FM 38, FM 57)
(1) It is recommended that this group should be encoded in the form A1A2DDD, where A1A2 are the two-letter geographical designators related to countries or territories as specified in Table C1, Part I of Attachment II–5 of the Manual on the Global Telecommunication System (Volume I). DDD are location designators comprising the first three letters of the name of the town or commune, where the mobile land station carried out upper-air sounding.
dT Amount of temperature change, the sign of the change being given by sn. (Code table 0822)
(FM 12, FM 13, FM 14)
dc Duration and character of precipitation given by RRR. (Code table 0833) (9-group in section 3 of FM 12, FM 13 and FM 14)
(1) If only one period of precipitation has occurred during the period covered by W1W2, the duration is defined as the time elapsed from the beginning (a) until the end of the period of precipitation, if precipitation is not occurring at the time of observation, or (b) until the time of observation, if precipitation is occurring at the time of observation.
(2) If two or more periods of precipitation have occurred during the period covered by W1W2, the duration of precipitation is defined as the time elapsed from the beginning of the first period of precipitation, all or part of which occurred during the period covered by W1W2, (a) until the end of the last period of precipitation, if precipitation is not occurring at the time of observation, or (b) until the time of observation, if precipitation is occurring at the time of observation.
dp Decimal point locator (FM 39, FM 40)
(1) The decimal point locator is defined as the number of places to the left of the third significant figure. The decimal point must be so placed as to obtain the actual density in g m–3 by p1p1p1.
(2) The third significant figure is always included in the value reported for symbol dp.
For example: If air density is 120 g m–3, the group 9dpp1p1p1 is coded 90120, dp being 0. If air density is 1.20 g m–3, the group 9dpp1p1p1 is coded 92120, dp being 2. If air density is 0.281 g m–3, the group 9dpp1p1p1 is coded 93281, dp being 3.

SPECIFICATIONS OF SYMBOLIC LETTERS
Volume I.1 A–179
dd True direction, in tens of degrees, from which wind is blowing (or will blow). (Code table 0877; stations within 1° of the North Pole use Code table 0878)
(FM 12, FM 13, FM 14, FM 18, FM 22, FM 39, FM 40, FM 45, FM 63, FM 64, FM 88)
— True direction (rounded off to the nearest 5°), in tens of degrees, from which wind is blowing.
(FM 32, FM 33, FM 34, FM 41)
— Forecast true direction, in tens of degrees, from which wind will blow at the relevant grid point. (Code table 0877)
(FM 50)
— True direction, in tens of degrees, from which wind is blowing, derived from movement of cloud elements. (Code table 0877)
(FM 85)
(1) When encoding wind direction that has been rounded off to the nearest 5°, the hundreds and tens figures of this rounded direction shall be reported by dd and the units figure shall be added to the hundreds figure of the wind speed.
Examples: (a) 293°/162 knots shall be encoded (b) 292°/162 knots shall be encoded 295 290 + 162 + 162 29662 29162
(2) Stations within 1° of the South Pole shall use Code table 0877 for reporting wind direction. These stations shall orient their azimuth rings so that the ring's zero coincides with the Greenwich meridian, e.g. wind from 0° longitude is coded 36, from 90°E longitude is coded 09, from 180° longitude is coded 18, and from 90°W longitude is coded 27, etc.
dBdB Drift direction of the buoy, expressed in tens of degrees, at the last known position of the buoy given in the groups YYMMJ GGgg/.
(FM 18)
dada Extreme anticlockwise direction from the mean direction of the wind reported by dd. (FM 22)
da1da1 Mean direction, in units of 4 degrees, from which waves are coming for the band indicated, relative to true north. (Code table 0880)
(FM 65)
(1) A value of 99 indicates the energy for that band is below a given threshold.
da2da2 Principal direction, in units of 4 degrees, from which waves are coming for the band indicated, relative to true north. (Code table 0880)
(FM 65)
(1) See Note (1) under da1da1.
dcdc Extreme clockwise direction from the mean direction of the wind reported by dd. (FM 22)
dddd True direction, in units of 4 degrees, from which dominant wave is coming. (Code table 0880)
(FM 65)

SPECIFICATIONS OF SYMBOLIC LETTERS
A–180 Volume I.1
dhdh True direction, in tens of degrees, from which wind will blow at the altitude indicated by hxhxhx. (Code table 0877)
(FM 53, FM 54)
djdj True direction, in tens of degrees, from which jet-stream wind is blowing (or will blow). (Code table 0877)
(FM 45)
dmdm True direction (rounded off to the nearest 5°), in tens of degrees, from which maximum wind is blowing.
(FM 32, FM 33, FM 34, FM 35, FM 36, FM 37, FM 38)
(1) See Note (1) under dd.
— True direction, in tens of degrees, from which maximum wind will blow at the flight level given by nmnmnm. (Code table 0877)
(FM 50)
— True direction, in tens of degrees, from which maximum wind will blow at the height given by h´mh´m. (Code table 0877)
(FM 53, FM 54)
dsds True direction, in tens of degrees, towards which the system or front is moving. (Code table 0877)
(FM 20, FM 45, FM 46)
(1) dsds denotes the direction towards which the system is moving at the position indicated by the preceding group(s)
— Directional spread, in whole degrees, of the dominant wave. (FM 65)
(1) The value of the directional spread is normally less than one radian (about 57°)
— True direction, in tens of degrees, towards which the tropical cyclone or system is moving. (Code table 0877)
(FM 85)
dtdt True direction (rounded off to the nearest 5°), in tens of degrees, from which wind is blowing at the tropopause level.
(FM 35, FM 36, FM 37, FM 38)
(1) See Note (1) under dd.
dwdw True direction, in tens of degrees, from which waves are coming. (Code table 0877) (FM 45, FM 46)
dw1dw1 True direction, in tens of degrees, from which swell waves are coming. (Code table 0877) dw2dw2 (FM 12, FM 13, FM 14)
d0d0 True direction, in tens of degrees, towards which sea-surface current is moving. (Code table 0877)
(FM 62)

SPECIFICATIONS OF SYMBOLIC LETTERS
Volume I.1 A–181
True direction (rounded off to the nearest 5°), in tens of degrees, from which wind is blowing at specified levels starting with surface level.
(FM 32, FM 33, FM 34, FM 35, FM 36, FM 37, FM 38)
d0d0 d1d1 . . . dndn
(1) See Note (1) under dd.
— True direction, in tens of degrees, towards which sea current at selected and/or significant depths starting with the sea surface is moving. (Code table 0877)
(FM 18, FM 64)
True direction, in tens of degrees, from which wind is blowing at the specified levels. (Code table 0877)
d1d1 d2d2 . . . dndn
(FM 39, FM 40)
— True direction, in units of 4 degrees, from which waves are coming. (Code table 0880) (FM 65)
ddd True direction, in degrees, rounded off to the nearest 10°, from which wind is blowing (or will blow).
(FM 15, FM 16, FM 51)
— True direction, in whole degrees, from which wind is blowing. (FM 42)
dndndn The extreme counterclockwise direction of a variable wind, reported with reference to true north and rounded off to the nearest 10°.
(FM 15, FM 16)
dtadtadta Main transport direction in atmosphere, in degrees from north. (FM 22)
dtwdtwdtw Main transport direction in water, in degrees from north. (FM 22)
True direction, in whole degrees, of the monthly mean vector wind at specified isobaric surfaces.
(FM 75, FM 76)
dv1dv1dv1
dv2dv2dv2 . . . dvndvndvn
(1) 500 shall be added to dvdvdv when the speed of the monthly mean vector wind is 100 units or more up to 199 units.
dxdxdx The extreme clockwise direction of a variable wind, reported with reference to true north and rounded off to the nearest 10°.
(FM 15, FM 16)
didididi Mesh width of grid, along the i-axis of a cartesian grid at the latitude of true scale, in kilometres.
(FM 47)
— Mesh width of grid along the parallels of a geographical grid, in tenths of a degree. (FM 47)

SPECIFICATIONS OF SYMBOLIC LETTERS
A–182 Volume I.1
djdjdjdj Mesh width of grid, along the j-axis of a cartesian grid at the latitude of true scale, in kilometres.
(FM 47)
— Mesh width of grid along the meridians of a geographical grid, in tenths of a degree. (FM 47)
E State of the ground without snow or measurable ice cover. (Code table 0901) (FM 12, FM 14)
ER Runway deposits. (Code table 0919) (FM 15, FM 16)
Ec Characteristics of release. (Code table 0933) (FM 22)
Ee Release behaviour over time. (Code table 0935) (FM 22)
Eh Elevation above the horizon of the base of anvil of Cumulonimbus or of the summit of other phenomena. (Code table 0938)
(9-group in Section 3 of FM 12, FM 13 and FM 14)
Es State of current or expected release. (Code table 0943) (FM 22)
E3 Slush condition under the ice layer. (Code table 0964) (FM 67)
E´ State of the ground with snow or measurable ice cover. (Code table 0975) (FM 12, FM 14)
EsEs Thickness of ice accretion on ships, in centimetres. (FM 12, FM 13, FM 14)
E1E1 Ice phenomena on river, lake or reservoir. (Code table 0977) E2E2 (FM 67)
EEE Amount of either evaporation or evapotranspiration, in tenths of a millimetre, during the preceding 24 hours.
(FM 12, FM 13, FM 14)
eC Elevation angle of the top of the cloud indicated by C. (Code table 1004) (FM 12, FM 13, FM 14)
eQ Number of zeros after QQQ, Q1Q1Q1 or Q2Q2Q2 to obtain the discharge in dm3 s–1. (FM 67, FM 68)
e1 Type of isopleth and units of isopleth values uuu. (Code table 1062) (FM 45)
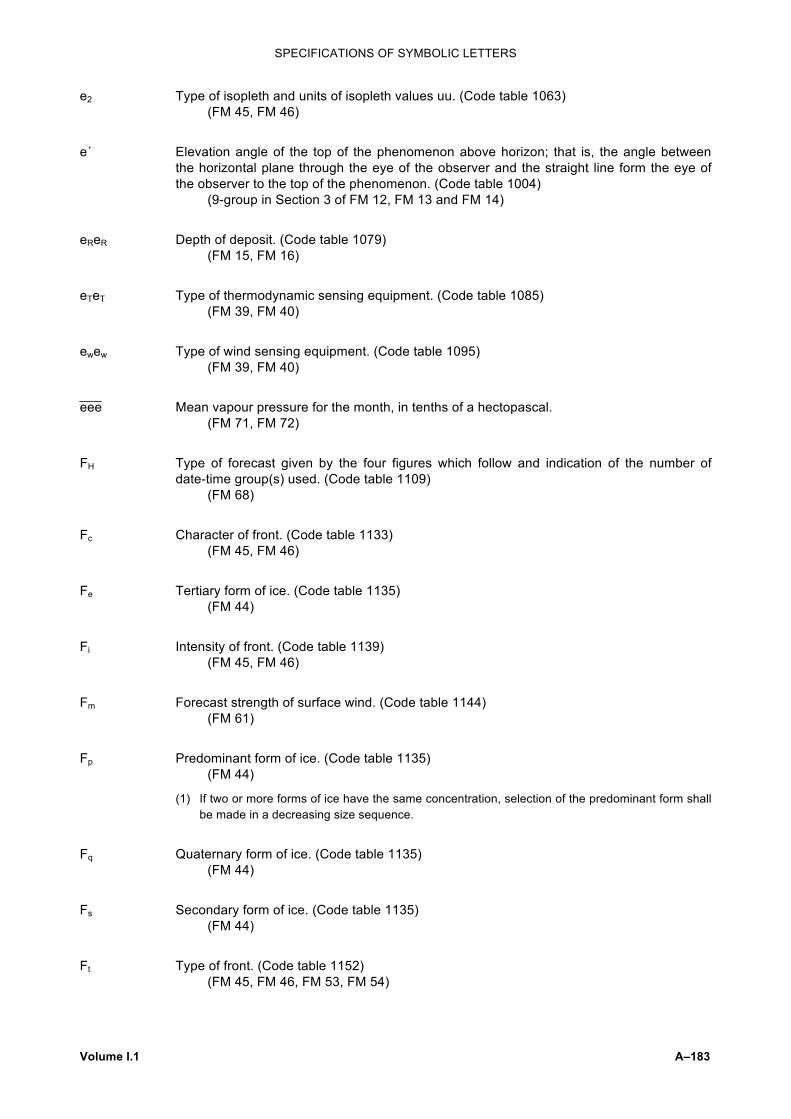
SPECIFICATIONS OF SYMBOLIC LETTERS
Volume I.1 A–183
e2 Type of isopleth and units of isopleth values uu. (Code table 1063) (FM 45, FM 46)
e´ Elevation angle of the top of the phenomenon above horizon; that is, the angle between the horizontal plane through the eye of the observer and the straight line form the eye of the observer to the top of the phenomenon. (Code table 1004)
(9-group in Section 3 of FM 12, FM 13 and FM 14)
eReR Depth of deposit. (Code table 1079) (FM 15, FM 16)
eTeT Type of thermodynamic sensing equipment. (Code table 1085) (FM 39, FM 40)
ewew Type of wind sensing equipment. (Code table 1095) (FM 39, FM 40)
eee Mean vapour pressure for the month, in tenths of a hectopascal. (FM 71, FM 72)
FH Type of forecast given by the four figures which follow and indication of the number of date-time group(s) used. (Code table 1109)
(FM 68)
Fc Character of front. (Code table 1133) (FM 45, FM 46)
Fe Tertiary form of ice. (Code table 1135) (FM 44)
Fi Intensity of front. (Code table 1139) (FM 45, FM 46)
Fm Forecast strength of surface wind. (Code table 1144) (FM 61)
Fp Predominant form of ice. (Code table 1135) (FM 44)
(1) If two or more forms of ice have the same concentration, selection of the predominant form shall be made in a decreasing size sequence.
Fq Quaternary form of ice. (Code table 1135) (FM 44)
Fs Secondary form of ice. (Code table 1135) (FM 44)
Ft Type of front. (Code table 1152) (FM 45, FM 46, FM 53, FM 54)

SPECIFICATIONS OF SYMBOLIC LETTERS
A–184 Volume I.1
Fu Quintary form of ice. (Code table 1135) (FM 44)
Fx Maximum wind force, in the period covered by W1W2, on the Beaufort scale (0 = 10 Beaufort; 1 = 11 Beaufort; 2 = 12 Beaufort, etc.).
(9-group in Section 3 of FM 12, FM 13 and FM 14)
(1) The Beaufort scale of wind is given in Section E of this volume.
F1 Intensity of points. (Code table 1162) F2 (FM 81) etc.
F1F2 Identification of originating/generating centre. (Common Code table C–1 – see Attachment I). (FM 47, FM 49, FM 57)
FLFLFL Outgoing long-wave radiation, in joules, integrated over 24 hours. (FM 88)
FiFiFi Incoming short-wave radiation, in joules, integrated over 24 hours. (FM 88)
FsFsFs Outgoing short-wave radiation, in joules, integrated over 24 hours. (FM 88)
F3F3F3 Identification of originating/generating centre (Common Code table C-1 – See Attachment I). (FM 86, FM 87, FM 88)
F4F4F4 Identification of originating/generating sub-centre (defined by centre F3F3F3 if necessary – Table to be supplied to WMO Secretariat by centre).
(FM 86, FM 87, FM 88)
FFFF Amount of radiation, in kilojoules per square metre, over a 1-hour period. (FM 12, FM 13, FM 14)
F24F24F24F24 Amount of radiation, in joules per square centimetre, over a 24-hour period. (FM 12, FM 13, FM 14)
f Wind speed derived from movement of cloud elements. (Code table 1200) (FM 85)
fe Speed of movement of echo pattern. (Code table 1236) (FM 20)
ff Wind speed, in units indicated by iw. (FM 12, FM 13, FM 14, FM 18, FM 22)
(1) If wind speed is 99 units or more, see Regulation 12.2.2.3.3.
— Wind speed, in knots or metres per second. (FM 15, FM 16, FM 51)
(1) For wind speeds of 100 units or more, see Regulations 15.5.6 or 51.3.5, as appropriate.

SPECIFICATIONS OF SYMBOLIC LETTERS
Volume I.1 A–185
ff (continued)
— Wind speed, in knots. (FM 45)
(1) For wind speeds of 100 units or more, see Regulation 45.3.6.2.
— Wind speed, in units indicated by iu. (FM 63, FM 64)
fmfm Maximum wind speed, in knots or metres per second. (FM 15, FM 16, FM 51)
(1) See Note (1) under ff (second specification).
fsfs Speed, in knots, of system, front or area. (FM 20, FM 45, FM 46)
(1) fsfs denotes the speed of the system at the position indicated by the preceding group(s).
— Speed, in knots, of tropical cyclone or other system. (FM 85)
ftafta Main transport speed in atmosphere, in metres per second. (FM 22)
ftwftw Main transport speed in water, in metres per second. (FM 22)
Speed, in knots or metres per second, of the monthly mean vector wind at specified isobaric surfaces.
fv1fv1fv1
fv2fv2fv2 . . . fvnfvnfvn
(FM 75, FM 76)
f10f10 Number of days in the month with observed or recorded wind speed equal to or more than 10 metres per second or 20 knots.
(FM 71)
(1) If continuous recording exists, the daily maximum of the mean wind speed over a 10-minute period shall be used.
(2) If continuous recording does not exist, the maximum mean wind speed over a 10-minute period, observed during the day, shall be used. In the absence of wind instruments, Regulation 12.2.2.3.2 shall apply.
f20f20 Number of days in the month with observed or recorded wind speed equal to or more than 20 metres per second or 40 knots.
(FM 71)
(1) See Notes (1) and (2) under f10f10.
f30f30 Number of days in the month with observed or recorded wind speed equal to or more than 30 metres per second or 60 knots.
(FM 71)
(1) See Notes (1) and (2) under f10f10.

SPECIFICATIONS OF SYMBOLIC LETTERS
A–186 Volume I.1
fff Wind speed, in units indicated by iw, of 99 units or more. (FM 12, FM 13, FM 14, FM 22)
(1) See Regulation 12.2.2.3.3.
— Wind speed, in metres per second or knots. (FM 32, FM 33, FM 34, FM 41, FM 88)
(1) See Note (1) under dd.
(2) See Note (1) under YY.
— Wind speed, in metres per second or knots, at the altitude given by HH. (FM 39, FM 40)
(1) See Note (1) under YY.
— Wind speed, in knots, at the level given by hIhIhI. (FM 42)
— Forecast wind speed, in knots, at the relevant grid point. (FM 50)
fdfdfd The increment to be added to the previous centre frequency or previous centre wave number, to obtain the next centre frequency (Hz) or the next centre wave number (m–1), in the series, the exponent being given by symbolic letter x.
(FM 65)
fgfgfg Maximum derived equivalent vertical gust, in tenths of a metre per second. (FM 42)
fhfhfh Wind speed, in kilometres per hour or knots or metres per second, at the level given by hxhxhx.
(FM 53, FM 54)
fjfjfj Wind speed of the jet stream, in units indicated by ij. (FM 45)
— Wind speed, in kilometres per hour or knots or metres per second, in the jet core. (FM 53, FM 54)
fmfmfm Maximum wind speed, in metres per second or knots. (FM 32, FM 33, FM 34, FM 35, FM 36, FM 37, FM 38)
(1) See Note (1) under dd.
(2) See Note (1) under YY.
— Maximum wind speed, in kilometres per hour or knots or metres per second, at the flight level given by nmnmnm.
(FM 50)
— Wind speed, in kilometres per hour or knots or metres per second, at the level given by h´mh´m.
(FM 53, FM 54)

SPECIFICATIONS OF SYMBOLIC LETTERS
Volume I.1 A–187
ftftft Wind speed, in metres per second or knots, at the tropopause level. (FM 35, FM 36, FM 37, FM 38)
(1) See Note (1) under dd.
(2) See Note (1) under YY.
fxfxfx Highest gust wind speed observed or recorded during the month, in tenths of units indicated by iw.
(FM 71)
Wind speed, in metres per second or knots, at specified levels starting with station level. (FM 32, FM 33, FM 34, FM 35, FM 36, FM 37, FM 38)
f0f0f0
f1f1f1 . . . fnfnfn (1) See Note (1) under dd.
(2) See Note (1) under YY.
Wind speed, in metres per second or knots, at specified isobaric surfaces. (FM 39, FM 40)
f1f1f1
f2f2f2 . . . fnfnfn (1) See Note (1) under YY.
— The first centre frequency (Hz) in a series, or the first centre wave number (m–1), the exponent being given by symbolic letter x.
(FM 65)
G Period covered by forecast. (Code table 1300) (FM 61)
Gp Period, to the nearest whole hour. (FM 53, FM 54)
(1) If the period is less than half an hour, Gp shall be encoded as 0.
GG Actual time of observation, to the nearest whole hour UTC. (FM 12, FM 13, FM 14, FM 32, FM 33, FM 34, FM 35, FM 36, FM 37, FM 38, FM 67, FM 81, FM 82)
(1) In the case of surface observations, the actual time of observation is the time at which the barometer is read.
(2) In the case of upper-air observations, the actual time of observation is the time at which the balloon or rocket is actually released, or the time at which the aircraft actually takes off from the surface.
(3) In the case of atmospherics observation, the actual time of observation is the time at which the observation of all specified elements is completed.
— Actual time, rounded downwards to the nearest hour UTC, of the first AMDAR report in the bulletin.
(FM 42)
— Valid time, to the nearest whole hour UTC, of the beginning of the forecast. (FM 51, FM 53, FM 54)
(1) See Regulations 51.8, 53.4 and 54.4.

SPECIFICATIONS OF SYMBOLIC LETTERS
A–188 Volume I.1
GG (continued)
— Actual time, to the nearest whole hour UTC, of the observed satellite data. (FM 86, FM 87)
GFGF Valid time, to the nearest whole hour UTC, of the temperature forecast. (FM 51)
GcGc Actual time, to the nearest whole hour UTC, of the observed data from which the chart is prepared.
(FM 44, FM 45, FM 46)
— Actual time, to the nearest whole hour UTC, of:
(a) Observations of data from which the analysed data field has been derived; or
(b) Analysed data field from which the prognostic data field has been derived; or
(c) End of period which was used to compute values (actual or prognostic) of mean field or field change. (FM 47, FM 49)
(1) The time shall be one of the standard times for synoptic observations (surface or upper-air, as the case may be).
GeGe Time, to the nearest whole hour UTC, of the end of the forecast period that began at GG. (FM 51)
GnGn Principal time of daily reading in UTC (hours) of minimum extreme temperature. (FM 71)
GpGp Number of whole hours to be added to GcGc to obtain the time at which the forecast is valid.
(FM 44, FM 45, FM 46)
— Period covered by the forecast, in whole hours. (FM 57)
GrGr Time of issue of the report, on monitoring operation or release, in whole hours UTC. (FM 22)
— Time of issue of the forecast, to the nearest whole hour UTC. (FM 57)
GsGs Actual time, to the nearest whole hour UTC, of the satellite data used to prepare the chart. (FM 44)
GxGx Principal time of daily reading in UTC (hours) of maximum extreme temperature. (FM 71)
G0G0 Initial time, in whole hours UTC, of analyses/forecasts used to produce the trajectory. (FM 57)

SPECIFICATIONS OF SYMBOLIC LETTERS
Volume I.1 A–189
G1G1 Time of commencement of period of forecast, in whole hours UTC. (FM 51, FM 53, FM 54, FM 61)
(1) When the period of forecast commences at midnight, G1G1 shall be encoded 00.
— Time, to the nearest whole hour UTC, specifying the beginning of the period covered by the forecast.
(FM 57)
— Time, to the nearest whole hour UTC, defining the time or the beginning of the period covered by the forecast.
(FM 68)
— Start of recording, to the nearest whole hour UTC. (FM 83)
G2G2 Time of ending of period of forecast, in whole hours UTC. (FM 51, FM 53, FM 54)
(1) When the period of forecast ends at midnight, G2G2 shall be encoded 24.
(2) When the period is between 25 and 48 hours after G1G1, G2G2 shall be encoded by adding 50 to the time of ending of period of forecast (however, this Note (2) does not apply to G2G2 in FM 51).
— Time, to the nearest whole hour UTC, defining the end of the period covered by the forecast.
(FM 68)
— End of recording, to the nearest whole hour UTC. (FM 83)
GGg Time of observation, in hours and tens of minutes UTC. (FM 20, FM 39, FM 40, FM 41, FM 85)
(1) The time to be reported in FM 20 is the time of the last radar exploration which was used to draft the report.
(2) The time to be reported in FM 39 and FM 40 is the time of firing of the rocket.
(3) The time to be reported in FM 41 is the time of observation, in hours and minutes UTC, expressed in the report received from the aircraft, with the last figure omitted.
(4) In the case of FM 85, see Regulation 85.2.2.
GsGsgs Mid-time, in hours and tens of minutes UTC, of the scanning period required to obtain the satellite picture used for the analysis.
(FM 85)
GGgg Time of observation, in hours and minutes UTC. (FM 12, FM 13, FM 14, FM 15, FM 16, FM 18, FM 22, FM 35, FM 36, FM 37, FM 38, FM 42, FM 62, FM 63, FM 64, FM 65, FM 67, FM 88)
(1) FM 12, FM 13, FM 14, FM 18: actual time of observation.
(2) FM 35, FM 36, FM 37, FM 38: actual time of launching the radiosonde.
(3) FM 63, FM 64: Time of launching the bathythermograph.

SPECIFICATIONS OF SYMBOLIC LETTERS
A–190 Volume I.1
GGgg (continued)
(4) FM 67: Time of occurrence of the observed maximum or observed minimum values of stage or discharges.
(5) FM 88: Time of observation or time of mid-point observation for wind computation.
— Time, in hours and minutes UTC, of the beginning or the end of a forecast change, or at which specific forecast condition(s) is (are) expected.
(FM 15, FM 16, FM 22, FM 51)
GGggZ Time of observation or forecast, in hours and minutes UTC, followed by the letter Z as an abbreviated indicator of UTC.
(FM 15, FM 16, FM 51, FM 53, FM 54)
(1) FM 15: Actual time of observation.
(2) FM 16: Time of occurrence of change(s) which justified the issue of the report.
(3) FM 51: Time of issue of forecast.
(4) FM 53, FM 54: Time of origin of forecast.
GFGFgFgF Time, in whole hours UTC, at which the WINTEM message is valid. (FM 50)
(1) As a result, gFgF shall always be equal to 00.
GaGagaga Time of accident, in hours and minutes UTC. (FM 22, FM 57)
GeGegege Time of end of monitoring operation or release, in hours and minutes UTC. (FM 22)
GsGsgsgs Time of start of monitoring operation or release, in hours and minutes UTC. (FM 22)
Time, in hours and minutes UTC, of expected arrival of radiological contamination at specified point location.
G1G1g1g1
G2G2g2g2
. . . GjGjgjgj
(FM 57)
g Time of the observations used to compute the reported mean values of geopotential, temperature and humidity. (Code table 1400)
(FM 75, FM 76)
g0 Period of time, in hours, between the time of the observation and the time of the wind change, the time of occurrence of the maximum mean wind speed, or the time of temperature change.
(FM 12, FM 13, FM 14)
(1) The period is the number of whole hours, disregarding the minutes. For example, if the time of occurrence is 45 minutes after the time of the observation, g0 shall be encoded as 0; if the time of occurrence is 1 hour or more, but less than 2 hours after the observation, g0 shall be encoded as 1; and so on.
(2) The value of g0 can be any whole number from 0 to 5.

SPECIFICATIONS OF SYMBOLIC LETTERS
Volume I.1 A–191
gpgp Number of hours to be added to, or subtracted from, the time given in the preamble, as specified to obtain the time of the supplementary information.
(FM 45, FM 46)
grgr Grid geometry and geographical support. (Code table 1487) (FM 47)
(1) The grid geometries corresponding to code figures 01–08 are defined in Section 2.
(2) The grid geometries corresponding to code figure 99 are given in Weather Reporting (WMO-No. 9), Volume B (see NNN under centre F1F2).
g1g1 Time of appearance of centre, to the nearest whole hour UTC. (FM 83)
g2g2 Time of disappearance of centre, to the nearest whole hour UTC. (FM 83)
He Altitude of echo top. (Code table 1535) (FM 20)
H1 Maximum altitude of cloud tops, corresponding to the first point out of five indicated by means of ULa1ULo1, ULa2ULo2, etc. (Code table 1561)
(FM 88)
H2 As for H1, but corresponding to the second, third, fourth and fifth points. (Code table 1561) H3 (FM 88) H4 H5
HH Altitude, in kilometres, of the level for which data are reported. (FM 39, FM 40)
HwHw Height of wind waves, in units of 0.5 metre. (FM 12, FM 13, FM 14)
— Height of forecast waves, in units of 0.5 metre. (FM 61)
(1) The average value of the wave height (i.e. vertical distance between trough and crest) shall be reported or forecast, as obtained from the larger well-formed waves of the wave system being observed or forecast.
(2) Height of the waves less than 0.25 m shall be coded 00, height of the waves from 0.25 m to less than 0.75 m shall be coded 01, height of the waves from 0.75 m to less than 1.25 m shall be coded 02, etc.
HwaHwa Height of waves, obtained by instrumental methods, in the same units as HwHw. (FM 12, FM 13, FM 14, FM 18)
(1) See Notes (1) and (2) under HwHw.
Hw1Hw1 Height of swell waves, in the same units as HwHw. Hw2Hw2 (FM 12, FM 13, FM 14)
(1) See Notes (1) and (2) under HwHw.

SPECIFICATIONS OF SYMBOLIC LETTERS
A–192 Volume I.1
H´H´ Altitude of the upper surface of clouds reported by C, in hundreds of metres. (FM 12, FM 14)
(1) H´H´ = 99 - the upper surface of clouds is at altitude 9 900 metres or higher.
HbHbHb Altitude of cloud base, in hundreds of metres. (FM 45)
HjHjHj Geopotential of jet-stream core, in units indicated by ij. (FM 45)
HtHtHt Altitude of tops of clouds, in hundreds of metres. (FM 45)
HwaHwaHwa Height of waves, obtained by instrumental methods, in units of 0.1 metre. (FM 12, FM 13, FM 14, FM 18)
(1) See Regulation 12.3.3.5 for the use of HwaHwaHwa.
(2) See Note (1) under HwHw.
HHHH D-value or height reduced to the nearest standard isobaric surface, in tens of metres. (FM 41)
HmHmHmHm Altitude of the level of maximum wind, in tens of standard geopotential metres. (FM 32, FM 33, FM 34)
— Maximum wave height, in centimetres. (FM 65)
(1) In the event wave height can only be reported in tenths of a metre, the final digit in the group shall be encoded as /.
HsHsHsHs Significant wave height, in centimetres. (FM 65)
(1) See Note (1) under HmHmHmHm.
— Stage, in centimetres, above zero of the gauge for the station. (FM 67)
(1) In case of negative stages, 5000 shall be added to the absolute value measured in centimetres.
HseHseHseHse Estimate of significant wave height from slope sensors, in centimetres. (FM 65)
(1) See Note (1) under HmHmHmHm.
Hs1Hs1Hs1Hs1 Lower limit of forecast stage, in centimetres, above zero of the gauge for the station. (FM 68)
(1) In case of negative stages, 5000 shall be added to the absolute forecast value in centimetres.
Hs2Hs2Hs2Hs2 Upper limit of forecast stage, in centimetres, above zero of the gauge for the station. (FM 68)
(1) See Note (1) under Hs1Hs1Hs1Hs1.

SPECIFICATIONS OF SYMBOLIC LETTERS
Volume I.1 A–193
Altitude levels of reference in the atmosphere, in tens of metres, or depth levels of reference in the ocean, in metres.
H1H1H1H1 H2H2H2H2
(FM 47, FM 49)
(1) In the case of analyses or prognoses relating to a layer between two levels, the upper level shall be indicated by H1H1H1H1 and the lower by H2H2H2H2 (only for FM 47).
(2) In the case of mean sea level, H2H2H2H2 = 0000.
Mean geopotentials of specified pressure surfaces, in standard geopotential metres. (FM 75, FM 76)
H1H1H1H1
H2H2H2H2
. . . HnHnHnHn (1) This value in standard geopotential metres is, for practical purposes, numerically equal to the height
expressed in metres.
(2) In the case of geopotentials above 9999 standard geopotential metres, the figures indicating the number of tens of thousands shall be omitted.
h Height above surface of the base of the lowest cloud seen. (Code table 1600) (FM 12, FM 13, FM 14, FM 35, FM 36, FM 38)
(1) The term "height above surface" shall be considered as being the height above the official aerodrome elevation or above station level at a non-aerodrome station, or above the surface of the water in reports from ships.
hc Character of topography system. (Code table 3133) (FM 45)
ht Type of topography system. (Code table 3152) (FM 45)
haha Geopotential of constant pressure surface, in tens of standard geopotential metres. (FM 45)
(1) For a HIGH or a LOW, haha is the geopotential at the centre. Along a ridge line, haha is the greatest geopotential and, along a trough line, it is the lowest geopotential.
hghg Height above the ground, in metres, at which diameter of deposit is observed (coded 99 for 99 m or more).
(9-group in Section 3 of FM 12, FM 13 and FM 14)
hshs Height of base of cloud layer or mass whose genus is indicated by C. (Code table 1677) (FM 12, FM 13, FM 14)
(1) If, notwithstanding the existence of fog, sandstorm, duststorm, blowing snow or other obscuring phenomena, the sky is discernible, the partially obscuring phenomena shall be disregarded. If, under the above conditions, the sky is not discernible, the 8-group is to be coded 89/hshs with the appropriate vertical visibility value being coded for hshs. The vertical visibility is defined as the vertical visual range into an obscuring medium. Vertical visibility is recorded to the same limits of accuracy as specified for cloud heights (Code table 1677).
(2) Heights are above surface (see Note (1) under h).
htht Height of the tops of the lowest clouds or height of the lowest cloud layer or fog. (Code table 1677)
(9-group in Section 3 of FM 12, FM 13 and FM 14)

SPECIFICATIONS OF SYMBOLIC LETTERS
A–194 Volume I.1
h´Ph´P Height* of the tropopause level. (FM 53, FM 54)
h´jh´j Height* of the level of the jet-stream core. (FM 53, FM 54)
h́ mh´m Height* of the maximum wind level. (FM 53, FM 54)
hhh Geopotential of an agreed standard isobaric surface given by a3, in standard geopotential metres, omitting the thousands digit.
(FM 12, FM 14)
hBhBhB Height of lowest level of turbulence. (Code table 1690) (FM 51, FM 53, FM 54)
(1) FM 51: heights are above surface (see Note (1) under h).
(2) FM 53, FM 54: heights are above sea level.
hIhIhI Pressure altitude, in hundreds of feet. (FM 42)
(1) Pressure altitude is a measure of height relative to the standard datum plane of 1013.2 hPa.
hdhdhd Flight level, in hundreds of feet. (FM 42)
hfhfhf Altitude of the 0°C isotherm. (Code table 1690) (FM 53, FM 54)
hihihi Height of lowest level of icing. (Code table 1690) (FM 51, FM 53, FM 54)
(1) See Notes (1) and (2) under hBhBhB.
_____________
* These heights are indicated in ICAO flight level numbers with last figure omitted. The ICAO flight levels are related to a pressure datum of 1013.2 hPa and are separated by a nominal distance of 500 feet. Schema of coding:
Code figure
ICAO flight level number
Metres (approx.)
Feet
20 200 6 000 20 000
20 205 6 150 20 500
21 210 6 300 21 000
21 215 6 450 21 500
etc. etc. etc. etc.

SPECIFICATIONS OF SYMBOLIC LETTERS
Volume I.1 A–195
hshshs Height of base of cloud layer or mass, or observed or forecast vertical visibility. (Code table 1690)
(FM 15, FM 16, FM 51, FM 53, FM 54) (1) If, notwithstanding the existence of fog, sandstorm, duststorm, blowing snow or other obscuring
phenomena, the sky is discernible, the partially obscuring phenomena shall be disregarded.
(2) FM 15, FM 16, FM 51: heights are above surface (see Note (1) under h).
(3) See Note (2) under hBhBhB.
hththt Altitude of cloud layer or mass. (Code table 1690) (FM 53, FM 54)
hxhxhx Altitude to which temperature and wind refer. (Code table 1690) (FM 53, FM 54)
Geopotential of the standard isobaric surfaces P1P1, P2P2, . . . PnPn, in standard geopotential metres and tens of standard geopotential metres.
(FM 35, FM 36, FM 37, FM 38)
h1h1h1
h2h2h2
. . . hnhnhn (1) Geopotentials of surfaces below sea level shall be reported by adding 500 to the absolute
value of the geopotential.
(2) The geopotential shall be reported in whole standard geopotential metres up to, but not including, 500 hPa and in tens of standard geopotential metres at 500 hPa and higher, omitting if necessary the thousands or tens of thousands digits.
— Geopotential of the specified isobaric surfaces, in thousands or hundreds of standard geopotential metres.
(FM 39, FM 40) (1) Geopotential of isobaric surfaces shall be reported in hundreds of standard geopotential
metres at and between 70 hPa and 0.0001 hPa, and in thousands of standard geopotential metres at 0.00007 hPa and higher.
hhhh Water depth, in metres. (FM 65)
hahahaha Actual release height, in metres. (FM 22)
(1) Code figure 9999 shall indicate a height of 10 000 metres or above.
hehehehe Effective release height, in metres. (FM 22)
(1) Code figure 9999 shall indicate a height of 10 000 metres or above.
hmhmhmhm Mixing height at the forecast point, in metres. (FM 57)
(1) Code figure 9999 shall indicate a height of 10 000 metres or above.
hrhrhrhr Elevation of a surface observing station or pressure altitude of an airborne observing station, in either metres or tens of feet as indicated by ih.
(FM 22, FM 57) (1) Code figure 9999 shall indicate an altitude of 10 000 metres or above, or 100 000 feet or
above, as the case may be.

SPECIFICATIONS OF SYMBOLIC LETTERS
A–196 Volume I.1
h0h0h0h0 Elevation of a mobile land station making surface or upper-air observations, in either metres or feet as indicated by im.
(FM 14, FM 34, FM 38)
Height above mean sea level, in metres. (FM 57)
h1h1h1h1
h2h2h2h2
. . . hjhjhjhj (1) Code figure 999 shall indicate a height of 10 000 metres or above.
I Density of points. (Code table 1700) (FM 83)
Ia Indicator for frequency or wave number. (Code table 1731) (FM 65)
Ib Indicator for directional or non-directional spectral wave data. (Code table 1732) (FM 65)
Ic Type of forecast ice accretion on the external parts of aircraft. (Code table 1733) (FM 51, FM 53, FM 54)
Id Indicator used to specify the hundreds of hectopascals figure (in Part A of TEMP, TEMP SHIP, TEMP DROP and TEMP MOBIL reports) or tens of hectopascals figure (in Part C of TEMP, TEMP SHIP, TEMP DROP and TEMP MOBIL reports) of the pressure relative to the last standard isobaric surface for which the wind is reported. (Code table 1734)
(FM 35, FM 36, FM 37, FM 38)
(1) When wind data are missing for one or more isobaric surfaces but are available for other isobaric surfaces below and above, a group (or groups) of solidi shall be included for the missing data.
(2) The wind group shall be omitted in the case of those isobaric surfaces for which no data are available, provided wind data are not available for any still higher surface.
(3) Code figure Id = 0 shall refer to the 1 000-hPa level.
(4) When wind data are not available for any standard isobaric surfaces (either in Part A or in Part C), Id shall be reported by means of a solidus (/).
(5) The wind group relating to the surface level shall be included in the report; when the corresponding wind data are not available, this group shall be coded /////.
(6) If wind data are available up to and including the 250-hPa level, the wind group relating to the 200-hPa level shall also be included in the report and coded as ///// except when the 250-hPa level is the highest standard isobaric surface reached by the sounding. The same rule shall apply to the 150-hPa level with regard to the 100-hPa level.
Ie Intensity of echoes. (Code table 1735) (FM 20)
Ij Density of points. (Code table 1741) (FM 81)
Im Indicator for method of calculation of spectral data. (Code table 1744) (FM 65)

SPECIFICATIONS OF SYMBOLIC LETTERS
Volume I.1 A–197
In Possibility that plume will encounter change in wind direction and/or speed. (Code table 1743)
(FM 22)
Ip Indicator for type of platform. (Code table 1747) (FM 65)
Is Ice accretion on ships. (Code table 1751) (FM 12, FM 13, FM 14)
I3 Indicator figure for instrument data used in processing (supplied by operator) (see Volume II).
(FM 86, FM 87)
I4 Indicator figure for data-processing technique used. (Code table 1765) (FM 86, FM 87)
I5 Indicator figure for data-processing techniques used to identify tropopause level (supplied by operator), (see Volume II).
(FM 86)
II Block number. (FM 12, FM 20, FM 22, FM 32, FM 35, FM 39, FM 57, FM 65, FM 71, FM 75, FM 81, FM 83, FM 85)
(1) The block numbers define the area in which the reporting station is situated. They are allocated to one country or a part of it or more countries in the same Region. The list of block numbers for all countries is given in Weather Reporting (WMO-No. 9), Volume A.
IXIXIX Instrument type for XBT, with fall rate equation coefficients. (Code table 1770) (FM 63, FM 64)
I6I6I6 Indicator figure for satellite identifier (supplied to WMO Secretariat by operators) (Common Code table C-5 – See Attachment I).
(FM 65, FM 86, FM 87, FM 88)
(1) Odd deciles for geostationary satellites.
(2) Even deciles for polar-orbiting satellites.
IS International two-letter characters of the isotope element name. (FM 22, FM 57)
IA . . . IA Aircraft identifier. (FM 42)
(1) The aircraft identifier is an alphanumeric which includes, either directly or indirectly, the airline identifier and aircraft identifier and, in the case of an ASDAR report, the ASDAR flight unit identification.
(2) In an AMDAR report from an ASDAR aircraft, the aircraft identifier, by convention, ends with the letter Z. In the case of an AMDAR report from a non-ASDAR aircraft, the letter Z is not appended.
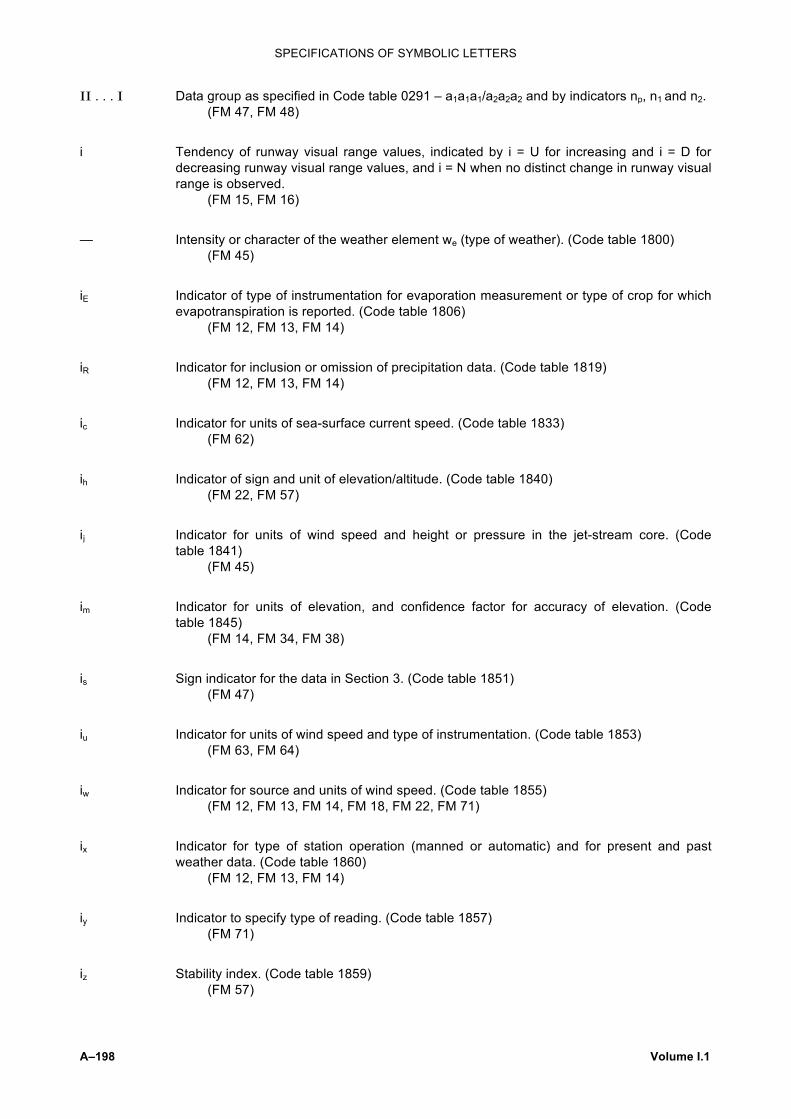
SPECIFICATIONS OF SYMBOLIC LETTERS
A–198 Volume I.1
II . . . I Data group as specified in Code table 0291 – a1a1a1/a2a2a2 and by indicators np, n1 and n2. (FM 47, FM 48)
i Tendency of runway visual range values, indicated by i = U for increasing and i = D for decreasing runway visual range values, and i = N when no distinct change in runway visual range is observed.
(FM 15, FM 16)
— Intensity or character of the weather element we (type of weather). (Code table 1800) (FM 45)
iE Indicator of type of instrumentation for evaporation measurement or type of crop for which evapotranspiration is reported. (Code table 1806)
(FM 12, FM 13, FM 14)
iR Indicator for inclusion or omission of precipitation data. (Code table 1819) (FM 12, FM 13, FM 14)
ic Indicator for units of sea-surface current speed. (Code table 1833) (FM 62)
ih Indicator of sign and unit of elevation/altitude. (Code table 1840) (FM 22, FM 57)
ij Indicator for units of wind speed and height or pressure in the jet-stream core. (Code table 1841)
(FM 45)
im Indicator for units of elevation, and confidence factor for accuracy of elevation. (Code table 1845)
(FM 14, FM 34, FM 38)
is Sign indicator for the data in Section 3. (Code table 1851) (FM 47)
iu Indicator for units of wind speed and type of instrumentation. (Code table 1853) (FM 63, FM 64)
iw Indicator for source and units of wind speed. (Code table 1855) (FM 12, FM 13, FM 14, FM 18, FM 22, FM 71)
ix Indicator for type of station operation (manned or automatic) and for present and past weather data. (Code table 1860)
(FM 12, FM 13, FM 14)
iy Indicator to specify type of reading. (Code table 1857) (FM 71)
iz Stability index. (Code table 1859) (FM 57)

SPECIFICATIONS OF SYMBOLIC LETTERS
Volume I.1 A–199
i0 Intensity of the phenomenon. (Code table 1861) (9-group in Section 3 of FM 12, FM 13 and FM 14)
i2 Zone type indicator. (Code table 1863) (FM 54)
(1) This symbol indicates the way in which the route is divided into sections.
i3 Indicator for supplementary phenomena. (Code table 1864) (FM 53, FM 54)
iii Station number. (FM 12, FM 20, FM 22, FM 32, FM 35, FM 39, FM 57, FM 65, FM 71, FM 75, FM 81, FM 83, FM 85)
(1) See Section D of this volume.
— Station number of station from which direction and distance of point position are given. (FM 45)
iHiHiH National hydrological observing station identifier number within a given basin (BB). (FM 67, FM 68)
(1) The national station identifier number is a three-figure number allocated by the appropriate Hydrological Service.
(2) The list of hydrological observing station identifier numbers of all countries is given in publication WMO-No. . . . (This publication will appear at a later stage.)
iaiaia Coordinate of the first grid point of the data line along the i-axis of a cartesian grid, in half-grid units.
(FM 47, FM 49)
— Difference between the longitude of the point of reference of the geographical grid and the longitude of the first grid point of the data line, in units of half-degrees.
(FM 47, FM 49)
ipipip Indicator for phase of flight and type of observation. (FM 42)
(1) See Regulation 42.2.1.
iiii i-coordinate of the Pole in grid units and tenths. (FM 47)
J Units digit of the year (UTC), i.e. 1974 = 4. (FM 18, FM 62, FM 63, FM 64, FM 65, FM 88)
JJ Tens and units digits of the year (UTC), i.e. 1974 = 74. (FM 47, FM 49)
JJJ Hundreds, tens and units digits of the year (UTC), i.e. 1974 = 974. (FM 22, FM 39, FM 40, FM 57, FM 71, FM 72, FM 73, FM 75, FM 76)

SPECIFICATIONS OF SYMBOLIC LETTERS
A–200 Volume I.1
j1 Supplementary information indicator. (Code table 2061) (FM 12, FM 13, FM 14)
jj Sequence number indicating the data line(s) of subsequent forecast point positions given. (FM 57)
jjj Supplementary information to be developed regionally (see Volume II). (FM 12, FM 14)
jajaja Coordinate of the first grid point of the data line along the j-axis of a cartesian grid, in half-grid units.
(FM 47, FM 49)
— Difference between the latitude of the point of reference of the geographical grid and the latitude of the first grid point of the data line, in units of half-degrees.
(FM 47, FM 49)
j2j3j4 Specifications relating to supplementary information. (Code table 2061) (FM 12, FM 13, FM 14)
jjjj j-coordinate of the Pole in grid units and tenths. (FM 47)
j5j6j7j8j9 Supplementary group which follows 5j1j2j3j4. (Code table 2061) (FM 12, FM 13, FM 14)
K Effect of the ice on navigation. (Code table 2100) (FM 44)
k Indicator for specifying the half-degrees of latitude and longitude. (Code table 2200) (FM 44, FM 45, FM 46, FM 82)
k1 Indicator for digitization. (Code table 2262) (FM 63, FM 64)
k2 Method of salinity/depth measurement. (Code table 2263) (FM 18, FM 64)
k3 Duration and time of current measurement (vector or Doppler current profiling method). (Code table 2264)
(FM 18, FM 64)
k4 Period of current measurement (drift method). (Code table 2265) (FM 64)
k5 Indicator for the method of current measurement. (Code table 2266) (FM 63)

SPECIFICATIONS OF SYMBOLIC LETTERS
Volume I.1 A–201
k6 Method of removing the velocity and motion of the ship or buoy from current measurement. (Code table 2267)
(FM 18, FM 64)
k1k1 Serial number of the data line. (FM 47, FM 49)
(1) k1k1 = 99 specifies the North Pole. k1k1 = 98 specifies the South Pole.
L Estimated level of wind data. (Code table 2300) (FM 85)
La Tenths of a degree of latitude. (FM 45, FM 46)
Lo Tenths of a degree of longitude. (FM 45, FM 46)
LaLa Latitude, in whole degrees. (FM 44, FM 45, FM 46, FM 53, FM 54, FM 82, FM 85, FM 86, FM 87)
LiLi Type of line or feature being described. (Code table 2382) LjLj (FM 44)
LoLo Longitude, in whole degrees. (FM 44, FM 45, FM 46, FM 53, FM 54, FM 82, FM 85, FM 86, FM 87)
(1) The hundreds digit shall be omitted for longitudes 100° to 180°.
LaLa L´aL´a Latitude parallel, in whole degrees, along which pressure values are given. L´´aL´´a (FM 73) . . .
LoLo L´oL´o Meridian, in whole degrees, to which the first given pressure (P1P1, P´1P´1, P´´1P´´1, . . .) refers. L´´oL´´o (FM 73) . . .
LaLaLa Latitude, in tenths of a degree. (FM 13, FM 14, FM 20, FM 33, FM 34, FM 36, FM 37, FM 38, FM 40, FM 41, FM 47, FM 72, FM 76, FM 85)
(1) Tenths shall be obtained by dividing the number of minutes by 6, disregarding the remainder.
La1La
1la1
La2La
2la2 Latitude coordinates of grid points, where laj is tenths of a degree of latitude (laj = 0 or 5). . . . (FM 50) La
jLajlaj
LoLoLo Longitude, in degrees. (FM 47)
(1) See Regulation 47.3.9.
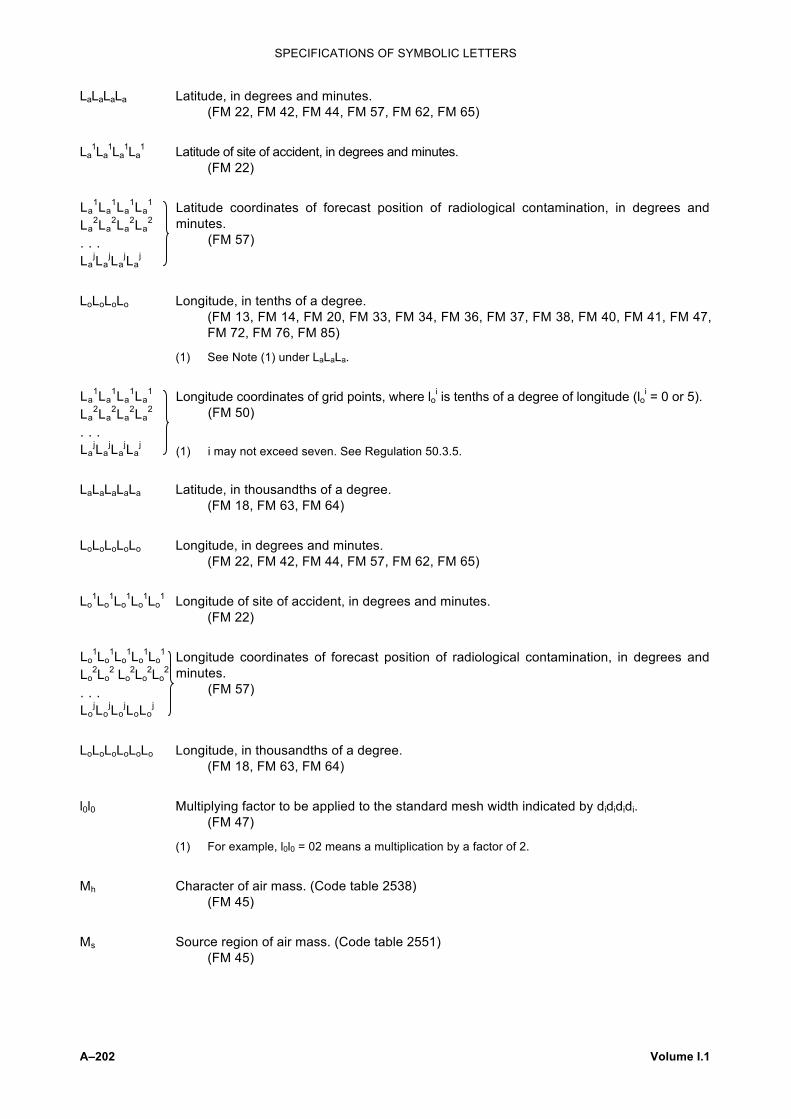
SPECIFICATIONS OF SYMBOLIC LETTERS
A–202 Volume I.1
LaLaLaLa Latitude, in degrees and minutes. (FM 22, FM 42, FM 44, FM 57, FM 62, FM 65)
La1La
1La1La
1 Latitude of site of accident, in degrees and minutes. (FM 22)
Latitude coordinates of forecast position of radiological contamination, in degrees and minutes.
La1La
1La1La
1
La2La
2La2La
2
. . . La
jLajLa
jLaj
(FM 57)
LoLoLoLo Longitude, in tenths of a degree. (FM 13, FM 14, FM 20, FM 33, FM 34, FM 36, FM 37, FM 38, FM 40, FM 41, FM 47, FM 72, FM 76, FM 85)
(1) See Note (1) under LaLaLa.
Longitude coordinates of grid points, where loi is tenths of a degree of longitude (loi = 0 or 5). (FM 50)
La1La
1La1La
1
La2La
2La2La
2
. . . La
jLajLa
jLaj (1) i may not exceed seven. See Regulation 50.3.5.
LaLaLaLaLa Latitude, in thousandths of a degree. (FM 18, FM 63, FM 64)
LoLoLoLoLo Longitude, in degrees and minutes. (FM 22, FM 42, FM 44, FM 57, FM 62, FM 65)
Lo1Lo
1Lo1Lo
1Lo1 Longitude of site of accident, in degrees and minutes.
(FM 22)
Longitude coordinates of forecast position of radiological contamination, in degrees and minutes.
Lo1Lo
1Lo1Lo
1Lo1
Lo2Lo
2 Lo2Lo
2Lo2
. . . Lo
jLojLo
jLoLoj
(FM 57)
LoLoLoLoLoLo Longitude, in thousandths of a degree. (FM 18, FM 63, FM 64)
l0l0 Multiplying factor to be applied to the standard mesh width indicated by didididi. (FM 47)
(1) For example, l0l0 = 02 means a multiplication by a factor of 2.
Mh Character of air mass. (Code table 2538) (FM 45)
Ms Source region of air mass. (Code table 2551) (FM 45)

SPECIFICATIONS OF SYMBOLIC LETTERS
Volume I.1 A–203
Mt Thermodynamic character of air mass. (Code table 2552) (FM 45)
Mw Water-spout(s), tornadoes, whirlwinds, dust devils. (Code table 2555) (9-group in Section 3 of FM 12, FM 13 and FM 14)
M1 Month when the period covered by the forecast begins. (Code table 2562) (FM 68)
M2 Month when the period covered by the forecast ends. (Code table 2562) (FM 68)
MM Month of the year (UTC), i.e. 01 = January; 02 = February, etc. (FM 18, FM 22, FM 39, FM 40, FM 47, FM 49, FM 57, FM 62, FM 63, FM 64, FM 65, FM 71, FM 72, FM 73, FM 75, FM 76, FM 88)
(1) In FM 75 and FM 76, MM shall be used to indicate the unit of wind speed in addition to indicating the month. When wind speeds are given in knots, 50 shall be added to MM. When the speed is given in metres per second, MM shall not be modified.
MiMi Identification letters of the report. (Code table 2582) (FM 12, FM 13, FM 14, FM 20, FM 32, FM 33, FM 34, FM 35, FM 36, FM 37, FM 38, FM 39, FM 40, FM 41, FM 62, FM 63, FM 64, FM 65, FM 67, FM 85, FM 86, FM 87, FM 88)
MjMj Identification letters of the part of the report or the version of the code form. (Code table 2582)
(FM 12, FM 13, FM 14, FM 20, FM 32, FM 33, FM 34, FM 35, FM 36, FM 37, FM 38, FM 39, FM 40, FM 41, FM 62, FM 63, FM 64, FM 65, FM 67, FM 85, FM 86, FM 87, FM 88)
MMM Number of Marsden squares in which the station is situated at the time of observation. (Code table 2590)
(FM 14, FM 33, FM 34, FM 36, FM 37, FM 38, FM 40)
m Movement. (Code table 2600) (FM 45, FM 46)
mS Averaging period for salinity. (Code table 2604) (FM 62)
mT Averaging period for sea temperature. (Code table 2604) (FM 62)
mTn Number of days missing from the record for daily minimum air temperature. (FM 71)
(1) If data are missing for 9 days or more, mTn shall be reported as 9.
mTx Number of days missing from the record for daily maximum air temperature. (FM 71)
(1) If data are missing for 9 days or more, mTx shall be reported as 9.

SPECIFICATIONS OF SYMBOLIC LETTERS
A–204 Volume I.1
mc Averaging period for surface current direction and speed. (Code table 2604) (FM 62)
mr Method of reducing data. (Code table 2649) (FM 39, FM 40)
ms Stage of melting. (Code table 2650) (FM 44)
(1) In case of unequal stages, the higher code figure shall be used.
mm Procedure or model used to generate the data field. (Code table 2677) (FM 47)
mPmP Number of days missing from the records for pressure. (FM 71)
mRmR Number of days missing from the records for precipitation. (FM 71)
mSmS Number of days missing from the records for sunshine duration. (FM 71)
mTmT Number of days missing from the records for air temperature. (FM 71)
meme Number of days missing from the records for vapour pressure. (FM 71)
N Total cloud cover. (Code table 2700) (FM 12, FM 13, FM 14, FM 22, FM 45)
(1) This symbolic letter shall embrace the total fraction of the celestial dome covered by clouds irrespective of their genus.
— Number of the centre. (FM 83)
Nh Amount of all the CL cloud present or, if no CL cloud is present, the amount of all the CM cloud present. (Code table 2700)
(FM 12, FM 13, FM 14, FM 35, FM 36, FM 38)
Nm Cloud conditions over mountains and passes. (Code table 2745) (9-group in Section 3 of FM 12, FM 13 and FM 14)
Ns Amount of individual cloud layer or mass whose genus is indicated by C. (Code table 2700)
(FM 12, FM 13, FM 14)
Nt Condensation trails. (Code table 2752) (9-group in Section 3 of FM 12, FM 13 and FM 14)

SPECIFICATIONS OF SYMBOLIC LETTERS
Volume I.1 A–205
Nv Cloud conditions observed from a higher level. (Code table 2754) (9-group in Section 3 of FM 12, FM 13 and FM 14)
N´ Amount of cloud whose base is below the level of the station. (Code table 2700) (FM 12, FM 14)
NN Identification number of a front or system. (FM 45)
(1) This number is assigned to the front or system by an analysis centre and is used for the same front or system throughout its life even though the type of front changes, e.g. cold to quasi-stationary, etc.
NcNc Percentage of cloud cover, as determined by the sounding instruments. (FM 86, FM 87, FM 88)
(1) Clear sky shall be coded 00, total cloud cover 99.
NeNe Sequential number of the 60 x 60 km square in the radar coordinate grid. (Code table 2776)
(FM 20)
NNN Catalogue number of grid used by centre F1F2. (FM 47, FM 49)
(1) See Weather Reporting (WMO-No. 9), Volume B.
(2) Whenever the grid used does not appear in the above WMO publication, NNN shall be encoded as 999 and Section 2 shall be used (only for FM 47).
NsNsNs Category of cloud amount, few, scattered, broken or overcast, given by three-letter abbreviations FEW (1 to 2 oktas), SCT (3 to 4 oktas), BKN (5 to 7 oktas) or OVC (8 oktas).
(FM 15, FM 16, FM 51, FM 53, FM 54)
n Number of consecutive isobaric surfaces for which wind data are reported, starting with the surface specified by P1P1.
(FM 32, FM 33, FM 34)
Number of the points on latitude parallels LaLa, L´aL´a, L ´aL´´a, . . . etc., for which pressure is given.
n n´ n´´ . . .
(FM 73)
nf Number of atmospherics observed by the system at the geographical locations that follow, during a 10-minute period within the hour immediately preceding the time of the report. (Code table 2836)
(FM 82)
nm Number of mean wind(s) reported. (FM 41)
np Number of grid points per data group. (FM 47)

SPECIFICATIONS OF SYMBOLIC LETTERS
A–206 Volume I.1
ns Number of spot wind(s) reported. (FM 41)
nu Number of unit thicknesses in sublayer. (FM 86)
Number of days for which wind observations are missing for the specified isobaric surface concerned (nv = 9 if observations are missing for 9 or more days).
nv1
nv2 . . . nvn
(FM 75, FM 76)
Number of digits in which the value of a parameter for a level or a layer is coded for each grid point.
(FM 47, FM 49)
n1 n2
(1) If one parameter a1a1a1 is reported for one level only, or for a layer, n1 shall be used to specify the number of digits, and n2 shall be coded as 0 (in the case of FM 49 GRAF, n2 is replaced by 0 in the code form).
(2) If one parameter a1a1a1 is reported for two special levels b1 b1 and b2b2, n1 shall refer to level b1b1 and n2 to level b2b2.
(3) If two parameters a1a1a1 and a2a2a2 are reported, n1 shall refer to parameter a1a1a1 and n2 to parameter a2a2a2.
n3 Evolution of clouds. (Code table 2863) (9-group in Section 3 of FM 12, FM 13 and FM 14)
n4 Evolution of clouds observed from a station at a higher level. (Code table 2864) (9-group in Section 3 of FM 12, FM 13 and FM 14)
nn Unit is either millimetre or tens and units of hectopascals (coded 99 for 99 or more units). (9-group in Section 3 of FM 12, FM 13 and FM 14)
— Serial number of the part of the complete analysis or prognosis which is transmitted separately.
(FM 47, FM 49)
(1) When the complete analysis or prognosis described by the grid has to be transmitted in a number of separate parts, each of optimum length, the serial number of the part which is transmitted shall be indicated by nn, and the total number of parts to be transmitted shall be indicated by ntnt.
— Number of points in 10-degree square. (FM 88)
nBnB Number of icebergs within the area. (Code table 2877) (FM 44)
nGnG Number of growlers and bergy bits within the area. (Code table 2877) (FM 44)
nLnL Number of layers for which the thickness or precipitable water is reported. (FM 86)

SPECIFICATIONS OF SYMBOLIC LETTERS
Volume I.1 A–207
nTnT Indicator of reference code table for type of parameter a1a1a1, a2a2a2. (Code table 2890) (FM 47, FM 49)
Number of days in the month for which temperature observations are missing for the specified isobaric surface concerned.
nT1nT1
nT2nT2 . . . nTn nTn
(FM 75, FM 76)
nana Number of data lines in the complete analysis or prognosis. (FM 47, FM 49)
(1) If the Pole is a grid point of a geographical grid, the Pole shall be included as a singular data line.
ngng Number of data groups on the data line. (FM 47, FM 49)
nini Maximum number of unit grid points on the grid lines in the grid system used. (FM 47)
njnj Maximum of unit grid lines in the grid system used. (FM 47)
nmnm Number of the band in which the maximum non-directional spectral density determined by heave sensors lies.
(FM 65)
nrnr Number of days in the month with precipitation equal to or greater than 1 millimetre. (FM 71, FM 72)
nsmnsm Number of the band in which the maximum non-directional spectral density determined by slope sensors lies.
(FM 65)
ntnt Number of parts into which the complete analysis or prognosis has been split for transmission purposes.
(FM 47, FM 49) (1) See Note (1) under nn.
— Identification number of tropical cyclone, from 01 to 99. (FM 85)
Number of level, starting with station level. (FM 32, FM 33, FM 34, FM 35, FM 36, FM 37, FM 38)
n0n0
n1n1 . . . nnnn
(1) Station level shall be coded n0n0 = 00.
nnn Isotope mass. (FM 22, FM 57)
— Specifications related to supplementary phenomena. (Code table 1864) (FM 53, FM 54)

SPECIFICATIONS OF SYMBOLIC LETTERS
A–208 Volume I.1
nbnbnb Type and serial number of buoy. (FM 13, FM 18, FM 22, FM 63, FM 64, FM 65)
nmnmnm Maximum wind flight level number. (FM 50)
(1) The last figure shall always be 0.
ntntnt Tropopause flight level number. (FM 50)
(1) The last figure shall always be 0.
Flight level numbers for specified levels. (FM 50)
n1n1n1
n2n2n2
. . . nknknk
(1) The last figure shall always be 0.
Pa Countermeasures taken near border. (Code table 3131) (FM 22)
Pc Character of pressure system. (Code table 3133) (FM 45, FM 46)
Pi Forecast ice phenomenon. (Code table 3139) (FM 68)
Pt Type of pressure system. (Code table 3152) (FM 45, FM 46)
Pw Period of waves. (Code table 3155) (FM 61)
(1) The period of the waves is the time between the passage of two successive wave crests past a fixed point (it is equal to the wave length divided by the wave speed).
(2) The average value of the wave period shall be forecast, as obtained from the larger well-formed waves of the wave system being forecast.
PP Pressure at a constant level surface, in whole hectopascals. (FM 45, FM 46)
(1) For a HIGH or a LOW, PP shall be the pressure at the centre. Along a ridge line, PP shall be the highest pressure and, along a trough line, it is the lowest pressure.
PAPA Pressure at standard reference levels, in tens of hectopascals up to and at the 20-hPa surface (1 000 hPa = 00), and in tenths of a hectopascal at the 10-hPa surface and above (10 hPa = 00).
(FM 86)
PbPb Pressure, in tens of hectopascals, at the base of the reported humid layer. (FM 88)

SPECIFICATIONS OF SYMBOLIC LETTERS
Volume I.1 A–209
PcPc Pressure level, in tens of hectopascals, derived from a conversion of cloud temperature and related to the level where cloud displacement was observed.
(FM 88)
PdPd Pressure level, in tens of hectopascals, derived from a conversion of cloud temperature. (FM 88)
PePe Estimated pressure, in tens of hectopascals, where cloud displacement was observed. (FM 88)
PwPw Period of wind waves, in seconds. (FM 12, FM 13, FM 14)
— Period of waves, in seconds. (FM 45, FM 46)
(1) See Note (1) under Pw.
(2) The average value of the wave period shall be reported, as obtained from the larger well-formed waves of the wave system being observed.
(3) A confused sea shall be indicated by coding 99 for PwPw.
PwaPwa Period of waves, obtained by instrumental methods, in seconds. (FM 12, FM 13, FM 14, FM 18)
Pw1Pw1 Period of swell waves, in seconds. Pw2Pw2 (FM 12, FM 13, FM 14)
(1) See Note (1) under Pw.
(2) See Note (2) under PwPw.
P1P1 Pressure of the lowest standard isobaric surface, with respect to altitude, for which wind data are reported.
(FM 32, FM 33, FM 34)
(1) The pressure of surfaces up to and including the 100-hPa surface shall be reported in tens of hectopascals. Above the 100-hPa surface, pressures shall be reported in whole hectopascals.
P1P1 P2P2 Pressure of standard isobaric surfaces (1 000 hPa = 00, 925 hPa = 92). . . . (FM 35, FM 36, FM 37, FM 38) PnPn
— Pressure of the specified isobaric surfaces, in whole hectopascals, tenths, hundredths, thousandths, ten-thousandths or hundred-thousandths of a hectopascal, as specified by the indicator figures 11, 22, 33, 44, 55 or 66.
(FM 39, FM 40)
— Pressure of the specified isobaric surfaces (1 000 hPa = 00, 10 hPa = 01). (FM 86)
(1) For SATEM reports, the pressure of surfaces up to and including 10 hPa shall be reported in tens of hectopascals. Above the 10-hPa surface, pressures shall be reported in tenths of a hectopascal.

SPECIFICATIONS OF SYMBOLIC LETTERS
A–210 Volume I.1
P1P1, P2P2, . . . Monthly mean pressures in oceanic areas. P´1P´1, P´2P´2, . . . (FM 73) P´´1P´´1, P´´2P´´2, . . . . . . . . . (1) For units of pressure, see Regulation 73.5.1.
PPP Pressure, in whole hectopascals. (FM 46)
PaPaPa Pressure at the level at which the aircraft is flying, in hectopascals. (FM 41)
(1) This pressure is the one which corresponds, in the ICAO standard atmosphere, to the ICAO flight level indicated in the report received from the aircraft. It is the actual pressure at which the aircraft is flying.
PcPcPc Pressure, in whole hectopascals, at the average cloud top, of the cloud cover as determined by the sounding instruments.
(FM 86, FM 87)
PmPmPm Pressure at the maximum wind level. (FM 32, FM 33, FM 34, FM 35, FM 36, FM 37, FM 38)
(1) The pressure of surfaces up to and including the 100-hPa surface shall be reported in whole hectopascals. Above the 100-hPa surface, pressure shall be reported in tenths of a hectopascal.
PsPsPs Pressure, in hectopascals, of standard constant pressure surface in which the line of maximum wind speed is given.
(FM 45)
PtPtPt Pressure at the tropopause level. (FM 35, FM 36, FM 37, FM 38, FM 86)
(1) See Note (1) under PmPmPm.
PwaPwaPwa Period of waves, obtained by instrumental methods, in tenths of a second. (FM 18)
(1) PwaPwaPwa shall be reported in addition to PwaPwa when the following conditions have been met:
(a) The sea is not calm (i.e. PwaPwaHwaHwa has not been reported as 0000);
(b) PwaPwa has not been reported as //;
(c) The station has the capability of accurately measuring instrumental wave period in units of 0.1 second.
(2) See Notes (1) and (2) under PwPw.
P0P0 P0 Pressure at specified levels. P1P1 P1 (FM 32, FM 33, FM 34, FM 35, FM 36, FM 37, FM 38) . . . PnPnPn (1) See Notes (1) and (2) under PwPw.
P0P0P0 Monthly mean surface pressure, in whole hectopascals, omitting the thousands digit at the time of release of the radiosonde.
(FM 75, FM 76)
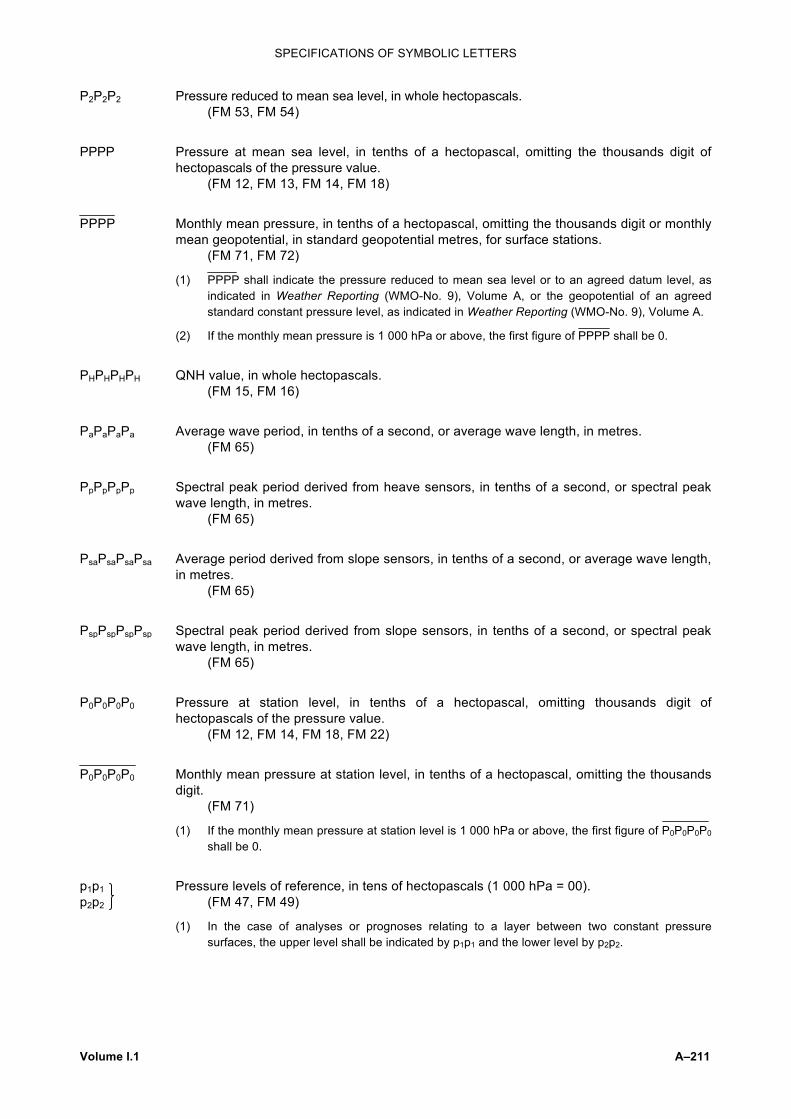
SPECIFICATIONS OF SYMBOLIC LETTERS
Volume I.1 A–211
P2P2P2 Pressure reduced to mean sea level, in whole hectopascals. (FM 53, FM 54)
PPPP Pressure at mean sea level, in tenths of a hectopascal, omitting the thousands digit of hectopascals of the pressure value.
(FM 12, FM 13, FM 14, FM 18)
PPPP Monthly mean pressure, in tenths of a hectopascal, omitting the thousands digit or monthly mean geopotential, in standard geopotential metres, for surface stations.
(FM 71, FM 72)
(1) PPPP shall indicate the pressure reduced to mean sea level or to an agreed datum level, as indicated in Weather Reporting (WMO-No. 9), Volume A, or the geopotential of an agreed standard constant pressure level, as indicated in Weather Reporting (WMO-No. 9), Volume A.
(2) If the monthly mean pressure is 1 000 hPa or above, the first figure of PPPP shall be 0.
PHPHPHPH QNH value, in whole hectopascals. (FM 15, FM 16)
PaPaPaPa Average wave period, in tenths of a second, or average wave length, in metres. (FM 65)
PpPpPpPp Spectral peak period derived from heave sensors, in tenths of a second, or spectral peak wave length, in metres.
(FM 65)
PsaPsaPsaPsa Average period derived from slope sensors, in tenths of a second, or average wave length, in metres.
(FM 65)
PspPspPspPsp Spectral peak period derived from slope sensors, in tenths of a second, or spectral peak wave length, in metres.
(FM 65)
P0P0P0P0 Pressure at station level, in tenths of a hectopascal, omitting thousands digit of hectopascals of the pressure value.
(FM 12, FM 14, FM 18, FM 22)
P0P0P0P0 Monthly mean pressure at station level, in tenths of a hectopascal, omitting the thousands digit.
(FM 71)
(1) If the monthly mean pressure at station level is 1 000 hPa or above, the first figure of P0P0P0P0 shall be 0.
p1p1 Pressure levels of reference, in tens of hectopascals (1 000 hPa = 00). p2p2 (FM 47, FM 49)
(1) In the case of analyses or prognoses relating to a layer between two constant pressure surfaces, the upper level shall be indicated by p1p1 and the lower level by p2p2.

SPECIFICATIONS OF SYMBOLIC LETTERS
A–212 Volume I.1
ppp Amount of pressure tendency at station level during the three hours preceding the time of observation, expressed in tenths of a hectopascal.
(FM 12, FM 13, FM 14, FM 18)
pSpSpS Percentage of total sunshine duration relative to the normal. (FM 71)
p1p1p1 Density in g m–3, rounded to three significant figures, at the altitude given by HH. (FM 39, FM 40)
p24p24p24 Amount of surface pressure change during last 24 hours either positive, zero or negative, in tenths of a hectopascal.
(FM 12, FM 13, FM 14)
Q Octant of the globe. (Code table 3300) (FM 45, FM 46, FM 53, FM 54, FM 85, FM 86, FM 87)
QA Location quality class (Code table 3302) (FM 18)
QL Quality of location. (Code table 3311) (FM 18)
QN Quality of the buoy satellite transmission. (Code table 3313) (FM 18)
QP Quality of the pressure measurement. (Code table 3315) (FM 18)
QTW Quality of the measurement of the water-surface temperature. (Code table 3319) (FM 18)
Qc Quadrant of the globe. (Code table 3333) (FM 13, FM 14, FM 18, FM 20, FM 33, FM 34, FM 36, FM 37, FM 38, FM 40, FM 41, FM 44, FM 47, FM 62, FM 63, FM 64, FM 65, FM 72, FM 76, FM 85)
Qd Quality control indicator. (Code table 3334) (FM 18)
Qd1 Quality control indicator for temperature/salinity profile. (Code table 3334) (FM 18)
Qd2 Quality control indicator for current profile. (Code table 3334) (FM 18)
Ql Quality control indicator for position. (Code table 3334) (FM 18)
Qt Quality control indicator for time. (Code table 3334) (FM 18)

SPECIFICATIONS OF SYMBOLIC LETTERS
Volume I.1 A–213
Qx Indicator of position of group. (FM 18)
(1) See Regulation 18.3.3.
Qz Indicator of depth correction (indication whether probe depths are corrected using hydrostatic pressure or not). (Code table 3318)
(FM 18)
Q2 Quality of the housekeeping parameter (second word in first block of ARGOS platform transmitters terminal sensor data). (Code table 3363)
(FM 18)
Q4 Quality of the measurement of air temperature. (Code table 3363) (FM 18)
QQQ The first three digits of the discharge value in dm3 s–1. (FM 67)
(1) If the discharge is less than 100 dm3 s–1, the first Q or QQ shall be numbered as 0 or 00, as appropriate.
(2) If the discharge is equal to or more than 100 dm3 s–1, QQQ shall be the first three rounded digits of the discharge value. The number of remaining digits is indicated by eQ.
Q1Q1Q1 The first three digits of forecast discharge value (lower limit) in dm3 s–1. (FM 68)
(1) See Notes (1) and (2) under QQQ.
Q2Q2Q2 The first three digits of forecast discharge value (upper limit) in dm3 s–1. (FM 68)
(1) See Notes (1) and (2) under QQQ.
q Relative confidence figure, in tens of per cent, as an overall quality measure of:
(a) Thickness values; (FM 86)
(b) Equivalent blackbody temperature values. (FM 87)
(1) High figures mean high relative confidence.
(2) A value of 0 means the relative confidence is not specified.
q1 Message contraction and data scanning indicator. (Code table 3462) (FM 47, FM 49)
q2 Data contraction indicator. (Code table 3463) (FM 47, FM 49)
qqq The three most significant digits of the discharge of the main receiving water body, in cubic metres per second.
(FM 22)
Rc Composition of release. (Code table 3533) (FM 22)

SPECIFICATIONS OF SYMBOLIC LETTERS
A–214 Volume I.1
Rd Frequency group within which R1R1R1R1 falls. (Code table 3534) (FM 71, FM 72)
Re Possibility of significant chemical toxic health effect. (Code table 3535) (FM 22)
— Extent of all ridging. (Code table 0501) (FM 44)
Rh Maximum height of ridging. (Code table 3538) (FM 44)
Rp Possibility that plume will encounter precipitation in State in which incident occurred. (Code table 3548)
(FM 22)
Rs Rate of ice accretion on ships. (Code table 3551) (FM 12, FM 13, FM 14)
Rt Time at which precipitation given by RRR began or ended. (Code table 3552) (9-group in section 3 of FM 12, FM 13 and FM 14)
(1) When precipitation is occurring at the time of observation or has ended during the hour preceding the observation, the time reported is the "time precipitation began". When precipitation is not occurring at the time of observation and has not occurred in the hour preceding the observation, the time reported is the "time precipitation ended". When two or more periods of precipitation occur during the period covered by W1W2, the time (beginning or ending) of the last period of precipitation is reported.
Rw Wave length of the radar. (Code table 3555) (FM 20)
RR Amount of precipitation or water equivalent of solid precipitation, or diameter of solid deposit. (Code table 3570)
(9-group in section 3 of FM 12, FM 13 and FM 14)
R01R01 Number of days in the month with precipitation equal to or more than 1.0 mm. (FM 71)
R05R05 Number of days in the month with precipitation equal to or more than 5.0 mm. (FM 71)
R10R10 Number of days in the month with precipitation equal to or more than 10.0 mm. (FM 71)
R50R50 Number of days in the month with precipitation equal to or more than 50.0 mm. (FM 71)
R100R100 Number of days in the month with precipitation equal to or more than 100.0 mm. (FM 71)

SPECIFICATIONS OF SYMBOLIC LETTERS
Volume I.1 A–215
R150R150 Number of days in the month with precipitation equal to or more than 150.0 mm. (FM 71)
RRR Amount of precipitation which has fallen during the period preceding the time of observation, as indicated by tR. (Code table 3590)
(FM 12, FM 13, FM 14, FM 22)
R1R1R1 R2R2R2 Radiance values, expressed in ergs with a scale factor as given by u. . . . (FM 87) RnRnRn
RRRR Total amount of precipitation or water equivalent of snow cover on the ground. (Code table 3596)
(FM 67)
RcRcRcRc Combination of up to four elements constituting the composition of release. (FM 22)
RxRxRxRx Highest daily amount of precipitation during the month, in tenths of millimetres. (FM 71)
R1R1R1R1 Total precipitation for the month. (Code table 3596) (FM 71, FM 72)
R24R24R24R24 Total amount of precipitation during the 24-hour period ending at the time of observation, in tenths of millimetres.
(FM 12, FM 14)
rm Type of rocket motor. (Code table 3644) (FM 39, FM 40)
rt Distance between the end of the observed outermost spiral band and the centre of the tropical cyclone. (Code table 3652)
(FM 20)
rara Radiosonde/sounding system used. (Code table 3685) (FM 35, FM 36, FM 37, FM 38)
Steadiness of wind at specified isobaric surfaces. (FM 75, FM 76)
rf1rf1
rf2rf2
. . . rfnrfn
(1) The steadiness factor is the ratio of speed of the monthly mean vector wind to the speed of the monthly mean scalar wind expressed as a percentage. It is reported to the nearest one per cent.
riri Distance, in nautical miles, that the ice has travelled during a 12-hour period. (FM 44)
r1r1 First normalized polar coordinate derived from Fourier coefficients. (FM 65)

SPECIFICATIONS OF SYMBOLIC LETTERS
A–216 Volume I.1
r2r2 Second normalized polar coordinate derived from Fourier coefficients. (FM 65)
rrr Range, in intervals of 5 km, for echoes at distances of 500 km or more. (FM 20)
rrrrrrr Reference value used as new zero for the parameter indicated by a1a1a1 or a2a2a2, in the same units as used for the parameter concerned.
(FM 47, FM 49)
S State of the sea. (Code table 3700) (9-group in Section 3 of FM 12, FM 13 and FM 14, FM 61)
(1) The state of the sea is the state of agitation of the sea resulting from various factors such as wind, swell, currents, angle between swell and wind, etc.
— Sign of temperature (P = positive or zero, M = negative). (FM 50)
SC Shape and definition of the eye of the tropical cyclone. (Code table 3704) (FM 20)
Sh Type of temperature and height data. (Code table 3738) (FM 41)
— Sign of the pressure altitude. (FM 42)
(1) If pressure altitude is zero or positive (aircraft is at or above the standard datum plane of 1013.2 hPa), Sh shall be encoded as the letter F.
(2) If pressure altitude is negative (aircraft is below the standard datum plane of 1013.2 hPa), Sh shall be encoded as the letter A.
Si Stage of development. (Code table 3739) (FM 12, FM 13, FM 14)
S0 Hoar frost or coloured precipitation. (Code table 3761) (9-group in Section 3 of FM 12, FM 13 and FM 14)
S1 Predominant stage of development of ice. (Code table 3763) (FM 44)
(1) If two or more stages of development are of the same concentration, older stages of development shall have precedence over the younger stages.
— Nature of the zone separated by the line formed by the points following the 2CsS1S2Z1 group (part to the right of the line). (Code table 3762)
(FM 45)
S2 Secondary stage of development of ice. (Code table 3763) (FM 44)

SPECIFICATIONS OF SYMBOLIC LETTERS
Volume I.1 A–217
S2 (continued)
— Nature of the zone separated by the line formed by the points following the 2CsS1S2Z1 group (zone inside the line). (Code table 3762)
(FM 45)
S3 Tertiary stage of development of ice. (Code table 3763) (FM 44)
S4 Quaternary stage of development of ice. (Code table 3763) (FM 44)
S5 Quintary stage of development of ice. (Code table 3763) (FM 44)
S6 Type of frozen deposit. (Code table 3764) (9-group in Section 3 of FM 12, FM 13 and FM 14)
S7 Character of snow cover. (Code table 3765) (9-group in Section 3 of FM 12, FM 13 and FM 14)
S8 Snow-storm phenomena (snow raised by wind). (Code table 3766) (9-group in Section 3 of FM 12, FM 13 and FM 14)
S´ State of the water surface in an alighting area. (Code table 3700) (9-group in Section 3 of FM 12, FM 13, FM 14, FM 15 and FM 16)
S´7 Regularity of snow cover. (Code table 3775) (9-group in Section 3 of FM 12, FM 13 and FM 14)
S´8 Evolution of drift snow. (Code table 3776) (9-group in Section 3 of FM 12, FM 13 and FM 14)
SS Duration of sunshine in the past hour, in tenths of an hour. (FM 12, FM 13, FM 14)
— Sign of the temperature. (FM 42)
(a) If temperature is zero or positive, SS shall be encoded as the letters PS.
(b) If temperature is negative, SS shall be encoded as the letters MS.
— Section of front or of pressure system to which NN refers. (Code table 3777) (FM 45)
SfSf Synoptic interpretation of significant features. (Code table 3780) (FM 85)
StSt Intensity of the tropical cyclone. (Code table 3790) (FM 85)

SPECIFICATIONS OF SYMBOLIC LETTERS
A–218 Volume I.1
SSS Duration of sunshine, in hours and tenths of an hour. (FM 12, FM 13, FM 14)
S1S1S1 Total sunshine for the month to the nearest hour. (FM 71)
SSSS Sampling interval (in tenths of a second or in metres). (FM 65)
S0S0S0S0 Salinity, in hundredths of a part per thousand (‰) (practical salinity), at the surface. (FM 62)
Salinity, in hundredths of a part per thousand (‰), at either significant or selected depths starting with sea surface.
S0S0S0S0
S1S1S1S1
. . . SnSnSnSn
(FM 18, FM 64)
SPSPspsp Supplementary information. (Code table 3778) (FM 12, FM 13, FM 14)
sc Nature of snow or ice interpreted from satellite information. (Code table 3833) (FM 85)
sn Sign of the data, and relative humidity indicator. (Code table 3845) (FM 12, FM 13, FM 14, FM 18, FM 22, FM 36, FM 62, FM 63, FM 64, FM 67, FM 71, FM 72, FM 86)
(1) See Note (1) under UUU.
— Sign of the exponent. (Code table 3845) (FM 22, FM 57)
— Sign of the reference value indicated by rrrrrrr. (Code table 3845) (FM 47, FM 49)
sp Pasquill–Gifford stability category. (Code table 3847) (FM 57)
sq Nature and/or type of squall. (Code table 3848) (9-group in Section 3 of FM 12, FM 13 and FM 14)
sr Solar and infrared radiation correction. (Code table 3849) (FM 35, FM 36, FM 37, FM 38)
ss Indicator for the sign and type of measurement of sea-surface temperature. (Code table 3850)
(FM 12, FM 13, FM 14)
sw Indicator for the sign and type of wet-bulb temperature reported. (Code table 3855) (FM 12, FM 13, FM 14)

SPECIFICATIONS OF SYMBOLIC LETTERS
Volume I.1 A–219
sx Sign indicator for the data group which follows (Section 3) and for the cartesian coordinates of the Pole (Section 2). (Code table 3856)
(FM 47)
s1 Type of navigation system. (Code table 3866) (FM 42)
— Distance, in tens of kilometres, of the point position from the station. (FM 45)
(1) When the distance is 100 kilometres, the direction shall be coded for symbol D1 and zero shall be reported for symbol s1.
s2 Type of system used. (Code table 3867) (FM 42)
— Hundreds of kilometres to be added to s1. (FM 45)
s3 Temperature precision. (Code table 3868) (FM 42)
ss Depth of newly fallen snow. (Code table 3870) (9-group in Section 3 of FM 12, FM 13 and FM 14)
— Depth, in centimetres, of layer of snow on ice. (FM 67)
(1) Depth of snow more than, or equal to, 99 cm shall be coded 99.
sasa Tracking technique/status of system used. (Code table 3872) (FM 35, FM 36, FM 37, FM 38)
sisi Forecast value of stability index at point position. (FM 57)
s00s00 Number of days in the month with snow depth more than 0 cm. (FM 71)
s01s01 Number of days in the month with snow depth more than 1 cm. (FM 71)
s10s10 Number of days in the month with snow depth more than 10 cm. (FM 71)
s50s50 Number of days in the month with snow depth more than 50 cm. (FM 71)
sss Total depth of snow. (Code table 3889) (FM 12, FM 14)

SPECIFICATIONS OF SYMBOLIC LETTERS
A–220 Volume I.1
ststst Standard deviation of daily mean values relative to the monthly mean air temperature, in tenths of a degree Celsius.
(FM 71)
Ta Approximate tenths value and sign (plus or minus) of the air temperature at the level given by PaPaPa. (Code table 3931)
(FM 41)
— Approximate tenths value and sign of temperature. (Code table 3931) (FM 86, FM 88)
(1) When the temperature is computed to the nearest whole degree Celsius, code figure 0 or 1 is used for Ta, as appropriate.
Tat Approximate tenths value and sign (plus or minus) of the air temperature at the tropopause level. (Code table 3931)
(FM 35, FM 36, FM 37, FM 38)
Ta0
Ta1
. . . Tan
Approximate tenths value and sign (plus or minus) of:
(a) The air temperature at specified levels starting with station level; (Code table 3931) (FM 35, FM 36, FM 37, FM 38)
(b) Equivalent blackbody temperature. (Code table 3931 (FM 87)
Tc Tropical system characteristics. (Code table 3933) (FM 45, FM 46)
Ti Tropical system intensity. (Code tables 3939, 3940) (FM 45, FM 46)
(1) Two separate code tables are provided for the cases of Tt = 0–8 (Code table 3939) and Tt = 9 (Code table 3940).
When Tt = 9, the code figure given for Ti indicates the force of the strongest wind in the reported cyclonic circulation or, in the case of a prognosis, the strongest wind force expected at the time of the prognosis.
Tn Minimum air temperature. (Code table 3956) (FM 61)
Tt Tropical circulation type. (Code table 3952) (FM 45, FM 46)
Tw Variation of temperature during the period covered by W1W2, associated with glaze or rime. (Code table 3955)
(9-group in Section 3 of FM 12, FM 13 and FM 14)
Tx Maximum air temperature. (Code table 3956) (FM 61)
T1 Topography of greatest extent. (Code table 3962) (FM 44)
(1) If two types are equal in extent, the higher code number is used first.

SPECIFICATIONS OF SYMBOLIC LETTERS
Volume I.1 A–221
T2 Topography of second greatest extent. (Code table 3962) (FM 44)
TT Two-letter indicators preceding, without a space, the time group, where TT = AT (at), FM (from) or TL (until).
(FM 15, FM 16, FM 22, FM 51)
— Absolute value of air temperature, in whole degrees Celsius, at the height given by HH. (FM 39, FM 40)
(1) The sign of temperature shall be disregarded; i.e. –57°C shall be coded as 57.
— Tens and unit digits of air temperature, in degrees Celsius. (FM 41, FM 86)
(1) The tenths of the temperature, which is measured in degrees and tenths, shall be indicated by means of Ta.
— Forecast temperature, in whole degrees Celsius, at the relevant grid point. (FM 50)
TFTF Forecast temperature, in whole degrees Celsius. (FM 51)
(1) For negative values, TFTF shall be preceded by the letter M.
TPTP Air temperature, in whole degrees Celsius, at the level given by h´Ph´P. (FM 53, FM 54)
(1) For negative values, TPTP shall be preceded by the letter M.
TcTc Temperature of cloud top, in whole degrees Celsius, at pressure estimated from infrared observations of clouds. (FM 88)
(1) This value is used to derive the pressure level PcPc in Section 2.
ThTh Air temperature, in whole degrees Celsius, at the height indicated by hxhxhx. (FM 53, FM 54)
(1) For negative values, ThTh shall be preceded by the letter M.
Tn0Tn0 Number of days in the month with minimum air temperature less than 0°C. (FM 71)
TsTs Temperature of the surface (land, water, ice, etc.), in whole degrees Celsius. (FM 15, FM 16, FM 88)
TtTt Air temperature, in whole degrees Celsius, at the tropopause level. (FM 35, FM 36, FM 37, FM 38, FM 86)
(1) This temperature, measured in degrees and tenths, is not rounded off to the next whole degree; only the whole degrees are indicated by TtTt. The tenths of this temperature shall be indicated by means of Tat.

SPECIFICATIONS OF SYMBOLIC LETTERS
A–222 Volume I.1
TvTv Variation in air temperature, in whole degrees Celsius. (9-group in Section 3 of FM 12, FM 13 and FM 14)
TwTw Water temperature at resorts during the bathing season. (9-group in Section 3 of FM 12, FM 13 and FM 14)
Tx0Tx0 Number of days in the month with maximum air temperature less than 0°C. (FM 71)
T0T0 Temperature of the surface (land, water, ice, etc.), in whole degrees Celsius. (FM 86)
T0T0
T1T1
. . . TnTn
Tens and unit digits of:
(a) Air temperature not rounded off, in degrees Celsius, at specified levels starting with station level; (FM 35, FM 36, FM 37, FM 38)
(b) Equivalent blackbody temperature, not rounded off, in degrees Celsius. (FM 87)
(1) The tenths of the temperature, which is measured in degrees and tenths, shall be indicated by means of Ta0, Ta1 . . . Tan.
T1T1 Air temperature, in whole degrees Celsius, at the specified isobaric surfaces. T2T2 (FM 39, FM 40)
. . . TnTn (1) See Note (1) under TT (second specification).
T25T25 Number of days in the month with maximum air temperature equal to or more than 25°C. (FM 71)
T30T30 Number of days in the month with maximum air temperature equal to or more than 30°C. (FM 71)
T35T35 Number of days in the month with maximum air temperature equal to or more than 35°C. (FM 71)
T40T40 Number of days in the month with maximum air temperature equal to or more than 40°C. (FM 71)
T´T ́ Air temperature, in whole degrees Celsius. (FM 15, FM 16)
(1) For negative values, T´T´ shall be preceded by the letter M.
T d́T d́ Dew-point temperature, in whole degrees Celsius. (FM 15, FM 16)
(1) For negative values, T´dT´d shall be preceded by the letter M.
TTT Air temperature, in tenths of a degree Celsius, its sign being given by sn. (FM 12, FM 13, FM 14, FM 18, FM 22, FM 63, FM 64)

SPECIFICATIONS OF SYMBOLIC LETTERS
Volume I.1 A–223
TTT Monthly mean air temperature, in tenths of degrees Celsius, its sign being given by sn. (FM 71, FM 72)
TATATA Air temperature, in tenths of degrees Celsius, at the level given by hIhIhI. (FM 42)
TanTanTan Lowest air temperature of the month, in tenths of degrees Celsius, its sign being given by sn. (FM 71)
TaxTaxTax Highest air temperature of the month, in tenths of degrees Celsius, its sign being given by sn. (FM 71)
TbTbTb Wet-bulb temperature, in tenths of degrees Celsius, its sign being given by sw. (FM 12, FM 13, FM 14)
TdTdTd Dew-point temperature, in tenths of degrees Celsius, its sign being given by sn. (FM 12, FM 13, FM 14, FM 18, FM 22)
(1) See Note (1) under UUU.
— Dew-point temperature, in tenths of degrees Celsius, its sign being given by SS. (FM 42)
(1) See Note (1) under UUU.
TnTnTn Minimum air temperature, in tenths of degrees Celsius, its sign being given by sn. (FM 12, FM 13, FM 14)
TnTnTn Mean daily minimum air temperature of the month, in tenths of degrees Celsius, its sign being given by sn.
(FM 71)
TndTndTnd Lowest daily mean air temperature of the month, in tenths of degrees Celsius, its sign being given by sn.
(FM 71)
TtTtTt Temperature of the element indicated by t, in tenths of degrees Celsius, its sign being given by sn.
(FM 67)
TwTwTw Sea-surface temperature, in tenths of degrees Celsius, its sign being given by sn. (FM 12, FM 13, FM 14, FM 18, FM 36, FM 62)
TwTwTw Monthly mean of sea-surface temperature, in tenths of degrees Celsius, its sign being given by sn.
(FM 72)
TxTxTx Maximum air temperature, in tenths of degrees Celsius, its sign being given by sn. (FM 12, FM 13, FM 14)

SPECIFICATIONS OF SYMBOLIC LETTERS
A–224 Volume I.1
TxTxTx Mean daily maximum air temperature of the month, in tenths of degrees Celsius, its sign being given by sn.
(FM 71)
TxdTxdTxd Highest daily mean air temperature of the month, in tenths of degrees Celsius, its sign being given by sn.
(FM 71)
Temperature, in tenths of degrees Celsius, at specified depths starting with sea surface.
(FM 83)
T0T0T0
T1T1T1
. . . TnTnTn
(1) For negative temperatures, 500 shall be added to the absolute value of the temperature in tenths of degrees Celsius.
Mean monthly air temperature, in tenths of degrees Celsius, at specified isobaric surfaces starting with station level.
(FM 75, FM 76)
T0T0T0
T1T1T1
. . . TnTnTn
(1) For negative temperatures, 500 shall be added to the absolute value of the mean temperature, omitting the thousands digit for temperature equal to or less than – 50.0° Celsius.
Temperatures, in hundredths of degrees Celsius, at either significant or selected depths starting with sea surface.
(FM 18, FM 64)
T0T0T0T0
T1T1T1T1
. . . TnTnTnTn
(1) For negative temperatures, 5000 shall be added to the absolute value of the temperature equal in degrees ° Celsius.
TTTTT Change indicators of trend forecasts and aerodrome forecasts (BECMG, TEMPO). (FM 15, FM 16, FM 51)
(1) Specifications for these change indicators are given in the Technical Regulations (WMO- No. 49, Volume II, [C.3.1].
t Nature of the temperature reading, the value of which is indicated by snTtTtTt. (Code table 4001)
(FM 67)
tE Thickness of the predominant form of ice, snow depth not included. (Code table 4006) (FM 44)
tL Thickness of layer. (Code table 4013) (FM 51, FM 53, FM 54)
tR Duration of period of reference for amount of precipitation, ending at the time of the report. (Code table 4019)
(FM 12, FM 13, FM 14, FM 22)
te Time interval over which the movement of the centre or the eye of the tropical cyclone has been calculated. (Code table 4035)
(FM 20)

SPECIFICATIONS OF SYMBOLIC LETTERS
Volume I.1 A–225
tm Time interval over which the movement of the tropical cyclone has been calculated. (Code table 4044)
(FM 85)
tn Tens digit of the altitude, expressed in units of 300 metres or 500 metres, which applies to the following data groups.
(FM 32, FM 33, FM 34)
tp Period to which measurement of precipitation refers, and/or time at which water equivalent of snow is measured, both coded by RRRR. (Code table 4047)
(FM 67)
(1) This period or time always ends at the exact hour GG of the measurement.
tw Time of commencement of a phenomenon before the hour of observation. (Code table 4055)
(9-group in Section 3 of FM 12, FM 13 and FM 14)
tt Time before observation or duration of phenomena. (Code table 4077) (9-group in Section 3 of FM 12, FM 13 and FM 14)
ttt Time interval between GcGc and
(a) Time to which the prognosis of a data field refers; or
(b) The end of the period to which a prognosis of a mean data field or a data field change refers, in units expressed by ut. (FM 47, FM 49)
Thickness, in geopotential decameters, of layers between PAPA and respectively P1P1 . . . PnPn (thousands figure omitted).
tL1tL1tL1
tL2tL2tL2
. . . tLntLntLn
(FM 86)
tbtbtb Length of averaging period or of data change period, in units expressed by ub. (FM 47)
ULa Unit digit in the reported latitude. (FM 14, FM 33, FM 34, FM 36, FM 37, FM 38, FM 40)
— Units in degrees (or tenths of a degree) in the reported latitude. (FM 88)
ULo Units digit in the reported longitude. (FM 14, FM 33, FM 34, FM 36, FM 37, FM 38, FM 40)
— Units in degrees (or tenths of a degree) in the reported longitude. (FM 88)
U1 Average relative humidity, in tens of per cent, of the layer between the pressure level indicated by PbPb and the level of the tropopause, at the first of the five points indicated by ULa1ULo1, ULa2ULo2, etc.
(FM 88)

SPECIFICATIONS OF SYMBOLIC LETTERS
A–226 Volume I.1
U2 U3 As for U1, but corresponding to the second, third, fourth and fifth points. U4 (FM 88) U5
UvUv Variation in relative humidity, in per cent. (9-group in Section 3 of FM 12, FM 13 and FM 14)
UUU Relative humidity of the air, in per cent, the first figure being zero except for UUU = 100 per cent.
(FM 12, FM 13, FM 14, FM 18, FM 42)
(1) See Regulation 12.2.3.3.1.
u Scale factor. (Code table 4200) (FM 47, FM 49, FM 87, FM 88)
ub Unit of time for averaging period or data change period, expressed by tbtbtb. (Code table 4232)
(FM 47)
up Unit of thickness of sublayers. (Code table 4242) (FM 86)
ut Unit of time for ttt. (Code table 4252) (FM 47)
u1 Units digit of the altitude, expressed in units of 300 metres or 500 metres, for the first data group following.
(FM 32, FM 33, FM 34)
u2 Units digit of the altitude, expressed in units of 300 metres or 500 metres, for the second data group following.
(FM 32, FM 33, FM 34)
u3 Units digit of the altitude, expressed in units of 300 metres or 500 metres, for the third data group following.
(FM 32, FM 33, FM 34)
uu Isopleth values, its units being given by e2. (FM 45, FM 46)
uuu Isopleth values, its units being given by e1. (FM 45)
V Forecast surface visibility. (Code table 4300) (FM 61)
Vb Variation of visibility during the hour preceding the observation. (Code table 4332) (9-group in Section 3 of FM 12, FM 13 and FM 14)

SPECIFICATIONS OF SYMBOLIC LETTERS
Volume I.1 A–227
Vs Visibility seawards (from a coastal station). (Code table 4300) (9-group in Section 3 of FM 12, FM 13 and FM 14)
V´s Visibility over the water surface of an alighting area. (Code table 4300) (9-group in Section 3 of FM 12, FM 13 and FM 14)
VV Horizontal visibility at surface. (Code table 4377) (FM 12, FM 13, FM 14)
(1) If the distance of visibility is between two of the distances given in Code table 4377, the code figure for the smaller distance shall be reported; e.g. if the distance is 350 metres, code figure 03 shall be reported.
VBVB Drifting speed, in cm s–1, of the buoy at the last known position of the buoy given in the groups YYMMJ GGgg/.
(FM 18)
VcVc Surface current speed, in tenths of a knot. (FM 63)
VsVs Visibility towards the sea. (Code table 4377) (9-group in Section 3 of FM 12, FM 13 and FM 14)
V1V1 Number of days in the month with observed or recorded visibility less than 50 m, irrespective of the duration of the observational period.
(FM 71)
V2V2 Number of days in the month with observed or recorded visibility less than 100 m, irrespective of the duration of the observational period.
(FM 71)
V3V3 Number of days in the month with observed or recorded visibility less than 1 000 m, irrespective of the duration of the observational period.
(FM 71)
VVVV Horizontal visibility at surface, in metres, in increments of 50 metres up to 500 metres, in increments of 100 metres between 500 and 5 000 metres, and in increments of 1 000 metres between 5 000 metres up to 9 999 metres, with 9999 indicating visibility of 10 km and above.
(FM 15, FM 16, FM 51, FM 53, FM 54)
(1) If the value is between two increments, it shall be rounded off downward to the lower of the two increments. For example, a visibility of 370 metres shall be reported as 0350, a visibility of 570 metres shall be reported as 0500, a visibility of 3 570 metres shall be reported as 3500, and a visibility of 5 700 metres shall be reported as 5000.
VNVNVNVN Minimum horizontal visibility at surface, in metres. (FM 15, FM 16)
VRVRVRVR Runway visual range, in metres. (FM 15, FM 16)
(1) Runway visual range shall be reported in steps of 25 metres when the runway visual range is less than 400 metres; in steps of 50 metres when it is between 400 metres and 800 metres;
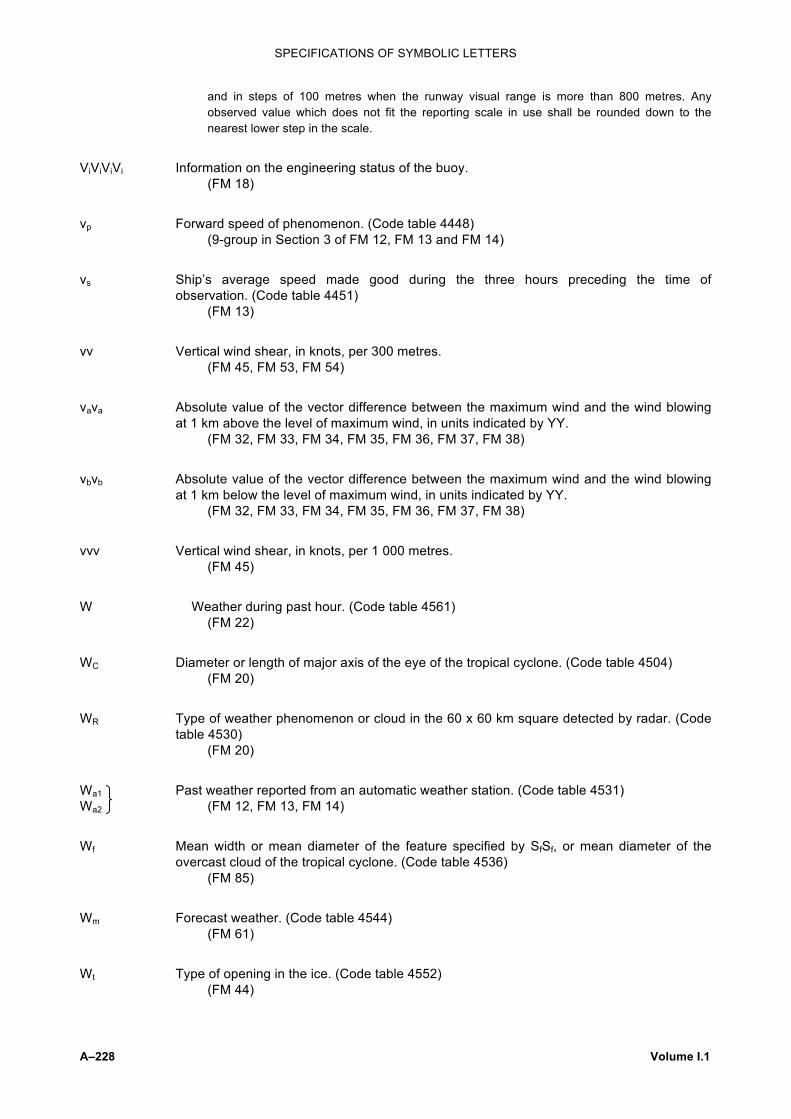
SPECIFICATIONS OF SYMBOLIC LETTERS
A–228 Volume I.1
and in steps of 100 metres when the runway visual range is more than 800 metres. Any observed value which does not fit the reporting scale in use shall be rounded down to the nearest lower step in the scale.
ViViViVi Information on the engineering status of the buoy. (FM 18)
vp Forward speed of phenomenon. (Code table 4448) (9-group in Section 3 of FM 12, FM 13 and FM 14)
vs Ship’s average speed made good during the three hours preceding the time of observation. (Code table 4451)
(FM 13)
vv Vertical wind shear, in knots, per 300 metres. (FM 45, FM 53, FM 54)
vava Absolute value of the vector difference between the maximum wind and the wind blowing at 1 km above the level of maximum wind, in units indicated by YY.
(FM 32, FM 33, FM 34, FM 35, FM 36, FM 37, FM 38)
vbvb Absolute value of the vector difference between the maximum wind and the wind blowing at 1 km below the level of maximum wind, in units indicated by YY.
(FM 32, FM 33, FM 34, FM 35, FM 36, FM 37, FM 38)
vvv Vertical wind shear, in knots, per 1 000 metres. (FM 45)
W Weather during past hour. (Code table 4561) (FM 22)
WC Diameter or length of major axis of the eye of the tropical cyclone. (Code table 4504) (FM 20)
WR Type of weather phenomenon or cloud in the 60 x 60 km square detected by radar. (Code table 4530)
(FM 20)
Wa1 Past weather reported from an automatic weather station. (Code table 4531) Wa2 (FM 12, FM 13, FM 14)
Wf Mean width or mean diameter of the feature specified by SfSf, or mean diameter of the overcast cloud of the tropical cyclone. (Code table 4536)
(FM 85)
Wm Forecast weather. (Code table 4544) (FM 61)
Wt Type of opening in the ice. (Code table 4552) (FM 44)

SPECIFICATIONS OF SYMBOLIC LETTERS
Volume I.1 A–229
W1 Past weather. (Code table 4561) W2 (FM 12, FM 13, FM 14)
we Weather. (Code table 4635) (FM 45)
wi Method by which winds were determined. (Code table 4639) (FM 88)
ww Present weather reported from a manned weather station. (Code table 4677) (FM 12, FM 13, FM 14, FM 22, FM 45)
(1) For correct use of the code, it is necessary to study with care Part III of the International Cloud Atlas (WMO-No. 407) which deals with meteors other than clouds
(2) The first figure of the scale ww indicates grosso modo a division of the scale into ten deciles, numbered 0–9, which correspond to ten principal categories of weather. Firstly, the decile the most suitable to the general state of the weather is chosen; then, in the complete list, the code figure is chosen which best describes the weather at the time of observation or (where specifically mentioned in the code) during the period of one hour immediately preceding it. In making the choice of the decile or in determining the complete code figure ww, one does not take into account meteorological phenomena which have been experienced more than one hour before the observation
wawa Present weather reported from an automatic weather station. (Code table 4680) (FM 12, FM 13, FM 14)
wsws Significant weather. (Code table 4683) (FM 45, FM 46)
w1w1 Present weather phenomenon not specified in Code table 4677, or specification of present weather phenomenon in addition to group 7wwW1W2. (Code table 4687)
(9-group in Section 3 of FM 12, FM 13 and FM 14)
w´w´ Significant present and forecast weather. (Code table 4678) (FM 15, FM 16, FM 51)
www Amount, in millimetres, of precipitable water in a layer. (FM 86)
Amount, in millimetres, of precipitable water in layers between PAPA and respectively P1P1 . . . PnPn
wL1wL1wL1 wL2wL2wL2 . . . wLnwLnwLn
(FM 86)
w1w1w1 Forecast weather. (Code table 4691) (FM 53, FM 54)
X Time of measurement or period of reference and tendency of the element measured, the value of which is indicated by HsHsHsHs or QQQeQ. (Code table 4700)
(FM 67)
(1) This characteristic applies to the measurement of stage or discharge given by the four figures of the group which follow X.

SPECIFICATIONS OF SYMBOLIC LETTERS
A–230 Volume I.1
XRXR Recorder type. (Code table 4770) (FM 63, FM 64)
XtXt Type of drogue. (Code table 4780) (FM 18)
XXX The three most significant digits of radiological quantity or release quantity. (FM 22, FM 57)
x Exponent for spectral wave data. (Code table 4800) (FM 65)
x4 Hemisphere indicator. (Code table 4865) (FM 82)
x1x1 Form in which point position groups are given. (Code table 4887) (FM 45)
x2x2x2 Type of analysis. (Code table 4892) (FM 45)
x3x3x3 Value designator of a given chart or analysis. (Code table 4892) (FM 45)
Y Day of the week (UTC). (Code table 4900) (FM 83)
(1) The day indicated by Y shall be the day of the report or of the group involved; it is, therefore, the day of the observation and not the day of transmission.
(2) When information is given for a period which includes parts of two calendar days, Y shall refer to the second calendar day.
YY Day of the month (UTC), with 01 indicating the first day, 02 the second day, etc.:
(a) On which the actual time of observation falls; (FM 12, FM 13, FM 14, FM 15, FM 16, FM 18, FM 20, FM 32, FM 33, FM 34, FM 35,
FM 36, FM 37, FM 38, FM 39, FM 40, FM 41, FM 42, FM 62, FM 63, FM 64, FM 65, FM 67, FM 85, FM 86, FM 87, FM 88)
(b) Indicating the date (day) of the beginning of the period for which the whole forecast or set of forecasts is valid;
(FM 53, FM 54, FM 61)
(c) Or indicating the day of the observation of the data, from which the chart is prepared; (FM 44, FM 45, FM 46, FM 47, FM 49)
(d) On which the forecast was issued (FM 51);
(e) Indicating the date (day) on which part of the forecast commences or a forecast change commences (FM 51).
(1) In FM 32, FM 33, FM 34, FM 35, FM 36, FM 37, FM 38, FM 39, FM 40, FM 41 and FM 88, YY shall be used to indicate the unit of wind speed in addition to indicating the day of the month. When wind speeds are given in knots, 50 shall be added to YY. When the speed is given in metres per second, YY shall not be modified.

SPECIFICATIONS OF SYMBOLIC LETTERS
Volume I.1 A–231
YFYF (a) Day of the month (UTC) on which the WINTEM message is valid; (FM 50)
(b) Valid day of the month (UTC) of the temperature forecast (FM51).
YaYa Date of accident, calendar day. (FM 22, FM 57)
YbYb Year of beginning of the reference period. (FM 71)
YcYc Year of ending of the reference period. (FM 71)
YeYe (a) Date of end of monitoring operation or release, calendar day; (FM 22)
(b) Day of month (UTC) of end of forecast change. (FM 51)
YrYr Date of issue of the report, calendar day. (FM 22)
— Date of issue of the forecast, calendar day. (FM 57)
YsYs Date of start of monitoring operation or release, calendar day. (FM 22)
— Day of the month (UTC) of observation of satellite data used for the preparation of the chart.
(FM 44)
Y0Y0 Date of analyses/forecasts used to produce the trajectory, calendar day. (FM 57)
Y1Y1 Day of the month of the beginning of the period of validity. (FM 51, FM 53, FM 54)
— Date of the beginning of the period covered by the forecast, calendar day. (FM 57)
— Day of the month (UTC) indicating the date or the beginning of the period covered by the forecast.
(FM 68)
Date of expected arrival of radiological contamination at specified point location, calendar day.
Y1Y1
Y2Y2
. . . YjYj
(FM 57)

SPECIFICATIONS OF SYMBOLIC LETTERS
A–232 Volume I.1
Y2Y2 Day of the month (UTC) indicating the end of the period covered by the forecast. (FM 51, FM 68)
yPyP Number of missing years within the reference period from the calculation of pressure normal.
(FM 71)
yRyR Number of missing years within the reference period from the calculation of normal for precipitation.
(FM 71)
ySyS Number of missing years within the reference period from the calculation of normal for sunshine duration.
(FM 71)
yTyT Number of missing years within the reference period from the calculation of normal for mean air temperature.
(FM 71)
yTxyTx Number of missing years within the reference period from the calculation of normal for mean extreme air temperature.
(FM 71)
yanyan Day of lowest air temperature during the month. (FM 71)
yaxyax Day of highest air temperature during the month. (FM 71)
yeye Number of missing years within the reference period from the calculation of vapour pressure normal.
(FM 71)
yfxyfx Day of highest observed or recorded wind speed during the month. (FM 71)
ynyn Day of lowest daily mean air temperature during the month. (FM 71)
yryr Day of highest daily amount of precipitation during the month. (FM 71)
yxyx Day of highest daily mean air temperature during the month. (FM 71)
yyyyy Position groups in the form indicated by the 333x1x1 group. (FM 45)
ZT Character of the temperature reported by TT. (Code table 5122) (FM 39, FM 40)

SPECIFICATIONS OF SYMBOLIC LETTERS
Volume I.1 A–233
Z0 Optical phenomena. (Code table 5161) (9-group in Section 3 of FM 12, FM 13 and FM 14)
Z1 Nature of evolution of zone S2. (Code table 5162) (FM 45)
ZZ Meteorological zone number by 5 degrees of longitude or latitude. (Code table 5177) (FM 54)
ZdZdZd Length of the cable at which the drogue is attached, in metres. (FM 18)
ZcZcZcZc Length of cable, in metres (thermistor strings). (FM 18)
ZdZdZdZd Total water depth, in metres. (FM 63, FM 64)
ZhZhZhZh Hydrostatic pressure of lower end of cable, in kPa. (FM 18)
zi Present ice situation and trend of conditions over preceding three hours. (Code table 5239) (FM 12, FM 13, FM 14)
zz Variation, location or intensity of phenomena. (Code table 4077) (9-group in Section 3 of FM 12, FM 13 and FM 14)
— Depth, in hundreds of metres, starting with the surface. (FM 63)
z0z0 z1z1 Significant depths, in metres, starting with the surface. . . . (FM 63) znzn
zzz Zone specification. (Code table 1863) (FM 54)
z0z0z0z0 z1z1z1z1 Selected and/or significant depths, in metres, starting with the surface. . . . (FM 18, FM 64) znznznzn
/ // Missing data. . . .
(1) The number of solidi depends on the number of symbolic letters for which no data can be reported.
_____________


Section C
SPECIFICATIONS OF CODE FIGURES (code tables)
a. Numbering system of international code tables
b. Code tables
_____________


Volume I.1 A–237
a. NUMBERING SYSTEM OF INTERNATIONAL CODE TABLES
When coding a report, analysis or forecast, symbolic letters or letter groups are replaced by figures, which specify the value or the state of the corresponding element. In some cases, the specification of the symbolic letter (or group of letters) is sufficient to permit a direct transcription into figures, e.g. GG or PPP. In other cases, these figures are obtained by means of a special code table for each element.
The code tables are used inversely for decoding incoming reports, analyses or forecasts, thus making available the information contained therein.
The code tables are numbered, each code table bearing a number consisting of four figures from 0100 up to 5299 and allotted in the alphabetical order of the symbols to which the code tables correspond. The attribution of the numbers is done in accordance with the following system:
The first two figures represent the number of the main letter of the symbol in alphabetical order. Capital letters are given an odd number, and small letters an even number: 01 for A, 02 for a, 03 for B, 04 for b . . . . . 51 for Z and 52 for z.
The two last figures are allocated in accordance with the following scheme:
00 to 01 are reserved for code tables corresponding to a symbol composed of one letter only (X or x, for instance);
02 to 30 are reserved for code tables corresponding to symbols of the forms XA to XZ, xA to xZ and derived symbols such as XA0 or xA0;
31 to 60 are reserved for code tables corresponding to symbols of the forms Xa to Xz, xa to xz and derived symbols such as Xa0 or xa0;
61 to 70 are reserved for code tables corresponding to symbols of the forms X0 to Xn, or x0 to xn, n being any number;
71 to 99 are reserved for code tables corresponding to symbols of the forms X´, XX, XXX, x´, xx, xxx or any similar forms such as XbXb, X0X0X0, xbxb, x0x0x0.
The numbering system and the numbers attributed to the code tables for the different elements are given in the following table.
Besides the specifications given by the code tables in worldwide use, other sets of code tables are established for regional use, which are numbered with a three-figure number ranging from 120 to 800, and are given in Volume II of the Manual on Codes.

A–238 Volume I.1
NUMBERING SYSTEM OF INTERNATIONAL CODE TABLES
0101 A 0552 Ct 1063 e2 1853 iu 0104 AC 0561 C0 1079 eReR 1855 iw 0114 AN 0562 C1 1085 eTeT 1857 iy 0131 Aa 0639 ci 1095 ewew 1859 iz 0133 Ac 0659 cT, cw 1109 FH 1860 ix 0135 Ae D, DH, DK, DL, 1133 Fc 1861 i0 0139 Ai 0700 DM, Da, De, Dp, Fe, Fp, Fq, 1863 i2, zzz 0152 At Ds, D1
1135 Fs, Fu 1864 i3, nnn
0161 A1, bw 0739 Di 1139 Fi 2061 j1, j2j3j4, j5j6j7j8j9 0163 A3 0755 Dw 1144 Fm 2100 K 0177 AA DtDt 1152 Ft 2200 k 0200 a D0D0 1162 F1, F2, etc. 2262 k1 0204 aC 0777 D1D1 1200 f 2263 k2 0210 aI . . . 1236 fe 2264 k3 0235 ae DnDn 1300 G 2265 k4 0239 ai 0822 dT 1400 g 2266 k5 0244 am 0833 dc 1487 grgr 2267 k6 0252 at dd, dhdh, djdj, 1535 He 2300 L 0262 a1 dmdm, dsds, 1561 H1, H2, H3, H4, H5 2382 LiLi, LjLj 0264 a3 dwdw, dw1dw1, 1600 h 2538 Mh 0265 a4 dw2dw2, d0d0 1677 hshs, htht 2551 Ms 0266 a5 d0d0 hBhBhB, hfhfhf, 2552 Mt 0291 a1a1a1, a2a2a2 0877 1690 hihihi, hshshs, 2555 Mw 0300 B hththt, hxhxhx 2562 M1, M2 0302 BA 1700 I 2582 MiMi, MjMj 0324 BT 1731 Ia 2590 MMM 0359 Bz 1732 Ib 2600 m 0366 BRBR
d1d1
. . . dndn
d1d1 d2d2
. . . dndn 1733 Ic 2604 mS, mT, mc
0370 BtBt 0878 dd Polar 1734 Id 2649 mr 0371 B1B2B3 1735 Ie 2650 ms 0439 bi 1741 Ij 2677 mm 0491 b1b1,b2b2 0880 1743 In 2700 N, Nh, Ns, N´ 0500 C, C´ 1744 Im 2745 Nm C, Ce, Cp, Cq,
da1da1, da2da2 dddd d1d1 d2d2
. . . dndn 1747 Ip 2752 Nt
0501 Cs, Cu, C1, C2, 0901 E 1751 Is 2754 Nv C3, C4, C5, Re 0919 ER 1765 I4 2776 NeNe 0509 CH 0933 Ec 1770 IXIXIX 2836 nf 0513 CL 0935 Ee 1800 i 2863 n3 0515 CM 0938 Eh 1806 iE 2864 n4 0519 CR 0943 Es 1819 iR 2877 nBnB, nGnG 0521 CS 0964 E3 1833 ic 2890 nTnT 0531 Ca 0975 E´ 1840 ih 3131 Pa 0533 Cc 0977 E1E1, E2E2 1841 ij 3133 Pc, hc 0544 Cm 1004 eC, e´ 1845 im 3139 Pi 0551 Cs 1062 e1 1851 is 3152 Pt, ht

NUMBERING SYSTEM OF INTERNATIONAL CODE TABLES
Volume I.1 A–239
(continued)
3155 Pw 3704 SC Ta, Tat 4504 WC 3300 Q 3738 Sh Ta0 4530 WR 3302 QA 3739 Si 3931 Ta1 4531 Wa1, Wa2 3311 QL 3761 S0 . . . 4536 Wf 3313 QN 3762 S1, S2 Tan 4544 Wm 3315 QP S1, S2, S3, 3933 Tc 4552 Wt 3318 Qz
3763 S4, S5 3939 Ti 4561 W, W1, W2
3319 QTW 3764 S6 3940 Ti 4635 we 3333 Qc 3765 S7 3952 Tt 4639 wi
Qd, Qd1, Qd2, Ql, 3766 S8 3955 Tw 4677 ww 3334
Qt 3775 S´7 3956 Tn, Tx 4678 w´w´ 3363 Q2, Q4 3776 S´8 3962 T1, T2 4680 wawa 3462 q1 3777 SS 4001 t 4683 wsws 3463 q2 3778 SPSPspsp 4006 tE 4687 w1w1 3533 Rc 3780 SfSf 4013 tL 4691 w1w1w1 3534 Rd 3790 StSt 4019 tR 4700 X 3535 Re 3833 sc 4035 te 4770 XRXR 3538 Rh 3845 sn 4044 tm 4780 XtXt 3548 Rp 3847 sp 4047 tp 4800 x 3551 Rs 3848 sq 4055 tw 4865 x4 3552 Rt 3849 sr 4077 tt, zz 4887 x1x1 3555 Rw 3850 ss 4200 u 4892 x2x2x2, x3x3x3 3570 RR 3855 sw 4232 ub 4900 Y 3590 RRR 3856 sx 4242 up 5122 ZT
RRRR 3866 s1 4252 ut 5161 Z0 3596
R1R1R1R1 3867 s2 4300 V, Vs, V´s 5162 Z1 3644 rm 3868 s3 4332 Vb 5177 ZZ 3652 rt 3870 ss 4377 VV, VsVs 5239 zi 3685 rara 3872 sasa 4448 vp 3700 S, S´ 3889 sss 4451 vs


Volume I.1 A–241
b. CODE TABLES
0101
A Mirage Code figure
0 No specification 1 Image of distant object raised (looming) 2 Image of distant object raised clear above the horizon 3 Inverted image of distant object 4 Complex, multiple images of distant object (images not inverted) 5 Complex, multiple images of distant object (some images being inverted) 6 Sun or moon seen appreciably distorted 7 Sun visible, although astronomically below the horizon 8 Moon visible, although astronomically below the horizon
Note: When code figures 4, 5 or 6 apply, recognition of the objects is liable to be difficult.
0104
AC Accuracy of the position of the centre or the eye of the tropical cyclone Code figure
1 Eye visible on radar scope, accuracy good (within 10 km) 2 Eye visible on radar scope, accuracy fair (within 30 km) 3 Eye visible on radar scope, accuracy poor (within 50 km) 4 Position of the centre within the area covered by the radar scope, determination by means of the
spiral-band overlay, accuracy good (within 10 km) 5 Position of the centre within the area covered by the radar scope, determination by means of the
spiral-band overlay, accuracy fair (within 30 km) 6 Position of the centre within the area covered by the radar scope, determination by means of the
spiral-band overlay, accuracy poor (within 50 km) 7 Position of the centre outside the area covered by the radar scope, extrapolation by means of the
spiral-band overlay / Accuracy undetermined
0114
AN Type of anemometer Code figure
0 Cup rotor 1 Propeller rotor 2 Wind Observation through Ambient Noise (WOTAN) / Missing value (coded 15 in BUFR)
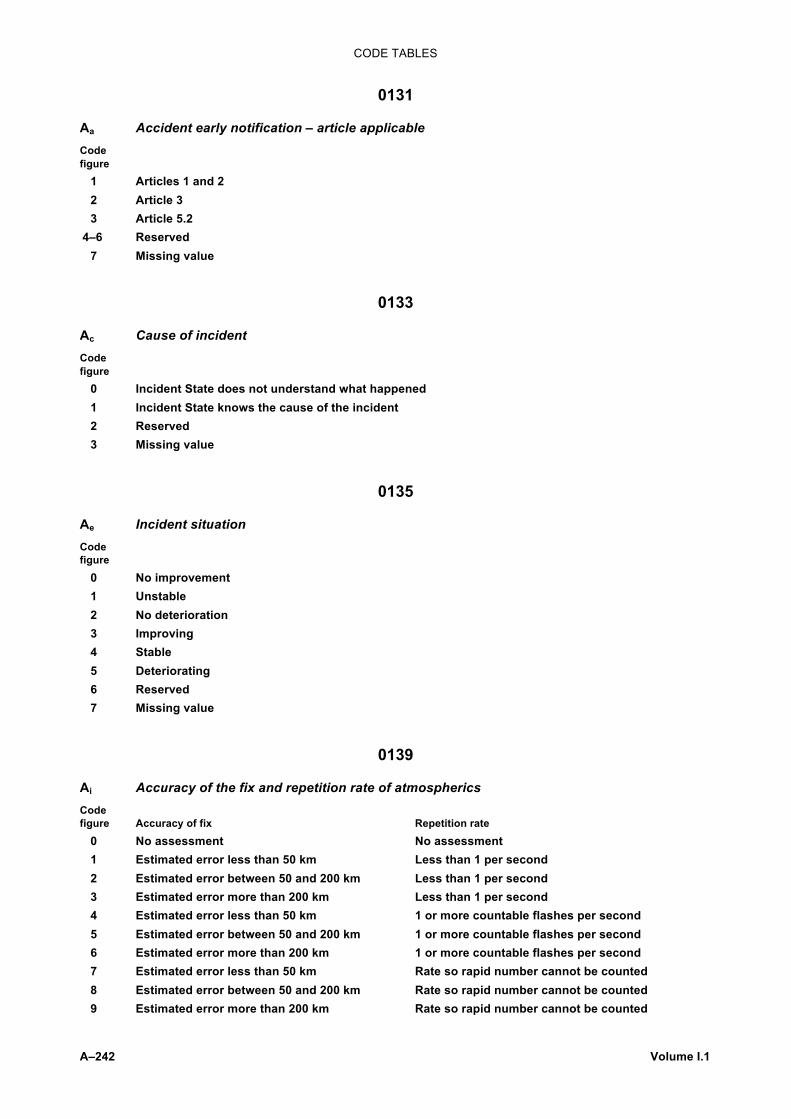
CODE TABLES
A–242 Volume I.1
0131
Aa Accident early notification – article applicable Code figure
1 Articles 1 and 2 2 Article 3 3 Article 5.2
4–6 Reserved 7 Missing value
0133
Ac Cause of incident Code figure
0 Incident State does not understand what happened 1 Incident State knows the cause of the incident 2 Reserved 3 Missing value
0135
Ae Incident situation Code figure
0 No improvement 1 Unstable 2 No deterioration 3 Improving 4 Stable 5 Deteriorating 6 Reserved 7 Missing value
0139
Ai Accuracy of the fix and repetition rate of atmospherics Code figure Accuracy of fix Repetition rate
0 No assessment No assessment 1 Estimated error less than 50 km Less than 1 per second 2 Estimated error between 50 and 200 km Less than 1 per second 3 Estimated error more than 200 km Less than 1 per second 4 Estimated error less than 50 km 1 or more countable flashes per second 5 Estimated error between 50 and 200 km 1 or more countable flashes per second 6 Estimated error more than 200 km 1 or more countable flashes per second 7 Estimated error less than 50 km Rate so rapid number cannot be counted 8 Estimated error between 50 and 200 km Rate so rapid number cannot be counted 9 Estimated error more than 200 km Rate so rapid number cannot be counted

CODE TABLES
Volume I.1 A–243
0152
At Accuracy of determination of the geographical position of the tropical cyclone Code figure
0 Cyclone centre within 10 km of the transmitted position 1 Cyclone centre within 20 km of the transmitted position 2 Cyclone centre within 50 km of the transmitted position 3 Cyclone centre within 100 km of the transmitted position 4 Cyclone centre within 200 km of the transmitted position 5 Cyclone centre within 300 km of the transmitted position / Cyclone centre undetermined
0161
A1 WMO Regional Association area in which buoy, drilling rig or oil- or gas-production platform has been deployed (1 – Region I; 2 – Region II, etc.)
bw Sub-area belonging to the area indicated by A1
Note: Two digit-numbers in the map correspond to A1 suffixed by bw.
0163
A3 Day darkness, worst in direction Da Code figure
0 Day darkness, bad 1 Day darkness, very bad 2 Day darkness, black
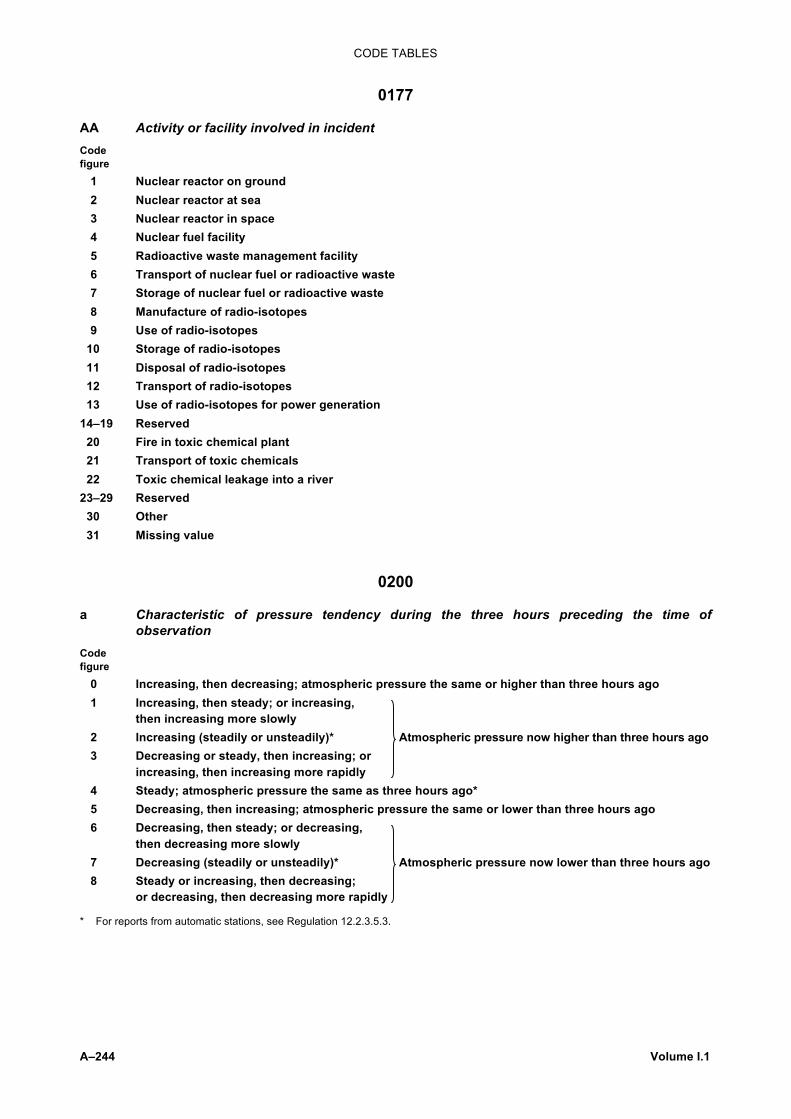
CODE TABLES
A–244 Volume I.1
0177
AA Activity or facility involved in incident Code figure
1 Nuclear reactor on ground 2 Nuclear reactor at sea 3 Nuclear reactor in space 4 Nuclear fuel facility 5 Radioactive waste management facility 6 Transport of nuclear fuel or radioactive waste 7 Storage of nuclear fuel or radioactive waste 8 Manufacture of radio-isotopes 9 Use of radio-isotopes
10 Storage of radio-isotopes 11 Disposal of radio-isotopes 12 Transport of radio-isotopes 13 Use of radio-isotopes for power generation
14–19 Reserved 20 Fire in toxic chemical plant 21 Transport of toxic chemicals 22 Toxic chemical leakage into a river
23–29 Reserved 30 Other 31 Missing value
0200
a Characteristic of pressure tendency during the three hours preceding the time of observation
Code figure
0 Increasing, then decreasing; atmospheric pressure the same or higher than three hours ago 1 Increasing, then steady; or increasing,
then increasing more slowly 2 Increasing (steadily or unsteadily)* Atmospheric pressure now higher than three hours ago 3 Decreasing or steady, then increasing; or
increasing, then increasing more rapidly 4 Steady; atmospheric pressure the same as three hours ago* 5 Decreasing, then increasing; atmospheric pressure the same or lower than three hours ago 6 Decreasing, then steady; or decreasing,
then decreasing more slowly 7 Decreasing (steadily or unsteadily)* Atmospheric pressure now lower than three hours ago 8 Steady or increasing, then decreasing;
or decreasing, then decreasing more rapidly
* For reports from automatic stations, see Regulation 12.2.3.5.3.

CODE TABLES
Volume I.1 A–245
0204
aC Change in character of the eye during the 30 minutes preceding the time of observation Code figure
0 Eye has first become visible during the past 30 minutes 1 No significant change in the characteristics or size of the eye 2 Eye has become smaller with no other significant change in characteristics 3 Eye has become larger with no other significant change in characteristics 4 Eye has become less distinct with no significant change in size 5 Eye has become less distinct and decreased in size 6 Eye has become less distinct and increased in size 7 Eye has become more distinct with no significant change in size 8 Eye has become more distinct and decreased in size 9 Eye has become more distinct and increased in size / Change in character and size of eye cannot be determined
0210
aI Trend in behaviour of ice Code figure
0 No change 1 Ice situation improving (for navigation) 2 Ice situation worsening (for navigation) 3 Ice breaking up 4 Ice opening or drifting away 5 Ice increasing 6 Ice freezing together 7 Ice drifting in 8 Ice under pressure 9 Ice hummocking, or hummocking and screwing / Undetermined or unknown
0235
ae Tendency of echo pattern Code figure Tendency of intensity Tendency of the area
1 Decreasing Decreasing 2 Decreasing No appreciable change 3 Decreasing Increasing 4 No appreciable change Decreasing 5 No appreciable change No appreciable change 6 No appreciable change Increasing 7 Increasing Decreasing 8 Increasing No appreciable change 9 Increasing Increasing / Undetermined Undetermined

CODE TABLES
A–246 Volume I.1
0239
ai Distribution of atmospherics Code figure
0 No atmospherics 2 Isolated point of activity 4 Sources of atmospherics activity located in the area enclosed by lines joining successive points
LaLaLoLok 6 Origin of atmospherics activity approximating a line joining successive points LaLaLoLok 9 No report due to technical reasons
0244
am Portion of the maritime area Code figure
0 Whole of the area AAA 1 NE quadrant of the area AAA 2 Eastern half of the area AAA 3 SE quadrant of the area AAA 4 Southern half of the area AAA 5 SW quadrant of the area AAA 6 Western half of the area AAA 7 NW quadrant of the area AAA 8 Northern half of the area AAA 9 Rest of the area AAA
0252
at Apparent 24-hour change in intensity of the tropical cyclone Code figure
0 Much weakening 1 Weakening 2 No change 3 Intensification 4 Strong intensification 9 Not observed previously / Undetermined

CODE TABLES
Volume I.1 A–247
0262
a1 Reason for no report or ground equipment employed Code figure
0 Launch not scheduled 1 Rocket motor failure 2 Instrument (or) telemetry signal not received 3 Ground tracking equipment failure 4 Weather prohibited launch 5 Range restrictions prohibited launch 6 Lack of expendables prohibited launch 7 Radar only employed 8 Radar and telemetry equipment employed 9 Telemetry equipment only employed
Notes:
(1) Code figures 0 to 6 shall be used to show the reason for no report when a scheduled launch is aborted, or when a launch is accomplished but no data are available.
(2) Code figures 7 to 9 shall be used to show the type of ground equipment employed during a satisfactory launch.
0264
a3 Standard isobaric surface for which the geopotential is reported
Code figure
1 1 000 hPa 2 925 hPa 5 500 hPa 7 700 hPa 8 850 hPa
0265
a4 Type of measuring equipment used Code figure
0 Pressure instrument associated with wind-measuring equipment 1 Optical theodolite 2 Radiotheodolite 3 Radar 4 Pressure instrument associated with wind-measuring equipment but pressure element failed during
ascent 5 VLF-Omega 6 Loran-C 7 Wind profiler 8 Satellite navigation 9 Reserved

CODE TABLES
A–248 Volume I.1
0266
a5 Type of report and unit of reported radiological quantity Code figure
1 Report of accidental radioactivity release to atmosphere, in becquerels (Bq) 2 Report of accidental radioactivity release to water, in becquerels (Bq) 3 Report of accidental radioactivity release to both atmosphere and water, in becquerels (Bq) 4 Report of accidental radioactivity release to ground water, in becquerels (Bq) 5 Report of named isotope concentration in precipitation, in becquerels per litre (Bq l–1) 6 Report of named isotope type including gross beta concentration in air, in becquerels per cubic
metre (Bq m–3), and, if data available, the density of deposits, in becquerels per square metre (Bq m–2) 7 Report of gamma dose in air along main transport path and, if data available, on land surface, in
millisieverts (mSv) 8 Report of an airborne observing station of named isotope type including concentration in air, in
becquerels per cubic metre (Bq m–3), and/or report of gamma dose in air, in millisieverts (mSv) 9 Reserved
0291
a1a1a1, a2a2a2 Type of parameter
Code figure
Field parameter Reference value
Unit Occurrence
and/or intensity of
phenomenon
Remarks
000 — — — Indicates missing parameter
001 Pressure 0 hPa 1 hPa 002 Geopotential height 0 gpm 10 gpm 003 Geometrical height 0 m 10 m 004 Temperature 0°C 1°C 005 Maximum temperature 0°C 1°C Surface level only 006 Minimum temperature 0°C 1°C Surface level only 007 Temperature deviation from normal 0°C 1°C 008 Potential temperature 0°C 1°C 009 Pseudo-adiabatic potential
temperature 0°C 1°C
010 Dew-point temperature 0°C 1°C 011 Dew-point depression (or deficit) 0°C 1°C 012 Specific humidity 0 g kg–1 0.1 g kg–1 013 Relative humidity 0 % 1 % 014 Humidity mixing ratio 0 g kg–1 0.1 g kg–1 015 Stability index 0°C 1°C See Code table 2677 for
specific parameters 016 Saturation deficit 0 hPa 0.1 hPa
(for a specific level) 0 gpm 10 gpm (for a specific layer)
017 4-layer lifted index 0°C 1°C 018 Reserved 019 020 Wind direction 0° 10° 021 Wind speed 0 m s-1 1 m s–1 022 Wind direction and speed 0°, 0 m s–1 5°, 1 m s–1 TEMP code form

CODE TABLES
Volume I.1 A–249
Code figure
Field parameter Reference value
Unit Occurrence
and/or intensity of
phenomenon
Remarks
023 024
Wind components 0 m s-1 1 m s-1
Relative to coordinate system used
025 Wind speed 0 kt 1 kt 026 Wind direction and speed 0°, 0 kt 5°, 1 kt TEMP code form 027 028
Wind components 0 kt 1 kt
Relative to coordinate system used
029 Stream function 0 m2 s–1 105 m2 s–1 030 Relative vorticity 0 s–1 10–5 s–1 031 Absolute vorticity 0 s–1 10–5 s–1 032 Relative vorticity advection 0 s–2 10–9 s–2 033 Absolute vorticity advection 0 s–2 10–9 s–2 034 Horizontal velocity divergence 0 s–1 10–5 s–1 035 Horizontal moisture divergence 0 g kg–1 s–1 0.1 g kg–1 s–1 036 Geostrophic vorticity 0 s–1 10–5 s–1 037 Geostrophic vorticity advection 0 s–2 10–9 s–2 038 Reserved 039 Velocity potential 0 m2 s–1 103 m2 s–1 040 Vertical velocity (↓) 0 cb s–1 10–1 cb s–1 041 Vertical velocity (↓) 0 cb/12 h 1 cb/12 h 042 Vertical velocity (↓) 0 hPa h–1 1 hPa h–1 043 Vertical velocity (↑) 0 mm s–1 1 mm s–1 044 Vertical wind shear 0 m s–1/1 000 m 1 m s–1/1 000 m 045 Vertical wind shear 0 kt/1 000 m 1 kt/1 000 m
046 Lapse rate 0°C/100 m 0.1°C/100 m 047 Precipitable water 0 mm 1 mm 048 Convective precipitation amount 0 mm 1 mm 049 Precipitation rate 0 mm h–1 1 mm h–1 050 Precipitation amount 0 mm 1 mm Surface level only 051 Snow depth 0 cm 1 cm Surface level only
052 Outgoing long-wave radiation 0 joule 0.1 joule (1 J = 107 ergs)
Integrated over 24 hours
053 Outgoing short-wave radiation 0 joule 0.1 joule Integrated over 24 hours
054 Incoming short-wave radiation 0 joule 0.1 joule Integrated over 24 hours 055 Non-convective precipitation
amount 0 mm 1 mm
056 057
Reserved
058 Afternoon SST warming 0°C 0.01°C 059 Temperature anomaly 0°C 0.01°C 060 Deviation of sea level from mean 0 cm 1 cm 061 Sea temperature 0°C 0.1°C
062 Salinity 0 o/oo 063 Density 064 Significant height of combined
wind waves and swell 0 m 0.5 m Threshold value of 0.5 m
065 Direction of swell 0° 10° 066 Significant height of swell 0 m 0.5 m Threshold value of 0.5 m 067 Mean period of swell 0 s 1 s 068 Direction of wind waves 0° 10° 069 Significant height of wind waves 0 m 0.5 m Threshold value of 0.5 m
070 Mean period of wind waves 0 s 1 s

CODE TABLES
A–250 Volume I.1
Code figure
Field parameter Reference value
Unit Occurrence
and/or intensity of
phenomenon
Remarks
071 Direction of current 0° 10° 072 Speed of current 0 cm s–1 1 cm s–1 073 074
Current components 0 cm s–1 1 cm s–1
Relative to coordinate system used
075 Primary wave direction 0° 10°
076 Primary wave period 0 s 1 s 077 Secondary wave direction 0° 10° 078 Secondary wave period 0 s 1 s 079 Cloud cover 0, 1, 2, 3, 4,
5, 6, 7, 8 Cloud amount in oktas (see
Code table 2677 for specific parameters)
080 Thunderstorm 0, 1 0 = absent, 1 = occurring 081 Tropical revolving storm 0, 1 0 = absent, 1 = occurring 082 Line squall 0, 1 0 = absent, 1 = occurring 083 Hail 0, 1 0 = absent, 1 = occurring 084 Turbulence (generally associated
with cloud) 0, 1, 2 0 = nil or slight,
1 = moderate, 2 = severe 085 Clear air turbulence 0, 1, 2 0 = nil or slight,
1 = moderate, 2 = severe 086 Icing 0, 1, 2 0 = nil or slight,
1 = moderate, 2 = severe 087 Mountain waves 0, 1 0 = absent, 1 = occurring 088 Sandstorm/duststorm 0, 1 0 = absent, 1 = occurring 089 Freezing rain 0, 1 0 = absent, 1 = occurring 090 Ice concentration 0, 1 0 = no sea ice,
1 = occurrence of sea ice 091 Ice thickness 0 m 1 m 092 Ice drift u-component 0 km/day 1 km/day 093 Ice drift v-component 0 km/day 1 km/day 094 Ice growth 0 dm 1 dm 095 Ice convergence/divergence 0 s–1 1 s–1 096 097 098 099
Reserved
100 Pressure 0 daPa 1 daPa 101 Geopotential thickness 0 gpm 1 gpm 102 Geopotential height 0 gpm 1 gpm 103 Geometrical height 0 m 1 m 104 Temperature 0°C 0.1°C 105
.
.
.
111
Reserved
112 Specific humidity 0 kg kg–1 1 kg kg–1 113 Relative humidity 0 % 0.1 % 114 Humidity mixing ratio 0 kg kg–1 1 kg kg–1 115 Stability (lifted) index 0°C 0.1°C 116 Saturation deficit 0 hPa
0 gpm 1 hPa 1 gpm

CODE TABLES
Volume I.1 A–251
Code figure
Field parameter Reference value
Unit Occurrence
and/or intensity of
phenomenon
Remarks
117 118 119
Reserved
120 Wind direction 0° 1° 121
.
.
.
128
Reserved
129 Stream function 0 m2 s–1 1 m2 s–1 130 Relative vorticity 0 s–1 10-6 s–1 131 Absolute vorticity 0 s–1 10-6 s–1 132 Relative vorticity advection 0 s–2 1 s–2 133 Absolute vorticity advection 0 s–2 1 s–2 134 Horizontal velocity divergence 0 s–1 1 s–1 135 Horizontal moisture divergence 0 kg kg–1 s–1 1 kg kg–1 s–1 136 Geostrophic vorticity 0 s–1 1 s–1 137 Geostrophic vorticity advection 0 s-2 1 s-2 138 Reserved 139 Velocity potential 0 m2 s–1 1 m2 s–1 140 Vertical velocity (↓) 0 hPa s–1 1 hPa s–1 141 Vertical velocity (↓) 0 dPa s–1 1 dPa s–1
(1 microbar s–1)
142 Reserved 143 Vertical velocity (↑) 0 m s–1 1 m s–1 144 Vertical wind shear 0 m s–1/1 m 1 m s–1/1 m 145 Reserved 146 Lapse rate 0°C/1 m 1°C/1 m 147 Precipitable water 0 m 1 m 148 Reserved 149 Precipitation rate 0 m s-1 1 m s–1 150 Precipitation amount 0 m 1 m 151 Snow depth 0 m 1 m 152 Outgoing long-wave radiation 0 joule 1 joule
(1 J = 107 ergs)
153 Outgoing short-wave radiation 0 joule 1 joule 154 Incoming short-wave radiation 0 joule 1 joule 155 156 157 158 159
Reserved
160 Deviation of sea level from mean 0 m 1 m 161 Sea temperature 0°C 1°C 162 Sea-surface temperature 0°C 0.01°C 163 SST anomaly 0°C 0.01°C 164 Significant height of combined
wind waves and swell 0 m 1 m
165 Direction of swell 0° 1° 166 Significant height of swell 0 m 1 m 167 Reserved

CODE TABLES
A–252 Volume I.1
Code figure
Field parameter Reference value
Unit Occurrence
and/or intensity of
phenomenon
Remarks
168 Direction of wind waves 0° 1° 169 Significant height of wind waves 0 m 1 m 170 Reserved 171 Direction of current 0° 1° 172 Speed of current 0 m s–1 1 m s–1 173 174
Current components 0 cm s–1 1 cm s–1
175 176 177 178 179
Reserved
180 Mixed layer depth 0 cm 1 cm 181 Transient thermocline depth 0 cm 1 cm 182 Main thermocline depth 0 cm 1 cm 183 Main thermocline depth anomaly 0 cm 1 cm 184
.
.
.
201
Reserved
202 Pressure reduced to mean sea level 0 hPa 1 hPa 203 Pressure tendency 0 hPa/3 h 0.1 hPa/3 h 204
.
.
.
211
Reserved
212 Virtual temperature 0°C 1°C 213
.
.
.
220
Reserved
221 Radar spectra Direction and frequency 222 Radar spectra Direction and radial number 223 Radar spectra Radial number and radial
number 224 225
Reserved
226 Pressure anomaly 0 hPa 1 hPa 227 Geopotential height anomaly 0 gpm 1 gpm 228 Wave spectra Direction and frequency 229 Wave spectra Direction and radial number 230 Wave spectra Radial number and radial
number 231
.
.
.
237
Reserved
238 Sigma coord. vertical velocity 0 s–1 1 s–1

CODE TABLES
Volume I.1 A–253
Code figure
Field parameter Reference value
Unit Occurrence
and/or intensity of
phenomenon
Remarks
239 240 Reserved 241 242 Absolute divergence 0 s–1 1 s–1 243 Reserved 244 Relative divergence 0 s–1 1 s–1 245 Vertical u-component shear 0 s–1 1 s–1 246 Vertical v-component shear 0 s–1 1 s–1 247
.
.
. Reserved
254 255 Vapour pressure 0 hPa 1 hPa 256 Reserved 257 Evaporation 0 mm 1 mm 258 259
Reserved
260 Thunderstorm probability 0 % 1 % 261 262 Reserved 263 264 Snowfall rate water equivalent 0 kg m–2 1 kg m–2 265 Water equivalent of acc. snow 0 kg m–2 1 kg m–2 266
.
.
.
271
Reserved
272 Convective cloud cover 0 % 1 % 273 Low cloud cover 0 % 1 % 274 Medium cloud cover 0 % 1 % 275 High cloud cover 0 % 1 % 276 Cloud water 0 mm 1 mm 277 278 279 280
Reserved
281 Land-sea mask 0, 1 0 = sea, 1 = land 282 Reserved 283 Surface roughness 0 m 1 m 284 Albedo 0 % 1 % 285 Soil temperature 0°C 1°C 286 Soil moisture content 0 mm 1 mm 287 Vegetation 0 % 1 % 288 289 290 Reserved 291 292 293 Direction of ice drift 0° 10°

CODE TABLES
A–254 Volume I.1
Code figure
Field parameter Reference value
Unit Occurrence
and/or intensity of
phenomenon
Remarks
294 Speed of ice drift 0 km/day 1 km/day
295 Reserved . . .
310 311 Net short-wave radiation (surface) 0 joule 0.1 joule 312 Net long-wave radiation (surface) 0 joule 0.1 joule 313 Net short-wave radiation (top of
atmosphere) 0 joule 0.1 joule
314 Net long-wave radiation (top of atmosphere)
0 joule 0.1 joule
315 Long-wave radiation 0 joule 0.1 joule 316 Short-wave radiation 0 joule 0.1 joule 317 Global radiation 0 joule 0.1 joule 318 319 320
Reserved
321 Latent heat flux 0 joule 0.1 joule 322 Sensible heat flux 0 joule 0.1 joule 323 Boundary layer dissipation 0 joule 0.1 joule 324 325 326
Reserved
327 Image data 328
.
.
.
454
Reserved for use by originating centre
455 . . .
998
Reserved
999 Reserved for totally fixed formats 999000 to 999999, for example: 999001 TTddfffTTddfffTTddfffTTddfffhh
TTddfff = temperature, wind direction and wind speed for 400-hPa, 300-hPa, 250-hPa and 200-hPa levels
hh = height of tropopause in 300-metre units Spaces between data groups omitted. Note: Code figures 999000 to 999999 for a1a1a1, a2a2a2 do not represent parameters. These code figures are used to indicate various standard formats in which the data content is given and which will be defined in an appropriate publication.
Where applicable, the indication of all groups specifying the level of reference is to be omitted
Notes: (1) The code figures 000 to 327 are used to represent parameters which are exchanged between a number of
centres; since the products generated by centres can be extremely diverse, code figures 328 to 454 are reserved for definition by the originating centre, and may differ from centre to centre.
(2) Where it is necessary for a centre to redefine this table completely, a code figure nTnT = 01–99 shall indicate the relevant redefined code table. The code figures a1a1a1, a2a2a2 shall then refer to the appropriate redefined code table.
(3) The first part of Code table 0291 (code figures 000–099) shall be used without the inclusion in the report of the optional group 2nTnTa1a2. Parameters in the latter part of the code table (100–999) can only be used with the inclusion in the report of the optional group 2nTnTa1a2.

CODE TABLES
Volume I.1 A–255
0300
B Turbulence Code figure
0 None 1 Light turbulence 2 Moderate turbulence in clear air, occasional 3 Moderate turbulence in clear air, frequent 4 Moderate turbulence in cloud, occasional 5 Moderate turbulence in cloud, frequent 6 Severe turbulence in clear air, occasional 7 Severe turbulence in clear air, frequent 8 Severe turbulence in cloud, occasional 9 Severe turbulence in cloud, frequent
0302
BA Turbulence Code figure
0 None (acceleration less than 0.15 g) 1 Light (acceleration from 0.15 g to, but not including 0.5 g) 2 Moderate (acceleration from 0.5 g to 1.0 g) 3 Severe (acceleration > 1.0 g)
Note: These accelerations, which may be positive or negative, are deviations from the normal acceleration of gravity (1.0 g).
0324
BT Type of release Code figure
0 No release 1 Release to atmosphere 2 Release to water 3 Release to both atmosphere and water 4 Expected release to atmosphere 5 Expected release to water 6 Expected release to both atmosphere and water 7 Missing value
0359
Bz High-level turbulence Code figure
0 None 1 Moderate 2 Severe

CODE TABLES
A–256 Volume I.1
0366
BRBR Friction coefficient/braking action Code figure
00 Friction coefficient 0.00 01 Friction coefficient 0.01 . . . 88 Friction coefficient 0.88 89 Friction coefficient 0.89 90 Friction coefficient 0.90 91 Braking action poor 92 Braking action medium/poor 93 Braking action medium 94 Braking action medium/good 95 Braking action good
96–98 Reserved 99 Unreliable // Braking conditions not reported and/or runway not operational
0370
BtBt Type of buoy Code figure
00 Unspecified drifting buoy 01 Standard Lagrangian drifter (Global Drifter Programme) 02 Standard FGGE-type drifting buoy (non-Lagrangian meteorological drifting buoy) 03 Wind measuring FGGE-type drifting buoy (non-Lagrangian meteorological drifting buoy) 04 Ice float
05–07 Reserved 08 Unspecified subsurface float 09 SOFAR 10 ALACE 11 MARVOR 12 RAFOS
13–15 Reserved 16 Unspecified moored buoy 17 Nomad 18 3-metre discus 19 10–12-metre discus 20 ODAS 30 series 21 ATLAS (e.g. TAO area) 22 TRITON 23 Reserved 24 Omnidirectional wave rider 25 Directional wave rider 26 Subsurface ARGO float
27–62 Reserved // Missing value (coded 63 in BUFR)

CODE TABLES
Volume I.1 A–257
0371
B1B2B3 Number designating a 10° x 10° square in the geographical grid formed by the intersection of two meridians and two parallels of latitude
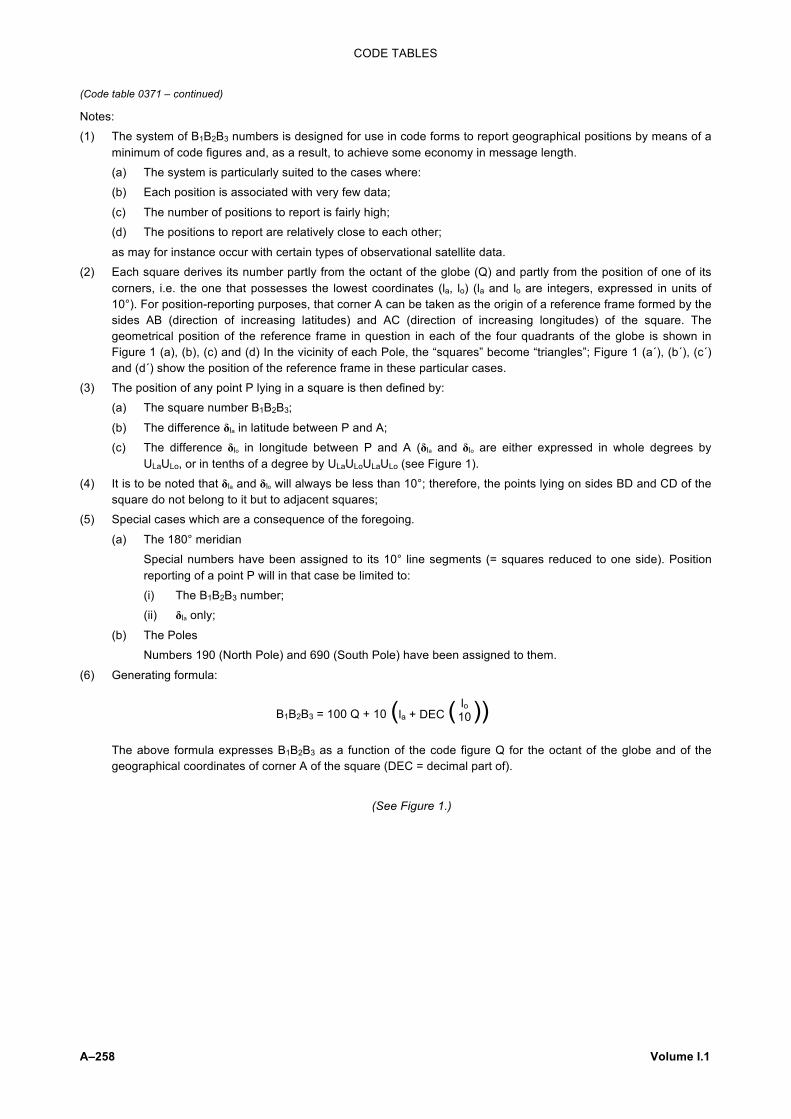
CODE TABLES
A–258 Volume I.1
(Code table 0371 – continued)
Notes:
(1) The system of B1B2B3 numbers is designed for use in code forms to report geographical positions by means of a minimum of code figures and, as a result, to achieve some economy in message length.
(a) The system is particularly suited to the cases where:
(b) Each position is associated with very few data;
(c) The number of positions to report is fairly high;
(d) The positions to report are relatively close to each other;
as may for instance occur with certain types of observational satellite data.
(2) Each square derives its number partly from the octant of the globe (Q) and partly from the position of one of its corners, i.e. the one that possesses the lowest coordinates (la, lo) (la and lo are integers, expressed in units of 10°). For position-reporting purposes, that corner A can be taken as the origin of a reference frame formed by the sides AB (direction of increasing latitudes) and AC (direction of increasing longitudes) of the square. The geometrical position of the reference frame in question in each of the four quadrants of the globe is shown in Figure 1 (a), (b), (c) and (d) In the vicinity of each Pole, the “squares” become “triangles”; Figure 1 (a´), (b´), (c´) and (d´) show the position of the reference frame in these particular cases.
(3) The position of any point P lying in a square is then defined by:
(a) The square number B1B2B3;
(b) The difference δla in latitude between P and A;
(c) The difference δlo in longitude between P and A (δla and δlo are either expressed in whole degrees by ULaULo, or in tenths of a degree by ULaULoULaULo (see Figure 1).
(4) It is to be noted that δla and δlo will always be less than 10°; therefore, the points lying on sides BD and CD of the square do not belong to it but to adjacent squares;
(5) Special cases which are a consequence of the foregoing.
(a) The 180° meridian
Special numbers have been assigned to its 10° line segments (= squares reduced to one side). Position reporting of a point P will in that case be limited to:
(i) The B1B2B3 number;
(ii) δla only;
(b) The Poles
Numbers 190 (North Pole) and 690 (South Pole) have been assigned to them.
(6) Generating formula:
lo B1B2B3 = 100 Q + 10 (la + DEC ( 10 ))
The above formula expresses B1B2B3 as a function of the code figure Q for the octant of the globe and of the geographical coordinates of corner A of the square (DEC = decimal part of).
(See Figure 1.)

CODE TABLES
Volume I.1 A–259
(Code table 0371– continued)
FIGURE 1

CODE TABLES
A–260 Volume I.1
0439
bi Ice of land origin Code figure
0 No ice of land origin 1 1–5 icebergs, no growlers or bergy bits 2 6–10 icebergs, no growlers or bergy bits 3 11–20 icebergs, no growlers or bergy bits 4 Up to and including 10 growlers and bergy bits – no icebergs 5 More than 10 growlers and bergy bits – no icebergs 6 1–5 icebergs, with growlers and bergy bits 7 6–10 icebergs, with growlers and bergy bits 8 11–20 icebergs, with growlers and bergy bits 9 More than 20 icebergs, with growlers and bergy bits – a major hazard to navigation / Unable to report, because of darkness, lack of visibility or because only sea ice is visible

CODE TABLES
Volume I.1 A–261
0491
b1b1, b2b2 Type of special level Code figure
00 — 01 Ground surface 02 Cloud base level 03 Level of cloud tops 04 Level of 0°C isotherm 05 Level of adiabatic condensation 06 Maximum wind level 07 Tropopause
08–09 Reserved 10 Lower limit of layer of instability with hail and/or thunderstorms 11 Upper limit of layer of instability with hail and/or thunderstorms 12 Not used 13 Upper limit of tropical revolving storm 14 Lower limit of layer of moderate turbulence (generally associated with cloud) 15 Upper limit of layer of moderate turbulence (generally associated with cloud) 16 Lower limit of layer of severe turbulence (generally associated with cloud) 17 Upper limit of layer of severe turbulence (generally associated with cloud) 18 Lower limit of layer of moderate clear air turbulence 19 Upper limit of layer of moderate clear air turbulence 20 Lower limit of layer of severe clear air turbulence 21 Upper limit of layer of severe clear air turbulence 22 Lower limit of layer of moderate icing 23 Upper limit of layer of moderate icing 24 Lower limit of layer of severe icing 25 Upper limit of layer of severe icing 26 Lower limit of layer of mountain waves 27 Upper limit of layer of mountain waves 28 Lower limit of layer of sandstorm/duststorm 29 Upper limit of layer of sandstorm/duststorm 30 Lower limit of layer of freezing rain 31 Upper limit of layer of freezing rain
32–49 Reserved 50 Surface of reflectivity
51–59 Reserved 60 Sea surface 61 Thermocline
62–99 Reserved

CODE TABLES
A–262 Volume I.1
0500
C Genus of cloud C Genus of cloud predominating in the layer C´ Genus of cloud whose base is below the level of the station Code figure
0 Cirrus (Ci) 1 Cirrocumulus (Cc) 2 Cirrostratus (Cs) 3 Altocumulus (Ac) 4 Altostratus (As) 5 Nimbostratus (Ns) 6 Stratocumulus (Sc) 7 Stratus (St) 8 Cumulus (Cu) 9 Cumulonimbus (Cb) / Not available for instrument detected clouds from AWS or cloud not visible owing to darkness, fog,
duststorm, sandstorm, or other analogous phenomena
0501
C Total concentration of all ice Ce Concentration of the tertiary form of ice Cp Concentration of the predominant form of ice Cq Concentration of the quaternary form of ice Cs Concentration of the secondary form of ice Cu Concentration of the quintary form of ice C1 Concentration of the predominant stage of development of ice C2 Concentration of the secondary stage of development of ice C3 Concentration of the tertiary stage of development of ice C4 Concentration of the quaternary stage of development of ice C5 Concentration of the quintary stage of development of ice Re Extent of all ridging Code figure
0 Less than 1/10 (less than 1 okta) 1 1/10 (1 okta) 2 2/10 – 3/10 (2 oktas) 3 4/10 (3 oktas) 4 5/10 (4 oktas) 5 6/10 (5 oktas) 6 7/10 – 8/10 (6 oktas) 7 9/10 (7 oktas) 8 10/10 with openings (8 oktas with openings) 9 10/10 without openings (8 oktas without openings)

CODE TABLES
Volume I.1 A–263
0509
CH Clouds of the genera cirrus, cirrocumulus and cirrostratus Code figure Technical specifications Code
figure Technical specifications
0 No CH clouds 0 No cirrus, cirrocumulus or cirrostratus
1 Cirrus fibratus, sometimes uncinus, not progressively invading the sky
1 Cirrus in the form of filaments, strands or hooks, not progressively invading the sky
2 Cirrus spissatus, in patches or entangled sheaves, which usually do not increase and sometimes seem to be the remains of the upper part of a cumulonimbus; or cirrus castellanus or floccus
2 Dense cirrus, in patches or entangled sheaves, which usually do not increase and sometimes seem to be the remains of the upper part of a cumulonimbus; or cirrus with sproutings in the form of small turrets or battlements, or cirrus having the appearance of cumuliform tufts
3 Cirrus spissatus cumulonimbogenitus 3 Dense cirrus, often in the form of an anvil, being the remains of the upper parts of cumulonimbus
4 Cirrus uncinus or fibratus, or both, progressively invading the sky; they generally thicken as a whole
4 Cirrus in the form of hooks or of filaments, or both, progressively invading the sky; they generally become denser as a whole
5 Cirrus (often in bands) and cirrostratus, or cirrostratus alone, progressively invading the sky; they generally thicken as a whole, but the continuous veil does not reach 45 degrees above the horizon
5 Cirrus (often in bands converging towards one point or two opposite points of the horizon) and cirrostratus, or cirrostratus alone; in either case, they are progressively invading the sky, and generally growing denser as a whole, but the continuous veil does not reach 45 degrees above the horizon
6 Cirrus (often in bands) and cirrostratus, or cirrostratus alone, progressively invading the sky; they generally thicken as a whole; the continuous veil extends more than 45 degrees above the horizon, without the sky being totally covered
6 Cirrus (often in bands converging towards one point or two opposite points of the horizon) and cirrostratus, or cirrostratus alone; in either case, they are progressively invading the sky, and generally growing denser as a whole; the continuous veil extends more than 45 degrees above the horizon, without the sky being totally covered
7 Cirrostratus covering the whole sky 7 Veil of cirrostratus covering the celestial dome
8 Cirrostratus not progressively invading the sky and not entirely covering it
8 Cirrostratus not progressively invading the sky and not completely covering the celestial dome
9 Cirrocumulus alone, or cirrocumulus predominant among the CH clouds
9 Cirrocumulus alone, or cirrocumulus accompanied by cirrus or cirrostratus, or both, but cirrocumulus is predominant
/ CH clouds invisible owing to darkness, fog, blowing dust or sand, or other similar phenomena, or because of a continuous layer of lower clouds
/ Cirrus, cirrocumulus and cirrostratus invisible owing to darkness, fog, blowing dust or sand, or other similar phenomena, or more often because of the presence of a continuous layer of lower clouds

CODE TABLES
A–264 Volume I.1
0513
CL Clouds of the genera stratocumulus, stratus, cumulus and cumulonimbus
Code figure Technical specifications Code
figure Technical specifications
0 No CL clouds 0 No stratocumulus, stratus, cumulus or cumulonimbus
1 Cumulus humilis or cumulus fractus other than of bad weather,* or both
1 Cumulus with little vertical extent and seemingly flattened, or ragged cumulus other than of bad weather,* or both
2 Cumulus mediocris or congestus, with or without cumulus of species fractus or humilis or stratocumulus, all having their bases at the same level
2 Cumulus of moderate or strong vertical extent, generally with protuberances in the form of domes or towers, either accompanied or not by other cumulus or by stratocumulus, all having their bases at the same level
3 Cumulonimbus calvus, with or without cumulus, stratocumulus or Stratus
3 Cumulonimbus the summits of which, at least partially, lack sharp outlines, but are neither clearly fibrous (cirriform) nor in the form of an anvil; cumulus, stratocumulus or Stratus may also be present
4 Stratocumulus cumulogenitus 4 Stratocumulus formed by the spreading out of cumulus; cumulus may also be present
5 Stratocumulus other than stratocumulus cumulogenitus
5 Stratocumulus not resulting from the spreading out of cumulus
6 Stratus nebulosus or Stratus fractus other 6 than of bad weather,* or both
6 Stratus in a more or less continuous sheet or layer, or in ragged shreds, or both, but no Stratus fractus of bad weather*
7 Stratus fractus or cumulus fractus of bad weather,* or both (pannus), usually below altostratus or nimbostratus
7 Stratus fractus of bad weather* or cumulus fractus of bad weather,* or both (pannus), usually below altostratus or nimbostratus
8 Cumulus and stratocumulus other than stratocumulus cumulogenitus, with bases at different levels
8 Cumulus and stratocumulus other than that formed from the spreading out of cumulus; the base of the cumulus is at a different level from that of the stratocumulus
9 Cumulonimbus capillatus (often with an anvil), with or without cumulonimbus calvus, cumulus, stratocumulus, Stratus or pannus
9 Cumulonimbus, the upper part of which is clearly fibrous (cirriform), often in the form of an anvil; either accompanied or not by cumulonimbus without anvil or fibrous upper part, by cumulus, stratocumulus, stratus or pannus
/ CL clouds invisible owing to darkness, fog, blowing dust or sand, or other similar phenomena
/ Stratocumulus, stratus, cumulus and cumulonimbus invisible owing to darkness, fog, blowing dust or sand, or other similar phenomena
* “Bad weather” denotes the conditions which generally exist during precipitation and a short time before and after.

CODE TABLES
Volume I.1 A–265
0515
CM Clouds of the genera altocumulus, altostratus and nimbostratus
Code figure Technical specifications Code
figure Technical specifications
0 No CM clouds 0 No altocumulus, altostratus or nimbostratus
1 Altostratus translucidus 1 Altostratus, the greater part of which is semi-transparent; through this part the sun or moon may be weakly visible, as through ground glass
2 Altostratus opacus or nimbostratus 2 Altostratus, the greater part of which is sufficiently dense to hide the sun or moon, or nimbostratus
3 Altocumulus translucidus at a single level 3 Altocumulus, the greater part of which is semi-transparent; the various elements of the cloud change only slowly and are all at a single level
4 Patches (often lenticular) of altocumulus translucidus, continually changing and occurring at one or more levels
4 Patches (often in the form of almonds or fish) of altocumulus, the greater part of which is semi-transparent; the clouds occur at one or more levels and the elements are continually changing in appearance
5 Altocumulus translucidus in bands, or one or more layers of altocumulus translucidus or opacus, progressively invading the sky; these altocumulus clouds generally thicken as a whole
5 Semi-transparent altocumulus in bands, or altocumulus, in one or more fairly continuous layer (semi-transparent or opaque), progressively invading the sky; these altocumulus clouds generally thicken as a whole
6 Altocumulus cumulogenitus (or cumulo-nimbogenitus)
6 Altocumulus resulting from the spreading out of cumulus (or cumulonimbus)
7 Altocumulus translucidus or opacus in two or more layers, or altocumulus opacus in a single layer, not progressively invading the sky, or altocumulus with altostratus or nimbostratus
7 Altocumulus in two or more layers, usually opaque in places, and not progressively invading the sky; or opaque layer of altocumulus, not progressively invading the sky; or altocumulus together with altostratus or nimbostratus
8 Altocumulus castellanus or floccus 8 Altocumulus with sproutings in the form of small towers or battlements, or altocumulus having the appearance of cumuliform tufts
9 Altocumulus of a chaotic sky, generally at several levels
9 Altocumulus of a chaotic sky, generally at several levels
/ CM clouds invisible owing to darkness, fog, blowing dust or sand, or other similar phenomena, or because of continuous layer of lower clouds
/ Altocumulus, altostratus and nimbostratus invisible owing to darkness, fog, blowing dust or sand, or other similar phenomena, or more often because of the presence of a continuous layer of lower clouds

CODE TABLES
A–266 Volume I.1
0519
CR Extent of runway contamination Code figure
1 Less than 10 per cent of runway contaminated (covered) 2 11 per cent to 25 per cent of runway contaminated (covered)
3–4 Reserved 5 26 per cent to 50 per cent of runway contaminated (covered)
6–8 Reserved 9 51 per cent to 100 per cent of runway contaminated (covered) / Not reported (e.g. due to runway clearance in progress)
0521
CS Special clouds Code figure
1 Nacreous clouds 2 Noctilucent clouds 3 Clouds from waterfalls 4 Clouds from fires 5 Clouds from volcanic eruptions
Note: A description of these clouds may be found in the International Cloud Atlas (WMO-No. 407), Volume I, Part II, Chapter 6.
0531
Ca Nature of clouds of vertical development Code figure
0 Isolated 1 Numerous
Cumulus humilis and/or cumulus mediocris
2 Isolated 3 Numerous
Cumulus congestus
4 Isolated 5 Numerous
Cumulus
6 Isolated 7 Numerous
Cumulus and cumulonimbus

CODE TABLES
Volume I.1 A–267
0533
Cc Coloration and/or convergence of clouds associated with a tropical disturbance Code figure
1 Slight coloration of clouds at sunrise
2 Deep-red coloration of clouds at sunrise
3 Slight coloration of clouds at sunset
4 Deep-red coloration of clouds at sunset
5 Convergence of CH clouds at a point below 45° 6 Convergence of CH clouds at a point above 45°
forming or increasing
7 Convergence of CH clouds at a point below 45° 8 Convergence of CH clouds at a point above 45°
dissolving or diminishing
0544
Cm Major cloud configuration Code figure
0 Low stratus or fog 1 Stratiform 2 Stratocumulifom – closed cells 3 Cirriform 4 Cumuliform and stratiform 5 Cumuliform 6 Open cells – not associated with cumulonimbus 7 Open cells – cumulus and cumulonimbus 8 Cumulonimbus (may be associated with other cloud types) 9 Multi-layered / Undetermined
0551
Cs Cloud system Code figure
1 Thunder type 2 Depression type 3 Intense depression type 4 Depression with snow 5 Depression with warm sector 6 Depression with misty tail 7 Altocumulus 8 Altocumulus with lateral zone 9 Altocumulus with misty tail

CODE TABLES
A–268 Volume I.1
0552
Ct Description of the top of cloud whose base is below the level of the station Code figure
0 Isolated cloud or fragments of clouds 1 Continuous cloud 2 Broken cloud – small breaks flat tops 3 Broken cloud – large breaks 4 Continuous cloud 5 Broken cloud – small breaks undulating tops 6 Broken cloud – large breaks 7 Continuous or almost continuous waves with towering clouds above the top of the layer 8 Groups of waves with towering clouds above the top of the layer 9 Two or more layers at different levels
0561
C0 Orographic clouds Code figure
1 Isolated orographic clouds, pileus, incus, forming 2 Isolated orographic clouds, pileus, incus, not changing 3 Isolated orographic clouds, pileus, incus, dissolving 4 Irregular banks of orographic cloud, föhn bank, etc., forming 5 Irregular banks of orographic cloud, föhn bank, etc., not changing 6 Irregular banks of orographic cloud, föhn bank, etc., dissolving 7 Compact layer of orographic cloud, föhn bank, etc., forming 8 Compact layer of orographic cloud, föhn bank, etc., not changing 9 Compact layer of orographic cloud, föhn bank, etc., dissolving
0562
C1 Confidence figure Code figure
0 No specification 2 With confidence 5 Uncertain 8 Very doubtful

CODE TABLES
Volume I.1 A–269
0639
Ci Concentration or arrangement of sea ice Code figure
0 No sea ice in sight 1 Ship in open lead more than 1.0 nautical mile wide, or ship in fast ice with boundary beyond limit of
visibility 2 Sea ice present in concentrations less than 3/10 (3/8), open water or very open pack ice 3 4/10 to 6/10 (3/8 to less than 6/8), open pack ice 4 7/10 to 8/10 (6/8 to less than 7/8), close pack ice 5 9/10 or more, but not 10/10 (7/8 to less than 8/8),
very close pack ice
Sea ice concentration is uniform in the observation area
6 Strips and patches of pack ice with open water between
7 Strips and patches of close or very close pack ice with areas of lesser concentration between
8 Fast ice with open water, very open or open pack ice to seaward of the ice boundary
9 Fast ice with close or very close pack ice to seaward of the ice boundary
Sea ice concentration is not uniform in the observation area
Ship in ice or within 0.5 nautical mile of ice edge
/ Unable to report, because of darkness, lack of visibility, or because ship is more than 0.5 nautical mile away from ice edge
0659
cT Thermodynamic correction technique cw Wind correction technique Code figure
0 No correction applied 1 US standard correction 2 UK standard correction 3 Japan standard correction

CODE TABLES
A–270 Volume I.1
0700
D Direction or bearing in one figure D True direction from which surface wind is blowing D True direction towards which ice has drifted in the past 12 hours DH True direction from which CH clouds are moving DK True direction from which swell is moving DL True direction from which CL clouds are moving DM True direction from which CM clouds are moving Da True direction in which orographic clouds or clouds with vertical development are seen Da True direction in which the phenomenon indicated is observed or in which conditions
specified in the same group are reported De True direction towards which an echo pattern is moving Dp True direction from which the phenomenon indicated is coming Ds True direction of resultant displacement of the ship during the three hours preceding the
time of observation D1 True direction of the point position from the station Code figure
0 Calm (in D, DK), or stationary (in Ds), or at the station (in Da, D1), or stationary or no clouds (in DH, DL, DM)
1 NE 2 E 3 SE 4 S 5 SW 6 W 7 NW 8 N 9 All directions (in Da, D1), or confused (in DK), or variable (in D(wind)), or unknown (in Ds), or unknown
or clouds invisible (in DH, DL, DM) / Report from a coastal land station or displacement of ship not reported (in Ds only – see
Regulation 12.3.1.2 (b))
0739
Di True bearing of principal ice edge Code figure
0 Ship in shore or flaw lead 1 Principal ice edge towards NE 2 Principal ice edge towards E 3 Principal ice edge towards SE 4 Principal ice edge towards S 5 Principal ice edge towards SW 6 Principal ice edge towards W 7 Principal ice edge towards NW 8 Principal ice edge towards N 9 Not determined (ship in ice) / Unable to report, because of darkness, lack of visibility or because only ice of land origin is visible

CODE TABLES
Volume I.1 A–271
0755
Dw True orientation of water feature given in Wt Code figure
0 No distinct orientation 1 Major axis of feature orientated NE–SW 2 Orientated E – W 3 Orientated SE–NW 4 Orientated N–S 5 Parallels shore to E 6 Parallels shore to S 7 Parallels shore to W 8 Parallels shore to N / Undetermined or unknown
0777
Dew-point depression in two figures DtDt Dew-point depression at the tropopause level D0D0 D1D1 . . . DnDn
Dew-point depression at standard isobaric surfaces or at significant levels, starting with station level
Code figure
Degrees Celsius Code
figure Degrees Celsius Code
figure Degrees Celsius Code
figure Degrees Celsius
00 0.0 25 2.5 50 5 75 25 01 0.1 26 2.6 51 76 26 02 0.2 27 2.7 52 77 27 03 0.3 28 2.8 53 Not used 78 28 04 0.4 29 2.9 54 79 29 05 0.5 30 3.0 55 80 30 06 0.6 31 3.1 56 6 81 31 07 0.7 32 3.2 57 7 82 32 08 0.8 33 3.3 58 8 83 33 09 0.9 34 3.4 59 9 84 34 10 1.0 35 3.5 60 10 85 35 11 1.1 36 3.6 61 11 86 36 12 1.2 37 3.7 62 12 87 37 13 1.3 38 3.8 63 13 88 38 14 1.4 39 3.9 64 14 89 39 15 1.5 40 4.0 65 15 90 40 16 1.6 41 4.1 66 16 91 41 17 1.7 42 4.2 67 17 92 42 18 1.8 43 4.3 68 18 93 43 19 1.9 44 4.4 69 19 94 44 20 2.0 45 4.5 70 20 95 45 21 2.1 46 4.6 71 21 96 46 22 2.2 47 4.7 72 22 97 47 23 2.3 48 4.8 73 23 98 48 24 2.4 49 4.9 74 24 99 49 // No humidity data
available

CODE TABLES
A–272 Volume I.1
0822
dT Amount of temperature change, the sign of the change being given by sn Code figure
0 ΔT = 10°C 1 ΔT = 11°C 2 ΔT = 12°C 3 ΔT = 13°C 4 ΔT = 14°C or more 5 ΔT = 5°C 6 ΔT = 6°C 7 ΔT = 7°C 8 ΔT = 8°C 9 ΔT = 9°C
0833
dc Duration and character of precipitation given by RRR Code figure
0 Lasted less than 1 hour 1 Lasted 1–3 hours 2 Lasted 3–6 hours 3 Lasted more than 6 hours
Only one period of precipitation has occurred during the period covered by W1W2
4 Lasted less than 1 hour 5 Lasted 1–3 hours 6 Lasted 3–6 hours 7 Lasted more than 6 hours
Two or more periods of precipitation have occurred during the period covered by W1W2
9 Unknown
0877
Direction in two figures
dd True direction, in tens of degrees, from which wind is blowing (or will blow) dd Forecast true direction, in tens of degrees, from which wind will blow at the relevant grid
point dd True direction, in tens of degrees, from which wind is blowing, derived from movement of
cloud elements dhdh True direction, in tens of degrees, from which wind will blow at the height indicated by
hxhxhx djdj True direction, in tens of degrees, from which jet-stream wind is blowing (or will blow) dmdm True direction, in tens of degrees, from which maximum wind will blow at the flight level
given by nmnmnm dmdm True direction, in tens of degrees, from which maximum wind will blow at the height given
by h´mh´m dsds True direction, in tens of degrees, towards which the system or front is moving dsds True direction, in tens of degrees, towards which the tropical cyclone orsystem is moving dwdw True direction, in tens of degrees, from which waves are coming

CODE TABLES
Volume I.1 A–273
(Code table 0877 – continued)
dw1dw1
dw2dw2 True direction, in tens of degrees, from which swell waves are coming
d0d0 True direction, in tens of degrees, towards which sea-surface current is moving d0d0 d1d1 . . . dndn
True direction, in tens of degrees, towards which sea current at selected and/or significant depths starting with the sea surface is moving
d1d1 d2d2 . . . dndn
True direction, in tens of degrees, from which wind is blowing at the specified levels
Code Code figure figure
00 Calm (no motion for dsds, 19 185° – 194° or no waves) 20 195° – 204° 01 5° – 14° 21 205° – 214° 02 15° – 24° 22 215° – 224° 03 25° – 34° 23 225° – 234° 04 35° – 44° 24 235° – 244° 05 45° – 54° 25 245° – 254° 06 55° – 64° 26 255° – 264° 07 65° – 74° 27 265° – 274° 08 75° – 84° 28 275° – 284° 09 85° – 94° 29 285° – 294° 10 95° – 104° 30 295° – 304° 11 105° – 114° 31 305° – 314° 12 115° – 124° 32 315° – 324° 13 125° – 134° 33 325° – 334° 14 135° – 144° 34 335° – 344° 15 145° – 154° 35 345° – 354° 16 155° – 164° 36 355° – 4° 17 165° – 174° 99 Variable, or all directions, or unknown 18 175° – 184° (for dsds), or waves confused, direction indeterminate
0878
dd True direction, in tens of degrees, from which wind is blowing (or will blow) at stations within 1° of the North Pole
Code figure
Wind coming from a meridian between
Code figure
Wind coming from a meridian between
Code figure
Wind coming from a meridian between
Code figure
Wind coming from a meridian between
00 Calm 10 95°W – 105°W 20 165°E – 155°E 30 65°E – 55°E 01 5°W – 15°W 11 105°W – 115°W 21 155°E – 145°E 31 55°E – 45°E 02 15°W – 25°W 12 115°W – 125°W 22 145°E – 135°E 32 45°E – 35°E 03 25°W – 35°W 13 125°W – 135°W 23 135°E – 125°E 33 35°E – 25°E 04 35°W – 45°W 14 135°W – 145°W 24 125°E – 115°E 34 25°E – 15°E 05 45°W – 55°W 15 145°W – 155°W 25 115°E – 105°E 35 15°E – 5°E 06 55°W – 65°W 16 155°W – 165°W 26 105°E – 95°E 36 5°E – 5°W 07 65°W – 75°W 17 165°W – 175°W 27 95°E – 85°E 08 75°W – 85°W 18 175°W – 175°E 28 85°E – 75°E 09 85°W – 95°W 19 175°E – 165°E 29 75°E – 65°E

CODE TABLES
A–274 Volume I.1
0880
da1da1 Mean direction, in units of 4 degrees, from which waves are coming for the band indicated, relative to true north
da2da2 Principal direction, in units of 4 degrees, from which waves are coming for the band indicated, relative to true north
dddd True direction, in units of 4 degrees, from which the dominant wave is coming d1d1 d2d2 . . . dndn
True direction, in units of 4 degrees, from which waves are coming
Code figure
00 358° to less than 2° 01 2° to less than 6° 02 6° to less than 10° . . . 89 354° to less than 358°
90–98 Not used 99 Ratio of the spectral density for the band to the maximum is less than 0.005
0901
E State of the ground without snow or measurable ice cover Code figure
0 Surface of ground dry (without cracks and no appreciable amount of dust or loose sand) 1 Surface of ground moist 2 Surface of ground wet (standing water in small or large pools on surface) 3 Flooded 4 Surface of ground frozen 5 Glaze on ground 6 Loose dry dust or sand not covering ground completely 7 Thin cover of loose dry dust or sand covering ground completely 8 Moderate or thick cover of loose dry dust or sand covering ground completely 9 Extremely dry with cracks
Notes:
(1) The definitions in the code for E for numbers 0 to 2 and 4 apply to representative bare ground and numbers 3 and 5 to 9 to an open representative area.
(2) In all instances, the highest code figures applicable shall be reported.

CODE TABLES
Volume I.1 A–275
0919
ER Runway deposits Code figure
0 Clear and dry 1 Damp 2 Wet and water patches 3 Rime and frost covered (depth normally less than 1 mm) 4 Dry snow 5 Wet snow 6 Slush 7 Ice 8 Compacted or rolled snow 9 Frozen ruts or ridges / Type of deposit not reported (e.g. due to runway clearance in progress)
0933
Ec Characteristics of release Code figure
0 No release 1 Release has stopped 2 Release 3 Release is continuing
4–6 Reserved 7 Missing value
0935
Ee Release behaviour over time Code figure
0 Release no longer occurring 1 Release still occurring 2 Release expected to increase in next six hours 3 Release expected to remain constant in next six hours 4 Release expected to decrease in next six hours
5–6 Reserved 7 Missing value

CODE TABLES
A–276 Volume I.1
0938
Eh Elevation above the horizon of the base of anvil of cumulonimbus or of the summit of other phenomena
Code figure
1 Very low on the horizon 3 Less than 30° above the horizon 7 More than 30° above the horizon
0943
Es State of current or expected release Code figure
0 Gaseous 1 Particulate 2 Mixture of gaseous and particulate 3 Missing value
0964
E3 Slush condition under the ice layer Code figure
0 No slush ice 1 Slush ice to approximately 1/3 of depth of the river, lake or reservoir 2 Slush ice from 1/3 to 2/3 of depth of the river, lake or reservoir 3 Slush ice to depth of the river, lake or reservoir greater than 2/3
0975
E´ State of the ground with snow or measurable ice cover Code figure
0 Ground predominantly covered by ice 1 Compact or wet snow (with or without ice) covering less than one-half of the ground 2 Compact or wet snow (with or without ice) covering at least one-half of the ground but ground not
completely covered 3 Even layer of compact or wet snow covering ground completely 4 Uneven layer of compact or wet snow covering ground completely 5 Loose dry snow covering less than one-half of the ground 6 Loose dry snow covering at least one-half of the ground but ground not completely covered 7 Even layer of loose dry snow covering ground completely 8 Uneven layer of loose dry snow covering ground completely 9 Snow covering ground completely; deep drifts
Notes:
(1) The definitions in the code for E´ apply to an open representative area.
(2) In all instances, the highest code figures applicable shall be reported.
(3) In the above code table, whenever reference is made to ice, it also includes solid precipitation other than snow.

CODE TABLES
Volume I.1 A–277
0977
E1E1, E2E2 Ice phenomena on the river, lake or reservoir Code figure
The first decile (00 to 09) describes the conditions on the river, lake or reservoir prior to transport of ice:
00 Water surface free of ice 01 Ice along banks 02 Ice crystals 03 Ice slush 04 Ice floes from tributaries entering near the river, lake or reservoir station
The second decile (10 to 19) describes the propagation of slush ice on the water surface of the river, lake or reservoir:
10 Floating slush ice covering approximately 1/3 (up to 30%) of the water surface 11 Floating slush ice covering about half (40% – 60%) of the water surface 12 Floating slush ice covering more than half (70% – 100%) of the water surface
The third decile (20 to 29) describes the conditions on the river, lake or reservoir when ice is being transported:
20 Floating ice covering 10% of the water surface 21 Floating ice covering 20% of the water surface 22 Floating ice covering 30% of the water surface 23 Floating ice covering 40% of the water surface 24 Floating ice covering 50% of the water surface 25 Floating ice covering 60% of the water surface 26 Floating ice covering 70% of the water surface 27 Floating ice covering 80% of the water surface 28 Floating ice covering 90% of the water surface 29 Floating ice covering 100% of the water surface
The fourth decile (30 to 39) describes the freezing-up of the river, lake or reservoir: 30 Water surface frozen at station, free upstream 31 Water surface frozen at station, free downstream 32 Water surface free at station, frozen upstream 33 Water surface free at station, frozen downstream 34 Ice floes near the station, water surface frozen downstream 35 Water surface frozen with breaks 36 Water surface completely frozen over 37 Water surface frozen over, with pile-ups
The fifth decile (40 to 49) describes the state of the river, lake or reservoir when the ice cover is breaking up:
40 Ice melting along the banks 41 Some water on the ice 42 Ice waterlogged 43 Water holes in the ice cover 44 Ice moving 45 Open water in breaks 46 Break-up (first day of movement of ice on the entire water surface) 47 Ice broken artificially
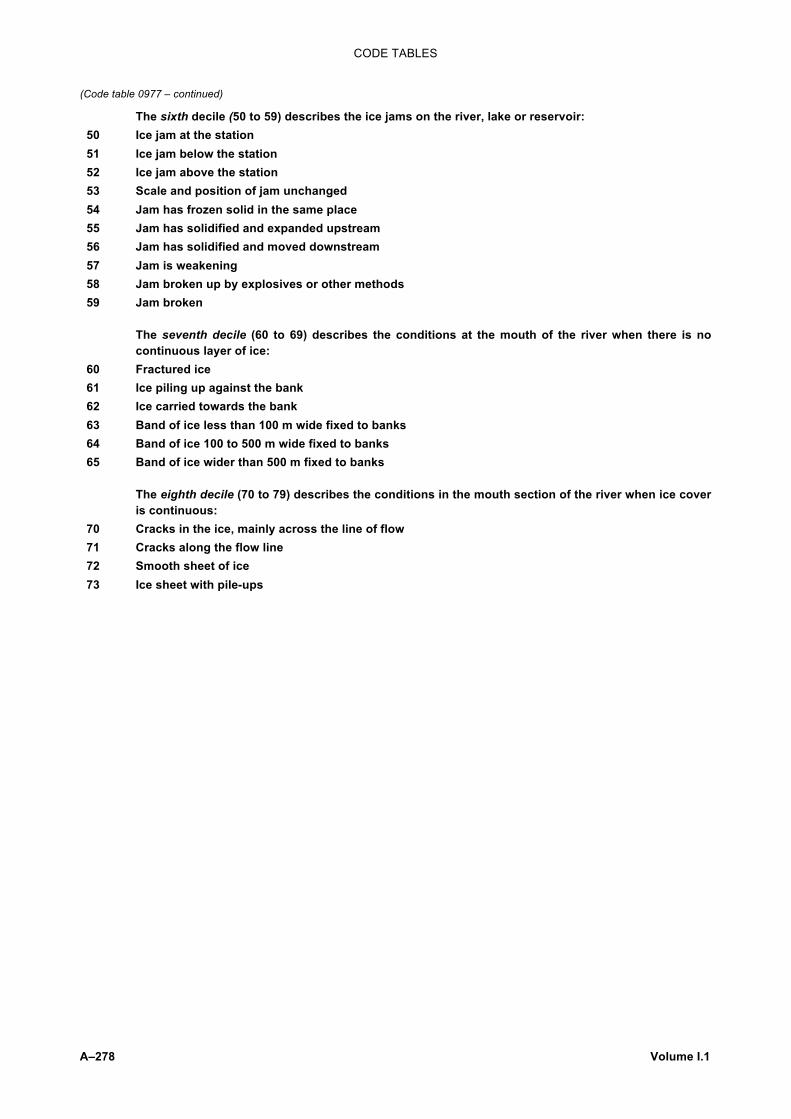
CODE TABLES
A–278 Volume I.1
(Code table 0977 – continued)
The sixth decile (50 to 59) describes the ice jams on the river, lake or reservoir: 50 Ice jam at the station 51 Ice jam below the station 52 Ice jam above the station 53 Scale and position of jam unchanged 54 Jam has frozen solid in the same place 55 Jam has solidified and expanded upstream 56 Jam has solidified and moved downstream 57 Jam is weakening 58 Jam broken up by explosives or other methods 59 Jam broken
The seventh decile (60 to 69) describes the conditions at the mouth of the river when there is no continuous layer of ice:
60 Fractured ice 61 Ice piling up against the bank 62 Ice carried towards the bank 63 Band of ice less than 100 m wide fixed to banks 64 Band of ice 100 to 500 m wide fixed to banks 65 Band of ice wider than 500 m fixed to banks
The eighth decile (70 to 79) describes the conditions in the mouth section of the river when ice cover is continuous:
70 Cracks in the ice, mainly across the line of flow 71 Cracks along the flow line 72 Smooth sheet of ice 73 Ice sheet with pile-ups

CODE TABLES
Volume I.1 A–279
1004
eC Elevation angle of the top of the cloud indicated by C e´ Elevation angle of the top of the phenomenon above horizon Code figure
0 Tops of cloud not visible 1 45° or more 2 About 30° 3 About 20° 4 About 15° 5 About 12° 6 About 9° 7 About 7° 8 About 6° 9 Less than 5°
Note: Angular elevation may be estimated by a rough-and-ready method. The following illustration demonstrates that method:
15°9°
30°
6°
At a distance of 30 cm (about a foot) from your eye, the span formed by your thumb and forefinger is about 30°. The total length of your forefinger is about 15°. The length of the top of your forefinger is about 9°. The breadth of two fingers is about 6°.

CODE TABLES
A–280 Volume I.1
1062
e1 Type of isopleth and units of isopleth values uuu Code figure
0 Relative or absolute contour or isallohypse; uuu in tens of standard geopotential metres (thousands figure omitted)
1 Dew point; uuu in whole degrees Celsius (add 500 for minus values) 2 Isotherm; uuu in whole degrees Celsius (add 500 for minus values) 3 Potential temperature; uuu in whole kelvins 4 Isobar or isallobar; uuu in whole hectopascals (thousands figure omitted) 5 Mixing ratio; uuu in tenths of a gramme/kilogramme 6 Saturation pressure; uuu in whole hectopascals (thousands figure omitted) 7 Relative humidity; uuu in units of percentage 8 Wind speed; uuu in knots 9 Streamline; uuu used as identification number
Note: For code figure 0 in a tropopause analysis, uuu shall be reported in hundreds of standard geopotential metres.
1063
e2 Type of isopleth and units of isopleth values uu Code figure
0 Sea-wave height; uu in metres 1 Swell-wave height; uu in metres 2 Wave height (wave type undetermined); uu in metres 3 Wave direction; uu in tens of degrees 4 Wave period; uu in seconds 9 Sea temperature; uu in whole degrees Celsius
1079 eReR Depth of deposit Code figure
00 Less than 1 mm 01 1 mm 02 2 mm 03 3 mm . . . 89 89 mm 90 90 mm 91 Reserved 92 10 cm 93 15 cm 94 20 cm 95 25 cm 96 30 cm 97 35 cm 98 40 cm or more 99 Runway or runways non-operational due to snow, slush, ice, large drifts or runway clearance, but
depth not reported // Depth of deposit operationally not significant or not measurable

CODE TABLES
Volume I.1 A–281
1085
eTeT Type of thermodynamic sensing equipment Code figure
00 No thermodynamic sensor
01–49 Sonde 01 Arcasonde, experimental 02 Arcasonde 1A, thin film mount, 10 mil (Bt) 03 WOX1A and WOX4A, experimental 04 WOX1A, 10 mil (Bt) 05 WOX4A, 10 mil (Bt) 06 Walmet, thin film loop mount, 10 mil (Bt) 07 Sts, experimental (Bt) 08 Sts, thin film mount, 10 mil (Bt) 09 Datasonde, experimental (Bt) 10 Datasonde, thin film loop mount, 10 mil (Bt) 11 Pulsed sonde, experimental
12–19 Unassigned 20 MK-1, MK-2, experimental (Rw) 21 MK-1 (Rw) 22 MK-2 (Rw)
23–29 Unassigned 30 Echosonde, ES64-B, experimental (Rw) 31 Echosonde, ES64-B (Rw) 32 Echosonde, ES89P
33–34 Unassigned 35 DMN sonde, thin wire 36 DMN sonde, flat plate
37–44 Unassigned 45 UK rocketsonde MK-11 spiralized coiled 13 µm resistance wire element
46–49 Unassigned
50–54 Sphere 50 Sphere, experimental 51 Sphere, inflatable
52–54 Unassigned
55–59 Grenade 55 Grenade, experimental 56 Grenade
57–59 Unassigned
60–64 Density gauge 60 Density gauge, experimental
61–64 Unassigned
65–69 Pressure gauge 65 Pressure gauge, experimental
66–69 Unassigned
70–79 Remote sensing 70 Remote sensing, experimental
71–79 Unassigned Note: When specifications indicating experimental equipment are reported, plain-language remarks explaining the experimental nature of the equipment shall be added at the end of the coded report.

CODE TABLES
A–282 Volume I.1
1095
ewew Type of wind sensing equipment Code figure
00 No wind sensor
01–09 Chaff 01 Chaff, experimental 02 Chaff, metallized
03–09 Unassigned
10–29 Parachute 10 Parachute, experimental 11 Parachute, 0.5 m to 3.5 m diameter 12 Parachute, 3.6 m to 5.5 m diameter 13 Parachute, greater than 5.5 m diameter 14 Mesh decelerator, experimental
15–29 Unassigned
30–49 Starute 30 Starute, experimental 31 Starute, 0.5 m to 3.5 m diameter 32 Starute, 3.6 m to 5.5 m diameter 33 Starute, greater than 5.5 m diameter
34–49 Unassigned
50–54 Sphere 50 Sphere, experimental 51 Sphere, inflatable
52–54 Unassigned
55–59 Grenade 55 Grenade, experimental
56–59 Unassigned
60–64 Chemical trail 60 Chemical trail, experimental
61–64 Unassigned
65–69 Meteor trail 65 Meteor trail, experimental
66–69 Unassigned
70–79 Remote sensing 70 Remote sensing, experimental
71–79 Unassigned
80–99 Unassigned
Note: When specifications indicating experimental equipment are reported, plain-language remarks explaining the experimental nature of the equipment shall be added at the end of the coded report.
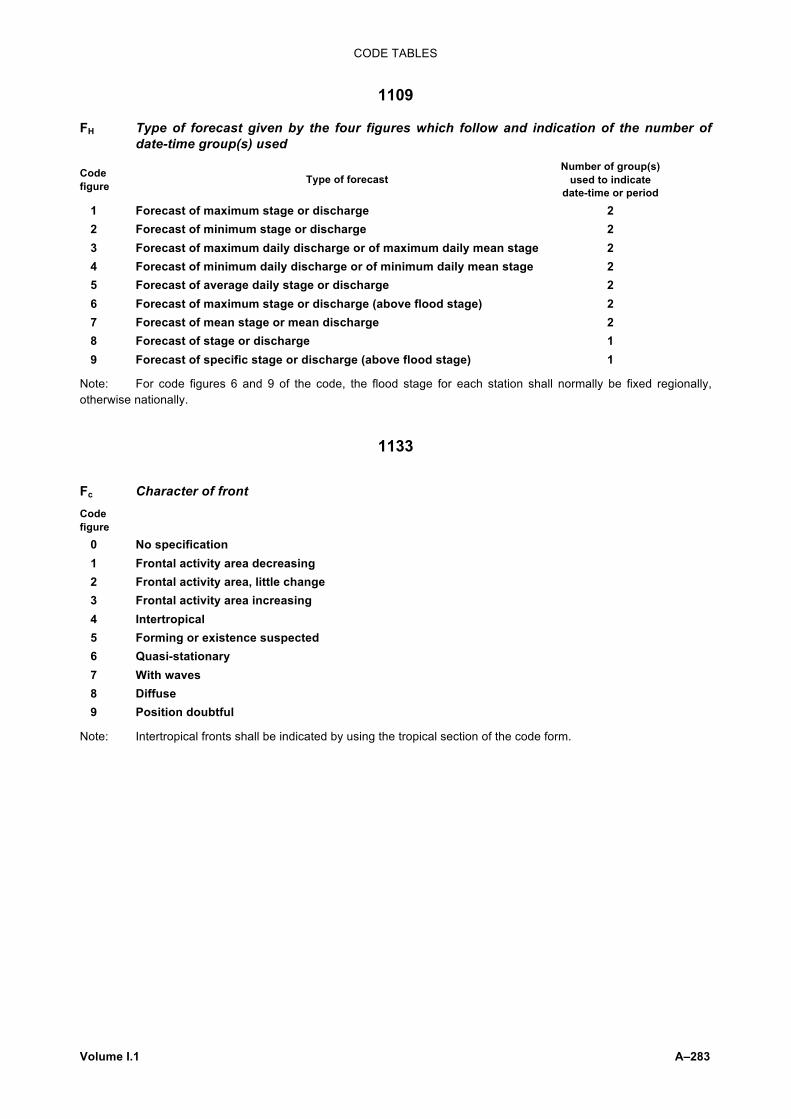
CODE TABLES
Volume I.1 A–283
1109
FH Type of forecast given by the four figures which follow and indication of the number of date-time group(s) used
Code figure Type of forecast
Number of group(s) used to indicate
date-time or period 1 Forecast of maximum stage or discharge 2 2 Forecast of minimum stage or discharge 2 3 Forecast of maximum daily discharge or of maximum daily mean stage 2 4 Forecast of minimum daily discharge or of minimum daily mean stage 2 5 Forecast of average daily stage or discharge 2 6 Forecast of maximum stage or discharge (above flood stage) 2 7 Forecast of mean stage or mean discharge 2 8 Forecast of stage or discharge 1 9 Forecast of specific stage or discharge (above flood stage) 1
Note: For code figures 6 and 9 of the code, the flood stage for each station shall normally be fixed regionally, otherwise nationally.
1133
Fc Character of front Code figure
0 No specification 1 Frontal activity area decreasing 2 Frontal activity area, little change 3 Frontal activity area increasing 4 Intertropical 5 Forming or existence suspected 6 Quasi-stationary 7 With waves 8 Diffuse 9 Position doubtful
Note: Intertropical fronts shall be indicated by using the tropical section of the code form.

CODE TABLES
A–284 Volume I.1
1135
Fe Tertiary form of ice Fp Predominant form of ice Fq Quaternary form of ice Fs Secondary form of ice Fu Quintary form of ice Code figure
0 No ice 1 Ice of land origin 2 Pancake ice 3 Brash ice, small ice cakes, ice cakes 4 Small ice floes (20–100 m across) 5 Medium ice floes (100–500 m across) 6 Big ice floes (500–2000 m across) 7 Vast ice floes (2–10 km across) 8 Giant ice floes (over 10 km across) 9 Fast ice / Undetermined or unknown
1139
Fi Intensity of front Code figure
0 No specification 1 Weak, decreasing (including frontolysis) 2 Weak, little or no change 3 Weak, increasing (including frontogenesis) 4 Moderate, decreasing 5 Moderate, little or no change 6 Moderate, increasing 7 Strong, decreasing 8 Strong, little or no change 9 Strong, increasing
1144
Fm Forecast strength of surface wind
Code Beaufort Code Beaufort figure number figure number
0 0–3 5 8 1 4 6 9 2 5 7 10 3 6 8 11 4 7 9 12

CODE TABLES
Volume I.1 A–285
1152
Ft Type of front Code figure
0 Quasi-stationary front at the surface 1 Quasi-stationary front above the surface 2 Warm front at the surface 3 Warm front above the surface 4 Cold front at the surface 5 Cold front above the surface 6 Occlusion 7 Instability line 8 Intertropical front 9 Convergence line
Note: Intertropical fronts shall be indicated by using the tropical section of the code form.
1162
F1, F2, etc. Intensity of points Code figure
1 Dots 2 Dots and dashes weak 3 Dashes 4 Dots 5 Dots and dashes moderate 6 Dashes 7 Dots 8 Dots and dashes strong 9 Dashes
1200
f Wind speed derived from movement of cloud elements Code figure
0 0 to 9 m s–1 1 10 to 19 m s–1 2 20 to 29 m s–1 3 30 to 39 m s–1 4 40 to 49 m s–1 5 50 to 59 m s–1 6 60 to 69 m s–1 7 70 to 79 m s–1 8 80 to 89 m s–1 9 90 m s–1 or more / Undetermined

CODE TABLES
A–286 Volume I.1
1236
fe Speed of movement of echo pattern Code figure
0 0 to 9 km h–1 1 10 to 19 km h–1 2 20 to 29 km h–1 3 30 to 39 km h–1 4 40 to 49 km h–1 5 50 to 59 km h–1 6 60 to 69 km h–1 7 70 to 79 km h–1 8 80 to 89 km h–1 9 90 km h–1 or more / Undetermined
1300
G Period covered by forecast Code figure
0 Synopsis of meteorological conditions in the forecast area at the time of the beginning of the forecast period
1 Forecast valid for 3 hours 2 Forecast valid for 6 hours 3 Forecast valid for 9 hours 4 Forecast valid for 12 hours 5 Forecast valid for 18 hours 6 Forecast valid for 24 hours 7 Forecast valid for 48 hours 8 Forecast valid for 72 hours 9 Occasionally
1400
g Time of the observations used to compute the reported mean values of geopotential, temperature and humidity
Code figure
1 0000 UTC 2 1200 UTC 3 0000 and 1200 UTC 4 0600 UTC 5 1800 UTC 6 0600 and 1800 UTC 7 0000, 1200 and either 0600 or 1800 UTC 8 0600, 1800 and either 0000 or 1200 UTC 9 0000, 0600, 1200 and 1800 UTC / Other hours
Note: The times of observation are one hour or less from the reported times.

CODE TABLES
Volume I.1 A–287
1487
grgr Grid geometry and geographical support (G = geographical; C = Cartesian)
MAP PROJECTION ORIGIN (OR REFERENCE POINT) DEFINED BY MEANS OF
Code figure
Grid type
Type Latitude of true scale
Cartesian coordinate of the Pole
Geographical coordinate of origin (or of reference point)
01 G — — — X
02 03
C C
Polar stereographic Polar stereographic
60° 60°
X —
— X
04 05
C C
Lambert’s conformal Lambert’s conformal
30° – 60° 30° – 60°
X —
— X
06 07
C C
Lambert’s conformal Lambert’s conformal
10° – 40° 10° – 40°
X —
— X
08 C Mercator 22.5° — X
99 Details specified in Weather Reporting (WMO-No. 9), Volume B (see NNN under centre F1F2)
1535
He Altitude of echo top Code figure
0 0 to less than 2 km 1 2 to less than 4 km 2 4 to less than 6 km 3 6 to less than 8 km 4 8 to less than 10 km 5 10 to less than 12 km 6 12 to less than 14 km 7 14 to less than 16 km 8 16 to less than 18 km 9 18 km and above / Undetermined

CODE TABLES
A–288 Volume I.1
1561
H1 H2 H3 Maximum altitude of cloud tops H4 H5 Code figure
0 3 000 m or less 1 Above 3 000 m to 4 500 m 2 Above 4 500 m to 6 000 m 3 Above 6 000 m to 7 500 m 4 Above 7 500 m to 9 000 m 5 Above 9 000 m to 10 500 m 6 Above 10 500 m to 12 000 m 7 Above 12 000 m to 13 500 m 8 Above 13 500 m to 15 000 m 9 Above 15 000 m
1600
h Height above surface of the base of the lowest cloud seen Code figure
0 0 to 50 m 1 50 to 100 m 2 100 to 200 m 3 200 to 300 m 4 300 to 600 m 5 600 to 1 000 m 6 1 000 to 1 500 m 7 1 500 to 2 000 m 8 2 000 to 2 500 m 9 2 500 m or more, or no clouds / Height of base of cloud not known or base of clouds at a level lower and tops at a level higher than
that of the station Notes:
(1) A height exactly equal to one of the values at the ends of the ranges shall be coded in the higher range, e.g. a height of 600 m shall be reported by code figure 5.
(2) Due to the limitation in range of the cloud-sensing equipment used by an automatic station, the code figures reported for h could have one of the three following meanings:
(a) The actual height of the base of the cloud is within the range indicated by the code figure; or
(b) The height of the base of the cloud is greater than the range indicated by the code figure but cannot be determined due to instrumental limitations; or
(c) There are no clouds vertically above the station.

CODE TABLES
Volume I.1 A–289
1677
hshs Height of base of cloud layer or mass whose genus is indicated by C htht Height of the tops of the lowest clouds or height of the lowest cloud layer or fog Code figure Metres Code
figure Metres Code figure Metres
00 <30 34 1 020 67 5 100 01 30 35 1 050 68 5 400 02 60 36 1 080 69 5 700 03 90 37 1 110 70 6 000 04 120 38 1 140 71 6 300 05 150 39 1 170 72 6 600 06 180 40 1 200 73 6 900 07 210 41 1 230 74 7 200 08 240 42 1 260 75 7 500 09 270 43 1 290 76 7 800 10 300 44 1 320 77 8 100 11 330 45 1 350 78 8 400 12 360 46 1 380 79 8 700 13 390 47 1 410 80 9 000 14 420 48 1 440 81 10 500 15 450 49 1 470 82 12 000 16 480 50 1 500 83 13 500 17 510 51 84 15 000 18 540 52 85 16 500 19 570 53 Not used 86 18 000 20 600 54 87 19 500 21 630 55 88 21 000 22 660 56 1 800 89 >21 000 23 690 57 2 100 90 Less than 50 m 24 720 58 2 400 91 50 to 100 m 25 750 59 2 700 92 100 to 200 m 26 780 60 3 000 93 200 to 300 m 27 810 61 3 300 94 300 to 600 m 28 840 62 3 600 95 600 to 1 000 m 29 870 63 3 900 96 1 000 to 1 500 m 30 900 64 4 200 97 1 500 to 2 000 m 31 930 65 4 500 98 2 000 to 2 500 m 32 960 66 4 800 99 33 990
2 500 m or more, or no clouds
Note: If the observed value is between two of the heights as given in the table, the code figure for the lower height shall be reported, except for code figures 90–99; in this decile, a value exactly equal to one of the heights at the ends of the ranges shall be coded in the higher range, e.g. a height of 600 m is reported by code figure 95.

CODE TABLES
A–290 Volume I.1
1690
hBhBhB Height of lowest level of turbulence hfhfhf Altitude of the 0°C isotherm hihihi Height of lowest level of icing hshshs Height of base of cloud layer or mass, or observed or forecast vertical visibility hththt Altitude of cloud layer or mass hxhxhx Altitude to which temperature and wind refer
Code figure Metres Code
figure Metres
000 <30 100 3 000 001 30 110 3 300 002 60 120 3 600 003 90 etc. etc. 004 120 990 29 700 005 150 999 30 000 or more 006 180 007 210 008 240 009 270 010 300 011 330 etc. etc. 099 2 970
Notes:
(1) The code is direct reading in units of 30 metres.
(2) The code table shall be considered as a coding device in which certain code figures are assigned values. These are discrete values, not ranges. Any observation or forecast of values to be coded in the code table shall be made without regard to the code table. The coding is then accomplished according to the following rule: If the observed or forecast value is between two of the heights as given in the table, the code figure for the lower height shall be reported.
1700
I Density of points Code figure
1 Low 2 Medium 3 High
1731
Ia Indicator for frequency or wave number Code figure
0 Frequency (Hz) 1 Wave number (m–1)

CODE TABLES
Volume I.1 A–291
1732
Ib Indicator for directional or non-directional spectral wave data Code figure
0 Non-directional 1 Directional
1733
Ic Type of forecast ice accretion on the external parts of aircraft
Code figure
0 No icing 1 Light icing 2 Light icing in cloud 3 Light icing in precipitation 4 Moderate icing 5 Moderate icing in cloud 6 Moderate icing in precipitation 7 Severe icing 8 Severe icing in cloud 9 Severe icing in precipitation
1734
Id Indicator used to specify the hundreds of hectopascals figure (in Part A of TEMP, TEMP SHIP, TEMP DROP and TEMP MOBIL reports) or tens of hectopascals figure (in Part C of TEMP, TEMP SHIP, TEMP DROP and TEMP MOBIL reports) of the pressure relative to the last standard isobaric surface for which the wind is reported
Code figure Wind group included up to and including the following standard isobaric surfaces:
Part A Part C
1 100 hPa or 150 hPa* 10 hPa 2 200 hPa or 250 hPa** 20 hPa 3 300 hPa 30 hPa 4 400 hPa — 5 500 hPa 50 hPa 6 — — 7 700 hPa 70 hPa 8 850 hPa — 9 925 hPa — 0 1 000 hPa — / No wind group is included for any No wind group is included for any standard isobaric surface standard isobaric surface
* In this case (150 hPa), the wind group relating to the 100-hPa level shall also be included and coded as ///// except when 150 hPa is the highest standard isobaric surface reached by the sounding.
** In this case (250 hPa), the wind group relating to the 200-hPa level shall also be included and coded as ///// except when 250 hPa is the highest standard isobaric surface reached by the sounding.

CODE TABLES
A–292 Volume I.1
1735
Ie Intensity of echoes Code figure Specification Reflectivity (mm6 m–3)
0 Very weak 0 to 2.30 x 10 1 Very weak (estimated) — 2 Weak 2.31 x 10 to 9.40 x 10² 3 Weak (estimated) — 4 Moderate 9.41 x 10² to 3.70 x 10⁴ 5 Moderate (estimated) — 6 Strong 3.71 x 10⁴ to 5.00 x 10⁵ 7 Strong (estimated) — 8 Very strong 5.00 x 10⁵ 9 Very strong (estimated) — / Undetermined
1741
Ij Density of points Code figure
0 1, 2 or 3 dots 1 Weak 2 Moderate Spread of source 10° or less 3 Strong 4 Weak 5 Moderate Spread of source 10° to 20° 6 Strong 7 Weak 8 Moderate Spread of source 20° to 40° 9 Strong
1743
In Possibility that plume will encounter change in wind direction and/or speed Code figure
0 No significant change expected within the next six hours 1 Anticipated significant change expected within the next six hours 2 Reserved 3 Missing value

CODE TABLES
Volume I.1 A–293
1744
Im Indicator for method of calculation of spectral data Code figure
1 Longuet–Higgins (1964) 2 Longuet–Higgins (F3 method) 3 Maximum likelihood method 4 Maximum entropy method
5–9 Reserved
1747
Ip Indicator for type of platform Code figure
0 Sea station 1 Automatic data buoy 2 Aircraft 3 Satellite
1751
Is Ice accretion on ships Code figure
1 Icing from ocean spray 2 Icing from fog 3 Icing from spray and fog 4 Icing from rain 5 Icing from spray and rain
1765
I4 Data-processing technique used Code figure
0 Processing technique not specified 1 Clear path, using automated statistical regression 2 Partly cloudy path, using automated statistical regression 3 Cloudy path, using automated statistical regression 4 Clear path, using automated statistical regression with interactive quality control 5 Partly cloudy path, using automated statistical regression with interactive quality control 6 Cloudy path, using automated statistical regression with interactive quality control
7–9 Reserved Notes: (1) Clear path means the sounding has been generated from clear radiances derived from actual clear spot
measurements. Tropospheric and stratospheric HIRS data, as well as MSU and SSU data, have been used. (2) Partly cloudy path means the sounding has been generated from clear radiances which have been calculated
from partly cloudy spots. Tropospheric and stratospheric HIRS data, as well as MSU and SSU data, have been used.
(3) Cloudy path means the sounding has been generated only from stratospheric HIRS data, MSU data, and SSU data. Tropospheric HIRS data have not been used because of cloudy conditions.

CODE TABLES
A–294 Volume I.1
1770
IXIXIX Instrument type for XBT, with fall rate equation coefficients
(See Common Code table C-3 in Attachment I.)
1800
i Intensity or character of the weather element we (type of weather) (The column selected from this table depends on the code figures used for symbol we)
Code figure
Height of base of significant cloud
in metres
Visibility in metres
Wind force (Beaufort) Icing
Turbulence
Squalls Snow cover in
centimetres
0 Less than 50 Less than 50 10 No specification Not specified No specification No snow
1 50–99 50– 199 11 Light Light Rain, few Up to 2
2 100–199 200– 499 12 Moderate Moderate Rain, scattered but numerous
Up to 5
3 200–299 500– 999 3 Severe In c
loud
Severe In c
loud
Rain, very numerous
Up to 10
4 300–599 1 000– 1 999 4 Light Light Snow, few Up to 15
5 600–999 1 000– 3 999 5 Moderate Moderate Snow, scattered but numerous
Up to 25
6 1 000–1 499 4 000– 9 999 6 Severe
In p
reci
pita
tion
Severe In c
lear
air
Rain and snow mixed, few
Up to 50
7 1 500–1 999 10 000–19 999 7 Rain and snow mixed, few
Up to 100
8 2 000–2 499 20 000–49 999 8 Rain and snow, scattered but numerous
Up to 200
9 2 500 or more, or no clouds
50 000 or more 9 Rain and snow, very numerous
200 or more
Note: When we = 8 = saturation, 0 shall be reported for i.
1806
iE Indicator of type of instrumentation for evaporation measurement or type of crop for which evapotranspiration is reported
Code figure Instrumentation or crop type Type of data
0 USA open pan evaporimeter (without cover) 1 USA open pan evaporimeter (mesh covered) 2 GGI-3000 evaporimeter (sunken) Evaporation 3 20-m2 tank 4 Others 5 Rice 6 Wheat 7 Maize Evapotranspiration 8 Sorghum 9 Other crops

CODE TABLES
Volume I.1 A–295
1819
iR Indicator for inclusion or omission of precipitation data Code figure Precipitation data are reported: Group 6RRRtR is:
0 In Sections 1 and 3 Included in both sections 1 In Section 1 Included 2 In Section 3 Included 3 In none of the two Sections 1 and 3 Omitted (precipitation amount = 0) 4 In none of the two Sections 1 and 3 Omitted (precipitation amount not available)
1833
ic Indicator for units of sea-surface current speed Code figure
0 Metres per second 1 Knots 9 No sea-current data available
1840
ih Indicator of sign and unit of elevation/altitude Code figure
1 Elevation at/or above sea level, in metres 2 Elevation at/or above sea level, in feet 3 Elevation below sea level, in metres 4 Elevation below sea level, in feet 5 Altitude of aircraft, in tens of metres 6 Altitude of aircraft, in tens of feet 7 Negative altitude of aircraft, in tens of metres 8 Negative altitude of aircraft, in tens of feet
Note: In code figures 5 through 8, aircraft altitude is reported with reference to the standard datum plane 1013.25 hPa (29.92 inches of mercury).
1841
ij Indicator for units of wind speed and height or pressure in the jet-stream core Code figure
0 Wind in m s–1 1 Wind in km h–1 Geopotential of jet-stream core in hundreds of standard geopotential metres 2 Wind in knots 4 Wind in m s–1 5 Wind in km h–1 Pressure in whole hectopascals 6 Wind in knots
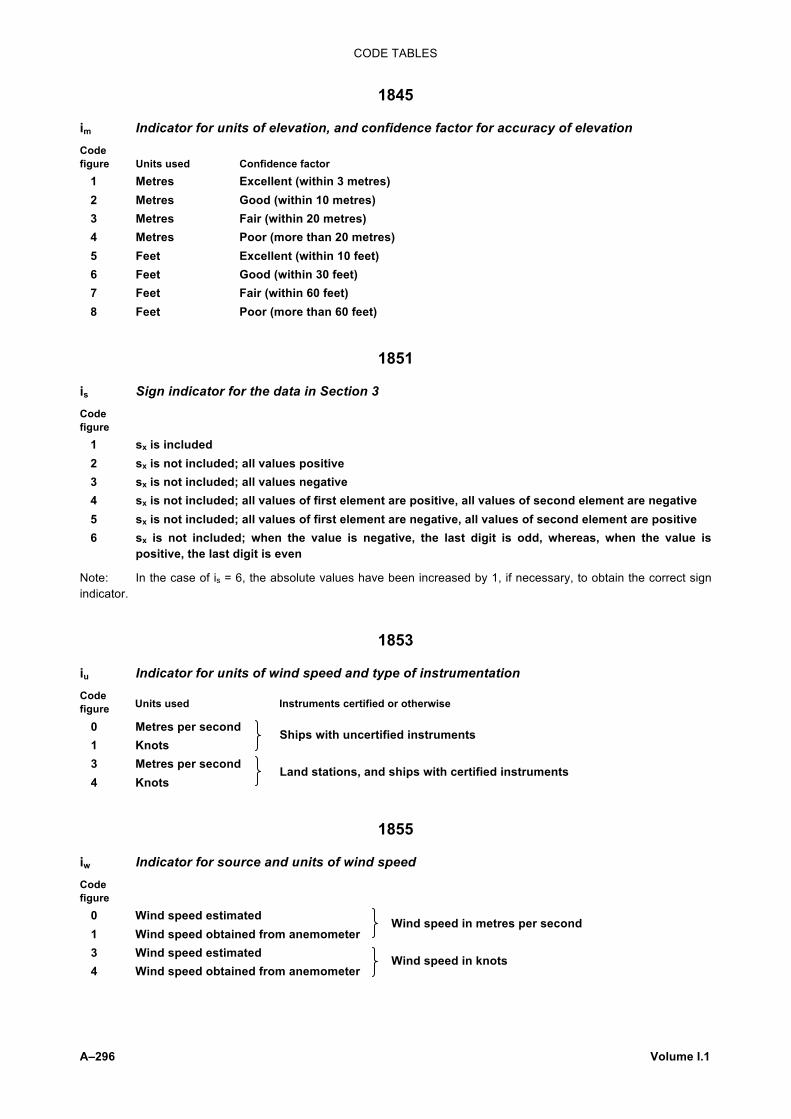
CODE TABLES
A–296 Volume I.1
1845
im Indicator for units of elevation, and confidence factor for accuracy of elevation Code figure Units used Confidence factor
1 Metres Excellent (within 3 metres) 2 Metres Good (within 10 metres) 3 Metres Fair (within 20 metres) 4 Metres Poor (more than 20 metres) 5 Feet Excellent (within 10 feet) 6 Feet Good (within 30 feet) 7 Feet Fair (within 60 feet) 8 Feet Poor (more than 60 feet)
1851
is Sign indicator for the data in Section 3 Code figure
1 sx is included 2 sx is not included; all values positive 3 sx is not included; all values negative 4 sx is not included; all values of first element are positive, all values of second element are negative 5 sx is not included; all values of first element are negative, all values of second element are positive 6 sx is not included; when the value is negative, the last digit is odd, whereas, when the value is
positive, the last digit is even
Note: In the case of is = 6, the absolute values have been increased by 1, if necessary, to obtain the correct sign indicator.
1853
iu Indicator for units of wind speed and type of instrumentation Code figure Units used Instruments certified or otherwise
0 Metres per second 1 Knots
Ships with uncertified instruments
3 Metres per second 4 Knots
Land stations, and ships with certified instruments
1855
iw Indicator for source and units of wind speed Code figure
0 Wind speed estimated 1 Wind speed obtained from anemometer
Wind speed in metres per second
3 Wind speed estimated 4 Wind speed obtained from anemometer
Wind speed in knots

CODE TABLES
Volume I.1 A–297
1857
iy Indicator to specify type of reading Code figure
1 Maximum/minimum thermometers 2 Automatic weather station 3 Thermograph
1859
iz Stability index Code figure
0 No index available 1 Total totals 2 Showalter 3 KO-index 4 Faust index
5–9 Reserved
1860
ix Indicator for type of station operation (manned or automatic) and for present and past weather data
Code Type of station figure operation Group 7wwW1W2 or 7wawaWa1Wa2
1 Manned Included 2 Manned Omitted (no significant phenomenon to report) 3 Manned Omitted (no observation, data not available) 4 Automatic Included using Code tables 4677 and 4561 5 Automatic Omitted (no significant phenomenon to report) 6 Automatic Omitted (no observation, data not available) 7 Automatic Included using Code tables 4680 and 4531
Note: Manned station operations use only the group 7wwW1W2 and indicator ix = 1, 2 and 3. Automatic station operations normally use the group 7wawaWa1Wa2 and indicator ix = 5, 6 and 7. However, only when an automatic station operation is sufficiently sophisticated and able to cope automatically with Code tables 4677 and 4561 should the group 7wwW1W2 and indicator ix = 4 be used.
1861
i0 Intensity of the phenomenon
Code figure
0 Slight 1 Moderate 2 Heavy or strong

CODE TABLES
A–298 Volume I.1
1863
i2 Zone type indicator
zzz Zone specification
0i2zzz 00000 Up to the turning point indicated by the first group QLaLaLoLo which appears between the index
numbers at the beginning of the message 01QLaLa Up to latitude LaLa 02QLoLo Up to longitude LoLo 04nnn Up to a point at a distance of nnn kilometres from preceding point 050ZZ For the area indicated in 5° zone numbers 06QLaLa At latitude LaLa 07QLoLo At longitude LoLo 09nnn At a point at a distance of nnn kilometres from preceding point
1864
i3 Indicator for supplementary phenomena nnn Specifications related to supplementary phenomena
9i3nnn 91P2P2P2 Forecast lowest mean sea pressure 92FtLaLa Type of front and its position (track of aircraft approximately N–S) 93FtLoLo Type of front and its position (track of aircraft approximately E–W) 94FtGG Type of front and time of passage 951// Gradual change along the route 952LaLa Change at latitude LaLa north along the route 953LaLa Change at latitude LaLa south along the route ROFOR only* 954LoLo Change at longitude LoLo east along the route 955LoLo Change at longitude LoLo west along the route 96GGGp (a) When Gp = 0: a self-contained part of the forecast beginning at GG. All prior forecast
conditions are superseded (b) When Gp = 1 to 4: change at either a regular or irregular rate at an unspecified time within
the period beginning at GG and indicated by Gp 97GGGp Frequent or infrequent temporary fluctuations taking place within the period indicated by Gp 9999C2 (a) When used in combination with 99GGGp: probability C2 of occurrence of an alternative
value of a forecast element, indicated in tens of per cent (b) When used in combination with 97GGGp: probability C2 of occurrence of temporary
fluctuation, indicated in tens of per cent 99GGGp Used in combination with 9999C2: time period Gp beginning at GG that the alternative value of a
forecast element may occur
* In ROFOR, such a change group must be qualified by a change group relative to time.
Note: Local variations in ARFOR and ROFOR may be described, if necessary, by the following expressions: LOC – locally (LOC, when used, will always be accompanied by plain language sufficient to identify the
locality in which the phenomenon is expected) LAN – inland COT – at the coast MAR – at sea VAL – in valleys CIT – near or over large towns MON – above high ground or mountains SCT – scattered (SCT is used when the phenomenon is expected to be scattered in space or time or in both)

CODE TABLES
Volume I.1 A–299
(Code table 1864 – continued)
Plain-language alternative terminology for the group 9i3nnn
91P2P2P2 Forecast lowest QFF (e.g. “Forecast QFF 1002”) 92FtLaLa The term FRONT should be used; the type is not normally designated; e.g. “FRONT 40 N” 93FtLoLo The term FRONT should be used; the type is not normally designated; e.g. “FRONT 30 E” 94FtGG The term FRONT should be used; the type is not normally designated; e.g. “FRONT 1200 UTC” 951// The term BECMG (without the time group) should be used for
this type of change 952LaLa The form FM LaLaN should be used for this type of change where
LaLa indicates the latitude (north) at which the change takes place
953LaLa The form FM LaLaS should be used for this type of change where ROFOR only LaLa indicates the latitude (south) at which the change takes place
954LoLo The form FM LoLoE should be used for this type of change where LoLo indicates the longitude (east) at which the change takes place
955LoLo The form FM LoLoW should be used for this type of change where LoLo indicates the longitude (west) at which the change takes place
96GGGp (a) The form FMGG should be used to indicate the beginning of self-contained part of the forecast indicated by GG. All forecast conditions before FMGG are superseded by the conditions indicated thereafter
(b) The form BECMG GGGeGe should be used to indicate a change to forecast meteorological conditions expected to occur at either a regular or irregular rate at an unspecified time within the period beginning at GG and ending at GeGe. The duration of the period beginning at GG and ending at GeGe shall normally not exceed two hours and in any case shall not exceed four hours
97GGGp The form TEMPO GGGeGe should be used to indicate frequent or infrequent temporary fluctuations to forecast meteorological conditions which are expected to last less than one hour in each instance and, in the aggregate cover, less than half of the period beginning at GG and ending at GeGe
9999C2 The form PROB (per cent) should be used for this group, either followed by GGGeGe to indicate the probability of occurrence of an alternative value of a forecast element (e.g. PROB30 1216), or followed by TEMPO GGGeGe to indicate the probability of occurrence of temporary fluctuations (e.g. PROB30 TEMPO 1216)
Pictorial illustration of changes or fluctuations (with time as abscissa and, for example, with hshshs as ordinate in the diagrams)
96GGGp – Change at specified time (Gp = 0) Example
96GGGp – Change at specified time (Gp = 0)
Example
96GGGp – Change at unspecified time within indicated time period (Gp = 1 to 4)
Example (a)(regular changethroughoutwhole period)
Forecast preceding the96GGGp
Forecast after the 96GGGp
GG
GG
Forecast precedingthe 96GGGp
Forecast after the 96GGGp
GG
GG+Gp

CODE TABLES
A–300 Volume I.1
(Code table 1864 – continued)
Example (b)(irregular changethroughout partor whole of period)
Example (c)(regular changeat unspecifiedtime throughoutperiod)
97GGGp – Temporary fluctuation(s)
Example (a)
Example (b)*
Forecast precedingthe 96GGGp
Forecast afterthe 96GGGp
GG
GG+Gp
Forecast precedingthe 96GGGp
Forecast afterthe 96GGGp
GG
GG+Gp
Forecast precedingthe 97GGGp
Forecast afterthe 97GGGp
GG+GpGG
less than1 hour
Forecast precedingthe 97GGGp
GG GG+Gp
less than
1 hour
less than
1 hour
less than
1 hour
Forecast after the 97GGGp
1 2 3
*1 + 2 + 3 = should be less than half the time indicated by Gp.

CODE TABLES
Volume I.1 A–301
2061
j1 Supplementary information indicator j2j3j4 Specifications relating to supplementary information j5j6j7j8j9 Supplementary group which follows 5j1j2j3j4 (a)
Code figure
j1 j2 j3 j4
0 1 2 3
Tens figure of evaporation or evapotranspiration
Units figure of evaporation or evapotranspiration
Tenths figure of evaporation or evapotranspiration
Indicator of type of instrumentation for evaporation measurement or type of crop for which evapotranspiration is reported
4 Temperature change data indicator
Period between the time of observation and the time of temperature change
Sign of temperature change
Amount of temperature change
5 Indicator for sunshine* Tens figure of duration of sunshine. j2 = 3 indicates that j3j4 reports duration of sunshine in past hour
Units figure of duration of sunshine
Tenths figure of duration of sunshine
Indicates the following group j5j6j7j8j9 reports radiation
j2 = 4 indicates the following group 4j6j7j8j9 reports radiation during the previous hour. j2 = 5 indicates the following group 5j6j7j8j9 reports radiation during the preceding 24 hours
j3 = 0 j4 = 7 indicates the following group reports net short-wave radiation. j4 = 8 indicates the following group reports direct solar radiation
6 Indicator for data on direction of cloud drift
Direction from which CL
clouds are moving Direction from which CM clouds are moving
Direction from which CH
clouds are moving 7 Indicator for data on
direction and elevation of cloud
Type of orographic clouds or of clouds with vertical development
Direction in which these clouds are seen
Elevation angle of the top of these clouds
8 9
Indicator for data on surface pressure change (8 – positive or zero change; 9 –negative change)
Tens figure of surface pressure change
Units figure of surface pressure change
Tenths figure of surface pressure change
* In case of j1 = 5, see Regulation 12.4.7.4.2.
(b)
Code figure
j5 j6 j7 j8 j9
0 1
Sign of net radiation
Thousands figure of net radiation
Hundreds figure of net radiation
Tens figure of net radiation
Units figure of net radiation
2 3 4 5 6 7 8 9
Indicator of type of solar or terrestrial radiation (code figures 0–6 used, 7–9 not used)
Thousands figure of solar or terrestrial radiation
Hundreds figure of solar or terrestrial radiation
Tens figure of solar or terrestrial radiation
Units figure of solar or terrestrial radiation

CODE TABLES
A–302 Volume I.1
2100
K Effect of the ice on navigation Code figure
0 Navigation unobstructed 1 Navigation slightly impeded for unstrengthened ships 2 Navigation difficult for unstrengthened ships and slightly impeded for strengthened ships 3 Navigation difficult for strengthened ships 4 Navigation very difficult for strengthened ships 5 Navigation possible for strengthened ships only with ice-breaker assistance 6 Channel open in the solid ice 7 Navigation temporarily closed 8 Navigation closed 9 Navigation conditions unknown, e.g. owing to bad weather
2200
k Indicator for specifying the half-degrees of latitude and longitude Code figure
0 Take LaLaLoLo as sent 1 Add 1/2 degree to LaLa east longitude 0° – 99° 2 Add 1/2 degree to LoLo or 3 Add 1/2 degree to LaLa and LoLo west longitude 100° – 180° 4* Whole degrees 5 Take LaLaLoLo as sent 6 Add 1/2 degree to LaLa west longitude 0° – 99° 7 Add 1/2 degree to LoLo or 8 Add 1/2 degree to LaLa and LoLo east longitude 100° – 180° 9* Whole degrees
* When k = 4 or 9, the values of LaLa and LoLo are accurate to the nearest whole degree only; for all other values of k, the accuracy is to the nearest half-degree.
2262
k1 Indicator for digitization Code figure
7 Values at selected depths (data points fixed by the instrument or selected by any other method) 8 Values at significant depths (data points taken from traces at significant depths)
2263
k2 Method of salinity/depth measurement Code figure
0 No salinity measured 1 In situ sensor, accuracy better than 0.020/00 2 In situ sensor, accuracy less than 0.020/00 3 Sample analysis

CODE TABLES
Volume I.1 A–303
2264
k3 Duration and time of current measurement (vector or Doppler current profiling method) Code figure
1 Instantaneous 2 Averaged over 3 minutes or less 3 Averaged over more than 3 minutes, but 6 at the most 4 Averaged over more than 6 minutes, but 12 at the most
between H–1 and H
5 Instantaneous 6 Averaged over 3 minutes or less 7 Averaged over more than 3 minutes, but 6 at the most 8 Averaged over more than 6 minutes, but 12 at the most
between H–2 and H–1
9 Vector or Doppler current profiling method not used
Note: H = time of observation.
2265
k4 Period of current measurement (drift method) Code figure
1 1 hour or less 2 More than 1 hour but 2 at the most 3 More than 2 hours but 4 at the most 4 More than 4 hours but 8 at the most 5 More than 8 hours but 12 at the most 6 More than 12 hours but 18 at the most 7 More than 18 hours but 24 at the most 9 Drift method not used
2266
k5 Indicator for the method of current measurement Code figure
0 Reserved 1* ADCP (Acoustic Doppler Current Profiler) 2 GEK (Geomagnetic ElectroKinetograph) 3 Ship’s set and drift determined by fixes 3–6 hours apart 4 Ship’s set and drift determined by fixes more than 6 hours but less than 12 hours apart 5 Drift of buoy 6 ADCP (Acoustic Doppler Current Profiler)
* This entry should not be used. Code figure 6 should be used instead.

CODE TABLES
A–304 Volume I.1
2267
k6 Method of removing the velocity and motion of the ship or buoy from current measurement Code figure
0 Ship’s motion removed by averaging 1 Ship’s motion removed by motion compensation Ship’s velocity removed by bottom tracking 2 Ship’s motion not removed 3 Ship’s motion removed by averaging 4 Ship’s motion removed by motion compensation Ship’s velocity removed by navigation 5 Ship’s motion not removed 6 Doppler current profiling method not used
7–9 Reserved
Note: Code figures 0, 1, 2 and 6 are also used for drifting buoys.
2300
L Estimated level of wind data Code figure
2 Low-cloud level 5 Middle-cloud level 8 High-cloud level
2382
LiLi, LjLj Type of line or feature being described
Code figure
00 No specification 01 North-east of following line* 02 East of following line* 03 South-east of following line* 04 South of following line* 05 South-west of following line* 06 West of following line* 07 North-west of following line* 08 North of following line* 09 Within following lines* 10 Land 11 Radar 12 Satellite 13 Limits of observation 14 Limits of analysis 15 Estimated 16 Compacted edge 17 Diffused edge 18 Area of greater concentration 19 Area of lesser concentration

CODE TABLES
Volume I.1 A–305
(Code table 2382 – continued)
21 Ice edge 22 Concentration boundary 23 Fast ice 24 Lead 25 Polynya 26 Belt 27 Patch 28 Field 29 Ridged ice zone 30 Fracture zone 31 Iceberg 32 Scattered icebergs 33 Group of icebergs 34 Ice island 35 (Available for expansion) 50 Whole visual observed area 51 Whole visual observed area outside pack-ice area
Note: If only one set of code figure LiLi is used, LjLj shall be coded as 00.
* The line indicated by the position groups following the group 6LiLiLjLj.
2538
Mh Character of air mass Code figure
0 No specification, or indeterminate 1 Continental (c) 2 Maritime (m)
2551
Ms Source region of air mass Code figure
0 No specification, or indeterminate 1 Arctic (A) 2 Polar (P) 3 Tropical (T) 4 Equatorial (E) 5 Superior (S)

CODE TABLES
A–306 Volume I.1
2552
Mt Thermodynamic character of air mass Code figure
0 No specification
1 Indeterminate 2 Cold (k) 3 Warm (w)
If not followed by another 33MhMsMt group, means only one air mass present; if followed by another 33MhMsMt group, means “mixed” with air mass described in the second group
4 Indeterminate 5 Cold (k) 6 Warm (w)
Is followed by another 33MhMsMt group, the air mass reported in the first group being above the air mass of the second group
7 Indeterminate 8 Cold (k) 9 Warm (w)
Is followed by another 33MhMsMt group, the air mass in the first group being “transitional” or “becoming” the air mass in the second group
2555
Mw Waterspout(s), tornadoes, whirlwinds, dust devils Code figure
0 Waterspout(s) within 3 km of station 1 Waterspout(s) more than 3 km from station 2 Tornado clouds within 3 km of station 3 Tornado clouds more than 3 km from station 4 Whirlwinds of slight intensity 5 Whirlwinds of moderate intensity 6 Whirlwinds of severe intensity 7 Dust devils of slight intensity 8 Dust devils of moderate intensity 9 Dust devils of severe intensity
2562
M1 Month when the period covered by the forecast begins M2 Month when the period covered by the forecast ends Code figure
0 Current month 1 First month after the current month 2 Second month after the current month 3 Third month after the current month 4 Fourth month after the current month 5 Fifth month after the current month 6 Sixth month after the current month 7 Seventh month after the current month 8 Eighth month after the current month 9 Ninth month after the current month

CODE TABLES
Volume I.1 A–307
2582
MiMi Identification letters of the report MjMj Identification letters of the part of the report or the version of the code form
MiMi MjMj Code form Land
station Sea
station Aircraft Satellite Part A
Part B
Part C
Part D
No distinction
FM 12-XIV Ext. SYNOP AA XX
FM 13-XIV Ext. SHIP BB XX
FM 14-XIV Ext. SYNOP MOBIL OO XX
FM 18–XII BUOY ZZ YY
FM 20–VIII RADOB FF GG AA BB
FM 32-XI Ext. PILOT PP AA BB CC DD
FM 33-XI Ext. PILOT SHIP QQ AA BB CC DD
FM 34-XI Ext. PILOT MOBIL EE AA BB CC DD
FM 35-XI Ext. TEMP TT AA BB CC DD
FM 36-XI Ext. TEMP SHIP UU AA BB CC DD
FM 37-XI Ext. TEMP DROP XX AA BB CC DD
FM 38-XI Ext. TEMP MOBIL II AA BB CC DD
FM 39-VI ROCOB RR XX
FM 40-VI ROCOB SHIP SS XX
FM 41-IV CODAR LL XX
FM 62–VIII Ext. TRACKOB NN XX
FM 63-IX BATHY JJ XX
FM 63-X Ext. BATHY JJ YY
FM 63-XI Ext. BATHY JJ VV
FM 64-IX TESAC KK XX
FM 64-XI Ext. TESAC KK YY
FM 65-XI Ext. WAVEOB MM XX
FM 67-VI HYDRA HH XX
FM 85-IX SAREP CC DD AA BB
FM 86-XI SATEM VV AA BB CC DD
FM 87-XI SARAD WW XX
FM 88-XI SATOB YY XX

CODE TABLES
A–308 Volume I.1
2590
MMM Number of Marsden square in which the station is situated at the time of observation
Note: For polar zones, see following page.
!"#
!$%
!&'
(#)
("!
(!"
#% *' () &($
&*&
&)#
'!*
'"(
'#$
*&&*&!*&(*&%*!#*!)*!$*!"*!**!'*!&*!!*!(*!%*(#*()*($*("**(**%*'#*')*'$*'"*'**''*'&*'!*'(*'%*&#*&)*&$*&"*&**&'
*(**('*(&*(!*((*(%*%#*%)*%$*%"*%**%'*%&*%!*%(*%%'##'#)
'#"'#*'#''#&'#!'#('#%')#'))')$')"')*')'')&')!')(')%
'"%'*#'*)'*$'*"'**'*''*&'*!'*('*%''#'')''$''"''*''''$#'$)'$$'$"'$*'$''$&'$!'$('$%'"#'")'"$'""'"*'"''"&'"!
'!''!&'!!'!('!%'(#'()'($'("'(*'(''(&'(!'(('(%'%#'%)''&''!''(''%'&#'&)'&$'&"'&*'&''&&'&!'&('&%'!#'!)'!$'!"
&))&)$&)"&)*&)'&)&&)!&)(&)%&$#&$)&$$&$"&$*&$'&$&&$!'%$'%"'%*'%''%&'%!'%('%%&##&#)&#$&#"&#*&#'&#&&#!&#(&#%
&*!&*(&*%&'#&')&'$&'"&'*&''&'&&'!&'(&'%&&#&&)&&$&&"&$(&$%&"#&")&"$&""&"*&"'&"&&"!&"(&"%&*#&*)&*$&*"&**&*'
&("&(*&('&(&&(!&((&(%&%#&%)&%$&%"&%*&%'&%&&%!&%(&%%&&*&&'&&&&&!&&(&&%&!#&!)&!$&!"&!*&!'&!&&!!&!(&!%&(#&()
($("
(*('
(&(!
(((%
#)
$"
*'
&!
(&"
&*&'
&&
&!
&(
&%
!#
!)
!$
!"
!*
!'
!&
!!
!(
!%
(#
*&*!
*(*%
'#')
'$'"
'*''
'&'!
'('%
&#&)
&$$!
$($%
"#")
"$""
"*"'
"&"!
"("%
*#*)
*$*"
**
)#))
)$)"
)*)'
)&
)!
)(
)%$#
$)$$
$"$*
$'$&
(%)(%$(%"(%*(%'(%&(%!(%((%%
###)
#$#"
#*#'
#&#!
#(
(!*(!'(!&(!!(!((!%((#(()(($(("((*(('((&((!(((((%(%#(''('&('!('(('%(&#(&)(&$(&"(&*(&'(&&(&!(&((&%(!#(!)(!$+
("(("%(*#(*)(*$(*"(**(*'(*&(*!(*((*%('#(')('$('"('*()%($#($)($$($"($*($'($&($!($(($%("#(")("$(""("*("'("&
(#$(#"(#*(#'(#&(#!(#((#%()#())()$()"()*()'()&()!()(!("!(*!('!(&!(!!((!(%!%#!%)!%$!%"!%*!%'!%&!%!!%(!%%(##
!&&!&!!&(!&%!!#!!)!!$!!"!!*!!'!!&!!!!!(!!%!(#!()!($!*!!*(!*%!'#!')!'$!'"!'*!''!'&!'!!'(!'%!&#!&)!&$!&"!&*
!")!"$!""!"*!"'!"&!"!!"(!"%!*#!*)!*$!*"!**!*'!*&!))!)$!)"!)*!)'!)&!)!!)(!)%!$#!$)!$$!$"!$*!$'!$&!$!!$(
170!
160!
150!
140!
130!
120!
110!
100!
90!
80!
70!
60!
50!
40!
30!
20!
10!
0!10
!20
!30
!40
!50
!60
!70
!80
!90
!10
0!11
0!12
0!13
0!14
0!15
0!16
0!17
0!18
0!18
0!
170!
160!
150!
140!
130!
120!
110!
100!
90!
80!
70!
60!
50!
40!
30!
20!
10!
0!10
!20
!30
!40
!50
!60
!70
!80
!90
!10
0!11
0!12
0!13
0!14
0!15
0!16
0!17
0!18
0!18
0!
80!
70!
60!
50!
40!
30!
20!
10! 0! 10!
20!
30!
40!
50!
60!
70!
80!
70!
60!
50!
40!
30!
20!
10! 0! 10!
20!
30!
40!
50!
60!
70!

CODE TABLES
Volume I.1 A–309
(Code table 2590 – continued)

CODE TABLES
A–310 Volume I.1
(Code table 2590 – continued
Note: The number to be coded for ULaULo in the position verifying group MMMULaULo is obtained by combining the second figure for La and the third figure for Lo in the reported position (LaLaLa QcLoLoLoLo). This number ULaULo is the number of the one-degree subdivision of the Marsden 10-degree square in which the ship is located at the time of observation.
When the ship is on the boundary between two (or four) 10-degree Marsden squares, the number to be coded for MMM is that of the Marsden 10-degree square in which the one-degree subdivision whose number is ULaULo, as defined above, corresponds to the ship’s position.
When the ship is on the meridian 0° or 180°, as well as on the Equator, the number used for reporting Qc shall be taken into account for determining the relevant number of the Marsden 10-degree square.
Examples:
(1) For a ship located at 42.3°N and 30.0°W, the position is coded as follows:
Qc = 7, LaLaLa = 423, LoLoLoLo = 0300
ULaULo is therefore 20. The ship is on the boundary line between Marsden squares 147 and 148. The relevant scheme of the annex (Qc = 7) shows that the one-degree subdivision corresponding to the ship’s position would be numbered 29 in Marsden square 147 and 20 in Marsden square 148. MMM is therefore to be coded 148.
(2) For a ship located at 40.0°S and 120.0°E, the position is coded as follows:
Qc = 3, LaLaLa = 400, LoLoLoLo = 1200
ULaULo is therefore 00. The ship is on the boundary point between Marsden squares 431, 432, 467 and 468. The relevant scheme of the annex (Qc = 3) shows that the one-degree subdivision corresponding to the ship’s position would be 90 in Marsden square 431, 99 in Marsden square 432, 00 in Marsden square 467, and 09 in Marsden square 468. MMM is therefore to be coded 467.
(See annex.)

CODE TABLES
Volume I.1 A–311
(Code table 2590 – continued)
ANNEX Subdivisions of the Marsden 10-degree squares into one-degree squares
for the eight octants (Q) of the globe

CODE TABLES
A–312 Volume I.1
2600
m Movement Code figure
0 No specification 1 Stationary 2 Little change 3 Becoming stationary 4 Retarding 5 Curving to left 6 Recurving 7 Accelerating 8 Curving to right 9 Expected to recurve
2604
mS Averaging period for salinity
mT Averaging period for sea temperature
mc Averaging period for surface current direction and speed Code figure
0 Spot values 1 Less than 15 minutes 2 From 15 to 45 minutes 3 More than 45 minutes 9 Data not available
2649
mr Method of reducing data Code figure
1 Manually – Nomogram 2 Electronic computer 9 Other method
Note: Code figure 1 shall be reported if all, or any portion, of the data reduction was manual. Code figure 2 shall be reported only when all the data reduction was by electronic computer.
2650
ms Stage of melting Code figure
0 No melt 1 Discoloured ice 2 Flooded ice

CODE TABLES
Volume I.1 A–313
(Code table 2650 – continued)
3 Few puddles 4 Many puddles 5 Puddles with few thaw holes 6 Puddles with many thaw holes 7 Thaw holes, no puddles 8 Rotten ice 9 Refreezing/refrozen puddles / Undetermined or unknown
2677
mm Procedure or model used to generate the data field Code figure
00 Subjective analysis 01–09 Subjective forecast 10–19 Objective (numerical) analysis 20–29 Barotropic (one layer) numerical forecast based on the primitive equations 30–39 Barotropic (one layer) numerical forecast based on other than the primitive equations 40–59 Baroclinic (multilayer) numerical forecast based on the primitive equations 60–79 Baroclinic (multilayer) numerical forecast based on other than the primitive equations 80–98 Other procedures or models
99 Not mentioned
Note: Detailed specifications of each procedure or model are contained in Weather Reporting (WMO-No. 9), Volume B.
2700
N Total cloud cover Nh Amount of all the CL cloud present or, if no CL cloud is present, the amount of all the CM
cloud present Ns Amount of individual cloud layer or mass whose genus is indicated by C N′ Amount of cloud whose base is below the level of the station Code figure
0 0 0 1 1 okta or less, but not zero 1/10 or less, but not zero 2 2 oktas 2/10 – 3/10 3 3 oktas 4/10 4 4 oktas 5/10 5 5 oktas 6/10 6 6 oktas 7/10 – 8/10 7 7 oktas or more, but not 8 oktas 9/10 or more, but not 10/10 8 8 oktas 10/10 9 Sky obscured by fog and/or other meteorological phenomena / Cloud cover is indiscernible for reasons other than fog or other meteorological phenomena, or
observation is not made
Note: For use of (/), see Regulation 12.1.4.

CODE TABLES
A–314 Volume I.1
2745
Nm Cloud conditions over mountains and passes Code figure
0 All mountains open, only small amounts of cloud present 1 Mountains partly covered with detached clouds (not more than half the peaks can be seen) 2 All mountain slopes covered, peaks and passes free 3 Mountains open on observer’s side (only small amounts of cloud present), but a continuous wall of
cloud on the other side 4 Clouds low above the mountains, but all slopes and mountains open (only small amounts of cloud
on the slopes) 5 Clouds low above the mountains, peaks partly covered by precipitation trails or clouds 6 All peaks covered but passes open, slopes either open or covered 7 Mountains generally covered but some peaks free, slopes wholly or partially covered 8 All peaks, passes and slopes covered 9 Mountains cannot be seen owing to darkness, fog, snowstorm, precipitation, etc.
2752
Nt Condensation trails Code figure
5 Non-persistent condensation trails 6 Persistent condensation trails covering less than 1/8 of the sky 7 Persistent condensation trails covering 1/8 of the sky 8 Persistent condensation trails covering 2/8 of the sky 9 Persistent condensation trails covering 3/8 or more of the sky
2754
Nv Cloud conditions observed from a higher level
Code figure
0 No cloud or mist 1 Mist, clear above 2 Fog patches 3 Layer of slight fog 4 Layer of thick fog 5 Some isolated clouds 6 Isolated clouds and fog below 7 Many isolated clouds 8 Sea of clouds 9 Bad visibility obscuring the downward view
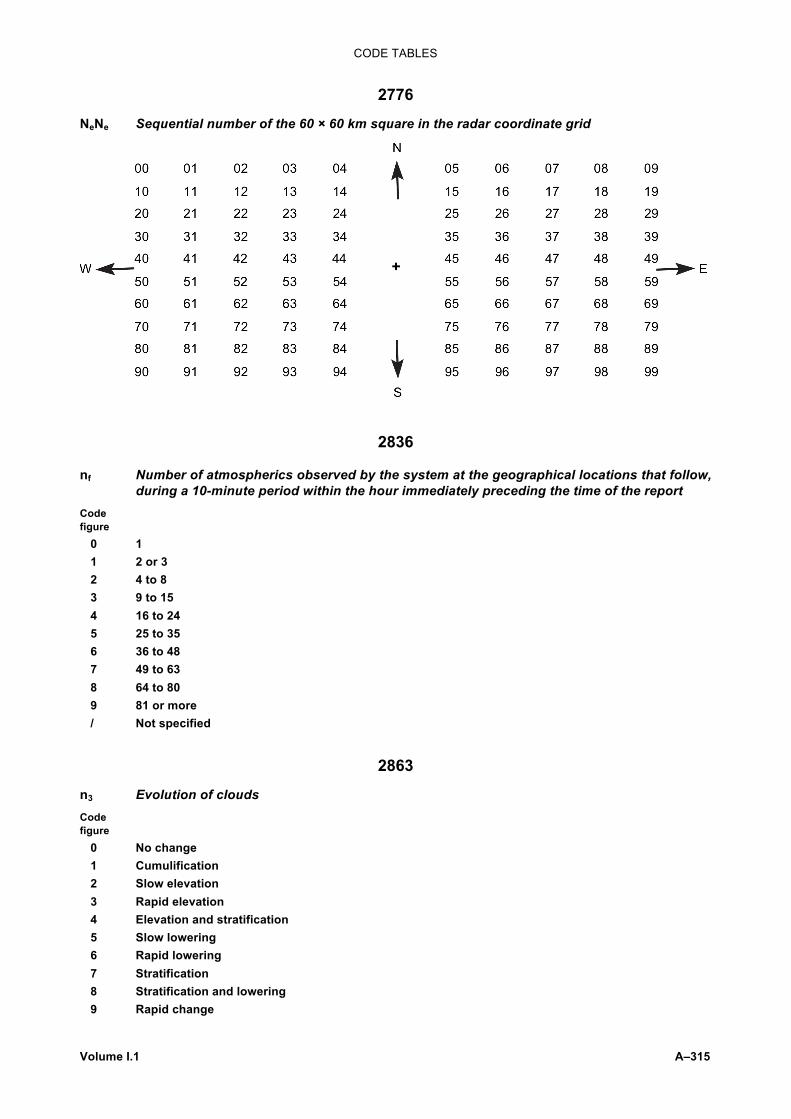
CODE TABLES
Volume I.1 A–315
2776
NeNe Sequential number of the 60 × 60 km square in the radar coordinate grid
2836
nf Number of atmospherics observed by the system at the geographical locations that follow, during a 10-minute period within the hour immediately preceding the time of the report
Code figure
0 1 1 2 or 3 2 4 to 8 3 9 to 15 4 16 to 24 5 25 to 35 6 36 to 48 7 49 to 63 8 64 to 80 9 81 or more / Not specified
2863
n3 Evolution of clouds Code figure
0 No change 1 Cumulification 2 Slow elevation 3 Rapid elevation 4 Elevation and stratification 5 Slow lowering 6 Rapid lowering 7 Stratification 8 Stratification and lowering 9 Rapid change

CODE TABLES
A–316 Volume I.1
2864
n4 Evolution of clouds observed from a station at a higher level Code figure
0 No change 1 Decrease and elevation 2 Decrease 3 Elevation 4 Decrease and lowering 5 Increase and elevation 6 Lowering 7 Increase 8 Increase and lowering 9 Intermittent fog at the station
2877
nBnB Number of icebergs within the area nGnG Number of growlers and bergy bits within the area Code Code figure figure
00 None 15 15 01 1 16 16 02 2 17 17 03 3 18 18 04 4 19 19 05 5 20 1–9 06 6 21 0–19 07 7 22 20–29 08 8 23 30–39 09 9 24 40–49 10 10 25 50–99 11 11 26 100–199 12 12 27 200–499 13 13 28 500 or more 14 14 99 No indication because counting has been impossible
Notes:
(1) If the exact number, 1 to 19, is known, code figures 01 to 19 shall be used.
(2) If the number is more than 19, or if the exact number can only be estimated, code figures 20 to 28 shall be used.
(3) Code figure 99 shall only be used when it is absolutely impossible to make a reasonable estimate of the number.
2890
nTnT Indicator of reference code table for type of parameter a1a1a1, a2a2a2 Code figure
00 Code table 0291 01–99 Reserved
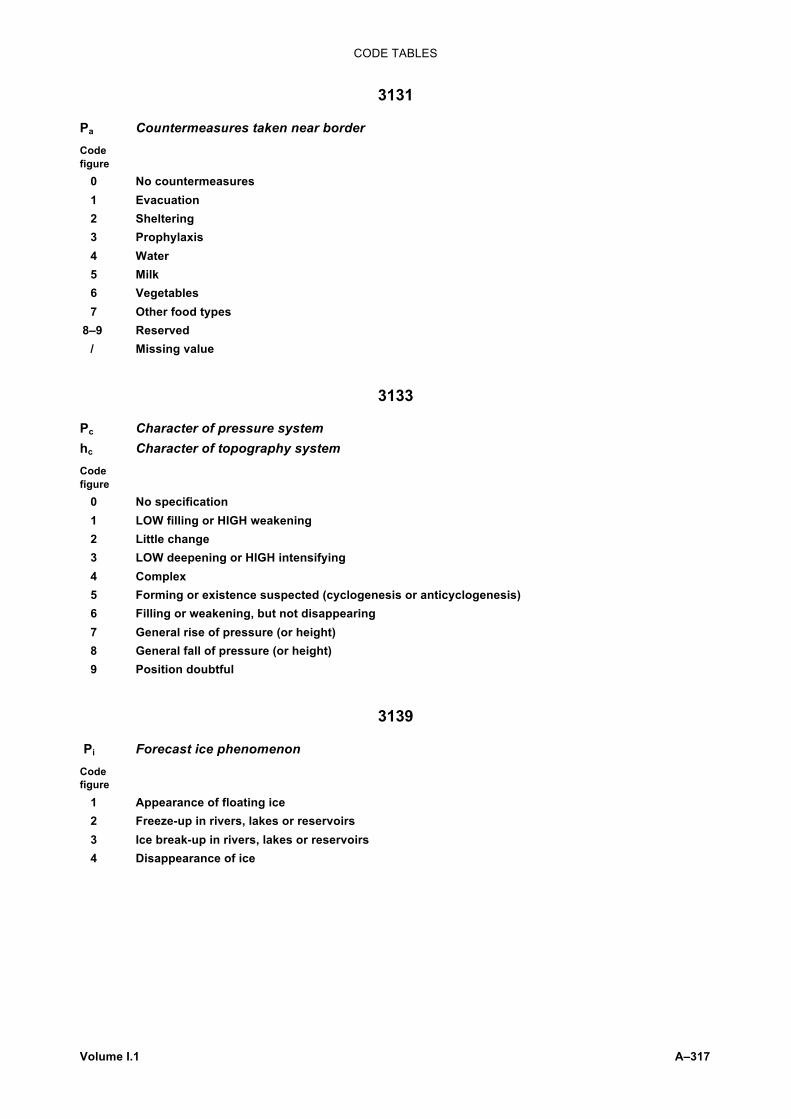
CODE TABLES
Volume I.1 A–317
3131
Pa Countermeasures taken near border Code figure
0 No countermeasures 1 Evacuation 2 Sheltering 3 Prophylaxis 4 Water 5 Milk 6 Vegetables 7 Other food types
8–9 Reserved / Missing value
3133
Pc Character of pressure system hc Character of topography system Code figure
0 No specification 1 LOW filling or HIGH weakening 2 Little change 3 LOW deepening or HIGH intensifying 4 Complex 5 Forming or existence suspected (cyclogenesis or anticyclogenesis) 6 Filling or weakening, but not disappearing 7 General rise of pressure (or height) 8 General fall of pressure (or height) 9 Position doubtful
3139
Pi Forecast ice phenomenon Code figure
1 Appearance of floating ice 2 Freeze-up in rivers, lakes or reservoirs 3 Ice break-up in rivers, lakes or reservoirs 4 Disappearance of ice

CODE TABLES
A–318 Volume I.1
3152
Pt Type of pressure system ht Type of topography system Code figure
0 Complex LOW 1 LOW 2 Secondary 3 Trough 4 Wave 5 HIGH 6 Area of uniform pressure (or height) 7 Ridge 8 Col 9 Tropical storm
3155
Pw Period of waves Code figure
0 10 seconds 1 11 seconds 2 12 seconds 3 13 seconds 4 14 seconds or more 5 5 seconds or less 6 6 seconds 7 7 seconds 8 8 seconds 9 9 seconds / Calm or period not determined
3300
Q Octant of the globe Code figure Longitude Hemisphere Code
figure Longitude Hemisphere
0 0° – 90°W 5 0° – 90°W
1 90° – 180°W 6 90° – 180°W 2 180° – 90°E 7 180° – 90°E 3 90° – 0°E
northern
8 90° – 0°E southern

CODE TABLES
Volume I.1 A–319
(Code table 3300 – continued)
N
180° 90° 0° 90° 180°
1 0 3 2
Equator W
6 5
Gre
enw
ich
mer
idia
n
8 7
E
180° 90° 0° 90° 180°
S
3302
QA Location quality class (range of radius of 66% confidence) Code figure
0 Radius ≥ 1500 m 1 500 m ≤ Radius < 1500 m 2 250 m ≤ Radius < 500 m 3 Radius < 250 m / Location quality class information not available
3311
QL Quality of location Code figure
0 The value transmitted at the beginning of the report is a reliable value (location made over two satellite passes)
1 The values at the beginning of the report are the latest known values (no location over the corresponding pass)
2 Dubious quality. The location was made over one pass only; a second solution is possible in five per cent of the cases
3313
QN Quality of the buoy satellite transmission Code figure
0 Good quality (several identical reports have been received) 2 Dubious quality (no identical reports)

CODE TABLES
A–320 Volume I.1
3315
QP Quality of the pressure measurement Code figure
0 Value within specified limits 1 Value outside specified limits
3318
Qz Indicator of depth correction (indication whether probe depths are corrected using hydrostatic pressure or not)
Code figure
0 Depth are not corrected 1 Depth are corrected / Missing
3319
QTW Quality of the measurement of the water-surface temperature Code figure
0 Value within limits 1 Value outside limits
3333
Qc Indicator of depth correction Code figure Latitude Longitude
1 North East 3 South East 5 South West 7 North West
Note: The choice is left to the observer in the following cases:
– When the ship is on the Greenwich meridian or the 180th meridian (LoLoLoLo = 0000 or 1800 respectively):
Qc = 1 or 7 (northern hemisphere) or
Qc = 3 or 5 (southern hemisphere);
– When the ship is on the Equator (LaLaLa = 000):
Qc = 1 or 3 (eastern longitude) or
Qc = 5 or 7 (western longitude).
Qc = 7 N Qc = 1
W E
Qc = 5 S Qc = 3
Equator
Gre
enw
ich
mer
idia
n

CODE TABLES
Volume I.1 A–321
3334
Qd Quality control indicator Qd1 Quality control indicator for temperature/salinity profile Qd2 Quality control indicator for current profile Ql Quality control indicator for position Qt Quality control indicator for time Code figure
0 Data not checked 1 Data good 2 Data inconsistent 3 Data doubtful 4 Data wrong 5 Data value has been changed
Note: These flags are the same as the IGOSS quality control flags.
3363
Q2 Quality of the housekeeping parameter (second word in first block of ARGOS platform transmitters terminal sensor data)
Q4 Quality of the measurement of air temperature Code figure
0 Value within limits 1 Value outside limits
3462
q1 Message contraction and data scanning indicator Code Spaces included figure between data groups Data line scanning mode
0 Yes Normal 1 Yes As described in Weather Reporting (WMO-No. 9), Volume B 2 No Normal 3 No As described in Weather Reporting (WMO-No. 9), Volume B

CODE TABLES
A–322 Volume I.1
3463
q2 Data contraction indicator Code figure
0 All data location groups and, where necessary, the group 999I0I0 included 1 Groups 999I0I0 k1k1ngng iaiaiajajaja omitted 2 Groups 999I0I0 ngng iaiaiajajaja omitted 3 Groups ngng iaiaiajajaja omitted 4 Group iaiaiajajaja omitted 5 Group 999I0I0 omitted
Notes:
(1) Code figures 1, 2, 3, 4 and 5 for q2 shall be used only when the relevant details are given in the appropriate WMO publication so that the unambiguous reconstruction of the product is possible by using that publication.
(2) When ngng is omitted but k1k1 is included, no solidi shall be included in the place of ngng. The group will therefore be reported in the form of k1k1.
3533
Rc Composition of release
Code figure
0 Noble gases 1 Iodines 2 Caesiums 3 Transuranics
4–9 Reserved / Missing value
3534
Rd Frequency group within which R1R1R1R1 falls Code figure
0 Smaller than any value in the 30-year period 1 In the first quintile 2 In the second quintile 3 In the third quintile 4 In the fourth quintile 5 In the fifth quintile 6 Greater than any value in the 30-year period
3535
Re Possibility of significant chemical toxic health effect Code figure
0 No significant chemical toxic health effect 1 Significant chemical toxic health effect possible 2 Reserved 3 Missing value

CODE TABLES
Volume I.1 A–323
3538
Rh Maximum height of ridging Code figure
0 Level ice 1 1 m 2 2 m 3 3 m 4 4 m 5 5 m 6 6 m 7 7 m 8 8 m 9 9 m or more / Undetermined or unknown
3548
Rp Possibility that plume will encounter precipitation in State in which incident occurred Code figure
0 Plume will not encounter rain in incident State 1 Plume will encounter rain in incident State 2 Reserved 3 Missing value
3551
Rs Rate of ice accretion on ships Code figure
0 Ice not building up 1 Ice building up slowly 2 Ice building up rapidly 3 Ice melting or breaking up slowly 4 Ice melting or breaking up rapidly
3552
Rt Time at which precipitation given by RRR began or ended Code figure
1 Less than 1 hour before time of observation 2 1 to 2 hours before time of observation 3 2 to 3 hours before time of observation 4 3 to 4 hours before time of observation 5 4 to 5 hours before time of observation 6 5 to 6 hours before time of observation 7 6 to 12 hours before time of observation 8 More than 12 hours before time of observation 9 Unknown

CODE TABLES
A–324 Volume I.1
3555
Rw Wave length of the radar Code figure
1 10 to less than 20 mm 3 20 to less than 40 mm 5 40 to less than 60 mm 7 60 to less than 90 mm 8 90 to less than 110 mm 9 110 mm and greater
3570
RR Amount of precipitation or water equivalent of solid precipitation, or diameter of solid deposit
Code figure mm Code
figure mm Code figure mm
00 0 34 34 68 180 01 1 35 35 69 190 02 2 36 36 70 200 03 3 37 37 71 210 04 4 38 38 72 220 05 5 39 39 73 230 06 6 40 40 74 240 07 7 41 41 75 250 08 8 42 42 76 260 09 9 43 43 77 270 10 10 44 44 78 280 11 11 45 45 79 290 12 12 46 46 80 300 13 13 47 47 81 310 14 14 48 48 82 320 15 15 49 49 83 330 16 16 50 50 84 340 17 17 51 51 85 350 18 18 52 52 86 360 19 19 53 53 87 370 20 20 54 54 88 380 21 21 55 55 89 390 22 22 56 60 90 400 23 23 57 70 91 0.1 24 24 58 80 92 0.2 25 25 59 90 93 0.3 26 26 60 100 94 0.4 27 27 61 110 95 0.5 28 28 62 120 96 0.6 29 29 63 130 97 30 30 64 140
A little precipitation, non-measurable
31 31 65 150 98 More than 400 mm 32 32 66 160 99 Measurement impossible 33 33 67 170

CODE TABLES
Volume I.1 A–325
3590
RRR Amount of precipitation which has fallen during the period preceding the time of observation, as indicated by tR
Code figure
Code figure
000 No precipitation 990 Trace 001 1 mm 991 0.1 mm 002 2 mm 992 0.2 mm etc. etc. 993 0.3 mm 988 988 mm 994 0.4 mm 989 989 mm or more 995 0.5 mm
996 0.6 mm 997 0.7 mm 998 0.8 mm 999 0.9 mm /// Precipitation not measured
Note: See Regulations 12.2.5.4, 22.5.2.1 and 22.5.2.2.
3596
RRRR Total amount of precipitation or water equivalent of snow cover on the ground R1R1R1R1 Total precipitation for the month Code figure 0000 No precipitation or no measurable water equivalent of snow cover on the ground 0001 1 mm 0002 2 mm etc. etc. 8898 8 898 mm 8899 8 899 mm or more 9999 More than zero and less than 1 mm
3644
rm Type of rocket motor Code figure
0 114 mm (4.5 in.), end burning 1 76 mm (3.0 in.), internal burning 2 Boosted, 114 mm (4.5 in.), end burning 3 Boosted, 76 mm (3.0 in.), internal burning 4 135 mm (5.3 in.), internal burning 5 160 mm (6.3 in.), internal burning

CODE TABLES
A–326 Volume I.1
3652
rt Distance between the end of the observed outermost spiral band and the centre of the tropical cyclone
Code figure
0 0 to less than 100 km 1 100 to less than 200 km 2 200 to less than 300 km 3 300 to less than 400 km 4 400 to less than 500 km 5 500 to less than 600 km 6 600 to less than 800 km 7 800 km or more / Doubtful or undetermined
3685
rara Radiosonde/sounding system used
(See common Code table C–2 in Attachment I.)
3700
S State of the sea S′ State of the water surface in an alighting area Code Height* figure Descriptive terms in metres
0 Calm (glassy) 0 1 Calm (rippled) 0 – 0.1 2 Smooth (wavelets) 0.1 – 0.5 3 Slight 0.5 – 1.25 4 Moderate 1.25 – 2.5 5 Rough 2.5 – 4 6 Very rough 4 – 6 7 High 6 – 9 8 Very high 9 – 14 9 Phenomenal Over 14
Notes:
(1) * These values refer to well-developed wind waves of the open sea. While priority shall be given to the descriptive terms, these height values may be used for guidance by the observer when reporting the total state of agitation of the sea resulting from various factors such as wind, swell, currents, angle between swell and wind, etc.
(2) The exact bounding height shall be assigned for the lower code figure; e.g. a height of 4 m is coded as 5.

CODE TABLES
Volume I.1 A–327
3704
SC Shape and definition of the eye of the tropical cyclone Code figure
0 Circular 1 Elliptical – the minor axis is at least 3/4 the length of the major axis 2 Elliptical – the minor axis is less than 3/4 the length of the major axis well defined 3 Apparent double eye 4 Other shape 5 III defined / Undetermined
3738
Sh Type of temperature and height data Code figure
0 Observed air temperature – D-value positive 2 Observed air temperature – D-value negative 4 Observed air temperature – no D-value reported 6 Air temperature reduced to the nearest standard isobaric surface – height reduced to the nearest
standard isobaric surface
3739
Si Stage of development Code figure
0 New ice only (frazil ice, grease ice, slush, shuga) 1 Nilas or ice rind, less than 10 cm thick 2 Young ice (grey ice, grey-white ice), 10–30 cm thick 3 Predominantly new and/or young ice with some first-year ice 4 Predominantly thin first-year ice with some new and/or young ice 5 All thin first-year ice (30–70 cm thick) 6 Predominantly medium first-year ice (70–120 cm thick) and thick first-year ice (>120 cm thick) with
some thinner (younger) first-year ice 7 All medium and thick first-year ice 8 Predominantly medium and thick first-year ice with some old ice (usually more than 2 metres thick) 9 Predominantly old ice / Unable to report, because of darkness, lack of visibility or because only ice of land origin is visible
or because ship is more than 0.5 nautical mile away from ice edge
3761
S0 Hoar frost or coloured precipitation Code figure
0 Hoar frost on horizontal surfaces 1 Hoar frost on horizontal and vertical surfaces 2 Precipitation containing sand or desert dust 3 Precipitation containing volcanic ash

CODE TABLES
A–328 Volume I.1
3762
S1, S2 Nature of the zone separated by the line formed by the points following the 2CsS1S2Z1 group (S1 is the part to the right of the line, S2 is the zone inside the line)
Code figure
0 Sky clear or slightly clouded 1 Sky cloudy or very cloudy 2 Anterior or lateral zone 3 Central zone 4 Posterior zone 5 Thunder zone 6 Fog 7 Connecting zone 8 Instability 9 Stratus (below 800 m) or stratocumulus
3763
S1 Predominant stage of development of ice S2 Secondary stage of development of ice S3 Tertiary stage of development of ice S4 Quaternary stage of development of ice S5 Quintary stage of development of ice Code figure
0 No stage of development 1 New ice 2 Ice rind, dark nilas, light nilas 3 Grey ice 4 Grey-white ice 5 Thin first-year ice 6 Medium first-year ice 7 Thick first-year ice 8 Second-year ice 9 Multi-year ice / Undetermined or unknown

CODE TABLES
Volume I.1 A–329
3764
S6 Type of frozen deposit
Code figure
0 Glaze 1 Soft rime 2 Hard rime 3 Snow deposit 4 Wet snow deposit 5 Freezing wet snow deposit 6 Compound deposits (at the same time glazed ice and rime, or rime and freezing wet snow, etc.) 7 Ground ice*
* Ice or ice-encrusted snow on the surface of the ground. This forms as a result of freezing liquid precipitation – rain, drizzle, thick fog droplets, wet snow, and also as a result of freezing snowmelt on the surface of the ground. Ground ice also includes snow which is compacted and ice-encrusted as a result of road traffic movement. Ground ice, as distinct from glaze, is observed only on the surface of the ground, and most often on the road.
3765
S7 Character of snow cover Code figure
0 Light, fresh snow 1 Fresh snow blown into drifts 2 Fresh compact snow 3 Old snow, loose 4 Old snow, firm 5 Old snow, moist 6 Loose snow, with surface crust 7 Firm snow, with surface crust 8 Moist snow, with surface crust
3766
S8 Snowstorm phenomena (snow raised by the wind) Code figure
0 Snow haze 1 Drifting snow, slight or moderate, with or without snow falling 2 Drifting snow, heavy, without snow falling 3 Drifting snow, heavy, with snow falling 4 Blowing snow, slight or moderate, without snow falling 5 Blowing snow, heavy, without snow falling 6 Blowing snow, slight or moderate, with snow falling 7 Blowing snow, heavy, with snow falling 8 Drifting and blowing snow, slight or moderate, impossible to determine whether snow is falling or
not 9 Drifting and blowing snow, heavy, impossible to determine whether snow is falling or not

CODE TABLES
A–330 Volume I.1
3775
S′7 Regularity of snow cover Code figure
0 Even snow cover, ground frozen, no drifts 1 Even snow cover, ground soft, no drifts 2 Even snow cover, state of ground unknown, no drifts 3 Snow cover moderately uneven, ground frozen, slight drifts 4 Snow cover moderately uneven, ground soft, slight drifts 5 Snow cover moderately uneven, state of ground unknown, slight drifts 6 Snow cover very uneven, ground frozen, deep drifts 7 Snow cover very uneven, ground soft, deep drifts 8 Snow cover very uneven, state of ground unknown, deep drifts
3776
S′8 Evolution of drift snow Code figure
0 Drift snow ended before the hour of observation 1 Intensity diminishing 2 No change 3 Intensity increasing 4 Continues, apart from interruption lasting less than 30 minutes 5 General drift snow has become drift snow near the ground 6 Drift snow near the ground has become general drift snow 7 Drift snow has started again after an interruption of more than 30 minutes
3777
SS Section of front or of pressure system to which NN refers Code figure
00 No section specified 01 North-east section 02 East section 03 South-east section 04 South section 05 South-west section 06 West section 07 North-west section 08 North section

CODE TABLES
Volume I.1 A–331
3778
SPSPspsp Supplementary information
Note: The group 9SPSPspsp is used to give (additional) information about certain phenomena occurring at the time of observation and/or during the period covered by ww or W1W2. The relevant time or time period may be indicated by inclusion of one or more time groups (decile 00–09), when and where appropriate.
9SPSPspsp
Decile 00–09: Time and variability 900tt Time of commencement 900zz Variability, location or intensity
of weather phenomenon reported by ww in group 7wwW1W2
901tt Time of ending of weather phenomenon reported by ww in group 7wwW1W2 902tt Time of commencement 902zz Variability, location or intensity
of weather phenomenon reported in the following group 9SPSPspsp
903tt Time of ending of weather phenomenon reported in the preceding group 9SPSPspsp 904tt Time of occurrence of weather phenomenon reported in the following group 9SPSPspsp 905tt
Duration of non-persistent weather phenomenon or time of commencement of persistent weather phenomenon
reported by ww in group 7wwW1W2
906tt
Duration of non-persistent weather phenomenon or time of commencement of persistent weather phenomenon
reported in the following group 9SPSPspsp
907tt Duration of period of reference, ending at the time of observation, of weather phenomenon reported in the following group 9SPSPspsp
908 Not used 909Rtdc Time at which precipitation given by RRR began or ended and duration and character of
precipitation
Decile 10–19: Wind and squall 910ff Highest gust during the 10-minute period immediately preceding the observation 911ff Highest gust 912ff Highest mean wind speed 913ff Mean wind speed 914ff Lowest mean wind speed
during the period covered by W1W2 in group 7wwW1W2, unless a different period of reference is indicated by group 907tt; or during the 10-minute period immediately preceding the time of observation indicated by group 904tt
915dd Direction of wind 916tt Pronounced clockwise shift in wind direction (veering) 917tt Pronounced anticlockwise shift in wind direction (backing) 918sqDp Nature and/or type of squall, and direction from which it approaches the station 919MwDa Waterspout(s), tornadoes, whirlwinds, dust devils Notes:
(1) When wind speed reaches or exceeds 99 units (knots or m s–1 as indicated by iw), two groups shall be used in the same manner as in Section 1 of the code form. For example, to report a gust of 135 knots during the 10-minute period preceding the observation, the two groups would be coded 91099 00135.
(2) The mean wind speed referred to in groups 912ff and 914ff is defined as time averaged instantaneous wind speed over a 10-minute interval throughout the period covered by W1W2 or as indicated by a preceding time group.
(3) A significant change in wind speed and/or direction is reported by two 913ff and/or 915dd groups giving the speed and/or direction before and after the change. Time of change is given by the group 906tt preceding the second 913ff and/or 915dd groups. Variation in speed and/or direction of light and variable winds would not normally be reported, nor would a gradual change in speed and/or direction of a strong wind; by “significant” change is meant a sudden onset or cessation of a strong wind or a sudden change in speed and/or direction of a strong wind.
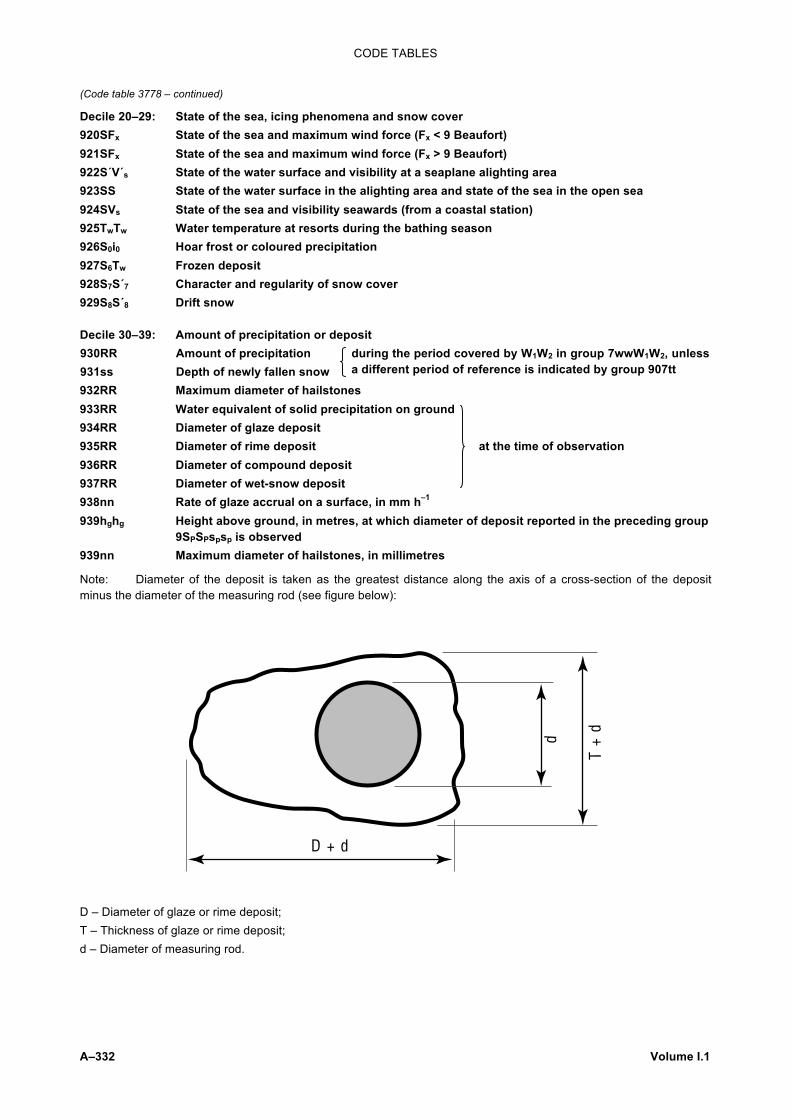
CODE TABLES
A–332 Volume I.1
(Code table 3778 – continued)
Decile 20–29: State of the sea, icing phenomena and snow cover 920SFx State of the sea and maximum wind force (Fx < 9 Beaufort) 921SFx State of the sea and maximum wind force (Fx > 9 Beaufort) 922S´V´s State of the water surface and visibility at a seaplane alighting area 923SS State of the water surface in the alighting area and state of the sea in the open sea 924SVs State of the sea and visibility seawards (from a coastal station) 925TwTw Water temperature at resorts during the bathing season 926S0i0 Hoar frost or coloured precipitation 927S6Tw Frozen deposit 928S7S´7 Character and regularity of snow cover 929S8S´8 Drift snow
Decile 30–39: Amount of precipitation or deposit 930RR Amount of precipitation 931ss Depth of newly fallen snow
during the period covered by W1W2 in group 7wwW1W2, unless a different period of reference is indicated by group 907tt
932RR Maximum diameter of hailstones 933RR Water equivalent of solid precipitation on ground 934RR Diameter of glaze deposit 935RR Diameter of rime deposit at the time of observation 936RR Diameter of compound deposit 937RR Diameter of wet-snow deposit 938nn Rate of glaze accrual on a surface, in mm h–1 939hghg Height above ground, in metres, at which diameter of deposit reported in the preceding group
9SPSPspsp is observed 939nn Maximum diameter of hailstones, in millimetres
Note: Diameter of the deposit is taken as the greatest distance along the axis of a cross-section of the deposit minus the diameter of the measuring rod (see figure below): D – Diameter of glaze or rime deposit; T – Thickness of glaze or rime deposit; d – Diameter of measuring rod.
D + d
d
T +
d

CODE TABLES
Volume I.1 A–333
(Code table 3778 – continued)
Decile 40–49: Clouds 940Cn3 Evolution of clouds 941CDp Direction from which clouds are moving 942CDa Location of maximum concentration of clouds 943CLDp Direction from which low-level clouds are moving 944CLDa Location of maximum concentration of low-level clouds 945htht Height of the tops of the lowest clouds or height of the lowest cloud layer or fog 946CcDa Direction of coloration and/or convergence of clouds associated with a tropical disturbance 947Ce´ Elevation of clouds 948C0Da Orographic clouds 949CaDa Clouds of vertical development
Decile 50–59: Cloud conditions over mountains and passes, or in valleys or plains observed from a higher level
950Nmn3 Cloud conditions over mountains and passes 951Nvn4 Fog, mist or low cloud in valleys or plains, observed from a station at a higher level 952–957 Not used 958EhDa Location of maximum concentration of cloud 959vpDp Forward speed and direction from which clouds are moving
reported in the preceding group 9SPSPspsp
Decile 60–69: Present weather and past weather 960ww Present weather phenomenon observed simultaneously with and/or in addition to weather
phenomenon reported by ww in group 7wwW1W2 961w1w1 Present weather phenomenon observed simultaneously with and/or in addition to weather
phenomenon reported by ww in group 7wwW1W2, or amplification of present weather phenomenon reported by ww in group 7wwW1W2
962ww 963w1w1
Amplification of weather phenomenon during preceding hour but not at the time of observation and reported by ww = 20-29 in group 7wwW1W2
964ww 965w1w1
Amplification of weather phenomenon during the period covered by W1W2 and reported by W1 and/or W2 in group 7wwW1W2
966ww 967w1w1
Weather phenomenon occurring at the time or during the period indicated by associated 9SPSPspsp time groups
968 Not used 9696Da Rain at the station not associated with thunderstorm in distance, direction Da 9697Da Snow at the station not associated with thunderstorm in distance, direction Da 9698Da Shower at the station not associated with thunderstorm in distance, direction Da
Decile 70–79: Location and movement of phenomena 970EhDa ww in group 7wwW1W2
971EhDa ww in group 960ww 972EhDa w1w1 in group 961w1w1
973EhDa W1 in group 7wwW1W2
974EhDa
Location of maximum concentration phenomenon reported by
W2 in group 7wwW1W2
975vpDp ww in group 7wwW1W2
976vpDp ww in group 960ww 977vpDp w1w1 in group 961w1w1
978vpDp W1 in group 7wwW1W2
979vpDp
Forward speed and direction from which it is moving, phenomenon reported by
W2 in group 7wwW1W2

CODE TABLES
A–334 Volume I.1
(Code table 3778 – continued)
Decile 80–89: Visibility 980VsVs Visibility towards the sea 981VV Visibility to NE 982VV Visibility to E 983VV Visibility to SE 984VV Visibility to S 985VV Visibility to SW 986VV Visibility to W 987VV Visibility to NW 988VV Visibility to N 989VbDa Variation of visibility during the hour preceding the time of observation and the direction in
which this variation has been observed
Decile 90–99: Optical phenomena and miscellaneous 990Z0i0 Optical phenomena 991ADa Mirage 99190 St Elmo’s fire 992Nttw Condensation trails 993CSDa Special clouds 994A3Da Day darkness 995nn Lowest atmospheric pressure reduced to mean sea level during the period covered by W1W2
unless otherwise indicated by associated 9SPSPspsp time group(s), in tens and units of hectopascals
996TvTv Sudden rise in air temperature, in whole degrees Celsius 997TvTv Sudden fall in air temperature, in whole degrees Celsius 998UvUv Sudden rise in relative humidity, in per cent 999UvUv Sudden fall in relative humidity, in per cent
Note: Groups 996TvTv, 997TvTv, 998UvUv and 999UvUv should not be used to report normal diurnal changes in temperature or humidity.
3780
SfSf Synoptic interpretation of significant features Code figure
00 Low-level ridge 01 Upper-level ridge, sharp 02 Upper-level ridge, medium 03 Upper-level ridge, broad 10 Quasi-stationary front, broken cloud pattern 11 Quasi-stationary front, continuous cloud mass 12 Cold front, broken cloud pattern 13 Cold front, continuous cloud mass 14 Warm front, broken cloud pattern 15 Warm front, continuous cloud mass 16 Occluded front 17 Squall-line 18 Non-frontal extra-tropical cloud band 20 Widening area in frontal cloud band 21 Well-developed frontal wave 22 Initial vortex associated with a front 23 Vortex occluding, cold air intrusion

CODE TABLES
Volume I.1 A–335
(Code table 3780 – continued)
24 Mature vortex, fully occluded 25 Decaying vortex 26 Clouds forming due to waves forming to the lee of mountain ranges or other obstacles 27 Clouds due to eddies to the lee of islands or isolated obstacles 28 Clear area due to orographic föhn processes 29 Orographic cloud system 30 Positive vorticity advection maximum, enhanced Cu or Cb 31 Positive vorticity advection maximum (solid), cloud mass 32 Vorticity maximum, comma shape, without clear area downstream 33 Vorticity maximum, comma shape, with clear area downstream 34 Cut-off vortex 35 Secondary vorticity centre, spiralling Cu or Cb without cirrus plumes 36 Secondary vorticity centre, spiralling Cu or Cb with cirrus plumes 40 Low-level trough 41 Upper-level trough, determined through cold-frontal cloud mass 42 Upper-level trough, associated with a major cloud mass 43 Upper-level trough, preceded by crescent cloud formation 44 Upper-level trough, determined by cirrus plumes 50 Jet stream, determined by cirrus shadow or edge 51 Same as 50, with transversal streaks 52 Jet stream, determined through cirrus streaks 53 Same as 52, with transversal streaks 54 Jet stream, determined from a change in the cloud texture 55 Jet stream, determined from a change in the cellular cloud pattern 60 Area of isolated Cb, Ci-plumes extend less than 1° latitude from the source 61 Same as 60, Ci-plumes extend more than 1° latitude from the source 62 Area of Cb clusters, Ci-plumes extend less than 1° latitude from the source 63 Same as 62, Ci-plumes extend more than 1° latitude from the source 70 Intertropical convergence zone (ITCZ) without specification of characteristics 71 ITCZ as uniformly bright band of cumulonimbus with cirrus cover 72 ITCZ as an accumulation of cumulonimbus 73 ITCZ as banks of cumuliform clouds gathering along the axis of convergence lying along the
direction of the trade winds 74 Bank of tropical clouds without cumulonimbus (Cb) 75 Bank of tropical clouds with Cb 76 Tropical wave 77 Wind shear line 88 Area of widespread sandstorm or duststorm 89 Area of widespread smoke 90 Ridge 91 Frontal cloud band 92 Frontal wave 93 Vortex 94 Convergence zone (including ITCZ) 95 Jet stream 96 Positive vorticity advection maximum (comma formation, enhanced convection, etc.) 97 Trough 98 Major cloud system 99 Synoptic interpretation of significant features is undetermined
Notes: (1) Code figures 90 to 99 may be used when more detailed synoptic interpretation is not possible. (2) In case of SfSf = 88, 89 or 98, the position groups in Section 2 delineate a major cloud system, an area of
widespread sandstorm or duststorm or an area of smoke.

CODE TABLES
A–336 Volume I.1
3790
StSt Intensity of the tropical cyclone Code Current Intensity Maximum sustained Maximum figure (CI Number) wind speed (knots) sustained wind speed (m s–1) 00 Decaying 15 1.5 25 13 20 2 30 15 25 2.5 35 18 30 3 45 23 35 3.5 55 28 40 4 65 33 45 4.5 77 39 50 5 90 46 55 5.5 102 52 60 6 115 59 65 6.5 127 65 70 7 140 72 75 7.5 155 79 80 8 170 87 99 Becoming extratropical // Undetermined
Note: The procedures for determining the Current Intensity (CI) Number from satellite imagery are explained in the Guide on the Global Data-processing System (WMO–No. 305).
3833
sc Nature of snow or ice interpreted from satellite information
Code figure
0 partial 1
Snow cover continuous
2 Shore ice 3 Snow-covered ice 4 Shelf ice 5 compact 6 broken 7
Sea ice scattered
8 Channel in sea ice 9 Iceberg(s) / Nature of snow or ice undertermined
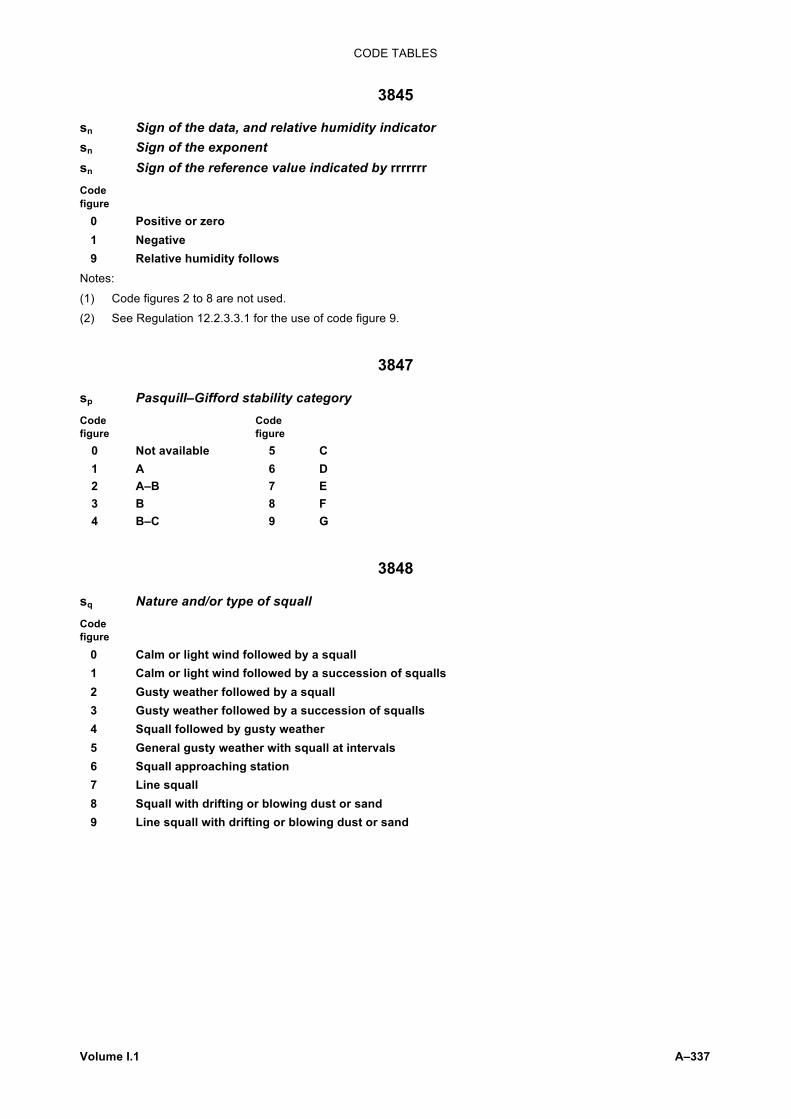
CODE TABLES
Volume I.1 A–337
3845
sn Sign of the data, and relative humidity indicator sn Sign of the exponent sn Sign of the reference value indicated by rrrrrrr Code figure
0 Positive or zero 1 Negative 9 Relative humidity follows
Notes:
(1) Code figures 2 to 8 are not used.
(2) See Regulation 12.2.3.3.1 for the use of code figure 9.
3847
sp Pasquill–Gifford stability category Code Code figure figure
0 Not available 5 C 1 A 6 D 2 A–B 7 E 3 B 8 F 4 B–C 9 G
3848
sq Nature and/or type of squall Code figure
0 Calm or light wind followed by a squall 1 Calm or light wind followed by a succession of squalls 2 Gusty weather followed by a squall 3 Gusty weather followed by a succession of squalls 4 Squall followed by gusty weather 5 General gusty weather with squall at intervals 6 Squall approaching station 7 Line squall 8 Squall with drifting or blowing dust or sand 9 Line squall with drifting or blowing dust or sand

CODE TABLES
A–338 Volume I.1
3849
sr Solar and infrared radiation correction Code figure
0 No correction 1 CIMO solar corrected and CIMO infrared corrected 2 CIMO solar corrected and infrared corrected 3 CIMO solar corrected only 4 Solar and infrared corrected automatically by radiosonde system 5 Solar corrected automatically by radiosonde system 6 Solar and infrared corrected as specified by country 7 Solar corrected as specified by country
3850
ss Indicator for sign and type of measurement of sea-surface temperature Code figure Sign Type of measurement
0 Positive or 0 Intake 1 Negative Intake 2 Positive or 0 Bucket 3 Negative Bucket 4 Positive or 0 Hull contact sensor 5 Negative Hull contact sensor 6 Positive or 0 Other 7 Negative Other
3855
sw Indicator for the sign and type of wet-bulb temperature reported Code figure
0 Positive or zero measured wet-bulb temperature 1 Negative measured wet-bulb temperature 2 Iced bulb measured wet-bulb temperature 5 Positive or zero computed wet-bulb temperature 6 Negative computed wet-bulb temperature 7 Iced bulb computed wet-bulb temperature

CODE TABLES
Volume I.1 A–339
3856
sx Sign indicator for the data group which follows (Section 3) and for the Cartesian coordinates of the Pole (Section 2)
Code figure First element (if any) Second element (if any)
0 Positive or zero Positive or zero 1 Negative Positive or zero 2 Positive or zero Negative 3 Negative Negative
3866
s1 Type of navigation system Code figure
0 Inertial navigation system 1 OMEGA
3867
s2 Type of system used Code figure
0 ASDAR 1 ASDAR (ACARS also available but not operative) 2 ASDAR (ACARS also available and operative) 3 ACARS 4 ACARS (ASDAR also available but not operative) 5 ACARS (ASDAR also available and operative)
3868
s3 Temperature precision Code figure
1 Low (precision near 2.0°C) 0 High (precision near 1.0°C)

CODE TABLES
A–340 Volume I.1
3870
ss Depth of newly fallen snow
Code figure mm
Code figure mm
Code figure mm
00 0 34 340 68 1 800 01 10 35 350 69 1 900 02 20 36 360 70 2 000 03 30 37 370 71 2 100 04 40 38 380 72 2 200 05 50 39 390 73 2 300 06 60 40 400 74 2 400 07 70 41 410 75 2 500 08 80 42 420 76 2 600 09 90 43 430 77 2 700 10 100 44 440 78 2 800 11 110 45 450 79 2 900 12 120 46 460 80 3 000 13 130 47 470 81 3 100 14 140 48 480 82 3 200 15 150 49 490 83 3 300 16 160 50 500 84 3 400 17 170 51 510 85 3 500 18 180 52 520 86 3 600 19 190 53 530 87 3 700 20 200 54 540 88 3 800 21 210 55 550 89 3 900 22 220 56 600 90 4 000 23 230 57 700 91 1 24 240 58 800 92 2 25 250 59 900 93 3 26 260 60 1 000 94 4 27 270 61 1 100 95 5 28 280 62 1 200 96 6 29 290 63 1 300 97 Less than 1 mm 30 300 64 1 400 98 More than 4 000 mm 31 310 65 1 500 99 32 320 66 1 600 33 330 67 1 700
Measurement impossible or inaccurate
3872
sasa Tracking technique/status of system used
(See Common table C-7 in Attachment I.)

CODE TABLES
Volume I.1 A–341
3889 sss Total depth of snow Code figure 000 Not used 001 1 cm etc. etc. 996 996 cm 997 Less than 0.5 cm 998 Snow cover, not continuous 999 Measurement impossible or inaccurate
Note: See Regulations 12.4.6.1 and 12.4.6.2.
3931 Ta Approximate tenths value and sign (plus or minus) of the air temperature at the level given
by PaPaPa Ta Approximate tenths value and sign of temperature Tat Approximate tenths value and sign (plus or minus) of the air temperature at the
tropopause level Ta0 Ta1 . . . Tan
Approximate tenths value and sign (plus or minus) of: (a) The air temperature at specified levels starting with station level (b) Equivalent blackbody temperature
Code figure Tenths figure of observed
air temperature Positive temperature Negative temperature
0 1 0 1
2 3 2 3
4 5
4 5
6 7 6 7
8 9 8 9
3933 Tc Tropical system characteristics Code figure
0 No specification 1 Diffuse 2 Sharply defined 3 Quasi-stationary 4 Existence certain 5 Existence uncertain 6 Formation suspected 7 Position certain 8 Position uncertain 9 Movement doubtful
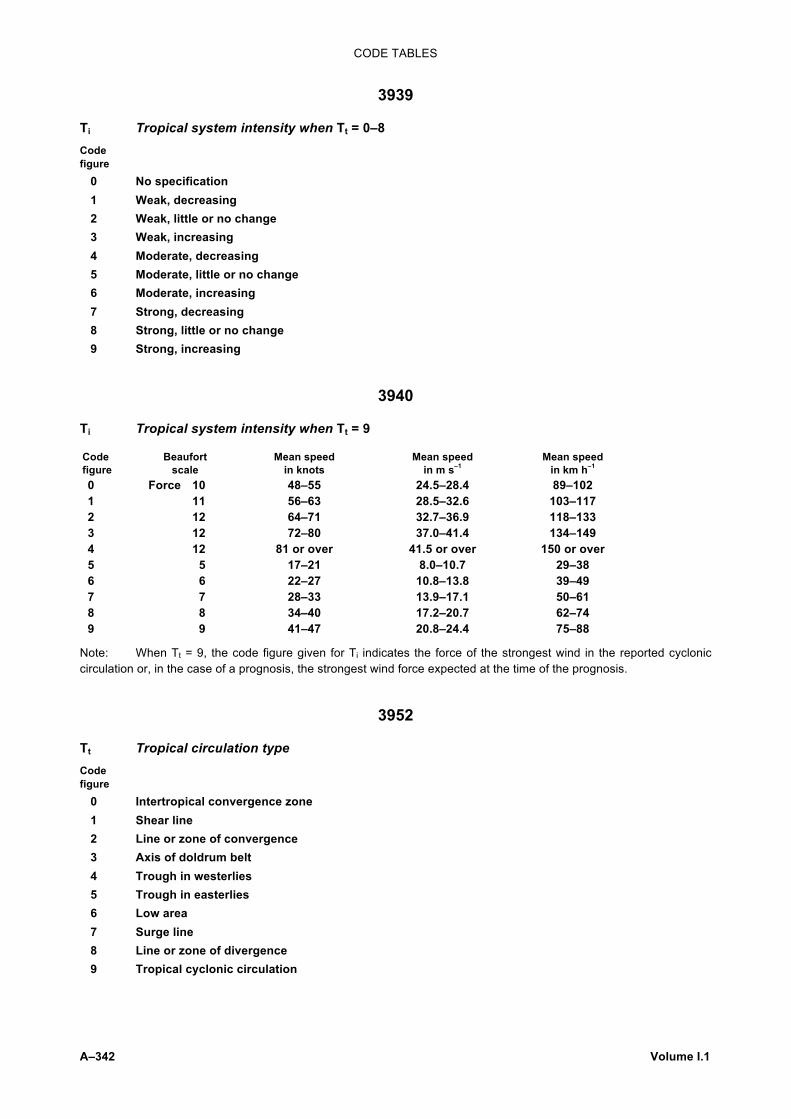
CODE TABLES
A–342 Volume I.1
3939
Ti Tropical system intensity when Tt = 0–8 Code figure
0 No specification 1 Weak, decreasing 2 Weak, little or no change 3 Weak, increasing 4 Moderate, decreasing 5 Moderate, little or no change 6 Moderate, increasing 7 Strong, decreasing 8 Strong, little or no change 9 Strong, increasing
3940
Ti Tropical system intensity when Tt = 9
Code figure
Beaufort scale
Mean speed in knots
Mean speed in m s–1
Mean speed in km h–1
0 Force 10 48–55 24.5–28.4 89–102 1 11 56–63 28.5–32.6 103–117 2 12 64–71 32.7–36.9 118–133 3 12 72–80 37.0–41.4 134–149 4 12 81 or over 41.5 or over 150 or over 5 5 17–21 8.0–10.7 29–38 6 6 22–27 10.8–13.8 39–49 7 7 28–33 13.9–17.1 50–61 8 8 34–40 17.2–20.7 62–74 9 9 41–47 20.8–24.4 75–88
Note: When Tt = 9, the code figure given for Ti indicates the force of the strongest wind in the reported cyclonic circulation or, in the case of a prognosis, the strongest wind force expected at the time of the prognosis.
3952
Tt Tropical circulation type Code figure
0 Intertropical convergence zone 1 Shear line 2 Line or zone of convergence 3 Axis of doldrum belt 4 Trough in westerlies 5 Trough in easterlies 6 Low area 7 Surge line 8 Line or zone of divergence 9 Tropical cyclonic circulation

CODE TABLES
Volume I.1 A–343
3955
Tw Variation of temperature during the period covered by W1W2, associated with glaze or rime Code figure
0 Temperature steady 1 Temperature falling, without going below 0°C 2 Temperature rising, without going above 0°C 3 Temperature falling to a value below 0°C 4 Temperature rising to a value above 0°C 5 Irregular variation, oscillations of temperature passing through 0°C 6 Irregular variation, oscillations of temperature not passing through 0°C 7 Variation of temperature not observed 8 Not allocated 9 Variation of temperature unknown owing to lack of thermograph
3956
Tn Minimum air temperature Tx Maximum air temperature Code Temperature figure in degrees Celsius
0 Less than –10 1 –10 to –5 2 –5 to –1 3 About 0 (to nearly ± 1) 4 1 to 5 5 5 to 10 6 10 to 20 7 20 to 30 8 Greater than 30 9 Temperature not forecast
3962
T1 Topography of greatest extent T2 Topography of second greatest extent Code figure
0 Level ice 1 Rafted ice 2 Finger-rafted ice 3 Hummocks 4 New ridges 5 Weathered ridges 6 Very weathered ridges 7 Aged ridges 8 Consolidated ridges 9 Standing floe / Undetermined or unknown

CODE TABLES
A–344 Volume I.1
4001
t Nature of the temperature reading, the value of which is indicated by snTtTtTt Code figure
1 Air temperature at the time of measurement 2 Dew-point temperature at the time of measurement 3 Maximum temperature of air during the preceding 24 hours 4 Minimum temperature of air during the preceding 24 hours 5 Water temperature at the time of measurement
Note: Regional Associations may use the figures 6 to 9 for other specifications.
4006
tE Thickness of the predominant form of ice, snow depth not included Code figure
0 Less than 5 cm 1 5 – 9 cm 2 10 – 19 cm 3 20 – 29 cm 4 30 – 39 cm 5 40 – 59 cm 6 60 – 89 cm 7 90 – 149 cm 8 150 – 249 cm 9 250 cm or more / Undetermined or unknown
4013
tL Thickness of layer Code figure
0 Up to top of cloud 1 300 m 2 600 m 3 900 m 4 1 200 m 5 1 500 m 6 1 800 m 7 2 100 m 8 2 400 m 9 2 700 m

CODE TABLES
Volume I.1 A–345
4019
tR Duration of period of reference for amount of precipitation, ending at the time of the report Code figure
1 Total precipitation during the 6 hours preceding the observation 2 Total precipitation during the 12 hours preceding the observation 3 Total precipitation during the 18 hours preceding the observation 4 Total precipitation during the 24 hours preceding the observation 5 Total precipitation during the 1 hour preceding the observation 6 Total precipitation during the 2 hours preceding the observation 7 Total precipitation during the 3 hours preceding the observation 8 Total precipitation during the 9 hours preceding the observation 9 Total precipitation during the 15 hours preceding the observation
Notes:
(1) If the duration of the period of reference is not covered by Code table 4019 or the period does not end at the time of the report, tR shall be coded 0.
(2) Members are recommended to avoid any deviations from international practices which require the use of code figure 0. The specification of code figure 0 should be indicated in Volume II of the Manual on Codes under national coding procedures.
4035
te Time interval over which the movement of the centre or the eye of the tropical cyclone has been calculated
Code figure 0–2 Not used
3 During the preceding 15 minutes 4 During the preceding 30 minutes 5 During the preceding 1 hour 6 During the preceding 2 hours 7 During the preceding 3 hours 8 During the preceding 6 hours 9 During a period of more than 6 hours / Undetermined

CODE TABLES
A–346 Volume I.1
4044
tm Time interval over which the movement of the tropical cyclone has been calculated Code figure
0 Less than 1 hour 1 1 to less than 2 hours 2 2 to less than 3 hours 3 3 to less than 6 hours 4 6 to less than 9 hours 5 9 to less than 12 hours 6 12 to less than 15 hours 7 15 to less than 18 hours 8 18 to less than 21 hours 9 21 to less than 30 hours / Movement group is not included
4047
tp Period to which measurement of precipitation refers, and/or time at which water equivalent of snow is measured, both coded by RRRR
Code figure
0 Total precipitation during the 1 hour preceding the observation 1 Total precipitation during the 2 hours preceding the observation 2 Total precipitation during the 3 hours preceding the observation 3 Total precipitation during the 6 hours preceding the observation 4 Total precipitation during the 12 hours preceding the observation 5 Total precipitation during the 24 hours preceding the observation 6 Total precipitation during the 48 hours preceding the observation 7 Total precipitation during the last 10 days 8 Total precipitation during the calendar month preceding the observation 9 Water equivalent of the snow pack at the time of measurement / Water equivalent of the snow which has fallen during the 24 hours preceding the time of observation
4055
tw Time of commencement of a phenomenon before the hour of observation
Code figure
0 0 to 1/2 hour 1 1/2 to 1 hour 2 1 to 11/2 hours 3 11/2 to 2 hours 4 2 to 21/2 hours 5 21/2 to 3 hours 6 3 to 31/2 hours 7 31/2 to 4 hours 8 4 to 5 hours 9 5 to 6 hours

CODE TABLES
Volume I.1 A–347
4077
tt Time before observation or duration of phenomena zz Variation, location or intensity of phenomena Code figure
Code figure
00 At observation 36 3 hours 36 minutes 01 0 hour 6 minutes 37 3 hours 42 minutes 02 0 hour 12 minutes 38 3 hours 48 minutes 03 0 hour 18 minutes 39 3 hours 54 minutes 04 0 hour 24 minutes 40 4 hours 0 minute 05 0 hour 30 minutes 41 4 hours 6 minutes 06 0 hour 36 minutes 42 4 hours 12 minutes 07 0 hour 42 minutes 43 4 hours 18 minutes 08 0 hour 48 minutes 44 4 hours 24 minutes 09 0 hour 54 minutes 45 4 hours 30 minutes 10 1 hour 0 minute 46 4 hours 36 minutes 11 1 hour 6 minutes 47 4 hours 42 minutes 12 1 hour 12 minutes 48 4 hours 48 minutes 13 1 hour 18 minutes 49 4 hours 54 minutes 14 1 hour 24 minutes 50 5 hours 0 minute 15 1 hour 30 minutes 51 5 hours 6 minutes 16 1 hour 36 minutes 52 5 hours 12 minutes 17 1 hour 42 minutes 53 5 hours 18 minutes 18 1 hour 48 minutes 54 5 hours 24 minutes 19 1 hour 54 minutes 55 5 hours 30 minutes 20 2 hours 0 minute 56 5 hours 36 minutes 21 2 hours 6 minutes 57 5 hours 42 minutes 22 2 hours 12 minutes 58 5 hours 48 minutes 23 2 hours 18 minutes 59 5 hours 54 minutes 24 2 hours 24 minutes 60 6 hours 0 minute 25 2 hours 30 minutes 61 6 to 7 hours 26 2 hours 36 minutes 62 7 to 8 hours 27 2 hours 42 minutes 63 8 to 9 hours 28 2 hours 48 minutes 64 9 to 10 hours 29 2 hours 54 minutes 65 10 to 11 hours 30 3 hours 0 minute 66 11 to 12 hours 31 3 hours 6 minutes 67 12 to 18 hours 32 3 hours 12 minutes 68 More than 18 hours 33 3 hours 18 minutes 69 Time unknown 34 3 hours 24 minutes 70 Began during observation 35 3 hours 30 minutes 71 Ended during observation

CODE TABLES
A–348 Volume I.1
(Code table 4077 – continued)
Code figure
72 Began and ended during observation 73 Changed considerably during observation 74 Began after observation 75 Ended after observation 76 At station 77 At station, but not in distance 78 In all directions 79 In all directions, but not at station 80 Approaching station 81 Receding from station 82 Passing station in distance 83 Seen in distance 84 Reported in vicinity, but not at station 85 Aloft, but not near ground 86 Near ground, but not aloft 87 Occasional; occasionally 88 Intermittent; intermittently 89 Frequent; frequently; at frequent intervals 90 Steady; steady in intensity; steadily; no appreciable change 91 Increasing; increasing in intensity; has increased 92 Decreasing; decreasing in intensity; has decreased 93 Fluctuating; variable 94 Continuous; continuously 95 Very light; very weak; greatly below normal; very thin; very poor 96 Light; weak; below normal; thin; poor 97 Moderate; normal; average thickness; fair; gradually 98 Heavy; severe; thick; above normal; good; suddenly 99 Very heavy; killing; very severe; dense; greatly above normal; very thick; very good
Notes:
(1) Code figures 00 to 69, which are used exclusively for tt, refer to the standard time of observation or, when duration of a phenomenon is reported, to the time period between its commencement and cessation.
(2) Code figures 70 to 75, which combine time and variation, refer to the actual time the elements were observed.
(3) Code figures 76 to 99, which are used exclusively for zz, refer to:
(a) The location of the phenomenon in relation to the station (76 to 86);
(b) Variation (87 to 94);
(c) Intensity (95 to 99).

CODE TABLES
Volume I.1 A–349
4200
u Scale factor Code figure
0 1 1 10 2 100 3 1 000 4 10 000 5 0.1 6 0.01 7 0.001 8 0.000 1 9 0.000 01
4232
ub Unit of time for averaging period or data change period, expressed by tbtbtb Code figure
0–3 Not used 4 Hour 5 Day Averaging period 6 Month 7 Hour 8 Day Data change period 9 Month
4242
up Unit of thickness of sublayers Code figure
1 0.1 hPa 2 1 hPa 3 2 hPa 4 5 hPa 5 10 hPa 6 20 hPa 7 30 hPa 8 50 hPa 9 100 hPa
4252
ut Unit of time for ttt Code figure
1 Hour 2 Day 3 Month

CODE TABLES
A–350 Volume I.1
4300
V Forecast surface visibility Vs Visibility seawards (from a coastal station) V′s Visibility over the water surface of an alighting area Code figure
0 Less than 50 m 1 50–200 m 2 200–500 m 3 500–1 000 m 4 1–2 km 5 2–4 km 6 4–10 km 7 10–20 km 8 20–50 km 9 50 km or more
4332
Vb Variation of visibility during the hour preceding the observation Code figure
0 Visibility has not varied (sun* visible) 1 Visibility has not varied (sun* invisible) 2 Visibility has increased (sun* visible) towards direction Da 3 Visibility has increased (sun* invisible) 4 Visibility has decreased (sun* visible) 5 Visibility has decreased (sun* invisible) 6 Fog coming from direction Da 7 Fog has lifted, without dissipating 8 Fog has dispersed without regard to direction 9 Moving patches or banks of fog
* Or sky (if sun is low), or moon or stars at night.

CODE TABLES
Volume I.1 A–351
4377
VV Horizontal visibility at surface VsVs Visibility towards the sea
Code figure km
Code figure km
Code figure km
00 < 0.1 34 3.4 68 18 01 0.1 35 3.5 69 19 02 0.2 36 3.6 70 20 03 0.3 37 3.7 71 21 04 0.4 38 3.8 72 22 05 0.5 39 3.9 73 23 06 0.6 40 4 74 24 07 0.7 41 4.1 75 25 08 0.8 42 4.2 76 26 09 0.9 43 4.3 77 27 10 1 44 4.4 78 28 11 1.1 45 4.5 79 29 12 1.2 46 4.6 80 30 13 1.3 47 4.7 81 35 14 1.4 48 4.8 82 40 15 1.5 49 4.9 83 45 16 1.6 50 5 84 50 17 1.7 51 85 55 18 1.8 52 86 60 19 1.9 53 Not used 87 65 20 2 54 88 70 21 2.1 55 89 > 70 22 2.2 56 6 90 < 0.05 23 2.3 57 7 91 0.05 24 2.4 58 8 92 0.2 25 2.5 59 9 93 0.5 26 2.6 60 10 94 1 27 2.7 61 11 95 2 28 2.8 62 12 96 4 29 2.9 63 13 97 10 30 3 64 14 98 20 31 3.1 65 15 99 ≥ 50 32 3.2 66 16 33 3.3 67 17

CODE TABLES
A–352 Volume I.1
4448
vp Forward speed of phenomenon
Code figure
0 Less than 5 knots Less than 9 km h–1 Less than 2 m s–1 1 5–14 knots 10– 25 km h–1 3– 7 m s–1 2 15–24 knots 26– 44 km h–1 8–12 m s–1 3 25–34 knots 45– 62 km h–1 13–17 m s–1 4 35–44 knots 63– 81 km h–1 18–22 m s–1 5 45–54 knots 82–100 km h–1 23–27 m s–1 6 55–64 knots 101–118 km h–1 28–32 m s–1 7 65–74 knots 119–137 km h–1 33–38 m s–1 8 75–84 knots 138–155 km h–1 39–43 m s–1 9 85 knots or more 156 km h–1 or more 44 m s–1 or more
4451
vs Ship’s average speed made good during the three hours preceding the time of observation Code figure
0 0 knot 0 km h–1 1 1– 5 knots 1–10 km h–1 2 6–10 knots 11–19 km h–1 3 11–15 knots 20–28 km h–1 4 16–20 knots 29–37 km h–1 5 21–25 knots 38–47 km h–1 6 26–30 knots 48–56 km h–1 7 31–35 knots 57–65 km h–1 8 36–40 knots 66–75 km h–1 9 Over 40 knots Over 75 km h–1 / Not applicable (report from a coastal land station) or not reported (see Regulation 12.3.1.2 (b)).
4504
WC Diameter or length of major axis of the eye of the tropical cyclone Code figure
0 Less than 5 km 1 5 to less than 10 km 2 10 to less than 15 km 3 15 to less than 20 km 4 20 to less than 25 km 5 25 to less than 30 km 6 30 to less than 35 km 7 35 to less than 40 km 8 40 to less than 50 km 9 50 km and greater / Undetermined

CODE TABLES
Volume I.1 A–353
4530
WR Type of weather phenomenon or cloud in the 60 × 60 km square detected by radar Code figure
1 Stratiform cloud without precipitation 2 Convective cloud without phenomena 3 Continuous precipitation 4 Showers 5 Showers and continuous precipitation 6 Thunderstorm or thunderstorm and showers 7 Thunderstorm and continuous precipitation 8 Hail 9 Hail and other phenomena / Undetermined
4531
Wa1 Wa2 Past weather reported from an automatic weather station
Code figure
0 No significant weather observed 1 VISIBILITY REDUCED 2 Blowing phenomena, visibility reduced 3 FOG 4 PRECIPITATION 5 Drizzle 6 Rain 7 Snow or ice pellets 8 Showers or intermittent precipitation 9 Thunderstorm
Note: The weather descriptions in this table are progressively complex, to accommodate the different levels of weather discrimination capability of various automatic stations. Stations having only basic sensing capability may use the lower code figures and basic generic descriptions (shown in capital letters). Stations with progressively higher discrimination capability shall use the more detailed descriptions (higher codes).

CODE TABLES
A–354 Volume I.1
4536
Wf Mean width or mean diameter of the feature specified by SfSf, or mean diameter of the overcast cloud of the tropical cyclone
Code figure
0 <1° of latitude 1 1° to less than 2° of latitude 2 2° to less than 3° of latitude 3 3° to less than 4° of latitude 4 4° to less than 5° of latitude 5 5° to less than 6° of latitude 6 6° to less than 7° of latitude 7 7° to less than 8° of latitude 8 8° to less than 9° of latitude 9 9° of latitude or more / Undetermined
4544
Wm Forecast weather Code figure
0 Moderate to good visibility (greater than 5 km) 1 Risk of accumulation of ice on superstructures (air temperature between 0 and –5°C) 2 Strong risk of accumulation of ice on superstructures (air temperature below –5°C) 3 Mist (visibility 1–5 km) 4 Fog (visibility less than 1 km) 5 Drizzle 6 Rain 7 Snow or rain and snow 8 Squally weather with or without showers 9 Thunderstorms
4552
Wt Type of opening in the ice Code figure
0 No openings 1 Crack 2 Very small fracture (0–49 m) 3 Small fracture (50–199 m) 4 Medium fracture (200–499 m) 5 Large fracture (500 m or more) 6 Lead, shore lead, flaw lead 7 Polynya, shore polynya, flaw polynya 8 Recurring polynya 9 Water between floes / Undetermined or unknown

CODE TABLES
Volume I.1 A–355
4561
W Weather during past hour W1 W2 Past weather
Code figure
0 Cloud covering 1/2 or less of the sky throughout the appropriate period 1 Cloud covering more than 1/2 of the sky during part of the appropriate period and covering 1/2 or less
during part of the period 2 Cloud covering more than 1/2 of the sky throughout the appropriate period 3 Sandstorm, duststorm or blowing snow 4 Fog or ice fog or thick haze 5 Drizzle 6 Rain 7 Snow, or rain and snow mixed 8 Shower(s) 9 Thunderstorm(s) with or without precipitation
4635
we Weather Code figure
1 Height of base of significant cloud 2 Visibility 3 Wind force 4 Icing 5 Turbulence 6 Squalls 7 Snow cover 8 Saturation (area of 100% relative humidity; i = 0)
Note: See Code table 1800 for intensity or character of we.
4639
wi Method by which winds were determined Code figure
1 Wind derived from cloud motion observed in the infrared channel 2 Wind derived from cloud motion observed in the visible channel 3 Wind derived from motion observed in the water vapour channel 4 Wind derived from motion observed in a combination of spectral channels

CODE TABLES
A–356 Volume I.1
4677
ww Present weather reported from a manned weather station
ww = 00–49 No precipitation at the station at the time of observation
ww = 00–19 No precipitation, fog, ice fog (except for 11 and 12), duststorm, sandstorm, drifting or blowing snow at the station* at the time of observation or, except for 09 and 17, during the preceding hour
Code figure
00 Cloud development not observed or not observable 01 Clouds generally dissolving or becoming less
developed 02 State of sky on the whole unchanged
No
met
eors
ex
cept
ph
otom
eteo
rs
03 Clouds generally forming or developing
Characteristic change of the state of sky during the past hour
04 Visibility reduced by smoke, e.g. veldt or forest fires, industrial smoke or volcanic ashes 05 Haze 06 Widespread dust in suspension in the air, not raised by wind at or near the station at the
time of observation 07 Dust or sand raised by wind at or near the station at the time of observation, but no well-
developed dust whirl(s) or sand whirl(s), and no duststorm or sandstorm seen; or, in the case of ships, blowing spray at the station
08 Well-developed dust whirl(s) or sand whirl(s) seen at or near the station during the preceding hour or at the time of observation, but no duststorm or sandstorm
Haz
e, d
ust,
sand
or s
mok
e
09 Duststorm or sandstorm within sight at the time of observation, or at the station during the preceding hour
10 Mist 11 Patches 12 More or less continuous
shallow fog or ice fog at the station, whether on land or sea, not deeper than about 2 metres on land or 10 metres at sea
13 Lightning visible, no thunder heard 14 Precipitation within sight, not reaching the ground or the surface of the sea 15 Precipitation within sight, reaching the ground or the surface of the sea, but distant, i.e.
estimated to be more than 5 km from the station 16 Precipitation within sight, reaching the ground or the surface of the sea, near to, but not at
the station 17 Thunderstorm, but no precipitation at the time of observation 18 Squalls 19 Funnel cloud(s)**
at or within sight of the station during the preceding hour or at the time of observation
ww = 20–29 Precipitation, fog, ice fog or thunderstorm at the station during the preceding hour but not at the time of observation
20 Drizzle (not freezing) or snow grains 21 Rain (not freezing) 22 Snow not falling as shower(s)
23 Rain and snow or ice pellets 24 Freezing drizzle or freezing rain 25 Shower(s) of rain 26 Shower(s) of snow, or of rain and snow 27 Shower(s) of hail,*** or of rain and hail*** 28 Fog or ice fog 29 Thunderstorm (with or without precipitation)

CODE TABLES
Volume I.1 A–357
(Code table 4677 – continued)
Code figure ww = 30–39 Duststorm, sandstorm, drifting or blowing snow
30 – has decreased during the preceding hour 31 – no appreciable change during the
preceding hour 32
Slight or moderate duststorm or sandstorm – has begun or has increased during the
preceding hour 33 – has decreased during the preceding hour 34 – no appreciable change during the
preceding hour 35
Severe duststorm or sandstorm – has begun or has increased during the
preceding hour 36 Slight or moderate drifting snow 37 Heavy drifting snow
generally low below eye level)
38 Slight or moderate blowing snow 39 Heavy blowing snow
generally high (above eye level)
ww = 40–49 Fog or ice fog at the time of observation
40 Fog or ice fog at a distance at the time of observation, but not at the station during the preceding hour, the fog or ice fog extending to a level above that of the observer
41 Fog or ice fog in patches 42 Fog or ice fog, sky visible 43 Fog or ice fog, sky invisible
has become thinner during the preceding hour
44 Fog of ice fog, sky visible 45 Fog or ice fog, sky invisible
no appreciable change during the preceding hour
46 Fog or ice fog, sky visible 47 Fog or ice fog, sky invisible
has begun or has become thicker during the preceding hour
48 Fog, depositing rime, sky visible 49 Fog, depositing rime, sky invisible
ww = 50–99 Precipitation at the station at the time of observation
ww = 50–59 Drizzle
50 Drizzle, not freezing, intermittent 51 Drizzle, not freezing, continuous
slight at time of observation
52 Drizzle, not freezing, intermittent 53 Drizzle, not freezing, continuous
moderate at time of observation
54 Drizzle, not freezing, intermittent 55 Drizzle, not freezing, continuous
heavy (dense) at time of observation
56 Drizzle, freezing, slight 57 Drizzle, freezing, moderate or heavy (dense) 58 Drizzle and rain, slight 59 Drizzle and rain, moderate or heavy
ww = 60–69 Rain
60 Rain, not freezing, intermittent 61 Rain, not freezing, continuous
slight at time of observation
62 Rain, not freezing, intermittent 63 Rain, not freezing, continuous
moderate at time of observation
64 Rain, not freezing, intermittent 65 Rain, not freezing, continuous
heavy at time of observation

CODE TABLES
A–358 Volume I.1
(Code table 4677 – continued)
Code figure 66 Rain, freezing, slight 67 Rain, freezing, moderate or heavy 68 Rain or drizzle and snow, slight 69 Rain or drizzle and snow, moderate or heavy
ww = 70–79 Solid precipitation not in showers
70 Intermittent fall of snowflakes 71 Continuous fall of snowflakes
slight at time of observation
72 Intermittent fall of snowflakes 73 Continuous fall of snowflakes
moderate at time of observation
74 Intermittent fall of snowflakes 75 Continuous fall of snowflakes
heavy at time of observation
76 Diamond dust (with or without fog) 77 Snow grains (with or without fog) 78 Isolated star-like snow crystals (with or without fog) 79 Ice pellets
ww = 80–99 Showery precipitation, or precipitation with current or recent thunderstorm
80 Rain shower(s), slight 81 Rain shower(s), moderate or heavy 82 Rain shower(s), violent 83 Shower(s) of rain and snow mixed, slight 84 Shower(s) of rain and snow mixed, moderate or heavy 85 Snow shower(s), slight 86 Snow shower(s), moderate or heavy 87 – slight 88
Shower(s) of snow pellets or small hail, with or without rain or rain and snow mixed – moderate or heavy
89 – slight 90
Shower(s) of hail,**** with or without rain or rain and snow mixed, not associated with thunder – moderate or heavy
91 Slight rain at time of observation 92 Moderate or heavy rain at time of observation 93 Slight snow, or rain and snow mixed or hail*** at time
of observation 94 Moderate or heavy snow, or rain and snow mixed or
hail*** at time of observation
Thunderstorm during the preceding hour but not at time of observation
95 Thunderstorm, slight or moderate, without hail,*** but with rain and/or snow at time of observation
96 Thunderstorm, slight or moderate, with hail*** at time of observation
97 Thunderstorm, heavy, without hail, *** but with rain and/or snow at time of observation
98 Thunderstorm combined with duststorm or sandstorm at time of observation
99 Thunderstorm, heavy, with hail*** at time of observation
Thunderstorm at time of observation
* The expression “at the station” refers to a land station or a ship.
** Tornado cloud or waterspout.
*** Hail, small hail, snow pellets. French: grêle, grésil ou neige roulée.
**** French: grêle.

CODE TABLES
Volume I.1 A–359
4678
w′w′ Significant present and forecast weather
QUALIFIER WEATHER PHENOMENA
INTENSITY OR PROXIMITY DESCRIPTOR PRECIPITATION OBSCURATION OTHER
1 2 3 4 5
– Light
Moderate (no qualifier)
+ Heavy (well developed in the case of dust/sand whirls (dust devils) and funnel clouds)
VC In the vicinity
MI Shallow
BC Patches
PR Partial (covering part of the aerodrome)
DR Low drifting
BL Blowing
SH Shower(s)
TS Thunderstorm
FZ Freezing (supercooled)
DZ Drizzle
RA Rain
SN Snow
SG Snow grains
IC Ice crystals (diamond dust)
PL Ice pellets
GR Hail
GS Small hail and/or snow pellets
UP Unknown precipitation
BR Mist
FG Fog
FU Smoke
VA Volcanic ash
DU Widespread dust
SA Sand
HZ Haze
PO Dust/sand whirls (dust devils)
SQ Squalls
FC Funnel cloud(s) (tornado or waterspout)
SS Sandstorm
DS Duststorm
The w´w´ groups shall be constructed by considering columns 1 to 5 in the table above in sequence, that is, intensity, followed by description, followed by weather phenomena. An example could be: +SHRA (heavy shower(s) of rain). Notes:
(1) Entries in this code table are based on the descriptions of hydrometeors and lithometeors found in the International Cloud Atlas (WMO-No 407), Volume I.
(2) Regulation 15.8 shall apply.
(3) More than one form of precipitation shall be combined, the dominant type of precipitation being reported first, for example +SNRA.
(4) More than one phenomenon other than a precipitation combination noted shall be reported in separate w´w´ groups in the order of the columns, for example –DZ FG.
(5) Intensity shall be indicated only with precipitation, precipitation associated with showers and/or thunderstorms, duststorm or sandstorm, and funnel clouds.
(6) Not more than one descriptor shall be included in a w´w´ group, for example –FZDZ.
(7) The descriptors MI, BC and PR shall be used only in combination with the letter abbreviation FG, for example MIFG.
(8) The descriptor DR (low drifting) shall be used for dust, sand or snow raised by the wind to less than two metres above the ground. BL (blowing) shall be used to indicate dust, sand or snow raised by the wind to a height of two metres or more above the ground. The descriptors DR and BL shall be used only in combination with the letter abbreviations DU, SA and SN, for example BLSN.
(9) When blowing snow is observed with snow falling from cloud, both phenomena are reported, e.g. SN BLSN. When due to blowing snow the observer cannot determine whether or not snow is also falling from cloud, then only BLSN shall be reported.

CODE TABLES
A–360 Volume I.1
(Code table 4678 – continued)
(10) The descriptor SH shall be used only in combination with one or more of the letter abbreviations RA, SN, GS, GR and UP to indicate precipitation of the shower type at the time of observation, for example SHSN.
(11) The descriptor TS, if not used on its own, shall be used only in combination with one or more of the letter abbreviations RA, SN, GS, GR and UP to indicate thunderstorm with precipitation at the aerodrome, for example TSSNGS.
(12) The descriptor FZ shall be used only in combination with the letter abbreviations FG, DZ, RA and UP for example FZRA.
(13) The proximity qualifier VC shall be used only in combination with the letter abbreviations TS, DS, SS, FG, FC, SH, PO, BLDU, BLSA, BLSN and VA.
(14) UP is to be used only in reports from fully automated stations unable to distinguish precipitation type.
4680
wawa Present weather reported from an automatic weather station Code figure
00 No significant weather observed 01 Clouds generally dissolving or becoming less developed during the past hour 02 State of sky on the whole unchanged during the past hour 03 Clouds generally forming or developing during the past hour 04 Haze or smoke, or dust in suspension in the air, visibility equal to, or greater than, 1 km 05 Haze or smoke, or dust in suspension in the air, visibility less than 1 km
06–09 Reserved 10 Mist 11 Diamond dust 12 Distant lightning
13–17 Reserved 18 Squalls 19 Reserved
Code figures 20–26 are used to report precipitation, fog (or ice fog) or thunderstorm at the station during the preceding hour but not at the time of observation. 20 Fog 21 PRECIPITATION 22 Drizzle (not freezing) or snow grains 23 Rain (not freezing) 24 Snow 25 Freezing drizzle or freezing rain 26 Thunderstorm (with or without precipitation) 27 BLOWING OR DRIFTING SNOW OR SAND 28 Blowing or drifting snow or sand, visibility equal to, or greater than, 1 km 29 Blowing or drifting snow or sand, visibility less than 1 km
30 FOG 31 Fog or ice fog in patches 32 Fog or ice fog, has become thinner during the past hour 33 Fog or ice fog, no appreciable change during the past hour 34 Fog or ice fog, has begun or become thicker during the past hour 35 Fog, depositing rime
36–39 Reserved

CODE TABLES
Volume I.1 A–361
(Code table 4680 – continued)
40 PRECIPITATION 41 Precipitation, slight or moderate 42 Precipitation, heavy 43 Liquid precipitation, slight or moderate 44 Liquid precipitation, heavy 45 Solid precipitation, slight or moderate 46 Solid precipitation, heavy 47 Freezing precipitation, slight or moderate 48 Freezing precipitation, heavy 49 Reserved
50 DRIZZLE 51 Drizzle, not freezing, slight 52 Drizzle, not freezing, moderate 53 Drizzle, not freezing, heavy 54 Drizzle, freezing, slight 55 Drizzle, freezing, moderate 56 Drizzle, freezing, heavy 57 Drizzle and rain, slight 58 Drizzle and rain, moderate or heavy 59 Reserved
60 RAIN 61 Rain, not freezing, slight 62 Rain, not freezing, moderate 63 Rain, not freezing, heavy 64 Rain, freezing, slight 65 Rain, freezing, moderate 66 Rain, freezing, heavy 67 Rain (or drizzle) and snow, slight 68 Rain (or drizzle) and snow, moderate or heavy 69 Reserved
70 SNOW 71 Snow, slight 72 Snow, moderate 73 Snow, heavy 74 Ice pellets, slight 75 Ice pellets, moderate 76 Ice pellets, heavy 77 Snow grains 78 Ice crystals 79 Reserved
80 SHOWER(S) or INTERMITTENT PRECIPITATION 81 Rain shower(s) or intermittent rain, slight 82 Rain shower(s) or intermittent rain, moderate 83 Rain shower(s) or intermittent rain, heavy 84 Rain shower(s) or intermittent rain, violent

CODE TABLES
A–362 Volume I.1
(Code table 4680 – continued)
85 Snow shower(s) or intermittent snow, slight 86 Snow shower(s) or intermittent snow, moderate 87 Snow shower(s) or intermittent snow, heavy 88 Reserved 89 Hail
90 THUNDERSTORM 91 Thunderstorm, slight or moderate, with no precipitation 92 Thunderstorm, slight or moderate, with rain showers and/or snow showers 93 Thunderstorm, slight or moderate, with hail 94 Thunderstorm, heavy, with no precipitation 95 Thunderstorm, heavy, with rain showers and/or snow showers 96 Thunderstorm, heavy, with hail
97–98 Reserved 99 Tornado
Notes:
(1) This code table includes terms on several levels to cover simple and increasingly complex stations.
(2) Generic terms for weather (e.g. fog, drizzle) are intended for use at stations capable of determining types of weather but no other information. Generic terms are included in the code table using all capital letters.
(3) Code figures for generic precipitation (code figures 40–48) are arranged in order of increasing complexity. For example, a very simple station that can sense only the presence or absence of precipitation would use code figure 40 (precipitation). At the next level, a station capable of sensing amount but not type would use code figure 41 or 42. A station capable of sensing gross type (liquid, solid, freezing) and amount would use code figures 43–48. A station capable of reporting actual types of precipitation (e.g. drizzle or rain), but not the amount, would use the appropriate whole decile number (e.g. 50 for generic drizzle, 60 for generic rain).
4683
wsws Significant weather
Code figure
00 Area of heavy swell 11 Area of strong winds (6 and 7 Beaufort) 22 Area of medium cloud 33 Area of low cloud 44 Area of poor visibility 55 Area of gales (8 Beaufort or more) 66 Area of continuous precipitation 77 Area of squally weather 88 Area of heavy showers 99 Area of thunderstorms
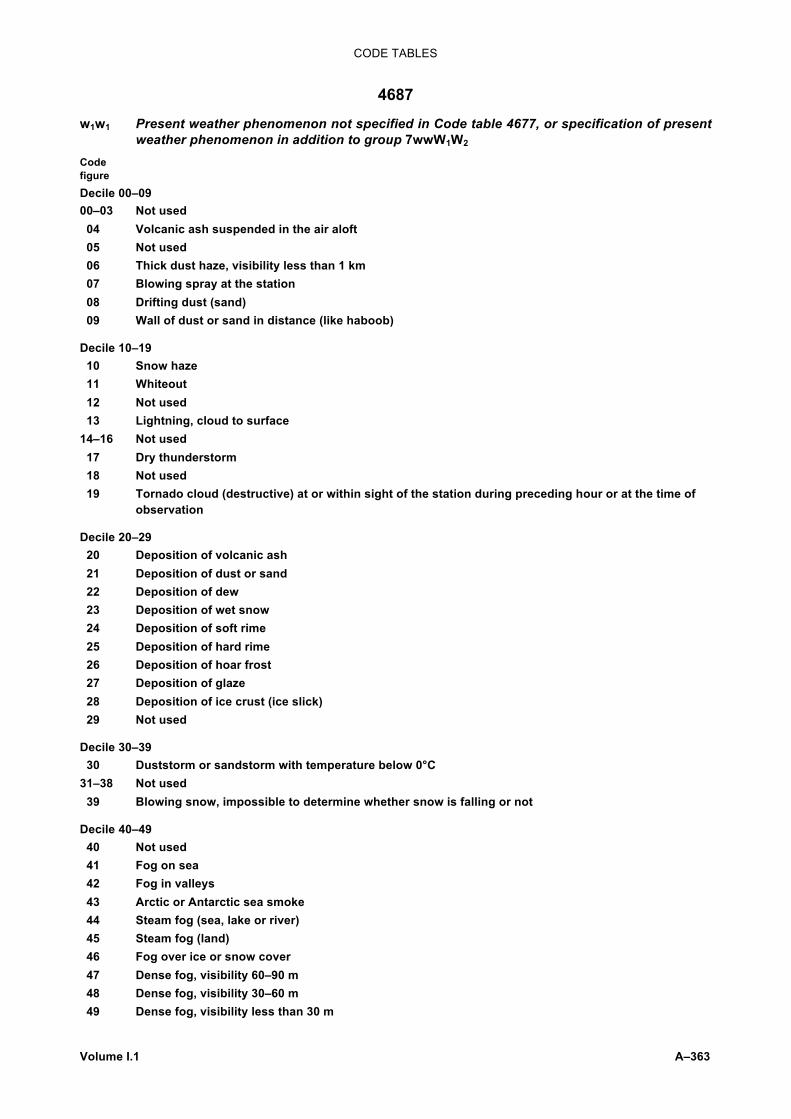
CODE TABLES
Volume I.1 A–363
4687
w1w1 Present weather phenomenon not specified in Code table 4677, or specification of present weather phenomenon in addition to group 7wwW1W2
Code figure Decile 00–09 00–03 Not used
04 Volcanic ash suspended in the air aloft 05 Not used 06 Thick dust haze, visibility less than 1 km 07 Blowing spray at the station 08 Drifting dust (sand) 09 Wall of dust or sand in distance (like haboob)
Decile 10–19 10 Snow haze 11 Whiteout 12 Not used 13 Lightning, cloud to surface
14–16 Not used 17 Dry thunderstorm 18 Not used 19 Tornado cloud (destructive) at or within sight of the station during preceding hour or at the time of
observation
Decile 20–29 20 Deposition of volcanic ash 21 Deposition of dust or sand 22 Deposition of dew 23 Deposition of wet snow 24 Deposition of soft rime 25 Deposition of hard rime 26 Deposition of hoar frost 27 Deposition of glaze 28 Deposition of ice crust (ice slick) 29 Not used
Decile 30–39 30 Duststorm or sandstorm with temperature below 0°C
31–38 Not used 39 Blowing snow, impossible to determine whether snow is falling or not
Decile 40–49 40 Not used 41 Fog on sea 42 Fog in valleys 43 Arctic or Antarctic sea smoke 44 Steam fog (sea, lake or river) 45 Steam fog (land) 46 Fog over ice or snow cover 47 Dense fog, visibility 60–90 m 48 Dense fog, visibility 30–60 m 49 Dense fog, visibility less than 30 m

CODE TABLES
A–364 Volume I.1
(Code table 4680 – continued
Decile 50–59 50 less than 0.10 mm h–1 51 0.10–0.19 mm h–1 52 0.20–0.39 mm h–1 53 0.40-0.79 mm h–1 54 0.80-1.59 mm h–1 55 1.60–3.19 mm h–1 56 3.20–6.39 mm h–1 57
Drizzle, rate of fall
6.4 mm h–1 or more 58 Not used 59 Drizzle and snow (ww = 68 or 69)
Decile 60–69
60 less than 1.0 mm h–1 61 1.0–1.9 mm h–1 62 2.0–3.9 mm h–1 63 4.0–7.9 mm h–1 64 8.0–15.9 mm h–1 65 16.0–31.9 mm h–1 66 32.0–63.9 mm h–1 67
Rain, rate of fall
64.0 mm h–1 or more 68–69 Not used
Decile 70–79 70 less than 1.0 cm h–1 71 1.0–1.9 cm h–1 72 2.0–3.9 cm h–1 73 4.0–7.9 cm h–1 74 8.0–15.9 cm h–1 75 16.0–31.9 cm h–1 76 32.0–63.9 cm h–1 77
Snow, rate of fall
64.0 cm h–1 or more 78 Snow or ice crystal precipitation from a clear sky 79 Wet snow, freezing on contact
Decile 80–99 80 Precipitation of rain (ww = 87–99) 81 Precipitation of rain, freezing (ww = 80–82) 82 Precipitation of rain and snow mixed 83 Precipitation of snow 84 Precipitation of snow pellets or small hail 85 Precipitation of snow pellets or small hail, with rain 86 Precipitation of snow and snow mixed pellets or
small hail, with rain 87 Precipitation of snow pellets or small hail, with snow 88 Precipitation of hail 89 Precipitation of hail, with rain 90 Precipitation of hail, with rain and snow mixed 91 Precipitation of hail, with snow
(ww = 26–27) (ww = 68 or 69) (ww = 87–99)
92 Shower(s) or thunderstorm over sea 93 Shower(s) or thunderstorm over mountains 94–99 Not used

CODE TABLES
Volume I.1 A–365
4691
w1w1w1 Forecast weather Code figure Abbreviation 111 TS Thunderstorm 222 TRS Tropical cyclone 333 LSQ Severe line squall 444 HAIL Hail 555 MTW Marked mountain waves 666 SAND Widespread sandstorm 777 DUST Widespread duststorm 888 FZR Freezing rain
4700
X Time of measurement or period of reference and tendency of the element measured, the value of which is indicated by HsHsHsHs or QQQeQ
Code Tendency during the three hours figure Nature and time or period of measurement preceding the observation
0 Value at time of observation Stationary 1 Value at time of observation Falling 2 Value at time of observation Rising 3 Value at 3 hours before the observation 4 Value at 6 hours before the observation 5 Value at 12 hours before the observation 6 Value at 24 hours before the observation 7 Mean value on the preceding day 8 Maximum value during preceding 24 hours 9 Minimum value during preceding 24 hours / Value at time of observation Unknown
4770
XRXR Recorder type
(See Common Code table C–4 in Attachment I.)

CODE TABLES
A–366 Volume I.1
4780
XtXt Type of drogue Code figure
0 Unspecified drogue 1 Holey sock 2 TRISTAR 3 Window shade 4 Parachute 5 Non-Lagrangian sea anchor
6–30 Reserved (to be developed) // Missing value (coded 31 in BUFR)
4800
x Exponent for spectral wave data Code figure
0 10–5 1 10–4 2 10–3 3 10–2 4 10–1 5 100 6 101 7 102 8 103 9 104
4865
x4 Hemisphere indicator Code figure
0 Northern hemisphere 1 Southern hemisphere
4887
x1x1 Form in which point position groups are given Code figure
00 Positions in form LaLaLoLok (northern hemisphere) 11 Positions in form LaLaLoLok (southern hemisphere) 22 Positions in form LaLaLoLok (equatorial) 66 Positions in form iiiD1s1 88 Positions in form QLaLaLoLo

CODE TABLES
Volume I.1 A–367
4892
x2x2x2 Type of analysis
x3x3x3 Value designator of a given chart or analysis Code figure x2x2x2 x3x3x3
000 Jet-stream analysis — 111 Constant level chart In tens of standard geopotential metres 222 Isobaric (constant pressure) surface In whole hectopascals (except that for the 1 000-hPa
chart, x3x3x3 = 000) 333 Isentropic chart In whole kelvins 444 Cross-section chart — 555 Thickness pattern chart To be followed by two 00x3x3x3 groups giving the
pressure of the upper and lower isobaric surfaces respectively in whole hectopascals (except that for the 1 000-hPa chart, x3x3x3 = 000)
666 Pressure or geopotential change chart
In whole hectopascals, or in tens of standard geopotential metres
777 Isothermal chart In whole degrees Celsius (add 500 for minus values) 888 Flow analysis In whole hectopascals x3x3x3 is indicated by /// 999 Tropopause analysis x3x3x3 is indicated by /// /// Upper-wind analysis —
Note: When x2x2x2 = 666, the 86668 group shall be followed by either 81118 or 82228 to indicate whether the chart is for a constant level or a constant pressure surface.
4900
Y Day of the week (UTC) Code Code figure figure
1 Sunday 5 Thursday 2 Monday 6 Friday 3 Tuesday 7 Saturday 4 Wednesday
5122
ZT Character of the temperature reported by TT Code figure
0 0° or higher 5 –1° to –99° inclusive 6 –100° to –199° inclusive / Missing
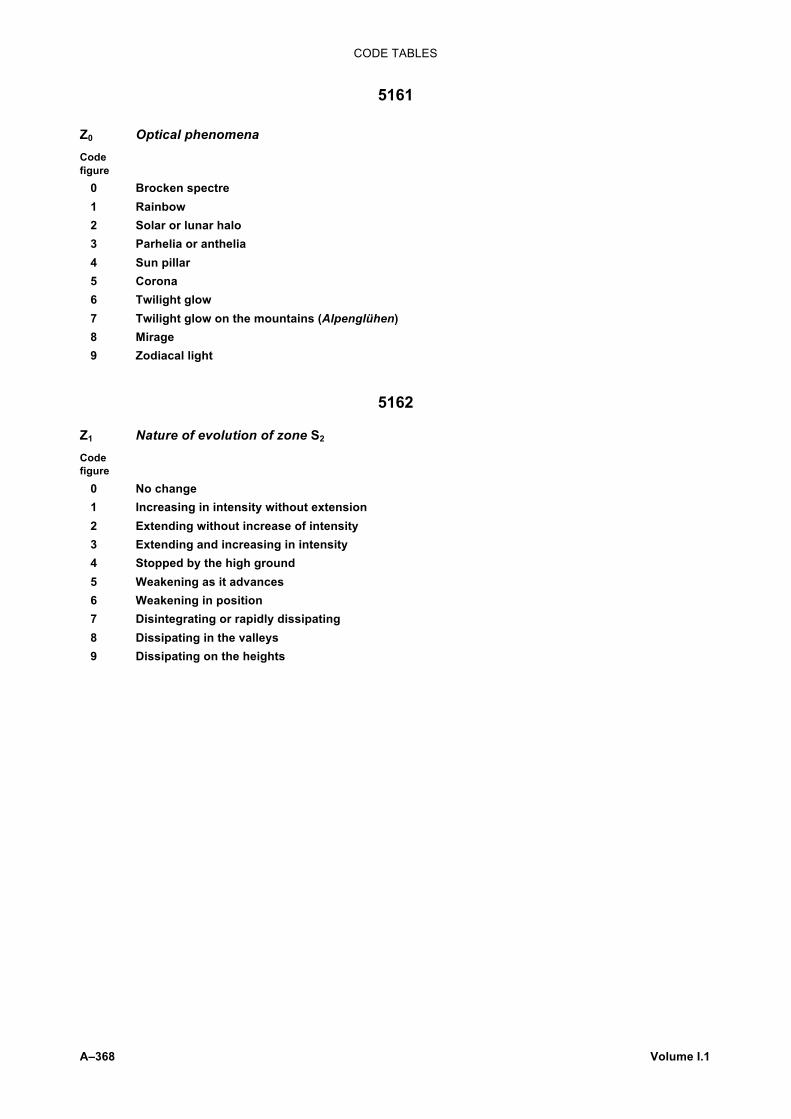
CODE TABLES
A–368 Volume I.1
5161
Z0 Optical phenomena Code figure
0 Brocken spectre 1 Rainbow 2 Solar or lunar halo 3 Parhelia or anthelia 4 Sun pillar 5 Corona 6 Twilight glow 7 Twilight glow on the mountains (Alpenglühen) 8 Mirage 9 Zodiacal light
5162
Z1 Nature of evolution of zone S2 Code figure
0 No change 1 Increasing in intensity without extension 2 Extending without increase of intensity 3 Extending and increasing in intensity 4 Stopped by the high ground 5 Weakening as it advances 6 Weakening in position 7 Disintegrating or rapidly dissipating 8 Dissipating in the valleys 9 Dissipating on the heights

CODE TABLES
Volume I.1 A–369
5177
ZZ Meteorological zone number by 5 degrees of longitude or latitude
EAST-WEST ZONES NORTH-SOUTH ZONES Zone No. Longitude west Longitude east Zone No. Latitude
01 0°– 5° 180° – 175° 51 90°N – 85°N 02 5° – 10° 175° – 170° 52 85°N – 80°N 03 10° – 15° 170° – 165° 53 80°N – 75°N 04 15° – 20° 165° – 160° 54 75°N – 70°N 05 20° – 25° 160° – 155° 55 70°N – 65°N 06 25° – 30° 155° – 150° 56 65°N – 60°N 07 30° – 35° 150° – 145° 57 60°N – 55°N 08 35° – 40° 145° – 140° 58 55°N – 50°N 09 40° – 45° 140° – 135° 59 50°N – 45°N 10 45° – 50° 135° – 130° 60 45°N – 40°N 11 50° – 55° 130° – 125° 61 40°N – 35°N 12 55° – 60° 125° – 120° 62 35°N – 30°N 13 60° – 65° 120° – 115° 63 30°N – 25°N 14 65° – 70° 115° – 110° 64 25°N – 20°N 15 70° – 75° 110° – 105° 65 20°N – 15°N 16 75° – 80° 105° – 100° 66 15°N – 10°N 17 80° – 85° 100° – 95° 67 10°N – 5°N 18 85° – 90° 95° – 90° 68 5°N – 0° 19 90° – 95° 90° – 85° 69 0° – 5°S 20 95° – 100° 85° – 80° 70 5°S – 10°S 21 100° – 105° 80° – 75° 71 10°S – 15°S 22 105° – 110° 75° – 70° 72 15°S – 20°S 23 110° – 115° 70° – 65° 73 20°S – 25°S 24 115° – 120° 65° – 60° 74 25°S – 30°S 25 120° – 125° 60° – 55° 75 30°S – 35°S 26 125° – 130° 55° – 50° 76 35°S – 40°S 27 130° – 135° 50° – 45° 77 40°S – 45°S 28 135° – 140° 45° – 40° 78 45°S – 50°S 29 140° – 145° 40° – 35° 79 50°S – 55°S 30 145° – 150° 35° – 30° 80 55°S – 60°S 31 150° – 155° 30° – 25° 81 60°S – 65°S 32 155° – 160° 25° – 20° 82 65°S – 70°S 33 160° – 165° 20° – 15° 83 70°S – 75°S 34 165° – 170° 15° – 10° 84 75°S – 80°S 35 170° – 175° 10°– 5° 85 80°S – 85°S 36 175° – 180° 5°– 0° 86 85°S – 90°S

CODE TABLES
A–370 Volume I.1
5239
zi Present ice situation and trend of conditions over preceding three hours Code figure
0 Ship in open water with floating ice in sight 1 Ship in easily penetrable ice; conditions improving 2 Ship in easily penetrable ice; conditions not changing 3 Ship in easily penetrable ice; conditions worsening 4 Ship in ice difficult to penetrate; conditions improving 5 Ship in ice difficult to penetrate; conditions not changing Ship in ice 6 Ice forming and floes freezing together 7 Ice under slight pressure 8 Ice under moderate or severe pressure 9 Ship beset
Ship in ice difficult to penetrate and conditions worsening
/ Unable to report, because of darkness or lack of visibility
_____________

Section D
SYSTEM OF STATION INDEX NUMBERS
a. Meteorological observing stations
b. Hydrological observing stations
_____________


Volume I.1 A–373
a. METEOROLOGICAL OBSERVING STATIONS
A station index number in the form IIiii is included in the reports of meteorological observations made at land meteorological stations or aboard lightships using land code forms. This group permits the identification of the meteorological station at which the observation has been made.
The station index number is composed of the block number (II) and the station number (iii).
The block number defines the area in which the reporting station is situated. The station index numbers have been allocated as follows:
Region I: Africa............................................................................................................... 60001 – 69998
20001 – 20099 20200 – 21998 23001 – 25998 28001 – 32998
Region II: Asia................................................................................................................. 35001 – 36998 38001 – 39998 40350 – 48599 48800 – 49998 50001 – 59998
Region III: South America ................................................................................................ 80001 – 88998
Region IV: North America, Central America and the Caribbean ...................................... 70001 – 79998
Region V: South-West Pacific ......................................................................................... 48600 – 48799 90001 – 98998
00001 – 19998 20100 – 20199 22001 – 22998
Region VI: Europe ............................................................................................................ 26001 – 27998 33001 – 34998 37001 – 37998 40001 – 40349
Stations in the Antarctic ..................................................................................................... 80001 – 88998
Block numbers are allotted to the services within each Region by regional agreement.
Station numbers (iii) corresponding to a common block number (II) except 89 are usually distributed so that the zone covered by this block number is divided into horizontal strips; e.g., one or several degrees of latitude. Where possible, station numbers within each strip increase from west to east and the first figure of the three-figure station number increases from north to south.
Station index numbers for stations in the Antarctic are allocated by the Secretary-General in accordance with the following scheme:
Each station has an international number 89xxy, where xx indicates the nearest 10° meridian which is numerically lower than the station longitude. For east longitudes, 50 is added; e.g., 89124 indicates a station between 120° and 130°W and 89654 indicates a station between longitudes 150° and 160°E. The figure “y” is allocated roughly according to the latitude of the station with “y” increasing towards the south.
For stations for which international numbers are no longer available within the above scheme, the algorithm will be expanded by adding 20 to xx for west longitudes (range of index numbers 200–380) and 70 for east longitudes (range of index numbers 700–880) to provide new index numbers.

SYSTEM OF STATION INDEX NUMBERS
A– 374 Volume I.1
Antarctic stations which held numbers before the introduction of this scheme in 1957 retain their previously allocated index numbers.
Station index numbers consisting of one figure repeated five times, e.g. 55555, 77777, etc., or ending with 000 or 999, or duplicating special code indicators used in code forms including station index numbers, shall not be assigned to meteorological stations (see list of these special code indicators in the note hereafter).
Modifications to the index numbers of synoptic land stations or aeronautical meteorological stations on land, the reports of which are included in international exchanges, shall be made effective on 1 January or 1 July. They shall be communicated to the Secretariat at least six months prior to becoming effective.
Other information relating to station index numbers shall be sent to the Secretariat at least two months prior to becoming effective.
The general list of station index numbers is published by the WMO Secretariat in a separate volume (Weather Reporting (WMO–No. 9), Volume A).
Positions of reporting ships or aircraft are given as geographical coordinates by position groups in the appropriate code forms. However, in order that a meteorological service or centre may follow and recognize the successive reports of a given ship, it is recommended that additional information be given in the report, permitting the identification of the ship. This information is given, whenever possible, by the inclusion of the call sign of ships. These call signs shall also be included in all collective messages of reports from selected and supplementary ships. In cases where the inclusion of the call signs is not possible, selected and supplementary ships are identified by name or by special numbers.
In the case of transport aircraft and for this same purpose, provision is made for the necessary identification information in the first group of the report.
Note: Figure groups used as special code indicators in FM 20, FM 32, FM 35 and FM 85 and which shall not be assigned to meteorological stations, in addition to groups consisting of one figure repeated five times and those ending with 000 or 999:
21212 Data for fixed regional and/or significant levels with respect to wind follow. (FM 32)
21212 Data for significant levels with respect to wind follow. (FM 35)
31313 Data on sounding system, launch time and sea-surface temperature follow. (FM 35)
41414 Cloud information follows. (FM 35)
51515 52525 53535 54545 55555 Additional data in regional code follow. (FM 20, FM 32, FM 35, FM 85) 56565 57575 58585 59595
61616 62626 63636 64646 65656 Additional data in national code follow. (FM 20, FM 32, FM 35) 66666 67676 68686 69696

Volume I.1 A–375
b. HYDROLOGICAL OBSERVING STATIONS
An international hydrological observing station identification number in the form (000ACi) BBiHiHiH is included in the reports of hydrological observation for a hydrological station and in a hydrological forecast. The two groups permit the identification of the WMO Region (A), country (Ci), river basin or group of basins (BB) and the station (iHiHiH).
The allocation of identification numbers is the responsibility of regional associations, for Ci and BB, and Member countries, for iHiHiH.
A Region may have a maximum of 99 indicators for large basins or groups of small basins. The number BB = 00 is not used.
If a country straddles several basins (BB), it should nevertheless have only one and the same figure for Ci.
If a basin BB comprises all or part of the territory of more than ten countries, Ci should be allocated starting with the largest countries, giving joint national numbers to others (the smallest). In the latter case, the national identification numbers of the station (iHiHiH) should be allocated by regional agreement.
Alternatively large river basins composed of more than nine countries may be divided into several sub-basins, each one of which may be allocated a separate BB; thus the number of countries will be less than ten in each BB.
In each country and for a portion of a basin BB, the national identification numbers of stations (iHiHiH) increase from 010 to 999 from west to east and from north to south. The numbers from iHiHiH = 000 to iHiHiH = 009 may be reserved to designate the identification of hydrological forecast centres.
Modifications to the identification numbers of hydrological observing stations, the reports of which are included in international exchanges, shall be made effective on 1 January or 1 July. They shall be communicated to the Secretariat at least six months prior to becoming effective.
Other information relating to station identification numbers shall be sent to the Secretariat at least two months prior to becoming effective.
The lists of Ci and BB are published in Volume II of the Manual on Codes (WMO–No. 306) and the lists of iHiHiH will be published in a separate volume (Operational Hydrology Report No. . . ., WMO–No. . . .). (This publication will appear at a later stage.)
_____________


Section E
BEAUFORT SCALE OF WIND
_____________

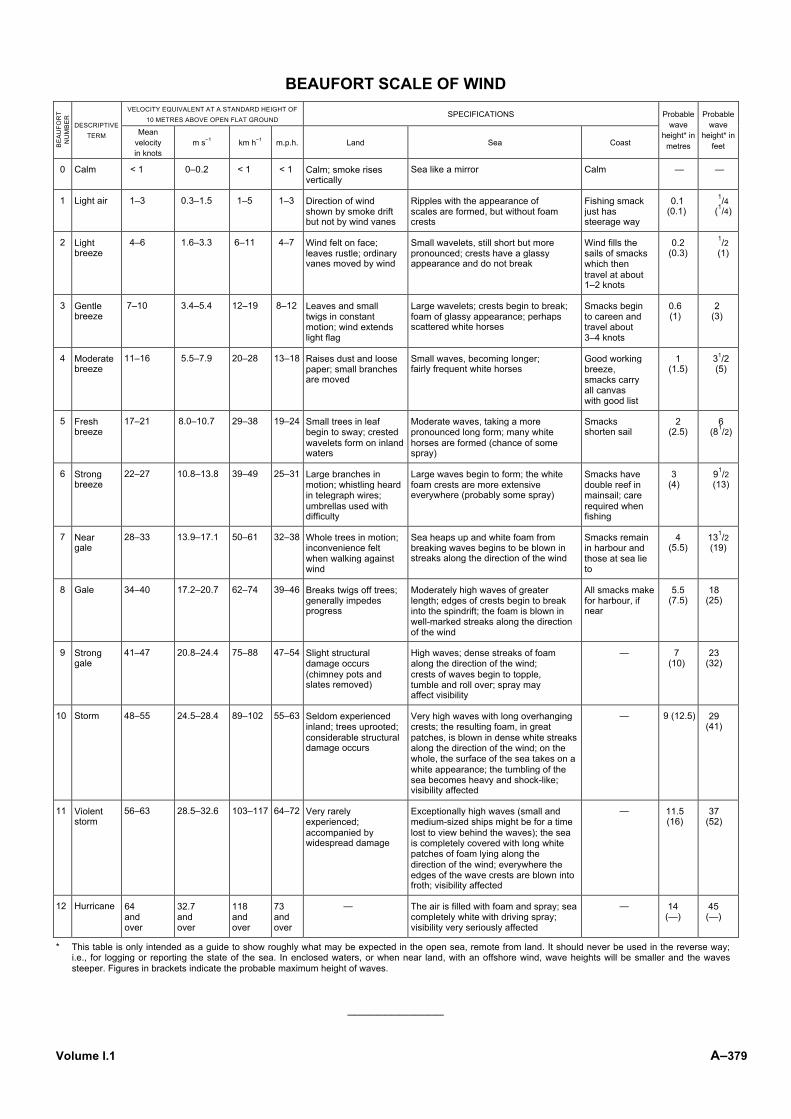
Volume I.1 A–379
BEAUFORT SCALE OF WIND
VELOCITY EQUIVALENT AT A STANDARD HEIGHT OF 10 METRES ABOVE OPEN FLAT GROUND
SPECIFICATIONS
BE
AU
FOR
T N
UM
BE
R
DESCRIPTIVE TERM Mean
velocity in knots
m s–1 km h–1 m.p.h. Land Sea Coast
Probable wave
height* in metres
Probable wave
height* in feet
0 Calm < 1 0–0.2 < 1 < 1 Calm; smoke rises vertically
Sea like a mirror Calm — —
1 Light air 1–3 0.3–1.5 1–5 1–3 Direction of wind shown by smoke drift but not by wind vanes
Ripples with the appearance of scales are formed, but without foam crests
Fishing smack just has steerage way
0.1 (0.1)
1/4 (1/4)
2 Light breeze
4–6 1.6–3.3 6–11 4–7 Wind felt on face; leaves rustle; ordinary vanes moved by wind
Small wavelets, still short but more pronounced; crests have a glassy appearance and do not break
Wind fills the sails of smacks which then travel at about 1–2 knots
0.2 (0.3)
1/2 (1)
3 Gentle breeze
7–10 3.4–5.4 12–19 8–12 Leaves and small twigs in constant motion; wind extends light flag
Large wavelets; crests begin to break; foam of glassy appearance; perhaps scattered white horses
Smacks begin to careen and travel about 3–4 knots
0.6 (1)
2 (3)
4 Moderate breeze
11–16 5.5–7.9 20–28 13–18 Raises dust and loose paper; small branches are moved
Small waves, becoming longer; fairly frequent white horses
Good working breeze, smacks carry all canvas with good list
1 (1.5)
31/2 (5)
5 Fresh breeze
17–21 8.0–10.7 29–38 19–24 Small trees in leaf begin to sway; crested wavelets form on inland waters
Moderate waves, taking a more pronounced long form; many white horses are formed (chance of some spray)
Smacks shorten sail
2 (2.5)
6 (81/2)
6 Strong breeze
22–27 10.8–13.8 39–49 25–31 Large branches in motion; whistling heard in telegraph wires; umbrellas used with difficulty
Large waves begin to form; the white foam crests are more extensive everywhere (probably some spray)
Smacks have double reef in mainsail; care required when fishing
3 (4)
91/2 (13)
7 Near gale
28–33 13.9–17.1 50–61 32–38 Whole trees in motion; inconvenience felt when walking against wind
Sea heaps up and white foam from breaking waves begins to be blown in streaks along the direction of the wind
Smacks remain in harbour and those at sea lie to
4 (5.5)
131/2 (19)
8 Gale 34–40 17.2–20.7 62–74 39–46 Breaks twigs off trees; generally impedes progress
Moderately high waves of greater length; edges of crests begin to break into the spindrift; the foam is blown in well-marked streaks along the direction of the wind
All smacks make for harbour, if near
5.5 (7.5)
18 (25)
9 Strong gale
41–47 20.8–24.4 75–88 47–54 Slight structural damage occurs (chimney pots and slates removed)
High waves; dense streaks of foam along the direction of the wind; crests of waves begin to topple, tumble and roll over; spray may affect visibility
— 7 (10)
23 (32)
10 Storm 48–55 24.5–28.4 89–102 55–63 Seldom experienced inland; trees uprooted; considerable structural damage occurs
Very high waves with long overhanging crests; the resulting foam, in great patches, is blown in dense white streaks along the direction of the wind; on the whole, the surface of the sea takes on a white appearance; the tumbling of the sea becomes heavy and shock-like; visibility affected
— 9 (12.5) 29 (41)
11 Violent storm
56–63 28.5–32.6 103–117 64–72 Very rarely experienced; accompanied by widespread damage
Exceptionally high waves (small and medium-sized ships might be for a time lost to view behind the waves); the sea is completely covered with long white patches of foam lying along the direction of the wind; everywhere the edges of the wave crests are blown into froth; visibility affected
— 11.5 (16)
37 (52)
12 Hurricane 64 and over
32.7 and over
118 and over
73 and over
— The air is filled with foam and spray; sea completely white with driving spray; visibility very seriously affected
— 14 (—)
45 (—)
* This table is only intended as a guide to show roughly what may be expected in the open sea, remote from land. It should never be used in the reverse way; i.e., for logging or reporting the state of the sea. In enclosed waters, or when near land, with an offshore wind, wave heights will be smaller and the waves steeper. Figures in brackets indicate the probable maximum height of waves.
_____________


APPENDIX
National practices regarding the coding of certain elements in reports, analyses or forecasts for international exchange
_____________


Volume I.1 A–383
NATIONAL PRACTICES REGARDING THE CODING OF CERTAIN ELEMENTS IN REPORTS, ANALYSES OR FORECASTS FOR INTERNATIONAL EXCHANGE
Reporting of horizontal visibility at surface in meteorological reports
By WMO circular letter W/SY/CO (PR-3195) of 16 September 1980, Members were invited to inform the Secretariat of their national practices regarding the coding of horizontal visibility at surface (VV) in meteorological reports.
The information received is given below. This table will be kept up to date through supplements.
Member Practices conform to Regulation 12.2.1.3.1
Other procedures
used
No information available
Afghanistan ........................................................................... X Albania .................................................................................... X Algeria ....................................................................................... X Angola ..................................................................................... X Antigua and Barbuda ............................................................ X Argentina .............................................................................. X Armenia .................................................................................... X Australia .................................................................................. X Austria .................................................................................. X Azerbaijan ................................................................................. X Bahamas ................................................................................. X Bahrain .................................................................................... X Bangladesh ........................................................................... X Barbados .............................................................................. X Belarus .................................................................................... X Belgium ................................................................................. X Belize ........................................................................................ X Benin ....................................................................................... X Bolivia (Plurinational State of) .............................................. X Bosnia and Herzegovina ...................................................... X Botswana .............................................................................. X Brazil ....................................................................................... X British Caribbean Territories ................................................. X Brunei Darussalam ................................................................. X Bulgaria ................................................................................ X Burkina Faso ........................................................................ X Burundi ................................................................................. X Cambodia ............................................................................. X Cameroon ............................................................................. X Canada .................................................................................... X Cape Verde ............................................................................. X Central African Republic ....................................................... X Chad ...................................................................................... X Chile ........................................................................................ X China ........................................................................................ X Colombia .............................................................................. X Comoros ............................................................................... X Congo ................................................................................... X Costa Rica ............................................................................ X Côte d’Ivoire ......................................................................... X
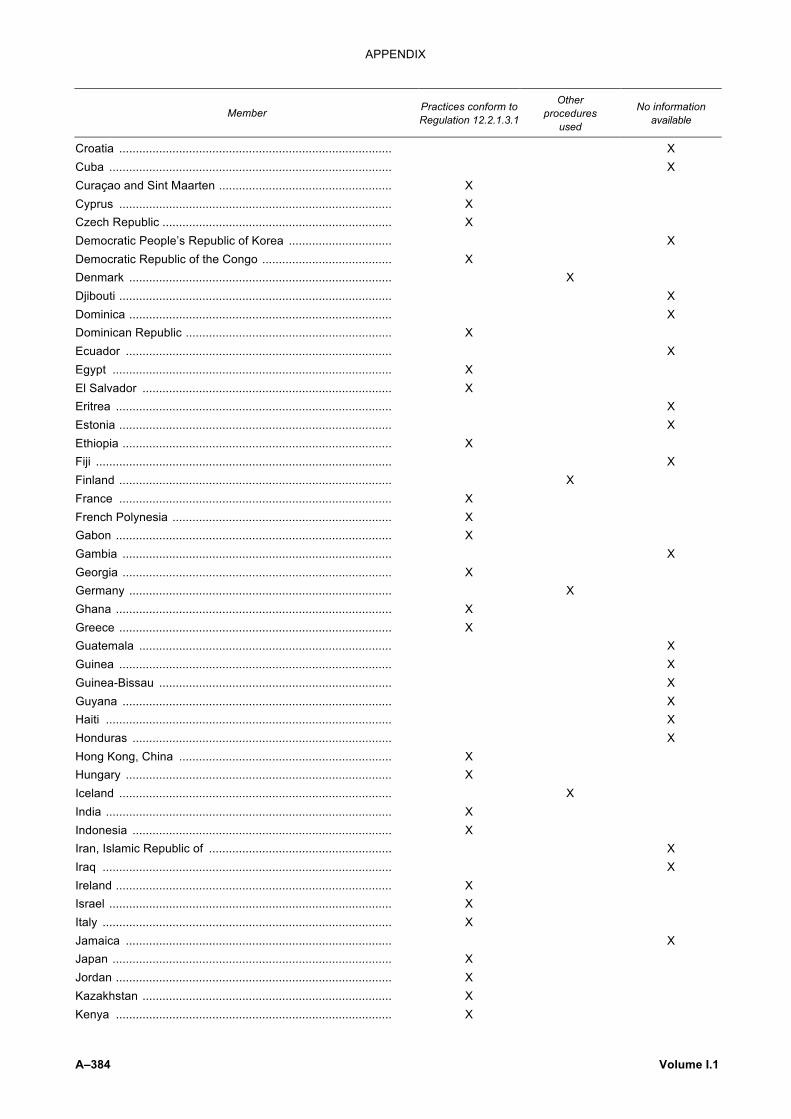
APPENDIX
A–384 Volume I.1
Member Practices conform to Regulation 12.2.1.3.1
Other procedures
used
No information available
Croatia .................................................................................. X Cuba ..................................................................................... X Curaçao and Sint Maarten .................................................... X Cyprus .................................................................................. X Czech Republic ..................................................................... X Democratic People’s Republic of Korea ............................... X Democratic Republic of the Congo ....................................... X Denmark ............................................................................... X Djibouti .................................................................................. X Dominica ............................................................................... X Dominican Republic .............................................................. X Ecuador ................................................................................ X Egypt .................................................................................... X El Salvador ........................................................................... X Eritrea ................................................................................... X Estonia .................................................................................. X Ethiopia ................................................................................. X Fiji ......................................................................................... X Finland .................................................................................. X France .................................................................................. X French Polynesia .................................................................. X Gabon ................................................................................... X Gambia ................................................................................. X Georgia ................................................................................. X Germany ............................................................................... X Ghana ................................................................................... X Greece .................................................................................. X Guatemala ............................................................................ X Guinea .................................................................................. X Guinea-Bissau ...................................................................... X Guyana ................................................................................. X Haiti ...................................................................................... X Honduras .............................................................................. X Hong Kong, China ................................................................ X Hungary ................................................................................ X Iceland .................................................................................. X India ...................................................................................... X Indonesia .............................................................................. X Iran, Islamic Republic of ....................................................... X Iraq ....................................................................................... X Ireland ................................................................................... X Israel ..................................................................................... X Italy ....................................................................................... X Jamaica ................................................................................ X Japan .................................................................................... X Jordan ................................................................................... X Kazakhstan ........................................................................... X Kenya ................................................................................... X

APPENDIX
Volume I.1 A–385
Member Practices conform to Regulation 12.2.1.3.1
Other procedures
used
No information available
Kuwait ................................................................................... X Kyrgyzstan ............................................................................ X Lao People’s Democratic Republic ....................................... X Latvia .................................................................................... X Lebanon ................................................................................ X Lesotho ................................................................................. X Liberia ................................................................................... X Libya ...................................................................................... X Lithuania ............................................................................... X Luxembourg .......................................................................... X Macao, China ....................................................................... X Madagascar .......................................................................... X Malawi .................................................................................. X Malaysia ............................................................................... X Maldives ............................................................................... X Mali ....................................................................................... X Malta ..................................................................................... X Mauritania ............................................................................. X Mauritius ............................................................................... X Mexico .................................................................................. X Micronesia, Federated States of ........................................... X Monaco ................................................................................. X Mongolia ............................................................................... X Montenegro .......................................................................... Morocco ................................................................................ X Mozambique ......................................................................... X Myanmar ............................................................................... X Namibia ................................................................................ X Nepal .................................................................................... X Netherlands .......................................................................... X New Caledonia ..................................................................... X New Zealand ........................................................................ X Nicaragua ............................................................................. X Niger ..................................................................................... X Nigeria .................................................................................. X Niue ...................................................................................... X Norway ................................................................................. X Oman .................................................................................... X Pakistan ................................................................................ X Panama ................................................................................ X Papua New Guinea .............................................................. X Paraguay .............................................................................. X Peru ...................................................................................... X Philippines ............................................................................ X Poland .................................................................................. X Portugal ................................................................................ X Qatar ..................................................................................... X Republic of Korea ................................................................. X

APPENDIX
A–386 Volume I.1
Member Practices conform to Regulation 12.2.1.3.1
Other procedures
used
No information available
Republic of Moldova ............................................................. X Romania ............................................................................... X Russian Federation .............................................................. X Rwanda ................................................................................ X Saint Lucia ............................................................................ X Sao Tome and Principe ........................................................ X Saudi Arabia ......................................................................... X Senegal ................................................................................ X Serbia ................................................................................... Seychelles ............................................................................ X Sierra Leone ......................................................................... X Singapore ............................................................................. X Slovakia ................................................................................ X Slovenia ................................................................................ X Solomon Islands ................................................................... X Somalia ................................................................................. X South Africa .......................................................................... X Spain .................................................................................... X Sri Lanka .............................................................................. X Sudan ................................................................................... X Suriname .............................................................................. X Swaziland ............................................................................. X Sweden ................................................................................. X Switzerland ........................................................................... X Syrian Arab Republic ............................................................ X Tajikistan .............................................................................. X Thailand ................................................................................ X The former Yugoslav Republic of Macedonia ....................... X Togo ..................................................................................... X Tonga ................................................................................... X Trinidad and Tobago ............................................................ X Tunisia .................................................................................. X Turkey ................................................................................... X Turkmenistan ........................................................................ X Uganda ................................................................................. X Ukraine ................................................................................. X United Arab Emirates ........................................................... X United Kingdom of Great Britain and Northern Ireland ......... X United Republic of Tanzania ................................................ X United States of America ...................................................... X Uruguay ................................................................................ X Uzbekistan ............................................................................ X Vanuatu ................................................................................ X Venezuela (Bolivarian Republic of) ...................................... X Viet Nam ............................................................................... X Yemen .................................................................................. X Zambia .................................................................................. X Zimbabwe ............................................................................. X

APPENDIX
Volume I.1 A–387
Information on the procedures used by Members other than those specified by Regulation 12.2.1.3.1 is given below:
Australia: When the horizontal visibility is not the same in different directions, the greatest distance prevailing over half or more of the horizon is given for VV. Significant reductions of visibility in other sectors are given in plain language at the end of the report.
Canada: The horizontal visibility which is reported in all surface observations is the “prevailing visibility” which is defined as the maximum visibility value common to sectors comprising one-half or more of the horizon circle.
China: The effective visibility is defined as the longest distance of visibility over more than one-half of all the directions.
Denmark: At manually operated stations if the horizontal visibility is not the same in different directions, the shorter distance is given for VV. However, if local phenomena reduce the visibility in a sector covering less than one-quarter of the horizon, this sector is disregarded provided that the visibility in it is 1 km or more. At automatic stations the visibility is given as a short distance – or a point – measurement.
Finland: When the horizontal visibility is not the same in different directions, the shortest distance shall be given for VV. However, visibility reduction in one or several small sectors caused by local phenomena is disregarded.
Germany: If the horizontal visibility is not the same in different directions, the shorter distance is given for VV. However, small sectors of the horizon in which local phenomena reduce visibility are disregarded, provided the extent of the sector or sectors concerned is not more than 30 degrees of the horizon circle in whole.
Iceland: When the horizontal visibility is not the same in different directions, the shortest distance shall be given for VV. Reduction of visibility confined to a sector of not more than 45 degrees shall not influence the selection of the code figure for VV. This reduction in visibility may be caused, for example, by precipitation, fog or haze not present at the observing station at the time of observation.
New Zealand: If the horizontal visibility is not the same in different directions, the shortest distance shall be given for VV or VVVV. However, if in one or more small sectors visibility is reduced, these are disregarded, provided the extent of the sector or sectors concerned is not more than one-quarter of the horizon circle in whole. When the horizontal visibility is 10 km or more, VVVV is coded in the form V´V´KM, where V´V´ is the visibility in whole kilometres.
Norway: If the horizontal visibility is not the same in different directions, the shortest distance shall be given for VV. However, small sectors of the horizon in which local phenomena such as showers or distant fog reduce the visibility are disregarded. The total of such small sectors should be less than 45 degrees.
Rwanda: If the horizontal visibility is not the same in different directions, the shorter distance is given for VV. However, if in one or more small sectors visibility is reduced, these are disregarded, provided the extent of the sector or sectors concerned is not more than one-quarter of the horizon circle.
Sweden: Regulation 12.2.1.3.1 is practiced with the following restriction: a reduction of the visibility within a limited area, extended at most 45 degrees of the horizon, shall not influence the choice of the code figure for VV. This reduction of the visibility can be caused by precipitation, fog or mist which is not present at the station at the time of observation.
United States of America: The national practice is to report the greatest visibility equalled or exceeded throughout at least half the horizon circle, which needs not necessarily be continuous. If this distance is between two values given in the code table, the code figure for the lower code table value will be reported.
_____________


ATTACHMENTS
I. Common code tables to binary and alphanumeric codes (copy of Volume I.2, Part C/c.: Common Features to Binary and Alphanumeric Codes)
II. List of alphanumeric code tables related to BUFR Table B
III. International Seismic Code
_____________


Volume I.1 A–391
ATTACHMENT I
COMMON CODE TABLES TO BINARY AND ALPHANUMERIC CODES
COMMON CODE TABLE C–1: Identification of originating/generating centre
F1F2 for alphanumeric codes F3F3F3 for alphanumeric codes Code table 0 in GRIB Edition 1/Code table 0 01 033 in BUFR Edition 3 Octet 5 in Section 1 of GRIB Edition 1/Octet 6 in Section 1 of BUFR Edition 3
COMMON CODE TABLE C–2: Radiosonde/sounding system used
Code table 3685 – rara (Radiosonde/sounding system used) – for alphanumeric codes Code table 0 02 011 (Radiosonde type) in BUFR
COMMON CODE TABLE C–3: Instrument make and type for water temperature profile measurement with fall rate equation coefficients
Code table 1770 – IXIXIX (Instrument type for XBT, with fall rate equation coefficients) – for alphanumeric codes Code table 0 22 067 (Instrument type for water temperature profile measurement) in BUFR
COMMON CODE TABLE C–4: Water temperature profile recorder types
Code table 4770 – XRXR (Recorder type) – for alphanumeric codes Code table 0 22 068 (Water temperature profile recorder types) in BUFR
COMMON CODE TABLE C–5: Satellite identifier
I6I6I6 for alphanumeric codes Code table 0 01 007 in BUFR Code used in GRIB Edition 2
COMMON CODE TABLE C–6: List of international units
(Used only in Volume I.2, Parts B and C)
COMMON CODE TABLE C–7: Tracking technique/status of system used
Code table 3872 – sasa for alphanumeric code Code table 0 02 014 in BUFR

ATTACHMENT I
A–392 Volume I.1
COMMON CODE TABLE C–1: Identification of originating/generating centre
Common Code table
F1F2 for alphanumeric codes F3F3F3 for alphanumeric codes Code table 0 in GRIB Edition 1/Code table 0 01 033 in BUFR Edition 3 Octet 5 in Section 1 of GRIB Edition 1/Octet 6 in Section 1 of BUFR Edition 3
Code figure for F1F2
Code figure for F3F3F3
Octet 5 in Section 1 of GRIB Edition 1
Octet 6 in Section 1 of BUFR Edition 3
00 000 0 WMO Secretariat 01–09: WMCs
01 001 1 Melbourne 02 002 2 Melbourne 03 003 3 ) 04 004 4 Moscow 05 005 5 Moscow 06 006 6 ) 07 007 7 US National Weather Service – National Centres for
Environmental Prediction (NCEP) 08 008 8 US National Weather Service Telecommunications Gateway
(NWSTG) 09 009 9 US National Weather Service – Other
10–25: Centres in Region I 10 010 10 Cairo (RSMC) 11 011 11 ) 12 012 12 Dakar (RSMC) 13 013 13 ) 14 014 14 Nairobi (RSMC) 15 015 15 ) 16 016 16 Casablanca (RSMC) 17 017 17 Tunis (RSMC) 18 018 18 Tunis-Casablanca (RSMC) 19 019 19 ) 20 020 20 Las Palmas 21 021 21 Algiers (RSMC) 22 022 22 ACMAD 23 023 23 Mozambique (NMC) 24 024 24 Pretoria (RSMC) 25 025 25 La Réunion (RSMC)
26–40: Centres in Region II 26 026 26 Khabarovsk (RSMC) 27 027 27 ) 28 028 28 New Delhi (RSMC) 29 029 29 ) 30 030 30 Novosibirsk (RSMC) 31 031 31 ) 32 032 32 Tashkent (RSMC) 33 033 33 Jeddah (RSMC) 34 034 34 Tokyo (RSMC), Japan Meteorological Agency

ATTACHMENT I
Volume I.1 A–393
Code figure for F1F2
Code figure for F3F3F3
Octet 5 in Section 1 of GRIB Edition 1
Octet 6 in Section 1 of BUFR Edition 3
35 035 35 ) 36 036 36 Bangkok 37 037 37 Ulaanbaatar 38 038 38 Beijing (RSMC) 39 039 39 ) 40 040 40 Seoul
41–50: Centres in Region III 41 041 41 Buenos Aires (RSMC) 42 042 42 ) 43 043 43 Brasilia (RSMC) 44 044 44 ) 45 045 45 Santiago 46 046 46 Brazilian Space Agency – INPE 47 047 47 Colombia (NMC) 48 048 48 Ecuador (NMC) 49 049 49 Peru (NMC) 50 050 50 Venezuela (Bolivarian Republic of) (NMC)
51–63: Centres in Region IV 51 051 51 Miami (RSMC) 52 052 52 Miami (RSMC), National Hurricane Centre 53 053 53 Montreal (RSMC) 54 054 54 ) 55 055 55 San Francisco 56 056 56 ARINC Centre 57 057 57 US Air Force – Air Force Global Weather Central 58 058 58 Fleet Numerical Meteorology and Oceanography Center,
Monterey, CA, United States 59 059 59 The NOAA Forecast Systems Laboratory, Boulder, CO, United
States 60 060 60 United States National Center for Atmospheric Research
(NCAR) 61 061 61 Service ARGOS – Landover 62 062 62 US Naval Oceanographic Office 63 063 63 International Research Institute for Climate and Society (IRI)
64–73: Centres in Region V 64 064 64 Honolulu (RSMC) 65 065 65 Darwin (RSMC) 66 066 66 ) 67 067 67 Melbourne (RSMC) 68 068 68 Reserved 69 069 69 Wellington (RSMC) 70 070 70 ) 71 071 71 Nadi (RSMC) 72 072 72 Singapore 73 073 73 Malaysia (NMC)

ATTACHMENT I
A–394 Volume I.1
Code figure for F1F2
Code figure for F3F3F3
Octet 5 in Section 1 of GRIB Edition 1
Octet 6 in Section 1 of BUFR Edition 3
74–99: Centres in Region VI
74 074 74 UK Meteorological Office – Exeter (RSMC) 75 075 75 ) 76 076 76 Moscow (RSMC) 77 077 77 Reserved 78 078 78 Offenbach (RSMC) 79 079 79 ) 80 080 80 Rome (RSMC) 81 081 81 ) 82 082 82 Norrköping 83 083 83 ) 84 084 84 Toulouse (RSMC) 85 085 85 Toulouse (RSMC) 86 086 86 Helsinki 87 087 87 Belgrade 88 088 88 Oslo 89 089 89 Prague 90 090 90 Episkopi 91 091 91 Ankara 92 092 92 Frankfurt/Main 93 093 93 London (WAFC) 94 094 94 Copenhagen 95 095 95 Rota 96 096 96 Athens 97 097 97 European Space Agency (ESA) 98 098 98 European Centre for Medium-Range Weather Forecasts
(ECMWF) (RSMC 99 099 99 De Bilt
Additional Centres Not applicable 100 100 Brazzaville Not applicable 101 101 Abidjan Not applicable 102 102 Libya (NMC) Not applicable 103 103 Madagascar (NMC) Not applicable 104 104 Mauritius (NMC) Not applicable 105 105 Niger (NMC) Not applicable 106 106 Seychelles (NMC) Not applicable 107 107 Uganda (NMC) Not applicable 108 108 United Republic of Tanzania (NMC) Not applicable 109 109 Zimbabwe (NMC) Not applicable 110 110 Hong Kong, China Not applicable 111 111 Afghanistan (NMC) Not applicable 112 112 Bahrain (NMC) Not applicable 113 113 Bangladesh (NMC) Not applicable 114 114 Bhutan (NMC) Not applicable 115 115 Cambodia (NMC) Not applicable 116 116 Democratic People’s Republic of Korea (NMC)

ATTACHMENT I
Volume I.1 A–395
Code figure for F1F2
Code figure for F3F3F3
Octet 5 in Section 1 of GRIB Edition 1
Octet 6 in Section 1 of BUFR Edition 3
Not applicable 117 117 Islamic Republic of Iran (NMC) Not applicable 118 118 Iraq (NMC) Not applicable 119 119 Kazakhstan (NMC) Not applicable 120 120 Kuwait (NMC) Not applicable 121 121 Kyrgyzstan (NMC) Not applicable 122 122 Lao People’s Democratic Republic (NMC) Not applicable 123 123 Macao, China Not applicable 124 124 Maldives (NMC) Not applicable 125 125 Myanmar (NMC) Not applicable 126 126 Nepal (NMC) Not applicable 127 127 Oman (NMC) Not applicable 128 128 Pakistan (NMC) Not applicable 129 129 Qatar (NMC) Not applicable 130 130 Yemen (NMC) Not applicable 131 131 Sri Lanka (NMC) Not applicable 132 132 Tajikistan (NMC) Not applicable 133 133 Turkmenistan (NMC) Not applicable 134 134 United Arab Emirates (NMC) Not applicable 135 135 Uzbekistan (NMC) Not applicable 136 136 Viet Nam (NMC) Not applicable 137–139 137–139 Reserved for other centres Not applicable 140 140 Bolivia (Plurinational State of) (NMC) Not applicable 141 141 Guyana (NMC) Not applicable 142 142 Paraguay (NMC) Not applicable 143 143 Suriname (NMC) Not applicable 144 144 Uruguay (NMC) Not applicable 145 145 French Guiana Not applicable 146 146 Brazilian Navy Hydrographic Centre Not applicable 147 147 National Commission on Space Activities (CONAE) – Argentina Not applicable 148–149 148–149 Reserved for other centres Not applicable 150 150 Antigua and Barbuda (NMC) Not applicable 151 151 Bahamas (NMC) Not applicable 152 152 Barbados (NMC) Not applicable 153 153 Belize (NMC) Not applicable 154 154 British Caribbean Territories Centre Not applicable 155 155 San José Not applicable 156 156 Cuba (NMC) Not applicable 157 157 Dominica (NMC) Not applicable 158 158 Dominican Republic (NMC) Not applicable 159 159 El Salvador (NMC) Not applicable 160 160 US NOAA/NESDIS Not applicable 161 161 US NOAA Office of Oceanic and Atmospheric Research Not applicable 162 162 Guatemala (NMC) Not applicable 163 163 Haiti (NMC) Not applicable 164 164 Honduras (NMC) Not applicable 165 165 Jamaica (NMC) Not applicable 166 166 Mexico City

ATTACHMENT I
A–396 Volume I.1
Code figure for F1F2
Code figure for F3F3F3
Octet 5 in Section 1 of GRIB Edition 1
Octet 6 in Section 1 of BUFR Edition 3
Not applicable 167 167 Curaçao and Sint Maarten (NMC) Not applicable 168 168 Nicaragua (NMC) Not applicable 169 169 Panama (NMC) Not applicable 170 170 Saint Lucia (NMC) Not applicable 171 171 Trinidad and Tobago (NMC) Not applicable 172 172 French Departments in RA IV Not applicable 173 173 US National Aeronautics and Space Administration (NASA) Not applicable 174 174 Integrated Science Data Management/Marine Environmental
Data Service (ISDM/MEDS) – Canada Not applicable 175 175 Reserved for other centres Not applicable 176 176 Cooperative Institute for Meteorological Satellite Studies
(CIMSS) – United States Not applicable 177 177 NOAA National Ocean Service – United States Not applicable 178–189 178–189 Reserved for other centres Not applicable 190 190 Cook Islands (NMC) Not applicable 191 191 French Polynesia (NMC) Not applicable 192 192 Tonga (NMC) Not applicable 193 193 Vanuatu (NMC) Not applicable 194 194 Brunei Darussalam (NMC) Not applicable 195 195 Indonesia (NMC) Not applicable 196 196 Kiribati (NMC) Not applicable 197 197 Federated States of Micronesia (NMC) Not applicable 198 198 New Caledonia (NMC) Not applicable 199 199 Niue Not applicable 200 200 Papua New Guinea (NMC) Not applicable 201 201 Philippines (NMC) Not applicable 202 202 Samoa (NMC) Not applicable 203 203 Solomon Islands (NMC) Not applicable 204 204 National Institute of Water and Atmospheric Research (NIWA –
New Zealand) Not applicable 205–209 205–209 Reserved Not applicable 210 210 Frascati (ESA/ESRIN) Not applicable 211 211 Lannion Not applicable 212 212 Lisbon Not applicable 213 213 Reykjavik Not applicable 214 214 Madrid Not applicable 215 215 Zurich Not applicable 216 216 Service ARGOS – Toulouse Not applicable 217 217 Bratislava Not applicable 218 218 Budapest Not applicable 219 219 Ljubljana Not applicable 220 220 Warsaw Not applicable 221 221 Zagreb Not applicable 222 222 Albania (NMC) Not applicable 223 223 Armenia (NMC) Not applicable 224 224 Austria (NMC) Not applicable 225 225 Azerbaijan (NMC)

ATTACHMENT I
Volume I.1 A–397
Code figure for F1F2
Code figure for F3F3F3
Octet 5 in Section 1 of GRIB Edition 1
Octet 6 in Section 1 of BUFR Edition 3
Not applicable 226 226 Belarus (NMC) Not applicable 227 227 Belgium (NMC) Not applicable 228 228 Bosnia and Herzegovina (NMC) Not applicable 229 229 Bulgaria (NMC) Not applicable 230 230 Cyprus (NMC) Not applicable 231 231 Estonia (NMC) Not applicable 232 232 Georgia (NMC) Not applicable 233 233 Dublin Not applicable 234 234 Israel (NMC) Not applicable 235 235 Jordan (NMC) Not applicable 236 236 Latvia (NMC) Not applicable 237 237 Lebanon (NMC) Not applicable 238 238 Lithuania (NMC) Not applicable 239 239 Luxembourg Not applicable 240 240 Malta (NMC) Not applicable 241 241 Monaco Not applicable 242 242 Romania (NMC) Not applicable 243 243 Syrian Arab Republic (NMC) Not applicable 244 244 The former Yugoslav Republic of Macedonia (NMC) Not applicable 245 245 Ukraine (NMC) Not applicable 246 246 Republic of Moldova (NMC) Not applicable 247 247 Operational Programme for the Exchange of weather RAdar
information (OPERA) – EUMETNET Not applicable 248 248 Montenegro (NMC) Not applicable 249 249 Reserved for other centres Not applicable 250 250 COnsortium for Small scale MOdelling (COSMO) Not applicable 251 251 Meteorological Cooperation on Operational NWP (MetCoOp) Not applicable 252 252 Max Planck Institute for Meteorology (MPI-M) Not applicable 253 253 Reserved for others centres Not applicable 254 254 EUMETSAT Operation Centre Not applicable 255 255 Missing value Not applicable 256–999 Not applicable Not used
Notes: (1) The closed bracket sign) indicates that the corresponding code figure is reserved for the previously named centre.
(2) With GRIB or BUFR, to indicate whether the originating/generating centre is a sub-centre or not, the following procedure should be applied:
In GRIB edition 1, use octet 26 of section 1, or in BUFR edition 3, use octet 5 of section 1, with the following meaning:
Code figure 0 Not a sub-centre, the originating/generating centre is the centre defined by octet 5 in section 1 of
GRIB edition 1, or by octet 6 in section 1 of BUFR edition 3. 1 to 254 Identifier of the sub-centre which is the originating/generating centre. The identifier of the sub-
centre is allocated by the associated centre which is defined by octet 5 in section 1 of GRIB edition 1, or by octet 6 in section 1 of BUFR edition 3. The sub-centre identifiers should be supplied to the WMO Secretariat by the associated centre(s) for publication.
(3) For the definitions of sub-centres provided to the WMO Secretariat, see Common code table C-12.

ATTACHMENT I
A–398 Volume I.1
COMMON CODE TABLE C–2: Radiosonde/sounding system used
Common Code table Code table 3685 – rara (Radiosonde/sounding system used) – for alphanumeric codes Code table 0 02 011 (Radiosonde type) in BUFR
Date of assignment of
number (necessary after 30/06/2007)
Code figure for rara
(Code table 3685)
Code figure for BUFR
(Code table 0 02 011)
Not applicable 00 0 Reserved
Before 01 1 iMet-1-BB (United States)
Not applicable 02 2 No radiosonde – passive target (e.g. reflector)
Not applicable 03 3 No radiosonde – active target (e.g. transponder)
Not applicable 04 4 No radiosonde – passive temperature-humidity profiler
Not applicable 05 5 No radiosonde – active temperature-humidity profiler
Not applicable 06 6 No radiosonde – radio-acoustic sounder
Before 07 7 iMet-1-AB (United States)
Not applicable 08 8 No radiosonde – . . . (reserved)
Not applicable 09 9 No radiosonde – system unknown or not specified
Before 10 10 VIZ type A pressure-commutated (United States)
Before 11 11 VIZ type B time-commutated (United States)
Before 12 12 RS SDC (Space Data Corporation – United States)
Before 13 13 Astor (no longer made – Australia)
Before 14 14 VIZ MARK I MICROSONDE (United States)
Before 15 15 EEC Company type 23 (United States)
Before 16 16 Elin (Austria)
Before 17 17 Graw G. (Germany)
Before 18 18 Graw DFM-06 (Germany)
Before 19 19 Graw M60 (Germany)
Before 20 20 Indian Meteorological Service MK3 (India)
Before 21 21 VIZ/Jin Yang MARK I MICROSONDE (Republic of Korea)
Before 22 22 Meisei RS2-80 (Japan)
Before 23 23 Mesural FMO 1950A (France)
Before 24 24 Mesural FMO 1945A (France)
Before 25 25 Mesural MH73A (France)
Before 26 26 Meteolabor Basora (Switzerland)
Before 27 27 AVK-MRZ (Russian Federation)
Before 28 28 Meteorit MARZ2-1 (Russian Federation)
Before 29 29 Meteorit MARZ2-2 (Russian Federation)
Before 30 30 Oki RS2-80 (Japan)
Before 31 31 VIZ/Valcom type A pressure-commutated (Canada)
Before 32 32 Shanghai Radio (China)
Before 33 33 UK Met Office MK3 (UK)
Before 34 34 Vinohrady (Czech Republic)
Before 35 35 Vaisala RS18 (Finland)
Before 36 36 Vaisala RS21 (Finland)

ATTACHMENT I
Volume I.1 A–399
Date of assignment of
number (necessary after 30/06/2007)
Code figure for rara
(Code table 3685)
Code figure for BUFR
(Code table 0 02 011)
Before 37 37 Vaisala RS80 (Finland)
Before 38 38 VIZ LOCATE Loran-C (United States)
Before 39 39 Sprenger E076 (Germany)
Before 40 40 Sprenger E084 (Germany)
Before 41 41 Sprenger E085 (Germany)
Before 42 42 Sprenger E086 (Germany)
Before 43 43 AIR IS – 4A – 1680 (United States)
Before 44 44 AIR IS – 4A – 1680 X (United States)
Before 45 45 RS MSS (United States)
Before 46 46 AIR IS – 4A – 403 (United States)
Before 47 47 Meisei RS2-91 (Japan)
Before 48 48 VALCOM (Canada)
Before 49 49 VIZ MARK II (United States)
Before 50 50 Graw DFM-90 (Germany)
Before 51 51 VIZ–B2 (United States)
Before 52 52 Vaisala RS80-57H
Before 53 53 AVK-RF95 (Russian Federation)
Before 54 54 Graw DFM-97 (Germany)
Before 55 55 Meisei RS-01G (Japan)
Before 56 56 M2K2 (France)
Before 57 57 Modem M2K2–DC (France)
Before 58 58 AVK-BAR (Russian Federation)
Before 59 59 Modem M2K2-R 1680 MHz RDF radiosonde with pressure sensor chip (France)
Before 60 60 Vaisala RS80/MicroCora (Finland)
Before 61 61 Vaisala RS80/Loran/Digicora I, II or Marwin (Finland)
Before 62 62 Vaisala RS80/PCCora (Finland)
Before 63 63 Vaisala RS80/Star (Finland)
Before 64 64 Orbital Sciences Corporation, Space Data Division, transponder radiosonde, type 909-11-XX, where XX corresponds to the model of the instrument (United States)
Before 65 65 VIZ transponder radiosonde, model number 1499–520 (United States)
Before 66 66 Vaisala RS80/Autosonde (Finland)
Before 67 67 Vaisala RS80/Digicora III (Finland)
Before 68 68 AVK-RZM-2 (Russian Federation)
Before 69 69 MARL-A or Vektor-M-RZM-2 (Russian Federation)
Before 70 70 Vaisala RS92/Star (Finland)
Before 71 71 Vaisala RS90/Loran/Digicora I, II or Marwin (Finland)
Before 72 72 Vaisala RS90/PC–Cora (Finland)
Before 73 73 Vaisala RS90/Autosonde (Finland) Before 74 74 Vaisala RS90/Star (Finland)

ATTACHMENT I
A–400 Volume I.1
Date of assignment of
number (necessary after 30/06/2007)
Code figure for rara
(Code table 3685)
Code figure for BUFR
(Code table 0 02 011)
Before 75 75 AVK-MRZ-ARMA (Russian Federation)
Before 76 76 AVK-RF95-ARMA (Russian Federation)
Before 77 77 GEOLINK GPSonde GL98 (France) Before 78 78 Vaisala RS90/Digicora III (Finland)
Before 79 79 Vaisala RS92/Digicora I, II or Marwin (Finland)
Before 80 80 Vaisala RS92/Digicora III (Finland)
Before 81 81 Vaisala RS92/Autosonde (Finland)
Before 82 82 Sippican MK2 GPS/STAR (United States) with rod thermistor, carbon element and derived pressure
Before 83 83 Sippican MK2 GPS/W9000 (United States) with rod thermistor, carbon element and derived pressure
Before 84 84 Sippican MARK II with chip thermistor, carbon element and derived pressure from GPS height
Before 85 85 Sippican MARK IIA with chip thermistor, carbon element and derived pressure from GPS height
Before 86 86 Sippican MARK II with chip thermistor, pressure and carbon element
Before 87 87 Sippican MARK IIA with chip thermistor, pressure and carbon element
Before 88 88 MARL-A or Vektor-M-MRZ (Russian Federation)
Before 89 89 MARL-A or Vektor-M-BAR (Russian Federation)
Not applicable 90 90 Radiosonde not specified or unknown
Not applicable 91 91 Pressure only radiosonde
Not applicable 92 92 Pressure only radiosonde plus transponder
Not applicable 93 93 Pressure only radiosonde plus radar reflector
Not applicable 94 94 No pressure radiosonde plus transponder
Not applicable 95 95 No pressure radiosonde plus radar reflector
Not applicable 96 96 Descending radiosonde
Before 97 97 BAT-16P (South Africa)
Before 98 98 BAT-16G (South Africa)
Before 99 99 BAT-4G (South Africa)
Not available 100 Reserved for BUFR only
01 101 Not vacant
Not available 102–106 Reserved for BUFR only
07 107 Not vacant
Not available 108–109 Reserved for BUFR only
01/01/2008 10 110 Sippican LMS5 w/Chip Thermistor, duct mounted capacitance relative humidity sensor and derived pressure from GPS height
01/01/2008
11 111 Sippican LMS6 w/Chip Thermistor, external boom mounted capacitance relative humidity sensor, and derived pressure from GPS height
12 112 Not vacant
15/09/2010 13 113 Vaisala RS92/MARWIN MW32 (Finland)
03/11/2011 14 114 Vaisala RS92/DigiCORA MW41 (Finland)

ATTACHMENT I
Volume I.1 A–401
Date of assignment of
number (necessary after 30/06/2007)
Code figure for rara
(Code table 3685)
Code figure for BUFR
(Code table 0 02 011)
01/12/2011 15 115 PAZA-12M/Radiotheodolite-UL (Ukraine)
01/12/2011 16 116 PAZA-22/AVK-1 (Ukraine)
02/05/2012 17 117 Graw DFM-09 (Germany)
18 118 Not vacant
Needed 19 119 Vacant
20–21 120–121 Not vacant
02/05/2012 22 122 Meisei RS-11G GPS radiosonde w/thermistor, capacitance relative humidity sensor, and derived pressure from GPS height (Japan)
03/11/2011 23 123 Vaisala RS41/DigiCORA MW41 (Finland)
03/11/2011 24 124 Vaisala RS41/AUTOSONDE (Finland)
03/11/2011 25 125 Vaisala RS41/MARWIN MW32 (Finland)
26–27 126–127 Not vacant
15/09/2011 28 128 AVK – AK2-02 (Russian Federation)
15/09/2011 29 129 MARL-A or Vektor-M – AK2-02 (Russian Federation)
01/01/2010 30 130 Meisei RS-06G (Japan)
03/11/2011 31 131 Taiyuan GTS1-1/GFE(L) (China )
03/11/2011 32 132 Shanghai GTS1/GFE(L) (China)
03/11/2011 33 133 Nanjing GTS1-2/GFE(L) (China)
Needed 34–36 134–136 Vacant
37 137 Not vacant
Needed 38–40 138–140 Vacant
03/11/2011 41 141 Vaisala RS41 with pressure derived from GPS height/DigiCORA MW41 (Finland)
03/11/2011 42 142 Vaisala RS41 with pressure derived from GPS height/ AUTOSONDE (Finland)
Needed 43–46 143–146 Vacant
47 147 Not vacant
02/05/2012 48 148 PAZA-22M/MARL-A
49 149 Not vacant
Needed 50 150 Vacant
51 151 Not vacant
03/11/2011 52 152 Vaisala RS92-NGP/Intermet IMS-2000 (United States)
53–59 153–159 Not vacant
Needed 60 160 Vacant
61 161 Not vacant
Needed 62–66 162–166 Vacant
67–72 167–172 Not vacant
Needed 73 173 Vacant
74–76 174–176 Not vacant
15/03/2010 77 177 Modem GPSonde M10 (France)
78–81 178–181 Not vacant

ATTACHMENT I
A–402 Volume I.1
Date of assignment of
number (necessary after 30/06/2007)
Code figure for rara
(Code table 3685)
Code figure for BUFR
(Code table 0 02 011)
07/11/2012 82 182 Lockheed Martin LMS-6 w/chip thermistor; external boom mounted polymer capacitive relative humidity sensor; capacitive pressure sensor and GPS wind
07/11/2012 83 183 Vaisala RS92-D/Intermet IMS 1500 w/silicon capacitive pressure sensor, capacitive wire temperature sensor, twin thin-film heated polymer capacitive relative humidity sensor and RDF wind
Needed 84 184 Vacant
85–89 185–189 Not vacant
Not available 190–196 Reserved for BUFR only
97–99 197–199 Not vacant
Not available 200–254 Reserved for BUFR only
255 Missing value
Notes:
(1) References to countries in brackets indicate the manufacturing location rather than the country using the instrument.
(2) Some of the radiosondes listed are no longer in use but are retained for archiving purposes.
(3) The alphanumeric code format reports only 2 digits, and the first digit for BUFR is identified from the date: the first digit is 0 if the introduction of the radiosonde for observation was before 30 June 2007, or 1 otherwise. Entries in the second part of the table (after 99), which are declared “Vacant” can be used for new radiosondes because the 2-digit number was originally attributed to sondes, which are no longer used. This system has been adopted to accommodate reporting in TEMP traditional alphanumeric code format up to the time BUFR is fully used for radiosounding reports.

ATTACHMENT I
Volume I.1 A–403
COMMON CODE TABLE C–3: Instrument make and type for water temperature profile measurement with fall rate equation coefficients
Common Code table
Code table 1770 – IXIXIX (Instrument type for XBT, with fall rate equation coefficients) – for alphanumeric codes Code table 0 22 067 (Instrument type for water temperature profile measurement) in BUFR
Meaning
Equation coefficients Code figure
for IXIXIX
Code figure for BUFR
(Code table 022 067) Instrument
make and type a b
001 1 Sippican T-4 6.472 –2.16 002 2 Sippican T-4 6.691 –2.25 011 11 Sippican T-5 6.828 –1.82 021 21 Sippican Fast Deep 6.346 –1.82 031 31 Sippican T-6 6.472 –2.16 032 32 Sippican T-6 6.691 –2.25 041 41 Sippican T-7 6.472 –2.16 042 42 Sippican T-7 6.691 –2.25 051 51 Sippican Deep Blue 6.472 –2.16 052 52 Sippican Deep Blue 6.691 –2.25 061 61 Sippican T-10 6.301 –2.16 071 71 Sippican T-11 1.779 –0.255 081 81 Sippican AXBT (300m probes) 1.52 0.0 201 201 TSK T-4 6.472 –2.16 202 202 TSK T-4 6.691 –2.25 211 211 TSK T-6 6.472 –2.16 212 212 TSK T-6 6.691 –2.25 221 221 TSK T-7 6.472 –2.16 222 222 TSK T-7 6.691 –2.25 231 231 TSK T-5 6.828 –1.82 241 241 TSK T-10 6.301 –2.16 251 251 TSK Deep Blue 6.472 –2.16 252 252 TSK Deep Blue 6.691 –2.25 261 261 TSK AXBT 401 401 Sparton XBT-1 6.301 –2.16 411 411 Sparton XBT-3 5.861 –0.0904 421 421 Sparton XBT-4 6.472 –2.16 431 431 Sparton XBT-5 6.828 –1.82 441 441 Sparton XBT-5DB 6.828 –1.82 451 451 Sparton XBT-6 6.472 –2.16 461 461 Sparton XBT-7 6.472 –2.16 462 462 Sparton XBT-7 6.705 –2.28 471 471 Sparton XBT-7DB 6.472 –2.16 481 481 Sparton XBT-10 6.301 –2.16 491 491 Sparton XBT-20 6.472 –2.16 501 501 Sparton XBT-20DB 6.472 –2.16 510 510 Sparton 536 AXBT 1.524 0 700 700 Sippican XCTD Standard 710 710 Sippican XCTD Deep 720 720 Sippican AXCTD
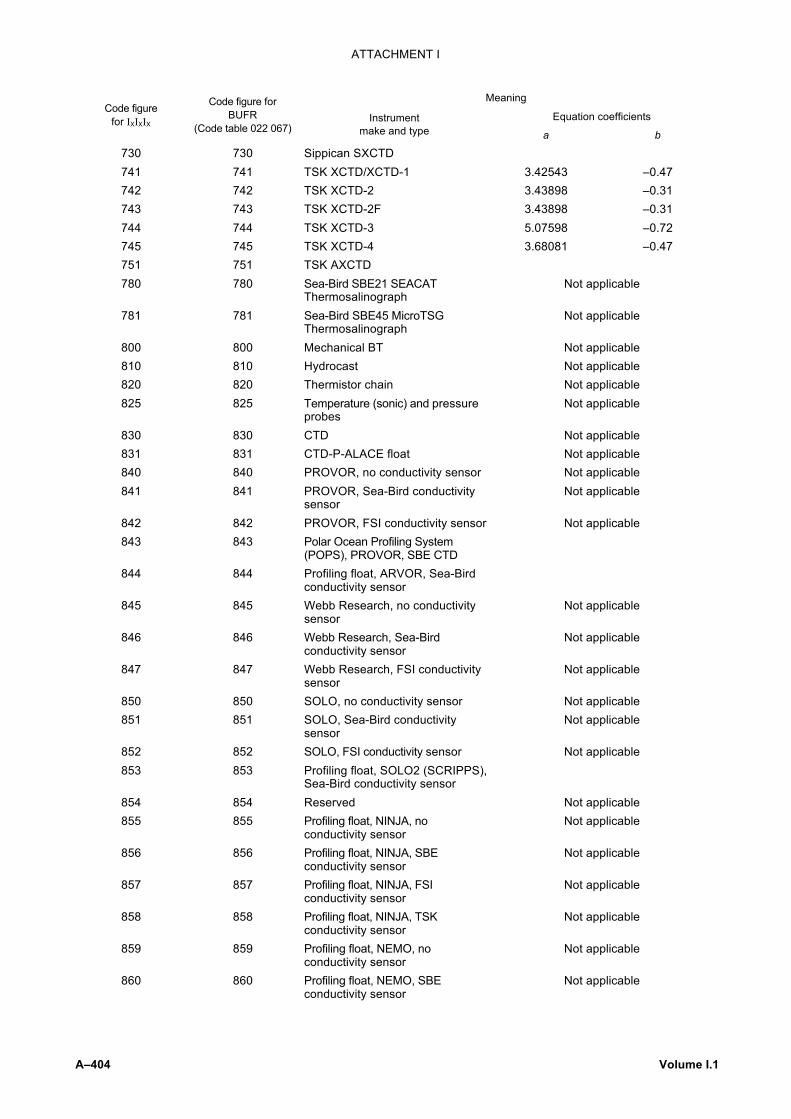
ATTACHMENT I
A–404 Volume I.1
Meaning
Equation coefficients Code figure
for IXIXIX
Code figure for BUFR
(Code table 022 067) Instrument
make and type a b
730 730 Sippican SXCTD 741 741 TSK XCTD/XCTD-1 3.42543 –0.47 742 742 TSK XCTD-2 3.43898 –0.31 743 743 TSK XCTD-2F 3.43898 –0.31 744 744 TSK XCTD-3 5.07598 –0.72 745 745 TSK XCTD-4 3.68081 –0.47 751 751 TSK AXCTD 780 780 Sea-Bird SBE21 SEACAT
Thermosalinograph Not applicable
781 781 Sea-Bird SBE45 MicroTSG Thermosalinograph
Not applicable
800 800 Mechanical BT Not applicable 810 810 Hydrocast Not applicable 820 820 Thermistor chain Not applicable 825 825 Temperature (sonic) and pressure
probes Not applicable
830 830 CTD Not applicable 831 831 CTD-P-ALACE float Not applicable 840 840 PROVOR, no conductivity sensor Not applicable 841 841 PROVOR, Sea-Bird conductivity
sensor Not applicable
842 842 PROVOR, FSI conductivity sensor Not applicable 843 843 Polar Ocean Profiling System
(POPS), PROVOR, SBE CTD
844 844 Profiling float, ARVOR, Sea-Bird conductivity sensor
845 845 Webb Research, no conductivity sensor
Not applicable
846 846 Webb Research, Sea-Bird conductivity sensor
Not applicable
847 847 Webb Research, FSI conductivity sensor
Not applicable
850 850 SOLO, no conductivity sensor Not applicable 851 851 SOLO, Sea-Bird conductivity
sensor Not applicable
852 852 SOLO, FSI conductivity sensor Not applicable 853 853 Profiling float, SOLO2 (SCRIPPS),
Sea-Bird conductivity sensor
854 854 Reserved Not applicable 855 855 Profiling float, NINJA, no
conductivity sensor Not applicable
856 856 Profiling float, NINJA, SBE conductivity sensor
Not applicable
857 857 Profiling float, NINJA, FSI conductivity sensor
Not applicable
858 858 Profiling float, NINJA, TSK conductivity sensor
Not applicable
859 859 Profiling float, NEMO, no conductivity sensor
Not applicable
860 860 Profiling float, NEMO, SBE conductivity sensor
Not applicable

ATTACHMENT I
Volume I.1 A–405
Meaning
Equation coefficients Code figure
for IXIXIX
Code figure for BUFR
(Code table 022 067) Instrument
make and type a b
861 861 Profiling float, NEMO, FSI conductivity sensor
Not applicable
862–899 862–899 Reserved 900 900 Sippican LMP-5 XBT 9.727 –0.0000473 901 901 Ice-tethered Profiler (ITP), SBE
CTD
902–994 902–994 Reserved 995 995 Instrument attached to marine
mammals Not applicable
996 996 Instrument attached to animals other than marine mammals
Not applicable
997–999 997–999 Reserved 1000–1022 Reserved 1023 Missing value
Notes:
(1) The depth is calculated from coefficients a and b and the time t as follows: z = at + 10–3bt2.
(2) All unassigned numbers are reserved for future use.
(3) The values of a and b are supplied for information only.

ATTACHMENT I
A–406 Volume I.1
COMMON CODE TABLE C–4: Water temperature profile recorder types
Common Code table Code table 1770 – XRXR (Recorder type) – for alphanumeric codes Code table 0 22 068 (Water temperature profile recorder types) in BUFR
Code figure for XRXR
Code figure for BUFR
(Code table 0 22 068) Meaning
01 1 Sippican Strip Chart Recorder 02 2 Sippican MK2A/SSQ-61 03 3 Sippican MK-9 04 4 Sippican AN/BHQ-7/MK8 05 5 Sippican MK-12 06 6 Sippican MK-21 07 7 Sippican MK-8 Linear Recorder 08 8 Sippican MK-10 10 10 Sparton SOC BT/SV Processor Model 100 11 11 Lockheed-Sanders Model OL5005 20 20 ARGOS XBT-ST 21 21 CLS-ARGOS/Protecno XBT-ST Model-1 22 22 CLS-ARGOS/Protecno XBT-ST Model-2 30 30 BATHY Systems SA-810 31 31 Scripps Metrobyte Controller 32 32 Murayama Denki Z-60-16 III 33 33 Murayama Denki Z-60-16 II 34 34 Protecno ETSM2 35 35 Nautilus Marine Service NMS-XBT 40 40 TSK MK-2A 41 41 TSK MK-2S 42 42 TSK MK-30 43 43 TSK MK-30N 45 45 TSK MK-100 46 46 TSK MK-130 Compatible recorder for both XBT and XCTD 47 47 TSK MK-130A XCTD recorder 48 48 TSK AXBT RECEIVER MK-300 49 49 TSK MK-150/MK-150N Compatible recorder for both XBT and XCTD 50 50 JMA ASTOS 60 60 ARGOS communications, sampling on up transit 61 61 ARGOS communications, sampling on down transit 62 62 Orbcomm communications, sampling on up transit 63 63 Orbcomm communications, sampling on down transit 64 64 Iridium communications, sampling on up transit 65 65 Iridium communications, sampling on down transit 70 70 CSIRO Devil-1 XBT acquisition system 71 71 CSIRO Devil-2 XBT acquisition system 72 72 TURO/CSIRO Quoll XBT Acquisition System 80 80 Applied Microsystems Ltd, MICRO-SVT&P 81 81 Sea Mammal Research Unit, Univ. St Andrews, UK, uncorrected salinity
from a sea mammal mounted instrument 82 82 Sea Mammal Research Unit, Univ. St Andrews, UK, corrected salinity from
a sea mammal mounted instrument 99 99 Unknown
127 Missing value
Note: All unassigned numbers are reserved for future use.

ATTACHMENT I
Volume I.1 A–407
COMMON CODE TABLE C–5: Satellite identifier
Common Code table I6I6I6 for alphanumeric codes Code table 0 01 007 in BUFR Code used in GRIB Edition 2
Code figure for I6I6I6
Code figure for BUFR
(Code table 0 01 007)
Code figure for GRIB
Edition 2
000 0 0 Reserved
001–099: Numbers allocated to Europe
001 1 1 ERS 1 002 2 2 ERS 2 003 3 3 METOP-1 (Metop-B) 004 4 4 METOP-2 (Metop-A) 005 5 5 METOP-3 (Metop-C)
020 20 20 SPOT 1 021 21 21 SPOT 2 022 22 22 SPOT 3 023 23 23 SPOT 4
040 40 40 OERSTED 041 41 41 CHAMP 042 42 42 TerraSAR-X 043 43 43 TanDEM-X 044 44 44 PAZ 046 46 46 SMOS
050 50 50 METEOSAT 3 051 51 51 METEOSAT 4 052 52 52 METEOSAT 5 053 53 53 METEOSAT 6 054 54 54 METEOSAT 7 055 55 55 METEOSAT 8 056 56 56 METEOSAT 9 057 57 57 METEOSAT 10 058 58 58 METEOSAT 1 059 59 59 METEOSAT 2
060 60 60 ENVISAT
070 70 70 METEOSAT 11
100–199: Numbers allocated to Japan
120 120 120 ADEOS 121 121 121 ADEOS II
140 140 140 GOSAT
150 150 150 GMS 3 151 151 151 GMS 4 152 152 152 GMS 5
171 171 171 MTSAT-1R 172 172 172 MTSAT-2

ATTACHMENT I
A–408 Volume I.1
Code figure for I6I6I6
Code figure for BUFR
(Code table 0 01 007)
Code figure for GRIB
Edition 2
200–299: Numbers allocated to the United States
200 200 200 NOAA 8 201 201 201 NOAA 9 202 202 202 NOAA 10 203 203 203 NOAA 11 204 204 204 NOAA 12 205 205 205 NOAA 14 206 206 206 NOAA 15 207 207 207 NOAA 16 208 208 208 NOAA 17 209 209 209 NOAA 18
220 220 220 LANDSAT 5 221 221 221 LANDSAT 4 222 222 222 LANDSAT 7 223 223 223 NOAA 19 224 224 224 NPP
240 240 240 DMSP & 241 241 241 DMSP 8 242 242 242 DMSP 9 243 243 243 DMSP 10 244 244 244 DMSP 11 245 245 245 DMSP 12 246 246 246 DMSP 13 247 247 247 DMSP 14 248 248 248 DMSP 15 249 249 249 DMSP 16
250 250 250 GOES 6 251 251 251 GOES 7 252 252 252 GOES 8 253 253 253 GOES 9 254 254 254 GOES 10 255 255 255 GOES 11 256 256 256 GOES 12 257 257 257 GOES 13 258 258 258 GOES 14 259 259 259 GOES 15
260 260 260 JASON 1 261 261 261 JASON 2
281 281 281 QUIKSCAT 282 282 282 TRMM 283 283 283 CORIOLIS 285 285 285 DMSP17 286 286 286 DMSP18

ATTACHMENT I
Volume I.1 A–409
Code figure for I6I6I6
Code figure for BUFR
(Code table 0 01 007)
Code figure for GRIB
Edition 2
300–399: Numbers allocated to the Russian Federation
310 310 310 GOMS 1 311 311 311 GOMS 2 320 320 320 METEOR 2-21 321 321 321 METEOR 3-5 322 322 322 METEOR 3M-1 323 323 323 METEOR 3M-2 341 341 341 RESURS 01-4
400–499: Numbers allocated to India
410 410 410 KALPANA-1 421 421 421 Oceansat-2 430 430 430 INSAT 1B 431 431 431 INSAT 1C 432 432 432 INSAT 1D 440 440 440 Megha-Tropiques 441 441 441 SARAL 450 450 450 INSAT 2A 451 451 451 INSAT 2B 452 452 452 INSAT 2E 470 470 470 INSAT 3A 471 471 471 INSAT 3D 472 472 472 INSAT 3E
500–599: Numbers allocated to China
500 500 500 FY–1C 501 501 501 FY–1D 510 510 510 FY–2 512 512 512 FY-2B 513 513 513 FY-2C 514 514 514 FY-2D 515 515 515 FY-2E 520 520 520 FY-3A 521 521 521 FY-3B
600–699: Numbers allocated to Europe
700–799: Numbers allocated to the United States
700 700 700 TIROS M (ITOS 1) 701 701 701 NOAA 1 702 702 702 NOAA 2 703 703 703 NOAA 3 704 704 704 NOAA 4 705 705 705 NOAA 5 706 706 706 NOAA 6 707 707 707 NOAA 7 708 708 708 TIROS-N
710 710 710 GOES (SMS 1) 711 711 711 GOES (SMS 2) 720 720 720 TOPEX

ATTACHMENT I
A–410 Volume I.1
Code figure for I6I6I6
Code figure for BUFR
(Code table 0 01 007)
Code figure for GRIB
Edition 2
721 721 721 GFO (GEOSAT follow on) 722 722 722 GRACE A 723 723 723 GRACE B
731 731 731 GOES 1 732 732 732 GOES 2 733 733 733 GOES 3 734 734 734 GOES 4 735 735 735 GOES 5
740 740 740 COSMIC-1 741 741 741 COSMIC-2 742 742 742 COSMIC-3 743 743 743 COSMIC-4 744 744 744 COSMIC-5 745 745 745 COSMIC-6
763 763 763 NIMBUS 3 764 764 764 NIMBUS 4 765 765 765 NIMBUS 5 766 766 766 NIMBUS 6 767 767 767 NIMBUS 7
780 780 780 ERBS 781 781 781 UARS 782 782 782 EARTH PROBE 783 783 783 TERRA 784 784 784 AQUA 785 785 785 AURA 786 786 786 C/NOFS 787 787 787 CALIPSO 788 788 788 CloudSat
800–849: Numbers allocated to other satellite operators
800 800 800 SUNSAT 810 810 810 COMS-1
811 811 811 COMS-2 820 820 820 SAC-C
821 821 821 SAC-D 825 825 825 KOMPSAT-5
850 850 850 Combination of TERRA and AQUA 851 851 851 Combination of NOAA 16 to NOAA 19 852 852 852 Combination of Metop-1 to Metop-3 853 853 853 Combination of METEOSAT and DMSP
870–998 870–998 870–998 Reserved 999 Missing value 999–1022 999–65534 Reserved 1023 65535 Missing value
Note: Within the ranges 000 to 849 and 870 to 998, even deciles indicate polar-orbiting satellites and odd deciles indicate geostationary satellites. The range from 850 to 869 shall be used to indicate combinations of satellites, so the aforementioned decile rule does not apply to values in this range.

ATTACHMENT I
Volume I.1 A–411
COMMON CODE TABLE C–6: List of international units
(Used only in Volume I.2, Parts B and C)
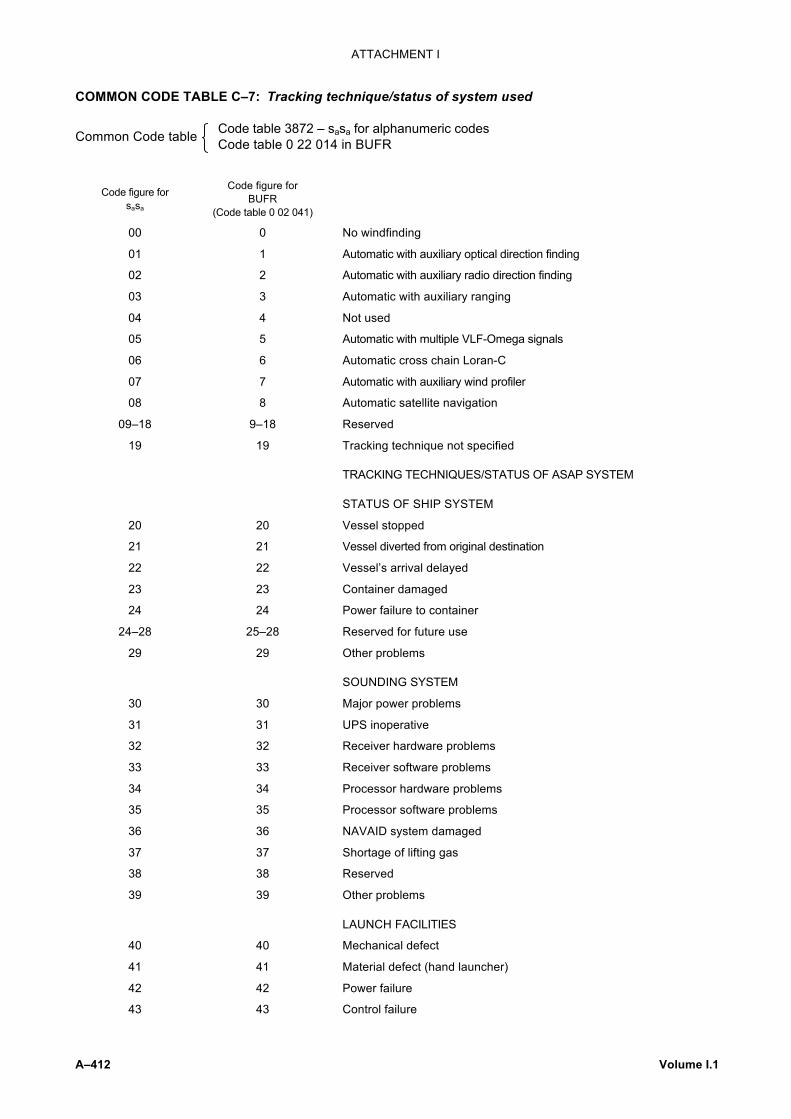
ATTACHMENT I
A–412 Volume I.1
COMMON CODE TABLE C–7: Tracking technique/status of system used
Common Code table Code table 3872 – sasa for alphanumeric codes Code table 0 22 014 in BUFR
Code figure for sasa
Code figure for BUFR
(Code table 0 02 041)
00 0 No windfinding
01 1 Automatic with auxiliary optical direction finding
02 2 Automatic with auxiliary radio direction finding
03 3 Automatic with auxiliary ranging
04 4 Not used
05 5 Automatic with multiple VLF-Omega signals
06 6 Automatic cross chain Loran-C
07 7 Automatic with auxiliary wind profiler
08 8 Automatic satellite navigation
09–18 9–18 Reserved
19 19 Tracking technique not specified
TRACKING TECHNIQUES/STATUS OF ASAP SYSTEM
STATUS OF SHIP SYSTEM
20 20 Vessel stopped
21 21 Vessel diverted from original destination
22 22 Vessel’s arrival delayed
23 23 Container damaged
24 24 Power failure to container
24–28 25–28 Reserved for future use
29 29 Other problems
SOUNDING SYSTEM
30 30 Major power problems
31 31 UPS inoperative
32 32 Receiver hardware problems
33 33 Receiver software problems
34 34 Processor hardware problems
35 35 Processor software problems
36 36 NAVAID system damaged
37 37 Shortage of lifting gas
38 38 Reserved
39 39 Other problems
LAUNCH FACILITIES
40 40 Mechanical defect
41 41 Material defect (hand launcher)
42 42 Power failure
43 43 Control failure
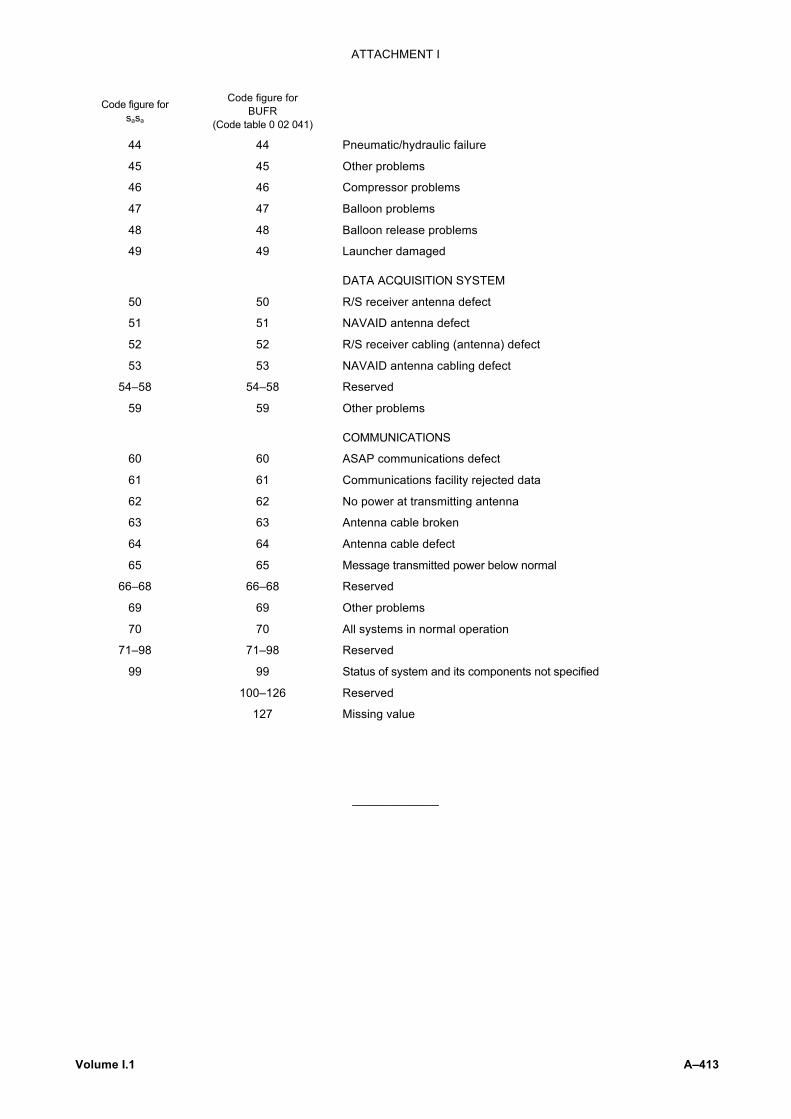
ATTACHMENT I
Volume I.1 A–413
Code figure for sasa
Code figure for BUFR
(Code table 0 02 041)
44 44 Pneumatic/hydraulic failure
45 45 Other problems
46 46 Compressor problems
47 47 Balloon problems
48 48 Balloon release problems
49 49 Launcher damaged
DATA ACQUISITION SYSTEM
50 50 R/S receiver antenna defect
51 51 NAVAID antenna defect
52 52 R/S receiver cabling (antenna) defect
53 53 NAVAID antenna cabling defect
54–58 54–58 Reserved
59 59 Other problems
COMMUNICATIONS
60 60 ASAP communications defect
61 61 Communications facility rejected data
62 62 No power at transmitting antenna
63 63 Antenna cable broken
64 64 Antenna cable defect
65 65 Message transmitted power below normal
66–68 66–68 Reserved
69 69 Other problems
70 70 All systems in normal operation
71–98 71–98 Reserved
99 99 Status of system and its components not specified
100–126 Reserved
127 Missing value
_____________


A–415
ATTACHMENT II
LIST OF ALPHANUMERIC CODE TABLES RELATED TO BUFR TABLE B
Related specification/code BUFRtable/regulation/code form code/flag Remarks
in alphanumeric codes table
AN — Code table 0114 0 02 169 —Aa — Code table 0131 0 23 001 —Ac — Code table 0133 0 23 005 —Ae — Code table 0135 0 23 006 —A1 — Code table 0161 0 01 003 —AA — Code table 0177 0 23 002 —a — Code table 0200 0 10 063 —a4 — Code table 0265 0 02 003 —BA — Code table 0302 0 11 031 —BT — Code table 0324 0 23 003 —BtBt — Code table 0370 0 02 149 —bi — Code table 0439 0 20 035 —C — Code table 0500 0 20 012 —CH — Code table 0509 0 20 012 —CL — Code table 0513 0 20 012 —CM — Code table 0515 0 20 012 —Ct — Code table 0552 0 20 017 —ci — Code table 0639 0 20 034 —Ds — Code table 0700 0 25 041 —E — Code table 0901 0 20 062 —Ec — Code table 0933 0 23 007 —Ee — Code table 0935 0 23 018 —
Es — Code table 09430 23 0080 23 009
—
E´ — Code table 0975 0 20 062 —Ft — Code table 1152 0 08 011 —F1F2 — Common Code table C–1 0 01 033 —F3F3F3 — Common code table C–1 0 01 033 —F4F4F4 0 01 034 To be specifiedgrgr — Code table 1487 0 29 001 —In — Code table 1743 0 23 032 —Is — Code table 1751 0 20 033 —I3 0 02 021 —I4 — Code table 1765 0 02 022 —I6I6I6 — Common Code table C-5 0 01 007 —IXIXIX — Code table 1770 0 22 067 Defined in Common Code table C–3i — Code table 1800 0 11 031 —iE — Code table 1806 0 02 004 —iu — Code table 1853 0 02 002 —iy — Code table 1857 0 02 051 —
Volume I.1

Related specification/code BUFRtable/regulation/code form code/flag Remarks
in alphanumeric codes table
ix — Code table 1860 0 02 001* —k1 — Code table 2262 0 02 032 Numerical variation in each tablek2 — Code table 2263 0 02 033 —k3 — Code table 2264 0 02 031 —k4 — Code table 2265 0 02 031 —k5 — Code table 2266 0 02 030 —k6 — Code table 2267 0 02 040 —N — Code table 2700 0 20 011 —Pa — Code table 3131 0 23 004 —QA — Code table 3302 0 33 027 —Qz — Code table 3318 0 25 086 —Rc — Code table 3533 0 24 003 —Rd — Code table 3534 0 13 051 —Re — Code table 3535 0 23 016 —Rp — Code table 3548 0 23 031 —Rs — Code table 3551 0 20 032 —rara — Code table 3685 (0–89) 0 02 011 Defined in Common Code table C–2rara — Code table 3685 (91–95) 0 02 015 Defined in Common Code table C–2S — Code table 3700 0 22 061 —Si — Code table 3739 0 20 037 —SPSPspsp — Code table 3778 0 20 063 To be developedsp — Code table 3847 0 13 041 —sr — Code table 3849 0 02 013 —ss — Code table 3850 0 02 038 —sw — Code table 3855 0 02 039 —s1 — Code table 3866 0 02 061 —s2 — Code table 3867 0 02 062 —sasa — Code table 3872 0 02 014 Defined in Common Code table C–7vs — Code table 4451 0 25 042 —Wa1 — Code table 4531 0 20 004 —Wa2 — Code table 4531 0 20 005 —W1 — Code table 4561 0 20 004 —W2 — Code table 4561 0 20 005 —wi — Code table 4639 0 02 023 —ww — Code table 4677 0 20 003* —wawa — Code table 4680 0 20 003* —w1w1 — Code table 4687 0 20 003* —XRXR — Code table 4770 0 22 068 Defined in Common Code table C–4XtXt — Code table 4780 0 02 034 —zi — Code table 5239 0 20 036 —
AMDAR — Regulation 42.2 0 08 004 —SYNOP/SHIP — Regulation 12.4.10.1 0 08 002 —TEMP/TEMP SHIP — Sections 2 to 6 0 08 001 —
____________
* See note at end of Attachment II.
A–416
ATTACHMENT II
Volume I.1

Note: Encoding/decoding ofSYNOP/SHIP ix — Code table 1860 to/from BUFR code tables
0 02 001 0 20 003CodeType of station operation Type of Presentfigure
station weather
1 Manned station (group 7wwW1W2 included) 1 00–99 (200–299)(but actually missing) (1) (510)
2 Manned station (group 7wwW1W2 omitted, 1 508no significant phenomenon to report)
3 Manned station (group 7wwW1W2 omitted, 1 509no observation, data not available)
4 Automatic station (group 7wwW1W2 included, 0 00–99 (200–299)using Code tables 4677 and 4561) (but actually missing) (0) (510)
5 Automatic station (group 7wawaWa1Wa2 omitted, 0 508no significant phenomenon to report)
6 Automatic station (group 7wawaWa1Wa2 omitted, 0 509no observation, data not available)
7 Automatic station (group 7wawaWa1Wa2 included, 0 100–199 (200–299)using Code tables 4680 and 4531)(but actually missing) (0) (510)
_______________
A–417
ATTACHMENT II
Volume I.1


A–419
ATTACHMENT III
INTERNATIONAL SEISMIC CODE
INTRODUCTION
The 1985 version of the International Seismic Code has been developed by an international working group.Although quite a few new features have been added, upward compatibility with the previous code has beenmaintained – the previous code is a subset of this 1985 version. That is to say, the new version does not makeany of the features of the old version obsolete but simply increases the scope of data types that can be trans-mitted. If a data contributor does not wish to include any of the newly reportable items, the old version may beused without having to violate the format of this new version.
This version of the seismic code consists of three parts:
1. Code form. A precise description of the syntax using a modification of a widely used metalanguage – a setof symbols and words used to describe another language (in which these symbols do not appear). Thismetalanguage is fully defined and illustrated in the last section of this introduction.
2. Definitions and usage . A supplement to the code form in which various codes are defined, expandedexplanations are given, and usage and scaling criteria are discussed.
3. Examples. Sample messages, exercising nearly the full range of parameters defined by the code, aregiven.
Among the various agencies receiving seismic data in the telegraphic format, few may wish to receive, orbe prepared to process, all of the types of data and messages that can be sent with the new seismic code.These agencies should communicate their precise needs to their traditional contributors in order to avoid con-fusion and processing problems.
Stations contributing data to agencies such as the ISC, the United States Geological Survey’s NEIC or otherinternational data centres are advised NOT to send ANY of the types of data newly permitted by the 1985 version NOR to implement ANY of the new formats until they have been notified by the recipient to do so.
The seismic code is intended for transmittal via any telegraphic circuit employing CCITT InternationalAlphabets Nos. 2 and 5 and it is also the format in which computer-to-computer transfers of such seismic datatake place. However, there is one internal heading field that should be used only by those sending via theWMO/GTS circuits. Also, WMO advises that the maximum length of the text of a seismic message is about 2100 characters for transmission on the GTS.
BACKUS-NAUR FORM
In order to precisely describe the syntax of the International Seismic Code a widely used metalanguage,known as Backus-Naur Form (Backus Normal Form or BNF), has been employed in a modified form – using BNF,syntactically valid sequences of symbols have been specified.
BNF consists of the four symbols (metacharacters) “⟨”, “⟩”, “⏐” and “::=” together with terminal and non-terminal symbols. Non-terminal symbols, metalinguistic variables (or metanames) are enclosed inangle-brackets “⟨⟩” and are used to define the components of the seismic code. The values of these metanamesare chosen so as to suggest their semantics. Terminal symbols appear outside the angle-brackets and denotethemselves – thus they are characters that actually appear in the seismic code. The vertical stroke “⏐” has themeaning “or” and the metacharacter “::=” means “is defined as”. Juxtaposition of terms implies concatenation– any sequence of terminal symbols and metanames implies linking together in a series.
The seismic code is herein initially defined in terms of four components, two terminal symbols (SEISMOand STOP) and the metanames ⟨standard delimiter⟩ and ⟨text⟩. These metanames and each metaname intro-duced thereafter are then defined by their components until each is reduced to the terminal symbols found inthe seismic code. The components designating the seismic code have been chosen and expanded so as tomake the BNF definition context-free. In a context-free grammar, any occurrence of a particular metavariablemay be replaced by one of its alternative values, irrespective of the other elements in the language.
Volume I.1

For an example, here is how the original BNF definition of an integer was developed:
⟨integer⟩::=⟨unsigned integer⟩⏐+ ⟨unsigned integer⟩⏐– ⟨unsigned integer⟩ (1)
⟨unsigned integer⟩::=⟨digit⟩⏐⟨unsigned integer⟩⟨digit⟩ (2)
⟨digit⟩::=0⏐1⏐2⏐3⏐4⏐5⏐6⏐7⏐8⏐9⏐ (3)
By introducing braces “{}” with indices into the notation, (1) can be written as:
⟨integer⟩::={+⏐–}10 ⟨unsigned integer⟩ (4)
and the recursive definition (2) can be written as:
⟨unsigned integer⟩::={⟨digit⟩}n1 (5)
where n = number of digits in the integer.
By combining (4) and (5) we can replace (1) and (2) with (6):
⟨integer⟩::={+⏐–}10{⟨digit⟩}n
1 or ⟨integer⟩::=[+⏐–]{⟨digit⟩}n1 (6)
Here, the braces represent repeated concatenation of the object within the braces with itself and the indicesspecify the upper and lower bounds of the number of repetitions.
A subscript of zero indicates that the enclosed item is not required (optional). The frequently encounteredoptional case with a superscript of 1 will be written as [...] rather than {...}1
0 as shown in (6) above. A superscriptwithout a subscript is used to indicate a required number of repetitions.
Terminal and non-terminal symbols are considered optional, either if their inclusion is entirely a matter ofchoice or preference or else if their use is required because of circumstances or the inclusion of related optionaldata. For example, ⟨date⟩ is frequently shown as optional [⟨date⟩] simply because it is required with the initial occur-rence of the group in which it is included and is only required thereafter when its value changes. If a required non-terminal group consists only of optional components, then at least one such component must be chosen.
Braces without indices will be used to group terms in a sequence. Parentheses inside angle-brackets “⟨(...)⟩”will occasionally be used to define a non-terminal symbol in plain language, where continued decomposition willnot lead to greater clarity.
CODE FORM
⟨code form⟩::=SEISMO⟨standard delimiter⟩⟨text⟩STOP
⟨standard delimiter⟩::=⟨b⟩::={(space)⏐(return)⏐(line feed)}n1
The ⟨standard delimiter⟩ is used to separate groups and subgroups. As it consists of any number or com-binations of spaces, carriage-returns and line-feeds, it also serves to indicate where lines of code may bebroken. Henceforth this delimiter is indicated by ⟨b⟩ and is shown only where required. Only single spacesare permitted in certain other positions which will be illustrated in the examples.
⟨text⟩::=[⟨message heading⟩]{⟨administrative messages⟩⏐⟨seismic data⟩}21
MESSAGE HEADING
⟨message heading⟩::=[⟨content designator⟩]⟨message number⟩[⟨originator⟩]
⟨content designator⟩::=GSE⟨gse code⟩⟨b⟩
⟨gse code⟩::=CR⏐DC⏐FB⏐NC⏐PA⏐PL⏐RP⏐RR⏐ST⏐XY (Refer to Definitions and usage)
⟨message number⟩::=N⟨last digit of year⟩⟨nnn⟩⟨b⟩
⟨last digit of year⟩::=0⏐1⏐2⏐3⏐4⏐5⏐6⏐7⏐8⏐9
⟨nnn⟩::=001⏐002⏐003...999
⟨nnn⟩ is the ordinal number from the first seismic message of the calendar year.
⟨originator⟩::=(([⟨gse test⟩]⟨message centre⟩[⟨transmission time⟩]))
⟨originator⟩ ought to be included only in those messages sent via the Global TelecommunicationSystem (GTS) of the World Meteorological Organization (WMO).
⟨gse test⟩::=GSE⟨(value to be specified by GSE for each ad hoc test)⟩
ATTACHMENT III
A–420 Volume I.1

⟨message centre⟩::=⟨(WMO GTS group TTAAii)⟩⟨b⟩
⟨transmission time⟩::=[19]⟨yymmdd⟩⟨b⟩⟨hhmm⟩⟨b⟩ (See Definitions and usage)
⟨yymmdd⟩::=⟨(6-digit year-month-day)⟩
⟨hhmm⟩::=⟨(4-digit hour-minute)⟩
ADMINISTRATIVE MESSAGES
⟨administrative messages⟩::={((⟨(free form and contents)⟩))⟨b⟩}n0
n = number of separate messages
SEISMIC DATA FORMAT OPTIONS
⟨seismic data⟩::={⟨single-station group form⟩}s1⏐⟨net-event group form⟩
s = number of stations reported
DATA ARRANGED BY STATION
⟨single-station group form⟩::=⟨station⟩[⟨report times⟩][⟨status code⟩][⟨process code⟩][⟨magnification⟩]
{[⟨date⟩]{⟨station-event⟩⏐⟨delimited station-event⟩}}e1
e = number of events reported
DATA ARRANGED BY SEISMIC EVENT
⟨net-event group form⟩::={⟨station⟩⟨report times⟩}s0[⟨status code⟩][⟨process code⟩][channel]{⟨net-event⟩⏐
⟨delimited net-event⟩}e1
e = number of net-events reported
⟨net-event⟩::={[⟨date⟩]{⟨station⟩[⟨process code⟩][⟨magnification⟩]{⟨station-event⟩⏐⟨delimited station-event⟩}⏐[⟨net⟩]⟨computations⟩}}n
1
n = number of stations reported(add 1 to n if a ⟨computations⟩ group is included)
⟨delimited net-event⟩::=BEGEV⟨b⟩⟨net-event⟩ENDEV
The content of a ⟨net-event⟩ never requires that the event be delimited. Whether or not an event is givenas a ⟨delimited net-event⟩ may depend strictly on the preference of the sender or receiver.
⟨station-event⟩::=[⟨first-arrival phase group⟩]{⟨secondary phase group⟩}n0 [⟨LP surface-wave group⟩]
[⟨old surface-wave group⟩][⟨event class⟩][⟨local magnitude data⟩][⟨comments⟩]
n = number of secondary phases reported
⟨delimited station-event⟩::=/⟨b⟩⟨station event⟩⟨b⟩/[⟨b⟩]
A ⟨station-event⟩ must be enclosed in solidi whenever its ⟨first-arrival phase group⟩ is either absent or con-tains more than one ⟨1st phase code⟩. A single solidus (/) cannot serve as both an ending and beginningdelimiter when two delimited station-events are adjacent. Two must separate the two station-events.
⟨computations⟩::={⟨hypocentre⟩⏐⟨magnitude⟩⏐⟨moment⟩}n1
PARAMETERS
The following parameters, once established, remain in effect until changed. All dates and times are UTC.
⟨station⟩::=[:]⟨(3–5 character station abbreviation)⟩⟨b⟩
⟨net⟩::=[:]⟨(3–5 character network abbreviation)⟩⟨b⟩
A colon (:) must be prefixed to a station or net abbreviation whenever the abbreviation is identical to aphase code or symbolic identifier used in the International Seismic Code.
⟨report times⟩::={⟨begin⟩⟨end⟩}{⟨out⟩⟨to⟩}n0
⟨report times⟩ may not be set within a ⟨net-event⟩.
ATTACHMENT III
A–421Volume I.1

⟨beg⟩::=BEG⟨b⟩⟨month⟩⟨day⟩⟨b⟩⟨hhmmss⟩⟨b⟩
⟨end⟩::=END⟨b⟩⟨month⟩⟨day⟩⟨b⟩⟨hhmmss⟩⟨b⟩
⟨out⟩::=OUT⟨b⟩⟨channels⟩⟨b⟩⟨month⟩⟨day⟩⟨b⟩⟨hhmmss⟩⟨b⟩
⟨channels⟩::={⟨instrument class⟩⟨components⟩⏐ALL}⟨b⟩
⟨instrument class⟩::=SP⏐LP⏐MP⏐BP⏐UP
⟨components⟩::=Z⏐ZN⏐ZNE⏐ZE⏐N⏐NE⏐E
⟨to⟩::=TO⟨b⟩⟨month⟩⟨day⟩⟨b⟩⟨hhmmss⟩⟨b⟩
⟨hhmmss⟩::=⟨(6-digit hour-minute-second)⟩
⟨date⟩::=[⟨year⟩]⟨month⟩⟨day⟩⟨b⟩
⟨year⟩::=YR19⟨(2-digit year)⟩⟨b⟩
⟨month⟩::=JAN⏐FEB⏐MAR⏐APR⏐MAY⏐JUN⏐JUL⏐AUG⏐SEP⏐OCT⏐NOV⏐DEC
⟨day⟩::=01⏐02⏐03...31
⟨status code⟩::=STAT{P⏐F}⟨b⟩
P = message contains preliminary interpretations and/or computationsF = message contains final interpretations and/or computations
The ⟨status code⟩ cannot be changed within a ⟨net-event⟩. It should be used especially by those contribu-tors sending preliminary interpretations and then sending revisions and more complete interpretationslater. Any data which are not the first set of interpretations for a reporting period for a given station are con-sidered final.
⟨process code⟩::=PROC{A⏐D⏐G}⟨b⟩ (Refer to Definitions and usage)
The following parameter, once established, remains in effect only until a station abbreviation is en-countered.
⟨magnification⟩::=[TRACE⏐GRND]{⟨SPZ magnification⟩⏐⟨SPH magnification⟩⏐⟨LPZ magnification⟩⏐⟨LPH magnification⟩}4
0
If double trace amplitudes are included in the current station’s data, inclusion of TRACE is strongly recommended, prefixing the required relevant channel magnification(s).
If all of the amplitudes reported for the current station are ground amplitudes, the sender may choose toinclude the channel magnification(s) for informational purposes only. If so, GRND is required.
See also under Definitions and usage for detailed discussion.
⟨SPZ magnification⟩::=⟨mk⟩K[C]
⟨SPH magnification⟩::=⟨mk⟩H[C]
⟨mk⟩::=⟨(magnification of SPZ or SPH instruments in thousands)⟩
⟨LPZ magnification⟩::=⟨m⟩M[C]
⟨LPH magnification⟩::=⟨m⟩J[C]
⟨m⟩::=⟨(magnification of LPZ or LPH instruments)⟩
The horizontal magnifications are required only if they differ from their respective vertical magnifications.The optional C is used to confirm that the indicated magnification represents a change from that previouslyreported by this station, for this component.
The following parameter (⟨channel⟩) is used to indicate the instrument type (class) and component fromwhich a phase and its associated measurements were obtained. ⟨channel⟩ may be changed within a ⟨station-event⟩ as often as necessary. However, once established (either explicitly or by default) within a ⟨station-event⟩, it remains in effect until changed or until the next ⟨station-event⟩ is encountered.
Since, within a given message, the overwhelming majority of the first phases reported within a⟨station-event⟩ will begin with data from the same ⟨channel⟩, a method of indicating this ⟨channel⟩ withoutrepeating the value of ⟨channel⟩ with each ⟨station-event⟩ is available. This default value is established using theoptional symbol “DEFAULT” as indicated below, with the first ⟨channel⟩ appearing in the message. This defaultmay be reset to a new value if necessary. This default value may be overridden for a given first phase reported
ATTACHMENT III
A–422 Volume I.1

within a ⟨station-event⟩ by simply including the correct ⟨channel⟩ value; the default value will be resumed withthe next ⟨station-event⟩ not beginning with ⟨channel⟩.
If no ⟨channel⟩ is given within the message, its value will be considered “unknown” unless implied by ampli-tudes available with the previous version of the seismic code.
⟨channel⟩::=⟨instrument class⟩⟨component⟩⟨b⟩[DEFAULT⟨b⟩]
⟨instrument class⟩::=⟨(See above under ⟨report times⟩)⟩
⟨component⟩::=Z⏐N⏐E
Z = vertical, N = north-south, E = east-west
BASIC SEISMIC DATA
The data covered in this section are obtained from both body and surface-wave recordings. In general, onlytheir syntax is given here. For a complete discussion of all the groups relating to periods and amplitudes, referalso to the Definitions and usage section.
As used in this specification of the seismic code, the term long-period (LP) is a generic term applied to datafrom intermediate-period (MP), broad-band (BP) and ultra long-period (UP) recordings as well as data from long-period recordings per se. This terminology is used herein simply to indicate that the forms and groups thataccommodate long-period data per se are used for MP, BP and UP data as well. However, the appropriate specific ⟨channel⟩ designators must be used in these various LP groups.
SCALING TIMES
⟨arrival time⟩::=[⟨2-digit hour⟩]⟨2-digit minute⟩⟨seconds⟩
⟨2-digit hour⟩::=00⏐01⏐02...23
The hour is required for the first ⟨arrival time⟩ reported within any ⟨station-event⟩ and whenever the hourchanges within a ⟨station-event⟩.
⟨2-digit minute⟩::=00⏐01⏐02...59
⟨seconds⟩::={⟨digit⟩}2[.][⟨digit⟩]⏐{⟨digit⟩}2.{⟨digit⟩}2
⟨arrival time⟩ must be given to at least the nearest whole second. Usually it is given to the nearest tenth ofa second when taken from SPZ. In either case the decimal point “.” is optional, but recommended.However, if given to hundredths of a second, the decimal point must be included.
⟨seconds⟩ should be quoted only to the precision actually obtained in scaling. However, in dealing with sur-face waves, the seconds may be filled with one or two zeros, if reasonable. Arrival times scaled from mostlong-period seismograms will generally not be legible to a precision closer than one second. However, theymay be given to a closer precision whenever it is obtainable.
A sixty-first second may be included when the scaling falls within a leap second.
⟨zero-crossing amplitude scaling time⟩::=⟨(Use the same rules that apply to ⟨arrival time⟩)⟩
This time is measured where the trace crosses the equilibrium point between the peak and trough thatcomprise the cycle whose amplitude was obtained.
PHASE CODES
The ⟨2nd phase code⟩ has been expanded to six characters. The clarity is not included in this limit.
Phases pP, pwP, pPcP, pPP, pS, etc. are encoded as AP, AWP, APCP, APP, AS, etc.; and sP, sPcP, sS,sSKS, etc. are encoded as XP, XPCP, XS, XSKS, etc.
The T-phase is encoded as TT to avoid confusion with T used as a symbolic prefix for periods.
Phase PKPPKPPKP (P´P´P´) is encoded as RRPKP, likewise PKPPKP (P´P´) is encoded as either PKPPKPor RPKP.
P´ and P* are alternative phase code designators for PKP and PB respectively. They are acceptable to com-puters processing seismic data, and may thus be exchanged by computer links or by air mail. However, “´” and“*” are generally not available to teletype circuits, so PKP and PB are the codes for teletype transmission evenif the originator’s circuit is capable of sending either “´” or “*”.
ATTACHMENT III
A–423Volume I.1

CLARITY OR ONSET QUALITY
⟨clarity⟩::=l⏐E⏐Q (See Definitions and usage)
⟨clarity⟩ is required if phase code is absent from a secondary phase.
PERIODS AND AMPLITUDES
⟨amplitude⟩
The amplitude units are not expressly given in a telegraphic message, but are implied by the channel fromwhich they were scaled and the presence or absence of a corresponding magnification field. A decimalpoint must be included in every amplitude value.
⟨period⟩
A decimal point must be included in every period value except in the long-period surface-wave groups andthe ⟨10–30 second noise⟩ group.
⟨LP maximum amplitude⟩::=XM[⟨(zero-crossing amplitude scaling time)⟩]⟨b⟩T⟨period⟩[G]A⟨amplitude⟩⟨b⟩
An LP maximum amplitude can be scaled for any phase. Occasionally, this amplitude may also meet thecriteria for the reporting of one of the several GSE amplitude groups. If a contributor is committed to sup-plying both groups but wishes to avoid duplication in this case, he may do so by using the optional “M”provided in the Rayleigh wave period-range designator of the ⟨gse Rayleigh amplitudes⟩ group and omit-ting the ⟨LP maximum amplitude⟩ group.
⟨SP maximum amplitude⟩::=XM[⟨(zero-crossing amplitude scaling time)⟩]⟨b⟩T⟨period⟩[G]A⟨amplitude⟩⟨b⟩
An SP maximum amplitude can be scaled for any body wave and the Lg phase. Occasionally, this ampli-tude may also meet the criteria for the reporting of one of the several GSE amplitude groups. If a con-tributor is committed to supplying both groups but wishes to avoid duplication in this case, he may do soby using the optional “M” provided in the P-coda interval-time designator of the gse SPZ first-arrival ampli-tudes group. Frequently, the SP maximum amplitude, scaled from recordings of intermediate or deep focusevents, will be found in the first few cycles. When this situation occurs, report the amplitude in the SP maximum amplitude group, or, if reporting ⟨gse SPZ first-arrival amplitudes⟩, report it as an XAM prefixedgroup.
FIRST MOTIONS
⟨first motion⟩::=FM[⟨SP 1st-motion(s)⟩][,⟨LP 1st-motion(s)⟩]
⟨SP 1st-motion(s)⟩::=[C⏐D][N⏐S][E⏐W]
⟨LP 1st-motion(s)⟩::=[C⏐D][N⏐S][E⏐W]
The short-period first-motion code(s), if any, are appended to the symbolic prefix FM. The long-period first-motion code(s), if any, together with their prefixed comma are appended to the ⟨SP 1st-motion(s)⟩ if itexists, or else directly to the FM. The comma (,) is required whenever LP first-motion codes are given.
Long-period, intermediate-period, broad-band or ultra long-period are indicated by the ⟨channel⟩ value. Ifa first-motion group included in any SP channel contains first-motion codes to the right of the comma, theyare simply considered generic LP first motions. Whenever LP, MP, BB or UP first motions are included ina first-motion group, a preceding comma is required.
FIRST-ARRIVAL PHASE GROUP
⟨first-arrival phase group⟩::=[⟨SP first-arrival phase group⟩][⟨LP first-arrival phase group⟩]
SHORT-PERIOD DATA
⟨SP first-arrival phase group⟩:: =[⟨SPZ 1st phase group⟩]{⟨SPH 1st phase group⟩}20
ATTACHMENT III
A–424 Volume I.1
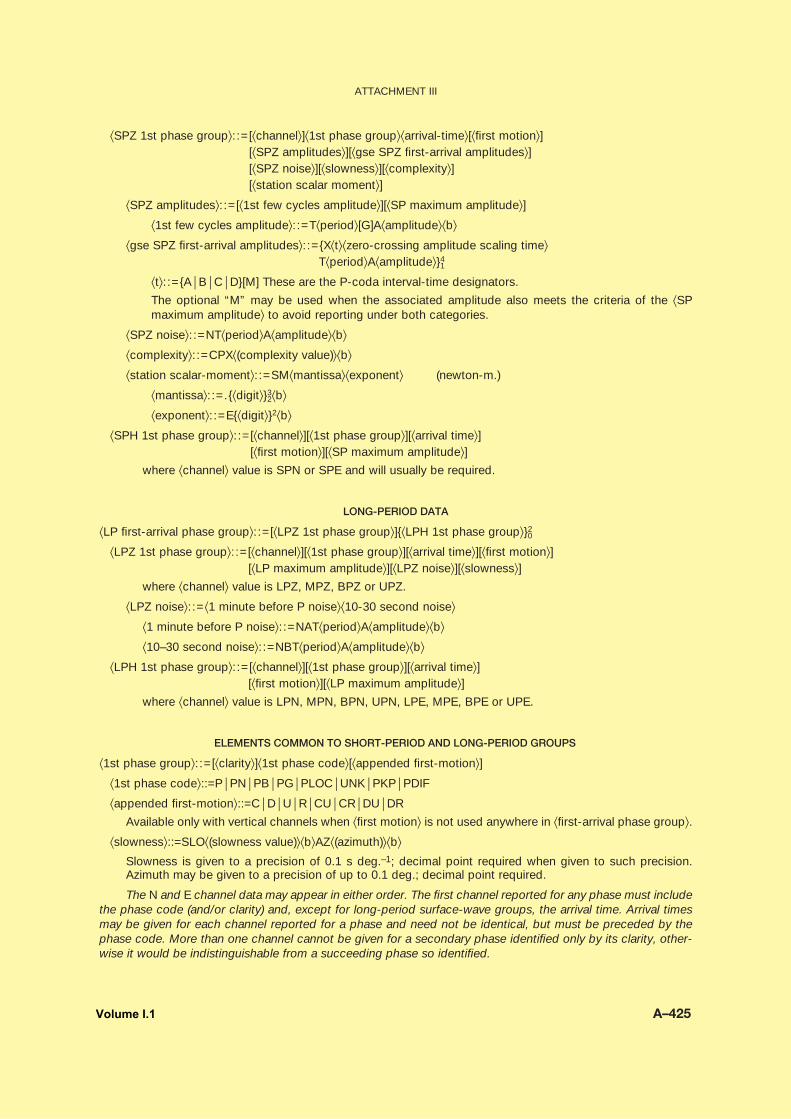
⟨SPZ 1st phase group⟩::=[⟨channel⟩]⟨1st phase group⟩⟨arrival-time⟩[⟨first motion⟩][⟨SPZ amplitudes⟩][⟨gse SPZ first-arrival amplitudes⟩][⟨SPZ noise⟩][⟨slowness⟩][⟨complexity⟩][⟨station scalar moment⟩]
⟨SPZ amplitudes⟩::=[⟨1st few cycles amplitude⟩][⟨SP maximum amplitude⟩]
⟨1st few cycles amplitude⟩::=T⟨period⟩[G]A⟨amplitude⟩⟨b⟩
⟨gse SPZ first-arrival amplitudes⟩::={X⟨t⟩⟨zero-crossing amplitude scaling time⟩T⟨period⟩A⟨amplitude⟩}4
1
⟨t⟩::={A⏐B⏐C⏐D}[M] These are the P-coda interval-time designators.
The optional “M” may be used when the associated amplitude also meets the criteria of the ⟨SP maximum amplitude⟩ to avoid reporting under both categories.
⟨SPZ noise⟩::=NT⟨period⟩A⟨amplitude⟩⟨b⟩
⟨complexity⟩::=CPX⟨(complexity value)⟩⟨b⟩
⟨station scalar-moment⟩::=SM⟨mantissa⟩⟨exponent⟩ (newton-m.)
⟨mantissa⟩::=.{⟨digit⟩}32⟨b⟩
⟨exponent⟩::=E{⟨digit⟩}2⟨b⟩
⟨SPH 1st phase group⟩::=[⟨channel⟩][⟨1st phase group⟩][⟨arrival time⟩][⟨first motion⟩][⟨SP maximum amplitude⟩]
where ⟨channel⟩ value is SPN or SPE and will usually be required.
LONG-PERIOD DATA
⟨LP first-arrival phase group⟩::=[⟨LPZ 1st phase group⟩]{⟨LPH 1st phase group⟩}20
⟨LPZ 1st phase group⟩::=[⟨channel⟩][⟨1st phase group⟩][⟨arrival time⟩][⟨first motion⟩][⟨LP maximum amplitude⟩][⟨LPZ noise⟩][⟨slowness⟩]
where ⟨channel⟩ value is LPZ, MPZ, BPZ or UPZ.
⟨LPZ noise⟩::=⟨1 minute before P noise⟩⟨10-30 second noise⟩
⟨1 minute before P noise⟩::=NAT⟨period⟩A⟨amplitude⟩⟨b⟩
⟨10–30 second noise⟩::=NBT⟨period⟩A⟨amplitude⟩⟨b⟩
⟨LPH 1st phase group⟩::=[⟨channel⟩][⟨1st phase group⟩][⟨arrival time⟩][⟨first motion⟩][⟨LP maximum amplitude⟩]
where ⟨channel⟩ value is LPN, MPN, BPN, UPN, LPE, MPE, BPE or UPE.
ELEMENTS COMMON TO SHORT-PERIOD AND LONG-PERIOD GROUPS
⟨1st phase group⟩::=[⟨clarity⟩]⟨1st phase code⟩[⟨appended first-motion⟩]
⟨1st phase code⟩::=P⏐PN⏐PB⏐PG⏐PLOC⏐UNK⏐PKP⏐PDIF
⟨appended first-motion⟩::=C⏐D⏐U⏐R⏐CU⏐CR⏐DU⏐DR
Available only with vertical channels when ⟨first motion⟩ is not used anywhere in ⟨first-arrival phase group⟩.
⟨slowness⟩::=SLO⟨(slowness value)⟩⟨b⟩AZ⟨(azimuth)⟩⟨b⟩
Slowness is given to a precision of 0.1 s deg.–1; decimal point required when given to such precision.Azimuth may be given to a precision of up to 0.1 deg.; decimal point required.
The N and E channel data may appear in either order. The first channel reported for any phase must includethe phase code (and/or clarity) and, except for long-period surface-wave groups, the arrival time. Arrival timesmay be given for each channel reported for a phase and need not be identical, but must be preceded by thephase code. More than one channel cannot be given for a secondary phase identified only by its clarity, other-wise it would be indistinguishable from a succeeding phase so identified.
ATTACHMENT III
A–425Volume I.1

ATTACHMENT III
A–426
SECONDARY PHASE GROUP
⟨secondary phase group⟩::=[⟨SP secondary phase group⟩][⟨LP secondary phase group⟩]
SHORT-PERIOD DATA
⟨SP secondary phase group⟩::=[⟨SPZ 2nd phase group⟩]{⟨SPH 2nd phase group⟩}20
⟨SPZ 2nd phase group⟩::=[⟨channel⟩][⟨2nd phase group⟩][⟨arrival time⟩][⟨first motion⟩][⟨SP maximum amplitude⟩]
⟨SPH 2nd phase group⟩::=[⟨channel⟩][⟨2nd phase group⟩][⟨arrival time⟩][⟨first motion⟩][⟨SP maximum amplitude⟩] [⟨gse SPH S-wave amplitude⟩]
⟨gse SPH S-wave amplitude⟩::=XA[M]⟨zero-crossing amplitude scaling time⟩⟨b⟩T⟨period⟩A⟨amplitude⟩⟨b⟩
available only if phase code is “S”. The optional “M” is used to indicate that the amplitude also meets thecriteria of the ⟨SP maximum amplitude⟩.
LONG-PERIOD DATA
⟨LP secondary phase group⟩::=[⟨LPZ 2nd phase group⟩]{⟨LPH 2nd phase group⟩}20
⟨LPZ 2nd phase group⟩::=[⟨channel⟩][⟨2nd phase group⟩][⟨arrival time⟩][⟨first motion⟩][⟨LP maximum amplitude⟩]
⟨LPH 2nd phase group⟩::=[⟨channel⟩][⟨2nd phase group⟩][⟨arrival time⟩][⟨first motion⟩][⟨LP maximum amplitude⟩][⟨gse LPH S-wave amplitude⟩]
⟨gse LPH S-wave amplitude⟩:: =XA[M]⟨zero-crossing amplitude scaling time⟩⟨b⟩T⟨period ⟩A⟨amplitude⟩⟨b⟩
available only if phase code is “S”. The optional “M” is used to indicate that the amplitude also meets thecriteria of the ⟨LP maximum amplitude⟩.
⟨2nd phase group⟩::={⟨clarity⟩⏐⟨2nd phase code⟩}21
LONG-PERIOD SURFACE-WAVE GROUPS
⟨surface-wave groups⟩::={⟨Love waves⟩}20{⟨Rayleigh waves⟩}3
0
LOVE WAVES
⟨Love waves⟩::=⟨channel⟩[⟨clarity⟩]⟨Love phase code⟩[⟨arrival time⟩][⟨Love mantle-wave amplitude⟩][⟨Love-wave maximum amplitude⟩]
where: ⟨channel⟩ is LPN, LPE, MPN, MPE, BPN, BPE, UPN or UPE.
⟨Love phase code⟩::={G⏐G1⏐LQ}⏐G2
⟨Love mantle-wave amplitude⟩::=T⟨period⟩A⟨amplitude⟩⟨b⟩
⟨Love-wave maximum amplitude⟩::=⟨LP maximum amplitude⟩
RAYLEIGH WAVES
⟨Rayleigh waves⟩::=⟨channel⟩[⟨clarity⟩]⟨Rayleigh phase code⟩[⟨arrival time⟩][⟨Rayleigh mantle-wave amplitude⟩][⟨Rayleigh max amplitude⟩][⟨gse Rayleigh amplitudes⟩]
⟨Rayleigh phase code⟩::={R⏐R1⏐LR}⏐R2
⟨Rayleigh mantle-wave amplitude⟩::=T⟨period⟩A⟨amplitude⟩⟨b⟩
⟨Rayleigh max amplitude⟩::=⟨LP maximum amplitude⟩
⟨gse Rayleigh amplitudes⟩::={X⟨p⟩⟨zero-crossing amplitude scaling time⟩⟨b⟩
Volume I.1

T⟨period⟩A⟨amplitude⟩}41
⟨p⟩::={A⏐B⏐C⏐D}[M] This is the Rayleigh wave period-range designator.
The optional “M” may be used when the associated amplitude also meets the criteria of the ⟨Rayleigh maxamplitude⟩ to avoid reporting under both categories. These designators are for data from vertical channelsonly, with the exception of B, which may also be used with horizontal components to report “20-second”wave data.
OLD SURFACE-WAVE GROUP
⟨old surface-wave group⟩::={{LZT⏐LNT⏐LET}⟨period⟩A⟨amplitude⟩⟨b⟩}30
where ⟨amplitude⟩ is applied to the “20-second” Rayleigh-waves from the Z, N or E components. Note thatthis group has been retained for upward compatibility only and one may continue to send data using thisgroup. For a discussion of how data in this group can be included in the groups new to this code, see thisheading under Definitions and usage.
LOCAL MAGNITUDE DATA
⟨local magnitude data⟩::={[⟨SP duration time⟩][⟨maximum local amplitude⟩]}n1
⟨SP duration time⟩::=[⟨channel⟩]⟨b⟩DUR⟨(total seconds)⟩⟨b⟩
where total seconds is measured between the first-arrival onset and the time the trace never again exceedstwice the noise level encountered immediately prior to the first arrival. Data are taken from an SP channel.Total seconds is used to compute duration magnitude.
⟨maximum local amplitude⟩::=[⟨channel⟩]{T⏐G}AMAX⟨(maximum amplitude)⟩
Scaled from a local event, when either the period cannot be measured or the amplitude assigned to a par-ticular phase. This amplitude must have been recorded by an SP instrument whose response is nearly con-stant over the period range within which the signal can be presumed to lie. If preceded by TAMAX theamplitude is a trace (not double-trace) amplitude in millimetres (mm). If preceded by GAMAX the amplitudeis a ground amplitude in millimicrons (mμ).
COMMENTS
⟨comments⟩::=((⟨(unformatted plain-language text)⟩))⟨b⟩
These comments contain information concerning the effects of the seismic occurrence to which the pre-ceding station event data pertain. When a hypocentre is included for the event, it is preferable that thecomments be given in the hypocentre comments, as a specific time can then be attached when processed.These comments may include:1. Macroseismic information such as: casualty, damage, intensity and other cultural effects and unusual
animal behaviour;2. Tsunami wave heights, damage, casualties and run-up data;3. information on artificial or induced events such as explosions, collapses, rockbursts, coal-bumps and
meteoritic impacts;4. Geological observations of associated faulting, uplift, eruptions, landslides, liquefaction, sand-boils,
earthquake lights, etc.
NETWORK COMPUTATIONS
⟨computations⟩::=[⟨hypocentre⟩][⟨magnitude⟩][⟨moment⟩]
⟨hypocentre⟩::=FOCUS⟨b⟩⟨origin-time⟩LAT⟨b⟩⟨latitude⟩LON⟨b⟩⟨longitude⟩[DEP⟨b⟩⟨depth⟩][NS⟨number of stations⟩][((⟨hypocentre comments⟩))⟨b⟩]
⟨hypocentre⟩ may be used to transmit rough hypocentres obtained from slowness and azimuth as well ascomputations using arrival-times from a net. If a slowness-derived hypocentre has been given, “SLO”should appear in the hypocentre comments. It may also be used to transmit rockburst and explosion coor-dinates, with appropriate hypocentre comments.
ATTACHMENT III
A–427Volume I.1

⟨origin time⟩::=⟨hour⟩⟨minutes⟩⟨seconds⟩.[⟨tenths⟩][⟨hundredths⟩]⟨b⟩
⟨latitude⟩::={⟨digit⟩}21.{⟨digit⟩}3
0{N⏐S}⟨b⟩
⟨longitude⟩::={⟨digit⟩}31.{⟨digit⟩}3
0{E⏐W}⟨b⟩
⟨depth⟩::={⟨digit⟩}31.{⟨digit⟩}1
0[FIX]⟨b⟩
where FIX indicates a fixed-depth solution.
⟨number of stations⟩::={⟨digit⟩}41⟨b⟩
⟨magnitude⟩::=MAG⟨b⟩{[⟨magnitude type⟩]}⟨magnitude value⟩[⟨distance estimate⟩][T⟨(average period of waves used)⟩][NS⟨number of stations⟩]
⟨magnitude type⟩::=ML⏐MS⏐MSZ⏐MSH⏐MB⏐MBSH⏐MW⏐MBW⏐MBLG⏐MSRG⏐MD⏐...
where:ML Richter (local) magnitude (ML)MS IASPEI formula Rayleigh wave (Ms)MSZ IASPEI formula Z-component Rayleigh waveMSH IASPEI formula H-component Rayleigh waveMB Gutenburg-Richter body-wave magnitude (mb)MBSH G-R body wave from horizontal SMW Moment magnitude (Mw)MBW Moment magnitude (mw)MBLG Nuttli’s mb from LgMSRG Nuttli’s Ms from RgMD Duration magnitude
This magnitude list is not comprehensive. Additional magnitude types and their appropriate symbolsmay be included.
⟨magnitude value⟩::=⟨digit⟩.{⟨digit⟩}21⟨b⟩
⟨distance estimate⟩::=D⟨(distance estimate in degrees)⟩
⟨moment⟩::=MOM⟨mantissa⟩⟨exponent⟩[NS⟨number of stations⟩]
⟨mantissa⟩::=.{⟨digit⟩}32⟨b⟩
⟨exponent⟩::=E{⟨digit⟩}2⟨b⟩ (newton-m.)
DEFINITIONS AND USAGE
The sequence in which subjects are introduced in this section corresponds to the order in which they arefound in the code form. Those subjects treated adequately in the code form will not be dealt with further in thissection.
MESSAGE HEADING
⟨gse code⟩
The gse code used in the message heading is primarily intended for transmissions to and from data centres via the Global Telecommunication System of the World Meteorological Organization. Use of this codeearly in the message permits the receiving computer to determine the contents of the message without decod-ing past the heading.
The gse codes and their definitions follow:CR Coordinator messageDC Data centre messageFB Final event bulletin from IDCNC Request by a national centre (or station)
ATTACHMENT III
A–428 Volume I.1

PA Parameter message to IDC (includes measurements of seismic signals)PL Preliminary event list from IDCRP Retransmission of PA messageRR Request retransmission of PA messageST Status or other administrative messageXY Reserved for other messages to be defined by GSE as needed
⟨originator⟩
This group ought to be included only in messages sent via WMO/GTS circuits. The ⟨message centre⟩ codeis the GTS data/geographical designator. The ⟨transmission time⟩ should indicate the time the message wasoriginally transmitted. This field could be completed by the teletypist. If this is a problem, the time that the message is to be given to the sender’s message centre could be used.
SEISMIC DATA FORMAT OPTIONS
⟨single-station group form⟩
With data arranged by station, all of the data for one station for its reporting period are given and they arethen followed by data from the next station, etc.
Data arranged by station are further ordered by increasing first reported arrival time (which is usually thefirst-arrival time) for each seismic event reported.
⟨net-event group form⟩
When data are arranged by event, all of the data from several stations pertaining to one seismic event aregiven, followed by such data from the next event, etc. A net event may include net computations such ashypocentres and magnitudes. On the other hand each event may consist of only hypocentre computations, inwhich case the report is reduced to an event list.
Data arranged by event is the usual method of sending data from local networks reporting mostly data pertaining to local events and their computational results. Reporting trace amplitudes with data arranged byevent is awkward, as the station’s magnification must be given each time the station appears with an amplitude.The net computations may appear anywhere within an event.
A contributor sending data arranged by event may wish, occasionally, within a message, to include dataarranged by station. It may be that these data belong to two or more teleseisms mixed together on the records,or he may wish to treat local and teleseismic data differently.
⟨delimited net-event⟩ is strictly optional.
⟨delimited station-event⟩
A ⟨station-event⟩ must be enclosed with solidi when the following conditions are met:1. A legitimate first-arrival is not available for the ⟨station-event⟩. It could be missing because of a recording
interruption or it may happen when a weak local event yields only a legible Sg or Lg. Also a high-gain long-period station may be able to send only surface-wave data for smaller events.
2. A first-arrival time from more than one channel has been included.3. Whenever there is likely to be some question as to whether two sequentially reported phases belong to the
same seismic event.This ambiguity is seen when two different phase codes, both of which may be reported as first-arrivals, follow each other closely enough in time. For example, a station could record a Pn from a distant regionalevent, and then, before recording its associated secondary phases, a Pg and Sg from a nearby local couldbe recorded. Currently, computer programs decoding the resultant seismic message must resort toassumptions based on generalized travel-time tables to attempt to discern the proper relation. Note alsothat a P preceding a Pn by a few seconds could belong either to the same event as the Pn or to a tele-seism. Therefore, as a general rule,
station-events which include P-type crustal phases should be delimited.4. Whenever a secondary arrival-time or amplitude scaling time follow the first-arrival time by more than
66 minutes.This precautionary requirement is necessary for the receiver to distinguish such data from cases wheredata have been lost or delimiters forgotten.
ATTACHMENT III
A–429Volume I.1

PARAMETERS
⟨report times⟩
⟨beg⟩ and ⟨end⟩ are used to indicate the beginning and ending times of the recording period covered bythe message for each station. If the data comprise strictly an event list, these times will indicate the range intime represented by the event list.
⟨out⟩ and ⟨to⟩ are used to delimit periods of interruption in the recording period covered by ⟨beg⟩ and ⟨end⟩.⟨out⟩ and ⟨to⟩ groups may be repeated as often as needed. The ⟨instrument class⟩ and ⟨components⟩ groupsindicate which instruments were not recording. If all instruments were out, “ALL” is used.
⟨process code⟩
The process code indicates the combination of recording and scaling techniques employed to obtain thearrival times (and perhaps amplitudes) reported for the associated station.
The three process codes are:A The measurements were primarily obtained from analog recordings on paper or film, by an interpreter using
visual and perhaps mechanical techniques. This is the default case – if no process code is given, “A” willbe assumed.
D The data were recorded digitally or were originally analog recordings that have been digitized by computer. In addition, the arrival times (and perhaps amplitudes) were obtained solely by automatic param-eter extraction.
G The data were recorded digitally or were originally analog recordings that have been digitized by computer. In addition, man-machine interactive methods utilizing a graphics screen showing wave-formswere used. The techniques used for process code D could have been employed in an early phase of thisprocedure.
⟨magnification⟩
See below under Periods, amplitudes and magnifications.
BASIC SEISMIC DATA
PHASE CODES
A phase code and/or a clarity code must accompany each arrival time reported. The first reported arrivaltime within each station event must be identified by a phase code.
RELATIVE IMPORTANCE OF SECONDARY PHASES
The most important secondary phases for hypocentre estimation are those which give an indication of thedepth of focus. These include pP encoded as AP, pwP encoded as AWP, sP encoded as XP, pPKP encoded asAPKP, Pg encoded as PG and Lg encoded as LG. Also of great value are S phases for local and regional shockswhen their onset can be read accurately enough to yield a check on the computed origin time. They are especiallyvaluable for analysing local and regional shocks with deeper than normal foci. When a large-magnitude shock is toodeep to propagate significant surface waves, the amplitude of long-period S assumes greater importance.
Any strong phase following teleseismic P by less than 2 min 30 s, which might be a pP but which the in-terpreter does not wish to identify definitely as pP, should be encoded with a clarity of “e” or “i” (followed bythe arrival time). A pPcP and/or sPcP together with PcP will yield depth information at epicentral distances toosmall to record pP or sP. The same considerations apply to ScP, PcS and ScS.
Phases which are generally prominent on short-period vertical instruments which are of some value inhypocentre estimation include PcP, ScP, PKKP and SKP. Identification of these phases by some stations mayaid in the identification of these same phases from other stations which have reported them as P. Such phases as PP, PPP, SS, SSS, SP, PgPg, etc. are generally of lesser value in routine hypocentre work.
Phases closely following P, which have much larger amplitudes than P, may indicate a multiple or complexevent. If their arrival times can be scaled accurately, they should be reported preceded by a clarity code (thesemay also include breakout or stopping phases), or they may be encoded as separate shocks if the interpretersuspects this is the case. In any case all significant increases in the SPZ amplitudes of complex-multiple eventsshould be reported either as individual SP maximum amplitudes or as one or more of the gse SPZ first-arrivalamplitudes.
ATTACHMENT III
A–430 Volume I.1

CLARITY OR ONSET QUALITY
Clarity is the observer’s estimation of the accuracy to which the associated arrival time has been measured.
The clarity codes are:I indicates an accuracy to within ± 0.2 second.E indicates an accuracy to within ± 1.0 second.Q indicates a less accurate measurement.
These limits are, in general, most appropriately applied to the first-arrival, and must be relaxed somewhatfor many secondary phases.
As the “shape” of the wave at the onset is a function of the transport speed of the drum or film and tracewidths, the “character” of the onset is not as useful as the observer’s indication of the timing accuracy, whichalso may reflect the accuracy of the chronometer.
it is difficult to establish firm clarity limits for secondary phases. For example, an accuracy of 1.0 secondmay rate an I for a teleseismic S, but only an E or a Q for an S recorded locally by a modern network.
PERIODS, AMPLITUDES AND MAGNIFICATIONS
A number of additional amplitude measurements may now be reported. Before discussing each individually, the general rules for reporting amplitudes, especially their units, will follow. In the past, reporting ofamplitude measurements has caused considerable confusion and undoubtedly resulted in the entry of erroneous data into the databases of several seismic centres.
The period is the apparent or dominant period of the wave whose amplitude is given.
Amplitude measurements are given either in double trace amplitudes in millimetres (mm) or as groundamplitudes whose units depend on the channel from which they were scaled (see definition of ⟨channel⟩ underParameters, in the Code form).
Amplitude data from a given station must be either double trace (with rare exceptions because of record-ing off-scale) or all ground amplitudes.
Double trace-amplitude measurements can be defined as either:peak-to-trough deflection for symmetrical waves, or,twice centre-to-peak for symmetrical or asymmetrical waves, where centre means base-line, zero-lineor equilibrium.
Double trace amplitudes in millimetres (mm) may be given for any reportable amplitude group. When double trace amplitudes are given, the channel magnification should be given and it is strongly re commendedthat the magnification include the TRACE symbol.
Ground amplitudes scaled from an SP channel must be given in nanometres (nm).
Ground amplitudes scaled from an LP channel must be given in micrometres (μm).
Thus effectively, all reportable surface-wave amplitudes, except Lg scaled from SPZ, and all long-periodbody-wave amplitudes will be given in micrometres (μm) as well as the two LP noise amplitudes when groundamplitudes are given.
⟨magnification⟩
The standard magnification is that magnification, at the nominal period, to which the instrument magnifi-cation factor is normalized to 1. The period to which magnifications are normalized varies with the instrumenttype, but is generally one second for short-period instruments and that period at which the instrument magnifi-cation peaks for long-period instruments.
It is strongly recommended that ground amplitudes be furnished by all. However, contributors sendingdouble trace amplitudes must obtain them from standardized instruments for which the response character-istics are known to the receiver, and they must have informed the receiver of their intention prior to transmissionof such data.
Although the ⟨magnification⟩ is optional when the recipient is known to have a record of the current oper-ating magnification(s) of the instruments from which double trace amplitudes have been supplied, it is stronglyrecommended that they be included. If a magnification has been changed since the last report, the new magnification is required and should have a C appended to the K or M identifier to confirm this fact. A station
ATTACHMENT III
A–431Volume I.1

should not commence sending amplitudes until it has first informed the recipient(s) of the type of amplitudes(double trace or ground) that it intends to send. If double trace amplitudes are to be sent, the type of standard-ized instrument(s) and their magnifications must be supplied.
[G]
A station which routinely reports double trace amplitudes (from the channels for which they furnish mag-nifications) may wish to substitute ground amplitudes from recordings which did not go off-scale (clip) whilerecording a large earthquake – data from a low magnification SPZ when a 200K WWNSS SPZ clipped, for exam-ple.
To substitute a ground amplitude where a double trace amplitude would ordinarily be expected, prefix theground amplitude with GA rather than A. This substitution is available for the 1st few cycles amplitude, the SPmaximum amplitude, the LP maximum amplitude, and the Rayleigh and Love-wave maximum-amplitudegroups.
⟨zero-crossing amplitude scaling times⟩
This field is available for all groups containing amplitudes except the 1st few cycles amplitude, the threenoise groups, and the ⟨maximum local amplitude⟩ defined under local magnitude data.
This time is measured where the trace crosses the equilibrium point between the peak and trough thatcomprise the cycle whose amplitude was reported.
P–WAVE AMPLITUDES
⟨1st few cycles amplitude⟩
This amplitude is scaled from the first “few” cycles following the onset of the first-arrival, recorded on SPZchannels only. The associated period must lie between 0.1 and 3.0 seconds and the decimal point is required.
⟨SP maximum amplitude⟩
This amplitude is taken from the largest amplitude in the P-wave coda recorded on SPZ channels.However, it must be obtained before the arrival of another clear phase such as pP, sP, PcP or PP. This is gen-erally the most important SPZ scaling of the P-wave amplitude. This group, as all maximum-amplitude groups,is designated by the prefix XM. No precise period range has been defined for SP maximum amplitudes.However, the period must include a decimal point.
⟨gse SPZ first-arrival amplitudes⟩
These amplitudes are each obtained from the maximum SPZ P-wave amplitude found within specifiedtime-intervals of the P-wave coda. They must be reported only before the arrival of the next clear phase.However, they are reported even if the coda amplitude is, in general, decaying. No precise period range hasbeen defined for these amplitudes. However, the periods must include a decimal point.
The P-coda interval-time designators prefixing these fields are:XA[M] 0–6 seconds after P-wave onsetXB[M] 6–12 seconds after P-wave onsetXC[M] 12–18 seconds after P-wave onsetXD[M] 18–300 seconds after P-wave onset
where the optional M is used to indicate that the amplitude also meets the criteria of the SP maximum amplitude.
⟨LP maximum amplitude⟩
This amplitude is taken from the largest amplitude in the P-wave coda recorded on an LPZ channel. It mustbe obtained before the arrival of another clear phase. This amplitude is generally the most important P-waveamplitude recorded from large intermediate or deep focus events. No precise period range has been defined forLP maximum amplitudes; however, the period must include a decimal point even though periods greater than9.9 seconds must be reported to the nearest second (e.g. 10.).
AMPLITUDES FROM THE HORIZONTAL COMPONENTS OF P
SP and LP maximum amplitudes for P may be reported from SPH and LPH channels respectively.However, to be most useful they must be obtained from matched horizontal channels and be measurements ofthe same cycle. Horizontal P-wave amplitudes are chiefly of interest when the vertical channels are unavailableor off-scale.
ATTACHMENT III
A–432 Volume I.1

SECONDARY PHASE AMPLITUDES
Although the code allows for maximum trace amplitudes from any channel of any secondary phase, thereare only a few from which data are sought. Chief among these are S, Lg and Rg. Although Lg and Rg are sur-face waves, they require the same format as the secondary body waves.
⟨SP maximum amplitude⟩
This amplitude is taken from the largest amplitude in the coda of the phase being measured. For regionalearthquakes with foci in the upper crust and a continental propagation path, the amplitude of the Lg from theSPZ is important.
⟨gse SPH S-wave amplitude⟩
This amplitude is the largest SPN/SPE amplitude found within the first ten seconds of the S-wave andshould be reported from both horizontal components. The respective zero-crossing amplitude scaling timesshould not differ by more than one-half the signal period. For large, shallow-focus earthquakes this amplitudewill generally not correspond to the maximum for S.
⟨LP maximum amplitude⟩
This amplitude is taken from the largest amplitude in the coda of the phase. For regional earthquakes with fociin the upper crust and a continental path, the amplitude of the Rg from the SPZ is important in some localities.
⟨gse LPH S-wave amplitude⟩
This amplitude is the largest LPN/LPE amplitude found within the first 40–60 seconds of the S-wave. Therespective zero-crossing amplitude scaling times should not differ by more than one-half the signal period.
LONG-PERIOD SURFACE-WAVE AMPLITUDES
Please note that for all long-period surface-wave groups (other than the old surface-wave group) the ⟨channel⟩ and phase codes are required. The ⟨channel⟩ must be given even if it is the same as that of the preceding phase.
LOVE WAVES
⟨mantle-wave amplitude⟩
This group is measured for large earthquakes, will have a period in the neighbourhood of 200 seconds andshould be reported from both components. This group is not prefixed.
⟨Love maximum amplitude⟩
This group is obtained from the maximum trace amplitude observed in the Love-wave train, regardless ofperiod, and should be reported from both components. This group is prefixed by XM.
RAYLEIGH WAVES
Data from the vertical components in these groups are emphasized.
⟨Rayleigh mantle-wave amplitude⟩
This group is measured for large earthquakes and will have a period near 200 seconds.
⟨Rayleigh max amplitude⟩
This group is obtained from the maximum trace amplitude observed in the Rayleigh-wave train regardlessof period. For continental paths, this period might well be near 15 seconds. This group is prefixed with XM.
⟨gse Rayleigh amplitudes⟩
The four amplitudes are each obtained from the maximum trace amplitude associated with waves of theirrespective period range. They need not all be present to report one or more.
The Rayleigh-wave period-range designators are:XA[M] 36–44-second wavesXB[M] 27–33-second wavesXC[M] 18–22-second wavesXD[M] 09–11-second waves
ATTACHMENT III
A–433Volume I.1

where the optional M is used to indicate that the amplitude also meets the criteria of the ⟨Rayleigh max ampli-tude⟩. These intervals are available for vertical channels only, with the exception of XC[M], which may be usedfor the horizontal “20-second” waves as well.
OLD SURFACE-WAVE GROUP
As this group has been retained in the seismic code to maintain upward compatibility, it is hoped that suchdata will be sent using the new forms available. Here is how the “20-second” Rayleigh waves may be sent using⟨Rayleigh wave⟩:1. If the period is between 17 and 23 seconds inclusive, and the amplitude is the maximum LPZ trace ampli-
tude in the Rayleigh-wave train, use ⟨Rayleigh max amplitude⟩, employing the appropriate channel codes.The period and amplitude for each component will thus be prefixed with XM.
2. If the period lies between 18 and 22 seconds inclusive, but the amplitude is not the maximum LPZ traceamplitude in the Rayleigh-wave train, use ⟨gse Rayleigh amplitudes⟩ for each component, employing theappropriate channel codes. The period and amplitude for each group will thus be prefixed with XC.
3. If the period is either 17 or 23 seconds but not as in 1. above, do not report it.
NOISE AMPLITUDES
⟨SPZ noise⟩
The short-period noise amplitude is taken from the SPZ channel and is the maximum amplitude with a period either between 0.2 and 1.0 second or close to that of the signal, found within 30 seconds before theonset of the first arrival.
⟨1 minute before P noise⟩
This noise amplitude is taken from the LPZ channel and is the maximum amplitude with a period between2.0 and 8.0 seconds found within one minute before the onset of the first arrival. The period should include adecimal point even if reported to the nearest second.
⟨1–30 second noise⟩
This noise amplitude is taken from the LPZ channel and is the maximum amplitude with a period between10–30 seconds found within five minutes before the onset of the first arrival. The period should be reported tothe nearest second.
FIRST MOTIONS
Generally, first motions will be reported only for the first arrival and then only when clear. However, if a Pgfollowing a Pn is clear, its first motion may be reported with that phase – likewise that of pP when clear.
⟨appended first motion⟩
This field has been retained only for the sake of upward compatibility (see Introduction). It contains theshort-period and/or long-period vertical first motions only. This field is found appended to the first-arrival phasecode. Long-period compressions must be reported in this group as U and dilatations as R. It is strongly recommended that the ⟨first motion⟩ field be used instead of the ⟨appended first motion⟩.
⟨first motion⟩
This group has been introduced to facilitate the reporting of first motions from any channel, to make thereporting of compressions (C) and dilatations (D) uniform and to allow reporting of first motions from secondaryP-type phases when desirable.
The ⟨first motion⟩ field consists of the symbolic prefix “FM” followed by the optional short-period firstmotions which is followed by the optional long-period first motions. The first character of the LP first-motiongroup is always a comma. Within each short- and long-period group the vertical component is given first, followed by the north-south and then east-west components. Any component may be absent, and corre-sponding long- and short-period components need not have the same directions.
The reported ⟨first motion⟩ field may be associated with any channel and generally it will be includedwith the SPZ channel data. However, when SPZ channel data are not reported, it may be associated withanother channel. Also, since “long-period” is used as a generic term to indicate not only long-period but
ATTACHMENT III
A–434 Volume I.1

also intermediate-period (MP), broad-band (BP) and ultralong-period (UP) instruments, the contributor whowishes to make these long-period distinctions or to report first motions from several of these may do so byincluding this field with any channel of the appropriate class.
LOCAL MAGNITUDE DATA
When a local earthquake has been recorded, if individual phases are recognizable, their maxima may bereported using ⟨SP maximum amplitude⟩. Amplitudes from P and S from subcrustal events, and such crustalphases as Pn, Pg, Sg from crustal foci, may be reported in this manner.
However, when individual phases cannot be discerned or the period of the signal accurately measured, the⟨maximum ground amplitude⟩ can be given for one or more components. This value will necessarily be a roughestimate if an associated period must be adopted.
⟨SP duration time⟩ may also be used in this case. However, it may also be used not only when the record-ing has clipped, but also for any local event where a suitably calibrated formula exists.
SECONDARY PHASE GROUP
A ⟨secondary phase group⟩ is specified for each secondary phase reported that is a body wave or Lg orRg. All of the data for each secondary phase reported are thus given before data for the next secondary phasewithin a station-event appear.
EXAMPLES OF TELEGRAMS
SINGLE-STATION GROUP FORM
The first example shows a message in which the data are arranged by station. The first station, ALQ, supplied data using nearly all the new forms made available by this edition of the code form. The second station, TUC, employed many of the new forms, but in general did not supply gse first-arrival or gse Rayleighamplitudes.
SEISMO GSEPA N5119 ((GSEXY SEXX1 850502 1445)) ALQ BEG APR30 141512 END MAY02 141522OUT ALL MAY01 140816 TO MAY01 141522 OUT MAY02 140322 TO MAY02 141116 STATP PROCATRACE 200K 3000M APR30 SPZ DEFAULT IPKP1606350 FMD T1.0A7.9 NT1.0A1.0 LPZ NAT7.7A2.0 SPZI06440 LPZ EPP0840 EPPP1056 LPE ESKS1337 LPZ ESKKP2001 LPE ESS2528 ESSS2940 LPE LQXM4112 T44A77 LPN XM T44A37 LPZ LR XAM4728 T41A112 XB4848 T30A70 XC5710 T20A56 LPE XCT20A52 LPN XC T20A47 EP225837.5 T1.5A8.0 IP225845.8 FMC T1.8A39.5 XA5851.0 T1.5A24.5 XB5858.0T1.5A45.0 XC5901.9 T0.9A50.0 XDM5939.4 T1.1A302 NT1.0A0.3 LPZ NAT7.3A3.5 SPE ES230819.0XM0903 T6.5A63.0 XA0827 T6.0A9.0 SPN XM0902 T6.5A38.5 XA T6.1A5.0 BPZ LR XM2740 T28GA54MAY01 IP105316.8 FMCW,CNW XA5327.8 T1.1A31.0 XB5336.0 T1.1A31.0 XCM5333.3 T1.2A37.8XD5344.0 T1.4A37.0 LPZ XM T15A38.0 NAT8.0A2.0 SPZ I5409.3 IPP5610.2 EPPP5803.5 SPNES110253.0 XM T6.0A11.0 SPE ES0254.0 XM T6.0A8.0 LPN ES0256.0 XM T20A85.0 LPE ES0256.0 XMT20A64 ESS0742 ESSS1121 SPZ EPKPPKP2040.8 ESKPPKP2417 LPE LQ XM1408 T31A73 LPN XMT32A40 LPZ LR XB1942 T32A103 XCM2124 T20A286 LPN XC T20A218 LPE XCM T20A139 IPG 1459084FMC ((ROCKBURST 31 DEG 14.6 MIN N, 111 DEG 2.42 MIN W 3 INJURED)) / ELG 150116.3 / IPLOCDUR126
TUC BEG APR30 151000 END MAY01 151000 OUT MPZNE APR30 151000 TO MAY01 151000 PROCGGRND IP1752303 FMC,C XM T0.8 A30.0 SLO6.84 AZ357 LPZ SLO7.0 AZ355 SPZ I52530 LPZ LR XMT31A100 LPN XM T32A99 LPE XM T32A00 / LPZ PDIF2355110 SPZ PKP2358101 I58452 ISKP00011401/ MAY01 QP003742 IUNK0123456 IP0200373 XM T2.9 A43.6 IAP00552 EAWP00581 EXP01042 /IPN041922.66 FMC,D IPB19252 FMD SPE IPG1930.1 FMCNE SPN ISN19558 ISB20024 SPZ ELG2006XM2021 T1.2 A14.6 MAG ML5.8 D2.1 DR5.6 ((DAMAGE VII YUMA)) / IP0606150 FMC,C XM0606155 T1.0A22.6 SPN ES09060 SPZ IPCP10521 IAPCP11280 EXPCP11520 ESCP14080 STOP
ATTACHMENT III
A–435Volume I.1
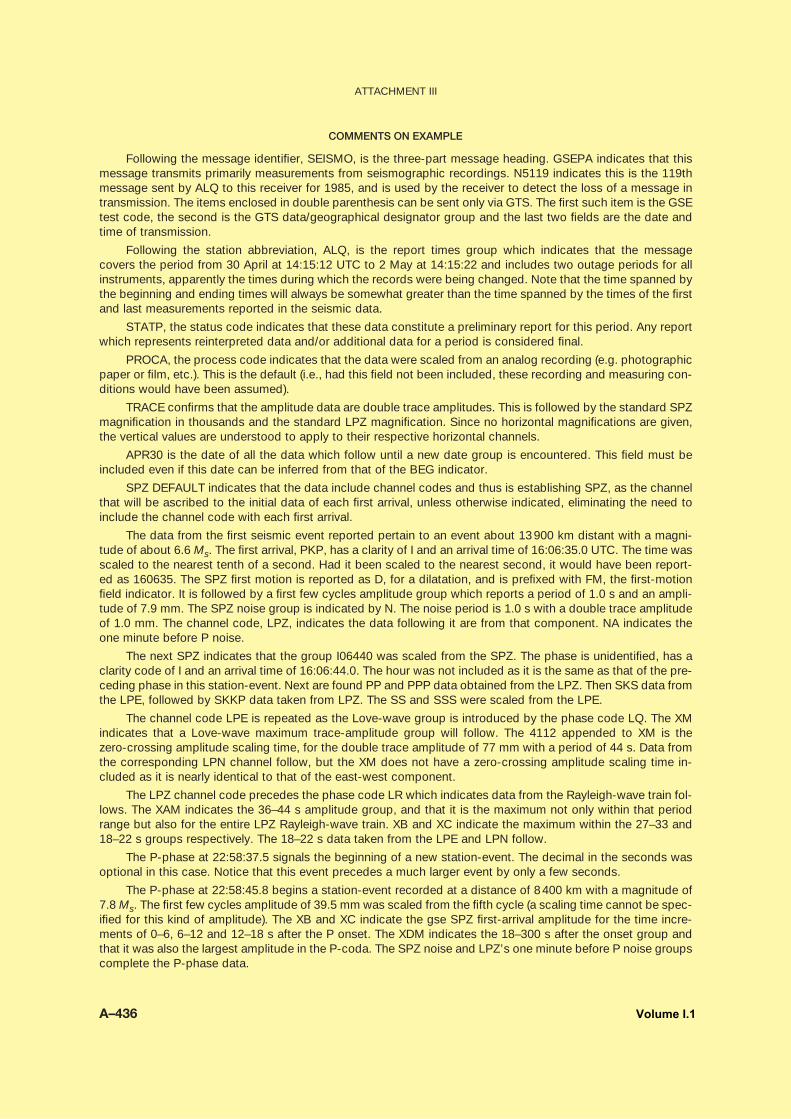
COMMENTS ON EXAMPLE
Following the message identifier, SEISMO, is the three-part message heading. GSEPA indicates that thismessage transmits primarily measurements from seismographic recordings. N5119 indicates this is the 119thmessage sent by ALQ to this receiver for 1985, and is used by the receiver to detect the loss of a message intransmission. The items enclosed in double parenthesis can be sent only via GTS. The first such item is the GSEtest code, the second is the GTS data/geographical designator group and the last two fields are the date andtime of transmission.
Following the station abbreviation, ALQ, is the report times group which indicates that the message covers the period from 30 April at 14:15:12 UTC to 2 May at 14:15:22 and includes two outage periods for allinstruments, apparently the times during which the records were being changed. Note that the time spanned bythe beginning and ending times will always be somewhat greater than the time spanned by the times of the firstand last measurements reported in the seismic data.
STATP, the status code indicates that these data constitute a preliminary report for this period. Any reportwhich represents reinterpreted data and/or additional data for a period is considered final.
PROCA, the process code indicates that the data were scaled from an analog recording (e.g. photographicpaper or film, etc.). This is the default (i.e., had this field not been included, these recording and measuring con-ditions would have been assumed).
TRACE confirms that the amplitude data are double trace amplitudes. This is followed by the standard SPZmagnification in thousands and the standard LPZ magnification. Since no horizontal magnifications are given,the vertical values are understood to apply to their respective horizontal channels.
APR30 is the date of all the data which follow until a new date group is encountered. This field must beincluded even if this date can be inferred from that of the BEG indicator.
SPZ DEFAULT indicates that the data include channel codes and thus is establishing SPZ, as the channelthat will be ascribed to the initial data of each first arrival, unless otherwise indicated, eliminating the need toinclude the channel code with each first arrival.
The data from the first seismic event reported pertain to an event about 13900 km distant with a magni-tude of about 6.6 Ms. The first arrival, PKP, has a clarity of I and an arrival time of 16:06:35.0 UTC. The time wasscaled to the nearest tenth of a second. Had it been scaled to the nearest second, it would have been report-ed as 160635. The SPZ first motion is reported as D, for a dilatation, and is prefixed with FM, the first-motionfield indicator. It is followed by a first few cycles amplitude group which reports a period of 1.0 s and an ampli-tude of 7.9 mm. The SPZ noise group is indicated by N. The noise period is 1.0 s with a double trace amplitudeof 1.0 mm. The channel code, LPZ, indicates the data following it are from that component. NA indicates theone minute before P noise.
The next SPZ indicates that the group I06440 was scaled from the SPZ. The phase is unidentified, has aclarity code of I and an arrival time of 16:06:44.0. The hour was not included as it is the same as that of the pre-ceding phase in this station-event. Next are found PP and PPP data obtained from the LPZ. Then SKS data fromthe LPE, followed by SKKP data taken from LPZ. The SS and SSS were scaled from the LPE.
The channel code LPE is repeated as the Love-wave group is introduced by the phase code LQ. The XMindicates that a Love-wave maximum trace-amplitude group will follow. The 4112 appended to XM is thezero-crossing amplitude scaling time, for the double trace amplitude of 77 mm with a period of 44 s. Data fromthe corresponding LPN channel follow, but the XM does not have a zero-crossing amplitude scaling time in-cluded as it is nearly identical to that of the east-west component.
The LPZ channel code precedes the phase code LR which indicates data from the Rayleigh-wave train fol-lows. The XAM indicates the 36–44 s amplitude group, and that it is the maximum not only within that periodrange but also for the entire LPZ Rayleigh-wave train. XB and XC indicate the maximum within the 27–33 and18–22 s groups respectively. The 18–22 s data taken from the LPE and LPN follow.
The P-phase at 22:58:37.5 signals the beginning of a new station-event. The decimal in the seconds wasoptional in this case. Notice that this event precedes a much larger event by only a few seconds.
The P-phase at 22:58:45.8 begins a station-event recorded at a distance of 8400 km with a magnitude of7.8 Ms. The first few cycles amplitude of 39.5 mm was scaled from the fifth cycle (a scaling time cannot be spec-ified for this kind of amplitude). The XB and XC indicate the gse SPZ first-arrival amplitude for the time incre-ments of 0–6, 6–12 and 12–18 s after the P onset. The XDM indicates the 18–300 s after the onset group andthat it was also the largest amplitude in the P-coda. The SPZ noise and LPZ’s one minute before P noise groupscomplete the P-phase data.
ATTACHMENT III
A–436 Volume I.1

SPE then precedes the S-phase data. Note the inclusion of an hour in the S arrival time as the hourchanged to 23 within the station-event. XM indicates the maximum S-coda SPE amplitude. XA indicates themaximum SPE amplitude within the first 10 s of the S arrival time. SPN precedes the same data groups fromthe north-south component.
BPZ indicates that data taken from a broad-band vertical component follow. The LR phase identifier meansthat Rayleigh-wave data are next. The XM indicates the maximum in the Rayleigh-wave train. The period is 28 s and the ground amplitude (centre-to-peak) is 54 μm. Evidently the quake was so large that thesurface waves were off scale on the LP instruments, but a lower magnification broad-band instrument recorded the Z amplitude which was reduced to a ground amplitude by the observer. The amplitude in this casewas preceded by GA rather than A to indicate ground amplitude as a trace amplitude was expected.
The next event is a 6.6 Ms aftershock of the previous event. C and W for the SP first motions and C, N andW for the LP first motions have been included. Note the required comma (,) preceding the LP first-motion group.PP and PPP data from the SPZ are the next phases reported. An arrival time of 110253.0 was reported for Sfrom the SPN together with its maximum amplitude. A slightly later arrival time was reported from the SPE chan-nel. This second arrival time for the same phase was strictly optional. The SP data for S are then followed bythe corresponding LP data for S. SS and SSS from the LPE are given, followed by P´P´ and SKPP´ from the SPZ.Maximum Love-wave data and the gse Rayleigh-wave amplitudes follow, with the 20 s horizontal Rayleigh-wavedata concluding this event.
The next event is represented by Pg from a rockburst. Note that the data inside double parenthesis mayspan several lines, which may be broken anywhere a space would normally occur.
The next station-event is delimited with solidi it contains no legitimate first arrival, but only an Lg from aweak local.
The last event from ALQ has a PLOC as a first-arrival phase code. This dummy phase code is used forreporting locals for which secondary phases cannot be read and for which first-arrival codes such as Pn, Pb orPg cannot be interpreted. Use of PLOC in such cases enables analysts and computer association programs todistinguish a teleseismic P from a local P where no other clues are found by examining the phase codes with-in the station-event and their time differences – use of PLOC in cases of such isolated local station-events willprevent misassociation of such data with teleseisms. A duration of 126 s was furnished.
Data from TUC begin with a report period in which a three-component set of intermediate-period instru-ments were reported as inoperative for the entire reporting period.
The process code, G, indicates that sophisticated, computerized equipment was used in the recording andinterpretation of the data.
GRND indicates that all of the amplitudes are ground amplitudes. Since no status code was given, thestatus code P for ALQ applies also to the TUC data. Also, since no default channel was given, the SPZ DEFAULTgiven by ALQ applies to TUC data.
Note the SPZ and LPZ slowness groups indicated by SLO and the related azimuths prefixed with AZ. Theobserver furnished maximum Rayleigh-wave amplitudes from three LP channels. The LPE amplitude has a valueof 00, because the waves arrived from nearly due north. Furnishing an amplitude of 00 rather than omitting thischannel served to distinguish it from the case where the LPE channel data were simply missing.
The station-event containing two legitimate first arrivals, PDIF and PKP, has been delimited so that thePDIF will not be separated from the rest of that event’s data.
The clarity code Q was used for the P phase arriving on 1 May at 00:37:42 to indicate that the observer feltthe timing was uncertain (questionable) by more than a second. This clarity code has been introduced to avoidsome of the ambiguities surrounding the use of (P) or E(P). In no case should a time such as 0037(42) be sent.
UNK, as shown in the next group, has been introduced as a first-arrival code to indicate that the observerdid not wish to identify the phase more specifically than as a first arrival. UNK must not be used for unidentifiedsecondary phases.
Data from the next event illustrate encoding of pP, pwP and sP, very important secondary phases.
The data from a strong local were given as a delimited station-event to indicate that the phases Pn, Pb andPg all pertained to the same event. Note that the SPZ and LPZ first motions of the Pn are of opposite sign. Donot “force” such observed first motions to be alike. Since the arrival time of Pn was reported to a precision ofhundredths of a second, the decimal point was required. Pb was also scaled from the SPZ with an SPZfirst-motion code of D. The Pg arrival time was scaled from the SPE, but SP first motions were given for threechannels. Sn and Sb were read from the SPN and Lg was read from the SPZ.
ATTACHMENT III
A–437Volume I.1

The Lg period, amplitude and its scaling time were given and could be applied to an appropriate magni-tude formula. An ML magnitude estimate of 5.8 based on a distance of 2.1 deg. was also supplied as well as aduration magnitude of 5.6. The comment gives the maximum intensity (VII) at Yuma. The intensity scale is generally understood as being based on the geographical region to which it has been applied.
In the last station-event, “depth” phases associated with PcP were reported. These phases will yield depthinformation at distances which may be too small to record pP or sP.
STOP is absolutely necessary to end the message.
NET-EVENT GROUP FORM
The following example shows a message in which the data are arranged by event. Data from five seismicevents are shown. Note that, within each event, the station-events have been arranged in any order convenientfor the sender, probably reflecting the order of telemetered traces recorded on film strips. The blank linesbetween net-events are optional as is the placement of station-events on separate lines.
SEISMO N5041 STATP PROCA SPZ DEFAULT
MAR23GIL IP1919534 FMC XMT1.4 A463ANV IP1918485 FMCSIT EP1920528KDC EP1920528PMR EP1919478 FM,C XMT1.0 A65 LPZ LR XCT20A90 LPN XT21 A31 LPE XCT19 A65NRA EP1919058GMA EP1919063
ANV EPLOC1927248
GIL EP1953558 XMT1.5 A107ANV EP1952488KDC EP1953356NRA EP1953059
MAR24GIL IP0052368 FMD XMT1.0 A65 I53255NKI IP0054070GMA IP0053149NRA IP0053162KDC IP0053018ADK IP0054325PMR IP0052459 FMC,C XMT1.0 A102 E53305 E54582 LPZ LR XBT28 A14 LPN XBT29 A6 LPE XBT27
A12AVE IP0053275 FMD
PMR FOCUS 0532491 LAT 55.43N LON 157.84W DEP 33 NS 8 ((FELT III AT PERRYVILLE)) MAG ML6.1 NS 2
SDN IPLOC 0533159KDC IPN0533447SVW IPN0534155PMR IPN0534391TTA IPN0534391TOA IPN0534581STOP
COMMENTS ON EXAMPLE
As this example has been designed primarily to illustrate the structure of the net-event group form, it doesnot exhaust the parameters available to the code. Those using this form will benefit from an examination of theprevious example.
ATTACHMENT III
A–438 Volume I.1

In this message ground amplitudes were used throughout. If double trace amplitudes had been reported,the appropriate magnifications would have been required nearly each time an amplitude group appeared. Notealso that the sender elected to insert a space between the period and amplitude groups. No other ⟨standarddelimiter⟩ would be acceptable in this position and none is required.
The second event consists of just one station.
The fifth event includes a computations group with a hypocentre based on eight station-events and an ML magnitude average from two stations. Local magnitudes shown in the examples are for illustrative purposes only and do not represent a comment on the use of local magnitude schemata developed for a particular area and depth range, but applied to a different region or depth range.
_______________
ATTACHMENT III
A–439Volume I.1


2011 edition
Updated in 2012
www.wmo.int
Manual on CodesInternational CodesVOLUME I.1
PART A – Alphanumeric Codes
WMO-No. 306
P-O
BS
_121
173