manual
TRANSCRIPT
MaxSea Professional Marine Software User Guide v10.3

Table Of ContentsUser Guide............................................................................................................................. 1
What's new in MaxSea professional version.......................................................................1
Foreword & License............................................................................................................3
Foreword......................................................................................................................... 3
INFORMATIQUE & MER SOFTWARE LICENSE...........................................................4
TO ENSURE YOUR SOFTWARE INSTALLATION.........................................................5
Getting started..................................................................................................................... 6
Getting started................................................................................................................. 6
Before starting.................................................................................................................6
Software User Guide.......................................................................................................6
Getting the computer ready.............................................................................................7
Installing the software on the PC.................................................................................8
Installing the hardware key on the PC.........................................................................9
Installing the software key (License)............................................................................9
Connecting a GPS receiver........................................................................................10
Screen display configuration recommended..............................................................11
Running the software.....................................................................................................12
Chart desktop environment............................................................................................12
Looking at the chart desktop......................................................................................12
Chart palette..............................................................................................................14
Tools palette..............................................................................................................15
Cursor Data................................................................................................................20
Nav Data.................................................................................................................... 20
Chart desktop settings...............................................................................................21
Using context menus.................................................................................................22
Usual keyboard shortcuts...........................................................................................23
Working with navigation tools........................................................................................24
Opening Charts..........................................................................................................24
Choosing the chart scale............................................................................................25
Moving the chart........................................................................................................26
Planning a Route.......................................................................................................26
Active Route...............................................................................................................28
Track your actual course............................................................................................29
Plotting marks............................................................................................................31
Man overboard...........................................................................................................32
Exiting the software.......................................................................................................33
Software References.........................................................................................................33
Software palettes...........................................................................................................33
Tools palette..............................................................................................................33
Cursor Data................................................................................................................34
Nav Data.................................................................................................................... 34
Tools.......................................................................................................................... 35
Navigation...................................................................................................................... 41
i

Headings & distances................................................................................................41
Planning Route..........................................................................................................42
Active route................................................................................................................49
Your boat on the chart................................................................................................62
Bearings.....................................................................................................................70
Layers............................................................................................................................ 72
User' data layers........................................................................................................72
Marks......................................................................................................................... 79
Tracks........................................................................................................................ 92
Events........................................................................................................................ 99
Charts.......................................................................................................................... 100
Using numeric charts...............................................................................................100
Horizontal datum conflict..........................................................................................110
Raster charts............................................................................................................116
Vector charts............................................................................................................122
2D view........................................................................................................................ 141
2D view....................................................................................................................141
2D Bathy config palette............................................................................................141
Display type and presence of imported data............................................................143
2D display configuration...........................................................................................144
2D color gradient......................................................................................................144
2D display mode choice...........................................................................................145
Display different types of data layers simultaneously...............................................147
3D view........................................................................................................................ 148
2D/3D module..........................................................................................................148
3D display................................................................................................................148
Display Modes.........................................................................................................150
Slope size Representation.......................................................................................151
Moving into the stage...............................................................................................153
Render modes in the 3D window.............................................................................154
3D view settings.......................................................................................................156
Configure the 3D view..............................................................................................157
Configure the contrast..............................................................................................158
3D camera options...................................................................................................159
Bathy imported data....................................................................................................160
Before importing 3D data.........................................................................................160
Hardware configuration............................................................................................162
Displaying data........................................................................................................162
Select imported 3D data...........................................................................................163
Configure imported data...........................................................................................171
PBG real time..............................................................................................................175
PBG / Real Time / 2D/3D.........................................................................................175
How to configure PBG Data Import..........................................................................176
How to configure PBG options.................................................................................179
Bathy database............................................................................................................180
ii

Table Of Contents
Bathy database........................................................................................................180
Edit 3D database.....................................................................................................181
Manage 3D database...............................................................................................185
Export 3D database.................................................................................................187
Seabed analysis..........................................................................................................188
Seabed analysis.......................................................................................................188
How to display Roughness (E1)/ Hardness (E2) on the chart..................................189
"Seabed Class" palette............................................................................................190
Activate the track.....................................................................................................192
Seabed classification preferences...........................................................................193
Configuring a Seabed classification.........................................................................194
"Engineer" adjustment dialog box............................................................................195
Applying a configuration to a track...........................................................................196
Trawl positioning..........................................................................................................196
Trawl positioning with PACHA or GEONET.............................................................197
PACHA / GEONET SYSTEM setting:......................................................................197
SIMRAD ITI SYSTEM setting:..................................................................................198
Trawl display............................................................................................................199
Dredge function...........................................................................................................200
The Dredge function................................................................................................200
Features...................................................................................................................200
Cable diagram..........................................................................................................201
Time Out preferences..............................................................................................201
Mobiles........................................................................................................................ 201
Mobiles.....................................................................................................................201
Displaying mobiles on chart.....................................................................................202
Mobile tracking.........................................................................................................203
Mobile center...........................................................................................................204
Mobile Properties.....................................................................................................205
Security CPA & TCPA..............................................................................................206
Tracking Radar............................................................................................................207
ARPA....................................................................................................................... 207
OVERLAY................................................................................................................210
Automatic Identify System (AIS)..................................................................................213
AIS targets...............................................................................................................213
How to configure AIS system with MaxSea..............................................................214
AIS mobile Displayed on the chart...........................................................................214
Mobile AIS, target displayed on chart......................................................................214
Tracking buoys............................................................................................................215
Buoys targets...........................................................................................................215
How to configure Follow up buoys system with MaxSea..........................................216
Buoy targets displayed on the chart.........................................................................216
Weather....................................................................................................................... 216
Weather module.......................................................................................................216
Open and display a weather file...............................................................................217
iii

Table Of Contents
Weather file from e-mail...........................................................................................218
Weather file save on hard disk.................................................................................218
Weather data palette................................................................................................219
Weather display options...........................................................................................221
Option: Weather.......................................................................................................223
Display Strength and direction of weather data........................................................223
Change the display date..........................................................................................224
Making movies........................................................................................................225
Open a movie...........................................................................................................226
Close the forecast file..............................................................................................226
Via MaxSea Chopper...............................................................................................227
Via Navcenter..........................................................................................................233
Via Navimail.............................................................................................................233
Tides............................................................................................................................ 234
Tidal data................................................................................................................. 234
Show and hide the tide gauges................................................................................235
Changing time..........................................................................................................236
Information on a drawing tide gauge........................................................................237
Making & opening movies........................................................................................238
Tidal currents...............................................................................................................239
Tidal currents data...................................................................................................239
Show/Hide tidal currents data..................................................................................240
Information on a drawing tidal current arrow............................................................241
Changing time..........................................................................................................242
Making & opening movies........................................................................................243
Logbook....................................................................................................................... 244
Navigation logbook..................................................................................................244
Displaying the logbook on the chart.........................................................................245
Displaying the logbook center..................................................................................245
Trip Logbook Center................................................................................................246
Creating an event.....................................................................................................247
Configuring the logbook...........................................................................................247
Archiving the logbook...............................................................................................250
Opening an archived logbook..................................................................................250
Importing previous logbook......................................................................................251
Closing archived logbooks.......................................................................................252
Catching logbook.....................................................................................................252
Customizing the display...............................................................................................254
Setting your Work Area display................................................................................254
Setting your Work Area display................................................................................254
Creating & displaying centering points.....................................................................255
Customizing the Auto Center mode display.............................................................256
North Up auto center mode display..........................................................................256
Course Up auto center mode display.......................................................................257
Head Up auto center mode display..........................................................................257
iv

Table Of Contents
Lighting screen level display....................................................................................258
Data Cursor display.................................................................................................258
Nav Data palette display..........................................................................................259
Tide & Current window display.................................................................................260
Chart window display...............................................................................................260
Software properties.....................................................................................................261
Option: PBG/2D/3D..................................................................................................261
Personal Bathy Generator settings..........................................................................261
Bathy 2D settings.....................................................................................................262
3D settings...............................................................................................................264
Option: GPS and track.............................................................................................264
Option: display.........................................................................................................266
Option: units.............................................................................................................267
Option: Magnetic Variation.......................................................................................267
Option: Fuel consumption........................................................................................269
Option: Customize Icons..........................................................................................269
Option: Route...........................................................................................................270
Option: Mobiles........................................................................................................270
Option: Text.............................................................................................................271
Option: TDs...Hyperboles.........................................................................................272
Option: Events.........................................................................................................272
Save and Print Chart window......................................................................................272
Print Preview............................................................................................................273
Printing..................................................................................................................... 273
Saving Chart as.......................................................................................................273
Installation & configuration..............................................................................................273
Hardware and system requirements............................................................................273
Screen display configuration recommended................................................................274
Software installation....................................................................................................274
Initial installation.......................................................................................................274
Upgrading Your software Version............................................................................275
Upgrading your software configuration....................................................................276
Installing the hardware key on the PC.....................................................................276
Installing the software key (License)........................................................................276
Connecting equipment.................................................................................................278
Connecting Equipment.............................................................................................278
Data Input-Output Settings.......................................................................................279
Input-Output Configuration.......................................................................................280
Add Instrument.........................................................................................................281
Remove Instrument..................................................................................................281
Data Calculator........................................................................................................282
Verify connection.....................................................................................................283
Verify data analysis..................................................................................................285
Flow control data parameters...................................................................................286
Configuration Preferences.......................................................................................288
v

Table Of Contents
Network Repeater function.......................................................................................289
Backup and Restore configuration...........................................................................290
PC computer cable diagram.....................................................................................291
Problems with ground loops.....................................................................................292
Installing the cartography.............................................................................................293
Installing charts on the hard drive............................................................................293
Table of chart compatibility......................................................................................293
MAPmedia...............................................................................................................294
BSB.......................................................................................................................... 296
ARCS & Seafarer.....................................................................................................297
C-MAP NT................................................................................................................300
C-MAP CM93 v2......................................................................................................303
C-MAP CM93 v3......................................................................................................307
S57 vector charts.....................................................................................................313
Utilities............................................................................................................................ 315
Customer Services......................................................................................................315
Software User Guide...................................................................................................315
Keyboard shortcuts......................................................................................................316
Troubleshooting..............................................................................................................318
Troubleshooting...........................................................................................................318
Software license protection..........................................................................................319
Running the software without Dongle......................................................................319
Unable to find a hardware key nor License..............................................................320
Choose the activation method..................................................................................321
Manual activation.....................................................................................................321
Program must be activated......................................................................................323
Activation wizard process (1)...................................................................................323
Activation wizard process (2)...................................................................................324
Activation wizard process (3)...................................................................................325
Activation wizard process (4)...................................................................................327
Activation under Email.............................................................................................328
Dongle failure...........................................................................................................329
Enter codes..............................................................................................................330
Temporary license...................................................................................................331
Activating a temporary license.................................................................................332
PROBLEM: Can not open a serial port........................................................................333
PROBLEM: the software does not work as well as before...........................................334
PROBLEM: 24 bit display setting is not appropriate....................................................335
How to reinitialize the software settings.......................................................................335
Glossary............................................................................................................................. 337
Index................................................................................................................................... 345
vi

User Guide
Getting started with MaxSea
What's new in this release
Finding and printing "User Guide" contents
Installing numeric charts
Connecting equipment
MaxSea © marine software version 10.3
Copyright & trade
This MaxSea User Guide provides detailed information about all the functions and capabilities within MaxSea. It is designed to help you become more familiar with the software and also act as a reference guide for experienced users.
What's new in MaxSea professional version... Use a Software Licence
Now you can use MaxSea without a Dongle. MaxSea will ask you if you want to install a software license protection.
A brand new interface
More intuitive, More explicit and easily recognizable symbols are presented, making use of the program icons a natural process – even for computer novices. All icons are listed in logical order of importance, with the option to show only the most frequently used functions.
More accessible. Primary functions are accessed with a single mouse click, eliminating the frustration of complicated multi-step processes found in other software.
More logical. The new MaxSea interface has been inspired by feedback from our many customers. Their comments have
1

guided us to organize MaxSea in a way that is consistent with the way that they work.
More reliable. The MaxSea interface is based on international industry standards (ECDIS). It offers an ideal blend of familiarity, flexibility and dependability with up-to-date weather forecasts.
More legible. With its appealing graphical interface and totally up-to-date design, MaxSea is a true pleasure to use. Information displayed can be adjusted in resolution, representation and color to achieve unparalleled clarity.
Related topic: Getting started with MaxSea
Order your free weather forecasts
using the simple MaxSea chopper graphic interface,
To access weather data, subscribe to our free services (
A new chart engine
MaxSea has new zooming capabilities with its Zoom plus and minus tools which allow you to quickly magnify or reduce the chart view.
The performance of ARCS charts in seamless mode has been improved
MaxSea v10 is compatible with the latest C-MAP NT+ charts on CD-ROM
Change your view in which you are working by selecting the chart orientation in the window.
Direct access to manage the entire data display (the user data and the chart data).
Using alarm with CMAP 93 ed 3: this function named Anti-grounding allows to display ALARM to warn you of a potential danger.
Graph drawing information
It's now easier to get information about tides, tidal currents and fuel consumption.
Easy access in MaxSea
It is now easier to:
- customize the MaxSea interface
- connect equipment
- use the most common functions without having to switch screens
You will find accurate explanations of all MaxSea features, including the external modules(*) like :
MaxSea 2D / 3D import and PBG
MaxSea Seabed Analysis
MaxSea Dredge function
Weather forecast module
Automatic Identification System (AIS) module
www.maxsea.com [email protected]
2

User Guide
* The presence of each module depends to your software configuration. To order or to obtain more information, please contact your dealer.
Foreword & License
Foreword
The software key or the hardware key and the following License Agreement are your proof of license.
Please treat them as valuable property.
Please read this before unpacking your software
MaxSea is a powerful electronic chart display software, but it is NOT intended to be used as a substitute for paper navigational charts
issued by official authorities and required by international maritime law.
Only official government charts and Notices to Mariners contain all information needed for the safety of navigation, and as always, the
captain is responsible for their prudent use.
Usage of MaxSea implies knowledge and acceptance of this warning by the user.
Informatique & Mer does not guarantee the accuracy of the updated daily FORECAST files .The weather forecast files are NOT intended to be used as a substitute for weather data issued by official weather offices.
This is a legal agreement between you (either an individual or entity), the end user, and Informatique & Mer S.A. If you do not agree to the terms of this Agreement, promptly return the CD ROM package and the accompanying items (including written materials and binders or other containers) to the place you obtained them for a full refund.
INFORMATIQUE & MER LICENCE agreement for boaters inside "North America"
INFORMATIQUE & MER SOFTWARE LICENSE agreement for all other boaters.
INFORMATIQUE & MER SOFTWARE LICENSE
1- GRANT OF LICENSE
3
MaxSea Professional Marine Software User Guide v10.3
(a) Dedicated use. Informatique & Mer grants to you the right to use one copy of the Informatique & Mer software identified above (the “SOFTWARE”) on a single computer (“Dedicated computer”). You may transfer the SOFTWARE to another single computer PROVIDED you do so no more often than once every thirty (30) days and no copies of the SOFTWARE licensed herein are retained for use on any other computer. However, if one individual uses the Dedicated Computer more than 80% of the time it is in use, then that individual also may use the SOFTWARE on a portable or home computer.
(b) Transitory Use. Notwithstanding (a), you may transfer the right to use the SOFTWARE as often as you like if you require each user of the SOFTWARE to have physical possession of an original Informatique & Mer SOFTWARE license (either this Informatique & Mer License Agreement or an equivalent designated by Informatique & Mer) at all times during the use of the SOFTWARE.
For the purposes of this section, “use” means loading the SOFTWARE into RAM, as well as installation on a hard disk or other storage device (other than a network server). You may access the SOFTWARE from a hard disk, over a network, or any other method you choose, so long as you otherwise comply with this Informatique & Mer License Agreement.
2- COPYRIGHT. The SOFTWARE is owned by Informatique & Mer or its suppliers and is protected by United States copyright laws and international treaty provisions. Therefore, you must treat the SOFTWARE like any other copyright material (e.g. a book or musical recording) except that you may either (a) make one copy of the SOFTWARE solely for backup or archival purposes, or (b) transfer the SOFTWARE to a single hard disk provided you keep the original solely for backup or archival purposes. You may not copy the written materials accompanying the software.
3- OTHER RESTRICTIONS. This Informatique & Mer License Agreement is your proof of license to exercise the rights granted herein and must be retained by you. You may not rent or lease the SOFTWARE, but you may transfer your rights under this Informatique & Mer License Agreement on a permanent basis provided you transfer this License Agreement, the SOFTWARE and all accompanying written material, retain no copies and the recipient agrees to the terms of this Agreement. You may not reverse engineer, decompile, or disassemble the SOFTWARE. If the SOFTWARE is an update, any transfer must include the update and all prior versions.
LIMITED WARRANTY
LIMITED WARRANTY. Informatique & Mer warrants that (a) the SOFTWARE will perform substantially in accordance with the accompanying written materials for a period of ninety (90) days from the date of receipt; and (b) any hardware accompanying the SOFTWARE will be free from defects in materials and workmanship under normal use and service for a period of one (1) year from the date of receipt. Any implied warranties on the SOFTWARE and hardware are limited to ninety (90) days and one (1) year, respectively. Some states do not allow limitations on duration of an implied warranty, so the above limitation may not apply to you.
CUSTOMER REMEDIES. Informatique & Mer ’s entire liability and your exclusive remedy shall be, at Informatique & Mer ’s option, either (a) return of the price paid or (b) repair or replacement of the SOFTWARE or hardware that does not meet Informatique & Mer ’s Limited Warranty and that is returned to Informatique & Mer with a copy of your receipt. This Limited Warranty is void if failure of the SOFTWARE or hardware has resulted from accident, abuse, or misapplication. Any replacement SOFTWARE will be warranted for the remainder of the original warranty period or thirty (30) days, whichever is longer. These remedies are not available outside of the United States of America.
NO OTHER WARRANTIES. Informatique & Mer disclaims all other warranties, either express or implied, including but not limited to implied warranties of merchantability and fitness for a particular purpose, with respect to the SOFTWARE, the accompanying written materials, and any accompanying hardware. This limited warranty gives you specific legal rights. You may have others, which vary from state to state.
NO LIABILITY FOR CONSEQUENTIAL DAMAGES. In no event shall Informatique & Mer or its suppliers be liable for any damages whatsoever (including, without limitation, damages for loss of business profits, business interruption, loss of business information, or other pecuniary loss) arising out of the use of or inability to use this Informatique & Mer
4

User Guide
product, even if Informatique & Mer has been advised of the possibility of such damages. Because some states do not allow the exclusion or limitation of liability for consequential or incidental damages, the above limitation may not apply to you.
U.S. GOVERNMENT RESTRICTED RIGHTS
The SOFTWARE and documentation are provided with RESTRICTED RIGHTS. Use, duplication, or disclosure by the Government is subject to restrictions as set forth in subparagraph (c) (1) (ii) of the Rights in Technical Data and Computer Software clause at DFARS 252.227-7013 or subparagraph (c) (1) and (2) of the Commercial Computer Software-Restricted Rights at 48 CFR 52.227-19 as applicable. Contractor/manufacturer is Informatique & Mer S.A., Maison du Parc, Technopole ‘IZARBEL’, 64210 BIDART, FRANCE.
This Agreement is governed by the laws of The State of Washington.
Should you have any questions concerning this Agreement, or if you desire to contact Informatique & Mer for any reason, please write: Informatique & Mer, Maison du Parc, Technopole ‘IZARBEL’, 64210 BIDART, FRANCE.
MaxSea is a Trademark from Informatique & Mer S.A.
Windows is a Trademark from Microsoft Corporation.
Other trademarks are registered by their respective manufacturers.
MaxSea use NetCDF, copyright from UCAR/Unidata
MaxSea use HDF, copyright from NCSA
TO ENSURE YOUR SOFTWARE INSTALLATION
IMPORTANT the software was given to you with either a serial number or a Dongle (option
chosen at time of purchase)
a sheet with software configuration codes.
one or several sheets with Chart configuration codes (chosen at time of purchase).
The serial number is provided on the first page of your paper User Guide manual. DO NOT LOOSE THIS NUMBER.
The help system contains a complete reference for all MaxSea functions. The various guides will also help you get familiar with the software.
The two-pane interface features:
A left pane for items list which is you help table of contents
A right pane for contents
Related topic : MaxSea Help software
Getting started
Getting started
The Getting started chapter will familiarize you with the most common functions of the software contents.
1. Before starting
2. Installing the software on the PC
5

MaxSea Professional Marine Software User Guide v10.3
3. Installing the hardware key on the PC
4. Installing the software License
5. Connecting a GPS receiver
6. Screen display configuration recommended
7. Running the software
8. Looking at the chart desktop
9. Tools palette
10. Charts palette
11. Cursor palette
12. Nav Data palette
13. Chart desktop settings
14. Using context menus
15. Usual keyboard shortcuts
16. Opening a chart
17. Choosing the chart scale
18. Moving the chart
19. Plan a route
20. Active route
21. Track your actual course
22. Plotting Marks
23. Quitting the software
Before starting
It is presumed that you have installed MaxSea as outlined in the “Installing Software” chapter.
It is also presumed that you are familiar with the Windows and are comfortable running Windows software. If this is the first time using a Windows-based program, it is recommended that you familiarize yourself with the Windows environment by reviewing the Windows Basics topic in your Windows help system.
Software User Guide
Overview
The Help Viewer provides an integrated table of contents, an index, and a full-text search feature so you can find information easily. Book icons open to reveal topic entries and sub-books. The Help Viewer has the added benefit of allowing you to see the table of contents, index, or search results at the same time you are viewing a Help topic. This orients you within the Help system and allows you to see all of the other applicable Help topics at a glance.
Three ways to open the Help software
1. Directly from the Installer program, to do it you have to click on HOW TO INSTALL THE SOFTWARE Button .
2. From your MaxSea software to select [User Guide] from the [Help] menu or directly click on F1 key.
6
User Guide
3. From the [Start] windows menu, select [Programs] > [MaxSea Utilities] > [User Guide].
Topics are marked as new with a red asterisk.
To find a Help topic In the Help Viewer, click one of the following tabs:
Contents tabTo browse through the table of contents, click the Contents tab. Double-click the book icons to reveal topic entries and sub-books.Click a table of contents entry to display the corresponding topic.
Index tabTo see a list of index entries, click the Index tab, and then either type a word or scroll through the list. Topics are often indexed under more than one entry.Double-click an index entry to display the corresponding topic.
Search tabTo locate every occurrence of a word or phrase, click the Search tab, type the word or phrase for which you want to search, and then click List Topics. See Find it fast for more information about refining and narrowing your search.Double-click a search results entry to display the corresponding topic.Three options allow to search into : search previous results, match similar words (checked by default) and search titles only.
Favorites tabTo bookmark a topic, use the Contents, Index, or Search tabs to locate and then display a topic. Click the Favorites tab, and then click Add to save the topic title to the Topics list.Double-click a bookmark in the Topics list to quickly display the topic.
Glossary tabTo find a term in the glossary, click the term and then the definition appears in the frame bellow.
Print help software:
To print the User Guide you need Microsoft Word 97 or greater.
To print a help topic Right-click the topic you want to print, and then click Print.
To print all topics within a book, on the Contents tab, select the book. On the Help toolbar, click Options, click Print, and then click Print the selected heading and all subtopics.
To print all the Help manual references: under [Windows] click [Programs], point to [Maxsea Utilities], click [UserGuide.doc] to open the document.
Getting the computer ready
Installing the software on the PC
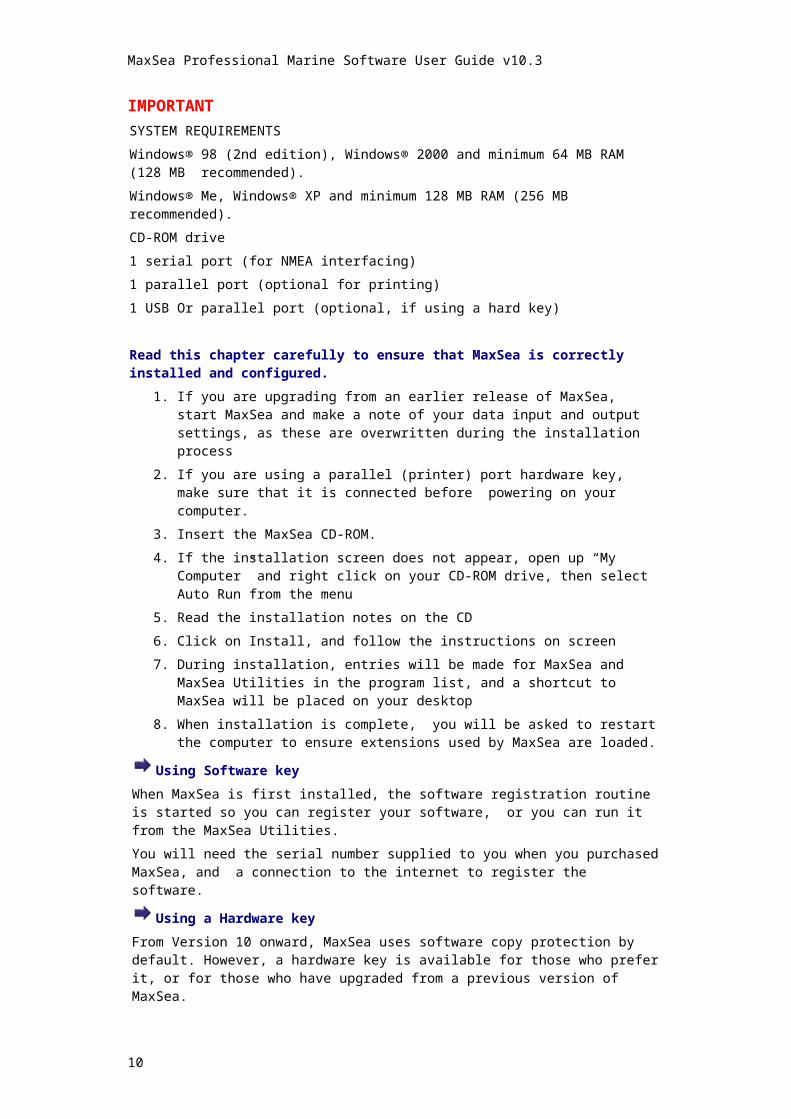
IMPORTANTSYSTEM REQUIREMENTS
Windows® 98 (2nd edition), Windows® 2000 and minimum 64 MB RAM (128 MB recommended).
Windows® Me, Windows® XP and minimum 128 MB RAM (256 MB recommended).
CD-ROM drive
1 serial port (for NMEA interfacing)
1 parallel port (optional for printing)
7

MaxSea Professional Marine Software User Guide v10.3
1 USB Or parallel port (optional, if using a hard key)
Read this chapter carefully to ensure that MaxSea is correctly installed and configured.
1. If you are upgrading from an earlier release of MaxSea, start MaxSea and make a note of your data input and output settings, as these are overwritten during the installation process
2. If you are using a parallel (printer) port hardware key, make sure that it is connected before powering on your computer.
3. Insert the MaxSea CD-ROM.
4. If the installation screen does not appear, open up “My Computer” and right click on your CD-ROM drive, then select Auto Run from the menu
5. Read the installation notes on the CD
6. Click on Install, and follow the instructions on screen
7. During installation, entries will be made for MaxSea and MaxSea Utilities in the program list, and a shortcut to MaxSea will be placed on your desktop
8. When installation is complete, you will be asked to restart the computer to ensure extensions used by MaxSea are loaded.
Using Software key
When MaxSea is first installed, the software registration routine is started so you can register your software, or you can run it from the MaxSea Utilities.
You will need the serial number supplied to you when you purchased MaxSea, and a connection to the internet to register the software.
Using a Hardware key
From Version 10 onward, MaxSea uses software copy protection by default. However, a hardware key is available for those who prefer it, or for those who have upgraded from a previous version of MaxSea.
If you are using a printer port hardware key, it should be plugged in to your printer port before installing MaxSea.
If you are using a USB hardware key, it should not be plugged in until after MaxSea has been installed.
Installing charts
If you are using Mapmedia or Maptech charts, we recommend that you create a CHARTS folder under My Documents, and copy the charts from the CD into this folder. ARCS and Seafarer charts are installed from the MaxSea Utilities. C-Map CM/93 charts and S-57 charts are installed from the MaxSea Utilities. C-Map NT charts are installed using the tools on the C-Map CD.
Unlock codes:
Whichever type of key you are using, you will need to go into MaxSea Utilities and select Configuration Codes (Dongle Update) to enter the two serial numbers supplied with MaxSea (unless your dealer has done this for you).
If you are installing MapMedia charts or tidal stream data, you will also have unlock codes either under MaxSea Utilities or under the software by choosing [Mapmedia User Permits] from the [File] menu.
Example: to start the Dongle Update tool, click on [Start], then [Programs], then [MaxSea Utilities] and then [ConfigurationCodes(DongleUpdate)].
Installing the hardware key on the PC
8

User Guide
Installing the Hardware Key
If you received a hardware key (a dongle, or electronic protection key / USB or Parallel) with your software, it must be connected to your computer after installation for MaxSea to run.
USB Dongle: Install MaxSea BEFORE connecting dongle. It is not necessary to turn the computer off to connect or remove USB Dongle.
Parallel Dongle: Install MaxSea before or after connecting dongle. This must ONLY be connected with the computer power OFF.
Installing the software key (License)
Follow these steps if you have chosen the software key option.
IMPORTANT: The temporary license allows you to use the software for a limited time. You must activate a full license key through the internet (or by calling your distributor) to permanently unlock your software.
Section I : Installing a software Key
When you launch the program for the 1st time (without a hardware key)
A window appears and allows you to launch the Software Key Activation process
Click on [I want to proceed. I do not need a hardware key]
Choose the type of activation method to receive your activation codes:
o Automatic activation: (immediate registration)
o Manual activation: (delayed registration)
For Automatic activation
For automatic activation, you must have an active connection to the Internet. (Be sure that your Web browser works and that you can connect to web sites.)
Enter your Serial Number: provided on the first page of your paper User Guide Manual. (Keep this Serial Number safe. It is your proof of license and the software can not be re-installed or upgraded without it.)
A data registration form appears. This identification allows you to get your Site Key automatically through Internet. This site key will permanently unlock the software on your computer.
All fields marked with an asterisk are required.
As a security measure, the e-mail address must be correct.
Confirm your e-mail address. (If there is a problem obtaining your Site key because your e-mail address is entered incorrectly or there is a problem with the internet connection, then contact your distributor.)
Verify that your e-mail is correct, then click on the Finish button to activate the Site Key.
To configure additional software modules, click on OK to run the "Dongle Update".
Enter your Configuration Codes and a message notifies you that the configuration was successful. MaxSea launches automatically.
For Manual activation
9
MaxSea Professional Marine Software User Guide v10.3
This method requires the Site code and the Serial number before contacting your distributor.
The Site code is generated and displayed in the manual activation dialog box.
Contact your distributor and give them your Serial Number and Site Code.
Your distributor will provide you with a Site key for permanent activation.
Section II : Installing the software on another computer
This method is used only if you wish to install MaxSea on another computer.
IMPORTANTDuring the removing process you will be given a serial number. Please, carefully note it, as it will NOT be given later on.
Go to your Windows "Start" menu, open "Programs", find "Software Key License Remover".
Left-click on the OK button, this action will generate a code saved into a file named "PROOF.TXT".
Please this code must be carefully noted before proceeding the license remover process.
Section III : From software trial version to Full License
This is how you proceed in order to get a Full License, before the end of the Demo trial period.
If your license is going to expire the software will warn you.
Switching from CD demo to full License can be done (with new codes given from your distributor):
o either at the end of the Demo period
o or during Demo period with using the Software Key Activation Wizard.
To get a new software key go to [Start] windows menu, select[Programs] open [MaxSea Utilities] and choose[Software Key Activation Wizard].
Connecting a GPS receiver
In most cases, connecting a GPS to your computer is straightforward, and is accomplished by simply connecting the serial cable supplied by your GPS manufacturer to the serial port on your PC.
The serial port is a nine-pin male port on the back of your computer often identified by a IOIOI symbol.
Serial to USB Cables
If you have a newer computer – especially a notebook or tablet PC – it may not include a serial port. One can be added with the use of a serial-to-USB adapter cable available from your MaxSea distributor, computer store, or on-line computer store. Adapters manufactured by KeySpan or Fitstream are preferred.
Connection Details
The PC's serial port (RS 232 type input/output port on COM1) is used for data acquisition. Connect your GPS to this port using the appropriate cable. This serial port must comply with RS 232 type electrical characteristics, a standard compatible with most marine electronics.
10
User Guide
The connection of a GPS to the computer is generally limited to a 2-wire connection with a NMEA 183 output from the GPS to input (RxD) and ground (Gnd) pins of the computer.
If your GPS has a RS 422 type connection, you cannot use the following process. Please contact your dealer.
Connections at serial port of the computer ( 9 Pin Type D Connector)
Pin Signal Information
2 Data reception Rx Connection to GPS
3 Data transmission Tx Connection to automatic pilot
5 Ground GND
Screen display configuration recommended
IMPORTANTMaxSea must be used with a Display configuration of 65k colors (16 bit). Do NOT use a 24 or 32 bit color setting.
How to optimize the MaxSea display function with Windows XP operating system ?
If your screen is configured to use something other than 65k colors (16 bit), please, follow the procedure below:
1. Right-click on the Windows desktop to activate the Windows context menu.
2. Point and left-click on [Properties] in the pop-up menu to call up the Display Properties dialog box.
3. Select the Settings Tab.
4. Choose Medium (16 bit) in the Color quality pop-up menu.
5. Click on the Apply button to validate your configuration.
6. Close the Display Properties Dialog box.
11

MaxSea Professional Marine Software User Guide v10.3
Running the software
IMPORTANT!The software will not run if the software protection is not activated (Hardware protection with the "Dongle" or software protection with the "Software License").
Two ways of running the software :
Double click the Software icon on the windows desktop.
OR
The software is in the Program folder of the Start menu. To launch it select [Programs] and choose the software from the [Start] windows menu.
At the first start, the software automatically searches for the presence of charts in the CD drive and/or of charts on your Hard Disk.
One or several charts are detected.
The software automatically detects the presence of charts in the CD drive and/or on your Hard Disk.
A dialog box appears asking you to select a chart. It is possible to open several charts simultaneously by pressing the Ctrl key while selecting the charts and clicking OK.
No chart is detected.
If no chart is detected, the software displays the world planning chart by default.
Before displaying the charts, a warning dialog box appears concerning the use of digitized documents.
You should:
Confirm your agreement by clicking I agree, the software will launch and the world chart will open by default.
Or quit the software by clicking I do not agree returning you to the Windows desktop.
Chart desktop environment
Looking at the chart desktop
MaxSea opens into a familiar charting environment (Figure below). You'll notice that MaxSea will display many differently types of charts simultaneously. The charts are ordered according to their geographical position and their scale of representation. Let's take you for a brief tour around the MaxSea Chart Desktop.
12
User Guide
The Chart Desktop (1) is the open window and consists in six parts :1. The Chart window is docked in the top of the open window, the scale datum and
the type of chart are displayed in the window titled [Raster 1:25 million[WVGS84] (for scale 1/25 million) (for scale 1/25 million, first chart window).Several chart window can be opened at the same time. The GPS symbol (8) is drawn in each open chart window, it indicates the boat position displayed on the chart at the point currently indicated by the GPS system connected.
2. The Menu bar (2) which is your gateway to a series of pull-down menus.
3. The Chart palette (3) which is your gateway to a series of buttons which allow you to turn on/off different functions in the software ( the presence of the buttons depends of the software configuration).
4. The Tools palette (7) which is your control center and it is always displayed on screen. Each tool does a specific job and can be chosen with a left click of the mouse.
5. The Cursor Data (4) palette displays the data wherever the cursor is located on the chart ( the cursor can be any of the various tools on the tools palette). This data information can be displayed in a palette by default on the right or docked around the software window. Data information are latitude , longitude , route and distance between the cursor, the boat, and the Time To Go ( TTG ) at the present GPS speed.
6. The Nav Data (9) palette displays the data from your GPS and any sailing instruments you have chosen to connect. Data instruments information can be displayed in a palette on the right by default or docked around the software window.
The Chart Desktop display configuration by default
13

MaxSea Professional Marine Software User Guide v10.3
1. When first start MaxSea, the name of the first layer which is Layer.ptf [WVGS84] and the chart window title are displayed in the Chart Desktop open window title (1). Note that if you click on the close button (6) the software warns you if you really want to quit.
2. The first Chart window is displayed in a "Full screen" mode. To switch from a full to a reduce mode, click on the Reduce window configuration button (5). The software warns you that you cannot close the only one seamless window presently opened in the Chart Desktop.
3. The Chart palette contains all the tools you need to manage the display of Numeric charts, User data, Weather data and other navigational information in each opened chart window. The Chart palette is docked in the top of the Chart Desktop window.
4. The tools tips are displayed when you place the cursor on a tool palette or button for a few seconds, MaxSea will display information about it.
5. The Tools palette is displayed vertically in the upper left-hand corner of the screen.
6. The Nav data palettes (Cursor data and Nav Data) are displayed in the right-hand of the screen.
Note : all the palettes in the chart desktop window can be displayed in two different modes, "Menu bar" layout display mode and "Floating palette" layout display mode. Refer to the Setting your work area paragraph.
Chart palette
The standard Chart palette contains buttons which allow you to directly turn on / off the data displayed according to the installed modules. The presence of a button indicates that the specific module is installed.
There are two types of buttons in the Chart palette:
Simple buttons which allow direct access to a specific function.
Pop-up menu buttons which allow you to choose items according to the selected function.
Use the corresponding button from the charts palette to turn on/off the different functions which are :
(1) - Customizing bar allows you to move a "docked" button group. Click then drag to detach the menu.
(2) - Center button to turn on/off chart auto-centering, centering the chart around the boat (related topic: center mode).
(3) - Chart orientation button chooses the display orientation (three modes are available, "North up", "Course up" and "Head up" the North up mode is selected by default).
(4) - Layer zone information (active layer name and its datum) is a pull-down list of available layers.
(5) - Charts zone information is a pull-down list of available charts (the planisphere, the "CD300_01.map" chart and the show/hide the grid are the list by default).
(6) - Tides button turns on/off tides for main ports of the world.
14

User Guide
(7) - Tidal currents button to turn on/off tidal currents vectors.
(8) - Weather button to turn on/off Weather information.
(9) - Current time is displayed in this zone by default. Click to pull-down date and time menus. The date and the time are displayed together when you have chosen to display text labels.
(10) - Pull-down menus which allows you to change date and time for tides, currents and weather files. (Only displayed when tides button or currents button or weather button is selected).
Note: the presence of some more buttons depends on your software configuration. The omission of a button means that the corresponding module is not available in the software. To get more information, please contact your distributor.
Right-clicking in the Chart palette opens a context menu where you can choose to display options:
with standard buttons or large buttons
with or without text labels
change the opacity of the palette, this option is only available when the palette is displayed in a l
Tools palette
The Tools palette appears vertically on the left side of the screen. It includes navigational "tools" which enable you to work on a computerized chart as you would on a paper chart with a pencil and navigational protractor.
The Tools palette consists in five parts
Part 1 - ACTIVATION BUTTONS
Simply click on the button.
Man Over Board function (MOB) to activate the “Man Over Board” function.
Track On/Off function to activate and stop tracking.
Zoom plus to magnify the view of the chart.
Zoom minus to magnify and reduces the view of the chart.
Part 2 - NAVIGATION TOOLS
Simply click on:
The Magnifying toolto change chart scale (zoom in or out)
15

MaxSea Professional Marine Software User Guide v10.3
The Hand toolto pan charts and access the chart data.
Single click the left mouse button to grab the chart and to pull it anywhere you want.
Double click the left mouse button to access the chart data screen.
The Compass tool to calculate compass/true headings and measure distance.
TheBearing toolto confirm your position, check your location on the chart.
The Waypoint Planning Route to plan a route.
This tool provides a simple method for laying down a single waypoint or series of connected waypoints which it's call a route.
The Waypoint Active Route tool to plot a route to be actively followed by the ship.
This tool provides a simple method for laying down a single waypoint or series of connected waypoints which it's call an active route.
Part 3 - CAPTURE AND MODIFICATION TOOLS
Simply click on:
The Plotting pen toolto plot marks, Lines, areas, or text based on plotting attribute choices.
The Insertion toolto insert a waypoint or a point.
The Position modification toolto select and move any object, point, or waypoint.
16

User Guide
The delete toolto remove unwanted information or objects.
Note: alternative to selecting the object and pressing the Delete key.
The Split tool (scissor symbol) to cut a line or tracks in two parts.
The Select point tool (Hand symbol) to select and get information about a point or object.
The Select object tool (Arrow symbol) to select and get information about an object or series of objects within a geographic area.
Part 4 - ATTRIBUTE CHOICES OF THE PLOTTING TOOL
Before plotting marks click on any of the following buttons to pull down the menu which allows you to choose attributes of the plotting tool.
The Plotting object type menuto choose between a point, a line, an area, a circle, a text.
The Plotting icons menuto choose plotting symbol according to set up plotting object.
The Plotting font size menuto choose plotting font size.
17

MaxSea Professional Marine Software User Guide v10.3
The Plotting color menu is used to choose plotting colour.
The Plotting width line size menu is used to choose a width line size.
18

User Guide
The Plotting drawing type menu is used to choose a type of the drawing plot.
Part 5 - ADDITIONAL DISPLAY OPTIONS
Select any display options tool on the palette by simply click on it.
Lighting level display options
To choose under the menu the screen lighting level.
Day mode selected
Dusk mode selected
Night mode selected
Day/Dusk/Night display darkens the software color palette and allows you not to be dazzled in a dark cabin.
Note: you should need a less bright display, in case of night navigation for example.
Screen display mode
To change the screen display mode. The activated mode of this button displays a full-screen window.
Cursor Data
19

MaxSea Professional Marine Software User Guide v10.3
The Cursor Data (mouse pointer) is displayed on the right-hand corner of the window chart. It contains the data for wherever the cursor is located on the chart and it moves over your screen as you move the mouse or the track-ball.
Default layout Cursor Data
To move the Data Cursor, left-click on its title bar, hold the mouse button down, drag to the new position and at least release the mouse button.
Left-clicking on the cross in the upper right hand corner will close the cursor palette. To reopen closed cursor palette go to [Display] on the menu bar and choose [Data
Cursor].
The default layout cursor data window is shown with 20% of transparency in the right upper corner of the screen. The Data Cursor data shows the Latitude and Longitude, route and distance between the cursor and your boat, and the time to go ( TTG ) at the present GPS speed is displayed .
Refer to the related topic "Customizing the Data Cursor display" to find out more about the Data Cursor display.
Nav Data
You have to use the navigation Instrument Displays to view information sent by electronic equipment connected to the input/output ports of the computer ( GPS , central navigation equipment).
20

User Guide
To move the Nav Data palette left-click on its title bar, hold the mouse button down, drag to the new position and at least release the mouse button.
Left-clicking on the cross in the upper right hand corner will close the cursor palette. To reopen closed cursor palette go to [Display] on the menu bar and choose [Nav
data].
Refer to the chapter Equipment connection to obtain more information regarding the instruments displays.
Note:(1) - there is a display for each peripheral (GPS, etc.) connected to the input/output ports.(2) - it's possible to select the data which you want to display in the instrument palette. (paragraph : Selecting the data for the display)
Chart desktop settings
There are numerous ways to lay-out your computer screen depending on your personal preferences. Changing the screen layout with MaxSea is very easy. Three modes can be used to organize your work area.
1 - Setting the palette position
a) - "Menu bar" layout display mode
This mode is useful in case you use several types of tools and in case your working space might disappear behind the accumulation of palettes. MaxSea allows you to dock the different menus according to your choice (right, left, top or bottom around the chart window). To Left-click on the customizing bar button, drag and drop the group menu to the docked destination.
b) - "Floating palette" layout display modeThis mode allows you to quickly identify your different tools. To move a floating palette drag its title bar and drop to the desired destination and double left-click to dock in the chart window.
c) - To move each palette, left-click on its title bar, hold the mouse button down, drag to the new position and release the mouse button.
d) - To resize each palette horizontally or vertically, click on its border, hold down the left mouse button while moving the mouse in whatever direction, release the mouse button.
2 - Setting the palette displaya) - Left-clicking on the cross in the upper right hand corner of each palette will close it. To reopen closed palette go to [display] on the menu bar and choose the palette you want to display again.
b) - To change the size or to display the legend of each palette which contains buttons, right-click on its title bar, hold the mouse button down, choose either "Large Buttons" or "Show text labels" under the menu and release the mouse button.
c) - To change the font size and the opacity of each data palette, right-click on its title bar, hold the mouse button down, choose the command. The menu list depends to the selected palette (for more information refer to the related topics: "Setting the Cursor palette display", "Setting the Nav Data palette display" and " Setting the Steering Data palette display").
21

MaxSea Professional Marine Software User Guide v10.3
3 - Setting the orientation of the chart desktop
The software allows you to work in the chart window in several ways of direction - using North up direction, using Course up direction, using Head up direction.
You can change your view in which you are working by selecting a view under the Chart orientation menu.
To do so, click the "Chart orientation" button, hold the mouse button down, choose a direction and release the mouse button.
Note: (1) - The tools palette is permanently displayed and can not be closed.(2) - All settings configuration are saved when you exit the software.(3) - Transparency layout option is available only with operating system Windows® 2000 and XP.
Using context menus
In addition to the menus at the top of your screen and the usual tools, context-sensitive menus display commands relevant to the selected object. Context menus let you quickly access useful commands according to the selected object.
To display context menus:
1 - Position the pointer over an object or a group of objects.
2 - Click with the right mouse button to bring up the appropriate menu.
Generally the context menus consist in four parts:
Part 1 - Most commonly display commands:
a) - Scale choices
b) - Zoom in the current chart
c) - Zoom out the current chart
Part 2 - Information and specific function commands related to the selected object
Part 3 - Capture and modify commands related to the selected object
Part 4 - List of tools choices
Note: For more information refer to the related topics of each navigation tools and charts displayed.
Usual keyboard shortcuts
Using the Palette
The palettes are accessed with the right and the left buttons of your mouse.
Single-Left Mouse Click to Select
Any time you want to select a tool,simply place the cursor over the tool,and then use
the left button one time. You have now selected this tool,and you ’ll see that the cursor
looks like the tool you ’ve selected.
22

User Guide
Double-Left Mouse Click to Delete
If you double-left-click over a given tool you will erase whatever it is you have been
using that tool to work on. If you mess up —and for us that happens a lot —this is an easy
way to get a clean chart from which to start over.
Right-Click Mouse to Choose the palette configuration
Right-click any tool in the palette brings up the context menu which allows you to change the button display size.
Accessibility MaxSea usual functions keyboard shortcuts
Press on the keyboard To
Ctrl + O Open file in MaxSea
Ctrl + N Create a new file
Ctrl + S Save the current file
Ctrl + W Close a file from MaxSea
Ctrl + P Print
Ctrl + A Select all object from the current file
Accessibility MaxSea Options keyboard shortcuts
Press the keyboard: To:
F1 Access to the User Guide
F2 Activate the Zoom In function
F3 Activate the Zoom Out function
F4 Activate the Center On/Off function
F5 Activate the Track On/Off function
F6 Create a logbook entry
F7 Select the next Waypoint
F8 Select the previous Waypoint
F9 Display Tide On/Off
F10 Display Current On/Off
F11 Display Weather On/Off
F12 Activate the Man Overboard function
Shift +F1 Select tool (switch between tools: zoom, Pan, Divider, Bearing Planning route, Active route, Add, Insert, Delete, Split)
Shift +F2 Switch Day/Dusk/Night
Shift +F4 Switch NorthUp/CourseUp/LegUp
Right/Left/Up/Down scroll chart function
23

MaxSea Professional Marine Software User Guide v10.3
Arrows
Of the Numeric keypad
The + and - Zoom in or zoom out
Accessibility Windows Options keyboard shortcuts
Press on the keyboard
To:
Alt Activate the menu bar of MaxSea software with out using the mouse (then use the keyboard Arrows)
RIGHT ARROW Open the next menu to the right, or open submenu *
LEFT ARROW Open the next menu to the left, or close a submenu *
UP ARROW Move up in the menu *
DOWN ARROW Move down in the menu *
(*) in case the Alt keyboard is selected then use the Arrows keyboard to move in the menu bar.
Working with navigation tools
Opening Charts
The software is compatible with cartographic data from several publishers. This data may be in vector or raster format saved on hard disk or CD-ROM
Opening a chart on your HardDisk
To open a chart installed on your hard disk, select [Open chart] from the [File] menu.
A warning box will appear about the use of digitized documents. Click Accept if you agree.
Choosing the chart scale
Generally, the MaxSea displays charts under a seamless mode.
You can change the scale of a chart in several ways:
1 - Using the Magnifying tool
At the top of the tools palette is a Magnifying glass button. This is the Chart Scale Selection Tool. Click on once, then move the tool to the center of the area in which you want the new chart to open. Hold down the mouse button while moving the mouse to the selected area, release the button to zoom in.
2 - Using the "Zoom in" and "Zoom out" tools
Clicking the "Zoom out" tool under the tools palette (Magnifying glass with a minus sign) zooms out.
24

User Guide
Clicking the "Zoom in" tool under the tools palette (Magnifying glass with a plus sign) zooms in.
3 - Using the Scale pop-up menu which allows you to select from the available chart scales.
You can right-click any time in the chart window to bring up the Scale pop-up menu even if you have another tool selected.
Under the [Display] menu choose [Select Scale] to bring up the scale pop-up menu as mentioned below.
The available scales are indicated by a drawing symbol next to their numbers. The current chart scale in the "Scale Pop Up" is shown in Bold.
Choose the desired scale, Left-click the mouse button. The chart is drawn at this scale and centered on the point clicked.
Note: the drawing symbol next to available scale indicates the type of data available:
chart data
depth data
chart and depth data
Moving the chart
1 - Hand tool
Click and move the cursor over the chart in the center of screen.
Single-click to move the chart anywhere you want it to go.
Double-click to access the chart data screen. Here you will find data on the chart source, its official number, the country of origin, scale, datum, and—most important—the units of depth (feet, meters, or fathoms).
As with other tools, right-clicking brings up the context menu allowing you to change the chart scale and access the chart data screen.
Note: when you release the mouse button, the software draws the part of the chart which appears following the move that you have made. Do not attempt to move a chart several times in quick succession. Wait until the software has redrawn the chart after each new move.
2 - With other tools
25

MaxSea Professional Marine Software User Guide v10.3
You can use the mouse buttons to move the chart in the active window.
single-click the wheel mouse button (if you have wheel mouse) to activate the free mode panning and click again on it to release this mode.
move the mouse near a window border and while the cursor is changed in arrow click on the left button to move the chart anywhere you want it to go.
Upper left corner chart window
Upper middle chart window
Upper right corner chart window
Lower left corner chart window
Lower middle chart window
Lower right corner chart window
Planning a Route
This chapter explains briefly how to plot a route (using the Waypoint route tool) and how to calculate headings and distances (using the compass tool) putting into practice the navigational rule of the compass which is used traditionally on a paper chart.
MaxSea offers you functions which are both simple, yet much more powerful than the traditional navigational tools.
You will select the Waypoint Route tool to plot a Route.
You will use the Compass tool to access the headings and distances calculation functions.
MaxSea allows you to create a route plan by linking together several Waypoints on the chart.
IMPORTANT A route plan created in this manner must not be confused with the Active Route that the ship is presently following which will be studied in the following chapter Follow the Active Route
To create a Route:
Click the Waypoint Route tool and move the pointer on which position you want to start your route .
A Waypoint will be displayed at the point clicked. It is called Waypoint W000.
You can create additional Waypoints by clicking points further along the route. These Waypoints will be successively numbered W001, W002, W003, W004 etc....
Note:
26

User Guide
(1) - at any time, you can move the chart or change scale (using the corresponding tool) while plotting a track . Select the Waypoint tool and continue to plot the track. The waypoint route is drawn in orange on the chart.(2) - a right button click on a waypoint symbol drawn on the chart will bring up its appropriate context menu. This menu allows you to access at any time to the "Waypoint properties" and other tools appropriate to a planning route.
By consulting the Route data center, MaxSea will display the total distance and duration of the track created (see following paragraph: Route data center).
You can erase this track by double clicking the Waypoint Route tool in the Tools palette.
A tool tip appears giving you information (distances and headings calculation )at every Waypoint drawn on the chart.
Every waypoint is described in a table associated to the road: [Planning Route center] from the [Route] menu.
Select the Finger tool and left-click on a Waypoint route and hold down the mouse button to obtain the distance value from the previous waypoint.
IMPORTANT A route plan must not be confused with the active course presently taken by the ship. More information on this topic is in the following chapter: Active course.
To access the headings and distances calculation functions:
27

MaxSea Professional Marine Software User Guide v10.3
Select the Compass tool by clicking the icon in the Tools palette.
To calculate the heading and the distance between two points on the chart.
To convert a planning route to the active route taken by the ship:
Right-click a waypoint any where on the route, a context menu appears, choose "Convert Planning Route to Active Route".
or
Select [Convert Planning Route to Active] item from [Route] menu
Active Route
The Active Route chapter teaches you how to create a course currently followed by your ship.
The Waypoint active route tool from the Tools palette is used for plotting a course.
Select the waypoint Active Route tool from the tools palette.
Click the position of the first Waypoint on the chart, the Steering data window is displayed in the lower left-hand corner of the screen.
To display the Steering display window go to the [Display] menu, choose [ Steering Display].
As explained in the previous chapter on the "Planning a Route" you can obtain more information about this course by selecting [Active Route center] from [Route] menu.
The course that you have plotted can be modified at any by right clicking an active route waypoint (for more information see chapter Modifying the Active Route).
When the chart scale value is chosen and Auto Scale Active is selected, the software will automatically change the chart scale as the ship approaches Waypoint.
When you activate the Display Alarm Border check box, the Security XTE area is delimited with two doted lines, green and red, on each side of the active route.
28

User Guide
Once you have plotted a course and if your computer is connected to an autopilot, you can control the ship with MaxSea.
You can track your actual course by clicking the Track button from the tools palette ( refer to the following chapter "Tracking").
Track your actual course
In this chapter you will learn how to display on the chart and save the track of your ship.
Click on the "Track on/off" button in the Tools palette. The Track off changes to Track on.
The track is then displayed on the chart and automatically saved onto the Layer[WGS84] file by default.
29
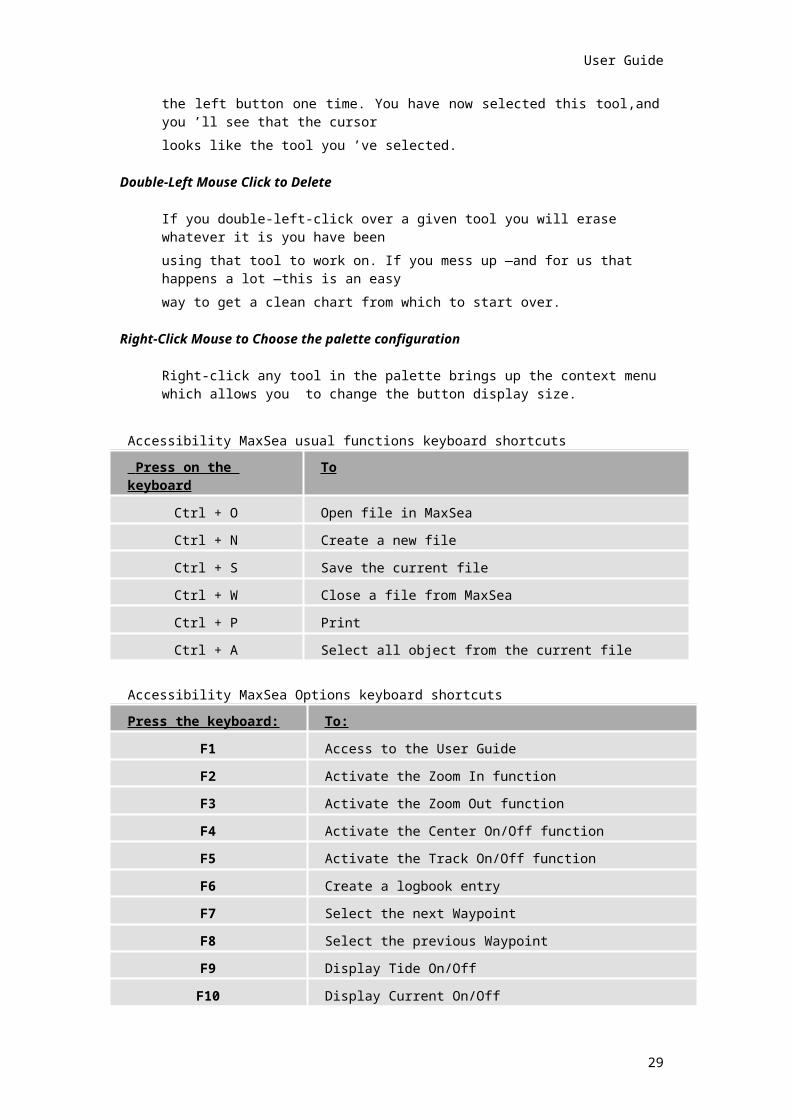
MaxSea Professional Marine Software User Guide v10.3
Click on the Track on/off button again in the Tools palette to deactivate the track saving function.
The program gives you the option to save the track permanently in a "PTF" file on the hard drive.
Left-clicking on "Save" will save the track in the layer.ptf and clicking on "Do not Save" will lose the save of track.
Left-clicking on "New file" will save the track in a chosen file.
Left-clicking on "Open file" has two effects open an existing file and save the track in it.
30

User Guide
Note : (1) - save the track onto a new layer for a later use.(2) - convert the recorded track as a new active route using the context menu.
Plotting marks
Personal marks can be saved onto layer(s). When MaxSea is started, an empty layer (named "Layer [WGS84]") is created .
The plot mark characteristics (type, icon, color) are indicated in the Mark type selection boxes located in the lower half of the Tools palette.
1 - Choose the drawing type and select the depending parameters.
2 - Select the Plotting pen tool from the Tools palette, place the cursor on the screen at required position; then click. A mark (point, line, area, circle or text) will be display at the position clicked.
Example:
Before plotting a mark, use the plotting set up tools which allow you to change the symbol, the colour, the line width, the draw and the font size.
(1) - point
(2) - line
(3) - area
(4) - circle
(5) -
31

MaxSea Professional Marine Software User Guide v10.3
text.
To repeat the operation, modification of the icon and the color may be necessary to plot more marks.
Note: Marks are saved onto the active layer by default (its name is indicated in the Chart palette). You can also save your personal marks onto personal layers. To create a new layer go to the [File] menu and select [New], choose the path and the name of the layer.
Man overboard
The "man overboard" function ( MOB ) can be a useful tool when used in addition to the usual practices (placing luminous buoys on the water, watchman, placing floating objects in the water, etc.).
Select the buoy icon from the Tools palette.
The following warning applies:
If you acknowledge this warning, the software passes immediately into Man overboard mode:
all the open charts are closed except the last one which is displayed in full screen mode.
The chart is displayed in Centered ship mode at a precise scale (1/2 500).
The active course is erased and a Waypoint is recorded at the position where the ship was when the Buoy icon was clicked (overboard point).
The Waypoint display appears as a graphical representation and continually shows the heading and distance to return to the point of fall.
The track is displayed.
The MOB and the Track ON/OFF buttons are both activated in the tools palette
IMPORTANT! The overboard position depends on the precision of the GPS at the moment the function is activated.
The man overboard may drift due to winds and currents.
32
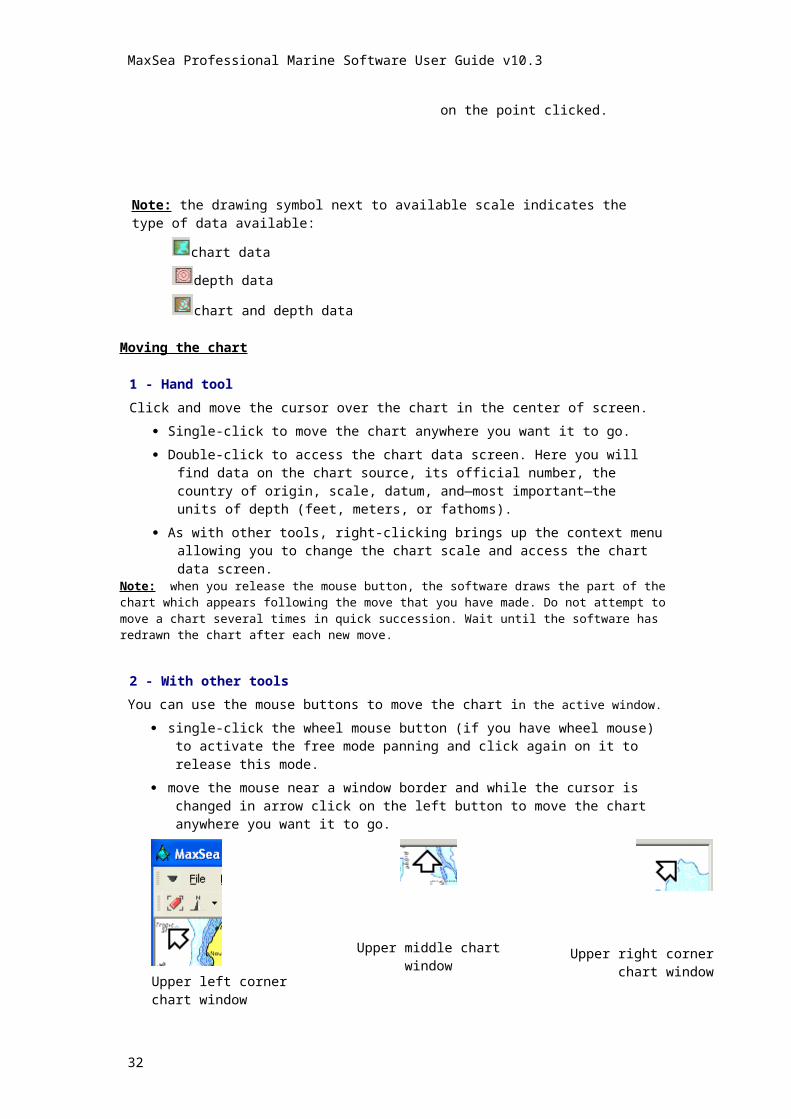
User Guide
Exiting the software
To exit the software:
1 - Choose [Exit] from the [File] menu or click the cross located in the upper right-hand corner of the window.
2 - Click yes if you really want to exit.
3 - A second dialog box warns you to choose whether or not to save any open layer file.
Click Yes for each open layer file to save the file.
Click No for each open file to close the file without saving it.
Note: If you have plotted marks and not create a new file, the software saves them automatically in the activated layer.
IMPORTANT Do not quit the software by turning the computer off! Doing so may cause damage to the software, as well as to any current information being used!
Quit the software as indicated above; then turn the computer off.
Software References
Software palettes
Tools palette
The first time you start the application, the Tools palette appears vertically on the left side of the screen. It includes navigational "tools" which enable you to work on a computerized chart as you would on a paper chart with a pencil and navigational protractor. MaxSea offers ease of use and power that was previously unavailable.
The Tools palette consists in five parts
Part 1 - ACTIVATION BUTTONS
Part 2 - NAVIGATION TOOLS
Part 3 - CAPTURE AND MODIFY TOOLS
Part 4 - PLOTTING SET UP OBJECTS
Part 5 - ADDITIONAL DISPLAY OPTIONS
Cursor Data
33

MaxSea Professional Marine Software User Guide v10.3
The Cursor Data (mouse pointer) is displayed on the right-hand corner of the window chart. It contains the data for wherever the cursor is located on the chart and it moves over your screen as you move the mouse or the track-ball.
Default layout Cursor Data
To move the Data Cursor, left-click on its title bar, hold the mouse button down, drag to the new position and at least release the mouse button.
Left-clicking on the cross in the upper right hand corner will close the cursor palette. To reopen closed cursor palette go to [Display] on the menu bar and choose [Data
Cursor].
The default layout cursor data window is shown with 20% of transparency in the right upper corner of the screen. The Data Cursor data shows the Latitude and Longitude, route and distance between the cursor and your boat, and the time to go ( TTG ) at the present GPS speed is displayed .
Refer to the related topic "Customizing the Data Cursor display" to find out more about the Data Cursor display.
Nav Data
You have to use the navigation Instrument Displays to view information sent by electronic equipment connected to the input/output ports of the computer ( GPS , central navigation equipment).
34

User Guide
To move the Nav Data palette left-click on its title bar, hold the mouse button down, drag to the new position and at least release the mouse button.
Left-clicking on the cross in the upper right hand corner will close the cursor palette. To reopen closed cursor palette go to [Display] on the menu bar and choose [Nav
data].
Refer to the chapter Equipment connection to obtain more information regarding the instruments displays.
Note:(1) - there is a display for each peripheral (GPS, etc.) connected to the input/output ports.(2) - it's possible to select the data which you want to display in the instrument palette. (paragraph : Selecting the data for the display)
Tools
Activation buttons
Unselected Selected
Man Over Board function
Click on MOB button to activate the "Man Over Board" function.
(For more information refer you to the related topic: Man over board function.)
Track On/Off function
Click on the Track button to activate and stop tracking.
(For more information refer you to the related topic :Tracking function)
PBG On/Off function
Click on the PBG button to activate and stop the Personal Bathymetry Generator
(For more information refer you to the related topic: Import & PBG )
&
& Zoom in or out functions
The zoom function (plus or minus) magnifies and reduces the view of the chart.
Navigation tools
Unselected Selected
35

MaxSea Professional Marine Software User Guide v10.3
Magnifying tool
Click the Magnifying tool to change chart scale (zoom in or out)
(For more information refer you to the related topic: Scale choice)
Hand tool
Click the Hand tool to pan charts and access the chart data. Single click the left mouse button to grab the chart and to pull it anywhere you want. Double click the left mouse button to access the chart data screen.
(For more information refer you to the related topic: Moving the chart)
Compass tool
Click the Compass tool to calculate compass/true headings and measure distance.
(For more information refer you to the related topic: Headings and distances)
Bearing tool
The Bearing tool is a powerful navigational tool, useful to confirm your position, check your location on the chart.
(For more information refer you to the related topic: Bearings)
Waypoint Route tool
The waypoint route tool provides a simple method for laying down a single waypoint or series of connected waypoints which it's call a route. This tool is used to plan your route.
(For more information refer you to the related topic: Plotting a Route )
Waypoint Active Route tool
The waypoint active route tool provides a simple method for laying down a single waypoint or series of connected waypoints which it's call an active route. This is the
36

User Guide
route presently followed by your boat.
(For more information refer you to the related topic:Plotting an Active Route )
Capture and modify tools
Unselected Selected
Plotting tool
To plot marks, lines, areas or text based on plotting choices.
(For more information see: Adding your personal marks)
Insertion tool
To insert a waypoint or a point.
(For more information see: Modifying marks and Modifying an active route)
Position modification tool
Click the tool, then select and move any object, point, or waypoint.
(For more information see: Modifying Marks & Modifying a Route & Modifying Active Route & Dead reckoning function)
delete tool
To remove unwanted objects.
(For more information see: Modifying Marks & Modifying a Route & Modifying Active Route)
Split tool
The split tool is used to cut a line or track into two parts.
(For more information see: Cutting a line in two parts or Cutting a track in a half)
Select point tool (Finger symbol)
The selection and information tool gives
37

MaxSea Professional Marine Software User Guide v10.3
access to data associated with a specific point.
(For more information see: Selecting Marks & Mark Information window )
Select object tool (Arrow symbol)
Selects an object or series of objects within a geographic area.
(For more information see: Modifying Marks & Modifying a Route & Modifying Active Route)
Plotting set up objects
Unselected Selected
Plotting object type
Before plotting marks click on this button to pull down the plotting object type menu. This provides easy to choose plotting object (point, line, area, circle, text and drift buoy).
(For more information refer you to the related topic: Adding personal marks)
Plotting icons
To choose plotting symbol according to set up plotting object.
(For more information refer you to the related topic: Adding personal marks)
38

User Guide
Plotting font size
To choose plotting font size.
(For more information refer you to the related topic: Adding personal marks)
Plotting color
To choose plotting color.
(For more information refer you the related topics: Modifying Marks & Modifying a Route & Modifying Active Route)
Plotting width line size
To choose a width line size.
(For more information refer you the related topics: Adding your personal marks)
39

MaxSea Professional Marine Software User Guide v10.3
Plotting drawing type
To select type of the drawing plot.
(For more information refer you the related topic: Adding your personal marks)
Additional display options
Unselected Selected
Lighting level display options
Chooses screen lighting level.
Day/Dusk/Night darkens the software color palette for use in a dark cabin.
(For more information refer you to the related topic: Customize the display)
Screen display mode
To change the screen display mode. When activated, a full-screen window is displayed.
Navigation
Headings & distances
Headings and distances
In this chapter, you will learn how to calculate headings and distances. You will put into practice the navigational rule and the Compass , which you use traditionally on a paper chart.
40

User Guide
You will discover how the software offers you functions which are both simple and yet much more powerful than the traditional navigational tools.
You will use the Compass tool to access these functions. Select this tool by clicking the icon in the Tools palette:
To calculate the heading and the distance between two points on the chart
To obtain the same calculation as above, from the ship position with one or several points
Between two points
To calculate the heading and the distance between two points on the chart, place the cursor on the first point, click then drag the mouse until the second point (and release the mouse button).
Note that when you drag the mouse, the heading and distance between the first point and present position of the cursor on the chart are displayed beside the cursor and continually update.
After releasing the mouse button, the heading, distance and Time To Go ( TTG .) to cover this distance are displayed. The duration is calculated depending on the present speed of the ship.
Double click the Compass tool in the Tools palette to erase the track created.
From the ship position with one or several points
Double click one or several points on the chart to obtain the same calculation as above, but for between the ship and the double clicked point (s).
As above, double click the compass tool in the Tool palette or simply click on the chart to erase the track created.
41

MaxSea Professional Marine Software User Guide v10.3
Repeat these operations several times.
Note: you can double click on any point on the chart, even if the ship icon is not visible on the screen. Check however, when moving the chart, that the course indicated does not cut dry land or cross hazards!
Planning Route
Planning a Route
MaxSea enables you to create a route plan by linking together several Waypoints on the chart.
IMPORTANT A route plan created in this manner must not be confused with the Active Route that the ship is presently following which will be studied in the following chapter The Active Route
To create a Route:
Select the Waypoint Route, position and click the cursor on the on the chart to plot a Waypoint.
Then A Waypoint will be displayed at the point clicked. It is called Waypoint W000.
You can create additional Waypoints by clicking points further along the route. These Waypoints will be successively numbered W001, W002, W003, W004 etc
Note: You can at any time move the chart or change scale (using the corresponding tool) while plotting a track . Then select again the Waypoint tool and continue to plot the track. The Route waypoint is drawn in orange on the chart.
MaxSea displays the different parts on the chart, to get indications of the total distance and duration of the track created you have to consult the Route data window (see the following paragraph: Route data window).
42

User Guide
You can erase this route by double clicking the Waypoint Route tool in the Tools palette.
A Context menu let you quickly access useful commands according to the selected planning route.
To display it:
1 - Position the pointer over a waypoint of the planning route or the selected planning route.
2 - Right-click a waypoint route and hold the mouse button down to bring up the appropriate menu which allows you:
to convert planning route to active route (this option is available only if there is no Active route presently opened)
to call up the selected Waypoint properties dialog box.
to add a planning waypoint or an active waypoint.
to delete a waypoint or the planning route
to move a waypoint or the planning route, a dialog box is called up and allows you to enter (lat/Lon) values to change the position. In case you have chosen to move the planning route all the waypoints are selected.
to select a waypoint or the planning route.
Planning Route Waypoint Properties
Two ways to call up the Waypoint Properties from a planning route:
1 - Double clicking with the Select point tool on a Waypoint gives you the following information dialog box :
This dialog Box gives you the possibility to enter :
[Name] : then the waypoint name is displayed on chart.
[ Latitude ] and [ Longitude ]: to change the Waypoint position, enter new values.
43

MaxSea Professional Marine Software User Guide v10.3
[Chart Scale ] : to assign a scale value used for the waypoint auto-scale function at waypoint passage.
3 - Right clicking a waypoint to call up the context menu, then choose "Waypoint properties".
Planning route center
You have just plotted a Route, you can obtain more information concerning your track . For that purpose, please, select the option [Planning route center] of the menu [Route].
The Planning Route Center Window contains:
A Planning Route Waypoint by line.
Values of constraint, which are marked out blue.
Not modifiable values, which are marked out gray.
Modifiable values, which marked out white (for example the waypoint name is a modifiable value)
When the waypoint is past the parameters associated to this waypoint are erased from the Route window excepted the values of its position (distance, latitude , longitude and COG ).
The Planning Route Center displayed indicates the total distance to cover, the Time To Go ( TTG ), the Estimated Time of Arrival (ETA)... These same values are also specified for each waypoint of the route as well as headings and distances for each segment.
Movement into the Planning Route Center (by using the mouse or the keyboard):
Vertically or Horizontally navigation into the Planning Route Center.
No possibility to move in the headings cells.
To change the Window display configuration:
A window display configuration is defined by default but you can:
Hide columns
Show all columns
Move columns in the Planning Route Center
44

User Guide
To hide and show columns just simply click in the column with the right button mouse, then a contextual menu appears and gives you different options:
To move column in the window you have to use the drag and drop function:
Select the column
Then move the selected column while holding the mouse button down to the desired place.
You can modify the speed using the arrows in the upper part of a column.
After each modification, the different values of the route plan are immediately updated.
45

MaxSea Professional Marine Software User Guide v10.3
It is possible to independently modify the speed for each part of the route plan.
Repeating these operations will show you how useful the Waypoint tool is in preparing your courses; the time required depending on different weather conditions, forecasts, etc..
To temporarily close the Route window, click the window closing box. You can open it again by selecting [Planning Route Center] from the [Route] menu.
Modifying the planning route
The Route that you have plotted can be modified at any time using the modifying tools in the palette or.
You can access the tools you need directly by right-clicking a waypoint to call up the context menu.
Extending the Route
Select the Waypoint Planning Route tool in the Tools palette, then click on the position of the Waypoint you want to add to the route plan. You can move the chart if needed. You may repeat the operation to add additional Waypoints.
Erasing a Waypoint
Select the delete tool in the Tools palette, then click the icon of the Waypoint that you want to delete. Repeat this operation to erase other Waypoints if necessary.
Modifying a Waypoint position or the planning route
Three ways to modify the position :
Directly from the Planning Route Center window, to do it, select the corresponding fields ( latitude and longitude cells from the tab)
Using the Position modification tool in the Tools palette, then click the icon of the Waypoint whose position you want to modify, hold the mouse button down, then drag to the desired position for this Waypoint (using information from the Cursor display if necessary). Release the mouse button.
Using the context menu, right click a waypoint and choose "Move" > "Waypoint" (or "Route"), to call up the dialog box in which you can enter precisely position.
Inserting a Waypoint into the route
Select the Insert tool in the Tools palette (note that the cursor is now like this ), click the Waypoint (which is then selected and is highlighted) where you want to insert a new Waypoint.
When the cursor has resumed its usual plotting form (pencil), click (or drag to) the new Waypoint position. This Waypoint is then inserted in the planning route.
46

User Guide
You can also insert a waypoint using directly the context menu, to do so click a waypoint and choose "Add" > "Planning waypoint".
Note: you can add also a waypoint in active route mode, at this moment an active waypoint is added and an active route is created at the same time (if before the active route was not defined).
Converting Planning Route to Active Route
Either go to the [Route] menu and choose [Convert to Active Route] or directly by selecting a waypoint and choose "Convert to Active Route".
Related topic:
Activating a planning routeNote: (1) - if an Active Route is already active, the convert function is not available.
Deleting the planning Route
There are two ways to erase the planning route from the chart without saving a copy to the hard disk:
Double click the waypoint planning route tool in the tools palette. The software offers you the chance to record this route plan on the hard disk before removing it from the chart. Click cancel and go to the [Route] menu and select [Save Planning Route as...].
or
Select [Delete route] from the [Route] menu.
IMPORTANT If you click on yes without saving the planning route, you won’t be able to retrieve this planning route later. To save the route you have to select [Save Planning Route as…] from the [Route] menu.
This route plan can be loaded at a later stage or used at the same time as the active course (as explained in The Active Route ).
Saving a Planning Route
To be able to have later the route which you have just defined, you have to record it.
For it select option [Save Planning Route as...] under the [Route] menu.
47

MaxSea Professional Marine Software User Guide v10.3
By default the file is named for example in the following way RouteDD_MM_YYYY.wpt (date In the daytime of creation)
The file so created is saved at the first level of "My documents" folder of your computer.
Convert track or line into planning Route
This function can be used, for example, to transform an old track into a planning Route .
Two ways to convert to a planning route:
Using the "Menu bar"
Click the Arrow icon in the tools palette, select, in the required order, a list of points (personal marks), or select a complete line or a track for example (see chapter Data Layers/ Marks / Modifying marks , and the paragraph Selecting objects ).
Go to [Route] menu and choose [Convert to planning route]
Then the selection is automatically converted to a planning route
Using the context menu
Right-click a point of a line or a track with any tool selected in the tools palette, this brings up the following context menu:
Choose and left-click the "Convert to planning route" under the context menu.
Two actions happen the selection is transformed into a planning Route and the new waypoints are added to the first route.
Note: (1) - if a route was drawn before on the chart the "Convert to planning route" item is not available. The previous planning route must be saved and closed before converting a list of points.(2) - The line or the track will NOT be erased. The Route will be superposed to the line or the track.
As same as above you can also convert a planning route to an Active Route refer you to next chapter Activating route.
48

User Guide
Opening a Route
To open a Route that you have already recorded, select [Open Route] from the [Route] menu.
Select the required planning route and then click the "Open" menu.
The planning route is then displayed on the chart.
Note: you can only display one route plan at a time on the chart. You can also open route file saved with previous software version.
IMPORTANT If the active file and the chart are in known and different datum , you have to convert the datum. For more information, refer you to the related topic: Horizontal datum conflict chapter.
Active route
Activating a planning route
If you have planned a Route using the waypoint planning Route tool selected and on the chart that you wish to follow, you can transform the Route into the Active Route .
To do this, simply click on a Waypoint with the right mouse button, a context menu appears where you can select the "Convert to Activate Route" option.
You can also convert a route into an active route by selecting [Convert to Active Route] from the [Route] menu.
The Route is immediately transformed into the active route and you can plot a new route.
Note: (1) - if an Active Route is already active, the convert function is not available.(2) - when the route is activated, a Waypoint W000 is plotted for the present position of the boat, which defines the initial heading for the first part of the course.
Plotting an active route
Select the Waypoint Active Route tool in the Tools palette.
Then click the position of the first Waypoint on the chart.
At this point, several things happen:
A Waypoint will be displayed at the point clicked. It is called Waypoint W001.
A special Waypoint will be displayed at the position where the ship was located when the point was clicked on the chart. It is called Waypoint W000. The course between this Waypoint 0 and Waypoint 1 represents the initial heading.
The waypoint data window is displayed; precise information on this is given in the following paragraph.
You can create additional Waypoints by clicking points further along the route. These Waypoints will be successively numbered 2, 3, 4 etc and they are drawn in red color on the chart.
49
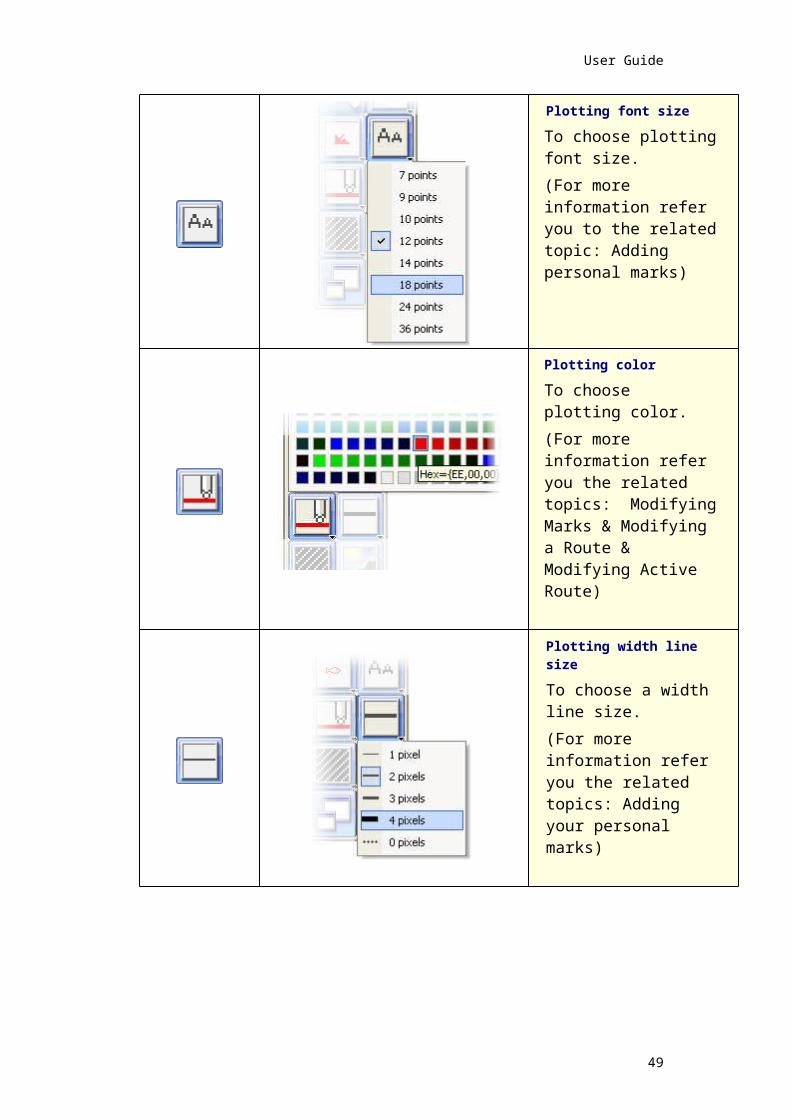
MaxSea Professional Marine Software User Guide v10.3
Note: at any time it is possible to change the scale and move the chart using the corresponding tools, and then re-select the Waypoint Active Route tool to continue plotting your course.
A Context menu let you quickly access useful commands according to the selected planning route.
To display it:
1 - Position the pointer over a waypoint of the planning route or the selected planning route.
2 - Right-click a waypoint route and hold the mouse button down to bring up the appropriate menu which allows you:
to reach the next waypoint (this option is available only if there is no Active route presently opened)
to reverse Active Waypoint.
to call up the selected Waypoint properties dialog box.
to add a planning waypoint or an active waypoint.
to delete a waypoint or the planning route
to move a waypoint or the planning route, a dialog box is called up and allows you to enter (lat/Lon) values to change the position. In case you have chosen to move the planning route all the waypoints are selected.
to select a waypoint or the planning route.
Steering Data & Steering display windows
As explained in the previous paragraph, when the first Waypoint is plotted, the Steering window is displayed in the lower left-hand corner of the screen.
50

User Guide
Steering data palette
1. To move the Steering palette left-click on its title bar, hold the mouse button down, drag to the new position and at least release the mouse button.2. Left-clicking on the cross in the upper right hand corner will close the Steering Data palette.3. To reopen closed steering data palette go to [Display] on the menu bar and choose [Steering data ].
The Steering data palette indicates and continuously updates information necessary to follow the course correctly:
Waypoint: name to reach.
Route: the heading to follow to directly reach the next Waypoint from your present position,
XTE : the "cross track error" indicates how far you are off course from the theoretical heading (initial heading),
Nominal: the initial heading, the theoretical heading that you should follow from the previous Waypoint,
Distance: the distance to the next Waypoint,
TTG : the Time To Go to reach the next Waypoint depending on the present speed of the ship,
Next: the next heading to follow after passing the Waypoint.
Steering data layout
To obtain the Steering data information in a form of "Menu bar" mode just double left-click on its title bar.
To return in a form of floating palette, just left-click on the "customizing bar" and then drag to new position on the screen.
To resize the palette horizontally or vertically hold down the left mouse button while moving the mouse in whatever direction.
Steering data settings
right-click on its title bar to pull down display settings menu :
To change the opacity, select Transparency and click a value from "Not transparent" or 10% or 20% or 30% or 40% or 50% or Text outline, then release the mouse.
To change the font size, select Font size and click a value from smallest or smaller or medium or bigger and biggest, then release the mouse.
To call up the Steering Display palette select Show steering.
To change the nominal course value, select Change course value... , this brings up a dialog box in which you can change directly the initial heading.
Call up the Steering display window
under the [Display] menu select [Steering display] or from the Steering data palette as it is described above .
close this graphical zone by clicking the cross.
51

MaxSea Professional Marine Software User Guide v10.3
Note: the software automatically detects the moment when the boat is close enough to the Waypoint. It then automatically passes to the next Waypoint in the list. A course is thus followed by the software without manual intervention (if the helmsman follows the indications supplied by the software).
You can select, in [Option : Route] from the [Route] menu, the automatic passage distance (Related topic:Option: Route ). On the large scale charts (precise) you can thus see the distance realized by a circle (of equal radius for the precision chosen) traced all around the waypoint to be reached.
IMPORTANT Monitoring of the vessel for safety must be continually
provided. The user must ensure that the course is perfectly safe.
Waypoint properties
Using the waypoint properties to enter waypoint name and scale.
Three ways to get the information dialog for an Active Route Waypoint :
1 – By selecting [Activate/Manage Waypoint] from the [Route] menu.
52

User Guide
Then select a waypoint and click on "Edit" button to open the Waypoint properties window.
2 - Double clicking with the Select point tool on a Waypoint gives you the following information dialog box :
This dialog Box gives you the possibility to enter :
[Name] : then the waypoint name is displayed on chart.
[ Latitude ] and [ Longitude ]: to change the Waypoint position, enter new values.
[Chart Scale ] : to assign a scale value used for the waypoint auto-scale function at waypoint passage.
3 - Right clicking a waypoint to call up the context menu, then choose "Waypoint properties".
Active route center
As explained in the previous chapter on the route planning, you can obtain more information concerning the Active Route . To do this select [Active Route center] from the [Route] menu.
Or simply right click using the Waypoint tool on one of the active route waypoints, will display a contextual menu which gives access to the Active Route window.
The Active Route window contains:
A Waypoint by line.
The line of the Active waypoint is written in red.
Values of constraint, which are marked out blue.
Not modifiable values, which are marked out gray.
53

MaxSea Professional Marine Software User Guide v10.3
Modifiable values, which marked out white (for example the waypoint name is a modifiable value)
Note: when the waypoint is past the parameters associated to this waypoint are erased from the Active Route window except the latitude and the longitude values.
The active route window displayed indicates the total distance to cover, the Time To Go ( TTG ), the Estimated Time of Arrival (ETA). These same values are also specified for each waypoint of the course as well as headings and distances for each segment.
Note: the software uses the present speed of the ship and updates automatically the values of the course as speed changes.
Movement into the Route window (by using the mouse or the keyboard):
Vertically or Horizontally navigation into the Route window.
No possibility to move in the headings cells.
To change the Window display configuration:
A window display configuration is defined by default but you can:
Hide columns
Show all columns
Move columns in the Route window
To hide and show columns just simply click in the column with the right button mouse, then a contextual menu appears and gives you different options:
To move column in the window select the column and then use the drag and drop function.
Modifying the Active Route
The course that you have plotted can be modified at any time using the modification tools.
Extending the course
Select the Waypoint Active Route tool from the Tools palette, then click on the position of the Waypoint you want to add to the course. You can move the chart if needed. You may repeat the operation to add additional Waypoints.
Erasing a Waypoint
Select the delete tool from the Tools palette, then click the icon of the Waypoint that you want to delete. Repeat this operation to erase other Waypoints if necessary.
Modifying a Waypoint position
Select the Position modification tool from the Tools palette, then click the icon of the Waypoint whose position you wish to modify, hold the mouse button down, then drag to the desired position for this Waypoint (using information from the Cursor display if necessary). Release the mouse button.
54
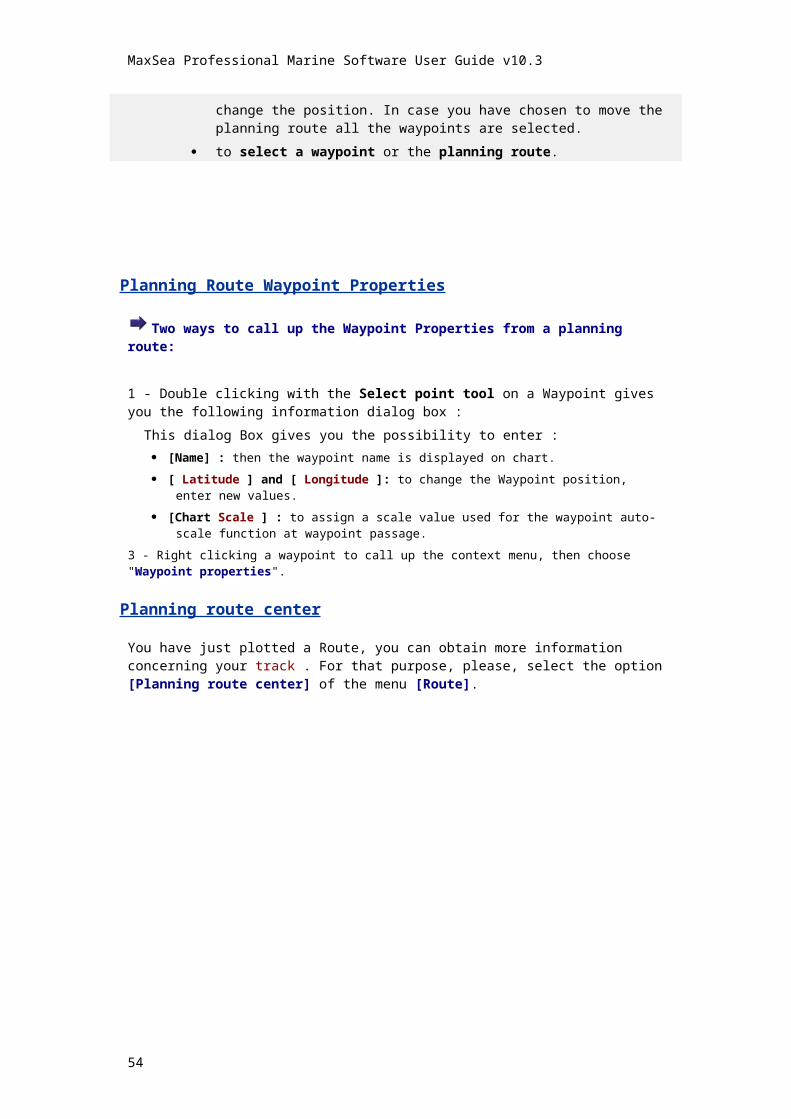
User Guide
Inserting a Waypoint into the course
Select the Insert tool from the Tools palette (note that the cursor is now like this ), click the Waypoint (which is then selected and is highlighted) after which you wish to insert a new Waypoint.
When the cursor has resumed its usual plotting form (pencil), click (or drag to) the new Waypoint position. This Waypoint is then inserted in the course.
Reversing the active route
Select [Reverse Active Route ] from the [Route] menu to reverse the direction of the active route (return course).
Directly from the contextual menu, then select the Reverse Active Route item:
Activate the next and Previous Waypoint
To select Waypoint placed after the active Waypoint :
Select [Activate Next Waypoint] from the [Route] menu.
Directly under the context menu, right click on an active route waypoint.
Directly on the chart by selecting shortcut (F7)
To select Waypoint placed before the active Waypoint :
Select [Activate Previous Waypoint] from the [Route] menu.
Directly on the chart by selecting shortcut (F8)
Deleting the Active Route
To erase the active route you can:
Either double click the Waypoint active route tool in the Tools palette. Click Ok if you want to erase definitively the Active Route .
Or select [Save Active Route as…] from the [Route] menu, this action will save and close the Active Route.
IMPORTANT When you double-click the Waypoint active route tool icon in the Tools palette, the software does not offer you the option of saving the course before removing it.
If you have chosen Save Active Route, the software offers you the option of saving it.
55

MaxSea Professional Marine Software User Guide v10.3
Choose a name and the record file, then click Save. You have just saved your Active Route onto disk (Routexx_xx_xx.wpt name by default).
The software erases the Active Route on the chart and closes the waypoint data and the Active Route windows.
Saving an Active Route as
To be able to have later the route which you have just defined, you have to record it.
For it select option [Save Active Route as...] under the [Route] menu.
By default the file is named for example in the following way RouteDD_MM_YYYY.wpt (date
In the daytime of creation)
The file so created is saved at the first level of "My documents" folder of your computer.
Activating a list of points
This function can be used to transform an existing track into an active course , or to assemble a waypoint library that you choose depending on requirements and in the order that you wish.
Two ways to activate a list of points:
Using the tools palette
Select in the required order, a list of points (personal marks), or select a complete line or a track.
Select the Active route Waypoint tool in the Tools palette, and click one of the points.
The selection is then transformed into the active route .
If an active route was already active, this adds the selected points to the active route and lengthens it.
Using the context menu
Right click one point on the line (track...) to bring up the context menu.
Choose "Convert to active route", this transforms the list of points into the active route.
If an active route was already active, the "Convert to active route" function is not available.
Related topics:
Modifying marks
Selecting objects Note:(1) - when a course is activated, Waypoint 0 is plotted at the present position of the boat, which defines the initial heading for the first part of the course.
56

User Guide
Activating a parallel line planning route (S.A.R.)
First plot two points using the Waypoint Route tool (erase the previously displayed planning route if necessary)
To select the route plan line, click one the points using the Arrow tool .
Then select [Copy] from the [Edit] menu, followed by [Paste] also from [Edit].
MaxSea then displays the following dialog box.
Fill in the different boxes and click OK.
A planning route consisting of parallel lines is displayed on the chart.
57

MaxSea Professional Marine Software User Guide v10.3
Activate this route plan by selecting [Activate route] from the [Route] menu.
Note: if a course is already active, this function is not available until you have closed the active course (see above paragraph).
Opening an Active Route
To open an Active Route which has already been saved, select [Open Active Route…] from the [Route] menu.
If an Active route is presently opened, this menu option is not available.
The Active Route that you will open has been recorded beforehand as a route or an Active Route using [Save route as… ] or [Save active route as…] from the [Route] menu .
Choose the Active Route that you wish to open, then click Open.
If you have opened a planning route:
1. The software displays the Route chosen and to activate the route you must select the "Convert to active route…" function.
2. The Route becomes the active route; it, as well as the waypoint data window, are displayed on the chart.
Note: (1) - when the active route is converted, the software plots automatically a waypoint at the place of the ship called Waypoint W000, which defines the start of the active route and the associated initial heading. (2) - You can also open route file saved with previous software version.
IMPORTANT If the active file and the chart are in known and different datum , you have to convert the datum.
Related topic:
Horizontal datum conflict chapter.
Automatic pilot connection
In this chapter, you have discovered how the software offers the steersman all the assistance possible to ensure that he follows the course correctly.
If your computer is connected to an autopilot, you can control this from the software:
If you want the software to control the Autopilot, you first have to configure the Input/Output.
To do so, select [Data Input/Output Settings] from [Utilities] menu.
The dialog box is opened and allows you to configure the autopilot.
You can select NMEA183 + Autopilot /Repeater, or an Autopilot/Repeater Output communication port.
58

User Guide
From now on, Automatic Pilot function is on by default.
IMPORTANT This function must be installed with full understanding of the responsibility involved. The user must ensure the safety of the chosen course, and must continually monitor the boat's course safety.
Related Topic :
Connecting equipments
GPS data transfer
This function allows you to manage the data transfer from your computer to the GPS or from the GPS to your computer. This function allows to transfer an active route created under the software to your GPS .
Note : For the active route, only 20 waypoints will be transferred.
Select [GPS Upload / Download] under the [Utilities] menu to call up the dialog box which lets you to customize the GPS data transfer.
If your GPS is configured on another port from the one which is selected.
1. Click on the "Change" button and follow the instructions from the next windows.
2. Eventually, select your GPS model and click on Next button (for example in case you have a Magellan GPS).
3. Now, select the port COM that you wish to use.
4. Select the Baud Rate under the pop up menu. (To choose the speed of transfer please refer to the characteristics of your GPS).
5. In case your GPS is not compatible with the standard NMEA 183, you have to modify parameters according to the GPS.Click on the "Advanced" button (see Flow control data parameters Chapter )
6. Then click on Finish.
According to your GPS model, select available button according to your choice:
Click on the "Upload data" button to transfer data from personal computer to the GPS.
Click on the "Download data" button to transfer data from the GPS to personal Computer.
CAUTIONDownload data function is available only for Magellan GPS.
Data transfer from personal computer to GPS
After having selected [GPS data transfer] option under the [Utilities] menu, the Data transfer window appears.
59

MaxSea Professional Marine Software User Guide v10.3
Click on the "Upload data (personal computer --> GPS)" and check the data that you wish upload.
Four types of data are allowed:
Active route
Separated active route Waypoints
Route
Separated route waypoints
Note: only one choice is possible at the same time. It is possible to transfer only 20 waypoints at most for transferring active route
A dialogue is displayed according to your GPS's model and allows you to rename your active route.
IMPORTANTError messages will be displayed:
If no active route is defined, the software warns you that the data transfer is impossible. Draw an active route and restart the data transfer process.
A message warns you that the active route will be deleted when the data transfer is activated.
At last a message will warn you that the active route stored in your GPS will be replaced by the present active route
Data transfer from the GPS to personal computer
This function is available only for Magellan GPS.
1 - Click on the "Download data" button from the Data transfer dialog box.
2 - Then select the type of data which you want to transfer:
Waypoints
Routes
Tracks points
Tracks
Note: the choice can be done on one or several or the totality of data.
3 - Then check the corresponding boxes that you want to transfer and click on "Ok" to valid.
GPS upload compatibility
Wpts and Active Route : NS = Not Supported
TEST X = OK,
O = not tested
Trade Mark Type Protocol Wpts A_Route Test
FURUNO GP-30 FURUNO OK OK xFURUNO GP-36 FURUNO OK OK x
60

User Guide
FURUNO GP-31 FURUNO OK OK x
MAGELLANColorTrak v1.0 MAGELLAN OK OK o
MAGELLANColorTrak v1.1 MAGELLAN OK OK o
MAGELLANGPS 2000 XL MAGELLAN OK OK o
MAGELLAN GPS 315 MAGELLAN OK OK x
MAGELLANGPS Trakker MAGELLAN OK x
MAGELLAN MéridianXL MAGELLAN OK o
MAGELLAN NAV 6000 MAGELLAN OK o
MAGELLANTrailblazer XL MAGELLAN OK o
MLR
FX 312 (version prog > 2.10)
MLR (FX series) OK x
MLR
FX 412 (version prog > 2.10)
MLR (FX series) OK x
MLR SP 12XMLR (SP series) OK x
MLRVALSAT 2008 M2
MLR (2008 series) OK x
MLR
VALSAT 03 ( 8 canaux)
MLR (2008 series) OK x
MLR
VALSAT 03 ( 5 canaux) ---- NS o
GARMIN GPS - 128 NMEA183 OK x
Your boat on the chart
Drift and surface speed vector
You can now display the Surface speed vector and the Drift vector with the Ground Speed vector on the chart.
To display vectors you have to:
Select "Vector direction display" option
Select corresponding Heading and Speed in the " Data Input/Output Settings Configuration".
How to define vectors
Select Data Input/Output Settings choice: To display:
GROUND SPEED and GROUND HEADING Ground speed vector
61

MaxSea Professional Marine Software User Guide v10.3
SURFACE SPEED and MAGNETIC HEADING Surface speed vector
SURFACE SPEED and GEOGRAPHIC HEADING Surface speed vector
DRIFT SPEED and DRIFT DIRECTION Drift vector
Note: If you do not receive this data from your instruments, you have to select the " MaxSea " Sentence in Data settings windows. MaxSea will calculate missing value (see the following example for drift Speed and direction).
Vectors display
Go to the [Utilities] menu and select [Option: GPS/Track] to choose which drawing vector you want to display on the chart.
Then check on or one of each corresponding boxes.
Blue vector :
A Surface speed vector is displayed on top of the chart
Yellow vector :
A Drift vector is displayed on top of the chart
Red vector :
A Ground speed vector
Related topic :
Input-Output Configuration
Option: GPS/Track
Vector direction display
To modify the vector direction display, select [Option: GPS/Track...] from the [Utilities] menu.
Select the "Misc" to call up the window zone in which you can choose to display or not the Vector direction on the chart.
at any time check or uncheck the direction display box to show or hide.
Security Circle & HDOP
The Ship Centering circle "radius" and "HDOP" display are accessed under the "Mobile" window.
62

User Guide
To define the parameters go to the [Utilities] menu and choose [Options: GPS/Track...].
Security circle option
Select the "Misc" tab
Then check the Security circle box to valid the display, and enter a radius circle value.
The display includes 3 parts:
The distance circle.
A cone of 15°.
A segment at GPS position, Segment length is equal to HDOP.Note: if HDOP is smaller than the boat length, then the segment is equal to the boat length.
HDOP display on the chart shows you the estimate precision of the GPS.
Note : (1) -Cone base width depends on HDOP (Horizontal Dilution Of Position) if it is acquired from GPS. (2) - Cone base width depends on the Mobile width if it is not acquired from the GPS.
Waypoint Auto-Scale function
The Waypoint Auto Scale function allows the software to automatically change the chart scale. Change of scale occurs when the ship gets into the Waypoint arrival circle.
Note that on the large Scale charts (precise) you can see the distances realized thanks to the red circle traced all around the waypoint to be reached.
Configure the Auto-Scale functionSelect [Option : Route] from the [Route] menu to call up the Route preferences dialog box.To activate the Auto Scale function you have to:
Define the Waypoint Arrival Circle Radius
Check "Auto Scale Active Window" box
Assign a new scale to a specific Waypoint under the Waypoint properties window
1. Double-left click on the Waypoint with the Finger tool selected, this brings up the Waypoint Info window.
63

MaxSea Professional Marine Software User Guide v10.3
2. Choose the scale that you want to assign under Chart Scale pop up menu.
Note: the software keeps the current scale if "No" is selected in the Chart Scale Pop Up
Now the software will automatically detect the moment when the ship is close enough to the waypoint and will change the chart scale.
Waypoint Auto-Scale status display
Graphical display of the waypoint scale, relative to current chart scale:
Example : Auto-Scale value
Current Chart Scale
No value chosen for auto scale function :
A point "." Appears into the Waypoint drawn
==>
Route mode
Active Route mode
No 1 : 10 000
The auto scale value is same as current chart scale :
The sign " = " appears into the Waypoint drawn
==>
Route mode
Active Route mode
1 : 10 000 1 : 10 000
The auto scale value is smaller than current chart scale:
The sign " – "appears into the Waypoint drawn
==>
Route mode
Active Route mode
1 : 25 000 1 : 10 000
The auto scale value is bigger than current chart scale:
The sign " + "appears into the Waypoint drawn
==>
Route mode
Active Route mode
1 : 5 000 1 : 10 000
Ship out limits
64

User Guide
When the ship moves off-course, a visual and audio alarm is activated.
To modify the X.T.E., select [Options :Route...] from the [Route] menu to call up the Route preferences dialog box and enter the new headings manually.
Select a value in the Alarm distance text area.
When you activate the Display Alarm Border check box, the Security XTE area is delimited with two doted lines, green and red, on each side of the active route .
Note : you can select in " Waypoint Arrival" part, the automatic passage distance "Circle radius", to switch on the next Waypoint arrival.
Man overboard function
The "man overboard" function ( MOB ) can be a very useful tool when used in addition to usual practice (placing luminous buoys in the water, watchman, placing floating objects in the water, etc.).
Select the buoy icon from the Tools palette.
The following warning applies:
65

MaxSea Professional Marine Software User Guide v10.3
If you acknowledge this warning, the software passes immediately into Man overboard mode:
The chart is displayed in Centered ship mode at a precise scale
(1/2 500).
The active course is erased and a Waypoint is saved at the position where the ship was when the Buoy icon was clicked (overboard point).
The Waypoint display appears as a graphical representation and continually shows the heading and distance to return to the point of fall.
The track display is displayed.Note: (1) - all the open charts are closed except the last one which is displayed in full screen mode. (2) - if a scanned chart was displayed, it is erased.
IMPORTANT 1. The overboard position depends on the precision of the GPS receiver connected at
the moment the function is activated. The repeat error can be great with respect to the man overboard.
2. The man overboard may drift greatly due to winds and currents.
Returning to Normal Mode
You can erase the MOB waypoint using the erasing tool,or by selecting it with the finger or arrow tool and hitting backspace. Open the chart and Change the chart scale with right mouse click and plot again a course.
Charts centering
Center on specific geographic locations
You can quickly move the chart to frequently visited locations by defining centering points.
To define centering points which permit you to directly center the chart on the recorded points:
Go to the [Display] menu and choose [Center On].
To enter centering point, refer to the Related topic:
"Display centering points"
Automatic Screen Centering
66

User Guide
This function puts the chart in centered mode (or Auto Center mode). If the chart was not previously centered on the boat, it is redrawn.
In Center On mode, the chart will automatically be moved when the boat moves out of the centering zone of the screen. This zone is by default located in the middle of the screen and has a width and height equal to half of the size of the screen.
Modification of the centering zone (dimension and position) according to the chosen Chart orientation are explained in the related topics:
Choosing the chart orientation
Customizing the Auto Center mode display
You can activate and deactivate this mode by clicking the Center on /off button located in the Chart palette of each chart window.
1. Click the "Center On/Off" button to activate Automatic Centering mode (or press F2 key board)
2. Click this button again to deactivate the Automatic Centering mode
Unselected
(center off mode)
Selected
(Center on mode)
Note:This Center On/Off button is present on each open chart window. You can activate this mode on only the windows you choose.
Define the automatic centering zone
The boat centering zone corresponds to that part of the screen that the ship icon will not cross in Auto mode. The chart is moved under the boat symbol so the boat symbol icon is re-centered.
To activate this mode Select [Center On/Off] from the [Display] menu.
This zone can be defined by the user at any time. You can configure it so that there is more screen in front of the ship than behind it.
IMPORTANT! When the specified centering zone is very small (and in particular if the ship is moving rapidly in relation to the scale of the chart chosen) performance may suffer if the software must continually redraw the chart.
The default centering zone corresponds to approximately a centered half-screen.
Related topic :
Display Center On/Off mode
67

MaxSea Professional Marine Software User Guide v10.3
Dead reckoning
Dead Reckoning function
The Dead Reckoning function is used for testing and planning purposes as well as in the event your GPS system fails.
Dead reckoning calculates the ship position at any time from a start position, a course and a speed.
This mode allows you to simulate boat movement on your home computer without a GPS connection.
Note: (1) the function calculation starts from the last position acquired by the GPS or simulated. (2) MaxSea starts in acquisition mode (dead reckoning turned off) by default.
To access Dead Reckoning
Select [Dead Reckoning] from the [Utilities] menu.
Click OK and you are now in Dead reckoning mode with GPS input turned off.
The position will be either the present GPS position or the software exit position.
By default the Dead Reckoning palette appears docked on the upper right-hand corner of the layers tool bar as it's shown below and the Data Nav palette becomes your Dead Reckoning control center.
To modify the boat position use the Dead Reckoning symbols. The dead reckoning symbols can be displayed in a floating palette as its shown below.
Use the Dead Reckoning symbols to Modify the boat position (Adjust Dead Reckoning heading and speed).
The two symbols and are used to change the speed of your boat.
The two symbols and are used to change the COG boat clockwise or counter clockwise. The modified values in the DataNav palette.
This symbol is used to change the actual position of your boat.
For more on this function, see "To modify the boat position".
To modify the boat position
The [Dead Reckoning] function is accessed through [Utilities] on the Menu bar.
Click “OK”, and you are now in Dead Reckoning mode.
68

User Guide
Modify the position using the Dead reckoning palette
1 - Click on the Modifying boat position symbol in the Dead Reckoning palette. The "Change Mobile Position" window appears and now you can choose the boat position.
3 - Choose latitude an longitude values using the pull down menu and then, click OK.4 - Or center it around middle of the screen by clicking on the "Get chart center coordinates".
Modify the position using the Position modification tool
You can modify the ship position using the Position modification tool , click one of the plotted Ship icon, then, holding the mouse button down, drag and release the button when the cursor is located on the new desired position.
During the move a screen tip indicates the new direction and distance calculate from the boat position actual.
Adjusting Dead Reckoning Speed and Heading using the Dead Reckoning palette
To fix the ship COG , or speed
Click on one of each symbol or to adjust the speed . At this moment the speed data is updated in the DataNav palette.
Click on each symbol or to adjust heading (clockwise or counter clockwise). The modified heading appears above in the DataNav palette.
To turn off the Dead Reckoning function go to the [Utilities] menu and choose [Dead Reckoning] again.
Bearings
69

MaxSea Professional Marine Software User Guide v10.3
Bearings
In this chapter, you will learn how to obtain a fix on the chart once you have taken the necessary seamark bearings using a compass and radar.
This tool can also be used to record the position of another ship by entering its bearing and range (measured using radar for example).
To access these functions, use the Bearings tool from the Tools palette.
By two bearings
If you have used a compass to take the bearing of two seamarks, drag the bearing line from the first seamark (click, drag and release) and then do the same to set the bearing line of the second seamark.
Select [Calculate fix] from the [Route] menu to obtain as before, the point of the bearing which is recorded in the active layer.
Note:(1) - it is not necessary to lengthen bearing lines to make the intersection, MaxSea will perform this function.(2) - instead of sliding the cursor over the chart you can click the seamark and then use the keyboard to enter the bearing in the dialog box which opens.
As above, either double click the Bearing tool in the Tools palette to erase the trace of the bearing taken or go to the [Route] menu and select [Delete Bearing].
By three bearings
Proceed exactly as explained in the above paragraph, but trace three bearing lines instead of two.
After selecting [Calculate fix] from the [Route] menu, the software displays the point of theoretical calculation as well as the triangle of accuracy.
70
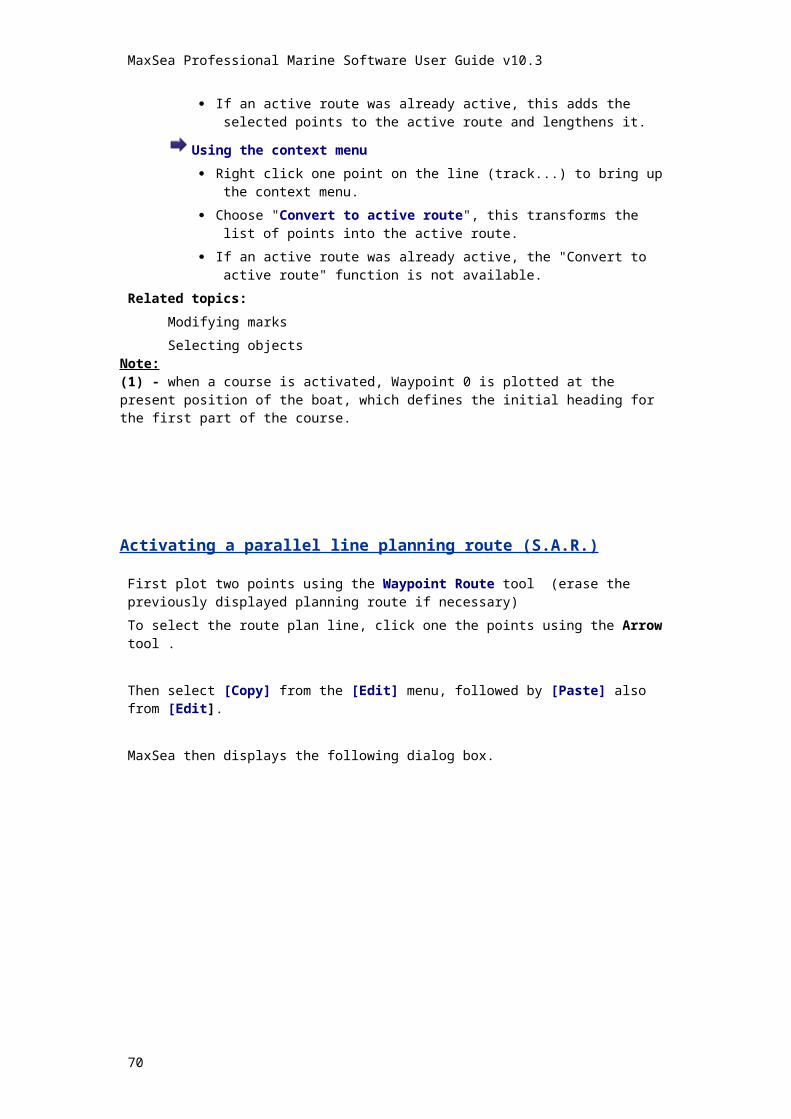
User Guide
These elements (point and triangle) are recorded in the active user's data layer.
Note: instead of sliding the cursor over the chart, you can click the seamark taken, then use the keyboard to enter the bearing in the dialog box available.
As above, double click the Bearing tool in the Tools palette to erase the trace of the bearing taken.
By a bearing and a range
If you have taken the bearing of a seamark ( fixed object such as a point of land) using a compass or a radar and if you know the range separating you from the seamark, click this seamark on the chart and then drag the cursor over to the point where the bearing and range correspond to the values taken.
71

MaxSea Professional Marine Software User Guide v10.3
Select [Calculate fix] from the [Route] menu.
A mark is displayed on the chart and recorded in the active layer. The trace line of the bearing remains displayed on the chart.
Note: instead of sliding the cursor over the chart, you can click the seamark taken, then use the keyboard to enter the bearing in the dialog box available.
Double click the Bearing tool in the Tools palette to erase the track of the bearing taken. Note that the point from the calculation remains displayed on the chart. It has been recorded onto the active fishing plan. Use the delete tool on the palette to delete the point.
Layers
User' data layers
User's data layers
User's data layer are specific vector files (with an extension ".PTF") which stack there transparency on displayed chart and on which user add marks and save his data.
72

User Guide
Refer to chapters Tracking, Adding your personal Marks to learn how to save personal marks onto user's data layers.
It is possible to create and display simultaneously as many layers as is required.
Each layer has a name and is associated to a computer file saved on the hard disk. If need be, you can save the layers onto diskette or other removable media (see paragraph below Saving User's data layer file(s) ).
Each layer can be displayed on or removed from the chart as the user so wishes (this is of course done without losing marks recorded on the layers).
Select the layer that you want to display directly under the list (a mark appears to sign the layer display).
When you quit the software, the list of open layers is recorded (This list can contain up to 50 opened files ) and they will be automatically re-opened when the software is next used.
When the software is first run, an empty user data layer is automatically created and named Layer.ptf. This file is activated and displayed on chart by default.
If you wish to save data that you have plotted on chart, create a new file or save as and rename the current layer file ( layer.ptf by default)
You should save your tracks onto this layer or create a new file which can be named Track.ptf (see chapter Ship track) and your marks onto an another one named Marks.ptf (see chapter Marks ).
Note: You can also create as many user data layers as you wish giving them different names. these files are saved in "My document "folder".
User's data layers
User's data layer are specific vector files (with an extension ".PTF") which stack there transparency on displayed chart and on which user add marks and save his data.
Refer to chapters Tracking, Adding your personal Marks to learn how to save personal marks onto user's data layers.
It is possible to create and display simultaneously as many layers as is required.
Each layer has a name and is associated to a computer file saved on the hard disk. If need be, you can save the layers onto diskette or other removable media (see paragraph below Saving User's data layer file(s) ).
Each layer can be displayed on or removed from the chart as the user so wishes (this is of course done without losing marks recorded on the layers).
Select the layer that you want to display directly under the list (a mark appears to sign the layer display).
When you quit the software, the list of open layers is recorded (This list can contain up to 50 opened files ) and they will be automatically re-opened when the software is next used.
73

MaxSea Professional Marine Software User Guide v10.3
When the software is first run, an empty user data layer is automatically created and named Layer.ptf. This file is activated and displayed on chart by default.
If you wish to save data that you have plotted on chart, create a new file or save as and rename the current layer file ( layer.ptf by default)
You should save your tracks onto this layer or create a new file which can be named Track.ptf (see chapter Ship track) and your marks onto an another one named Marks.ptf (see chapter Marks ).
Note: You can also create as many user data layers as you wish giving them different names. these files are saved in "My document "folder".
Activating a user's data layer
You have seen in the Adding your personal Marks chapter that the marks you plot (marks, lines, areas, etc.) are recorded onto the active user data layer. The name of the active layer is displayed in the charts palette.
When you have created several user data layers, you may want to record some marks on one layer file, and others to a different layer.
To choose the user data layer on which you will save your next marks, select the layer that you wish to activate from the pull-down menu in the Chart palette.
Click the [Layer zone] button, select [Set active file] and click the layer under the list you wish to activate.
IMPORTANT
Always be aware that each time you plot a mark or an event, it is recorded onto the active user data layer whose name is displayed in the Chart palette.
Saving User's Data layer file(s)
IMPORTANT
Each time that you add or modify marks on a user's data layer, the modification is saved in the Layer.ptf file by default. The save is only permanent on different layer files once you have explicitly saved the corresponding user's data layer file (this avoids saving modifications which have been made mistakenly).
YOU SHOULD MAKE REGULAR SAVES ON USER'S DATA LAYER FILES ON WHICH YOU ARE WORKING. YOU SHOULD ALSO BACKUP THIS DATA IN CASE YOUR HARD DRIVE FAILS.
Saving permanently in the active user's data layer file
1. Once you have plotted marks and you wish to save them, press "Ctrl" + "s" or choose [Save] under the [File] menu, this will save automatically all plotted marks in the active layer.
2 - If you have plotted marks and the active file is Layer.ptf (the default layer). When you quit MaxSea, your marks will automatically be saved in "Layer.ptf" file under your "My documents" folder.
3 - when you quit the software or close a user's data layer on which information has been modified, MaxSea gives you the option to save the changes.
Saving in a chosen file
1 - Once you have plotted marks you wish to save them to a file:
74

User Guide
2 - Choose [Save as...] under the [File] menu and select a file and folder in the location window.
3 - The file save dialog box which is displayed allows you to save onto disk in " My documents" folder user data which may be loaded at a later stage and displayed on the chart.
4 - After saving, the new user data layer file is automatically activated and displayed on the chart.
Note: (1) - a file called Layer.ptf exists and it is the User's data layer file by default. You can choose which layer you want to be activated and to be "shown / hidden" (related topics: Activating a User's data layer and Show and Hide user's data layers).(2) - only the layers modified since the last backup will appear in the list and will be displayed on the chart.
Creating user's data layer file (s)
To create a new data layer file:
1 - select [New...] from the [File] menu.
2 - assign a name and specify the path where you want to save the user's data layer file.3 - enter a password if you want to protect your data. This password will be required each time that you wish use this data layer file. if you do not choose a password, anyone can consult this data layer.
Note: The created user's data layer is now the active file and its name is displayed in the Chart palette. At any time you can hide this layer or change the active layer you want to display on the chart.
IMPORTANTIf you have entered a password, this will be required for opening the User's data layer file. You won't be able to open a password-protected layer if you forget the password.
Closing user's data layer file (s)
The different user's data layer files that you have created or opened can be displayed on the chart.
To save computer memory and speed up the software, it is best to close all user data layers that are open but not being actively used.
To close one of these open layer files (it will be on the hard disk, but will not be immediately available in the software).
To close a data file which you have opened before and which is displayed on the chart:
1. select [Close] from the [File] menu.
2. choose the file
3. to simultaneously close several files, press the "Ctrl" key while selecting the files from the close dialog box.
4. click on close to valid.
75

MaxSea Professional Marine Software User Guide v10.3
IMPORTANT
Layer.ptf is the active layer by default and can never be closed.
Note: (1) - when you quit the software the list of files which are currently displayed is saved and the next time the software is launched these files will automatically be opened.(2) - if the user's data layer file(s) that you have closed has/have been modified since the last save, the software informs you that the corresponding file(s) has/have not been saved and offers you the option to do so.(3) - if the user data layer closed was the active layer, the following layer in the list of layers becomes the active layer (its name is displayed in the chart window).
Opening user's data layer file(s)
To open a data file which you have already saved:
1 - select [Open] from the [File] menu.
2 - Next click on the pop-up menu Format of file (*.ptf).
3 - Finally select the personal User's Data file that you want to open from the list and click on Open.
4 - The User's data layer is displayed on the chart. It contains your track and any specific data you’ve
added to the charts.
Note: (1) - You can have multiple user's data layers open at one time.(2) - The recorded files which are opened again in MaxSea can not be updated (as deleted or added points).(3) - If the active file and the chart are in known and different datum , you have to convert the datum. For more information, refer you to Horizontal datum conflict chapter.
Split a user's data layer in half
It may be necessary to split in two parts a user's data layer which is too large in order to use less memory.
IMPORTANT
You are advised not to work with user's data layers greater than 800 K bytes.
Save the initial user data layer before carrying out any of the functions below. If a mistake is made, you can thus recover the original user's data layer.
First of all create a new user's data layer, as explained above, go to the [File] menu and select [New].
You can now split the initial user's data layer into two; one including, for example, marks in the northern part of the zone and another Layer including those of the southern part.
You will be able to, depending on your zone of work, open one or the other (and close that which is not necessary, in order to free space in the memory).
1 - Choose a scale which enables you to view on the screen all the marks saved on the plan.
2 - Select the Arrow tool and beginning in the upper left-hand corner of the screen click and hold the mouse button. Then, drag the mouse until you reach the middle of the screen on the right. Release the mouse button.
76

User Guide
3 - All the marks located in the upper part of the plan (southern part) are selected, whereas all those which are located in the lower part are not (see Modifying marks ).
4 - Select [Cut] from the [Edit] menu.
5 - Select the user's data layer which you wish to copy (that which you have just created), click the layer button on the Charts palette and choose the New file from the pull down menu, then release the mouse button.
6 - Go to the [Edit] menu and select [Paste]. The marks in the southern part of the layer that you wish to copy are now saved on the newly created user's data layer file, those in the northern part remain saved on the initial layer or on a new layer by redoing the manipulation as above.
Note: each layer now uses memory equal to approximately half that of the original layer.
IMPORTANT
The marks in the northern part have been removed from the initial layer. However, they are recorded onto the newly created layer.
Import user's data layer from other plotters
It is possible to read plans from other plotters directly into MaxSea simply by selecting the import item from the MaxSea File menu.
Data is automatically converted into (.ptf) files that can be modified as desired.
To import a file:
1. select [Import to PTF] from the MaxSea [File] menu:
2. Select the format type of the file you want to import:
Plotter Version Method
Turbo 2000 V4.0 DOS and older (6.0.1.21) Direct
Turbo 2000 V5.0 DOS Direct
77

MaxSea Professional Marine Software User Guide v10.3
Furuno GD 180 / 185 Direct or From DOS copy (More Information )
Furuno GD 188 Direct or From DOS copy (More Information )
C-Plot - Direct
Text / ASCII All ASCII files
Pts / Obj MaxSea Exported files directly from the MaxSea software
SeaPlot / Instar v3.0 Exported files directly from the software
QuodFish v210. Windows
( More information)
Direct
ECC v1.8 Direct
P-Sea WinPlot v7.76 Exported files directly from the software
Olex v3.7 Special export (More information)
Penta - Direct
Shipmate RS 2500 - From dumped file (More information)
3. Click on the Next button,
4. Choose the file source directory and click OK,
5. Save the file under the name you have chosen.
6. The file is converted to a (.ptf) file format and you can open it at any time in MaxSea.
Note: the software generates a "Conversion_Log.txt" file with the description of the conversion.
Advanced mode:
Choose this mode if you need to configure the type of conversion in separate files.
Click on the View log button to see the Conversion Results.
You will have to proceed in the same way for the other Conversion types.
Import Fishing plan from QuodFish plotter
There are 4 QuodFish file formats on the market. V1 and v2 are from DOS software, v3 and v4 are from Windows software. All formats have different import requirements.
The QuodFish import is similar to other imports:
You can create one single PTF file from several QF files.
Conversion_log.txt file records the work done.
MaxSea looks for QF files in subfolders of the selected folder.
Expected files: (*.UDB) and (*.TDB)
Expected file versions: version V4.11 (other versions are not imported)
Note: in case of a bad version or any bad file format error, a message is displayed.
Shipmate RS 2500 - Dumped file
A software utility is delivered with the software which allows to create dumped file. This software is named "ANADISK".
78

User Guide
This software is available on the DOS environment.
RS 2500 files is exported using the ANADISK software to PTF format.
Note: the original files can be imported one by one, imported several files into a single PTF file is not available.
Importing plan from OLEX
To convert the data coming out from Plotter Olex, it is necessary to replace 2 files of the system LINUX by scripts which were developed by Informatique & Mer. When these scripts are loaded, the safeguard of the data saved on a diskette is automatically redirected in a specific files.
The files thus obtained could be transferred on a diskette.
This show you how to convert Olex file before importing into MaxSea:
Steps to be following under LINUX
Copy I&M scripts
Save the data
Copy the files on a diskette
Replace the original files
Steps to be following under Windows
Merge the files
The files must be uncompressed and renamed
Convert the data
Then import the data in MaxSea
To get the scripts and / or to obtain more information about the process contact Informatique & Mer
Before Importing data files from FURUNO plotter
If the Windows system cannot read the files which are contained in the disk from Furuno, you have to use before a specific program to make the files available. The program that you have to use is named Swapfuruno.bat and it's run on Windows 98 SE system. This program will read, convert and copy all the files on the computer.
To make the User's data file from FURUNO plotter available on Windows 98 SE system :
1. Insert the FURUNO disk in the disk drive
2. Launch the program from Windows [Start] menu [Programs]
[MaxSea Utilities] [Swapfuruno]
3. Then all the files are automatically converted and saved on your computer in "C:Furunomx" folder .
Now the files are ready and to continue the Imported data process in MaxSea refer you to the "Import user's data layer from other plotters" paragraph .
79

MaxSea Professional Marine Software User Guide v10.3
Marks
Adding personal marks
User data
User data consists of geographical objects (such as points, lines and surfaces) which are displayed on the chart itself.
These objects are saved in files which can then be easily be displayed on the chart or hidden. Each file can be thought of as a transparent layer which can be superimposed on the chart or on other files which are already displayed.
Note: by default the user data which has been entered is saved on the layer called Marks, which is automatically created the first time MaxSea is launched. Refer to the paragraph below entitled Saving user data layers to find out how to save the layer.
From now on, you can assign horizontal datum to old plans and adjust them to every type of chart.
Note: Every simulation and route plan are automatically updated. However, this operation can also be done manually with the horizontal datum conversion box from Edit menu.
Before looking at this chapter, the Tool Box should be displayed in a long configuration by clicking on the key located in the upper right-hand corner of the box’s title bar (see Software configuration ).
Selecting plotting type and icon
First, select the type of object that you wish to plot. To do this, click the Plotting type selection tool located in the Tools palette to call up the pop-up menu corresponding to the different types of objects.
1. Select Point in the Plotting type selection menu.
2. Then, choose the icon you require from the icon type pop-up menu (a wreck for example).
80

User Guide
Note: you can change the icon palette settings by selecting the item [Option:Customize icons...] from the [Utilities] menu.
Then select the color of the icon from the corresponding pop-up menu.
The selection boxes indicate the choices you have made; isolated point, red wreck.
Related topic:
Customizing Icons
Customizing Icons
The MaxSea Icon palette offers 81 icons by default. But you have the possibility to customize this palette by selecting new icons from the several hundred at your disposal.
To add new icons or change the icon palette, select [Option: Customize Icons] from the [Utilities] menu:
Then, the following dialog box is opened:
81

MaxSea Professional Marine Software User Guide v10.3
The left part of the box displays the used icons as the right part shows the available icons. The user palette can contain up to 100 icons.
To add a new icon
You can add up to 100 icons.
1. Click on the icon of your choice among the available icons.
2. Click on the left arrow to see the new icon positioning in the user palette
3. Repeat the same operation so much that it is possible.
To replace an icon
Click on the icon of your choice and drag it towards the one to be replaced.
To delete an icon
82

User Guide
Click on the icon to be deleted, then click on the right arrow or on the DEL key of your keyboard like in the example above.
To come back to the default configuration, simply click on the Default Config button.
Plotting isolated points
Select the Plotting tool in the Tools palette and place the cursor on the chart at the required position.
A target is drawn on the chart ( (1) on following picture) to indicate the precisely clicked position.
Then click, a mark is displayed at the position and it is immediately saved onto the active layer (Layer(WGS84) by default).
83

MaxSea Professional Marine Software User Guide v10.3
Repeat the operation, changing the icon or colors if necessary, to plot several marks.
Plotting lines
Proceed as in the above paragraph, but select Line (instead of Isolated point) from the mark-type pop-up menu. Then select the icon. Of course, you can choose another icon or no icon at all (first box in upper left-hand corner). You can modify line thickness using the corresponding pop-up menu which is now available in the lower part of the Tools palette.
Before plotting a line:1. select the line symbol under the pop up "Plotting object type" menu from the tools
palette.2. choose the width line size under the pop up "Plotting object width line size" menu
from the tools palette.3. choose a color from the pop up menu "Plotting object color" menu from the tools
palette.
Using the Plotting tool, click a point on the chart to start the line and then click successive points to extend it. To finish this operation, double click the last point.
Plot other lines as required.
Note: to call up the dialog box which allows you to assign a label, left click while holding down the shift keyboard.
Plotting areas
Select Area from the mark type selection box.
84

User Guide
The pattern selection box in the lower left-hand corner of the selection boxes is now available (it replaces the line thickness box).
Click it to call up the pop-up menu and select the pattern that you wish to use to fill the area.
Proceed exactly as in the above paragraph for plotting a line. After double clicking to close, the area is closed and colored with the pattern selected.
In order to plot a circular area, select Circle (instead of Area) from the mark type selection box. Click the chart, then drag the mouse and release the mouse button to define the radius of the circle. Note that the circle is colored with the pattern selected.
Note: if you click the chart and do not hold the mouse button down, the software displays the dialog box where you can enter the circle radius value manually.
You can either display a complete circle or a sector of a circle. To display a sector enter the value of the starting angle and the value of the arc in the dialog box.
Line distance or area calculation display
You can get information about coordinate of one point situated on a line or about an area calculation.
85

MaxSea Professional Marine Software User Guide v10.3
Coordinate of one point which belongs to a line
1. left-click on a line section with the Finger tool
2. hold the mouse button down. The software displays the selected coordinate point.
Note: if you select a point as above this information does not appeared (see Mark label paragraph).
Area calculation:
1. select the Area with the Finger tool
2. hold the mouse button down, the software displays the area calculation.
Note : to change units refer to Option: units chapter.
Enter a text
1. Choose Text option from the plotting object type selection box.
86

User Guide
2. Using the Plotting tool, click the chart at the required position. A text dialog box appears.
3. Type in your text (64 characters maximum) and click OK. The entered text is displayed on the chart at the position clicked.
If you want to change the font and the characteristics: Option: Text
Mark properties
Double left-click on a mark using the Select point tool opens the information window.
To update parameters which are associated to a point, click on any of one of these elements.
The "Mark properties" dialog box contains:
1. available datum information in upper right-hand corner.
2. the Latitude value (Data zone).
3. the Longitude value (Data zone).
4. symbol associated to a mark.
5. symbol color associated to a mark.
6. name associated to a mark.
7. created date/ hour associated to a mark..
8. mark depth value associated to a mark.
9. mark comments associated to a mark.
Several data fields are directly modified in the "Mark properties" dialog box.
1. to change the symbol color; left-click and hold down the mouse button to bring up the color palette and then choose a color among it.
2. to change the symbol left-click and hold down the mouse button to bring up the palette and then choose a new symbol among it.
3. to update a text zone (name and comments): left-click in the text field zone and enter directly the text using the keyboard.
4. to update a data zone (date/hour and latitude/longitude): left-click in the data zone at this moment a scroll appears in order to allow a seizure without the assistance of the keyboard.
87

MaxSea Professional Marine Software User Guide v10.3
5. to valid the update click on OK.
6. to close the information window, click the closing box located in the left-hand part of the title bar of the window or click on cancel. In these two cases the modifications are not taken in account.
Notes
1. The "Apply Depth/Height to all points" check box is available only when the selected point belongs to a multi-points system like a line, an area...
2. The mark label includes a maximum of 8 characters which are displayed beside the
mark icon. .
3. The number of the characters for the comment is unlimited. Click once with the finger tool on a point to display the comment associated to a point.
4. right-hand arrow near the scroll of the date/hour data field appears and click on it to bring up a calendar in which you can choose directly the date.
Using context menu on selected marks
The software makes extensive use of context menus, which let you quickly access the most useful commands related to the object you have selected.
Using context menus
1 - Right-click the object located in the chart window. The context menu for the selected object appears.
2 - Choose the corresponding command.
Common commands for each object selected:
In the upper of the context menu:
1 - to select a scale
2 - to select the Zoom in function.
3 - to select the Zoom out function.
In the bottom of the context menu:
2 - to select a tool at any time.
If the selected object is either a mark or a circle or a text, each context menu will allow you:
1 - to bring up the Mark properties dialog box by selecting "Mark Properties.." How to modify the parameters refer to related topic:Mark properties.
2 - to move the mark to the position you want by selecting "Move", this brings up a dialog box in which you can enter moving values.
3 - to delete the mark.
4 - to select the mark.
88

User Guide
5 - to add object (mark, line, area, text, planning route and active route waypoint...) or to create a list of marks. Be careful to select a symbol in the Icon palette before adding a list of marks (however, adding a list of marks refer to related topic: Using the keyboard to enter positions).
If the selected object is a line the context menu will allow you:
1 - to convert the line to planning route (available if no planning route is opened)
2 - to convert the line to active route (available if no active route is opened)
3 - to call up the point properties.
4 - to move the line to the position you want, then enter the new values in the Move dialog box.
5 - to delete the line.
6 - to split a line, this will cut the line in two parts.
7 - to select a point or all points belong to the line.
If the selected object is an area the context menu will allow you:
1 - Select "Move" under the menu to move the area to the position you want, this brings up a dialog box in which you can enter the new values in the Move dialog box.
2 - to quickly delete the area.
3 - to quickly select the area.
Using the keyboard to enter positions
In order to enter the position of the points, first choose the type of point that you wish to record by selecting the corresponding tool in the Tools palette ( be careful to select symbol icon and color before adding positions).
Two ways to call up the dialog box which allows you to enter positions using the keyboard.
1 - either go to the [Edit] menu and select [Create Mark list...]
2 - or right click any where in the chart window to call up the context menu, point to "Add" and left click on "Create Mark list..."
Enter geographic positions in the Create Mark dialog box
1 - choose under the pop up menu the datum according to the positions.
2 - enter the geographic positions you wish. After every seizure, press Enter on keyboard to confirm each position.
3 - since datum, latitude and longitude are now again selected, you can immediately plot the next new point from the keyboard and thus link several points.
Modifying personal marks
Modifying marks
89

MaxSea Professional Marine Software User Guide v10.3
It is possible to modify all types of marks saved (tracks, marks, events, waypoints, etc.).
Four tools from the Tools palette can be used to easily modify the marks that you have plotted.
1. delete tool (pacman symbol)
2. Split tool (scissor symbol)
3. Position modification tool
4. Insertion toolNote: (1) - Select a modification tool and click a point to apply the modification (erase, cut, etc.). If you have previously selected a group of marks, as explained in the paragraphs below Selecting objects, when you modify one of the selection points, the modification is applied to all the marks selected.(2) - It is not possible to modify the track when it is being saved (active track in use).
Removing marks
Removing a point
The Delete tool is used to delete a saved mark. Click on a saved mark or on one of the points of a line, for example.
Removing an object
To erase a complete object (line or area), proceed as above with the Dele tool but hold down the Ctrl Key under Windows. Clicking one point will erase the whole object.
Removing the selection
Select, as explained in the paragraph Selecting objects, all the points and objects that you wish to erase. Then select [Cut] from the [Edit] menu (Ctrl + X).
Note: all of these functions are available directly under the context menu (right click on the mark to call it up)
Modifying the position
Moving the position of a point
Using the Position modification tool click one of the plotted marks, then, holding the mouse button down, drag and finally release the button when the cursor is located on the new required position. Similarly, modify the position of other points, in particular, those belonging to a line and note the result.
If you double click a mark using the Position modification tool the modification dialog box appears in which you can enter manually the position modification precisely using geographical or hyperbolic coordinates.
If you wish to assign a new position to an existing mark (geographical or hyperbolic) you can use the keyboard to enter this position. First, click the mark using the Position modification tool in order to select the required mark, then select latitude from the cursor display (or the first hyperbolic coordinate) and enter the required value.
IMPORTANT!
90

User Guide
This last function can only be used on isolated points.
Modifying the object position
Proceed as above using the Position modification tool , but hold down the Control Key while you move one of the points of the object.
Modifying the position of a selection
Select, as explained in the paragraph Selecting objects , all the points and objects that you wish to move.
Then click one of the points using the Position modification tool and drag the mouse until the new position is reached (or double click the point to open the modification dialog box as indicated above).
Cutting a line in two
Using the Split tool click a point on a line (for example an old track ).
The line is cut after the point clicked.
Inserting a point
The Insert tool can be used to insert a new point on an existing line (or area).
1. Select the Insert tool from the Tools palette (note that the cursor appears as
on the screen).
2. Click a point on the line after which a new point is to be inserted.
3. Drag the cursor ( at this moment two lines are drawn in red and green colors) to the position of the new point. This is inserted on the line in place of the initially selected point.
Note: (1) - once you have selected the Insert point on the line (the cursor then appears as a Plotting tool but the Insert tool is still selected in the Tools palette), you can use the keyboard to enter the position of the point to be inserted in the cursor display.(2) - right click a point to bring up the context menu to quickly select this tool.
Selecting objects
The Select point tool and the Select object tool are used to select points and/or objects (lines, areas) in order to apply modifications such as removing or modifying the position (see paragraphs above).
Selecting points and objects
Using the Select point tool click a point ( Waypoint , mark, etc.) to select it (it is highlighted).
91
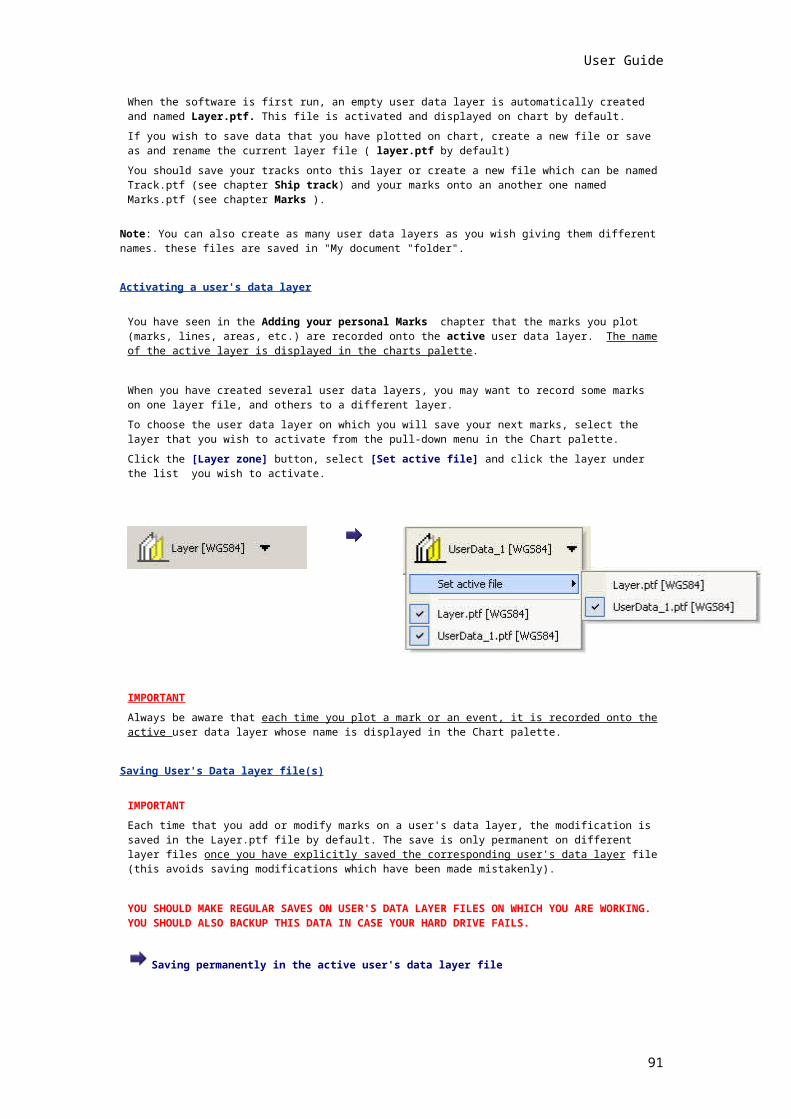
MaxSea Professional Marine Software User Guide v10.3
If you use the Select object tool , instead of the Select point tool , the complete object (line, area) to which the point clicked belongs is selected.
Note: (1) - You can make multiple selections by holding the Shift key down while you click points or objects using the Select point or Select object tools.(2) - To deselect all of the points selected, click the chart away from the points using the Select point or Select object tools or click these tools in the Tools palette.
Selecting a region
Using the Select point tool click then drag around the region to be selected. When you release the mouse button, all the points located in the region that you have covered are selected (waypoints, personal marks, track points, etc.). They are highlighted.
The Select object tool can be used in exactly the same manner as the Select point tool but it covers a rectangular region and not a free-form one. As with the Select point tool all the points in the region are selected.
Note: to deselect all the points selected, click the chart using the Select point or the Select object tools or click these tools in the Tools palette.
[Selecting all...] under the [Edit] menu
This option can be useful when you want to copy all plotting data from the active layer to another layer.
Related topic : "Copying Marks and tracks"
Selecting a type of object
1. Go to the [Edit] menu, choose [Select ...].
2. Choose the type of object as well as the characteristics (color, etc.) that you wish to look for, then click OK.
All the objects displayed which meet search criteria are selected. You can then apply a modification.
Transforming objects
You can modify display parameters or the type of object that you have already saved. For example, you may modify a certain type of icon, transform isolated points into a line, etc.
To do this, first select as explained in the above paragraph, the objects that you wish to transform. You can select either a single point or a group of point (for example a line).
Once the object has been selected, choose [Change selection] from the [Edit] menu to call up the Modifying selection dialogue box.
The dialog box consists in two parts :
1 - In the upper of the window you can change:
the color
the icon symbol
the line width (this is possible only if the selected object is a line)
92
User Guide
the pattern
1. Check the box nearest the type you wish to change
2. Then select the new type you want to assign.
3. Click OK to valid the transformation.
2 - In the bottom of the window the Object type option allows you :
to transform all isolated points into a line or area.
to transform a line or area into isolated points.
1. Choose the transformation parameters from the dialog box in particular the type of new object in the lower part of the dialog (a line for example).
2. Then click OK.
IMPORTANT If you wish to transform isolated points into a line, take care to select points in the order of the required line.
If you wish to transform a line into isolated points, take care to select a type of symbol icon.
Editing a track
See paragraph Editing a track in the chapter Ship track .
related topic:Editing a track
Copying marks and tracks
You can copy personal marks (marks, tracks, etc.) or groups of marks.
1. To do this, first select, as explained in the above paragraph, the marks that you want to copy.
2. Select [Copy] from the [Edit] menu (or Cut if you do not wish to keep the points originally selected).
3. Then select [Paste] from the [Edit] menu. This brings up the open file dialog box.
4. Select the user data layers from which you wish to copy, then click OK.
This very powerful function enables you to duplicate or transfer marks from one plan to another. Therefore, you can, for example, copy Decca tracks or marks onto a new plan, then apply a GPS position modification on another plan. You will then have an original plan of Decca references and on a new plan the same marks but from GPS.
Tracks
Tracking on / off
Tracking
Click the Track on/off button in the Tools palette to activate the tracking function.
The button appears selected in the tools palette during all the time the tracking function is activated
.
93

MaxSea Professional Marine Software User Guide v10.3
You can also use the shortcut F5 if you have selected it from the [Route] menu.
The track is displayed on the chart and saved. If several positioning systems are connected, the program can save the track of the different positioning systems (see paragraph bellow Several positioning systems connected ).
No position
The Track on/off and MOB button are not available and appear in grey color. It indicates that MaxSea is in "0 POS" configuration.
Note: if you often remain in tracking mode, the display speed of the chart can be effected due to lack of memory; particularly if the save interval is short. In this case, either the time between saves (see paragraph Setting Track Options below) or periodically save or erase the track (refer to rest of this chapter, as well as the chapter ).
Stop the tracking function
The Track off button becomes on Track on when you click on it.
Click on the Track on/off button again in the Tools palette to turn off the tracking function.
The program gives you the option to save the track permanently in a "PTF" file on the hard drive (Layer [WGS84] by default).
Left-clicking on "Save" will save the track in the layer.ptf and clicking on "Do not Save" will loose the save of track.
Left-clicking on "New file" will save the track in a chosen file.
Left-clicking on "Open file" has two effects open an existing file and save the track in it.
Set track parameters
94

User Guide
Go to the [Utilities], then Select [ Option: GPS/Track...] and click on the [Track] tab, then choose the parameters for how you want to save the track.
Enable track recording is checked, the track is automatically saved into the active layer.
Record all input data is checked any data selected from your wind instruments will be recorded.
Single user file for mobile trails
Recording accuracy
o Define the precision of your track (i.e. the interval between two saved points) in either time or distance.
o We would advise a frequency of between 120 and 300 seconds (2 to 5 minutes) which is sufficiently adequate for normal navigation requirements.
Track line options
There are a series of options with the track. You can have just a basic trail of a fixed color or you can have a trail which varies in color according to the input of specific information from sailing instruments.
o Line width track :Click on the pop-up menu to choose one type of line which stands out on the charts.
o Colour of track : Select the color of your track by clicking on the corresponding pop-up menu, click on the desired color in the box and select, for example, the color red.
o Variable color: You could chose a variable track color in accordance with one of the data sources recognised by the software (e.g. speed of the ship, wind force factor, etc.).
Note: the data sources are dependent upon the electronic equipment installed.
Firstly click on the radio button Variable Color and choose a data under the pop up which then on the pop-up menu of available data to show the list of available data and select the data in accordance to which the color is to be varied (for example, speed).
Using the keyboard select the delimiting speed values by successively selecting text zones (for example, speed of less than 5 knots: blue track; speed exceeding 10 knots: red track; speed between the two: variable color).
(Related topic: Option Mobile and Track)
Several positioning systems connected
Several positioning systems can be connected to certain versions of MaxSea.
In this case, it is possible to choose the type of display and tracking options for each one of them.
One of these connected positioning system is considered to be the master positioning system.
Choosing the master positioning system
To choose the master positioning system, select the menu [Option: GPS/Track...] from the [Utilities] menu and select the required positioning system. Then select from the list on the left-hand window the system you want to choose as the master positioning system.
Note: the name assigned to each positioning system is specified in the Data Input/Output Settings management (see in How to easily… Connect equipments to MaxSea).
Setting the display and tracking options for each positioning system
It is possible to choose the type of display and save the track for the master positioning system and also from all the other connected positioning systems.
When you activate the Track button in the Tools palette, all the "positioning systems" for which track saving is active are tracked.
95

MaxSea Professional Marine Software User Guide v10.3
To set the display type and track save options from the different positioning systems, select [Option: GPS/Track..] from the [Utilities] menu to open the dialog box.
1. Select a Positioning system in the "Select a mobile" list zone in the left part of the dialog box
2. Choose the positioning system that you wish to set options for.
3. Click on the Track tab in the right part of the dialog box.
4. Choose the track saving options, Recording accuracy and the Track line.
5. Click on the Misc tab.
6. Choose the options you wish to display (security circle, directional vectors,....).Note: repeat this procedure for each one of the connected positioning systems (using the pop-up menu Other system located in the Positioning system in the upper part of the dialog box) in order to set up all of them.
Profile
With the MaxSea Professional version, measurements from different sensors (depth, water temperature, etc.) can be recorded for each point of the track .
When a sounder is connected to MaxSea, the measurement from the sounder is recorded for each point of the track.
MaxSea can thus be used to display the bottom profile or the profile of one of the connected sensors (water temperature, etc.).
You can either display the profile associated to a previously saved old track, or display the profile of the track which is being recorded.
Profile of an old track
Select an old track by clicking the Select object tool (if need be, see chapter Modifying marks for more information on this tool).
Then click on the Profile button located on the Charts Palette.
In the dialog box, call up the pop-up menu and select what type of profile you wish to display (bottom profile, temperature profile, etc.). Then click OK to display the window of the corresponding profile.
Note: the list shown depends on the equipment connected. See chapter Connection.
Profile of current track
Check that no track and no object is selected, then click on the profile button and proceed as in the above paragraph.
96

User Guide
Note: if the track is not activated, it is automatically activated (the Track off button in the Tools palette changes to Track on).
Profile window
The profile window is always associated to a track (either a previously saved old track, or the current track).
Note: the track is displayed in the profile window moving from left to right (start of left line).
You can modify the scale of the window profile using the Magnifying tool , in exactly the same manner as used for the chart.
Note: certain scales are not accessible as they are not applicable to the corresponding track.
You can also use the horizontal and vertical scrolling bars of the window to move along the profile.
When you display the profile of the current track the buttons and , located in the lower left-hand corner of the profile window, can be used to center automatically on the ship (AutoH) and on the immediate vertical value of the profile (AutoV). Click on each one of these buttons to activate or deactivate the corresponding auto mode.
Note: in AutoH mode, the ship is positioned to the right in the profile window and the profile of the track runs to the left.
Finally, the two selection arrows , located in the upper right-hand corner of the profile window, can be used to modify the vertical spread of the display of the display window, thus enabling the displayed profile to be expanded as on a depth echo sounder.
Note: the current sounder is displayed in the upper right-hand corner of the Profile window: the profile distance, as well as the number of points of the corresponding track, are displayed in the lower part of the window.
Modifying tracks
Removing a track
97

MaxSea Professional Marine Software User Guide v10.3
To remove a previously saved old track , select the Select object tool , then on click one of the points of the track to select it (if need be, see chapter Modifying marks ).
Select [Cut] from the [Edit] menu to erase the track selected (or even press the erase button).
Note: it is not possible to erase the current track in this way. If you wish to erase the current track, first stop the tracking (see previous paragraph Stopping the track save).
Edit Color Range
This function allows you to customize your track color according to selected received data.
To change the color of the track go to the [Utilities] menu and select [Option: GPS/Track]. This brings up a settings dialog box.
1 - Click the track tab in the upper of the window.
2 - In the bottom of the window click in the "According to.." radio button to assign a color to a track according to the parameter that you wish : for example, the track depending on the SOG , you can choose one colour for the 0.0 to the 4.0 knots interval, and an other one for the 4.0 to 20.0 knots interval, so that you can see your track at a glance.
Note: the information depends on the electronic equipment connected.
3 - First, for example select the SOG interval on which color will be apply.
4 - Click on the Apply button to confirm.
5 - Then, choose between the 16 colours proposed to you by using the Number of colors pop-up
Note: you can customize the colors by right clicking on a color.
6 - You can also define more precisely the value intervals by right clicking any value slider:
7 - Finally, click on the Apply button.
Recording all data option in the GPS/Track settings dialog box
It is possible to save all the input data (speed, course, wind, etc.) associated with any given point of the track.
To do this activate the check-box Record all input data which is situated in the top right-hand corner of the dialog box.
Editing a track
IMPORTANTThis function is not used when the tracking on function is in use.
To modify Edit track parameters
1. Select an old track using the select point tool
2. Go to the [Edit] menu and choose [Edit track]
The Edit track dialog box appears
To modify a characteristic of the track, check box according to what you want to change between:
1. The line width
98

User Guide
2. The line colour
3. The line smoothing Note: you can change one or all of the characteristics.
If the line width option is selected, click on the pop up menu and choose a type of width.
If the line colour option is selected, either choose a fixed color or a color according to a data like the depth for example.
If the line smoothing option is selected you can choose between three options (medium, light or important)
IMPORTANT
The smoothing function can modify the track and you may lost the initial saving. It is recommended to make a copy of the file before doing any modification on the track.
To valid all the modify click OK and CANCEL to quit without saving.
To change track into Planning Route
This function can be used, for example, to transform an old track into an Route Plan.
Two ways to convert a track into a Planning Route :
Select, in the required order, a list of points (personal marks), or select a complete line or a track for example (see chapter User's Data Layers / Marks / Modify marks , and the paragraph Select objects ).
Then select the planning route Waypoint tool from the Tools palette, and click one of the points of the selection.
The selection is transformed into the active route.
Select a complete line or a track . Then select the Compass tool from the Tools palette, and click one of the points of the selection with the right mouse button.
Now your selection is transformed into the Route Plan.
Note: The line or a track will NOT be erased. The Planning Route will be superposed to the line or the track.
To change a track into Active Route
This function can be used, for example, to transform an old track into an active route, or constitute a waypoint library that you choose depending on requirements and in the order that you wish.
Select, in the required order, a list of points (personal marks), or select a complete line or a track for example (see chapter Modifying marks , and the paragraph Selecting objects ).
Then select the Active Route Waypoint tool from the Tools palette, and click one of the points of the selection.
Now your selection is transformed into the active course (this is possible only if any active route is presently activated)
Transform the track into Active Route using the context menu, two ways to do it:
1 - if any Active Route is presently activate:
right click on a point of the track to bring up the context menu.
select "Convert to Active Route" the track is immediately transformed into Active Route.
2 - if an active route was already activate, to change the track into active route:
select first the track.
99

MaxSea Professional Marine Software User Guide v10.3
Right click on the selected track to call up the context menu.
Point the Add item and click on Active Waypoint.
All the points on the track are simultaneously transformed and added to the present active route. This function adds the selected points to the active route and lengthens it.
Note: (1) - when a course is activated, Waypoint 0 is plotted at the present position of the ship, which defines the initial heading for the first part of the course.(2) - If you double click on the active waypoint, this will erase the active route and not the track.
Cutting a track in half
This function enables you, for example, to keep only the valid part of a track .
IMPORTANT!You can not modify the track during saving.
Select the Deleting tool (scissor symbol) by clicking it in the Tools palette, then on click the point of the track after which you wish to cut the track.
You can now erase one of the parts of the track, as explained in the above paragraph, in order to keep only the valid part.
Events
Events
Manual or automatic events are saved as in the case of the marks that were shown in the previous chapter onto the active User Data Layer.
When you create a manual or automatic event, a mark is saved onto the active fishing plan at the present position of the ship.
IMPORTANT
Plotting and modification of events is saved in the RAM. The save is only permanent once you have explicitly saved the corresponding fishing plan (this avoids saving modifications which have been made by mistake). You should save regularly the layer you are working on.
Related topic:
1. Opening user's data layer file(s)
2. Saving User's data layer file(s)
3. Closing user's data layer file (s)
Events palette
At any time you can display the Events palette, go to the [Display] menu and select [Events Display].
100

User Guide
This palette represents the exact image of the Numeric keypad and allows you to create events with a simple click on an icon symbol. Each symbols are according to a number key of your numeric keypad.
To enter an event click on a number key (or on an icon) and click Enter to confirm.
As The other palette you can move the Events palette and change its size display on the screen.
Manual event
Different manual events can be assigned to the number keys (0, 1, 2, etc.) on the numeric keypad located to the right of your keyboard.
Each key corresponds to an icon that you choose beforehand.
Related topic:
Configuring the numeric keypad
Press one of the number keys and note that an event is saved at the present position of your boat.
Note:(1) - if a sounder is connected, the associate value is the one of the sounder.(2) - if you press Enter (on the right-hand side of your keyboard) you save an event mark as the icon presently selected in the Tools palette.
Related topic:
Marks for more information on icon choice
Automatic events
Select [Automatic Event On] from the [Route] menu to begin automatically saving events. (Shift + F7)
Note: A check mark is now displayed in front of the [Automatic Event ON] menu to indicate that this function is active.
If a sounder is connected, the depth associated with this mark is recorded.
Select [Automatic Events On] again from the [Route] menu to deactivate the saving function.
Refer to the "Option:Events..." to customize the numeric keypad (choosing the symbol according to an event ) when automatic events are saved
Charts
Using numeric charts
Using numeric charts
101

MaxSea Professional Marine Software User Guide v10.3
The software is compatible with cartographic data from several producers, this data may be in vectorial (Vector Charts) or rasterized (Raster Charts) form saved on the hard disk or CD-ROM.
(contact your dealer for more information concerning data available).
You can choose the chart to be used depending on your requirements.
In this chapter you will learn how to choose the chart, choosing the scale , and how to display the chart.
1. Opening a chart
2. Chart zone information
3. Chart windows
4. Choosing the chart scale
5. Moving the chart
6. Choosing the chart orientation
7. "Center on" specific locations
8. Charts properties
9. Closing a chart
10. Using context menu
Using numeric charts
The software is compatible with cartographic data from several producers, this data may be in vectorial (Vector Charts) or rasterized (Raster Charts) form saved on the hard disk or CD-ROM.
(contact your dealer for more information concerning data available).
You can choose the chart to be used depending on your requirements.
In this chapter you will learn how to choose the chart, choosing the scale , and how to display the chart.
1. Opening a chart
2. Chart zone information
3. Chart windows
4. Choosing the chart scale
5. Moving the chart
6. Choosing the chart orientation
7. "Center on" specific locations
8. Charts properties
9. Closing a chart
10. Using context menu
Opening a chart
1 - Automatic opening at first starting up the software
At the first start, the software automatically detects the presence of all available charts (chart CD in the CD drive and on your Hard Disk).
The automatic opening chart function looks :
All folders inside "My documents" folder.
All first level folders inside the Hard Drives or CD drive.
102

User Guide
The Mapmedia CD300/01 (worldwide planning charts) is automatically installed in "My Documents" folder.
The first time you open the software you will be shown the “Open Chart” window, from which you can choose under a list the chart you wish to open.
All of the charts you have installed will be shown to you. To simultaneously open several charts. To do so, press the Ctrl key while selecting each chart you want to open.
2 - Launch again the automatic opening
To open a specific chart region (or series of chart regions) go to [File] on the menu bar, and then click on [Open Chart]. To stop the automatic "Chart search" click the ESC key.
The "Open chart" window appears and shows all the charts that the software has found.
Select a chart or several charts (to do so, press the Ctrl key while selecting the charts and click OK.
The dialog box with the warning about the use of digitized documents appears. Click I AGREE to agree.
3 - Manual Opening
However, you can also open a chart by selecting [Open] from the [File] menu, like you used to do with previous versions of software, or, for example, if you want to open charts you have already installed on your hard drive.
The Open file window appears and allows you to specify the location where you want to locate the chart.
Then pull down the pop-up menu File of type and select the type of the chart that you wish to open ( vector or rasterized). For example, if you wish to open a Mapmedia CD-ROM, select Mapmedia from the File of type pop-up menu.
Insert the Mapmedia CD-ROM that you wish to open. After a short while, the contents of the CD-ROM are displayed as a list in the dialog box.
Select the chart stored on the CD-ROM by clicking its name in the list; then click Open (or double click the chart name in the list).
The dialog box with the warning about the use of digitized documents appears. Click Accept if you agree.
After it has been loaded, the Mapmedia chart is displayed in the chart window.
If you forget to enter your personal codes before starting up the software, it shows automatically the "MapMedia user permit" dialogue box.
4 - the chart is opened and displayed in the chart window
103

MaxSea Professional Marine Software User Guide v10.3
The boundaries, or outlines, of the charts you have installed are displayed on the chart to help you to find them quickly. This feature is activated by default. If you want to disable this option, select the [option: Display...] from the [Display] menu and check or un check "Chart outlines display" box .
The chart outline display represents a chart that is currently being used at that scale.
Note: (1) - The software will remember which charts were open and will display the same charts the next time the program is started.(2) - opening certain types of charts causes the previously used chart to close automatically.(3) - if you need to enter unlock codes for using Mapmedia charts go to the [File] menu and select [Mapmedia User Permits...] (4) - at any time you can access to the managing vector charts useful functions to update the data or to order. go to the [File] menu and select [Manage 3D Database] (Related topic:Vector charts installation process)
Chart zone information
The chart zone information is the chart engine for each opened chart window. It allows you to choose which chart you want to display and to customize its display appearance when it is possible (see Vector chart)
The Chart zone information in the Chart palette lets you control :
1. When several Raster charts are opened together in the same window chart to choose which one you want to show or to hide.
2. When Vector chart is opened in the chart window to change the information display (a chart window for a type of vector chart, you can not open different type of vector together in the same window).
3. To display geographic grid.
IMPORTANTEach opened chart window has its own menu chart display and it depends to the type of the chart.
Chart windows
MaxSea allows you to work at the same time on several opened chart windows.
Opening a new chart window:
1. Select [New Chart window] from the [Window] menu.
2. At this moment a new option is added in the [Window] menu list.
Then you can choose the mode of the opened windows three modes of window display are proposed :
1. Tile vertical
2. Tile horizontal
3. Cascade
Choosing the chart scale
Generally, the software operates charts under a seamless mode. This is the case for vector charts, as well as Mapmedia raster charts.
You can change the scale of a chart in several ways:
104

User Guide
1 - Using the Magnifying tool to zoom in a chosen zone
At the upper of the tools palette is the Chart Scale Selection Tool named Magnifying tool . Click on once, then move the tool to the center of the area in which you want the new chart to open. Hold down the mouse button while moving the mouse to the selected area, release the button to zoom in.
2 - Using the "Zoom in" and "Zoom out" tools
Single Left-click the "Zoom out" tool under the tools palette zooms out the chart view i. This tool is useful when you want to undo the last zoom in.
Single Left-click the "Zoom in" tool under the tools palette zooms in the current chart view.
3 - Using the Scale pop-up palette which provides easy access to select available chart scales.
at any time with other tool selected right-click any where in the chart window to bring up the Scale pop-up palette, as mentioned below.
under the [Display] menu choose [Select Scale] to bring up the scale pop-up palette as mentioned below.
The available scales are indicated by a drawing symbol next to their numbers. The current activate chart scale in the "Scale Pop Up" is written in Bold character.
Simply choose the desired scale, Left-click the mouse button. The chart is drawn at the scale chosen and centered on the point clicked.
Note: (1) - the drawing symbol next to available scale indicates the type of data available at this scale.
chart data
105

MaxSea Professional Marine Software User Guide v10.3
depth data
chart and depth data
(2) - if you have a wheel mouse roll it up or down to zoom in or zoom out in the chart window.
Moving the chart
You can move a chart in its window in several ways.
1 - Hand tool
The Hand tool is what you use for panning and to access the chart data.
Left-click on once and move the cursor over the chart in the center of screen.
single-click the left mouse button to move the chart anywhere you want it to go.
double-click the left mouse button to access the chart data screen. Here you will find data on the chart source, its official number, the country of origin, scale, datum, and—most important—the units of depth (feet, meters, or fathoms).
as with other tools, right-click to bring up the chart scale choices.Note: when you release the mouse button, the software draws the part of the chart which appears following the move that you have made. Do not attempt to move a chart several times in quick succession. Wait until the software has redrawn the chart after each new move.
2 - With other tools
You can directly use the mouse buttons to move the chart in the active window.
single-click the wheel mouse button (if your have wheel mouse) to activate the free mode panning and click again on it to release this mode.
move the mouse near a window border and while the cursor is changed in arrow click on the left button to move the chart anywhere you want it to go.
Upper left-hand corner window chart
Upper middle-hand window chart
Upper right-hand corner window chart
Downstair left-hand corner window chart
Downstair middle-hand window chart
Downstair right-hand corner window chart
3 - Using arrow keys of the keyboard
Another way to move the chart on the screen is to use the arrow keys on the keyboard. To move the chart, just press the arrow that points in the direction that you want to see. If you want to see more of the chart to the right, press the right arrow key.
106

User Guide
Choosing the chart orientation
The software gives you the ability to orient your screen charts for a North-up, Leg-up, or Course-up display.
The default chart orientation is North-up.
A symbol placed on the Chart palette shows the active mode :
North up :
Head up :
Course up :
To select a new chart orientation select it from the pull down menu in the chart palette
North up mode
The chart is shown always with the north direction upward. Corresponds to the orientation of the nautical charts.
North
West Chart displa
y
East
South
107

MaxSea Professional Marine Software User Guide v10.3
Head up mode
The chart is shown with the direction of the vessels course upward. The display orientation is constant until a new course direction is fed in.
Course up mode
108

User Guide
The chart is shown with the direction of the vessel's heading always pointing upward. This orientation corresponds to the visual view from the bridge in the direction of the ship's heading.
Note: for Course-up and Leg-up mode, North direction is indicated by the compass rose
symbol .When you are using a Raster chart, the written information will turn on the chart, making it more difficult to read. On Vector charts written information is displayed horizontally while only the chart turns.
Related topic: Customizing the Auto Center mode display
"Center on" specific locations
MaxSea allows you directly center the chart on predefined points.
This function is quite useful to quickly move the chart from one area to another.
To center the chart, select [Center on…] from the [Display] menu.
See "Display centering points" for information on how to create centering points.
Charts properties
To get information on each chart displayed in the window.
Using the RIGHT CLICK
1. Any where on the chart to call up the context menu.
109

MaxSea Professional Marine Software User Guide v10.3
2. Choose and click again on the "Chart properties..." option.
Using the Pan tool
1. Click the Pan tool in the Tools palette.
2. Position the cursor any where in the Chat window.
3. Double click in the chart window to bring up an informational dialog window.
The dialog box supplies information available for the displayed chart.
Click OK to close the dialog information box.
Closing a chart
Select [ Close] from the [ File] menu to call up the following dialog box:
Select from the list the chart (or various charts using the keyboard Ctrl Key under Windows ) that you wish to close, then click Close.
Note: One chart and one layer must remain open at all times. MaxSea will not allow you to close the last remaining chart or layer.
Using context menus
MaxSea makes extensive use of "context menus", which let you access the most useful commands related to the selected chart with your right mouse button.
To display the chart context menu
1 - Position the cursor over the chart any where in the Chart window.
2 - Right-click to bring up the context menu.
3 - All the available items depend of the selected chart format.
The menu lets you access (for both raster and vector charts):
The most common commands and tools (zoom in, zoom out, select scale)
The Chart Properties window which supplies information available for the displayed chart.
The most common functions to ADD (waypoint, mark, line etc....)
If the selected chart is a vector chart, the menu also lets you access:
110
User Guide
The Chart Object properties
Specific items according to the characteristic of the vector chart (Related topic : C-Map charts display options)
Horizontal datum conflict
Horizontal datum conflict
Thanks to this function, you can adapt the plan datum to the chart's one on which it is displayed.
Manually
To convert a ( *.ptf ) file to the current chart datum:
1. select Datum Conversion from the Edit menu
2. Select the Active file, its Origin and Destination from the corresponding pop-ups, then click the OK button.
Automatic AlarmNote: The following alert is displayed on the screen in two cases :
1. The active file and the chart are in known and different datum.
2. The active file datum is known and there are more than one datum in the window.
111
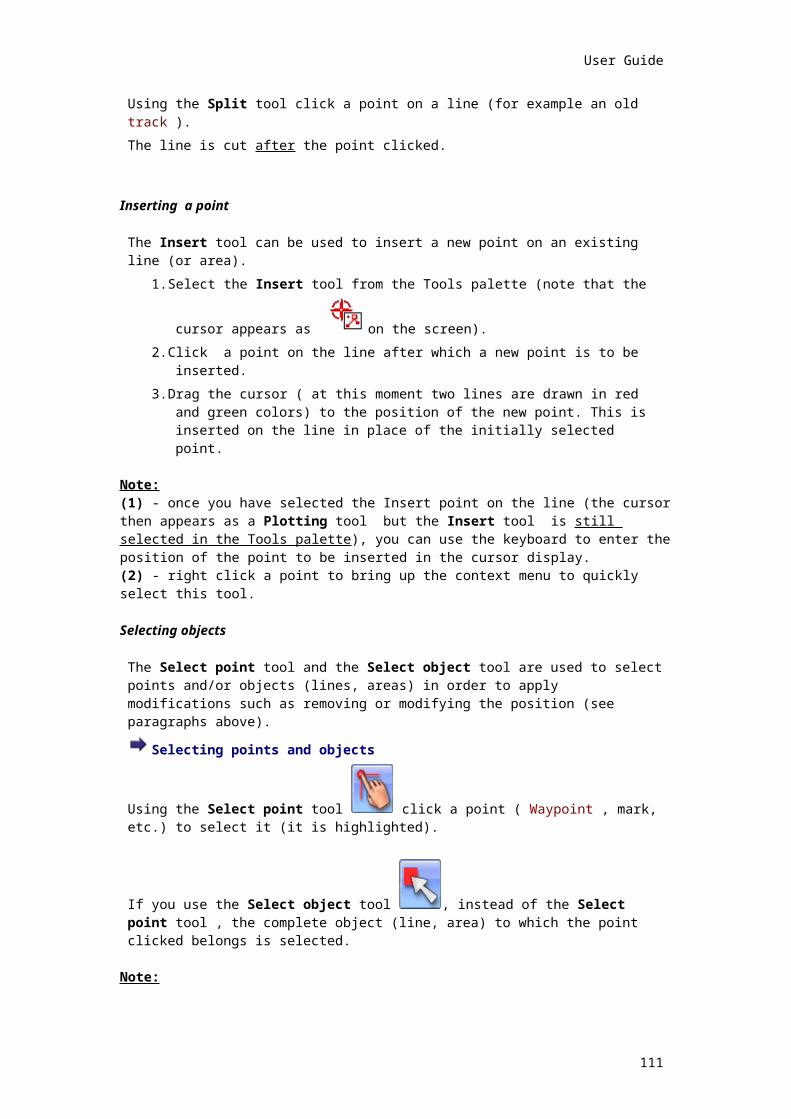
MaxSea Professional Marine Software User Guide v10.3
The convert button allows direct access to the datum conversion dialog :
Available datum list
001 WGS 1972 -- Global Definition
002 WGS 1984 -- Global Definition
003 Adindan -- MEAN FOR Ethiopia, Sudan
004 Adindan -- Burkina Faso
005 Adindan -- Cameroon
006 Adindan -- Ethiopia
007 Adindan -- Mali
008 Adindan -- Senegal
112

User Guide
009 Adindan -- Sudan
010 Afgooye -- Somalia
011 Ain el Abd 1970 -- Bahrain
012 Ain el Abd 1970 -- Saudi Arabia
013 Anna 1 Astro 1965 -- Cocos Islands
014 Antigua Island Astro 1943 -- Antigua (Leeward Islands)
015 Arc 1950 -- MEAN FOR Botswana, Lesotho, Malawi, Swaziland, Zaire, Zambia, Zimbabwe
016 Arc 1950 -- Botswana
017 Arc 1950 -- Burundi
018 Arc 1950 -- Lesotho
019 Arc 1950 -- Malawi
020 Arc 1950 -- Swaziland
021 Arc 1950 -- Zaire
022 Arc 1950 -- Zambia
023 Arc 1950 -- Zimbabwe
024 Arc 1960 -- MEAN FOR Kenya, Tanzania
025 Ascension Island 1958 -- Ascension Island
026 Astro Beacon E 1945 -- Iwo Jima
027 Astro DOS 71/4 -- St Helena Island
028 Astro Tern Island (FRIG) 1961 -- Tern Island
029 Astronomical Station 1952 -- Marcus Island
030 Australian Geodetic 1966 -- Australia & Tasmania
031 Australian Geodetic 1984 -- Australia & Tasmania
032 Ayabelle Lighthouse -- Djibouti
033 Bellevue (IGN) -- Efate & Erromango Islands
034 Bermuda 1957 -- Bermuda
035 Bissau -- Guinea-Bissau
036 Bogota Observatory -- Colombia
037 Bukit Rimpah -- Indonesia (Bangka & Belitung Islands)
038 Camp Area Astro -- Antarctica (McMurdo Camp Area)
039 Campo Inchauspe -- Argentina
040 Canton Astro 1966 -- Phoenix Islands
041 Cape -- South Africa
042 Cape Canaveral -- Bahamas, Florida
043 Carthage -- Tunisia
044 Chatham Island Astro 1971 -- New Zealand (Chatham Island)
045 Chua Astro -- Paraguay
046 Corrego Alegre -- Brazil
047 Dabola -- Guinea
048 Djakarta (Batavia) -- Indonesia (Sumatra)
049 DOS 1968 -- New Georgia Islands (Gizo Island)
050 Easter Island 1967 -- Easter Island
051 European 1950 -- MEAN FOR Austria, Belgium, Denmark, Finland, France, W Germany, Gibralter, Greece, Italy, Luxembourg, Netherlands, Norway, Portugal, Spain, Sweden, Switzerland
113

MaxSea Professional Marine Software User Guide v10.3
052 European 1950 -- MEAN FOR Austria, Denmark, France, W Germany, Netherlands, Switzerland
053 European 1950 -- MEAN FOR Iraq, Israel, Jordan, Lebanon, Kuwait, Saudi Arabia, Syria
054 European 1950 -- Cyprus
055 European 1950 -- Egypt
056 European 1950 -- England, Channel Islands, Ireland, Scotland, Shetland Islands
057 European 1950 -- Finland, Norway
058 European 1950 -- Greece
059 European 1950 -- Iran
060 European 1950 -- Italy (Sardinia)
061 European 1950 -- Italy (Sicily)
062 European 1950 -- Malta
063 European 1950 -- "Portugal, Spain
064 European 1979 -- MEAN FOR Austria, Finland, Netherlands, Norway, Spain, Sweden, Switzerland
065 Fort Thomas 1955 -- Nevis, St. Kitts (Leeward Islands)
066 Gan 1970 -- Republic of Maldives
067 Geodetic Datum 1949 -- New Zealand
068 Graciosa Base SW 1948 -- Azores (Faial, Graciosa, Pico Sao Jorge, Terceira)
069 Guam 1963 -- Guam
070 Gunung Segara -- Indonesia (Kalimantan)
071 GUX 1 Astro -- Guadalcanal Island
072 Herat North -- Afghanistan
073 Hjorsey 1955 -- Iceland
074 Hong Kong 1963 -- Hong Kong
075 Hu-Tzu-Shan -- Taiwan
076 Indian -- Bangladesh
077 Indian -- ndia, Nepal
078 Indian 1954 -- Thailand, Vietnam
079 Indian 1975 -- Thailand
080 Ireland 1965 -- Ireland
081 ISTS 061 Astro 1968 -- South Georgia Islands
082 ISTS 073 Astro 1969 -- Diego Garcia
083 Johnston Island 1961 -- Johnston Island
084 Kandawala -- Sri Lanka
085 Kerguelen Island 1949 -- Kerguelen Island
086 Kertau 1948 -- West Malaysia & Singapore
087 Kusaie Astro 1951 -- Caroline Islands
088 L. C. 5 Astro 1961 -- Cayman Brac Island
089 Leigon -- Ghana
090 Liberia 1964 -- Liberia
091 Luzon -- Philippines (Excluding Mindanao)
092 Luzon -- Philippines (Mindanao)
093 Mahe 1971 -- Mahe Island
114
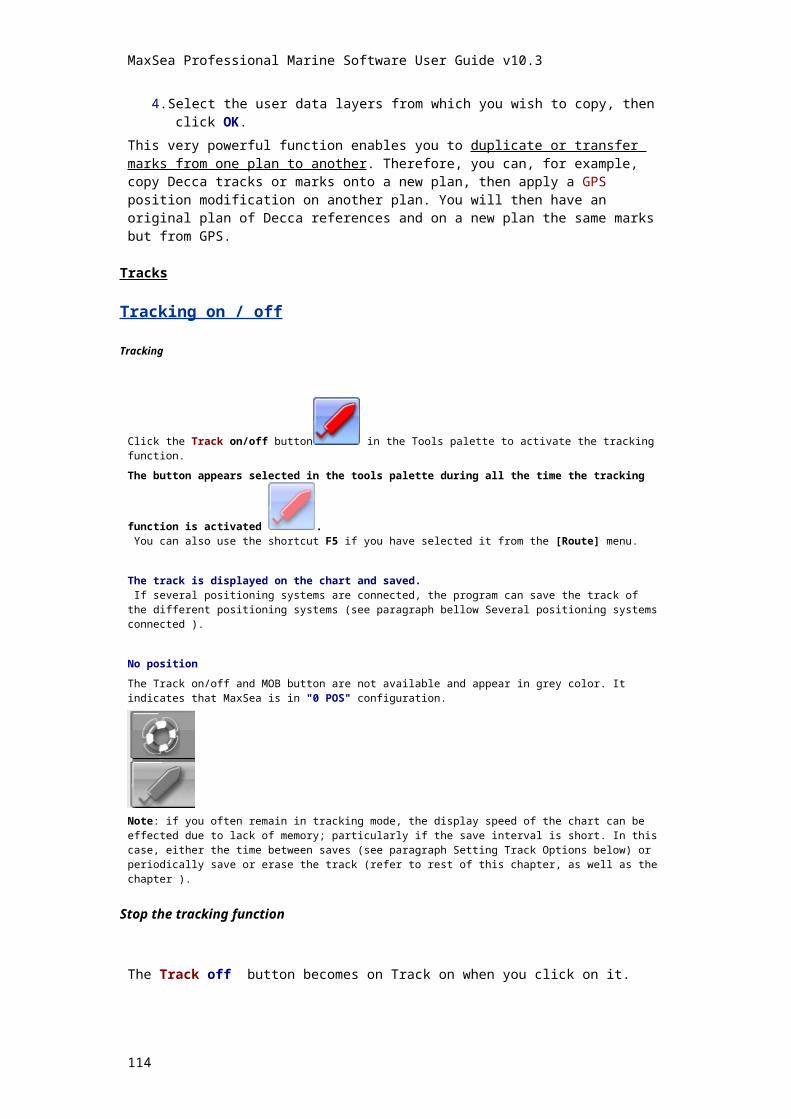
User Guide
094 Massawa -- Ethiopia (Eritrea)
095 Merchich -- Morocco
096 Midway Astro 1961 -- Midway Islands
097 Minna -- Cameroon
098 Minna -- Nigeria
099 Montserrat Island Astro 1958 -- Montserrat (Leeward Islands)
100 M'Poraloko -- Gabon
101 Nahrwan -- Oman (Masirah Island)
102 Nahrwan -- Saudi Arabia
103 Nahrwan -- United Arab Emirates
104 Naparima BWI -- Trinidad & Tobago
105 North American 1927 -- MEAN FOR Antigua, Barbados, Barbuda, Caicos Islands, Cuba, Dominican Republic, Grand Cayman, Jamaica, Turks Islands
106 North American 1927 -- MEAN FOR Belize, Costa Rica, El Salvador, Guatemala, Honduras, Nicaragua
107 North American 1927 -- MEAN FOR Canada
108 North American 1927 -- MEAN FOR CONUS
109 North American 1927 -- MEAN FOR CONUS (East of Mississippi River) Including Louisiana, Missouri, Minnesota
110 North American 1927 -- MEAN FOR CONUS (West of Mississippi River)
111 North American 1927 -- Alaska
112 North American 1927 -- Bahamas (Except San Salvador Island)
113 North American 1927 -- Bahamas (San Salvador Island)
114 North American 1927 -- Canada (Alberta, British Columbia)
115 North American 1927 -- Canada (Manitoba, Ontario)
116 North American 1927 -- Canada (New Brunswick, Newfoundland Nova Scotia, Quebec)
117 North American 1927 -- Canada (Northwest Territories, Saskatchewan)
118 North American 1927 -- Canada (Yukon)
119 North American 1927 -- Canal Zone
120 North American 1927 -- Cuba
121 North American 1927 -- Greenland (Hayes Peninsula)
122 North American 1927 -- Mexico
123 North American 1983 -- Alaska, Canada, CONUS
124 North American 1983 -- Central America, Mexico
125 Observatorio Metereo. 1939 -- Azores (Corvo & Flores Islands)
126 Old Egyptian 1907 -- Egypt
127 Old Hawaiian -- MEAN FOR Hawaii, Kauai, Maui, Oahu
128 Old Hawaiian -- Hawaii
129 Old Hawaiian -- Kauai
130 Old Hawaiian -- Maui
131 Old Hawaiian -- Oahu
132 Oman -- Oman
133 Ord. Survey G. Britain 1936 -- MEAN FOR England, Isle of Man, Scotland Shetland Islands, Wales
134 Ord. Survey G. Britain 1936 -- England
115
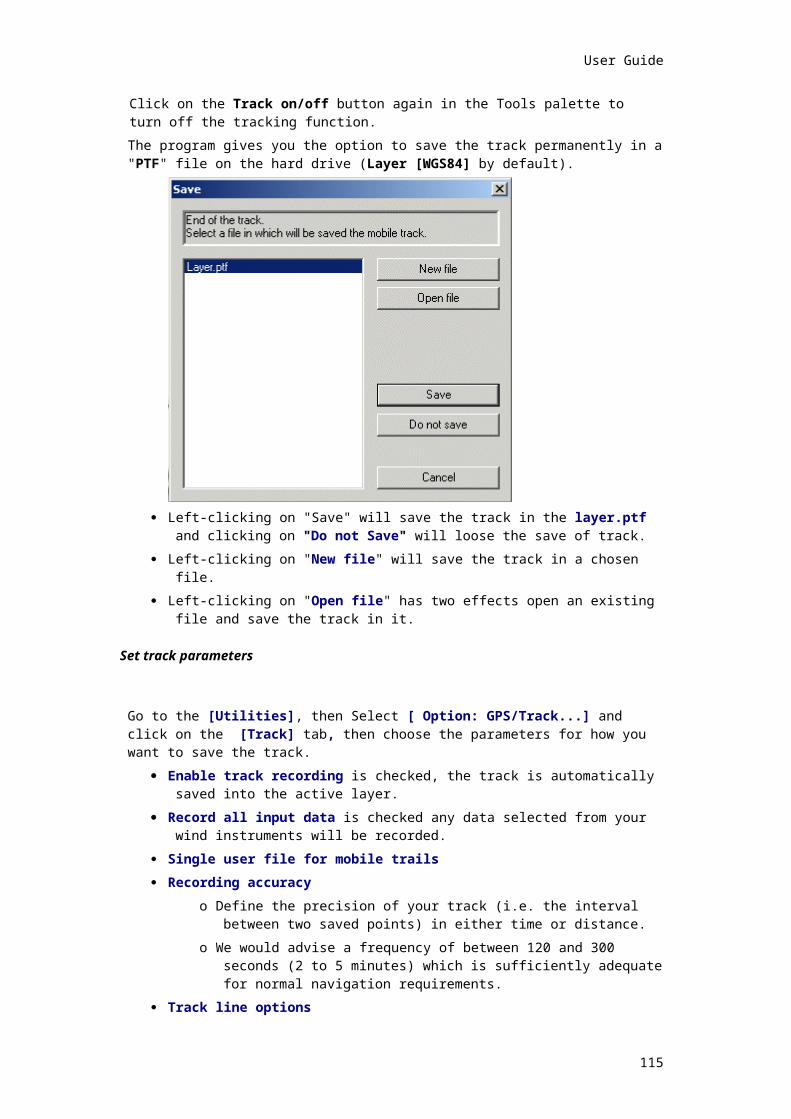
MaxSea Professional Marine Software User Guide v10.3
135 Ord. Survey G. Britain 1936 -- England, Isle of Man, Wales
136 Ord. Survey G. Britain 1936 -- Scotland, Shetland Islands
137 Ord. Survey G. Britain 1936 -- Wales
138 Pico de las Nieves -- Canary Islands
139 Pitcairn Astro 1967 -- Pitcairn Island
140 Point 58 -- MEAN FOR Burkina Faso & Niger
141 Pointe Noire 1948 -- Congo
142 Porto Santo 1936 -- Porto Santo, Madeira Islands
143 Provisional S. American 1956 -- MEAN FOR Bolivia, Chile, Colombia, Ecuador, Guyana, Peru, Venezuela
144 Provisional S. American 1956 -- Bolivia
145 Provisional S. American 1956 -- Chile (Northern, Near 19¡S)
146 Provisional S. American 1956 -- Chile (Southern, Near 43¡S)
147 Provisional S. American 1956 -- Colombia
148 Provisional S. American 1956 -- Ecuador
149 Provisional S. American 1956 -- Guyana
150 Provisional S. American 1956 -- Peru
151 Provisional S. American 1956 -- Venezuela
152 Provisional S. Chilean 1963 -- Chile (South, Near 53øS) (Hito XVIII)
153 Puerto Rico -- Puerto Rico, Virgin Islands
154 Qatar National -- Qatar
155 Qornoq -- Greenland (South)
156 Reunion -- Mascarene Islands
157 Rome 1940 -- Italy (Sardinia)
158 Santo (DOS) 1965 -- Espirito Santo Island
159 Sao Braz -- Azores (Sao Miguel, Santa Maria Islands)
160 Sapper Hill 1943 -- East Falkland Island
161 Schwarzeck -- Namibia
162 Selvagem Grande -- Salvage Islands
163 South American 1969 -- MEAN FOR Argentina, Bolivia, Brazil, Chile Colombia, Ecuador, Guyana, Paraguay Peru, Trinidad & Tobago, Venezuela
164 South American 1969 -- Argentina
165 South American 1969 -- Bolivia
166 South American 1969 -- Brazil
167 South American 1969 -- Chile
168 South American 1969 -- Colombia
169 South American 1969 -- Ecuador
170 South American 1969 -- Ecuador (Baltra, Galapagos)
171 South American 1969 -- Guyana
172 South American 1969 -- Paraguay
173 South American 1969 -- Peru
174 South American 1969 -- Trinidad & Tobago
175 South American 1969 -- Venezuela
176 South Asia -- Singapore
177 Tananarive Observatory 1925 -- Madagascar
116

User Guide
178 Timbalai 1948 -- Brunei, East Malaysia (Sabah, Sarawak)
179 Tokyo -- MEAN FOR Japan, Korea, Okinawa
180 Tokyo -- Japan
181 Tokyo -- Korea
182 Tokyo -- Okinawa
183 Tristan Astro 1968 -- Tristan da Cunha
184 Viti Levu 1916 -- Fiji (Viti Levu Island)
185 Wake-Eniwetok 1960 -- Marshall Islands
186 Wake Island Astro 1952 -- Wake Atoll
187 Yacare -- Uruguay
188 Zanderij -- Suriname
189 Norsk Gradnett
190 RT90/RH70 or RT38/RH70
191 IGN NTF
Raster charts
Raster charts
Raster is a Computer graphics term describing a predetermined pattern of line that provides uniform coverage of a display space. Raster graphics are computer graphics that are composed of an array of pixels arranged in rows and columns. Raster charts are stored as a series of pixels.
All your Raster charts can be opened together in the same window chart.
Show / Hide the chart in the opened window :
Click the [Chart zone information] in the chart palette to pull down the menu.
Position the cursor on a chart file name and click again to show or hide the chart.Note:1 - A mark nearest the chart file name indicates that the chart is shown.2 - The chart data display depends of the scale chart selected.
Create a new Raster chart window:
Select [New chart window...] from the [Window] menu.
A window chart is automatically opened when only one type of window chart is opened.
A dialog box appears when different types of chart window are opened together. You will have to choose which type of window chart you want to create raster or vector type.
Types of raster charts
1. MapMedia charts
2. ARCS / SeaFarer catalog
117

MaxSea Professional Marine Software User Guide v10.3
3. Maptech chart pack
4. Maptech chart kit
How to install Raster charts
1. MapMedia
2. ARCS / Seafarer
3. Maptech BSB
Raster charts
Raster is a Computer graphics term describing a predetermined pattern of line that provides uniform coverage of a display space. Raster graphics are computer graphics that are composed of an array of pixels arranged in rows and columns. Raster charts are stored as a series of pixels.
All your Raster charts can be opened together in the same window chart.
Show / Hide the chart in the opened window :
Click the [Chart zone information] in the chart palette to pull down the menu.
Position the cursor on a chart file name and click again to show or hide the chart.Note:1 - A mark nearest the chart file name indicates that the chart is shown.2 - The chart data display depends of the scale chart selected.
Create a new Raster chart window:
Select [New chart window...] from the [Window] menu.
A window chart is automatically opened when only one type of window chart is opened.
A dialog box appears when different types of chart window are opened together. You will have to choose which type of window chart you want to create raster or vector type.
Types of raster charts
1. MapMedia charts
2. ARCS / SeaFarer catalog
3. Maptech chart pack
4. Maptech chart kit
How to install Raster charts
1. MapMedia
2. ARCS / Seafarer
3. Maptech BSB
118

User Guide
MAPmedia
MapMedia charts
IMPORTANTLook after your CD-ROMs, cleaning them when necessary with a product designed specifically for this purpose.
A dirty CD-ROM may lead to the malfunctioning of MaxSea and/or the system software.
_______________________________________________________
Mapmedia charts are available on CD-ROM. You have the choice to buy only certain charts on the CD-ROM (you can buy other charts at a later date as you wish).
Charts are opened using codes which are sent to you by Informatique & Mer or Mapmedia. These codes are unique and are personal, they are linked to your hardware key.
To use a Mapmedia CD-ROM, it is necessary to configure MaxSea. The MapmediaConfig software, delivered with MaxSea, can be used to enter personal codes necessary for chart access.
Note:1 - If you forgot to enter your personal codes before starting up the software, MaxSea shows automatically the "MapMedia Config. CD " dialogue box.2 - you will have to carry out this configuration procedure before first using a Mapmedia CD-ROM and each time that you receive new codes, following a new request for new charts.
Chart display fault
If you change your computer, the Mapmedia charts codes are lost. In this case it is necessary to enter the corresponding codes again, as above.
Note: you will have to repeat this operation for each one of the CD-ROMs that you have (a series of codes per CD-ROM). It is not necessary to insert a CD-ROM to enter the corresponding codes.
IMPORTANT Be sure to keep track of your personal codes for Mapmedia charts.
The Mapmedia 3D charts
Bathymetric data used by Mapmedia comes from the sounding campaigns realised by Ifremer and the Hydrographic Services. They use multi-beam sounders covering the deep up to 7 times.
The whole of the data is then processed to obtain a matrix that contains the geographical (x,y) coordinates as well as the (z) deep corresponding to every points.
Then, files are subsequently interpolated to guarantee regular information networking.
119

MaxSea Professional Marine Software User Guide v10.3
The 3D Mapmedia module allows the 3D display for a current chart zone for which you have already access rights. (refer you to the Enter 3D Mapmedia codes paragraph from Installing charts chapter)
ARCS / Seafarer CD Roms catalog
ARCS / SeaFarer catalog
Now launch MaxSea and try to open ARCS / SeaFarer charts.
To open an ARCS / SeaFarer catalog:
either select [Open Chart] under the [File] menu.
or you can choose to open the file Chart.cat under the ARCS folder. select from the [File] menu [open] to find the chart.cat file under "C:\Program Files\I&M\Maxsea\ARCS" from your hard disk.
MaxSea will then open automatically the "world" chart.
To obtain information about Arcs / Seafarer and to work on it right click to call up the context menu which allows you:
To zoom in/out and to change the scale.
To get information by selecting Chart properties.
To add object etc...
Related topics to:
To move the chart
To choose the scale
Note: this can take a certain time.
CAUTION: If you want to open a chart that is on the CD n°x, this CD must be in your CD drive, or must have been copied to your hard drive, either the whole CD, or just the selection of charts you have access to. If not, you will get an error message.
Adding new Chart Permits
ARCS&SeaFarerConfig software allows you to insert new chart permits.
Important: first check that the right type of permit has been selected:
If you have ARCS skipper permit select GB.SCP window.
If you have ARCS navigator permit select GB.NCP window.
If you have SeaFarer chart permit select AUS.CHT window.
If you have SeaFarer update permit select AUS.UPD window.
Go to the [Start] Windows menu point [MaxSea Utilities] and choose ARCS&SeaFarerConfig
A dialog will allow you to enter permit in two ways:
from keyboard or from a Chart Permit file (from floppy for example).
from a file, select from the Permit menu the Insert from File…
120

User Guide
Insert the floppy and open the permit file (GB.SCP or GB.NCP or AUS.CHT or AUS.UPD according to your license type).
It is also possible to delete a Chart Permit by selecting Delete.
To enter a new permit from keyboard (received by phone, FAX…), select Insert from keyboard and enter the new permit in the following window.
Updating charts
Each time you receive a new Update CD or have ordered new charts, you have to update your installation. First be VERY careful not to mismatch any CD (for each ARCS skipper license order you receive a floppy, an update CD, and may receive one or more chart CDs). Verify the dates of each CD. Do not mismatch CDs between two orders.
To update charts, launch the ARCS&SeaFarerConfig software like you did before (see first part of this presentation),
1. Select Update Charts from the Charts menu, and follow instructions.
2. The update procedure is identical to chart installation. Just insert the newly ordered Chart or Update CDs when requested by installation software.
3. Then quit the installation software using File/Quit menu.
Verify a chart integrity
If you have any trouble with a chart, you can verify its integrity by launching the Arcs&SeafarerConfig under Windows Start Menu > Programs > MaxSea Utilities
Then go to the Chart menu on the menu bar and choose Verify chart integrity… item.
You will be asked to open a chart file, and optionally an update file.
A dialog informs you if the file integrity is good, or if you must install it again from chart CD.
Maptech chart pack
Maptech chart pack
IMPORTANT
MaxSea handles any kind of Maptech Pack charts, excepted the charts which are not using Mercator projection.
MaxSea is not compatible with the Maptech "Super CD".
Look after your CD-ROMs, cleaning them when necessary with a product designed specifically for this purpose.
A dirty CD-ROM may lead to the malfunctioning of MaxSea and/or the system software.
______________________________________________________
121
MaxSea Professional Marine Software User Guide v10.3
Opening a M.C. Pack Chart file
Caution ! If you want to change the chart CD-ROM in use, you have to first close the charts in use.
Select Open from the File menu. The open file dialog appears.
If necessary, pull down by clicking the pop-up menu Format of file and select Charts. Then pull down the pop-up menu File of type and select M.C. Pack from the File of type pop-up menu.
Insert, for example, the Maptech Chart Pack "Gulf of Mexico" CD-ROM. After a short while, select the Open function in the File menu, then select the CD drive:
The contents of CD-ROM are displayed as a list in the dialog box:
Open the "Charthdr" folder.
Then click one of the files (.hdr extension) of the list, and finally click Open.
Note: MaxSea automatically open all the charts of the folder.
The dialog box with warning about the use of digitized documents appears. Click I AGREE to agree.
Maptech chart kit
Maptech chart kit
IMPORTANT
MaxSea is compatible with BSB charts version 2.0 (and higher), as well as BSB charts version 1.
MaxSea handles any kind of BSB charts, even the charts which are not North Up oriented.
Look after your CD-ROMs, cleaning them when necessary with a product designed specifically for this purpose.
A dirty CD-ROM may lead to the malfunctioning of MaxSea and/or the system software.
______________________________________________________
Opening a M.C. Kit Chart file
Caution ! If you want to change the chart CD-ROM in use, you have to first close the charts in use.
Select Open from the File menu. The open file dialog appears.
122

User Guide
If necessary, pull down by clicking the pop-up menu Format of file and select Charts. Then pull down the pop-up menu File of type and select the M.C. Kit (BSB) from the File of type pop-up menu.
Insert the Maptech Chart Kit Region 4 CD-ROM. After a short while,
select Open in the File menu, then select the CD drive:
The contents of CD-ROM are displayed as a list in the dialog box.
Open the "BSBCHART" folder.
Then click one of the files (*.kap extension) of the list, and finally click Open.
Note: MaxSea automatically open all the charts of the folder.
The dialog box with warning about the use of digitized documents appears. Click I AGREE to agree.
Contents of a BSB CD-ROM
A BSB CD-ROM version 2.0 contains a catalog of charts, representing a region of north America.
Each region is associated to a number. To use your BSB charts with MaxSea, you will have to know the number of the region that is on your CD.
You will not need the other files with this version of MaxSea.
Vector charts
Vector Charts
The vector charts are Images defined by sets of straight lines that are defined by the locations of the end-points. Vector graphics require much less storage space than raster or bitmapped graphics.
Each Vector charts are opened in a own Chart window and the Chart zone information menu is related to the opened vector chart type.
Create a new chart window:
Select [New chart window...] from the [Window] menu.
First time you open a new chart window, you will not have to choose the type of window.
A dialogue appears when vector chart window and raster chart windows are together opened. It enables you to select the type of window to be opened. Roll the menu and click upon the "New chart window" item.
123

MaxSea Professional Marine Software User Guide v10.3
The menu items depends of the type of the chart presently opened:
For example Raster chart and Vector chart and Vector / S57 windows are already opened.
You can open a new chart window according to the type between all the types proposed.
Types of Vector charts
1. C-MAP NT chart via PCMCIA
2. C-MAP NT/PC chart via a CD ROM
3. C-Map CM93 v2
4. C-MAP S57 (CM93 v3 )
5. AutoCAD DXF and DWG files
How to install Vector charts
1. C-MAP NT Cartridge Reader
2. C-MAP NTPC Selector
3. C-Map CM93 v2 Access
4. CM93 v3 vector charts
5. S57 vector charts
Vector Charts
The vector charts are Images defined by sets of straight lines that are defined by the locations of the end-points. Vector graphics require much less storage space than raster or bitmapped graphics.
Each Vector charts are opened in a own Chart window and the Chart zone information menu is related to the opened vector chart type.
Create a new chart window:
Select [New chart window...] from the [Window] menu.
First time you open a new chart window, you will not have to choose the type of window.
A dialogue appears when vector chart window and raster chart windows are together opened. It enables you to select the type of window to be opened. Roll the menu and click upon the "New chart window" item.
The menu items depends of the type of the chart presently opened:
For example Raster chart and Vector chart and Vector / S57 windows are already opened.
You can open a new chart window according to the type between all the types proposed.
Types of Vector charts
1. C-MAP NT chart via PCMCIA
2. C-MAP NT/PC chart via a CD ROM
124

User Guide
3. C-Map CM93 v2
4. C-MAP S57 (CM93 v3 )
5. AutoCAD DXF and DWG files
How to install Vector charts
1. C-MAP NT Cartridge Reader
2. C-MAP NTPC Selector
3. C-Map CM93 v2 Access
4. CM93 v3 vector charts
5. S57 vector charts
C-MAP NT
Via C-card reader PCMCIA
Opening a C-MAP NT chart
The opening of C-MAP NT charts can only be carried out through the function [Open a chart] from the [File] menu.
If the C-MAP NT cartridge has been properly connected to the printer port of your PC, the Open chart dialog box appears.
Select the chart you wish to open and click Ok
Closing
Select the Close function of the File menu. Select the CMAP NT item, which represents the C-Map charts catalogue in the list of available files and click Close.
The C-Map chart catalogue is closed and all the C-Map windows are canceled.
Note : You may change the C-MAP NT cartridge at any time without quitting MaxSea, provided that you close the chart beforehand.
C-MAP NT windows Management
The C-MAP NT charts are open in a specific window, which can be identified by means of its C-MAP NT title bar. As with all charts in MaxSea, you can open several C-MAP NT windows.
A C-MAP NT windows opens automatically when MaxSea starts.
In order to open an new C-MAP NT chart, select New chart window in the Display menu, then select C-MAP NT in the dialogue. The window that you have just opened places you on the same geographic zone as the one in the last opened chart window.
125

MaxSea Professional Marine Software User Guide v10.3
Via CD Rom
Opening a C-MAP NT/PC chart
You can open a C-MAP NT/PC chart in MaxSea only if he has referenced it at first. Then, MaxSea is going to suggest to open this cartography from its launch.
If you chose other maps, at MaxSea's launch, you can afterwards open them in an additional window by choosing " Open Chart " in the "File" menu. It is then necessary that you select " C-MAP NT/PC " so that the new window is created.
If a chart is already opened, your selecting " Open Chart " will see C-MAP NT/PC chart (already open) being displayed besides the other cartographies available on your discs. you can however select C-MAP NT/PC to open a new window, this has for consequence to close the one that was already opened.
Note: to order C-MAP NT/PC refer to the "Installing charts" chapter.
Display options
You can change the display scale by clicking on the chart where you wish to zoom. You can then select the desired scale. The scales with an available chart are preceded by one black sign, the others are available but will over-zoom when necessary.
You can modify the display options, either click the Chart zone information to pull down or RIGHT CLICK any where on the chart to bring up the context menu, select the "chart config..." item and choose a display configuration:
1. Change configuration...
2. Choose between 3 detail levels: Low details, Normal details and High details
You can also create your own display configurations by using the dialog Box
" Change Config " by the menu " Change Configuration " of the pop - up zoom.
126

User Guide
To display an own configuration select the "Add" button in previous window, then click on "OK" to valid your Configuration.
To remove a configuration, select it in the right target window and then click on the "Remove" button.
How to use a C-MAP NT/PC chart
Information on a C-MAP NT/PC chart
You can obtain information about the present objects around a point of the chart :
1. Either by RIGHT CLICKING any where in the chart window to call up the context menu and choosing "Chart Object Properties...". This brings up the "Cartographic properties" dialog box.
2. Or using the select point tool and double left clicking any where in the Chart window to bring up the "Cartographic properties" dialog box.
The "Cartographic properties" dialog box :
1. The left part of the window shows you a list of the type of objects selected,
2. The right part of the window shows you the description of each object selected with the mouse. In the left part of the window, click an object from the list to display information about it in the right part of the window.
C-MAP NT/PC Special function
To obtain complementary information around a selected point on the present chart.
Right click any where in the chart window to call up the Context menu.
Select the Find Nearest... item
Choose the Port Service for the Nearest Search:
1 - Click on one icon in the following dialog box.
127

MaxSea Professional Marine Software User Guide v10.3
Example:
(The area in the present example is the South-West of France)
2 - After selecting the provisions icon the following box appears:
The bellow window gives you up to ten best matches.
3 - Then if you want more information, select the line corresponding to an Area Name (nearest port).
4 - Finally you can display:
128
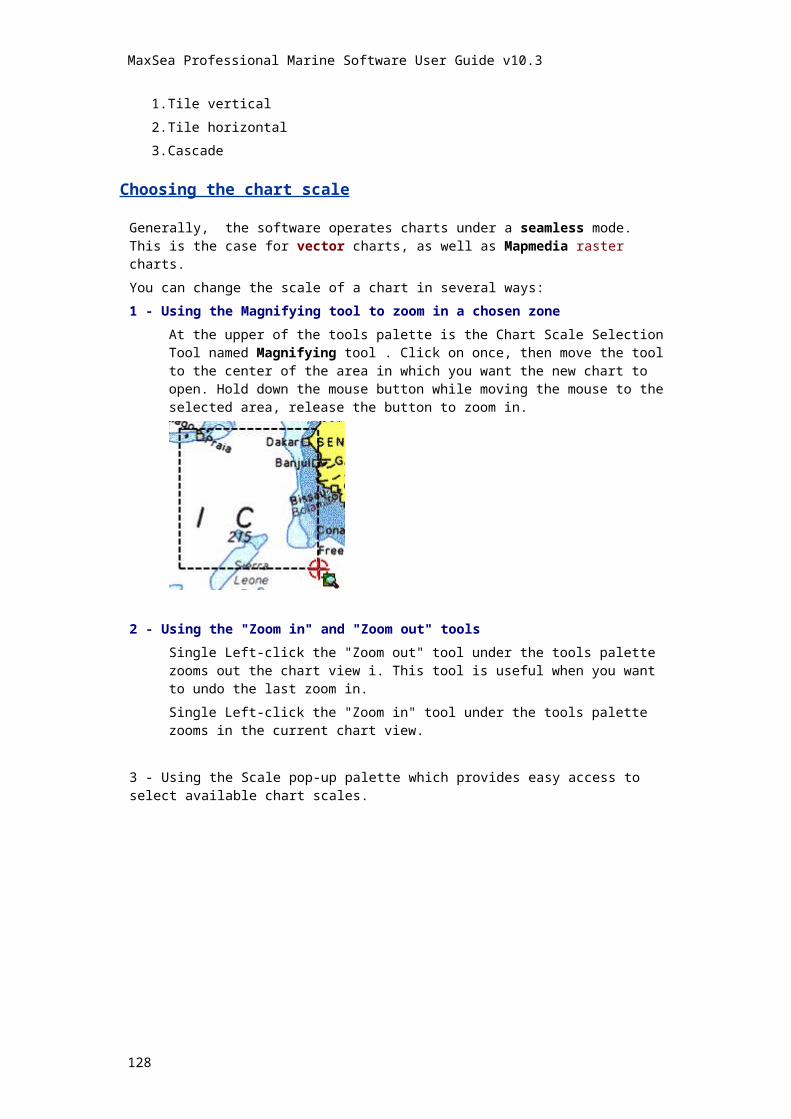
User Guide
The situation on the chart by clicking on the "LOCATE" button and the selected point is automatically displayed on the chart.
Complementary information by clicking on the "INFO" button, if there is no more information, a message "no info" is displayed in the window.
C-MAP CM93 v2
Opening a C-Map CM93 v2
In this chapter, you will be told how to open, close and operate the C-Map cartography.
Insert your C-Map CD-ROM into the CD reader and activate the Open Chart function of the File menu.
After a few minute wait, MaxSea opens a new window which contains a 50 million-scale C-Map chart.
C-Map charts are displayed in dedicated windows (recognizable by their title: the "C-Map" text appears on the left of the scale . See example below). You can open other C-Map windows. To do so, please refer to the "open a C-Map window " section.
How to use C-Map CM93 v2
This section includes a short summary of the various tools used to move within the C-Map charts. For a more detailed review, please refer to the chart selection section.
Use directly the mouse or the hand tool to move the chart :
position the mouse nearest a chart border window, an arrow appears and allows you to move the chart in what direction you want.
click upon the chart and have it slide while pressing on the left button of the mouse : the chart will move simultaneously with the hand.
Using context menu RIGHT CLICK any where on the chart and select Chart properties... item under the menu.
To have the information dialogue relating to the displayed chart appears, left-click twice upon the chart or right click once to bring up the context menu and choose Chart
129

MaxSea Professional Marine Software User Guide v10.3
properties... item. The information dialogue will inform you about the chart geodesy, about creation dates, etc.
In order to change the scale , select the magnifying tool and click within the chart onto the desired place.
Then select a scale in the available scales list. Some scales appear with a mark : these are the scales for which the chart will be of better quality. If you select a scale without a mark, the chart will appear in overzoom (the chart will be "enlarged").
Display Options
C-Map charts can be displayed following 3 different detail levels. You are also given a selection between 3 display modes for lighthouses.
In order to modify these display options, either click the Chart zone information to pull down or RIGHT CLICK any where on the chart to bring up the context menu, select the "chart config..." item and choose a display configuration between:
1. Change configuration...
2. Choose between 3 detail levels: Low, Normal and High
You can obtain information about the present objects around a point of the chart by right clicking in the chart window and selecting to call up the context menu to choose:
Details : low
Minimum detail level : coastlines, bathymetric lines and wrecks.
Details : Medium
Medium detail level : lighthouses, navigation zones,…
Details : High
Maximum detail level : sounding lines, navigation lines,
information about ports,…
130

User Guide
Change the configuration
This option allows you to create your own display configurations from chosen option display in the "C-Map configuration selection" dialog box:
1. Select the options which you want to be displayed in the chart window.
2. To set a new configuration click on the Add button
3. Change the name in the Config Name text area.
4. Click Ok to confirm
If you navigate by day and do not want your chart to be cluttered, you may choose not to display the lighthouses and associated data.
For this purpose, select an option from the Lights Display pop-up menu :
1. No Light option.
2. Light option with Small sectors
3. Light option with Medium sectors
4. Light option with Big sectors
5. Light option with CMAP default option
Four options enable the display of lighthouses. Depending on the selected option, the sectors will be represented in various forms : with the Light, the circular arc radius representing the sector will correspond to the Light option of the lighthouses display. With the Light : CMAP default option, the sectors are deliberately made smaller so that not to overload the chart (their size is proportionate to the lighthouse range). This is the default mode of representation.
Light option with Small sectors
131

MaxSea Professional Marine Software User Guide v10.3
Light option with Big sectors
Light option with CMAP default option
Obtain information about an object
Click on the Select point tool and double click upon the required object (a lighthouse for example). The following information dialogue appears :
Several objects are generally available at the place you indicate. This dialogue enables you to consult each one of these objects. The name of the selected object is displayed on top of the dialogue.
132

User Guide
To move from one object to another, click on the buttons "Next object" and "previous object". You can also reach an object directly by pointing it out within a list, selecting it in the pop-up menu as follows :
C-MAP CM93 v3 & S57
The C-MAP Cartographic Service Overview
The system that you are now using has the capability of using and displaying the latest C-MAP CM-93/3 worldwide vector chart database. These charts are fully compliant with the latest IHO S-57 3.1 specifications and, when using the CM-93/3 ENC database in an approved ECDIS, are considered equivalent to the navigational charts required by the SOLAS (Safety Of Life At Sea) convention.
In order to prepare the system for use with the C-MAP CM-93/3 database, there are a number of steps you must follow:
1. Registering the system at C-MAP.
When a system is installed that has the capability to use the CM-93/3 database, a file called USER.USR will be automatically created (normally in the Program Files\CM93v3 SDK directory). This file contains the Company ID and System ID assigned to the ECDIS/ECS system when it is installed. These ID’s can be found on the back of the installation CD box or on a sticker placed on the equipment. This file must be sent to C-MAP Norway by email ([email protected]) or by a direct Internet connection when installing the software. Licenses can only be generated once this file has been received and registered by C-MAP. It is important to note that the software may need to be reinstalled and reinitialized if the operating system or hardware is upgraded (see the troubleshooting section). In some cases the manufacturer of the system will have already pre-registered the system.
If when installing a new system, you do not know your Company ID or System ID, please contact C-MAP Norway before continuing installation.
2. Ordering Charts
It is essential that as much information as possible is sent to C-MAP when ordering charts for a system. To order CM-93/3 charts, the System Information section should first be completed (normally found in the License Administrator section of your software). This contains vital information that will allow us to maintain your licenses throughout the lifetime of the system. Once this section is completed you can order charts by choosing the ORDER LICENSES section in the License Administrator. Charts can be ordered by Zone, Area or Cell and these which can be seen at www.c-map.no. Price quotes can be obtained via your chart dealer or direct from your local C-MAP office. Once the license order has been prepared, it should be e-mailed to ([email protected]) or faxed to C-MAP Norway AS (+47 51464701).
3. Applying For Licenses
Once the order has been received at C-MAP, a license will be generated and transmitted back to the user. This may be in the form of a single alphanumerical string (16 characters), or in the form of a file called PASSWORD.USR. Once this license has been received it should be input using the License Administrator or the
133

MaxSea Professional Marine Software User Guide v10.3
software designed by the ECDIS/ECS manufacturer. There are two types of licenses, purchase and subscription. Purchase licenses are valid indefinitely while subscription licenses need to be renewed each 12 months from the start of the subscription. Failure to renew a subscription will result in the charts becoming unavailable.
4. Troubleshooting
If you are having problems installing your software or charts please check the following before calling C-MAP:
You are installing on Windows XP, Windows NT, Windows 2000 or Windows 98 second edition. The system will not normally run under Windows 95 or Windows 98 first edition.
That you have registered the WORLD database in the GDBADMIN application.
That the registered WORLD database is available. If you are running the database from the CD drive, the CD-ROM must be loaded.
That you have correctly typed the license string.
That you have not reinstalled Windows or any major hardware components. If you have done this you will probably need to reinstall your software.
Contact Information:
For information or help please call you’re nearest C-MAP Office (details can be found on the reverse side of the C-MAP chart CD box) or contact C-MAP Norway:
C-MAP Norway AS
Post Box 212
Hovlandsveien 52
4379 Egersund
Norway
Tel. +47 51464700
Fax.+47 51464701
Email: [email protected]
Opening a CM93 v3 chart
Unlike other charts, CM93v3 charts are organized in a database (and not as simple graphic files). This database must be referenced before you open CM93v3 charts. (see the chapters on “Vector Chart Installation Process” and “C-MAP CM93v3” in the User Guide).
Important If the CM93v3 database is corrupted or unavailable, MaxSea will warn you and will not open
Cm93v3 Windows.
If no CM93v3 licence is available at the time you try to open a chart, only a general scale chart (1:5 Million) will be available in MaxSea.
MaxSea will warn you 2 months in advance of any license expiration. (See the Licences Management chapter to renew licenses.)
C-MAP CM93v3 display Options
Magnifying
As in all the available cartographies in MaxSea, you can change display scale by doing one click straight ahead in the wished place. You can then select the scale suited to your needs. The scales
134

User Guide
for which there is a chart are preceded by one black sign, the others are thus available but without supplementary information with regard to the first marked superior level.
Note: : If S57 charts are opened together with C-Map charts, marks will not correspond to S57 charts but to CMap93ed3 ones.
Modify the display level
You can customize the appearance of charts by turning on and off layers of information. You can modify the display level by clicking on the Chart zone information situated in the chart palette to call up the menu. This menu gives you the choice between various display configurations.
You can obtain information about the present objects around a point of the chart, either by clicking the Charts zone information button or by right clicking in the chart window to call up the context menu.
The Charts menu on the chart palette provides the ability to display :
A own configuration by selecting "Change Configuration..."
S52 Base,
S52 Standard and corresponding S52
Other in standard S52.
S52 other text
To activate the anti-grounding function
To display the geographic grid
C-Map CM 93 v3 & S57 display settings
To add a personal configuration,
You should choose " Add " in the dialogue that appears, a new configuration is created with the name " New Config " by default, he can modify this name in the frame " Config Name ". The user is then free to choose the elements that he wishes to be a part of this configuration, among the 9 available groupings in the frame " Layers ".
To erase a display configuration,
It is enough to select it in left window and to click " Remove ".
135

MaxSea Professional Marine Software User Guide v10.3
To validate modification made in this dialog box,
it is necessary to click on "OK". The configuration selected during the release of the dialog box will be used that for the posting.
Obtain information.
information windows about the chart.
As with all charts in MaxSea the user can have chart information by double clicking the hand tool
You can obtain information about the present object around a point of the chart :
Either by double left-clicking an object with the Selected object ( finger) tool. Or RIGHT CLICKING without switching tool an object to call up the context menu and choose the
"Chart object properties" item.
information windows about a specific point.
The information dialog box about the chosen point appears:
The Left-hand dialog box window brings together all the objects around the place chosen by the user.
The Right-hand dialog box window gives description about each of the object selected with the mouse (one click) in the above window.
Your own display configuration
136

User Guide
You can also create your own display configurations by using the dialog Box " Change Config " by the menu " Change Config " of the pop - up zoom.
Objects displayed by default:
Bridge, Cable, overhead, Canal, Coastline, Conveyor, Dam, Deep water route centerline, Deep water route part, Depth area, Depth contour, Dock area, Dredged area, Floating dock, Gate, Hulk, Ice area, Incineration area, Inshore traffic zone, Land area, Lock basin, Log pond, Mooring/Warping facility, Obstruction, Offshore platform, Oil barrier, Pile, Pipeline, overhead, Pontoon, Precautionary area, Pylon/bridge support, Radio calling-in point, Recommended route centerline, Recommended traffic lane part, Shoreline construction, Underwater/awash rock, Unsurveyed area, Wreck, Accuracy of data, Compilation scale of data, Coverage, Horizontal datum of data, Horizontal datum shift parameters, Nautical publication information, Navigational system of marks, Production information, Quality of data, Sounding datum, Survey reliability, Units of measurement of data, Vertical datum of data, Vertical datum of data, Vertical datum of data.
RIGHT CLICK any where on the chart window, select "Chart Config..." to call up the dialog box which allows you to change the configuration.
The "Change Config" window allows you to destroy or create your own config by choosing options under a table as it is described below:
Select an option NAME :
To display on chart :
Text / Names Cartographic line, Text, Text...
Traffic info Ferry route, Signal station, traffic, Traffic separation line, Traffic separation scheme boundary, Traffic separation scheme crossing, Traffic separation scheme lane part, Traffic separation scheme roundabout, Traffic separation zone, Two-way route part, Cartographic area, Cartographic area...
Small Craft facilities Small craft facility
Low Nav info Anchor berth, Anchorage area, Cable area, Cable, overhead, Cable, submarine, Caution area, Dumping ground, Fairway, Fog signal, Ice area, Local magnetic anomaly, Magnetic variation, Offshore platform, Military practice area, Offshore production area, Pilot boarding place, Pipeline area, Radar transponder beacon, Recommended track, Restricted area, Submarine transit lane, Top mark, Top mark...
Medium Nav info Berth, Contiguous zone, Distance mark, Exclusive economic zone, Ferry route, Marine farm/culture, Pipeline, submarine/on land, Tideway, Cartographic line, Cartographic symbol, Compass, Text, Text...
Objects Low info Airport area, Building, single, Built-up area, Cargo transhipment area, Dam, Dyke, Fishing ground, Incineration area, Lake shore, Navigation line, Radar line, Radar range, Radar reflector, Radar station, River, River bank, Sea-plane landing area, Signal station, warning, Silo/tank, Sloping ground, Waterfall, Waterfall...
Objects Medium info Canal bank, Causeway, Checkpoint, Coast guard station, Coastline, Contiguous zone, Continental shelf area, Control point, Conveyor, Crane, Current - non-gravitational, Custom zone, Day mark, Deep water route centerline, Dry dock, Dyke, Fairway, Fence/wall, Fishery zone, Fishing facility, Fog signal,
137

MaxSea Professional Marine Software User Guide v10.3
Fortified structure, Free port area, Gate, Gridiron, Harbour area (administrative), Harbour facility, Inshore traffic zone, Lake, Marine farm/culture, Military practice area, Mooring/Warping facility, Navigation line, Pile, Pilot boarding place, Production/storage area, Radio station, Railway, Rapids, Recommended track, Rescue station, Retro-reflector, Road, Runway, Sand waves, Sea area/named water area, Sea-plane landing area, Seabed area, Signal station, traffic, Slope top line, Sloping ground, Spring, Square, Straight territorial sea baseline, Swept area, Territorial sea area, Tidal stream - harmonic prediction, Tidal stream - non-harmonic prediction, Tidal stream panel data, Tidal stream - time series, Tide - harmonic prediction, Tide - non-harmonic prediction, Tide - time series, Traffic separation scheme roundabout, Traffic separation zone, Tunnel, Unsurveyed area, Vegetation, Water turbulence, Weed/Kelp, Tidal stream - flood/ebb, Tidal stream - flood/ebb...
Lights and buoys Light : Beacon, cardinal, Beacon, isolated danger, Beacon, lateral, Beacon, safe water, Beacon, special purpose/general, Buoy, cardinal, Buoy, installation, Buoy, isolated danger, Buoy, lateral, Buoy, safe water, Buoy, special purpose, Land area, Land elevation, Land region, Landmark, Light, Light float, Light vessel, Light vessel...
Soundings Sounding
Lights real range Displays dotted black lines showing the real range of lights.
Simplified Symbols Displays object using S52 normalized / traditional presentation. Valid for buoys, lights…
Int-1 (C-Map style) Use S52 normalized / C-Map style for chart display.
Low detail scales Changes the MaxSea’s zoom where new charts appear.
Using Alarm with CMAP CM93 ed3
The Antigrounding alarm warns you when your boat crosses a potential danger as grounding boundaries, buoys and depth lines which are defined on the chart. (Related topic : List of objects which can be taken as a potential danger )
The AntiGrounding function will be activated when the boat head will
138

User Guide
crosse objects as :
(1) - Buoys
(2) - Line width sounder
(3) - Ground boundary
This alarm is active when the "Antigounding Master GPS" is checked.
The Antigrounding alarm depends to the Cone base width of the Security circle.
You can specify the boundary alarm settings by changing the circle distance size.
Go to the [Utilities menu], choose [Option: GPS/Track] to call up the dialog box which allows you to modify the parameters.
1. Click on the "Misc" tab.
2. Check the "display" box to show the security circle on the chart.
3. Enter a value of the radius to define the alarm limit (By default the radius circle is equal to 1Nm and the width of the cone base is equal to 30° ).
All activated Alarms are recorded and displayed in a table which is named "AntiGrounding Center"
Note: the Security circle and the cone base (Alarm zone) are displayed on the chart by default.
List of potential dangerous objects
List of objects which can be taken as a potential danger:
Anchorage area (a name by default is defined) - Beacon, cardinal - Beacon, isolated danger - Beacon, lateral - Beacon, safe water - Beacon, special purpose/general - Bridge - Buoy, cardinal - Buoy, installation - Buoy, isolated danger - Buoy, lateral - Buoy, safe water - Buoy, special purpose - Cable area - Cable, overhead - Canal - Cargo transhipment area - Causeway - Caution area - Conveyor - Crane - Deep water route part - Depth area ( can take value from x to y meters) - Depth contour (define a value for y meters) - Dredged area (can take value from x to y meters) - Dry dock - Dumping ground - Fairway - Fishing ground - Floating dock -
Ice area - Incineration area - Inshore traffic zone - Land area ( can take value from x to y meters) - Light vessel - Marine farm/culture -Military practice area - Obstruction - Offshore platform - Offshore production area - Oil barrier - Pile - Pipeline area - Pipeline, overhead - Pontoon - Production/storage area - Recommended track - Recommended traffic lane part - Restricted area - Sea-plane landing area - Shoreline construction - Sounding - Submarine transit lane - Traffic separation line - Traffic separation scheme boundary - Traffic separation scheme crossing - Traffic separation scheme lane part - Traffic separation scheme roundabout - Traffic separation zone - Two-way route part - Underwater/awash rock - Wreck
Example :
Depth range from 20 to 50 meters and the Buoy, cardinal are defined with Karek Kreiz, Land Area.
139
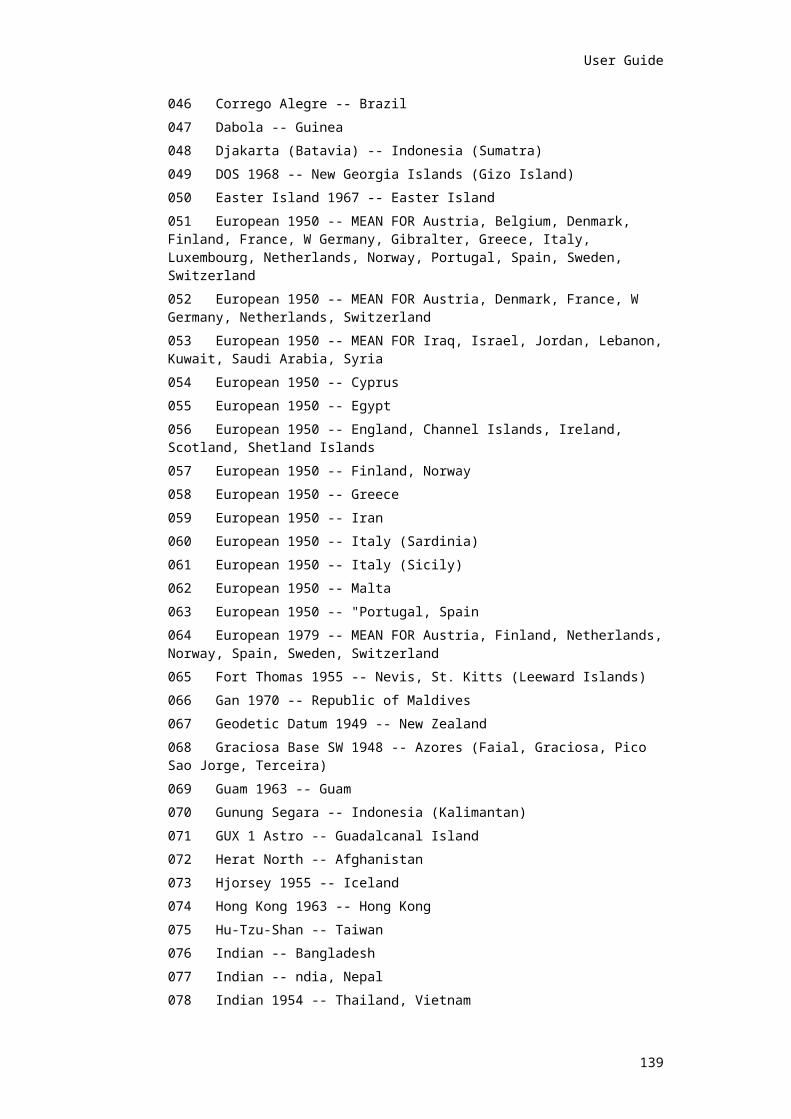
MaxSea Professional Marine Software User Guide v10.3
AntiGrounding Center
The AntiGrounding center is your control center where you can follow all recorded alarms and they history.
To bring up the AntiGrounding center click on the "Chart zone information" in the chart palette and choose "AntiGrounding center".
The table contains all useful information for each present object having crossed the Security circle boundaries :
1. The date when the alarm is activated.
2. The type object category.
3. Details of the object.
4. Its geographical position.
The alarms are displayed in order of their recording. To change the data order display of each column, simple click in each column title.
The width of each column can be modified by left clicking a border and drag to the desired position.
You can specify the display position of the palette as you will do with the others palettes (setting the palette position as a menu bar layout display mode or as a floating layout display mode).
Advanced configuration
All Alarms depth configuration are available in the "CMapconfig.ini" file.
The Following table resume all the configuration:
identification KEY Value Description
SAFETYCONTOUR_ONLY 0 / 1 (0 by default)
Show only the safety sounding line.
SAFETYCONTOUR_LINE_OFF 0 Safety sounding line as the others or in bold.
DANGER_SYMBOL 0A symbol is drawn nearest an object to indicate the danger.
DANGER_DEPTHS_OFF 0 Show isolated soundings which are dangerous.
SHALLOW_DEPTHS_OFF 0 Show the soundings which have a value less than the "SHALLOW_CONTOUR".
SAFETY_DEPTH 30 meters
Safety depth for isolated objects.
140

User Guide
DEEP_CONTOUR 30 meters
Depth for "Free water".
SHALLOW_CONTOUR 2 meters Depth zone not available.
SAFETY_CONTOUR 30 meters
Safety sounding lines.
DXF & DWG
AutoCAD DXF and DWG files
With the MaxSea Dwf/Dwg module you can open AutoCAD DXF and DWG files format (extension « .DWG » « .DXF »).
IMPORTANT
To correctly open a plan:
The original values X0/Y0 must match the geographic coordinate point in the good geographic system datum.
Opening the plan in the good datum system
1. Open the file
Use the manual opening function.
Go to [File] menu, select [Open] and choose "Chart AutoCad (dxf; dwg)" file format.
2. Select the datum system
The following window will appear :
Select the datum system
Then click Ok.
The plan will be open
141

MaxSea Professional Marine Software User Guide v10.3
2D view
2D view
With the 2D module installed and a connection to your depth sounder, you can generate your own bathymetric data in real-time and display it in 2D.
You can select the characteristics of the display: minimum and maximum depth displayed, step between isolines, etc.
A choice of several displays (isolines, plain colors, etc…) allows for quick assessment of the sea floor configuration.
To display data in 2D, click the 2D button located in the Chart palette. The 2D bathy config palette appears and allows you to configure the 2D bathymetric data that you want to display in the current window. Clicking on the button again turns off the 2D display.
2D Bathy config palette
The 2D Bathy config palette can be represented by 2 different manners.
142

User Guide
Reduced Palette
To pass from the "reduced Palette" mode to the "full Palette" mode and vice versa, click the special button :
Full Palette
Caution: The " reduced Palette" or " full Palette " mode is not remembered when you leave MaxSea.
The palette is always in " full Palette " mode when you throw MaxSea.
"Reduced Palette" description
Upper left-hand the bathymetric color scale is displayed.
Below the "2D display mode choice" buttons and pop-up
Button to display / mask isolines.
Button to display / mask depth surface.
Button to display / mask the presence and the type data imported to the 3D data base.
MaxSea displays the depth by default, when available the pop-up gives you the possibility to display the ground discrimination track and access to the ground discrimination function.(for more information refer you to the Ground Discrimination chapter)
NB: the Depth option contains DEM, CmapEd2 and User data depth values.
The values Min and Max is reminded, in fact, in the bathymetric color scale. It allows you to know these values even in "reduced Palette" mode.
The intermediate values in the scale of colors correspond at the moment exactly to the shown isolines.
143

MaxSea Professional Marine Software User Guide v10.3
In the example, one sees according to the palette that the shown isolines is 600 , 800,1000,1200,1400 and 1600m.
"Full Palette" descriptionUpper right-hand of the Bathy Config palette, there are 3 small pop-up menus to select the interval of the depths on which the display will be based.
However you can directly keyboard the data.IMPORTANT if more than 100 isolines is selected to display, a warning is displayed. Other wise, MaxSea may start to slow, displaying Hundreds of isolines.
Display type and presence of imported data
Use the button to display /mask the presence and the type of use data.
Before selecting the button you have to configure parameters to choose which data you want to display. (see MaxSea options chapter to display the details of your data import)
The "Use data type" displayed on chart, depends on which options you have selected.
Example :
Display all Use data type
144

User Guide
Display only DEM data
Display only User data
Note: if you forget to select the Use DataType button, the data will not be displayed.
2D display configuration
Depth choice
Min = Minimum depth
Max = Maximum depth
Step = Distance in meters between 2 isobathes.
AutomaticallyThe Auto Config button automatically applies optimal display parameters based on the current chart data. Use this button to get an instant 2D view relevant to your current screen display. It is then easy to manually adjust the display to your own preferences.
ManuallyFor example, if you navigate between 10 and 500 meters, you may wish to view isobathes every 20 meters.You can use the values suggested in the pop-up or adjust them directly.
Configure the "Bathy palette config" like in the example
Click on the Apply button to see the new display.
The Apply button will activate once you change the parameters. (Your parameter settings will be discarded if you choose not to click the Apply button.)
Note: MaxSea accepts decimal numbers for the depth values (.2, .3, etc.).
2D color gradient
145

MaxSea Professional Marine Software User Guide v10.3
There may be times when you want to change the 2D color gradient - for example when there isn't enough contrast between the 2D display and ship track (which is red by default).
To change color, double-click on the upper left-hand color scale of the 2D palette. The following dialog box appears and gives you 2 color gradient choices, select one and click on OK.
The configuration is simultaneously applied in the 2D palette and in the chart window.
Examples:
Example(1): the 2D color gradient is from blue to red and in this example the ship track is not clearly visible.
Example(2): in this example the ship track appears clearly after you have chosen the blue gradient color.
2D display mode choice
Three display modes are available :
Isobathes only: to follow a fault line,
146
User Guide
Depth surface only
Isobathes and depth surface: for a composite view
147

MaxSea Professional Marine Software User Guide v10.3
Display different types of data layers simultaneously
If a ground discrimination system is connected to MaxSea and the Hardness (E1) or the Roughness (E2) data values are recorded, MaxSea can show the depth data values (in "Isobathes") and the roughness data (in "Depth surface") simultaneously:
This example shows two ways to simultaneously display multiple data types.
Here the "depth surface" mode is selected to display the depth values and the "Isobathe" mode configuration is selected to display the "Roughness" data.
148

User Guide
Here the "isobathe" mode configuration is selected to display the depth values and the "Depth Surface" mode configuration is selected to display the "Roughness" data.
Note: the isobathes are drawn in black to distinguish them in "Depth surface" mode.
Only one type of representation ( "Isobathe" display mode, "Depth surface" display mode) is applied to only one type of data value chosen between the depth,E1, E2 or seabed class data.
3D view
2D/3D module
The software 2D/3D module displays bathy data in the current window.
In this chapter, you will learn how to use 3D charts and the 3D window's easy-to-use interface.
To obtain the best 3D performance and detail, the minimum hardware configuration required is : 128Mb RAM with an 8Mb RAM 3D video card.
See the related topic "Enter Mapmedia 3D codes" to learn how to enter 3D codes and how to use the 2D/3D modules.
3D display
149
MaxSea Professional Marine Software User Guide v10.3
The 3D module allows you to display a 3 dimensional view of the displayed chart.
To see the new 3 dimensions window, click on the 3D Button in the Chart palette, it becomes active
and calls up the "3D view" window.
The following window appears :
Display description:
150

User Guide
1. Red arrow shows the depth at the cursor position on the 2D chart
2. Blue arrow shows the depth at the boat position
3. The track of your ship is also displayed in the 3Dview
Trawl Displayed in 3D window
Sensors position is also represented in the 3D view showing the trawl position.
A blue arrow is displayed under each mobile to indicate the depth position on the chart.
(Refer you to Trawl positioning chapter for more information)
Display Modes
4 display modes are available:
"Normal Scene" mode: is the exact representation of the current chart window in 3 dimensions.
151

MaxSea Professional Marine Software User Guide v10.3
"Extended" mode: extend the scene as far as the horizon. However, the chart will not cover all the window and the extended parts will appear in gray color.
" Sea Surface" mode: is an extended scene with a visualization of the sea surface. This mode is useful to obtain a view of the sea level in the far parts of the scene, where the charts cannot be displayed.
"Cube" Mode: this mode is strongly recommended to view the general configuration of the undersea relief . This representation allows you to view the section of the relief inside a cube which you can manipulate as you wish.
To change the Display mode, select it from the Display mode pop-up located in the high left corner of the 3D Window :
Slope size Representation
The scale changing allows you to emphasize the detail of the relief especially when it is slight, or, on the contrary to reduce it when the slope is steep.
3 pre-selected levels are proposed to you :
Small Slope
Normal Slope
Big SlopeNote :(1) - the "Normal" mode allows you to see better the slight relieves and, on the contrary reduce the steep relieves.(2) - the relief appears twice as big in Big Slope mode, and twice as small in Small Slope mode, compared to the Normal Slope mode.
152

User Guide
To change the Slope size , select it from the Slope size pop-up located in the high left corner of the 3D Window :
Configuring manually
1. Select the User Config icon from the Slope Size pop-up
User Config
The values are corresponding to the multiplication coefficient applied to the depth values. The X,Y values are not modified.
153

MaxSea Professional Marine Software User Guide v10.3
To configure the Slope value, click on the Vertical scale pop-up and then, select the value of your choice.
Note: You can also configure the Slope value directly from the scroll button of the mouse.
Moving into the stage
To zoom, click and slide backwards or forwards with the right button of the mouse on the 3D window.
A magnifying glass drawing indicates you that you are in position of zoom in or zoom out.
To turn around the relief , slide at left or at right with the left button of the mouse.
154

User Guide
An arrow drawing indicates you that you are in position turn around the relief.
Note : Each slide of the chart is automatically reported to the 3D display : the 3D window "follows" your current chart window.
Render modes in the 3D window
5 Render modes
To access them, select a mode from the Render Mode pop-up menu which is situated on the fourth position upper right hand of the software 3D window .
Simple Grid
Filled faces
155

MaxSea Professional Marine Software User Guide v10.3
Grid Filled faces
Chart
156

User Guide
Grid Chart
3D view settings
In order to get a better display in the 3D window you can:
1. reach directly to the 3D configuration by selecting the button situated at the bottom of the window 3D view.
157

MaxSea Professional Marine Software User Guide v10.3
2. configure the contrast of the 3D view by selecting the contrast button at the bottom of the window 3D view..
3.configure the position of the 3D view with regard to the boat position by selecting
the camera button at the bottom of the window 3D view.
Configure the 3D view
To obtain the best 3D velocity and graphic details, the minimum hardware configuration required is 128 Mo RAM with an 8Mo RAM 3D card.
Note : the 3D window is in "hardware" mode if it’s possible for it to use the 3D card.
Otherwise, the 3D window is in "software" mode that is to say that all the 3D graphics are calculated by the software, without the help of the 3D hardware.
: "Software" mode
: "Hardware" mode.
If there is not 3D graphic card on your computer, the mode stays in "Software" mode .
If the 3D graphic card on your computer has only 4Mo RAM, the mode stays in "Software" mode.
158

User Guide
If your computer is very powerful you can optimize the 3D chart details and display speed.
To do so, refer to the PBG chapter.
Configure the contrast
You can adjust the 3D view contrast on the screen by selecting the "Contrast button"
situated at the bottom of the window 3D view :
Click on the "Contrast" button and adjust it like in the following example:
White contrast (low contrast)
159

MaxSea Professional Marine Software User Guide v10.3
Black Contrast (high contrast)
3D camera options
If you want to configure the 3D view so that you are always viewing from behind or beside
the boat, click on the camera button situated at the lower left of 3D window.
Then the following dialog box appears :
1 - Three options for the camera center:
The 2D view option allows you to be centered according the 2D view. By default this option is selected and the Camera altitude options is not available.
The boat option allows you to center the camera on the boat . By default the camera is positioned behind the boat and the camera moves according to the movement of the boat.
160
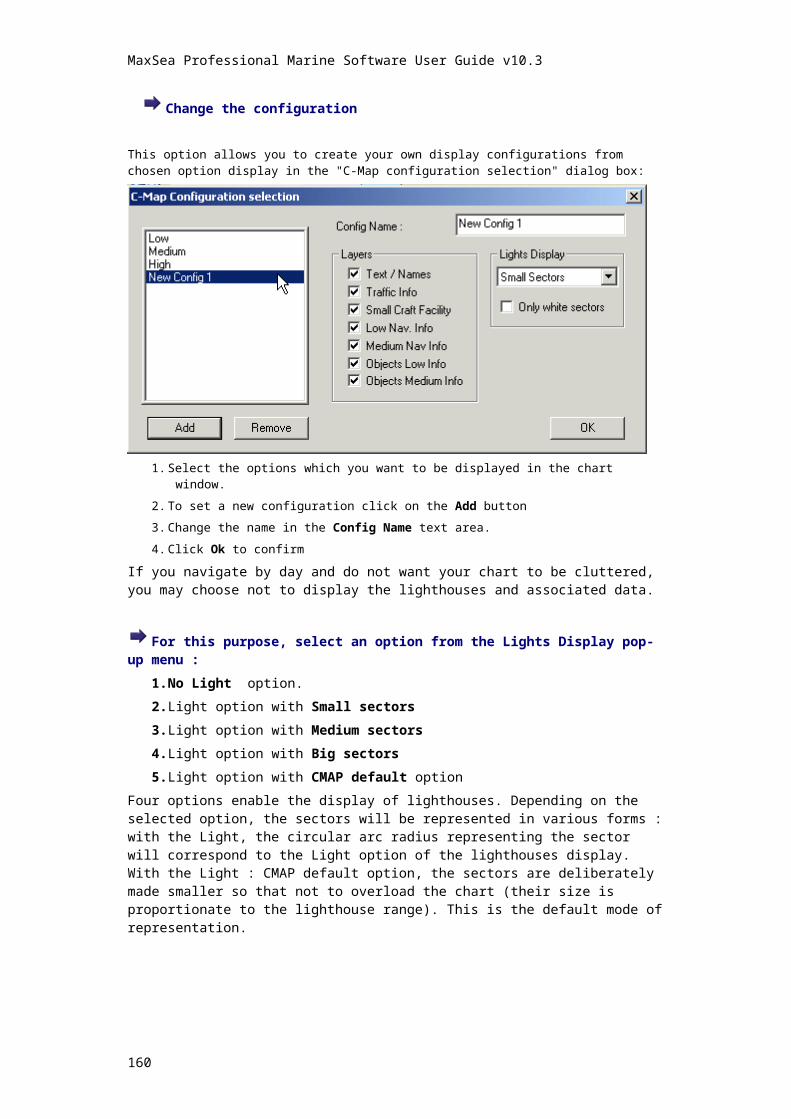
User Guide
The trawl option allows you to center the camera on the trawl. The camera moves according to the movement of the trawl. This option is unavailable if the trawl is not displayed.
Note: The Camera altitude can be changed with the boat or the trawl option.
2 -Two options for the camera altitude settings:
If the "Mobile altitude" option is selected , the camera is centered on the mobile's altitude ( if the Boat option is selected the mobile altitude is equal to 0 or if the trawl option is selected the mobile altitude is equal to the depth of the trawl).
The "On the ground" option is selected, the camera is centered on the ground.
Bathy imported data
Before importing 3D data
IMPORTANTMaxSea must o be used with a Display configuration of 65k colours (16 bits). Do
NOT use a 24 or 32 bit color setting.
161

MaxSea Professional Marine Software User Guide v10.3
How to optimize the MaxSea display function with Windows XP operating system ?
If your screen is configured to use something other than 65k colors (16 bits), please, follow the procedure below.
Right-click on the Windows desktop.
Select [Properties] in the pop-up menu to display the Properties Dialog box.
1. Select the Settings Tab.
2. Choose Medium (16 bit) in the Color quality pop-up menu.
3. Click on the Apply button to validate your configuration.
4. Close the Display Properties Dialog box.
This module will allow you to import sounding data from external sources as well as personal data. You will be able to create and enhance a personal database containing this sounding data.MaxSea is delivered with a world-wide 3D data base (Sandwell). The best way to proceed is first to import more precise 3D data such as MNT (Mapmedia) or C-Map on your fishing area. Now that you have more references in your 3D database, you can enhance it with your own .ptf files or Real Time sounding data using MaxSea's Personal Bathy Generation (PBG) capabilities This way you will be able to enhance the quality of the database as you navigate by correcting the chart values with your own measurements.
You will be allowed to import:
User data
Layer files or Fishing plans
Marks
Lines.
(XYZ) files
162

User Guide
3D charts
Bathy Mapmedia
C-Map Ed 2
.GRD data grid.
Real time PBG – Personal Bathy Generator
Datum
Bathymetric data such as Bathy Mapmedia, C-Map Ed 2 and .GRD data grid, is in WGS84 format. Be careful when you import real time or personal data, for the WGS84 datum must be used consistently.
Hardware configuration
Hard diskAs the database is to be stored on the hard disk, we strongly recommend you to choose a fast hard disk (ATA-100 or better if possible ) with a large capacity (20 gigabytes or more) formatted on a single FAT 32 partition.
Video cardIn order to obtain the best 3D display results, you should choose a video card with 3D capabilities and a minimum of 16MB of video memory.
The best performance will be reached if you have the possibility to display the 2D and 3D windows on two different screens. To do that, you will have to equip each screen with a 16 Mb video card (or a dual video card).
MemoryUnder Windows 98 SE we recommend a minimum of 128 Mo of SRAM memory (PC100).
Under Windows 2000 PRO or XP, we recommend a minimum of 256 Mo of SRAM memory (PC100).
Operating system
Windows 2000/ XP Windows 98
The +
Stability
Security (system protection)
General performances
The +
Simplicity of running
Best managing of 3D card
Allow an installation on less efficient systems
The –
A minimum of 256 Mo of memory is necessary
A little more technical knowledge is necessary for the installation
A good quality 3D card is required
The –
Less stable system
No security managing
Required Configuration PC Pentium III or Athlon , 700 MHz rate
128 Mb of SDRAM (or 256 Mo for Windows 2000)
A 20 Gb hard disk (7200 t/ FAT 32 formatted)
2 32 Mb integrated VRAM video cards (not shared)
Windows 98 SE or Windows ME or Windows 2000
A great capacity backup system (CDRW or a second hard disk).
Displaying data
Click the 2D button to display or to block off bathymetric data in the 2D window.
Select imported 3D data
163
MaxSea Professional Marine Software User Guide v10.3
Import data to MaxSea 3D database
You can import your own data using the files you have previously recorded.
You can also import data
From a version 8.1 DataBase (Be careful and don’t use this option if the version 8.1 database contains DEM grid data)
From "C-Map Ed2" vector charts
From files
1. From User Data
2. From ASCII file
3. From D.E.M. ("Mapmedia" 3D charts and MaxSea "3D charts world database")
To import data, select [Import to 3D data base] from the [File] menu
Then select the type of data you wish to import.:
1. To import version 8.1 data.
2. To select the database path on your computer
3. To import "CMAP ed2" data
4. To import data from User data (file PTF file, PBG on), ASCII (xyz file), D.E.M. (Depth Elevation Model, *.GRD, *.G03)
5. The path zone file import data
6. Use "Add data files" button to select a new data file
7. Use "Clear selection" button to clear a data file from the list before importing
Note : if the import takes too much time, you can cancel by clicking on the "Cancel" button.
Import data from old DataBase
164
User Guide
There are two ways to import data from an 8.1 Database
1 - The most secure way to import the 3D data from version 8 is to follow these steps:
Import depth value upon the fishing area from the grid files:
Check D.E.M. box (Depth Evaluation Model)
Click Add files to select 3D data files
An "Open file" dialog box appears that allows you to select the file you wish to import.
Import depth value upon the fishing area from the Cmap93Ed2 CDs, :
Select [Open chart…] from [File] menu (the CMAP chart must be open before the import)
Check the "C-Map" box to select the chart from the CD.
Import the "User data" in the 3D database version8:
Check the "User Data" box
Click on the "Choose database folder" button to import old user data from an exiting database.
2 - An option available to automatically import his C-Map Ed2 depth data from the version 8 3D database.
IMPORTANT
Be careful when using this feature.
This method can be used ONLY if the user has not imported DEM data (in such a case the accuracy could be significantly decreased).
All data is imported with the old parameters (you can't, for example, modify Tide parameters).
Only version 8 User Data from fishing plan or from a PBG tracking file can be exported and included in the 3D database.
Import "User data"
To import depth information from User data you have to:
Choose "User data (*.ptf)",
Then, click on "Add files", the following file appears.
Click "Open" after you have selected a file
The file path appears in the following window
165

MaxSea Professional Marine Software User Guide v10.3
Note:
1. It is also possible to simultaneously add several User data files. , select the file and click Add files again.
2. It is also possible to delete a file selected in the window. To do it, select the file and click on Clear Selection.
At last click "OK" to start the import
Before importing data into the 3D database, you have to adjust some parameters (see the following How to configure 3D data Import paragraph).
Inserting lines and points
If you wish, you can plot your own bathymetric data on an existing point or line and then import it into your 3D database:
Create or display the point or line,
Open the point info window (double click on the point with the finger tool)
Enter a value for depth
Validate by clicking OK.
Note: if you want to modify all the depth value for a line, click on the "All the line" button.
166
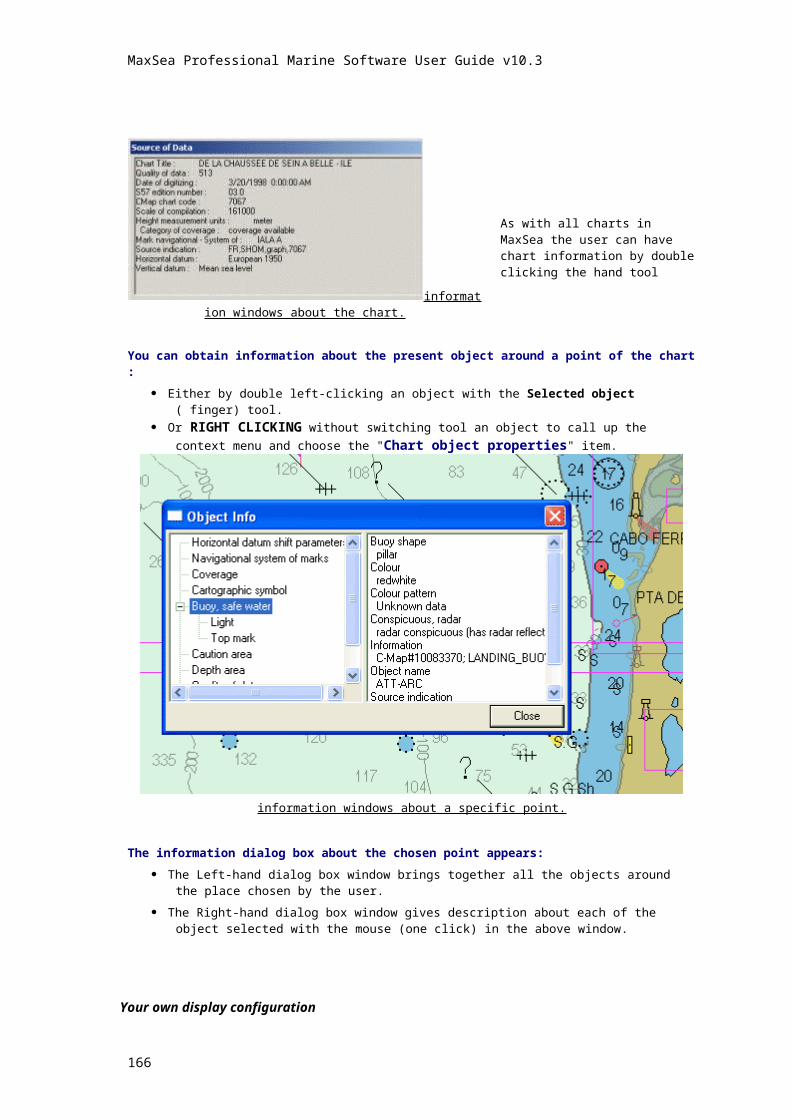
User Guide
You can add this new information to your database by importing the ptf file. (You must save the pft file before importing data from it.) For more information see Import "User data").
Before importing "ASCII (*.xyz)" files
The MaxSea data format:
Latitude and Longitude are in decimal degree.
The depth is in meters,
By default the scale of import is 1/10000.
The standard lines of this basic format will be: X Y Z.
Each data field must be separated by a space.
Note: you can change import data parameters, to do this you have to add information in the ASCII file header.
[COMMENTS]
User comments
[PARAMETERS]
HeightUnit = METERS // (meters by default
ImportLevel = 9 // scale data import (1/10000 by default)
MaxSea scale Scale import
500 5
1000 6
2500 7
5000 8
10000 9
25000 10
50000 11
100000 12
250000 13
167
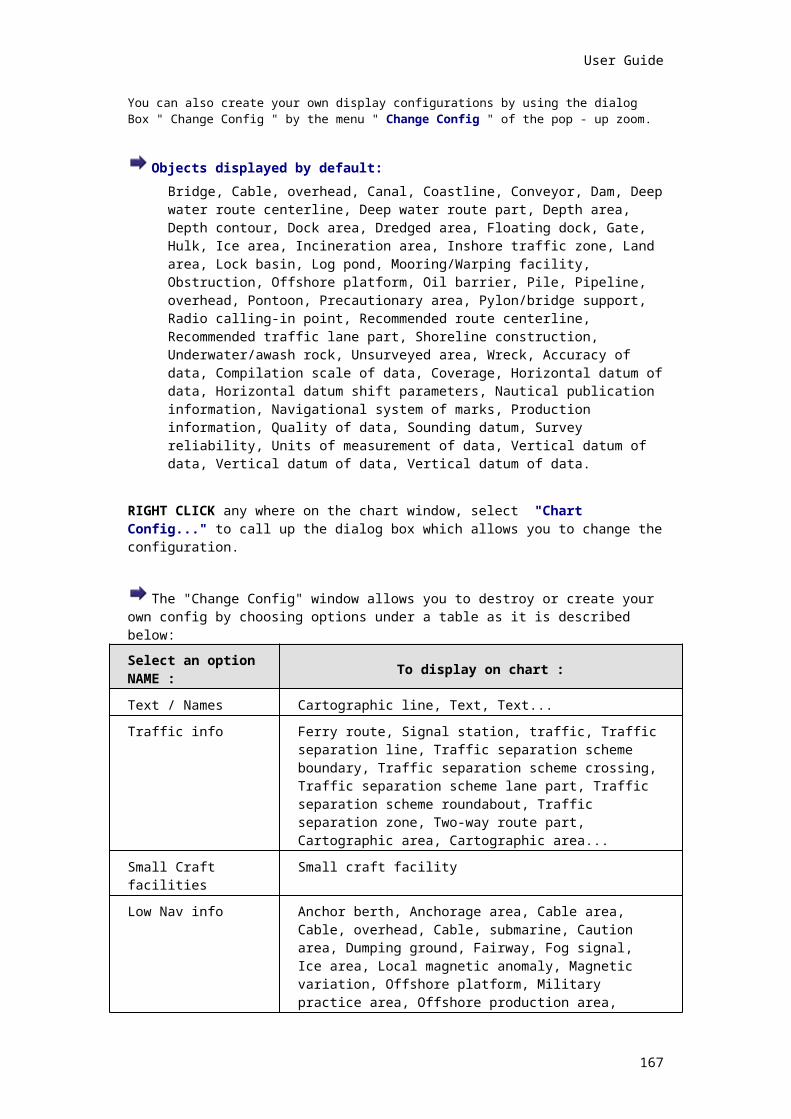
MaxSea Professional Marine Software User Guide v10.3
500000 14
1M 15
2.5M 16
5M 17
10M 18
25M 19
50M 20
100M 21
250M 22
[COORDINATE SYSTEM]
Group = LAT-LONG
System = LAT-LONG
Datum = WGS84 or ED50
Unit = METERS
The complete list unit:
MILLIMETERS, CENTIMETERS, DECIMETERS, METERS, KILOMETERS, INCHES, USINCHES, TENTHFEET, TENTHUSFEET, FEET, USFEET, CLARKE FEET, LINKS, BENOIT LINKS, SEARS LINKS, GUNTER LINKS, CLARKE CHAINS, BENOIT CHAINS, SEARS CHAINS, GUNTER CHAIN, YARDS, SEARS YARD, INDIAN YARD, NAUTICAL MILES, U.S. SURVEY MILES, INTERNATIONAL MILES, RODS, PERCH, POLE.
[DATA TYPE]
Data type = 8 for depth data
26 for Roughness (E1) data
27 for Roughness (E2) data
Data origin = -1 for all data
0 for User data
1 for Cmap data
2 for Grid data
[DATA]
Separated the data to be imported by a space …
Import ASCII (*.xyz) files
To import data from "ASCII(*.xyz)" you have to:
Choose "ASCII"
Click on "Add files" button, the following file appears.
168

User Guide
Note:
1.To add several user data files in same way click on "Add files" again.
2. To delete a selected file in the window, first select the displayed file and click on Clear selection button
3. At last click "OK" to start the import
Before importing data to 3D database, the software suggests you to adjust some parameters (for more information refer you to chapter How to configure data import "from ASCII (*.xyz)" file)
Import Digital Evaluation Model
Allows you to import data from bathymetric charts such as:
World-wide data (provided with the 2D module),
Mapmedia data (SHOM, IFREMER).
To import data from "3D charts" you have to:
Select D.E.M. box (Digital Evaluation Model)
Click Add files button to select a 3d data file
An "Open file" dialog box appears that allows you to select the file you want to import in your database.
169

MaxSea Professional Marine Software User Guide v10.3
Click "Open" after you have selected a file The file path appears in the following window
Note:
To add several user data files, click on "Add files" again.
To delete a selected file in the window, first select the file and click on Clear selection
Click "OK" to start the import
IMPORTANT Before importing data to the 3D database, you are given the option to set some
parameters, but you must click the the Import button. Adjusting these parameters has no effect on the importing D.E.M. data.
It is possible to cancel the import if it takes too much time by clicking on the "STOP" button. Note that it will stop it at that point and not cancel the entire import.
Import "C-Map Ed2 Data"
170
User Guide
First open the C-Map ed2 chart, by selecting [Open chart…] from [File ] menu
Select a scale of the front window from 1:1000000 to 1:500, zoom on the region you want to import. MaxSea will import depth from ALL charts included inside the window, at ALL scales from the window scale up to scale 1:500.
Then select [Import to 3D database] from the [File] menu
The following dialog box appears: select the type of data you wish to import :
Check C-Map box
Then Click on Ok.
You have to define some parameters before importing data. (See "how to configure data import from C-Map CD")
Start the 3D data import
Once you have chosen the data to be imported and adjusted the parameters (if necessary) you can start the import.
Start the "CMAP" 3D data import Start the "D.E.M." 3D data import
To preview before importing data, click on the Test button.
If you need configure the import, see "How to configure data import".
Start the import by clicking on Import
171
MaxSea Professional Marine Software User Guide v10.3
Start "User data" files
Note: the Test function is available for C-Map Chart and (ASCII / PTF) files.
If you have already imported a file, a warning appears and informs that this file might be already imported.
o Click on the Import button to confirm
or
o Click on Do not import to escape.
A dialog informs you about the time remaining for the import.
When the import is finished the following dialog box gives you the number and type of points imported into the database.
BE CAREFUL: this operation can take a long time.
Configure imported data
How to configure Data Import
The Import Data window interface will change according to the type of imported data.
172

User Guide
1- Parameters Tabs are available according to the chosen import of data (Area, Range, Offset, Boat, Tide, Filter).
2- Test button: when you have done a change you can test the result before importing your data.
3- Undo button: to cancel the test.
4- Import button: to launch the import data
5- Cancel button: to quit
Note: in most of case you don’t have to change the parameters.
When you choose the data to be imported:
If the imported parameters need to be adjusted you can preview directly the result by selecting the Test button. Select Undo to erase the configuration if it’s wrong.
Then select the Import button to add directly data in the database.
For more information about adjustment refer you to the following paragraphs.
How to configure an Area Data Import
By default World box is checked (all depth data will be imported)
The Geographic rectangle checked allows you the possibility to define the geographic zone for which you want to import data. This function is available for C –Map chart, ASCII file and user data and not available for Mapmedia 3D data chart and world data.
Before selecting a zone check the Geographic rectangle radio button.
Define a zone on the chart using the Arrow tool, the data coordinate will be automatically updated.Note: By default the geographic zone corresponds to the window displayed at the time of the data import.
173

MaxSea Professional Marine Software User Guide v10.3
How to configure a Range Data Import
You can choose the range according with the depth data import.
How to configure the Offset Data Import
This function allows you to apply a constant or proportional data difference.
How to configure the Boat Data Import
174

User Guide
Sounder position
GPS position
This function allows you to choose an immersion value for your Echo Sounder head in case it is not self compensated. It is also important to correct the x,y horizontal offset.
How to configure the Tide Data Import
Allows you 3 possibilities of tide display:
No tide
When the tide tables on the zone are not precise.
Automatic station selection
MaxSea adjusts data with the nearest reference harbour.
Selected station
Otherwise, choose a reference harbor for the tide values. The tide values of that harbour will correct the sound data you import. It also works with your former own data.
Then choose a station from the Harbour list:
175
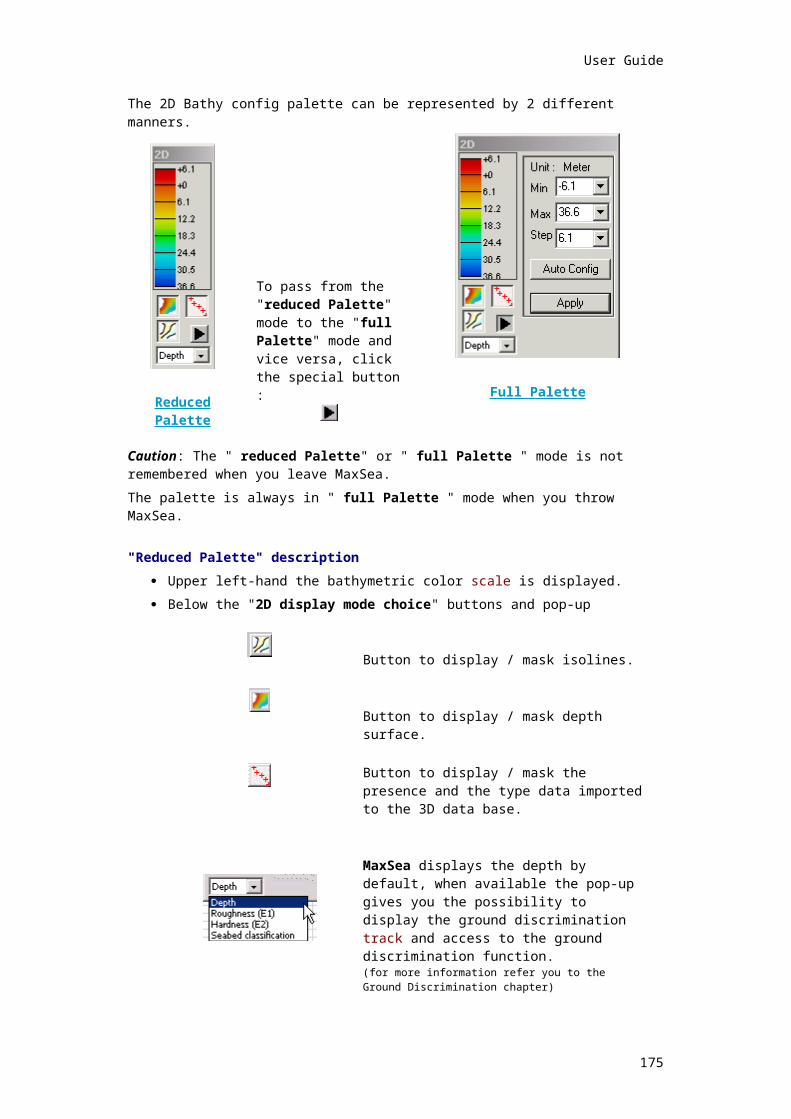
MaxSea Professional Marine Software User Guide v10.3
How to configure the Filter Data Import
Maximum import scale
It is recommended to select a scale to import your data. It indicates the precision of the grid on which data will be insert.
For example: for a scale of 1:10000, data will be available from 1:10000 to 1:250 million.
Note: to display the under scale value you have to activate the Overzoom function (see 3D properties chapter). Data value will be available but not precise.
Please pay attention to following advises:
If you choose the Auto item from the pop-up, MaxSea will define the scale of imported depth value.
Filter:
Select the range of sounding values that will be inserted in the database to enhance it. It is a % value.
PBG real time
PBG / Real Time / 2D/3D
176

User Guide
The import PBG allows to get depth data from a sounder in real time. When the function is activated, the depth data is automatically recorded (in the database) and the 2D and 3D displays are updated in real time in the window chart.
Note: a sounder must be connected and the input/output port must be configured. Refer to the "Connect equipment to your software " chapter for more information.
The PBG on/off button activate or deactivate the real-time recording of depth data.
When PBG is on, the data is automatically recorded and the 2D and 3D displays are updated as configured.
The PBG settings (filter, tide…) can be configured in the 2D/3D properties dialog box.
Access to PBG options:
Select [Option: PBG/2D/3D ] from the [Utilities] menu to open the full dialog box for "PBG / 2D / 3D" options.
See the Related topics: How to configure PBG options PBG data
How to configure PBG Data Import
Parameters
To modify the Data Import parameters, click on the Parameters button situated in the "Real time import" zone.
177

MaxSea Professional Marine Software User Guide v10.3
See the following paragraphs to adjust the parameters:
How to configure the Boat data import.
How to configure the Tide data import.
How to configure the Filter data import.Import scale
Before activating the PBG function, you have to select a scale for importing data (see " How to configure PBG options "). It indicates the precision of the grid on which data will be inserted.
Please pay attention to following:
Data values will be available from the scale selected up to higher scales, but be careful. If you choose a level which is too high to import data, your disk will fill up quickly. If you choose the "Very High Resolution Bottom Analysis", MaxSea will display a Dialog box to warn you.Filter
No echo sounder is 100% accurate, and echo sounder may send false depth values from time to time. If those values are imported, the 3D database will not be accurate. In this case a tool tip will appear down on the right of the chart screen and will indicate that the PBG Depth Data is filtered:
Select the range of sounding values that will be inserted in the database to enhance it. It is a % value that is explained in the example below.
Example: you choose 20% and import data in a zone where previous sounding values were 100 meters.
All data in the range 80 – 120 meters will be inserted to correct your data base; the other ones will be rejected.
Echo sounder
Choose an immersion value for your Echo Sounder head in case it is not self compensating. It is also important to correct the x,y horizontal offset according to its location in relation to your GPS receiver (positioner).
178

User Guide
Tide
Choose a constant tide value to insert an offset if the tide tables on the zone are not precise.
179

MaxSea Professional Marine Software User Guide v10.3
Otherwise, choose a reference harbor for the tide values. The tide values of that harbor will correct the sound data you import. It also works with your former own data.
To choose a reference harbor, select the Choose station button
How to configure PBG options
Select the PBG tab to choose a PBG import resolution (see: Personal Bathy Generator settings)
For example you can choose:
1. "Very High Resolution Bottom Analysis" only on a small area.2. "Shallow Water" if you are going out daily and when you fish near your harbor.3. "Open Water" when you work far from the shore.4. "Navigation and Prospecting" to get general information about the bottom.5. "Automatic" MaxSea will select the best resolution according to the depth.
Note: by default, the "Automatic" radio button is checked.
Then select the Filters tab
180

User Guide
This option allows you :
2D/3D update frequency: allows you to select the time interval between updates of the 2D/3D view. Depending on your needs and computer speed, select a frequency from 1 to a few seconds.
PBG Input frequency: select the time interval in seconds between database updates.
Note: When PBG is on, the echo sounder data is inserted into the database in real time. It is strongly recommended to first set the PGB parameters by clicking the Parameters button (see How to configure the PBG parameters paragraph above). You can select a filter value, a tide correction… that will be active when recording data in real time.
Bathy database
Bathy database
MaxSea stores 3D data in two formats:
H.D.F. format : Used for grid data (DEM) management
ACCESS : Used for discrete data management
1. Imported user data from fishing plan (*.ptf format), text files (ASCII format) and user data imported from an old database.
2. Data recorded from PBG.
3. C-MAP ed2 (CM93) data.
This separation allows
Better database management for importing, modifying or deleting data.
A choice for the type of data used for 2D and 3D display (User data, DEM data or both)
Important
181
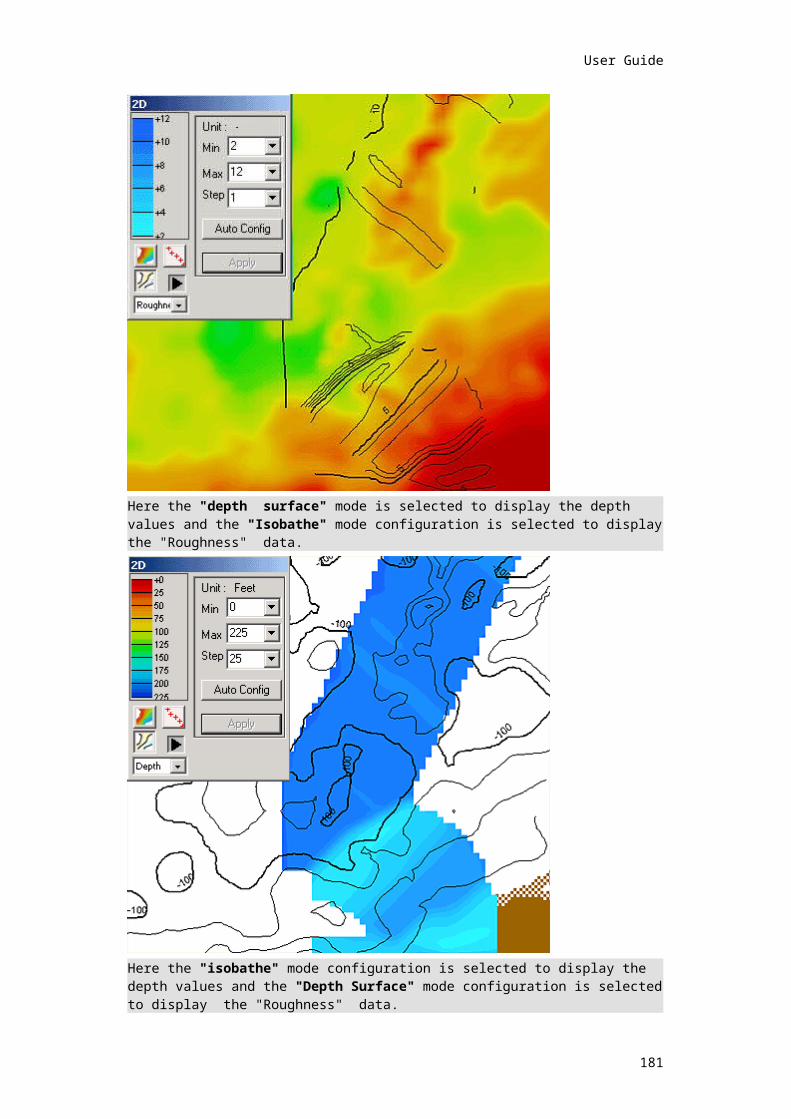
MaxSea Professional Marine Software User Guide v10.3
It is possible to repair the 3D database when MaxSea detects wrong values. This option is accessible at any time. For more information, refer to the following subject:" To repair the 3D database".
Edit 3D database
Edit the 3D database
This function allows you to display the contents of the database in order to eventually delete or modify non accurate values.
To edit database, first select [Edit 3D database] from the [Edit] menu:
Then, the following display appears in which you can from this window:
Delete user data values
Modify user data values
MaxSea allows to display independently each kind of data:
C-Map by small pink crosses
UserData by small red crosses
It will allow to display step by step these 3 kinds of data, or to select which one to display.
You can see that the grid display is different: the grid and all imported data are displayed just as data that can be deleted are displayed with red included rectangles.
"Overzoom depth" values are represented by crosses in dotted line. 2 levels of "Overzoom depth" values are displayed in the 2D view.
182

User Guide
Example :
Correct value representation First level of the "overzoom depth" value
Second level of the "overzoom depth" value
By default all data displayed on screen and which can be edited, are selected.
IMPORTANTIt is possible to delete and modify Overzoom depth values you have to select the option Overzoom from the 2D properties dialog box.
(for more information about this option refer you to the 2D properties chapter)
To select several value use the Arrow tool and draw the zone in which you want to modify or delete data.
You can also refine this selection by determining a range to which the operation will be applied:
, choose the Range tab.
The following box appears and allows you the below options:
Apply to all Depth values
Apply inside the range Depth values you have chosen
Apply outside the range Depth values you have chosen
Then define the range
(if you want to change the depth units see General properties chapter)
Modify non accurate values
Select the Offset tab before you have selected non accurate values to be modify.
183

MaxSea Professional Marine Software User Guide v10.3
Three modifying options are proposed:
[Offset] box checked: the function consists in adding a fixed value in your selected depth values and then you have to choose the value which you want to affect.
[Exact Value] box checked: the function consists in replace selected depth values by a fixed value and then you have to choose the value which you want to affect.
[Offset%] box checked: the function consists in replacing selected depth values by a proportional value and then you have to choose the value which you want to affect.
After you have chosen the option select the [Modify] button.
Modified values are displayed and you have to:
Confirm your modify by selecting [Validate]
Or
Escape by selecting [Undo]
Note: you also have the possibility to do successive selections before validate your modification.
Delete non accurate values
You can erase the selected values by clicking on the Delete button
Erased data are not definitively deleted to update the 2D/3D displays according to these modifications you have to click on the Validate button (to cancel click on Undo).
184

User Guide
All depth values selected are automatically refreshed in the 3D view according to the 2D view, so you can improve your selection.
At every moment you can choose to undo or to validate the deleted function. You also have the possibility to do successive selections before the deleted function.
Manage 3D database
Manage the 3D database
Data is stoked by default in C:\3Dbackup\ and are formatted in .grd (for a standard installation of MaxSea).
You can reach the management of the database directly from the MaxSea [file] menu.
To do it select [Manage 3D database…] from [file] menuThis window allows you the ease of your database management.
You can :
Backup your database
Restore your database
185

MaxSea Professional Marine Software User Guide v10.3
Compact your database.
Repair your database if need
Backup the 3D database
It is important to frequently backup the 3D database by selecting Backup 3D database from the File menu.
A dialog box appears and informs you that this function may take a long time :
If you are sure, click OK.
A second dialog box appears and tells you where the backup files have been saved on your PC.
Click OK.
IMPORTANT
We recommend that you archive these files to a separate disk, CD-R, or separate computer. Otherwise you will lose this data in the event of a severe hard disk failure.
Restore the 3D database
You may need to restore the last back database for example after a false manipulation when import data.
To do that, select [Restore 3D Database] from the [File] menu:
The following dialog is opened:
If you are sure, click OK.
IMPORTANT
The restore function replaces the current database by the last which have been saved. In certain cases, editing the base and deleting data can be enough to correct a mistake during an import.
Compact the 3D database
If the database is very voluminous, it is necessary to compact the database to accelerate the operations on it.
This function modifies not at all the type of file and the useful data which are imported but deletes all unusable data.
The database should be compacted after a several imports of data or after a PBG's long use.
Note: It is not useful to compact the database for every save data. It takes more or less of time following the number of data to compact the database.
186

User Guide
To launch the compact database function you have to click on the [Compact] button from the "Manage 3D database" dialog box.
Then a dialog box with the warning about the duration to compact the 3D database appears.
Click on Ok to valid.
The bar of progress appears and informs you about the duration.
Repair the 3D database
MaxSea verify the 3D database at the first run and every time when a new data is read.
A warning appears each time when MaxSea detected a wrong format value in the current 3D database zone. MaxSea proposes to repair your 3D database.
To repair your 3D database select [Manage 3D database…] from [file] menu and then click on the "Repair" button.
Note: in case MaxSea has detected no wrong value and the repair function has been selected, a message appears and warns you before launching the process.
Change your 3D database password
You have the option of changing your 3D database password.
Click on the [Change] button from "Manage your 3D database" window and the following dialog box appears:
Enter your old password and the new one and click on OK.
Export 3D database
Export a 3D database
187

MaxSea Professional Marine Software User Guide v10.3
You can export data from a database. It allows you by import of these data (type of file: *.XYZ), to share your data with the other users or to bring together data of several databases.
Caution: MaxSea ONLY exports the "UserData" . The exported file is encrypted and will only be available with MaxSea software.
, select the function [Export the database 3D] from the [file] menu.
Then a dialogue box appears:
Choose the type of data which be exported (by default the Depth is selected)
Note: if the database contains Roughness (E1) or Hardness (E2) information, you can also export these data by selecting the corresponding item from the pop-up.Then if need be, enter the password and click on OK to valid.
Note: you can protect exported data by password since the menu [Manage the 3D database] from the [file] menu
Select on the chart with the arrow tool the data zone of which you want to export.
Note: by default during the opening of this window the preset zone corresponds to the zone displayed on the screen.
If you change the scale it will automatically be updated according to the new displayed zone on the screen.
Click on [Export] to valid
Then choose a folder and file name for your exported file.
Archive the 3D Database
What means archived database?
It is not especially necessary to confuse the notion of database Backup and the notion of archived the database
The Backup is only a working copy. So if during a tide the data which you recorded are not correct, you can decide not to keep them. For it you thus go to restore the database previously Backup database so as to be able to return on an clean database by ignoring the last acquisitions.
The archives is a help copy of your data base in case having problems on your hard disk or on your PC. The save will be made rather on a support as an external Hard disk or a CD-ROM. You can keep a copy of your database in a sure place and possibly reload it in case of important problem.
Caution : please, do not store the archives of your Data bases in the same hard disk as the active the base because to risk you to saturate the hard disk pointlessly. Furthermore in case of "crash" of your hard disk you would lose all your work.
188

User Guide
Establish an Archives
To archive your Base of datum you owe:
Protect your (so necessary) Base do a copy of your of file of Protection (3D Backup by default) on an external support (the procedure of copy depends on the used support: CD, Hard disk)
Seabed analysis
Seabed analysis
Connected to a Seabed system the PBG function is able to gather 2D and 3D data providing much more detail of ocean floor relief and composition (sand, silt, rock,...).
The software displays and records Roughness (E1) and Hardness (E2) information.
When a Seabed system is connected and PBG is on, the Roughness (E1) and Hardness (E2) data are recorded automatically in the database.
Note: (1) - Refer you to the related topic PBG Real Time for more information.(2) - a seabed system must be connected and the input/output port must be configured, see "Connect equipment to MaxSea " for more information.
How to display Roughness (E1)/ Hardness (E2) on the chart
The software gives you the possibility to display directly on the chart, the Roughness (E1), the Hardness (E2) or the seabed classification according to the available data in the 3D database
Three display modes are available :
Display the Roughness (E1)
To display the Roughness (E1) information on the chart select the corresponding item from the pop-up
Display the Hardness (E2)
189

MaxSea Professional Marine Software User Guide v10.3
To display the Hardness (E2) information on the chart select the corresponding item from the pop-up.
In this example, one sees that the track colors is according to the seabed zone.
To change the Seabed classification configuration click on Seabed Config button situated in the right 2D window.
Related topic:
"Configuring a Seabed classification"
"Seabed Class" palette
When a Seabed system is connected to MaxSea, a specific box can be displayed.
To call up the "Seabed Class" palette go to the [Display] menu and select [Other display].
190

User Guide
Three display modes:
1 – Reduce palette is displayed by default
2 – Simple click on the box located in the upper right-hand corner of the window to open the graphic zone.
The box shows the values E1 (Roughness) and E2 (Hardness) characteristics of the ground type.
3 – Double click on the box to open the key of ground types and a third time to return to the minimum configuration.
191

MaxSea Professional Marine Software User Guide v10.3
Note: to move the box over the screen Click the title bar and hold the mouse button down.
Modifying scale
It is possible to modify the display scale of the Seabed graphic from the palette using any tool selected from the tools palette
(The scale is multiplied by 1by default)
To activate this configuration click on a "ground area" from the graphic with the right button of the mouse.
A pop-up menu appears and gives you the possibility to modify the scale multiple.
(The scale can be multiplied by 1,2, 4, 8, 16 or user choice).
Two possibilities:
1 – For example the (*2) multiple have been chosen in the pop-up menu, the selected zone is multiplied by 2.
192

User Guide
2 – The User choice option allows you to modify the display ratio between E1(Roughness) and E2(Hardness).
Activate the track
The track is activated by default.
Click on the Track off button located in the upper left-hand corner of the box to activate or deactivate the track function; the last 12 points remain displayed on the " Seabed Class " graphic in Tracking mode .
Playback the track
When you select a track on the chart associated with Seabed system information, an S button appears in the Sea bed class box (see the Modifying marks chapter).
Click the S button to run a playback display of the selection in the Sea bed class box.
Note: Click the mouse button to stop the playback. Click a second time to repeat the playback.
Seabed classification preferences
In order to obtain the best results, it is necessary to configure the Ground discrimination system depending on the type of sounder, water salinity, etc..
The software allows you to define as many configurations as necessary and use them when required.
IMPORTANT
When you change the configuration, the new configuration is automatically applied to the current track . The previously recorded tracks are not modified with respect to the new Ground discrimination system configuration (see paragraph Applying a configuration to a track to adapt the display of a previously recorded track to the new configuration).
Click on preferences button P located in the upper right-hand corner of the Seabed class box to open the configuration dialog box.
193

MaxSea Professional Marine Software User Guide v10.3
Seabed graphic Interface:
1. To define a new Seabed configuration name
2. To define a Seabed zone color
3. To define a Seabed zone name
4. To delete a selected zone
5. To show the track on the Seabed graphic
6. To open a Seabed configuration
7. To the current Seabed configuration
8. Settings to adjust the Ground discrimination system with the MaxSea software
9. Seabed zone selected
10. Different Seabed zones (constituting the Seabed graphic)
Seabed color legend
Configuring a Seabed classification
Using Seabed configuration
Saving a Seabed configuration:
194

User Guide
When you define a new seabed configuration you should save it with a new file name. It will be easy to load this configuration in the future.
To do the save, click on the Save button, the configuration will be saved in the "My documents" folder and the file extension is (*.rox)
Opening a personal Seabed configuration:
In case you want to open a personal Seabed configuration, which is stored in "My Documents" folder click on Open button.
This opens the file open dialogue box and can be use to load a previously saved configuration.
Modifying the size of a selected zone
Click on a zone to select it.
Then click the upper left-hand corner or the lower right-hand corner of the selected zone and drag the mouse to modify the size of the zone.
Note: by clicking this zone, you move it into the foreground.Be careful Zones should not overlap. If the modifying zone covers other zones the visible zone becomes priority.
Modifying the zone name
Click the zone to select it and then enter the new name in the Title box.
Modifying the color of the zone
Click the zone to select it then call up the color pop-up menu.
Erasing a zone
Click the zone to select it, then select Erase from the Edit menu.
Creating a zone
Click outside of the existing zone. Next, drag the mouse holding its button down to define the new zone. Then, enter the associated parameters (name, color) as explained above.
Note: 16 zones max can be created.
Displaying the selection
If points to which (E1/E2) information is associated are selected on the chart, a "S" button appears in the upper left corner Ground discrimination palette
195

MaxSea Professional Marine Software User Guide v10.3
Click the Selection display (S) button to display the points selected in the dialog box.
Click on the mouse to interrupt the simulation.
NOTE : Preferences are always saved when exiting and restored during exit launch cycle.
"Engineer" adjustment dialog box
Click the Settings button to open the Seabed class "Engineer" adjustment dialog box (for more information see your Ground discrimination system manual before filling items).
The Seabed Class dialog box appears and then inform the required items:
1 - "Apply depth correction" option is selected
The frequency and the sound speed fields are filled. The following calculation which is applied on the displayed depth value is:
(Displayed Depth value ) = (Entered Depth value ) X (propagation speed of sound / (2 X selected frequency ))
2 - "Apply E1/E2 correction" option is selected
Enter a maximum depth value and The following calculation is applied:
If the (Depth value >= entered LMax value) then (Displayed E1 value ) = (Entered E1 value ) X (Depth value / LMax value)
or
If the (Depth value <= entered LMax value) then (Displayed E2 value ) = (Entered E2 value ) X (Depth value / LMax value)
3 -"Apply display law" option is selected
196

User Guide
by default this option allows a calculation on E1 and E2 to improve the display in the 2D view.
Then to allow the calculation you have to click on OK .
IMPORTANT
The calculation is available on the display and not on the recorded values. The data values are saved in the database with out the Display Law correction. The display law is applied dynamically during the display process. This will allow you to change the display law or to share there Hardness / roughness database more easily. Be careful, an old Hardness/Roughness databases from a previous version are Not available if the "display law" was applied.
Applying a configuration to a track
1. Choose the required current configuration as explained above.
2. Using the Arrow tool select the track to which you wish to apply the current configuration.
3. Select [Edit Track Line] from the [Edit] menu.
In the Change the track parameters zone in the upper part of the dialog box, select Track color (and optionally the line thickness).
Check the Variable color box and the select the Edit color range button from the Track color zone, then call up the pop-up menu and select (E1/E2) as the new display parameter. Finally, click OK to validate.
The selected track display is modified depending on the current E1/E2 configuration.
Trawl positioning
Trawl positioning with PACHA or GEONET
The Pro version of MaxSea Fish with the module enables you to display data provided by PACHA, Geonet or Simrad ITI, the depth acoustic positioning system for trawls.
For more information about this function, contact your reseller.
Introduction
The PACHA , Geonet or Simrad ITI system allows to determine the location, geometry and environment of a trawl in order to safely and efficiently perform trawling operations.
This system makes it possible to determine in a very precise way the site, positioning in order to improve the security and to optimize the performances of each spinning operation .
For example, thanks to the accurate measurements of the trawl location, it is possible to operate very close to the obstacles and wrecks where the catch of fish can be very much increase.
Configuration
To receive data from PACHA , Geonet or Simrad ITI transponders, the configuration required is the following :
MaxSea Pro with 3 serial ports
Pacha Geonet Simrad ITI module.
1 serial port for Position ( GPS )
Gyro
2 serial ports for the PACHA , Geonet or Simrad ITI system.
197

MaxSea Professional Marine Software User Guide v10.3
Connection
NMEA standard.
All the data coming from the system PACHA arrive on PACHA DAP1 serial port. The configuration in MaxSea DAP2 is there only to simulate position coming from DAP2. The DAP2 data comes in fact from DAP1 serial port.
Input-Output configuration
1. Select [Input/Output Settings] from the [Utilities] menu. The following dialog box is opened :
2. Click the Trawl tab
3. Add the PACHA/GEONET system by clicking on "Add Instrument".
4. Select a the port com which is connected to the system
5. Click next to activate the wizard which lets you to choose between several system.
6. Select the line PACHA / GEONET or Simrad ITI or Scanmar or Marelec.
The system is connected, select the line in the Instrument list by:
1. Either double clicking the line.
2. Or click on the Advanced settings button.
3. The data settings : trawl on port COM2 appears to configure your system.
PACHA / GEONET SYSTEM setting:
The following setting dialog box is according to Pacha/Geonet System.
All data provided by Pacha are coming on the PACHA DAP1 serial port.
DAP2 configuration is used to simulate in MaxSea the arrival of the DAP2 transponder.
DAP2 data positioning in fact, arrive through the DAP1 serial port.
SIMRAD ITI SYSTEM setting:
The following setting dialog box is according to Pacha/Geonet System.
198

User Guide
Trawl display
2D DisplayThen trawl is represented as an icon on the window card, the dials instruments show information sent by sensors.
Trawl track
By default the track of the trawl panels is activated. It is thus enough to click [ TrackOn] to show the tracking trawl on the chart. You can modify parameters or deactivate the track of the trawl in the same way as the ship track from the [Utilities] menu: [Option: GPS/rack].
Please, select in the left-hand list a positionner of your choice the panel the parameters of track of which you want to modify
Select panel and then, enter the new tracking parameters.
You can activate for example or deactivate the track of the panel by checking or not the Track on box.
(For more information about parameter settings refer you to the Ship track chapter)
Remark: it is possible to activate the trawl track by clicking on Track On/Off button without showing the track of the ship. To do it you have to deactivate the track option for the GPS in the "Track properties".window.
3D DisplaySensors position is represented in the 3D window showing immediately the trawl position compared to the bottom.
199

MaxSea Professional Marine Software User Guide v10.3
Description:1 – DAP1 and DAP2 follow-up (displayed only in the 3D window).2 – 3D representation of the trawl net.3 – DAP1 and DAP2 representation in the 3D window. 4 – Ship follow-up (displayed only in the 3D window).5 – Ship grounding track and DAP1 / DAP2 grounding tracks which are displayed when the ship is "Track on" positioned, the tracks will be saved into the active fishing plan.
Thanks to this system, it is possible to work in full safety in dangerous trimmings, where it is known that the fish caught will be much better.
Dredge function
The Dredge function
MaxSea is able to receive values sent by dredge sensor relative to the different states of the dredge :
o 0 for inactive dredge,
o 1 for active dredge
o 2 for hanging dredge.
These states are displayed in the data window in the field Quality.
Features
The dredge transducer provides a 0 or 5 volt signal.
Inactive dredge
When MaxSea receives a 0 volt signal without having ever received a 5 volt one, the state automatically turns to 0 (inactive dredge).
Active dredge
When the software receives a 5 volt signal, the state turns to 1 (active dredge) and the track is on.
200

User Guide
Note: it is impossible to :
Manually stop the track
Activate the track parameters choice dialog
Use the Man overboard function.
Hanging dredge
When MaxSea does not receive anymore signal, the state turns to 2 (waiting for a new state, active or inactive) the track color turns to blue and the track save is still going on.
Then, if the signal is not received within TimeOut, MaxSea automatically turns the state to 0, the track is off.
The software stops the track save and suggests to "save as" the track in an existing file named ".SeaDRAG_AAAAMMJJ.HHh.ptf".
Note that you can modify the TimeOut (for that, see paragraph TimeOut Preferences below).
It is possible to create a new destination folder to save the dredge track in a new. PTF file. But it will be impossible to modify this file.
Then, the track is saved in an ASCII format file named "AAAAMMJJ.HHh.DRA.txt", the software suggests you to create a new destination folder for it.
Cable diagram
ground to pin 5 of the RS232 standard
output TTL 0/5 V to 8 (CTS) of the RS232 standard
Time Out preferences
To modify the "Time Out" you have to select the " Preferences tab" from the Data Input-Output dialog box.
Then, choose the appropriated value in the "Delay before stopping track " edit box.
Example:
In case the time out is defined
If you stop the dredge, then after 60s the dredge track will be stopped if you did not activated the dredge again.
Mobiles
Mobiles
Types of Mobile available in MaxSea1. ARPA target
2. AIS
3. Buoys
Display mobiles on chartsEvery mobiles are shown in real time on the Chart : displaying mobiles on chart
Mobile center
201

MaxSea Professional Marine Software User Guide v10.3
is your control center to follow all active Mobile settings : Mobile Center windows.
Mobile Propertiesgives you useful information about a Mobile : Mobile Properties windows
Displaying mobiles on chart
Mobiles are displayed on the chart windows in real time.
Mobile symbol icon
The icon use for the mobile representation depends on the type and the status of this one
We can distinguish 3 types of mobile :
1. ARPA
2. AIS
3. BUOYS
and different statuses :
1. selected or not selected
2. inside or outside the boat security circle
3. loose
Mobile type
Outside the security circleinside the security
circleMobile lost
Normal icon
Selected Icon
Normal icon
Selected Icon
ARPA
AIS
BUOYS
Note : To avoid to have too many mobiles on screen you can hide AIS mobile directly from the [Mobile] menu.
Center on active mobileYou can quickly center the chart to the active mobile position by selecting [Center ON] from the [Mobile] menu.
Note : this function does not allow to follow the mobile but only allows to center the chart on the current mobile position.
Mobile colorYou can define the Mobile color from :
Mobile label
202
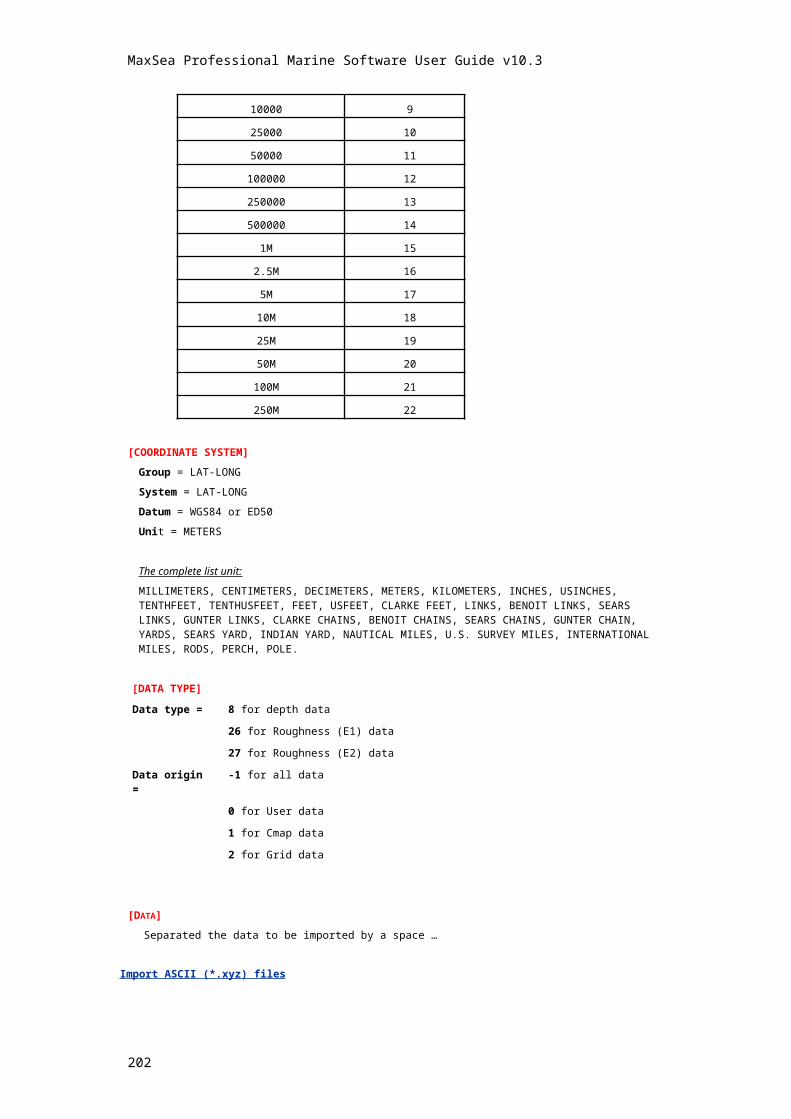
User Guide
You can display the mobile label on chart by selecting the Option [Mobile Label Displayed on Chart] from the [Mobiles] menu.
To define a type of label for a mobile target displayed on the chart go to |Utilities] menu and choose
Mobile Ground Heading vectorMobile Ground Heading Vector can be displayed on chart as shown in the following picture from
Note : Ground heading vector are displayed or hide for all mobiles including the ship in same time.
Select [Option: GPS/Track... ] from the [Utilities] menu to bring up the Mobile window.
Misc tab
Vector
1. three check boxes allow to display vectors direction of your mobile ( Ground heading, Surface heading or the drift)
2. Choose to display all vectors or one of them.
3. select in which mode you want to display vectors with a fixed length or if it moves according to the speed that you have entered.
Mobile tracking
Mobile Track activation
MaxSea displays the mobile on the chart then you can record its track in the same way as you would for your ship's track.
Manual Tracking
To activate the track on a Mobile you must :
1. select a mobile using the Select point tool or a series of mobile using the Select objet tool.
2. either RIGHT CLICK to bring up the context menu and choose the Track On
3. or go to the [Mobiles] menu and select [Track on].
The mobile track is saved in the layer "Target.ptf". If it doesn't exist yet MaxSea will create and open it.
203

MaxSea Professional Marine Software User Guide v10.3
When you leave MaxSea a dialog box appears asking you : "Do you want to save the targets tracks of this session" Yes or No.
If Yes then MaxSea will propose to save the target track file as : Targets_YYYY_MM_DD_hh_mm_ss.ptf (Targets_2003_03_28_10_40_55.ptf)
Automatic Tracking
The track can be activated automatically for each new mobile from :
Mobile Track colorThe default track color is black but as with any mobile (buoys) color can be modified according to a mobile information :
Mobile center
You can obtain more information about your set of mobile objects by displaying the Mobile center window.
The Mobile center window:Select [Mobile center] from the [Mobiles] menu.
A line corresponds to one mobile. Attributes are displayed by columns. The selected mobile appears with grey underlining. In case of hide AIS mobile appears The information [Filtered] is placed near the
table Title.
The available attributes are the following :
Type : AIS or ARPA or Ryokuseisha or ...
Name : Number (MMSI NUMBER / target number) or Name or Call Sign or ...
204

User Guide
CPA : Closest Point of Approach from boat to mobile
TCPA : Time to CPA
Rng to Tgt :
Range from boat to mobile
Brg to Tgt : Bearing from boat to mobile
S.O.G : mobile Speed Over Ground
C.O.G : mobile Course Over Ground
When available you can have more information about a mobile by displaying the corresponding [Mobile properties] windows
To sort out by attribute.Mobile center information can be sorted by attributes by double clicking on the corresponding column heading.
When double clicking again on the same column, the order is changed ( increase <=> decrease )
A symbol is placed near the name of the selected column :
decreasing sort
increasing sort
Mobile Properties
You can display the mobile properties by :
- selecting [Mobile properties ] from the [Mobiles] menu to display information about the active one.
- double clicking with the finger tool on the mobile of your choice
- double clicking on the corresponding line in the Mobile Center windows
Various information from the mobile are displayed and updated in real time. Information available depends on the type of mobile you are displaying properties.
205

MaxSea Professional Marine Software User Guide v10.3
When the Mobile properties Windows is displayed you can see properties of an other mobile displayed on a chart by a simply click with the finger tool on it. The Mobile properties Windows will then display the information requested.
Security CPA & TCPA
CPA & TCPA information
CPA and TCPA information is an available information in Mobile center and Mobile properties Windows.
Note : the Mobile Center Windows allows you to quickly sort the table using CPA or TCPA attributes.
IMPORTANTIt is a particularly powerful function for ensuring safety but, of course, considers that the two ships are traveling at constant speeds and headings.
CPA WarningYou can activate the mobile CPA Warning by selecting [CPA warning displayed on chart] from the [Mobiles]
Security circle (With ARPA Target Only)You can draw around the boat position a security circle. As soon as an ARPA Target enters this circle then its Icon changes showing that it is closer to you
To define the security circle :
1. Select [Option: GPS/Track... ] from the [Utilities] menu
2. First choose GPS mobile on which you want to apply settings.
3. Then select MISC tab to apply settings.
Misc tab / Security circle
1. check "Display" to show it on chart.2. enter a value in Size input text to define a circle distance.
206
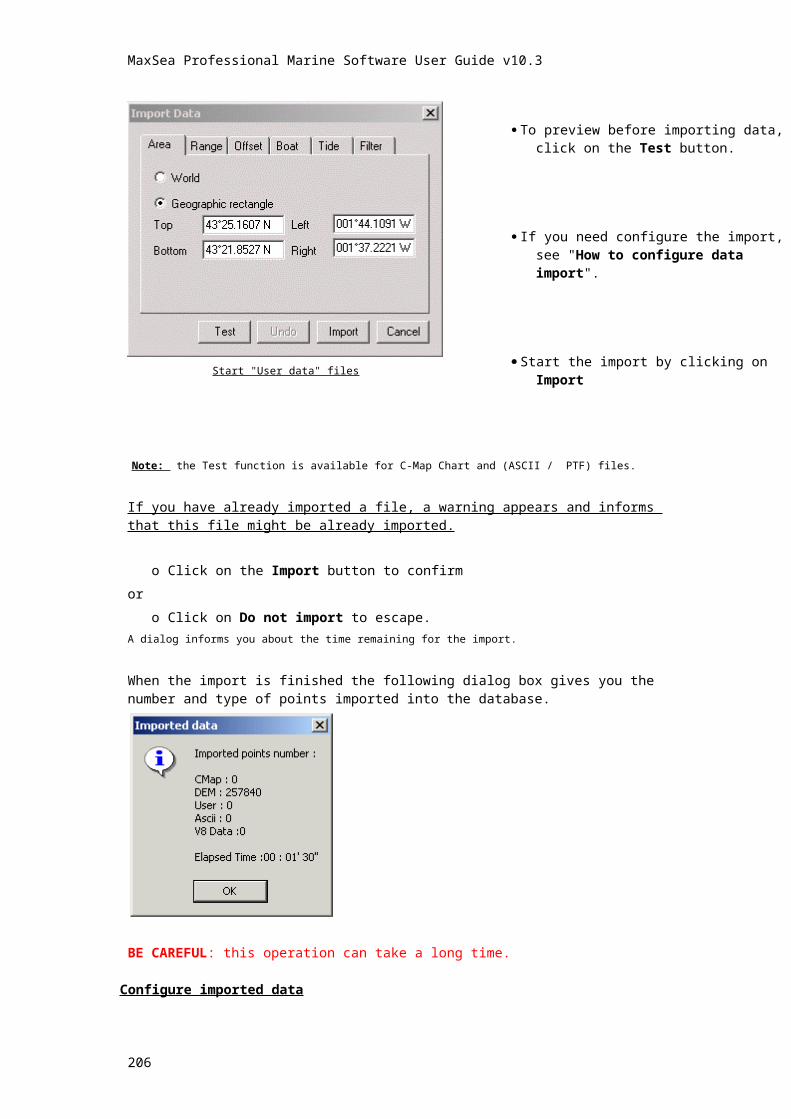
User Guide
Mobile type
Outside the security circle
inside the security circle
Normal icon
Selected Icon
Normal icon
Selected Icon
ARPA
Tracking Radar
ARPA
ARPA targets
When a target is selected on the radar, it is automatically displayed on the chart.
MaxSea displays the icons for all the targets tracked by the connected radar.
IMPORTANT the tracks of all the radar targets are recorded in the same file created by default by the software but which you can modify (see below).
Information concerning an ARPA target displayed on the chart
1. Either using the Selected point tool double click a target to display the information window for this target which shows the parameters received.
2. Or right click an ARPA target to call up the context menu and choose Mobile properties.
Related topics:
1. Mobile Properties to display the target mobile displayed on the chart.
207
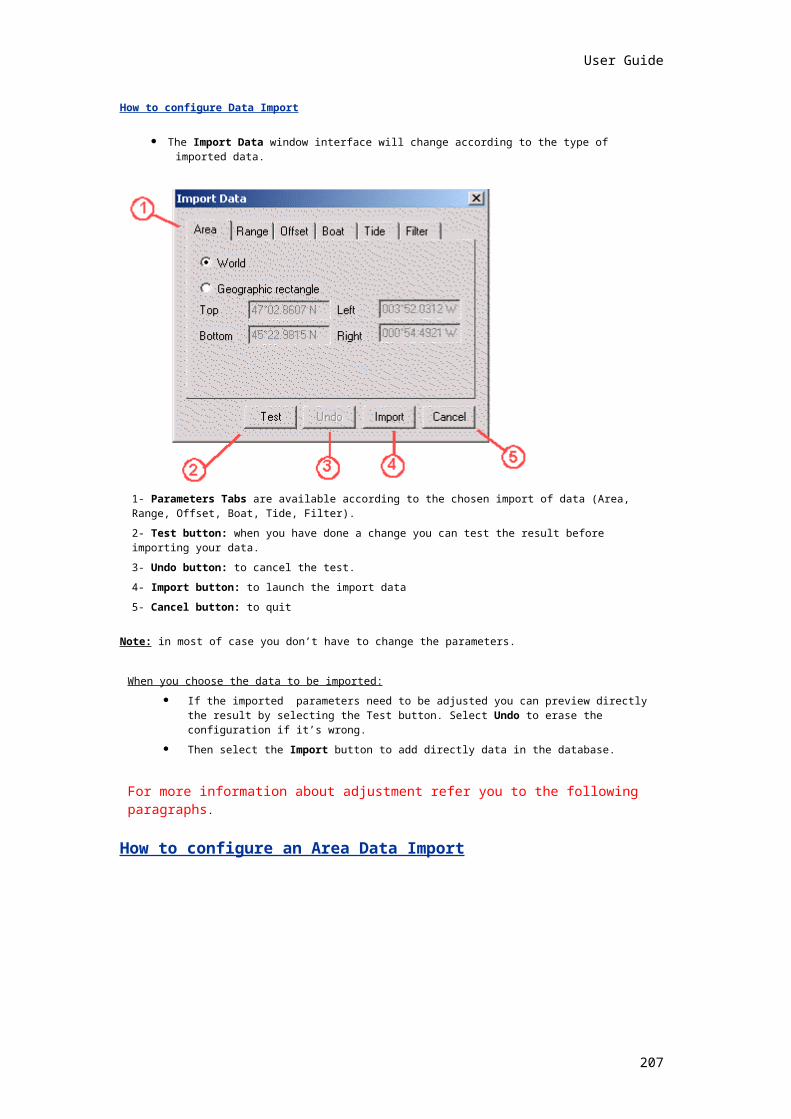
MaxSea Professional Marine Software User Guide v10.3
2. Option: Mobiles... to customize the track (display and record parameters).The Target track box is used to start and stop the display and record the target track exactly as you would for your own ship.
This dialog box allows you:
To save the target track check the Save the track box to start and un-check it to stop the display and record the target track exactly as you would for your own ship.
To modify the name of the target and add a comment.
To select a new file other than the default file on which you will record the tracks of all the targets, click on "New file" button and choose a path.
To inform you about the received target data ( date, time, headings speed and if available the sea surface temperature data)
How to configure ARPA system with MaxSea
After connecting the ARPA System, you just need to configure the corresponding serial port at the appropriate Norm.
1. Go to [Utilities] menu and select [Input Output data settings]
2. Click on the Radar tab to set the corresponding port and its norm
3. Click on Add instrument.
4. Select the port COM where the system is connected.
5. Choose the norm between Radar & ARPA ($--TTM+$--TLL+$--RSD), Kelvin Hugues HR2000 or others...
ARPA mobile displayed on the chart
ARPA targets are displayed on the chart in real time.
ARPA target symbol representation
Inside Security circle
Outside Security circle
Inside Security circle
Outside Security circle
display by default target selected target lost
To display the ARPA label on the chart go to [Mobile] menu and choose [Label mobile displayed on chart]
This label depends to your choice and if needed to change the label displayed on the chart go to [Mobiles] menu and select [Option: Mobiles...] to call up the dialog box which allows you to choose a type of label between three choices Name, Call sign + Name or Name + Sea Surface Temperature.
The Name of the mobile is the label text displayed on chart by default.
208

User Guide
ARPA mobile target 80 selected
Various information from target named 80 (SOG, heading, TCPA, etc.) are displayed and updated in real time .
Get received information from an ARPA target
1. Using the Select point tool double click on the target symbol to bring up the Mobile properties dialog box.
2. Right-click on an ARPA target to call up the context menu and choose "Mobile properties"
Tracking on an ARPA target
1. Using the Select point tool go to the [Mobiles] menu and choose [Track on].
2. Right-click on an ARPA target to call up the context menu and choose "Track on"
How to configure the Time Out
This option depends to the Radar settings
Select eventually the time limit (in seconds) for a radar target is considered as lost.
To do it, select [Data input/output settings…] from the [Utilities] menu.
Click on the Radar tab to choose the instrument for which you want to configure.
Select a port for the Radar and choose ARPA and then click on the "Advanced settings…" button.
A windows appears and allows you to adjust:
1 - Target Time Out for all targets that belong to the selected instrument.
2 - Identifying number for each instrument connected. By default this ID number is assigned. This allows to easily identify the owner displayed targets.
209
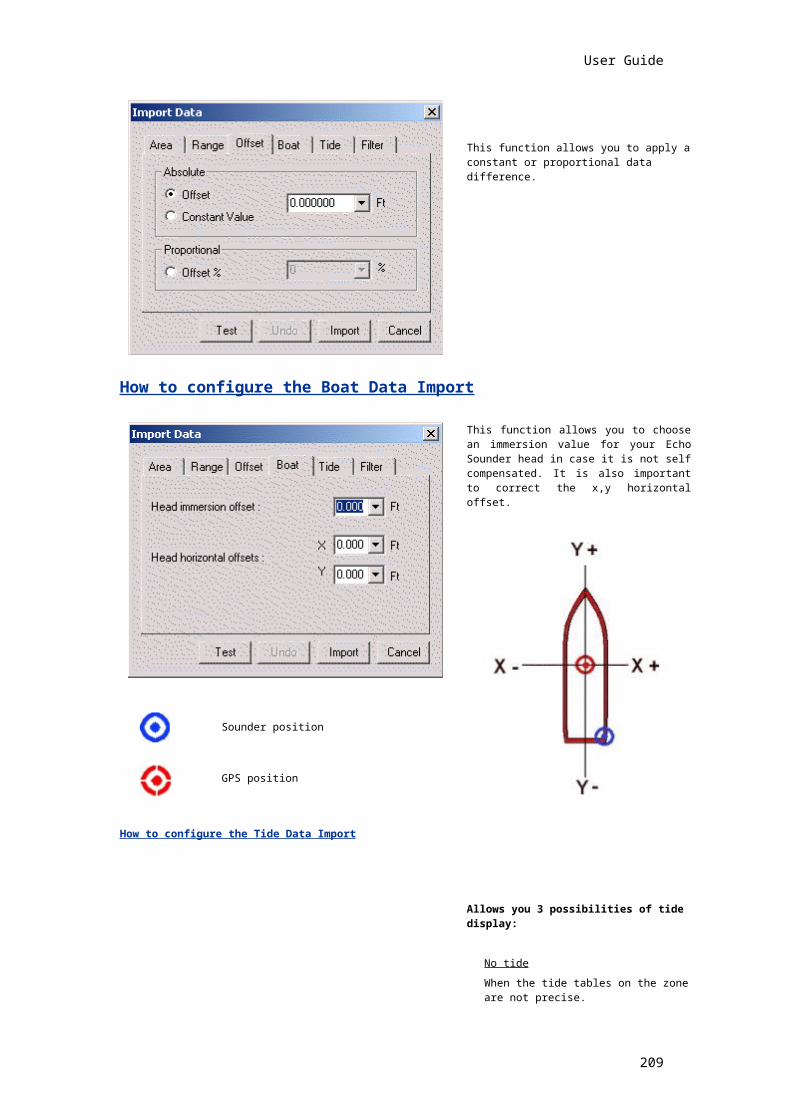
MaxSea Professional Marine Software User Guide v10.3
Note : If you choose the option "Do not use time out" , a target which once appeared since MaxSea's launch is never marked as lost.
Simulating the TCPA
1. You can activate the mobile CPA Warning by selecting [CPA warning on] from the [Mobiles].
2. Select [CPA warning displayed on chart] from the [Mobiles] menu to graphically show on the chart the positions of your ship and the target at TCPA (point on the chart where your ship and the target are located when they are the closest to one another).
Related Topic: Security CPA & TCPA
IMPORTANTIt is a particularly powerful function for ensuring safety but, of course, considers that the two ships are traveling at constant speeds and headings.
OVERLAY
Overlay Image
MaxSea can display a real time radar overlay image at any scale on the cartography.
The system used is called PC radar kit , works under Windows and is compatible with most radars.
Overlay targets
You can appoint on the radar overlay image whatever you wish to transform into a target (mobile or not) and check its track on the chart. It is a slave system, compatible with most radars of the market
The Pcradar Kit also has a tracking capacity of about 300 targets.
IMPORTANT !
To use this module, the hardware installation has to be done. To order or to obtain more information, please contact your reseller.
Opening the Radar Overlay
To open the radar overlay, click on the radar symbol upper in the chart palette.
210
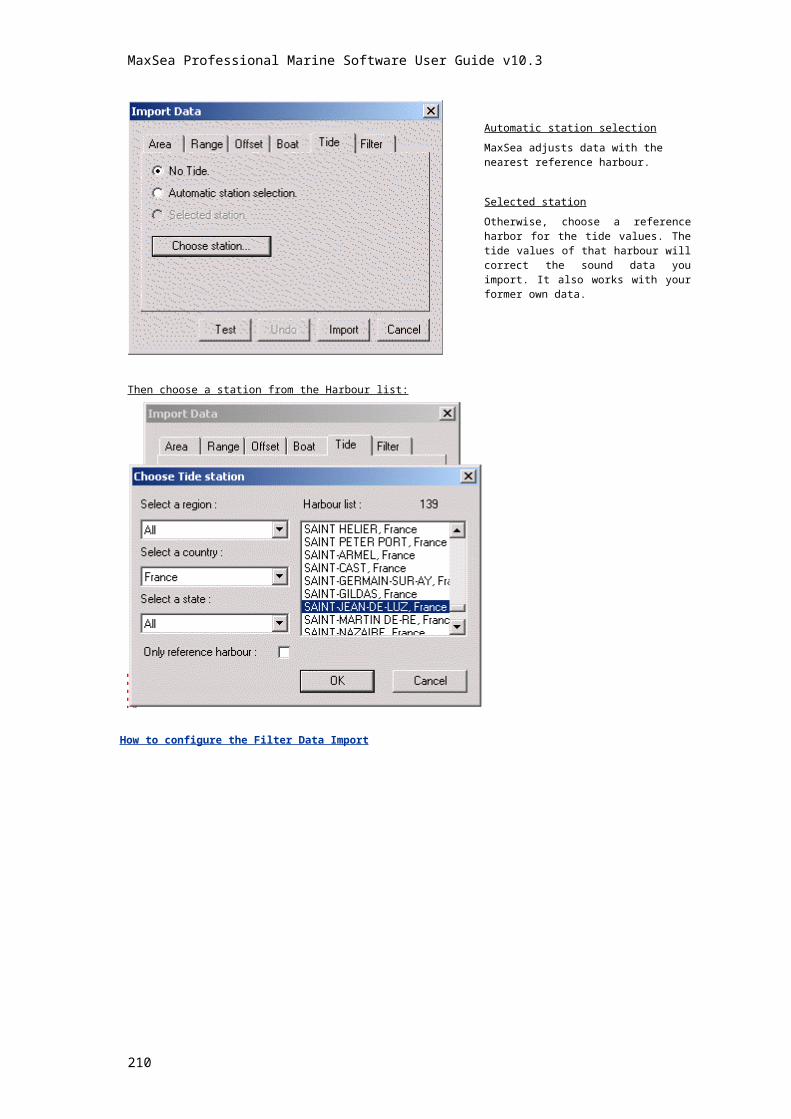
User Guide
The radar overlay is displayed on the chart:
The radar overlay can be displayed in different colors, chosen in the Radar colour pop-up menu.
Radar palette settings
Click the arrow nearest the Radar icon symbol to pull down the menu
211

MaxSea Professional Marine Software User Guide v10.3
This palette allows you to select the best display according to the weather and sea conditions.
The Gain slider to amplify the radar echo.
The Sea clutter slider }
To obtain a better image in case of bad conditions
The Rain clutter slider
The transparency slider to see the chart.
The Radar and Glow colors pop-ups allow you to change the radar overlay or its historic.
The Rings check box allows you to display or not rings in order to get yourself bearings. The interval will be chosen automatically to display 5 or 7 rings on the screen.
Note: the intensity of the color displayed varies according to the echo power.
Plotting a overlay target
To plot a target:
1. Right click any where on the chart to call up the context menu
2. Select Set a target.
212

User Guide
If the radar overlay contains a point at this place, it will be stored as a target.
Note: (1) - The item Set a target does not appear where no echo is available at this place.(2) - The display of a target can take up to 15 seconds depending on your Input/Output settings.(3) - It is not possible to plot more than 300 targets on the same radar overlay. The additional targets will not be taken into account.
To obtain information on a Overlay target
Using the Select point tool
double click a target to display the Mobile properties window for this target which shows the parameters received.
Using the context menu
1. Right click on a target to call up the context menu
2. Select "Mobile properties" to bring up the target properties window.
The Target track box is used to stop the display and record the target track exactly as you would for your own ship. If desired, you can modify the name of the target and add a comment.
To free a Overlay target
To free an Overlay radar target:
1. Select an Overlay target by clicking it with Select point tool
2. Go to the [Mobiles] menu and to choose [Release Mobile...].
Note: (1) - the target erasing can take a certain time, according to the refreshing and validating time of information.(2) - a target already free or lost by the radar can not be free (the Stop tracking button is not available).
Automatic Identify System (AIS)
AIS targets
In combination with MaxSea, the AIS technology gives you an improved surveillance system and information about nearby ship traffic.
The three main components in the Transponder are :
GPS-receiver,
VHF-transceiver,
Computer.
213
MaxSea Professional Marine Software User Guide v10.3
The GPS-receiver provides accurate position and navigation data, the computer packs this information together and broadcasts the data on a digital data link via the VHF-transceiver. All ships within VHF range equipped with an AIS transponder can receive this message, unpack it, and plot the position, vessel name (references), speed over ground, course over ground of the other ships. Every ship within VHF radio coverage may be automatically plotted.
How to configure AIS system with MaxSea
After connecting the AIS System, you just need to configure the corresponding serial port at the
"AIS Transponder" Norm.
1. Go to [Utilities] menu and select [Input Output data settings]
2. Click on the Radar tab to set the corresponding port and its norm
3. Click on Add instrument.
4. Select the port COM where the system is connected.
5. Choose the norm between AIS NMEA 183, AIS transponder or others....
AIS mobile Displayed on the chart
MaxSea displays the AIS targets on the chart and you can record the tracks, exactly as for your ship track.
AIS target symbols
display by default AIS target selected
When the AIS target is lost
Related topic : Displaying mobiles on chart
Note: each track point stores the date and the time, the position, as well as the speed and the heading of the target.
Mobile AIS, target displayed on chart
MaxSea displays automatically the AIS symbol target on the chart for all the vessels tracked by the connected AIS system.
Displaying AIS target properties
Using the Select point tool double click on a target to display the information window for this target, which shows the parameters received.
Various information from target :
Position,
speed,
214

User Guide
heading,
TCPA,
etc…are displayed and updated in real time.
Related topic: Mobile Properties
You can modify the name of the target and add a comment.
Activating The Target tracking box is used to start and stop the display and recording of the target track , exactly as explained in your own ship.
IMPORTANT The tracks of all the radar targets are recorded in the same file, created by default by the software but which you can modify .
Note: click New file to select a layer, other than the default one, on which you will record the track of all the targets.
Tracking buoys
Buoys targets
Buoys tracked on Electronic Charts
In various fisheries buoys report their position and other data back to the vessel. Some fishing buoys report via satellite, and others, such as the Australian LINEMASTER buoys communicate their own GPS position and other data directly and automatically to the vessel via radio.
MaxSea can display the positions of widely used RYOKUSEISHA, and LINEMASTER buoys directly on the chart.
The program tracks their movement over time, similarly to the way the vessel’s own track is recorded. Each track point stores the date, time, position, drift rate and temperature of the buoy. A vector shows the direction to which the buoy is heading.
Different colours can be allocated to aid identification of each buoy tracked.
The temperature is clearly displayed at the latest position.
Data received from a LineMaster buoys:
1. COG (Course Over Ground)
2. HDOP (Horizontal Dilution Of Position)
3. Latitude
4. Longitude
5. Satellite number
6. Sea surface temperature
7. SOG (Speed Over Ground)
8. Battery voltage
Data received from a Ryokuseisha buoys:
1. Latitude
2. Longitude
215

MaxSea Professional Marine Software User Guide v10.3
3. Sea surface temperature
How to configure Follow up buoys system with MaxSea
After connecting the System, you just need to configure the corresponding serial port at the corresponding Norm.
1. Go to [Utilities] menu and select [Input Output data settings]
2. Click on the Radar tab to set the corresponding port and its norm.
3. Click on Add instrument.
4. Select the port COM where the system is connected.
5. Choose the norm between LineMaster buoys, Buoys (SERPE, MLR,...), Ryokuseisha buoys or others...
Buoy targets displayed on the chart
Buoy target symbol representation displayed on chart
Different buoy representation
Buoy target displayed by default
Buoy target selected buoy target lost
Activating the track :
1. Select a Buoy target using the Select point tool.
2. either RIGHT CLICK to bring up the context menu and choose the Track On
3. or go to the [Mobile] menu and select [Track on].
Track parameters settings
You can define the Track buoy color according to the sea surface temperature :
Get received information from a buoy
1. Using the Select point tool double click on the target symbol to bring up the Mobile properties dialog box.
2. Right-click on an ARPA target to call up the context menu and choose "Mobile properties"
Get received information from a ryokuseisha buoy
At any time you can call a Ryokuseisha target to get the latest information on it:
1. Either using the select point tool click the Ryokuseisha buoy target and go to the [Mobiles] menu and choose [Call mobile...].
2. Or right-click a ryokuseisha buoy target to call up the context menu and choose "Call Mobile..."
Note: if your buoy target is not a ryokuseisha buoy the Call Mobile option is not available.
Weather
Weather module
These functions are only available if you have MaxSea’s Weather module.
216

User Guide
MaxSea provides all the features that allow you to interpret GRIB files from several sources:
MaxSea chopper : Navcenter forecast...
Navcenter web site
Navimail : Meteo France forecast...
Meteo consult
These files contain numeric data which give you various forecast information :
Wind
Pressure
Waves
Temperature
Altimeter
Geostrophic Stream
These files can be received by different means. They will be generally received on board via :
one of the Immarsat satellite systems.
Navcenter website download
from an e-mail.
In this chapter you will learn how to display weather forecasts in MaxSea and how to use weather information.
Open and display a weather file
It is assumed that you already have the GRIB file save on your hard disk or opened directly from an e-mail
Using weather button
The weather button is used to show or hide the last opened weather file.
If you don't open GRIB file before when you click the weather button
1. A browse window is opened
2. Select the folder where the GRIB file is saved
3. Select the desired weather forecast from the file list and click Open.
Now each time you click on the weather button, this weather data will be displayed or hidden even if the weather file is closed. If you want to change the displayed file you have to open a new weather file.
Different types of information (wind, swell, pressure, etc.) can be contained in this file. The software displays immediately on the chart the forecast for the present date, if the present date is included in the interval covered by the forecasts. If it is not the case, the time is set to the last forecast date. You can also change the display sate : Change display date chapter.
Note:(1) you can only open one weather forecast file at a time.(2) by default the wind is displayed in the form of vectors with barbs, the swell in the form of vectors characteristic of direction and height, pressure in the form of isolines and water
217

MaxSea Professional Marine Software User Guide v10.3
temperatures in the forms of areas. See Weather data display preferences paragraph to change a display.
How to open a new weather file.
1. Select [Open weather file] from the [Weather] menu .
2. A browse window is opened.
3. Select the folder in which you wish save the GRIB file.
4. Then choose among the file list the required weather forecast file and click Open.
Weather file from e-mail
You just receive Weather information from an e-mail (using MaxSea chopper,Navimail...).
Double click directly on attached file which you have received in your e-mail.
A dialog box appears and gives you two choices
1. open the file
2. save it to your computer
Click on "Open..." to launch it directly in MaxSea.
CAUTION! in this case files are saved in temporary internet file folder and cannot be opened again directly using the file open procedure. It become the default weather file until the next download.
or
Click on "Save..."
and select the destination folder. The file is then saved in the selected folder and ready to be opened and displayed on a chart. (See chapter "Weather file save on hard disk" .)
Weather file save on hard disk
Weather file can be saved on your hard disk :
After a download operation (via Navcenter)
from an e-mail attached file save on the hard disk (via MaxSea chopper, via Navimail,...l)
after a copy from an external support (diskette)
...
Weather file extension
To be opened by MaxSea Weather file you have should have .GRB or .bz2 extension
GRB : is the extension for GRIB file format
bz2 : Bzip2 compressed file extension. this type of file is automatically decompressed by MaxSea during the opening.
Note : 1 - If the extension is not the good one or missing then MaxSea cannot see and open the file. 2 - If the file is compressed (Zip,Rar,...) then you have to use the corresponding program (Winzip,Winrar,...) to extract the GRIB file.
218

User Guide
Weather data palette
MaxSea allows you to easily show or hide data contained in the weather file.
You will see in this chapter :
weather layer palette displayed mode
available weather layer data
show hide weather layer
Weather layer palette displayed mode.
The palette can be displayed in three modes :
pop up menu under the weather button (default mode)
Weather palette displayed as floating palette
Weather palette docked to the chart palette.
Available weather layer data.
Using the weather data palette you could see weather layer available in the opened GRIB file.
- Wind layer
219

MaxSea Professional Marine Software User Guide v10.3
- Waves layer
- Pressure layer
- 500mb Pressure layer
- Sea surface temperature layer
- Altimetry layer
- Current layer
When a data is not available the corresponding icon is drawn in grey.
- Available
in this example only Wind and Pressure data information are available in the opened weather file.- Available & Not
Display
- Not available
- Not available
- Available & not Display
- Not available
- Not available
IMPORTANT
if all the icons are grey this means that:
either there is no weather file displayed on the chart
or no weather file is opened.
Click the Weather button to display (or open if needed) the weather file information.
Show/Hide weather layer
To show or hide one of the available layer just have to click on the corresponding icon.
When a layer is displayed on chart the corresponding icon is displayed with blue border.
220

User Guide
wind layer is hide
wind layer is displayed on chart.
Note: functions previously describe are available from the Weather layers item from the weather menu.
Symbol use for the display of each type of data can be modified.
Related topic:
Option: weather
Weather display options
They are many ways you can display weather (GRIB) data. MaxSea allows several display options:
Available data in a GRIB file depend on your order selection.
A weather file can contain up to five types of data:
Wind,
Waves,
Current,
Altimetry,
Sea surface temperature,
Pressure,
500 Mb pressure.
All available data is displayed by default in a specific mode (see Available display mode table below) but you can show or hide certain types using the Weather data palette.
Available display mode
Each data type can be displayed in different display modes :
Line : Isolines mode Colors : Surfacing mode
221

MaxSea Professional Marine Software User Guide v10.3
Bubbles : Text in bubble mode Arrows : Vector mode
Wind feather : For wind information only
Several modes shown at the same time
Notes : (1) A color legend is displayed when needed.(2) Each data can be represented in several modes in a same time.
Weather options.
Go to the [Weather] menu, select [Option: weather... ] to call up the dialog box which allows you to customize each weather data display
Related topic:
222

User Guide
Option: weather
Option: Weather
To customize the weather data display, select [Option: weather... ] from the [Weather] menu.
This brings up a dialog box which consists in seven parts.
Each part of this dialog box allows to customize the display according to each type of weather data.
Click in the corresponding check box situated nearest each representation mode to customize the weather display according to a type of weather data.
Available display mode table
Mode Data Line
(Isolines)
Colors
(Surfacing)
Bubbles
(Text)
Arrows
(Vectors)
Wind feath
er
WindAvailable
green color line
Available Available No Default
Wave
Available only for the
Wave height
blue color line
Default (height)
Available
(period)Default No
CurrentAvailable
brown color line
Available Available Default No
Sea Surface Temperature
Default
pink color line
Available Available No No
Altimetry No Default Available No No
500 mb Pressure
(Geopotential Height)
Default
purple color line
Available Available No No
PressureDefault
grey color line
Available Available No No
Note: (1) - display mode can be defined even if the data is not available. (2) - only one color representation is displayed on the chart at the same time.
223

MaxSea Professional Marine Software User Guide v10.3
Display Strength and direction of weather data
With using the Finger tool left-click on a point from the chart (in the weather file zone) and maintain the left mouse button down to display strength (speed) and direction of weather data available in your weather file ( other parameters such as well, pressure, temperature, etc.) at the point clicked.
Note: (1) the software interpolates in space and time the file values. (2) if several chart windows are opened, use the weather button to show or hide the current weather file for each window.
Change the display date
Chart time display
The time/date, Chart time, is displayed in the tools bar. This "Chart time" is by default the current time and date.
Weather files are displayed on the chart according to this Chart time.
To view displayed information (Wind, pressure...) at a different time/date, click the Chart time box to call up the selection pop-up menu.
From this pop-up menu you can then select :
Current time To display current weather information.
Select Date/Time ... To enter a date and time via a dialog box.
Date list To select a date available in the opened forecast files.
- the symbol is placed before the actual date
- the selected date appears in a blue rectangle
224

User Guide
Arrows To display the previous or next weather forecast
After selecting one of these times, the display of the chart is automatically updated according to the time chosen.
Note: Chart Time is associated with a chart window. It is therefore possible to display on the same weather file at different dates on several chart windows.
Current time display
If the display date is not the current one then the chart time appears in a red rectangle.
current time old or future time
Making movies
MaxSea is able to prepare a movie of weather changes. To do this, MaxSea generates a film recorded on the hard disk which can be played back (continually or frame by frame).
Note: if a route is selected when the movie is created, a ship icon follows this route in parallel with changes in the weather. This tool is particularly powerful as it correlates your route forecasts with changes in the weather.
To create the movie, prepare the window chart as you want it to appear (window size, scale , zone, etc.).
Then select [Create movie] from the [Edit] menu.
IMPORTANT The generation of many images requires sufficient free space on the hard disk. The size of the chart window used when the movies is created (active window) greatly influences the necessary disk space. You are strongly advised to reduce the size of the window before generating the film. A window covering half the screen is generally sufficient.
The dialog displayed can be used to choose the parameters for the creation of the film.
Define the interval between each image by selecting: Day number (00d). Hour number (01h). Minute number (00mn). Second number (00s).
225

MaxSea Professional Marine Software User Guide v10.3
Note : 1 hour is the movie sequence value defined by default.
Then click on OK, the saving dialog box can be used to specify the name of the film that you are going to generate.
After clicking Save, a dialog box appears and allows to choose either a movie compression format or not.
1. Uncompressed format is selected click on OK to generate the movie.
2. In case you have selected a compression format, you can adjust the compression quality or/and configure the video display.
The software automatically generates the film in "My document" folder, easier to find the movie later for playing.
Note: the creation of the film generally requires several minutes.
To play the movie you have to open it by clicking twice on the file movie (*.AVI) from "My documents" folder , the Movie reader window is active
(See Open a movie chapter).
Open a movie
To play the movie you have to open it by clicking twice on the file movie (*.AVI) from "My documents" folder , the Movie reader window is active.
to play or stop the movie click on the picture below
Note: Date and time are displayed in the right lower corner of the window movie.
Playing and controlling movies is easy. Simply double-left-click on the movie file to open the movie window (this will be done except the software).
From the movie player left-click on one of each button:
To do this :
PLAY play the movie in a continuous loop
PAUSEif you want to pause the movie at any point. Resume play with the Play button.
STOP stop the movie at any point.
Play the movie as often as you wish to get a feel for the rhythm of the weather. After the movie has been paused, you can control it by dragging the "Seek bar" left or right to study the weather more carefully (forward and back in the weather forecast file).
Close the forecast file
Select [Close] from the [File] menu.
226

User Guide
Select the weather file, then click on Close.
The weather forecast is removed from the chart.
Via MaxSea Chopper
MaxSea Chopper
Note: MaxSea Chopper is installed at the same time as your software.
MaxSea chopper functions are only available if you have MaxSea’s Weather module.
You can reach this program directly from the software without having to leave it under the software [Weather] menu select [Chopper: Navcenter forecast].
IMPORTANT the first time you are using a new address E-mail to access to one of the MaxSea Chopper services, click on the button "To Register" upper hand of MaxSea chopper window.
(see Register to MaxSea Chopper chapter)
MaxSea chopper allows you to send by email a request to the Navcenter weather file server. Navcenter will return requested information using personal email address (if the address you are using is registered)
227

MaxSea Professional Marine Software User Guide v10.3
THIS SERVICE IS ENTIRELY FREE FOR THE MAXSEA USERS!
How to send a request? select the [Weather] menu of the software.
select : MaxSea chopper : Navcenter forecast...
select the model you want to use (see MaxSea Chopper weather forecast models chapter)
IMPORTANT available Area, Parameters and Forecast can be different from a model to an other one
Simply left-click and hold the button down to draw a rectangle around the area you want to select (the size of the area is entirely up to you)
Select Parameters: Wind, Pressure ... Choose a time interval for the weather Forecasts : 00h 12h 24h ... Select File Compression : No compression, Zip, MaxSea compression Then select a course (and/or) a speed value, in this case MaxSea will
automatically centered the display according to the weather forecast and the defined position.
At least click on the button to receive the selected forecast file.
The MaxSea Chopper is compatible with any email service which authorizes attached files to be received.
A few minutes after sending your email request from the MaxSea Chopper, your MaxSea weather forecast file will be received in your personal email box. You then upload this information into MaxSea for a comprehensive weather forecast.
MaxSea Chopper weather forecast models
The MaxSea Chopper offers easy selection of any area around the world by specifying the data you want to receive (wind, waves, sea temperature, etc.) you control file size.
You simply select an area from a map at "MaxSea Chopper" (the size of the area is entirely up to you), then enter the parameters you require, for example wind strength and direction. Finally, specify the time scale for your forecast. It works with any system of communication.
Note: parameters number and time forecasts depend of the model you have selected.
228

User Guide
In case you have chosen:
The worldwide GFS MaxSea chopper model ( meridian or antemeridian view) allows you a choice of :
1. (and/or) Wind data parameters according to the GFS model
2. (and/or) Pressure data parameters according to the GFS model
3. (and/or) Geopotential Height (500mb) data parameters according to the GFS model
The Oceanic Experimental MaxSea chopper model (meridian or antemeridian view) this allows you a choice of:
1. (and/or) Wind data parameters according to the NWW3 model
2. (and/or) Surface Pressure data parameters according to the GFS model
3. (and/or) Waves data parameters according to the NWW3 model
4. (and/or) Sea Surface Temperature data parameters according to the NLOM model
5. (and/or) Altimeter data parameters according to the NLOM model
6. (and/or) Geostrophic Stream data parameters according to the NLOM model
7. (and/or) Geopotential Height (500mb) according to the GFS model
229

MaxSea Professional Marine Software User Guide v10.3
The High Resolution East USA coast MaxSea chopper model allows you a choice of :
1. (and/or) Wind data parameters according to the WNA model for the East USA coast
2. (and/or) Waves data parameters according to the WNA model for the East USA coast
The High Resolution West USA coast MaxSea chopper model allows you a choice of :
1. (and/or) Wind data parameters according to the ENP model for the West USA coast
2. (and/or) Waves data parameters according to the ENP model for the West USA coast
The High Resolution Alaska & pacific NW MaxSea chopper model allows you a choice between :
1. (and/or) Wind data parameters according to the AKW model
2. (and/or) Waves data parameters according to the AKW model
230

User Guide
The Gulf Stream Wind & Current MaxSea chopper model allows you a choice between :
1. (and/or) Wind data parameters according to the WNA model
2. (and/or) Waves data parameters according to the WNA model
3. (and/or) Surface stream data parameters according to the COFS model
4. (and/or) Sea surface temperature data parameters according to the COFS model
Models
GFS is a global model type with a full coverage and a resolution equal to (2.5° X 2.5°)
00 h to 180 h for the minimum time forecast (by step of 3 hours)
192 h to 384 h for the maximum time forecast ( by step of 12 hours ).
First download : 4h00 GMT
Available from: 4h45 GMT
Downloaded frequency every 6 hours
NWW3 is a global model type with a coverage equal to 77°S to 77° N (0° - 360°) and a resolution equal to (1.25° X 1°)
00 h to 138 h for the time forecast (by step of 3 hours)
First download : 6h00 GMT
Available from: 7h00 GMT
Downloaded frequency each day
AKW (Alaskan Water) is a regional model type with a coverage equal to (160° E - 123°W) and a resolution equal to (0.5° X 0.25°).
00 h to 138 h (for the time forecast (by step of 3 hours)
First download : 6h00 GMT
Available from: 7h00 GMT
Downloaded frequency each day.
WNA (Western North Atlantic - East USA coast) is a regional model type with a coverage equal to 0° to 50° N (98° - 30°W) and a resolution equal to (0.25° X 0.25°).
00 h to 138 h (for the time forecast (by step of 3 hours)
First download : 6h00 GMT
Available from: 7h00 GMT
231
MaxSea Professional Marine Software User Guide v10.3
Downloaded frequency each day.
ENP (Eastern North Pacific - East USA coast) is a regional model type with a coverage equal to 5° to 60.25° N (170° - 77.5°W) and a resolution equal to (0.25° X 0.25°).
00 h to 138 h (for the time forecast (by step of 3 hours)
First download : 6h00 GMT
Available from: 7h00 GMT
Downloaded frequency each day.
NLOM (Western North Atlantic - East USA coast) is a regional model type with a coverage equal to 55° S - 65° N (0° - 360°) and a resolution equal to (0.06° X 0.08°).
one forecast each day.
First download : 6h00 GMT
Available from: 7h30 GMT
Downloaded frequency each day.
COFS is a regional model type with a coverage equal to 55° S - 65° N (0° - 360°) and a resolution equal to (0.06° X 0.08°).
3 forecasts: 00H, 24H and 48H.
First download : 8h00 GMT
Available from: 9h00 GMT
Downloaded frequency each day at 12H00 GMT.
Register to MaxSea Chopper
If it's the first use of your address Email for MaxSea Chopper, please you have to register it from our web site.
Simply click on register button from MaxSea chopper software.
An intermediate screen allows you:
To reach the registration form which you have to carefully complete :
o Name, First Name, Address, Zip Code, City, State,
o Email: Your Email address must be valid if you want to use MaxSea chopper services
o License and Dongle (optional)
Note: All your e-mails addresses of use must be recorded.
To choice which service you need :
o MaxSea User Registration
232

User Guide
o Subscribe to Navcenter Chopper
o Subscribe to News Letters
To receive Select Subscribe to Navcenter Chopper
Via Navcenter
Download a forecast file from the WEB
You can download forecast files from "http://Navcenter.com" web site, without having to leave MaxSea.
The window of the site is divided into two parts, using the left part, you can access to all Navcenter web site services.
Weather data download :
Click on "Download" in the left window frame.
If it is a first use you have to complete carefully the NavCenter Weather Center Subscription Form .
A new page gives you the possibility to check one or several weather files areas.
Click on a file link among the list.
Then, follow the usual download procedure until you obtain the dialog which ask you if you want to open or save the file :
Click on "Open..." if you want to open directly the file in MaxSea.
IMPORTANT in this case files are saved in temporary internet file folder and cannot be opened again directly using the file open procedure. It become the default weather file until the next download.
or
Click on "Save..." and select the destination folder. The file is then saved in the selected folder and ready to be opened and displayed on a chart.
Via Navimail
Navimail
The NAVIMAIL program is automatically installed in the MaxSea folder in the same time of the MaxSea program.
It is directly accessible in MaxSea from the weather menu.
Prerequire
Possess an e-mail and install MaxSea on your PC.
Products
This application allows you, wherever you are on the globe, to order easily different type of data (wind, pressure, waves, surface temperature). The numerical files are delivered through GRIB format and require a MAXSEA to be used.
Security bulletins and satellite images concerning your zone of navigation are available free of charge (except telecommunication cost).
233

MaxSea Professional Marine Software User Guide v10.3
Operation
Orders and deliveries work through e-mail via your telecommunication system, answers being attached files.
In order to receive numerical files, you must subscribe for an account in points at METEO-FRANCE on our internet site http://meteopro.cvf.fr However, if you possess such an address [email protected], you directly access to the Navimail service; the orders will be reported to your telecom bill.
Help NAVIMAIL help on line
You can find all information you need to use it from the [ ? ] tab of Navimail by clicking on the Help button
Navimail is a service of Meteo France
Tides
Tidal data
You can access the basic tidal data in two ways. The first is to go to [Utilities] on the menu bar and then select [Tides & Current]. this will bring up the "Tides & Current" window which gives information of the display on the nearest tide station to your present location.
You can also have Tides gauges displayed on chart for each location. To access this data
click on the "Tides" icon on the layers toolbar. The Tides icon becomes selected and this brings up the tide gauges on the chart as it is shown below.
234

User Guide
The tide function can be used to display the tide for the main ports of the world.
The tide display vary from the chart scale :
From scale 1: 250 M to 1: 2.5 M, tide and current station is represented by fixed shape symbols:
From scale 1: 1 M to 1: 500 000, only reference station is shown:
From scale 1: 250 000 to 1: 500, both reference and secondary station is shown:
.Note: every tide gauges comes along with a label indicating the height of the tide. The unit is which one you have chosen in the software. Refer to related topic "Option:units" to change unit.
Show and hide the tide gauges
Show and hide tide gauges on the chart in the same manner as the weather and tidal currents file data.
Simply left-click on the Tidal currents icon
235

MaxSea Professional Marine Software User Guide v10.3
Tide gauges is displayed on the chart.
Note : the reference stations is displayed in double width pen style, whereas the secondary stations is displayed in single width pen style.
Three different tide gauges symbol represent the three possible tide states:
Rising
Falling
Slack
Changing time
Once the tide gauges display is on, you can change the date and the time of the tide gauge by left-clicking on the change date and time symbols on the layers toolbar.
1 - Changing time of the tide gauges displayed beginning with the current date
The default mode is the "Current time". In this mode, the tidal gauges are updated automatically each minute according to the computer clock.
To move the time of the tide display by one hour increments, left-click on the decreased (-1h) or increased (+1h) button. The Clock becomes selected and the time display beside the clock is updated.
236

User Guide
Left-click on the arrow beside the "-1h" or "+1h" icon to pull down a menu from which you can choose different values for the display increment (-/+1h or -/+2h or -/+3h or -/+6h or -/+12h or -/+24h).
Note: to change between the "Current time" and " Select Date/time", the Clock icon in the layer tools
bar becomes selected when the second option is chosen .
2 - Changing time of the tide gauges displayed beginning with a chosen date
Left-click on the clock from the Layers tools bar and choose Select Date/Time to open a specific window.
The Clock becomes selected as shown above
Check a date from the calendar and the date & time display beside the clock is automatically updated.
To change the time of the tide display you can choose one hour increments, by clicking on the decreased (-1h) or increased (+1h) symbol. The Clock becomes selected and the time display beside the clock is updated.
Click on the arrow beside the "-1h" or "+1h" icon to pull down a menu from which you can choose time display increment. (-/+1h or -/+2h or -/+3h or -/+6h or -/+12h or -/+24h).
Note that while the tide gauges respond to the change time, the tide/current display stays with the present time for the closest tide gauge.
Information on a drawing tide gauge
Once the tide data display is on, you can use the finger tool to check any tide gauge for data on it.
Simple left-click on any tide gauge and maintain the mouse button down to bring up a screen tip which shows specific data :
Height and type of tide
Name location
Double left-click on any tide gauge to bring up the tides graph:
237

MaxSea Professional Marine Software User Guide v10.3
From the top of the window the name location, geographical location and the station identification number are displayed.The height tide data information during 24 hours for each hour are indicated in the Tide table on right of the window and the same information are reported on a graph. By default the present tide gauge data appears selected in the table and a red line drawing on the graph indicated its position.
Bring up the Tide & Current window to obtain more information about the tide and current values, and the GMT time with the nearest reference harbour refer to related topic Tide & Current Window . When you choose to display this window, it permanently appears in the chart window.
Making & opening movies
You can make time-lapse movies of weather and tidal current stream under the software from the selected chart window. This movie includes chart current arrows.
To make a movie file under the software, first choose the Tidal current time at which you wish the movie to begin.
Next, from the [Edit] menu, select [Create a movie] and choose the time between each image.
o Day number (00d)
o Hour number (01h)
o Minute number (00mn)
o Second number (00s)Note: one hour is the interval of time between two sequences of animation.
CAUTIONGeneration of many image sequences requires enough free space on the hard disk. It is strongly advised to reduce the size of the window chart before generating movies.
Then, select the folder and the file name for which you want to save the movie as (easier to find later for playing).
Finally, select a type of compression format and click on OK (uncompressed format is selected by default). If you have chosen a compression format, you can adjust the quality or/and customize the video display.
238

User Guide
The software automatically makes a movie ( in the "My documents" folder by default. This movie is defined on a period of 24 hour period, date and time are displayed in the right lower corner of the window movie.
Playing and controlling movies is easy. To play the movie, go to Windows Explorer and click on the Movie file (*.AVI).
Click twice on the movie file to open the movie window (this will be done except the software).
From the movie player left-click on one of each button:
To do this :
PLAY play the movie in a continuous loop
PAUSEif you want to pause the movie at any point. Resume play with the Play button.
STOP stop the movie at any point.
Play the movie as often as you wish to get a feel for the rhythm of the tidal currents moving. After the movie has been paused, you can control it by dragging the "Seek bar" left or right to study the movement more carefully (forward and back in the file).
Tidal currents
Tidal currents data
This module allows the tidal current display for a current chart zone for which you have already access rights.
Before the first use, you have to enter your personal code:
For that, select [User Permits configuration] from the [File] menu.
Then, choose Tidal Stream under the Type pop-up as it is shown below.
1. Enter your code in the "New permit" text area.
239
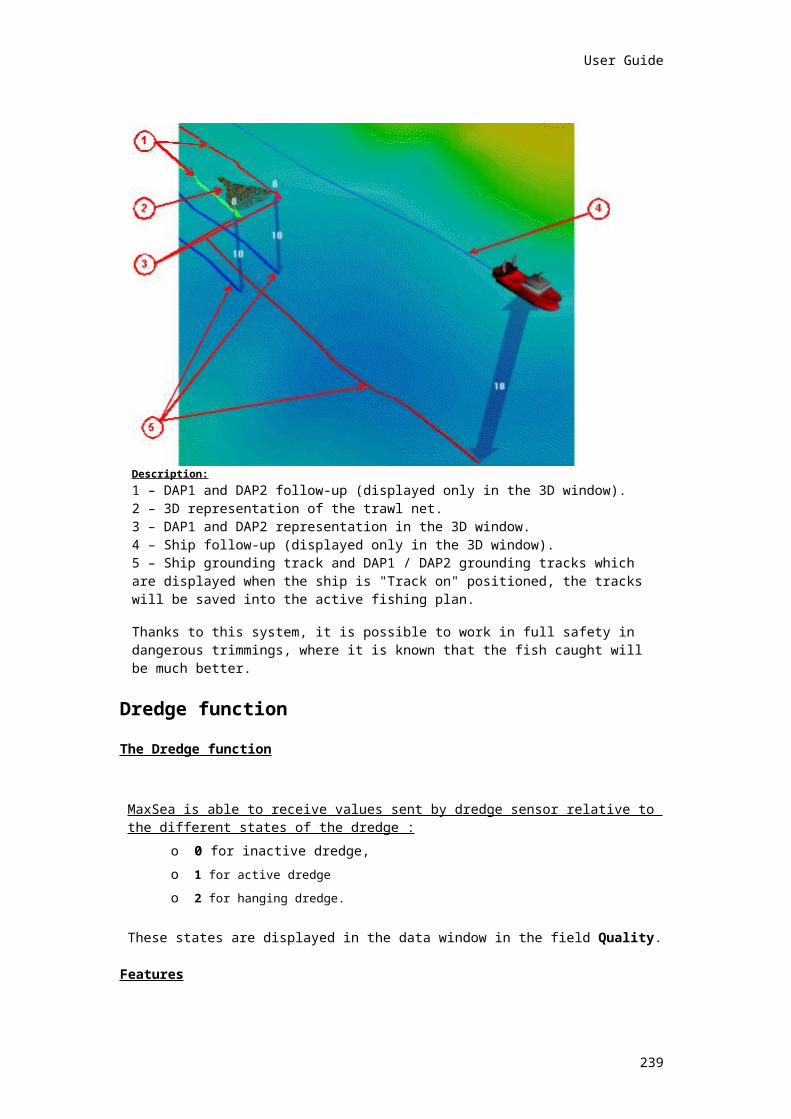
MaxSea Professional Marine Software User Guide v10.3
2. Your personal code will appear on the right window frame in top of the list .
3. Now you are ready to display tidal current data in the software.
Show/Hide tidal currents data
Show and hide tidal currents data in the same manner as the weather and tides file data.
Simply left-click on the Tidal currents icon located in the layer tools bar. This will display yellow rectangles outlined on chart that show the presence of tidal currents data (for high scales) . To bring up tidal current arrows right-click on one of yellow rectangle outlined and choose a scale under the menu. For lower scales, currents are represented by arrows.
Tidal currents legend :
Yellow rectangles outlined on chart display the location of Tidal current data.
Arrows become yellow squares for values less than 0.1 knots, we are between ebb and flow, the current direction may change rapidly.
240

User Guide
0.1 knot > 3.0 knots
Information on a drawing tidal current arrow
Once the tidal current data display is on, you can use the finger tool to check any current arrow for data on it.
Simple left-click on any current arrow and maintain the mouse button down to bring up a screen tip which shows specific data :
Speed (strength)
Direction
Location
Data source name
Double left-click on any current arrow to bring up the tidal currents graph:
Upper left part of the window is reserved for information concerning the selected harbour (name,identification number of the station and its position with according to geographic position (latitude, longitude).
The tidal current data information (Strength and direction of the tidal current) during 24 hours for each hour are indicated in the Current table on right-hand of the window and same information are reported on a graph. By default the present tidal current data appears selected in the table and it is indicated with a red line on the graph.
241

MaxSea Professional Marine Software User Guide v10.3
Bring up the Tide & Current window to obtain more information about the tide and current values, and the GMT time with the nearest reference harbour refer to related topic Tide & Current Window . When you choose to display this window, it permanently appears in the chart window.
Changing time
Once the tidal current display is on, you can choose between two ways to change the tidal current display time:
1 - Changing time of the tidal current display beginning from the current time
The default mode is the "Current time". In this mode, the Current arrows are updated automatically each minute according to the computer clock.
Note: to make the difference between the "Current time" mode and the " Select Date/time", the Clock icon in the layer tools bar becomes selected when the second option is chosen
.
To move the time tidal current data display by step of one hour simple left-click on one of each decreased (-1h) or increased (+1h) button. At this moment the Clock becomes selected and the time display beside the clock is updated.
Left-click on the arrow beside one of each "-1h" or "+1h" icon to pull down a menu from which you can choose different step values of the changing time display (-/+1h or -/+2h or -/+3h or -/+6h or -/+12h or -/+24h).
2 - Changing time of the tidal current display beginning from a chosen date
Left-click on the clock from the Layers tools bar and choose Select Date/Time to open a specific window.
Then check a date from the calendar. Then to change the time of the tidal current display select the step value between two choices. Select a step of one hour, by simple left-clicking on one of each decreased (-1h) or increased (+1h) symbol.
Left-click on the arrow beside one of each "-1h" or "+1h" icon to pull down a menu from which you can choose different step value of the changing time display (-/+1h or -/+2h or -/+3h or -/+6h or -/+12h or -/+24h).
At this moment the Clock becomes selected and the time display beside the clock is updated.
Note for example:you have chosen date value "January the 22 at 13:54:59" and time value (+6h). The next two layer tidal current data display are projected six and twelve hours forward from the current data (just to the left 13:54:59)
242

User Guide
Making & opening movies
You can make time-lapse movies of Tidal current stream under the software from the selected chart window. This movie includes chart current arrows.
To make a movie file under the software, first choose the Tidal current time at which you wish the movie to begin.
Next, from the [Edit] menu, select [Create a movie] and choose the time between each image.
o Day number (00d)
o Hour number (01h)
o Minute number (00mn)
o Second number (00s)Note: one hour is the interval of time between two sequences of animation.
CAUTIONGeneration of many image sequences requires enough free space on the hard disk. It is strongly advised to reduce the size of the window chart before generating movies.
Then, select the folder and the file name for which you want to save the movie as (easier to find later for playing).
Finally, select a type of compression format and click on OK (uncompressed format is selected by default). If you have chosen a compression format, you can adjust the quality or/and customize the video display.
Then the software automatically makes a movie ( in "My document" folder by default. This movie is defined on a period of 24 hour period, date and time are displayed in the right lower corner of the window movie.
Playing and controlling movies is easy. Simply click twice on the movie file to open the movie window (this will be done except the software).
From the movie player left-click on one of each button:
To do this :
PLAY play the movie in a continuous loop
PAUSEif you want to pause the movie at any point. Resume play with the Play button.
STOP stop the movie at any point.
Play the movie as often as you wish to get a feel for the rhythm of the tidal currents moving. After the movie has been paused, you can control it by dragging the "Seek bar" left or right to study the movement more carefully (forward and back in the file).
Logbook
Navigation logbook
These functions are only available if you have the Navigation logbook module. They are located under the Logbook menu.
243

MaxSea Professional Marine Software User Guide v10.3
MaxSea automatically creates a navigation logbook similar to the one normally hand-written by the navigator himself.
To do this the software generates logbook entries at regular time intervals (to be determined by the user).
Moreover, you can specify a further criteria so that an additional entry may be made automatically in the logbook (when the ship’s course is modified by more than 15°, for example).
Lastly, it is also possible to manually generate a logbook entry by using the Event function.
When a logbook entry is made the software saves all known information for that point in the ship’s route (date, position, route, speed, weather information, etc.).
There are two types of logbook:
The current logbook, where all events relevant to navigating the vessel are automatically stored. Only one of these exists.
Archived logbooks which have been previously saved onto disk in "My Documents" folder as "LogBook.mdb".
This file is saved in Microsoft ® Access 97 format with out password.
Displaying the logbook on the chart
At first launch of MaxSea a logbook is automatically created.
Select [Logbook Displayed On Charts] from the [Logbook] to display the current logbook, as well as any archived logbooks which have been opened, on the chart; a marker will be shown against [Logbook Displayed On Charts] under the [Logbook] menu Related topic:Displaying the logbook window
Note: before displaying an archived logbook select the opening archived logbook. (See the paragraph "Opening archived Logbook ")
They are drawn on the chart:
In dark green 1 (thick track on the chart) for the active logbook
In light green 2 (thin track on the chart) for an archived logbook.
244

User Guide
Re-select [Logbook Displayed On charts] to erase the current logbook.
To erase an archived logbook select [Close Logbook file].
Displaying the logbook center
Display the logbook on the chart by selecting [Trip Logbook Center] from the [Logbook] menu.
Two manners to display a logbook window:
Display the Active Logbook information
Using the Finger tool , access an entry in the logbook by double-clicking on it.
Or select [Trip Logbook Center] from the [Logbook] menu, a marker will be shown against Active logbook window under the Logbook menu.
245
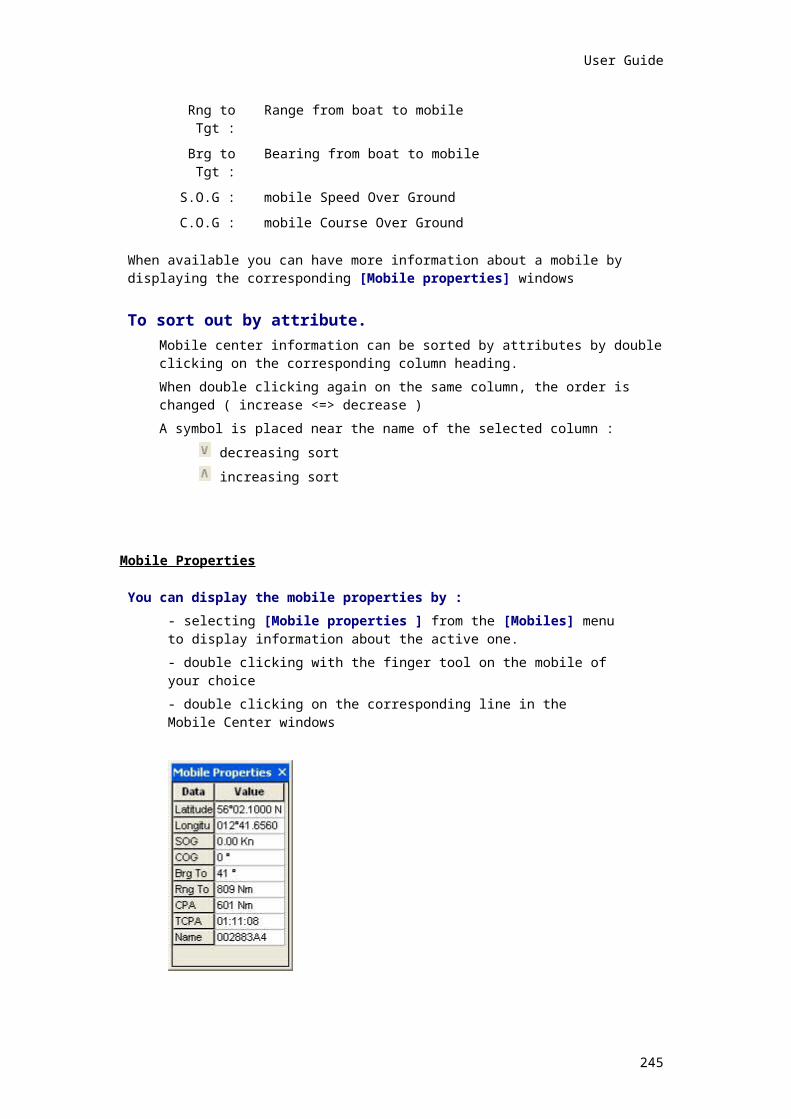
MaxSea Professional Marine Software User Guide v10.3
Note: to display an archived logbook window which is opened do as above using the finger tool or select [Logbook File] item from the [Logbook].
Click on the close window key to hide the logbook window or select again [Trip Logbook Center] from the [Logbook] menu.
Trip Logbook Center
You can obtain more information concerning your Logbook track by displaying the logbook window. Every line of the table describes an event.
The Logbook window:
Select [Trip logbook center] from the [Logbook] menu.
Or
Double-clicking with the finger tool will activate the logbook window and a cursor in the first column will be shown against a sequence line of the table.
A simple right click on a column of the table will display a contextual menu which allows you to:
You can change the table display configuration by simply moving columns in the window using the drag and drop function:
1 Select the column
2 Then drag and drop the selected column
A commentary may be added to this Logbook
246

User Guide
Note: if you have the program’s Race module a column will be added into the active logbook window and will inform about the Rate polar percent.
Creating an event
Select [Create a logbook entry] from the [Logbook] menu (shortcut F6).
A logbook entry is stored in the navigation logbook.
We would advise you to use this function when experiencing excessive changes in conditions (notable increase in wind force factor, for example) or an unprecedented event occurs.
Configuring the logbook
Activate the function [Option: Logbook] under the [Logbook] menu to access the dialog box for configuring saved information.
247

MaxSea Professional Marine Software User Guide v10.3
Regular events
In the first section you can define the frequency of saves in either time or distance.
If the "Distance" check box is checked a line is added in the logbook:
When the boat went through the distance wanted since MaxSea's launch.
Every time the boat went through the selected distance of The last recording.
If the "Time" box is checked and a time value is defined a line is added in the Logbook:
When the past time is equal to the selected time since MaxSea's launch.
When the past time since the last recording is equal to the selected time.
Conditional events
In the second section you may, if you wish, enter a further save criteria.
To do so click on the "Activate conditional lines" check-box to activate it, then click on the Add button for the choice of a conditional event. The " Add/Modify" dialog box appears and allows you different choices of criteria:
Choose the type of conditional event, this will generate a line in the logbook. Two items are proposed:
"The modification of the value is greater than" item is chosen, the delimiting value is defined and the type of data on which you want to apply the conditional event is selected. A line will be added in the logbook every time when the conditional event is reached. The value is compared with the last recorded value.
Or
"The value is cross" the delimiting value specified in the input text. A line will be added in the logbook every time when the conditional event is reached. The value is compared with the last recorded value and the comparison does not depend on the direction. For example if the value cross is [10K for the SOG ] an event is created when the SOG value reaches from 9.9K to 10.1K but also when the SOG value reaches from 10.1K to 9.9K.
To select the data criteria from the pop-up menu
248

User Guide
The criteria (course, speed, etc.). Lastly specify the delimiting value for this criteria ( the value above which an entry should be made in the logbook (for example, if the ship’s course is modified by more than 15°)).
To deactivate conditional events unchecked the "Activate conditional line" check box. This will not delete last recorded events.
To modify conditional line event select it and click on the "modify" button to edit again the "Add/Modify event" dialog box.
Archiving the logbook
A logbook is automatically archived when a new logbook is created.
To create a logbook, select [New Trip logbook...] from the [Logbook] menu.
The save dialog box appears:
249

MaxSea Professional Marine Software User Guide v10.3
You can enter:
A name for the archive logbook ( the current date is designed for the name by default)
The name of the port of origin. The name of the port of destination.
We strongly recommend that you regularly archive the current logbook ( at the end of each cruise for example).
The archived logbook is added in the archived logbook table (see the Archived Logbook window)
Note: navigation logbooks are saved in text format and may be opened in applications such as spreadsheets and database management programs for sorting and analyzing.
Opening an archived logbook
Archived logbooks may be opened at any time when the software is running.
You just need to activate the function [Open logbook file] from the [Logbook] menu, and to select the archived logbook from the "Archived Logbook window".
A logbook window like the active logbook window is displayed. Click on this window’s close button to hide it from the archived logbook window.
250

User Guide
The archived logbook is then displayed on the chart together with the current logbook when the function Display active logbook on chart is activated (refer to the previous paragraph Displaying logbooks on chart ).If this function is not selected the archived logbook is only displayed on the chart.
Note: only one archived logbook may be opened at any one time.
Importing previous logbook
To import a logbook from a previous MaxSea version (under version 9) to this MaxSea's version, select [open logbook file] from the [logbook] menu and the archived logbook window appears.
Click on the "Import old logbooks (*.log)" button.
Browse all the files of the computer and select one or several logbooks to be imported.
If the import succeeds, you will see them in your list of your archived logbooks.
If an error message indicates that the date format is not compatible with your Windows environment, follow the procedure below:
Define the date format of the logbook file to be imported. , you should open the file ( *.lgb) with a text editor (like notepad). Note the format of the date and the hour.(2001-11-29 => aaaa-mm-jj 29/11/01 => jj/mm/aa 12:52:23 =>hh:mm:ss 12-52-23 => hh-mm-ss)
Next you have to adjust the window parameters according to the logbook parameters. , open the "configuration panel" file of your computer, then double click on the "regional options" button a dialog box appears. Select the corresponding tabs to update the date and the hour format of your computer.
Then try again the "import old logbook" function into MaxSea.
Note: it is possible that your old Logbooks have not all the same format, in that case, please, repeat the operation as often as it is necessary.
Closing archived logbooks
Select the function [Close logbook file] from the [Logbook] menu
(the archived logbook will remain on the hard disk and may be opened at a later stage).
Catching logbook
Tuna fishing logbook
The Tuna fishing logbook is adapted to tuna fishing using purse seines.
It is used to maintain the history file of purse seines and associated information (environmental conditions, etc.).
251
MaxSea Professional Marine Software User Guide v10.3
The Tuna fishing logbook is in text format and it can be used by other software on a PC.
Plotting a catching entry
Select [Catching Entry] from the [Catching] menu.
Fill in the text dialog boxes and the different pop-up menus with information associated to the purse seine.
Note: the date and time are automatically displayed.
Then click OK to confirm the recording. An icon representing the purse seine plotted is displayed on the chart at the position of the ship.
The icons are defined as follows:
:Total tonnage of the catch less than 50 tons.
:Total tonnage of the catch greater than 50 tons and less than 100 tons.
:Total tonnage of the catch greater than 100 tons and less than 150 tons.
:Total tonnage greater than 150 tons.
Icon color is defined as follows:
Red if the first species is white tuna.
Blue if the first species is listao.
Green if the species is a mix and if the catch took place on a wreck.
Yellow in other cases.
Viewing a purse seine
Select the Select object tool from the Tools palette, then double click the purse seine icon on the chart that you wish to view.
252

User Guide
The information dialog box is displayed.
Note: you can change information about the purse seine in the dialog box which has already been entered. However, it is not possible to change the tuna ship icons on the chart using the modification tools.
Create a new catching logbook
Select [New Catching logbook] from the [Catching] menu to save the present tuna boat log and open a new empty log.
Enter a name for archiving the old logbook and then click Save.
Note: an archived fishing logbook can be opened to display any plan on the chart by selecting Open from the File menu.
Customizing the display
Setting your Work Area display
In this chapter you will learn how to organize and configure your software to adapt the screen to your requirements as customizing the screen display, displaying palettes and customizing the palettes display.
Creating centering points
Customizing the Auto Center mode display
Choosing the lighting screen level display
Setting the Data Cursor
Setting the Nav Data
Setting the Steering data
The Steering data window is automatically displayed when the track on function is activated.
To show or hide the Steering data window go to the [Display] menu and select the [Steering data] item.
Show / Hide the Steering display
The Steering display is not shown by default.
To show the Steering display window go to the [Display] menu and select the [Steering display] item.
Setting the Tide & Current display
Show / Hide Events display
The [Events display] item from the [Display] menu brings up the "Events palette" . This option is available according to your software configuration.
Seabed Classification display
The [Seabed classification] item from the [Display] menu brings up windows which inform you about the seabed data. This option is depending to your software configuration.
Display Palettes in default positions
To reset palettes to the default positions select [Arrange Display] from the [Display] menu.
This allows you to restore default positions at any time.
Modifications that you make, during this chapter, in screen presentation will be saved when you quit the software. Therefore, when the software is run again the saved presentation will appear again.
253

MaxSea Professional Marine Software User Guide v10.3
Setting your Work Area display
In this chapter you will learn how to organize and configure your software to adapt the screen to your requirements as customizing the screen display, displaying palettes and customizing the palettes display.
Creating centering points
Customizing the Auto Center mode display
Choosing the lighting screen level display
Setting the Data Cursor
Setting the Nav Data
Setting the Steering data
The Steering data window is automatically displayed when the track on function is activated.
To show or hide the Steering data window go to the [Display] menu and select the [Steering data] item.
Show / Hide the Steering display
The Steering display is not shown by default.
To show the Steering display window go to the [Display] menu and select the [Steering display] item.
Setting the Tide & Current display
Show / Hide Events display
The [Events display] item from the [Display] menu brings up the "Events palette" . This option is available according to your software configuration.
Seabed Classification display
The [Seabed classification] item from the [Display] menu brings up windows which inform you about the seabed data. This option is depending to your software configuration.
Display Palettes in default positions
To reset palettes to the default positions select [Arrange Display] from the [Display] menu.
This allows you to restore default positions at any time.
Modifications that you make, during this chapter, in screen presentation will be saved when you quit the software. Therefore, when the software is run again the saved presentation will appear again.
Creating & displaying centering points
In order to create a centering points, first move your chart using the Magnifying and the Hand tools to the zone chosen.
Select [Center on] from the [Display] menu, this brings up the "Center On" dialogue box (it does not include any element when it is first opened) into which you enter points.
Use the keyboard to enter or choose:
1. the name that you wish to give to the point
2. the scale of the point zone, by clicking on the scale pop-up, or select No scale change check box.
3. the coordinates of the point.
By default, the center of the chart coordinates are displayed.
Then click on Add button to insert the new point in the Centering point list.
254
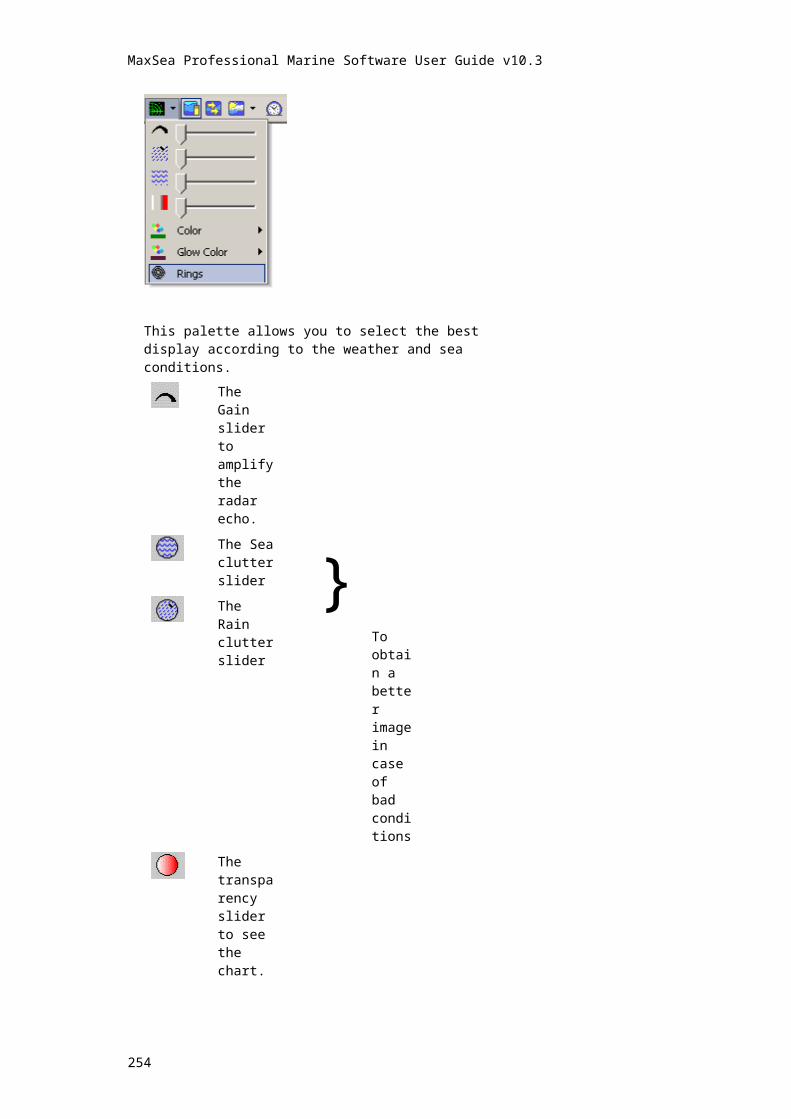
User Guide
Note that the name of a port you have chosen have been added to the list ;
Move the chart, then select a new port (or the name that you have specified) and click on Center on. You will notice that the chart is immediately drawn centered around the new port at the scale you have specified (or the position of the point that you have specified).
You can return at any time in the "Center On..." window to :
1. center around another point of the list
2. add or delete a point
3. modify the specifications of a centering point (name, coordinates, scale). To do so, choose the point from the list, modify it and click on the Add button.
Note : you can center the chart on the coordinates entered in the dialog box without add it to the list; to do so, just click on the Center on button just after the coordinates input.
Customizing the Auto Center mode display
Defining the automatic boat centering zone
The boat centering zone corresponds to that part of the screen that the boat symbol will not cross in Auto mode. The chart is moved under the boat icon so the boat symbol is re-centered.
The automatic auto center settings will correspond with the direction layout of the chart display.
Customizing the auto center mode according to North Up layout orientation
Customizing the auto center mode according to Course Up layout orientation
Customizing the auto center mode according to Head Up layout orientation
North Up auto center mode display
Select [Auto Center] from the [ Display] menu brings up the Auto Center window which allows you to choose between three Modes :
Default
The chart is automatically scrolled when the boat goes outside of the window.
1. choose Default option.2. select the Display option to show borders of centering box.
Manual
To use chart centering with manual selection:
1. select "Manual"
2. left-clicking on the "Position" slider bar brings up a series of choices, select one of them.
3. left-clicking on the "Size" slider bar brings up two choices (small or big)4. Select the Display option to show borders of centering box drawn on the chart.
255

MaxSea Professional Marine Software User Guide v10.3
Boat centering zone is defined by the user according to "Size" and "Position" pop-up menus.
COG depending
Boat centering zone is automatically dependant from COG . The chart is centered based on the course of the boat.
1. select COG depending option
2. Condition depending on speed ( SOG ) can be chosen. To do so, choose a minimum speed (Minimal SOG for mode activation)3. select the Display option to show borders of centering box.
"North Up" mode is selected, then click the "Center On/Off" button on the charts palette to activate the "auto center" mode.
The "Display" option is activated, a blue rectangle showing borders of centering box is drawn on the chart.
When the boat moves out of this rectangle area the screen is auto centered.
Course Up auto center mode display
Select [Auto Center] from the [ Display] menu brings up the Auto Center window .
Click the "Course up" tab to customize the Auto center display mode when the Course up mode is chosen.
Default
The chart is automatically scrolled when the boat goes outside of the window.
1. choose Default option.2. select the Display option to show borders of centering box.
Manual
To use chart centering with manual selection:
1. select "Manual"
2. left-clicking on the "Position" slider bar brings up a series of choices, select one of them.
3. left-clicking on the "Size" slider bar brings up two choices (small or big)4. select the Display option to show borders of centering box. 5. If you don't have a compass or a giro connected, enter a minimum SOG value to activate the Course Up mode.
Boat centering zone is defined by the user according to "Size" and "Position" pop-up menus.
As long as this speed is not exceeded, the centring zone borders are drawn in the middle of the screen and the screen does not turn any more.
If a compass or a giro is connected and whatever the speed of the boat the "Course Up" mode is activated.
Head Up auto center mode display
Select [Auto Center] from the [ Display] menu brings up the Auto Center window .
Click the "Head up" tab to customize the Auto center display mode when the Head up mode is selected.
256

User Guide
Default
The chart is automatically scrolled when the boat goes outside of the window.
1. choose Default option.2. select the Display option to show borders of centering box.
Manual
To use chart centering with manual selection:
1. select "Manual"
2. left-clicking on the "Position" slider bar brings up a series of choices, select one of them.
3. left-clicking on the "Size" slider bar brings up two choices (small or big)4. select the Display option to show borders of centering box.
Boat centering zone is defined by the user according to "Size" and "Position" pop-up menus.
Lighting screen level display
You should need a less bright display, in case of night navigation for example.
Day/Dusk/Night display darken the software color palette and allows you to not be dazzled in a dark cabin.
It also applies on the following charts :
Mapmedia
ARCS
NDI
Maptech
C-MapThree ways to call up Day/Dusk/Night option display
1. The lighting controls are found at the bottom of the palette (Sun symbol). Click the Sun symbol button and choose a display level under the pull down menu.
2. Select [option: display] from the [Utilities] menu and select the display option from the corresponding pop-up.
3. The short cut access : Shift + F2 to switch between lighting level (Day/dusk/night) display.
Data Cursor display
You can hide or display the cursor palette as you work by choosing [Data Cursor] from the [Display] menu.
To hide it, click the closing box located in the left-hand corner of the title bar of the display.
To obtain the cursor information in a form of "Menu bar" mode just double left-click on the cursor title bar.
To return in a form of "floating palette", just left-click on the "customizing bar" and then drag to new position on the screen.
257
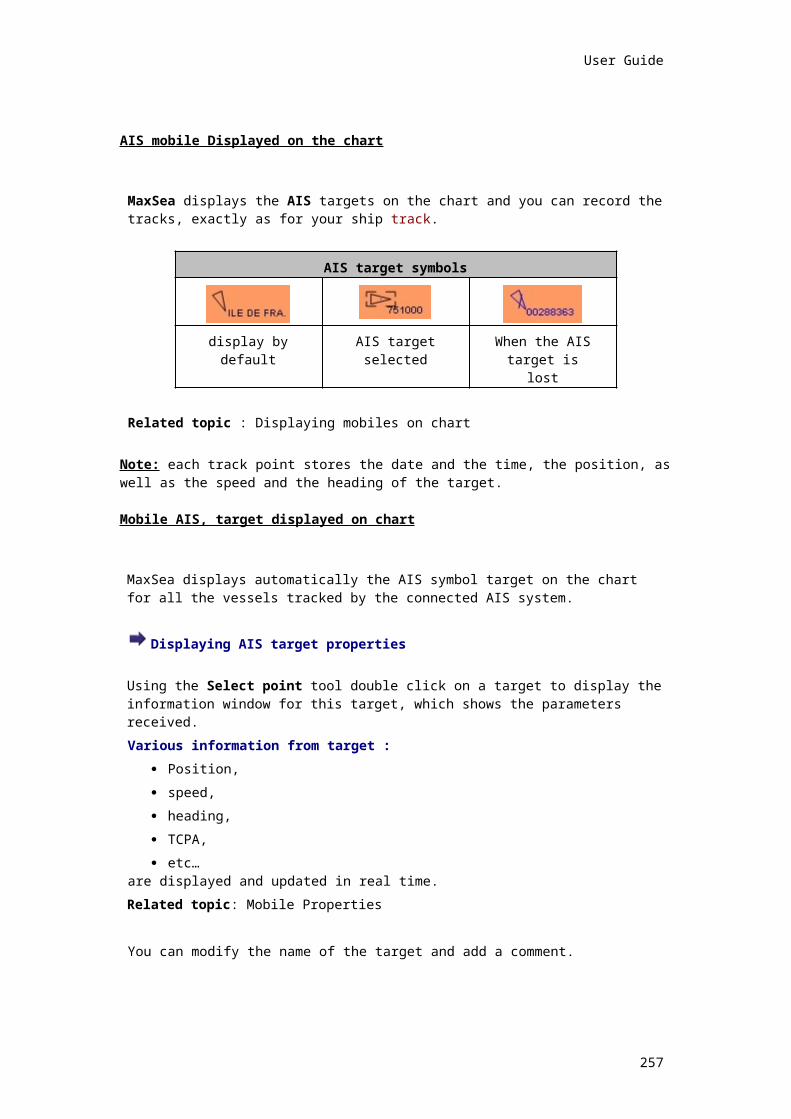
MaxSea Professional Marine Software User Guide v10.3
To resize the palette horizontally or vertically hold down the left mouse button while moving the mouse in whatever direction.
Right-click on the title bar to change the cursor palette layout, different types of layout are proposed in a menu:
1. degree of transparency choosing from "Not transparent" or 10% or 20% or 30% or 40% or 50% or Text outline.
2. font size choosing from smallest or smaller or medium or bigger and biggest.
3. two options for the cursor palette: full mode display shows all data and reduce mode shows only the position data.
Standard display modeReduce display
modeNo transparent display mode Text outline display mode
Note:Transparency layout option is available only with operating system Windows® 2000 and XP.
Nav Data palette display
The Nav data palette can be used to display information sent by electronic equipments, which are connected to the input/output port of the computer ( GPS , central navigation equipment, etc.). The Nav Data palette regroups all data information providing to each available electronic equipment.
To connect electronic equipment refer you to the related topic : Equipment Connection .
The Nav data palette is displayed, when the software is first used, in the right-hand side of the screen.
To show and hide the Nav data palette go to [Display] on the menu bar and choose [Nav data].
To obtain the Nav Data information in a form of "Menu bar" mode just double left-click on the cursor title bar.
To return in a form of floating palette, just left-click on the "customizing bar" and then drag to new position on the screen.
To resize the palette horizontally or vertically hold down the left mouse button while moving the mouse in whatever direction.
Right-click on the title bar to change the palette layout. Three modes of layout are proposed in the menu:
258

User Guide
1. The Degree of transparency ("Not transparent" or 10% or 20% or 30% or 40% or 50% or Text outline).
2. The Font size (from smallest or smaller or medium or bigger and biggest).
3. "Choose displayed data..." brings up a dialog box in which you can choose the data to be displayed according to each instruments connected (repeat all following steps to customize the data layout according to each available instruments).
a) - Select first the instrument under the list on the left side of the window
b) - Click the Up arrow or the Down arrow to order the instrument position layout in the Nav Data palette.
c) - Enter a name according to each available equipment.
d) - Choose different color according to each data output information.
e) - Check the box next the data that you want to display. As above, you can change the order of the output data layout by clicking the nearest Up or Down arrows.
Note:Transparency layout option is available only with operating system Windows® 2000 and XP.
Tide & Current window display
The Tide & Current window indicates the value of the tide and current display based on the nearest tide station to your present location. As the boat moves the software will update the display with the closest tide station.
The Tide and Current window can be left open anywhere on the chart.
To open the Tide & current window, go to [Display] on the menu bar and select [Tide & Current display].
This brings up a window which displays tide and current value.
The 7.6Ft refers to the height of the tide and the current arrow indicates approximate direction of the tidal flow and strength.
GMT time is displayed at the bottom so you have one place where this time is available.
When you are keeping the cursor a few seconds on Tide, Current and GMT window zone, MaxSea gives you information about it.
Holding the mouse over on the tide gauge icon brings up a tip screen that gives the nearest reference harbour name.
Holding the mouse over on the current arrow icon brings up a tip screen that gives the exact orientation value of the current and its strength according with the ship position.
Holding the mouse over on the GMT hour brings up a tip screen that gives the local time and the GMT time.
Chart window display
259

MaxSea Professional Marine Software User Guide v10.3
You can view several charts at the same time at different scales or zones (a specific window centered on the ship and a general window for the whole of the route and the navigation zone for example).
The size of the windows may be adapted (to view two charts on the same screen for example) using the dimensioning key located in the lower right-hand corner of the windows. The configuration box in the right-hand corner of the title bar can be used to switch from the size that you have chosen to a maximum size and inversely.
Note: the software is compatible with using several monitors at the same time.
To change the screen display mode
select [New Chart Window] from the [Windows] menu. The software creates a new window in scale and centered on the previously activated chart. You can now modify the scale, zone, etc. of the chart window.
To create a new chart window
1. select [New Chart Window] from the [Windows] menu. The software creates a new window in scale and centered on the previously activated chart. You can now modify the scale, zone, etc. of the chart window.
2. a new element is added to the [Windows] menu, which represents the name of the window created.
3. when you choose one of the chart windows from the [Windows] menu, it will be displayed in the foreground and on top of the other windows.
You select one of the chart windows and make it active by clicking it with the mouse (it is displayed in the foreground and is displayed on top of the other windows).
To place side by side chart windows
Two modes to place side-by-side chart windows
1. select [Tile vertically] from the [Windows] menu.
2. select [Tile horizontally] from the [Windows] menu.
To place chart windows some above the others
select [Cascade] from the [Windows] menu.
Note: The software displays for each charts a window in scale and centered on the previously activated chart.
Software properties
Option: PBG/2D/3D
Select [Option: PBG/2D/3D] from the [Utilities] menu to call up the dialog box in which you can customize either the PBG or 2D or 3D data before displaying on the chart.
Refer to related topics:
1. Personal Bathy Generator settings
2. Bathy 2D settings
3. 3D settings
Personal Bathy Generator settings
260

User Guide
Select [Option: PBG/2D/3D] from the [Utilities] menu, click the PBG tab to call up the window area which allows you to configure the PBG data display.
This zone of the window consists in three parts in which you can select easily the PBG resolution before imported data:
1. Check one of each radio button to choose the scale resolution for the PBG import.
2. The second part of the dialog box informs you about the chosen resolution value.
3. The third part on the bottom of the dialog box consists to a short definition that allows you to know in which case the chosen option is to be used.
Note: these customization features must be done before activating the PBG function on.
Bathy 2D settings
To emphasize the details of your 2D display charts, or accelerate the display speed, you can change the values of the 3D display properties.
To do so, select [Option: PBG/2D/3D] from the [Utilities] menu
Click the 2D tab index, The dialog box consists in four parts in which you can choose how to customize the 2D display on the chart.
(1) - Use data type
You can select the type of data you wish to display or not in 2D as well as the grid.
You can display one of each data type or all data types from "User data", " C-map" or "D.E.M.".
Note: check all boxes to display all data.
(2) - Display density
The Normal density option allows to optimize the resolution of posting 2D the data display resolution. Select Low density option if you want to obtain more display speed.
(3) - Interpolation
The interpolation check box allows you to select either Spline or Dilatation algorithms to display the data.
The Spline mode is a smooth mode more adapted to high scales but is slower.
261

MaxSea Professional Marine Software User Guide v10.3
The Dilatation mode is faster and more adapted to situations where data is grouped in a small geographical zone. There is no smoothing in this mode, only calculated data is displayed.
(4) - Display
Check the D.E.M. box to display the data import grid
And / or check the overzoom box to display data value for lower scales on the import value scale . (overzoom data value)
262

User Guide
3D settings
You can change the values of the 3D display properties to emphasize certain chart details or improve performance.
1. Select [Option: PBG/2D/3D] from the [Utilities] menu
2. Select the 3D tab
3. Select the "Altitude Data filter" display by checking one of the radio buttons.
4. Several filters are available in the 3D tab as well as a check box to use hardware acceleration.
You can display:
All data, in this case no filter is used.
Marine data only by removing land data.
All data except for underwater data.
Hardware
The minimum hardware configuration required is 64 Mb RAM with an 8Mb RAM video card. Better performance can be achieved with more system and video memory and a card that supports 3D acceleration.
Note : MaxSea will operate in "hardware" mode if the video card supports hardware acceleration.
Otherwise, all 3D graphics are calculated by the software.
: "Software" mode
: "Hardware" mode.
If your computer does not have a 3D video card, the mode stays in "Software" mode .
Hardware : the "Use hardware acceleration" check box is unchecked by default (the calculation is realized by the software) and check the box to allow the software to use the 3D graphic card.
3D Window Display Quality: this slider allows you to determine the display precision degree of the 3D charts. It defines the best report quality / performance depending on your equipment and your required level of detail.
Note : the slider is in Lowest "Quality/Fastest" position by default.
Option: GPS and track
Select [Option: GPS/Track... ] from the [Utilities] menu to bring up the GPS/Track... window which consists in four parts of settings.
A list of mobile is shown on left-hand of the window. This list contains one or several mobiles, first choose a mobile on which you want to apply settings.
Then select one of each tab to apply settings.
Track tab
Checking boxes to define how to save your track.
1. Active check box to record directly the current track.
2. Record all input data check box will record all data received from all mobile.
3. Single user file for mobile trails check box will record the track in a single file.
263

MaxSea Professional Marine Software User Guide v10.3
Recording accuracy
Define the precision of your track ( the interval between two saved points) in either time or distance.
We would advise a frequency of between 120 and 300 seconds (2 to 5 minutes), which is sufficiently adequate for normal navigation requirements where land is in sight. The saving of tracks is generally not used in the open sea.
1. Choose either Time or Distance option.
2. left-click on each number unit to modify its value or use arrow to increase or decrease.
Note: to set the measurement units that you normally use go to [Option: units] under [Utilities] menu.
Track line
Select line width option to define the width of track displayed on chart.
2. left-click on the pop-up menu to pull down a menu.
3. choose one track width.
Two ways to select the color of your track :
Fixed Track color1. select Fixed color option2. choose a single color from the color palette.
Variable Track color
You could choose a variable track color in accordance with one of the data sources recognized by the software (e.g. speed of the ship, wind force factor, etc.).1. click on "According to..." , to access the color palette range.2. choose the data from which the color track will change (for example, speed).3. click on the "Edit color range" button to bring up the window color range.4. use the keyboard to select the delimiting speed values by successively selecting text zones (for example, speed of less than knots: blue track; speed exceeding knots: red track; speed between the two: variable color). 5.click on the Apply button to valid the display.
Note: the data sources are dependent upon the electronic equipment installed.
Display tabDisplay is checked and the boat symbol will be displayed on screen.
Click on the color zone area of the symbol to choose in which color you want to the boat symbol.
Size an type of the boat symbol
Minimum ship size unit is defined in pixel unit. Choose a size.
The boat symbol cannot be less small than minimum size defined by the user.
ECDIS symbol display.
Ship symbol constant size display.
Misc tab
Position alert
1. If the "Display" check box is enabled, a «bip» alert is permanently performed when no position is received by the software.
2. Unchecked it if you do not want to hear this alert anymore.
264

User Guide
Security circle 1. check "Display" to show it on chart.2. enter a value in Size input text to define a circle distance.
Vector1. three check boxes allow to display vectors direction of your mobile ( Ground heading, Surface heading or the drift)2. Choose to display all vectors or one of them.3. select in which mode you want to display vectors with a fixed length or if it moves according to the speed that you have entered.
Average input data every...You can choose the average rate, which will be used by the navigation logbook.
CharacteristicsMobile size
1. enter the length and the width of the selected mobile.2. choose from the middle of the mobile axis of the GPS antenna position
Option: display
Select [Option: display] from the [Display] menu to bring up the Display window that allows you to define characteristics on the chart.
Colors
Day / Dusk / Night display
You should need a less bright display, in case of night navigation for example.
Day/Dusk/Night display darken the software color palette and allows you to not be dazzled in a dark cabin.
It also applies on the following cartographic:
o Mapmedia
o ARCS
o NDI
o Maptech
o C-Map
choose your display mode.
Example of Dusk display :
265

MaxSea Professional Marine Software User Guide v10.3
Background color / Grid color / world chart color
Left-click on one of each option to bring up the corresponding color palette in which you can choose a color.
Tools
This part of the "display window" allows to change the characteristics of the selection tools ( by changing the line color and its width drawn on chart).
Palette font size
The pop-up menu can be used to specify the character size used for text inside the displays.
Display the grid
If you select this box, the grid of lat / lon coordinates is displayed on charts.
Display chart outlines
If you select this box, the contours of available charts are displayed.
Antemeridian
Select the box to choose a chart display centered on the antemeridian ( longitude 180°) which replaces the display centered on the Greenwich (longitude 0°) meridian .
Great circle or Rhumb line calculationsThe software can work in Great circle or Rhumb line on the chart. You are advised to always work in Great circle method.
Option: units
Select [Option: Units] from the [Utilities] menu to call up the measurement units properties window.
Measurement units
1. Choose the measurements units that you normally use by calling up the corresponding pop-up menus.
2. Select an item in the corresponding pop-up menus (Distance, Short distance, speed, depth or high etc....)
3. Click on OK to valid the settings parameters.
4. Click Cancel to close without taking into account the setting parameters.
Option: Magnetic Variation
Select [Option: Magnetic Variation] from the [Utilities] menu to bring up the Magnetic variation window which consists in three parts of setting zone.
Heading display
1. First choose an option to explain how you wish display headings:
2. if you wish that the headings are indicated by the software in geographical mode, check Geographic heading box.
3. if you wish that the headings are indicated as magnetic headings check the Magnetic heading box.
266
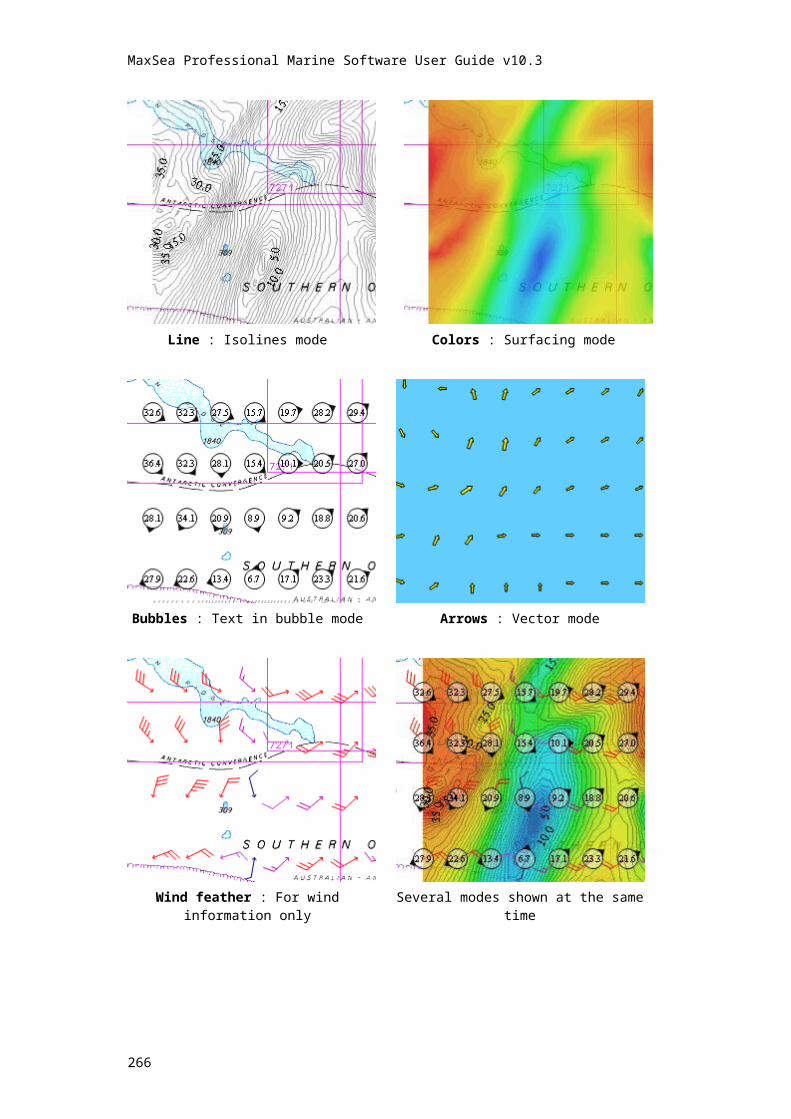
User Guide
Note:
1. True (or geographic) headings use the geographic North pole as the reference point and refer to the north maritime chart.
2. Magnetic headings reference the magnetic North pole (this value is constantly moving very slowly) so you have to apply a correction factor to compensate for this offset.(see the following MaxSea World magnetic chart reference)
3. Compass heading is that which is indicated on steering compass. Most GPS give the option of outputting geographic or magnetic heading.
Magnetic variation
Choose a correction that is known as Magnetic variation.
1. check the Manual radio button from the Magnetic variation zone and then use the keys (+ ) and (-) to enter the present declination on your navigation region, from the 0°(East ).
2 - select Auto from the magnetic variation zone.
Note:
MaxSea refers to a world Magnetic chart reference to apply correction. This refers to Epoch 2000 declination - Main field(D) references.
The World magnetic chart shown above is the magnetic variation reference in MaxSea ( chart not available in MaxSea )
Magnetic deviation (Curve or Table)
267

MaxSea Professional Marine Software User Guide v10.3
The deviation (or the boat influence) is the error of your steering compass, this is the affect of magnetic items near your compass ( for example iron), this will affect the headings of your boat.
Choose the different deviation values for each ship heading. Take care to use the correct direction for the curve (East or West).
MaxSea allows you to input your deviation corrections on a permanent basis. this can be done in two ways:
1. directly from the curve, left-click a point from the curve and move according to the correction value.
2. or enter your magnetic deviation directly in a cell of the table and choose the geographic direction (East or West), left click in the cell and choose the direction from the pull-down menu.
IMPORTANT If you have chosen Compass heading mode the software displays all the headings taking into account the variation (declination and deviation). However, deviation is not applied when the bearing lines are plotted using the Bearing tool (see chapter Bearings In effect these are generally taken using a bearing compass which is not affected by the deviation (only the correction due to declination is brought to bearing values).
Option: Fuel consumption
Select [Option: Fuel consumption] from the [Utilities] menu to call up the Fuel consumption window.
A graph is drawn in the upper of the window and represents the average of your boat fuel consumption.
The tab in the lower part of the window allows to add a specific consumption value according to the speed.
To add or to remove a value:
1. To add a value left click on the Add data button.
2. To change the value click in the desired cell and then enter directly the value.
3. To remove a value just click on the Delete data button.
4. To valid the customize click on OKNote: three values are defined by default (lower, middle and higher)
Option: Customize Icons
Select [Option: Customize Icons] from the [Utilities] menu to call up the Customize Icons properties dialog box.
You can add up to 100 icons.
1. Left-click on an icon of your choice among the "available icons" frame .
2. Click on middle left arrow to see the new icon positioning in the user palette
3. Repeat the same operation so much that it is possible.
To replace an icon
268

User Guide
Click on an icon of your choice and drag it towards the one to be replaced.
To delete an iconClick on an icon of your choice from the left frame and drag it towards the one to be deleted (or click on the middle right arrow).
Option: Route
Select [Option: Route] from the [Route] menu to call up the route properties dialog box.
This is where you set the time interval for how often the route track is updated.
Waypoint Arrival
Circle Radius
You can modify the distances from which the waypoint is considered as "passed" (the software then selects the following waypoint from the route list as the target).
To active the Auto Scale function check the "Auto Scale Window" box.
XTE
Choose also the Cross Track Error ( XTE ) so that you accept before the alarm is displayed in the waypoint display.
You can modify the XTE limit value into the Alarm Distance input text.
Then select the "Display Alarm Borders" check box to valid the XTE function.
Option: Mobiles...
Select [Option: Mobiles...] under the menu [Mobiles] to call up the Mobile option dialog box.
In case MaxSea is connected to a mobile, you can change the setting parameters applied on :
1. Tracking
If the " Automatic Track ON" box is checked, each new mobile is automatically displayed on Tracking.
The mobile track is saved in the layer "Target.ptf". If not existing yet MaxSea will create it.
Select a time (xx mn xx s) for the Recording accuracy. All information available concerning this mobile will be saved on its tracks at this period.
Note : This option allows at the same time to refresh the target display
2. Mobile color
MaxSea displays all mobiles on the chart with same color.
In Mobile color you can select :
ECDIS color (green)
or
Fixed color and then choose the color you want by using the PopUp menu.
269

MaxSea Professional Marine Software User Guide v10.3
3. Track color
o If the " variable color for temperature " box is checked, each new mobile track is drawn in different colors according to the sea surface temperature. To associate different colors to a mobile track click on the settings button and choose a color gradient according to an interval of temperature.
o This has two effects on the display:
o The track is drawn in different colors and the temperature appears beside the target name (23°7c)
o The temperature is also indicated in the Mobile properties windows
4. Auto saving
Check the " Automatic daily saving…" box to choose how often you wish to save the mobile track (daily hour frequency).
Then select an hour in the corresponding pop-up.
When time for recording is arrived MaxSea automatically save the active target.ptf file as : Targets_YYYY_MM_DD_hh_mm_ss.ptf (Targets_2003_03_28_10_40_55.ptf)
5. Mobile label
To define the mobile label displayed on chart select the most appropriate label under the pull down menu.
Choose a label type between the following options:
1. Name
2. Call Sign + Name
3. Name + Sea Surface Temperature.
Option: Text
Select [Option: Text] from the [Edit] menu to call up the Text properties window.
This gives you control over text by setting:
Font typography
Font size
Font color
Text Justification
270

User Guide
Highlight check the box to display text written on white background.
Choose the font and the characteristics that you wish to apply; then click OK to confirm.
For more information refer to "Entering text " chapter.
Option: TDs...Hyperboles
Select [Option: TDs...] from the [Utilities] menu to call up the dialog box detailing the hyperbolic networks used.
1 - Click the Hyperbole 1 button, then select parameters for this network (Decca, Loran or Toran type).
2 - Then, call up the pop-up menu Channel to choose the required network.
3 - Finally, choose the colors or stations as well as any corrections.
Note: (1) - you can select simultaneously two different hyperbolic networks.(2) - when a hyperbolic network is selected, all of the positioning information will be indicated both in geographical mode ( latitude , longitude ) and in hyperbolic mode.
To display the hyperbolic network(s) on the chart, go to [Display] menu, choose [Show/Hide...] and select the corresponding boxes.
Option: Events...
To call up the dialog box which lets you to customize events go to the [Utilities] menu and select [Option: events...].
The Events dialog box lets you to customize each events using the numeric keypad and to select the required parameters.
The dialog box consists in two parts:
The upper part of the dialog box is reserved for setting up automatic events (saving frequency, additional criteria, etc.).
1. Two manners to define the recording interval between two events. Two manners to define this frequency, in a value of time or in a value of distance.
2. If you wish that some of the information (SOG, COG, speed, etc.) be recorded at the same time as the event.
3. Select the "Additional function memorisation" check box.
4. Call up the pop-up menu and choose the type of value for which the information is taken in account.
5. Enter the "Higher than" value to activate recording of additional criteria.
The lower part of the dialog box is reserved for setting recording commands.
1. Click the "Event Short name" check box if you wish that some of the information (depth, water temperature, etc.) be displayed on the chart at the same time as the event.
2. Call up the pop-up menu and select the information chosen.
3. For each number key, choose the required icon and color from the corresponding pop-up menus.
271

MaxSea Professional Marine Software User Guide v10.3
Note: the software allows you to customize maximum 10 events;
Save and Print Chart window
Print Preview
You can preview how the chart will look and see how many printed pages it will be by clicking the [File] menu and then clicking [Print Preview].
1. Select the type of window that you want preview
2. Choose a printed paper scale resolution.
3. Click on Print button to print
Printing
Go to [File] on the menu bar, and select [Print] which brings up the Print dialog box.
Here is where you decide whether to actually print out the computer screen, create a digital image of the screen.
The first choice you have to make is the window type the Chart window or other, then choose “Chart Scale/Resolution”. The default setting is the same as the displayed chart scale.
If you want more data in your file or on the printed paper, choose a smaller scale, Printing to Paper, and then select “Print” to bring up the printing menu below.
The first time go into “Properties” and set your printer for either portrait or landscape mode and to “Fit selection to paper”.
With that done you are back to the menu below.
Choose “Selection” and then left-click on “OK” and you are set. CHOOSING A PRINTER
The printing keeps the chart scale, that is that if you choose to print a Raster chart in the 10 000, then 1 cm on the paper = 10 000 cm on the chart.
The scale of the printing is then indicated below to the left of the sheet, under the shape of a gradual and annotated bar.
The scale of the printed charts depends on the resolution of the printing. See Choice of the resolution.
The centre of the printing corresponds to the center display in the window.
Saving Chart as...
To save a computer screen as a digital image:
Go to [File] and select [Save window chart as...].
Select the type of the picture (Bmp, jpeg, gif, tiff or png).
“Select “Save the picture”.
Pick a folder in which to place the image and name the file.
Note: Files can be e-mailed or viewed / manipulated in almost any graphics program.
Installation & configuration
272

User Guide
Hardware and system requirements
Your system must have a valid Windows installation: Windows 2000, Windows 98 ed2, Windows Me or XP
Read this chapter carefully to ensure correct installation.
Computer Processor
Intel® Pentium® or equivalent 200MHz
A printer port or USB port is necessary for the hardware key (dongle).
Operating system Windows® 98 (2nd ed)
Windows®ME
Windows® 2000
Windows® XP
Memory (RAM)200 Windows® 98 & 2000 64 MB at least / 128 MB recommendedWindows® ME & XP 128 MB at least / 256 MB recommended
Screen 16 bit color display at 800 x 600.
(32 bit color, 1024 x 768 recommended)
CD-ROM drive 24X recommended
Video card 8 MB at least and 16 MB recommended
Screen display configuration recommended
IMPORTANTMaxSea must be used with a Display configuration of 65k colors (16 bit). Do NOT use a 24 or 32 bit color setting.
How to optimize the MaxSea display function with Windows XP operating system ?
If your screen is configured to use something other than 65k colors (16 bit), please, follow the procedure below:
1. Right-click on the Windows desktop to activate the Windows context menu.
2. Point and left-click on [Properties] in the pop-up menu to call up the Display Properties dialog box.
3. Select the Settings Tab.
4. Choose Medium (16 bit) in the Color quality pop-up menu.
5. Click on the Apply button to validate your configuration.
6. Close the Display Properties Dialog box.
273

MaxSea Professional Marine Software User Guide v10.3
Software installation
Initial installation
IMPORTANT! Consult the chapter System Requirements before installing MaxSea.
Installing the software with using Software Key
Unless you are using the optional hardware key, the software registration routine is started so that you can register your software when you first run MaxSea. You will need the serial number supplied to you when you purchased MaxSea, and an Internet connection to register. (If an Internet connection is unavailable, you may activate MaxSea by phone by calling your distributor.)
The Software key activation wizard will start automatically to guide you through the registration process. (You may also run the key activation from the MaxSea Utilities under Windows Start menu.)
Installing the software with using a Hardware Key (dongle)
Starting with Version 10, MaxSea uses software copy-protection by default. A hardware key (dongle) is available for those who prefer it, or for those who have upgraded from a previous version. The hardware key is useful for installing MaxSea on a computer with no Internet access, or if you wish to share a license and install and run MaxSea on more than one computer.
1. If you are using a printer port hardware key, it should be plugged in to your printer port before installing MaxSea.
2. If you are using a USB hardware key, it should not be plugged in until after MaxSea has been installed.
Whichever type of key you are using, you will need to go into MaxSea Utilities and select Dongle Update to enter the two serial numbers supplied with MaxSea (unless your dealer has done this for you).
Software Installation
3. Click on Installation, choose your language and follow the instructions on screen.
4. During installation, icon will be made for MaxSea and MaxSea Utilities in the Windows programs menu, and a shortcut to MaxSea will be placed on your desktop.
The installation program may ask you to restart the computer in order to ensure that system files used by MaxSea are loaded.
Installing Charts
If you are using Mapmedia or Maptech charts, we recommend that you create a CHARTS folder under My Documents, and copy the charts from the CD into this folder. ARCS and Seafarer charts are installed from the MaxSea Utilities. C-Map CM/93 charts and S-57 charts are installed from the MaxSea Utilities. C-Map NT charts are installed using the tools on the C-Map CD.
Upgrading Your software Version
You MUST remove the previous version of MaxSea before upgrading.
1. Remove the program
274

User Guide
To remove the program version xxxx.
Under [Windows] click [Start], point to [Settings], click [Control Panel].
Double-click the Add/Remove programs.
Select the MaxSea program and click Change/Remove or Remove.
If your installed version is 10
Insert the MaxSea installation CD.
Click on Installation, choose your language, and follow the instructions on the screen.
Three options are displayed: Modify, Repair, Remove.
Select Remove click Next and follow the instructions on screen.
2. install the new edition
Install the software as outlined in the Installation Section
Upgrading your software configuration
The MaxSea installation CD ships with additional modules which you can unlock from your installation CD. It is not necessary to have a new CD shipped if you decide to purchase these modules. Instead, you will receive two codes from MaxSea and use the Dongle Update program.
To start the Dongle Update tool, click on [Start], select [Programs], point [MaxSea Utilities] and click on [DongleUpdate].
• The Dongle Update software starts up and displays a window which allows you to enter your codes.
• Click on OK to validate.
Installing the hardware key on the PC
Installing the Hardware Key
If you received a hardware key (a dongle, or electronic protection key / USB or Parallel) with your software, it must be connected to your computer after installation for MaxSea to run.
USB Dongle: Install MaxSea BEFORE connecting dongle. It is not necessary to turn the computer off to connect or remove USB Dongle.
Parallel Dongle: Install MaxSea before or after connecting dongle. This must ONLY be connected with the computer power OFF.
Installing the software key (License)
Follow these steps if you have chosen the software key option.
IMPORTANT: The temporary license allows you to use the software for a limited time. You must activate a full license key through the internet (or by calling your distributor) to permanently unlock your software.
275

MaxSea Professional Marine Software User Guide v10.3
Section I : Installing a software Key
When you launch the program for the 1st time (without a hardware key)
A window appears and allows you to launch the Software Key Activation process
Click on [I want to proceed. I do not need a hardware key]
Choose the type of activation method to receive your activation codes:
o Automatic activation: (immediate registration)
o Manual activation: (delayed registration)
For Automatic activation
For automatic activation, you must have an active connection to the Internet. (Be sure that your Web browser works and that you can connect to web sites.)
Enter your Serial Number: provided on the first page of your paper User Guide Manual. (Keep this Serial Number safe. It is your proof of license and the software can not be re-installed or upgraded without it.)
A data registration form appears. This identification allows you to get your Site Key automatically through Internet. This site key will permanently unlock the software on your computer.
All fields marked with an asterisk are required.
As a security measure, the e-mail address must be correct.
Confirm your e-mail address. (If there is a problem obtaining your Site key because your e-mail address is entered incorrectly or there is a problem with the internet connection, then contact your distributor.)
Verify that your e-mail is correct, then click on the Finish button to activate the Site Key.
To configure additional software modules, click on OK to run the "Dongle Update".
Enter your Configuration Codes and a message notifies you that the configuration was successful. MaxSea launches automatically.
For Manual activation
This method requires the Site code and the Serial number before contacting your distributor.
The Site code is generated and displayed in the manual activation dialog box.
Contact your distributor and give them your Serial Number and Site Code.
Your distributor will provide you with a Site key for permanent activation.
Section II : Installing the software on another computer
This method is used only if you wish to install MaxSea on another computer.
IMPORTANTDuring the removing process you will be given a serial number. Please, carefully note it, as it will NOT be given later on.
Go to your Windows "Start" menu, open "Programs", find "Software Key License Remover".
Left-click on the OK button, this action will generate a code saved into a file named "PROOF.TXT".
Please this code must be carefully noted before proceeding the license remover process.
Section III : From software trial version to Full License
276

User Guide
This is how you proceed in order to get a Full License, before the end of the Demo trial period.
If your license is going to expire the software will warn you.
Switching from CD demo to full License can be done (with new codes given from your distributor):
o either at the end of the Demo period
o or during Demo period with using the Software Key Activation Wizard.
To get a new software key go to [Start] windows menu, select[Programs] open [MaxSea Utilities] and choose[Software Key Activation Wizard].
Connecting equipment
Connecting Equipment
The software is configured to be connected on serial port COM 1 to a GPS which sends the standard positioning information :
- Norm : NMEA 183
- Sentences : GLL(Position), VTG ( SOG / COG )
- Baud Rate : 4800
Most PCs on the market use a standard 9 pin male RS232 serial port. Connect the cable from your GPS to the COM1 port.
(see the PC computer cable diagram for more details).
To connect other types of electronic equipment, (depth sounder, navigation computer, autopilot, etc.), it is necessary to modify the input/output configuration. (see Data Input-Output Settings chapter)
Important: Serial port :
If your computer has no serial port, you may install an internal PCI board, a PC-Card (PCMCIA) or a USB to serial adapter.
Note that older systems may have a male 25 PIN DB25 serial port. Don't confuse this with the parallel (printer) port, which has a 25 pin female connector.
Incoming Data Precision
In order to ensure accuracy, check that your GPS receiver is properly configured to match geodesy of your electronic charts (usually WGS84).
277

MaxSea Professional Marine Software User Guide v10.3
Some GPS receivers communicate in hundredths of minutes (instead of thousandths) by default. A precision of thousandths is required for proper operation and accuracy with MaxSea. Make the necessary configuration changes to your GPS receiver.
Data Input-Output Settings
MaxSea is compatible with several types of equipment. It allows the user to configure the Input/output data, to verify the data acquired and to modify the horizontal datum used by the GPS:
MaxSea expects standard positioning from a GPS.
Norm : NMEA 183
Sentences : GLL(Position), VTG ( SOG / COG )
Baud Rae : 4800
This default configuration can be modified if necessary.
Select [Data Input-Output Settings] from the [Utilities] menu or press [F4]
On the Data Input-Output Settings tabs you will be able to :
From the BOAT or RADAR tab :
show active COM ports used with devices connected on.
add either to remove easily an instrument, see Add or Remove Instrument chapters
For each one you can:
define norm to be used
define the speed of communication
define among received data those that will be used in MaxSea (see Advanced settings... chapter.)
IMPORTANT any tab as RADAR, are dynamic so their display will depend on the software configuration.
From Preferences tab :
- define general preferences (Tolerance of position, geodetic datum correction...)
- backup or restore configuration
- configure network communication
From Check Data tab :- verify the data sentences received by each port connected as well as the physical connection between the electronic equipment and the computer.
From Data Display tab :- verify the data analysis.
278
User Guide
Input-Output Configuration
If you want to change which information (position, heading and ground speed) from your instrument is feeding MaxSea:
menu [Utilities] : [Data Input-Output Settings] or [F4]
Choose the tab corresponding to the type of instrument to modify: Boat, Radar,...
Data and sentence selection
Click on the Advanced settings button (or double-click on the Instrument line) to select the available data on the selected port.
A new dialog is displayed.
- select the corresponding case information that you wish to acquire,
GROUND SPEED
GROUND HEADING
SURFACE SPEED
MAGNETIC HEADING
...
DEPTH
...
- Select the corresponding Sentence to use for this data from the Pop-up.
Note : The predefined sentence is the most common use for this type of data. However you can change it if necessary.
Note: refer to your instruments technical documentation for more information concerning standards and sentences used.Note : for certain norms such as Atlas 8600, or Marelec…), there is no (user) configuration possible.
Master selection
If the same information is provide by several instruments, you need to select one as your master source. For example, boat position may be received by your GPS and your Loran.
To define your master instrument, select it in master column.
Note : Previously Master column gives you the name of the master instrument previously used for this data .
Baud Rate selection
The Baud rate is defined during the instrument installation (see Adding Instruments), but can be changed here if necessary.
279

MaxSea Professional Marine Software User Guide v10.3
Checksum
The NMEA 0183 Standard allows for an optional checksum. The checksum is preceded by the asterisk (*) character placed after the last data field. It is a special two-character representation which verifies the character bytes of the sentence.
(Checksums are like person one giving person two a list of 100 numbers. To verify that all the numbers were received correctly, person number two replies with the sum of the numbers. If the sum of the 100 number is correct, it is assumed that all of the information was correctly transmitted.)
If you prefer to ignore checksum errors, then select "Ignore sentences with checksum errors" from Miscellaneous column.
Add Instrument
menu [Utilities] : [Data Input-Output Settings] or [F4]
choose the tab corresponding to the type of instrument to add : Boat, Radar,...
For serial port connection :
Click on Add Instrument-select Serial port (COM)
- select the serial port from the pop-up menu Click Next
- Select the norm corresponding to the connected equipment.Note: the pop-up menu only shows the Norm available this type of instrument
- select Baud rate (refer to the instrument configuration)Note : For certain Norms, you cannot choose the transmission data speed (in Baud).
Click Next Click on Finish if your configuration is correct or return to the last step by clicking on
the Back button.
For Network connections :
If you want to be able to select TCP/IP or UDP , select the TCP/IP instrument type and refer to the Network Repeater function chapter.
Remove Instrument
menu [Utilities] : [Data Input-Output Settings] or [F4]
Choose the tab corresponding to the type of instrument to Remove : Boat, Radar,...
- select the line corresponding to the instrument to Remove
- Click on Remove Instrument button
IMPORTANT the operation cannot be undone.
Note : this operation have to be used to change the norm used for an instrument.
280

User Guide
Data Calculator
Select Data [Input-Output Settings] from the [Utilities] menu or press [F4]
Select the Boat tab :
The MaxSea data calculator can be used to control instrument data or if needed to replace it as master.
IMPORTANT To be able to calculate a data MaxSea can need other data.
On each line of the data settings : Boat / Data Calculator windows you will find the list of needed data for the calculation.
some examples :
Data Data needed
COURSE OVER GROUND
Pos
SPEED OVER GROUND
Pos
TRUE HEADING -1- COG & SOG & Drift angle & drift speed
or -2- Magnetic variation & Magnetic heading
or -3- only COG
MAGNETIC HEADING
Magnetic variation & True heading
... ...
To control instrument data
click Data calculator button
The Data settings : Boat / Data calculator windows is displayed
select data to calculate on each corresponding line
then click OK
You can then compare the two values from the Data display tab (See Verify data analysis chapter for more details.)
281

MaxSea Professional Marine Software User Guide v10.3
In this example the SOG and COG coming from instrument and the calculate data are different.
To use the calculated data as master.
click Data calculator button
The Data settings : Boat / Data calculator windows is displayed
select data you wish to calculate on corresponding line
select Master on third column
and click OK
Now MaxSea will use the calculated data as master data.
In the following example calculated data for COG and SOG are better than data coming from COM1. Then we will prefers to choose the calculated data as master.
Note : if you verify data configuration on COM1
Verify connection
menu [Utilities] : [Data Input-Output Settings] or [F4]
Check Data tab.
The Check Data tab allows you to verify the data sentence received by each port connected as well as the physical connection between the electronic equipment and the computer.
select from the Pop-up the port you want to verify. If your connection is good the displayed character are those received before any analysis.
282

User Guide
IMPORTANT
Serial communication using RS-232 requires similar parameters between instrument and serial port configuration (baud rate of the transmission, the number of data bits encoding a character, the sense of the optional parity bit, the number of stop bits).
NMEA 0183 devices employ an asynchronous serial interface with the following parameters: - Baud Rate 4800 - Data Bits 8- Parity None - Stop Bits One(or more)
NMEA 0183 sentence description :All NMEA 0183 messages start with a "$" and are terminated by a [Carriage Return][Line Feed]. The five characters immediately after the "$" are the address field. The address field is interpreted based on the type of sentence (talker, query or proprietary). Multiple data fields follow the address field and are delimited by commas.
The address field of a talker sentence contains a five character string immediately following the "$" sign. - the first two characters are the talker identifier - the next three are the sentence identifier. The sentence identifier defines the remaining data fields.
Under the NMEA 0183 Standard, the data fields are uniquely defined for each sentence type.
An example talker sentence is: GLL - Geographic Position, Latitude / Longitude Latitude and Longitude of present vessel position, time of position fix and status.
$GPGLL,5133.81,N,00042.25,W 1 4648.882 Current latitude 2 N North/South 3 00312.053 Current longitude 4 W East/West
Note: the Display button offers the possibility to keep the information scrolling or to stop the display (the sentence processing continues even if the display is stopped).
If there is nothing displayed in the Check Data tab
- the electronic equipment is not or is badly connected (for example, earth wire and signal wire reversed). See Cable diagram, as well as the technical manual for the connected equipment,
- the electronic equipment is not configured correctly (data transmission to the serial port is not activated or is activated with a transmission frequency which is too slow). Refer to the technical manual for the connected equipment,
- the electronic equipment format is different from that which is specified in MaxSea (for example, CIF instead of NMEA 183, etc.): modify the format in order to ensure coherence between connected electronic equipment and MaxSea (see above paragraphs).
If the window Check Data displays incomprehensible characters and if data is not interpreted by MaxSea
283
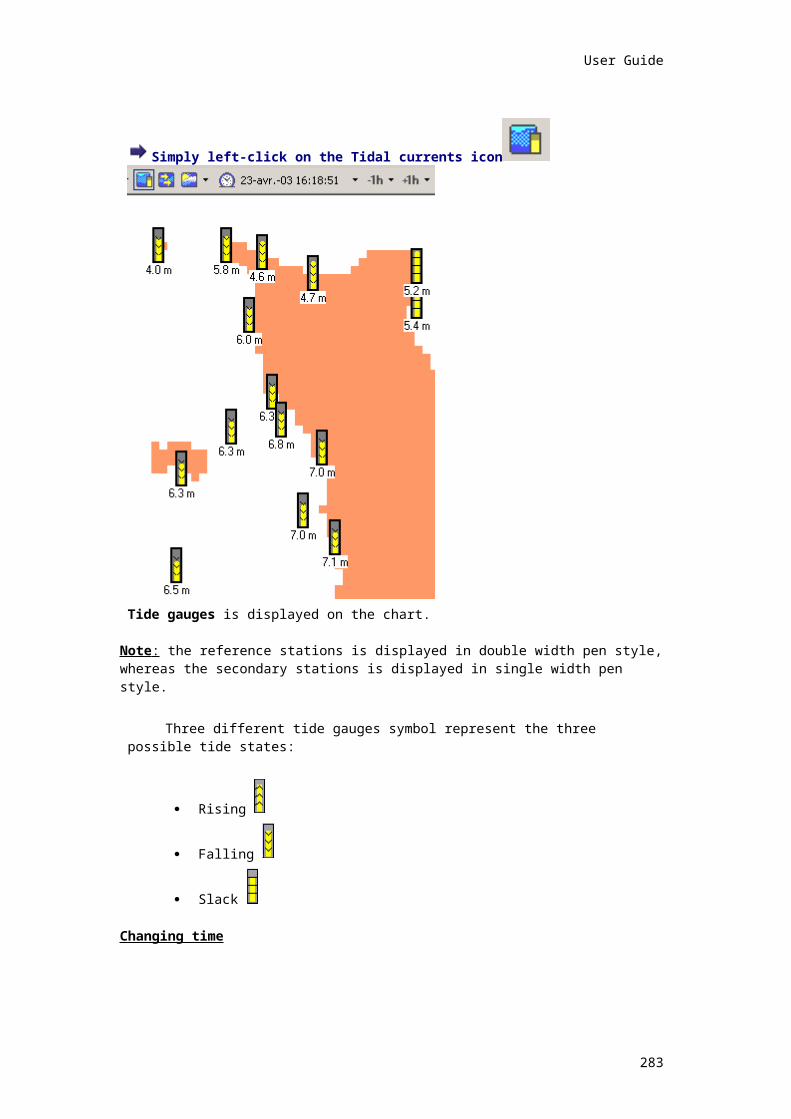
MaxSea Professional Marine Software User Guide v10.3
The format of the electronic equipment is really different from that which is specified in MaxSea (for example CIF instead of NMEA 183, etc.). Modify the format in order to ensure coherence between electronic equipment connected and MaxSea (see above paragraphs).
Serial port and instrument configuration (Baud rate, parity...) are different, see the specification of the instrument.
Verify data analysis
menu [Utilities] : [Data Input-Output Settings] or [F4]
Data Display tab
Before verify the MaxSea data analysis be sure that the connection is good, see verify connection and data chapter.
The data display tab show following information :
First line give you :
the name of the instrument : Boat / radar...
the DATA origin : COM 1, COM 2, Data Calculator...
On each column you can verify :
data selected on the corresponding instrument port : Latitude , Longitude , SOG , ...
the received or calculate value of each data which will be transmitted to MaxSea.
IMPORTANT:
284
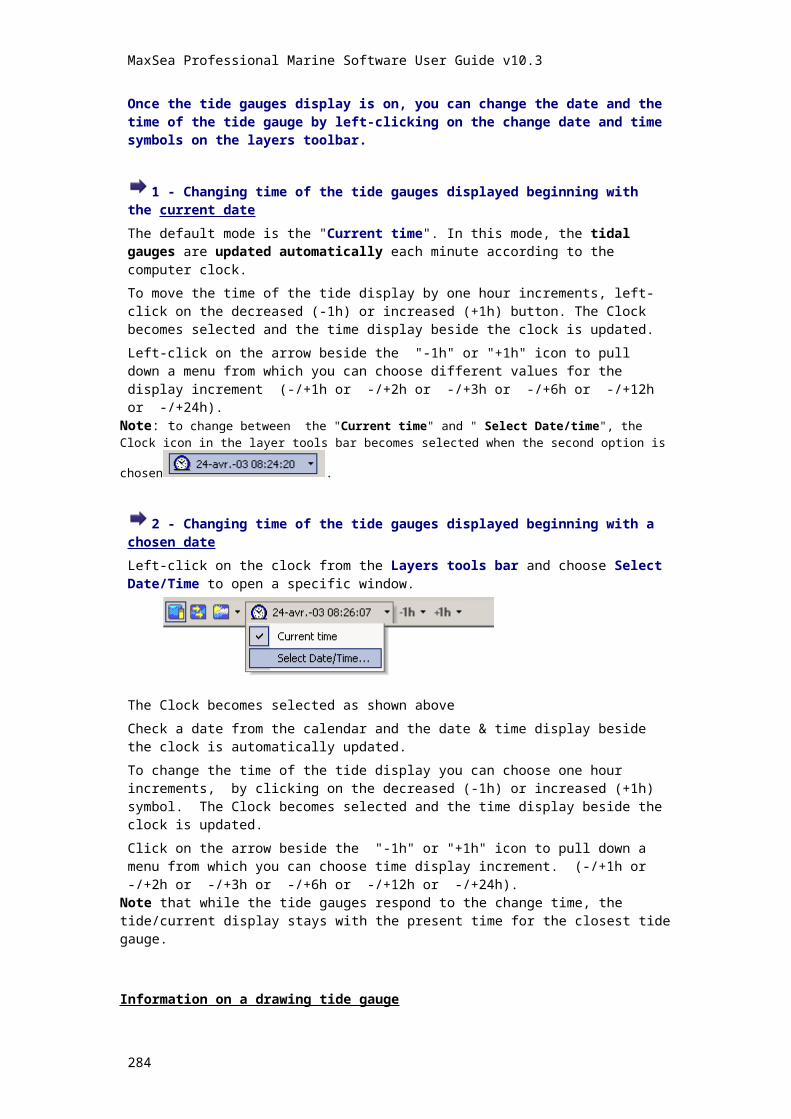
User Guide
if a value is replaced by "---" that means that the received or calculated data is bad and cannot be used correctly by MaxSea.
If one or several data stay in zero "---"
1. Received data bad analysis :
you don't receive this information.
The connected equipment is badly configured and it does not send data on the serial port (refer to the technical manual of the connected equipment)
the sentence sent with the connected equipment is different from the one that was specified
Modify the configuration of this data to assure the coherence between the connected electronic equipment and MaxSea
example $ - GLL instead of $ - GGA for a position in size NMEA 183
Note : to verify if you received or not an information and the sentence use for it you can display data entries from the Check data tab. (see Verify connection and data)
2. calculated data problems :
at least one of the value use for the data calculation is bad or missing.
(see Data calculator chapter)
Flow control data parameters
Select the Advanced COM settings button from the "Data settings"window, the dialog box appears and gives you the possibility to verify and modify flow data parameters.
How to configure : FLOW CONTROL sentences
o CTS (clear-to-send) output flow control
Specifies whether the CTS signal is monitored for output flow control. If this member is TRUE and CTS is turned off, output is suspended until CTS is sent again.
o DSR (data-set-ready) output flow control
Specifies whether the DSR signal is monitored for output flow control. If this member is TRUE and DSR is turned off, output is suspended until DSR is sent again.
o DSR Sensitivity
Specifies whether the communications driver is sensitive to the state of the DSR signal. If this member is TRUE, the driver ignores any bytes received, unless the DSR modem input line is high.
o DTR (data-terminal-ready) flow control type
Specifies the DTR flow control. This member can be one of the following values :
Disable Disables the DTR line when the device is opened and leaves it disabled.
Enable Enables the DTR line when the device is opened and leaves it on
Handshake Enables DTR handshaking
o RTS (request-to-send) flow control
Specifies the RTS flow control. This member can be one of the following values.
o Disable Disables the RTS line when the device is opened and leaves it disabled.
o Enable Enables the RTS line when the device is opened and leaves it on.
o Handshake Enables RTS handshaking. The driver raises the RTS line when the "type-ahead" (input) buffer is less than one-half full and lowers the RTS line when the buffer is more than three-quarters full.
o Toggle Specifies that the RTS line will be high if bytes are available for transmission. After all buffered bytes have been sent, the RTS line will be low
285

MaxSea Professional Marine Software User Guide v10.3
PARITY
o Enable Parity Checking
Specifies whether parity checking is enabled. If this member is TRUE, parity checking is performed and errors are reported.
o Parity
Specifies the parity scheme to be used. This member can be one of the following values.
o Even
o Mark
o No Parity
o Odd
o Space
ERRORS
o Enable error replacement
o Specifies whether bytes received with parity errors are replaced with the character specified by the ErrorChar member. If this member is TRUE and the Parity member is TRUE, replacement occurs.
o Error Replacement character
o Specifies the value of the character used to replace bytes received with a parity error.
o Abort on error
o Specifies whether read and write operations are terminated if an error occurs. If this member is TRUE, the driver terminates all read and write operations with an error status if an error occurs.
Xon / Xoff
o Xon / Xoff out flow control
Specifies whether XON/XOFF flow control is used during transmission. If this member is TRUE, transmission stops when the XoffChar character is received and starts again when the XonChar character is received.
o Xon / Xoff in flow control
Specifies whether XON/XOFF flow control is used during reception. If this member is TRUE, the XoffChar character is sent when the input buffer comes within XoffLim bytes of being full, and the XonChar character is sent when the input buffer comes within XonLim bytes of being empty.
o Continue TX on error
Specifies whether transmission stops when the input buffer is full and the driver has transmitted the XoffChar character. If this member is TRUE, transmission continues after the input buffer has come within XoffLim bytes of being full and the driver has transmitted the XoffChar character to stop receiving bytes. If this member is FALSE, transmission does not continue until the input buffer is within XonLim bytes of being empty and the driver has transmitted the XonChar character to resume reception.
o Tx and Rx XON character
Specifies the value of the XON character for both transmission and reception.
o Tx and Rx XOFF character
Specifies the value of the XOFF character for both transmission and reception.
o Transmit XON threshold
Specifies the minimum number of bytes allowed in the input buffer before flow control is activated to inhibit the sender. Note that the sender may transmit characters after the flow control signal has been activated, so this value should never be zero. This assumes that either XON/XOFF, RTS, or DTR input flow control is specified in fInX, fRtsControl, or fDtrControl.
o Transmit XOFF threshold
Specifies the maximum number of bytes allowed in the input buffer before flow control is activated to allow transmission by the sender. This assumes that either XON/XOFF, RTS, or DTR input flow control is specified in fInX,fRtsControl, or fDtrControl. The maximum number
286
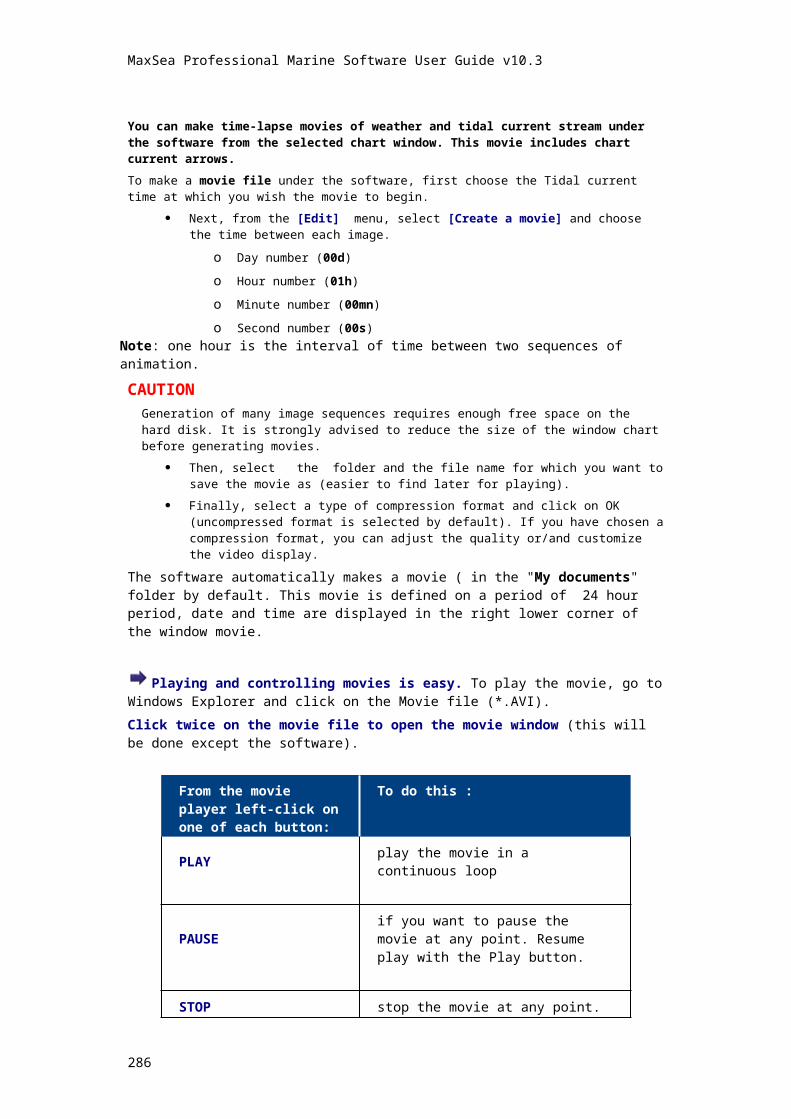
User Guide
of bytes allowed is calculated by subtracting this value from the size, in bytes, of the input buffer.
OTHERS
o Stop bits
Specifies the number of stop bits to be used. This member can be one of the following values.
- 1 Stop bit
- 1.5 Stop Bits
- 2 Stop bits
o Byte size
Specifies the number of bits in the bytes transmitted and received.
o Binary mode, no EOF check
Specifies whether binary mode is enabled. The Win32 API does not support non binary mode transfers, so this member should be TRUE. Using FALSE may not work.
o Enable null striping
Specifies whether null bytes are discarded. If this member is TRUE, null bytes are discarded when received.
o End of input character
Specifies the value of the character used to signal the end of data.
o Received event character
Specifies the value of the character used to signal an event.
IMPORTANT For Windows® XP and autopilot users
It is significant to configure MaxSea in the following way:
1. Select [Data Input/Output] from [Utilities] menu.
2. Select the serial port corresponding to this adapter.
3. Select the NMEA 0183 & Autopilot/Repeater norm
4. Click on the “Advanced settings…” button and click again on the “Advanced Com Settings” button.
5. Then select the [Handshake] option from the “DTR flow control type” pop-up menu
6. At least Click on OK to valid.
Configuration Preferences
Select [Data Input-Output Settings] from the [Utilities] menu or press [F4]
Select the [Preferences] tab :
Tolerance for positions
The position tolerance disregards implausible positions reported by the equipment.
If a position is different from the position previously received from a distance greater than the tolerance value, it is ignored.
NMEA / Autopilot Repeater
Frequency : determine the interval between 2 sending of chains towards the Autopilot
NMEA Talker: in NMEA 183, $--GLL $--RMC, etc. chains, the "--" will be replaced by the chosen prefix for the sending to Autopilot.
Geodetic datum
287

MaxSea Professional Marine Software User Guide v10.3
Electronic charts and GPS receivers generally use WGS 84 Geodetic Datum.
Meanwhile, if the charts are for example in Europe 50 geodesy and if your GPS does not recognize this geodesy or can not be modified for whatever reason, call up the Utilities menu and select With datum transformation.
Then, thanks to the corresponding menus, select the geodesy of the positioning device and the geodesy of the chart.
Note: as far as is possible, match the geodesy of your GPS receiver to that of your chart to avoid having different positions displayed on the GPS receiver and in MaxSea.
Echo
Repeat (without any process) all information arriving on a port, on this same port.
COG / SOG recalculation
This ratio is useful if in your Input-Output configuration, the speed and heading data are not selected on the master instrument for the position
The speed and heading data are essential for MaxSea working; so, it is necessary to computerize them (from the positions) when the master GPS receiver no longer supplies them.
It is recommended to leave this computing to be made as often as possible (every position = 1) and to increase the ratio according to the lack of precision of your master GPS receiver.
Backup / Restore configuration
Allows you to Backup or to Restore an input output configuration.
See Backup and restore configuration Chapter.
Network
Allows you to activate to receive or send data using the installed network.
See Network repeater Chapter.
Network Repeater function
You can configure MaxSea to be a data repeater for other PCs.
If you need to make run MaxSea on a PC network, please contact your reseller.
Warning the Network Repeater function do not double MaxSea data but repeats all input data on the server towards the clients and only for the textual norms.
The Network Repeater Configuration
menu [Utilities] : [Data Input-Output Settings] or [F4]
Preferences tab.
click on the Configure network button.
The Configure network repeater windows is opened:
You first have to choose the mode in which you want MaxSea to be configured:
Network repeater (1) Network listener (2) None (default configuration)
288
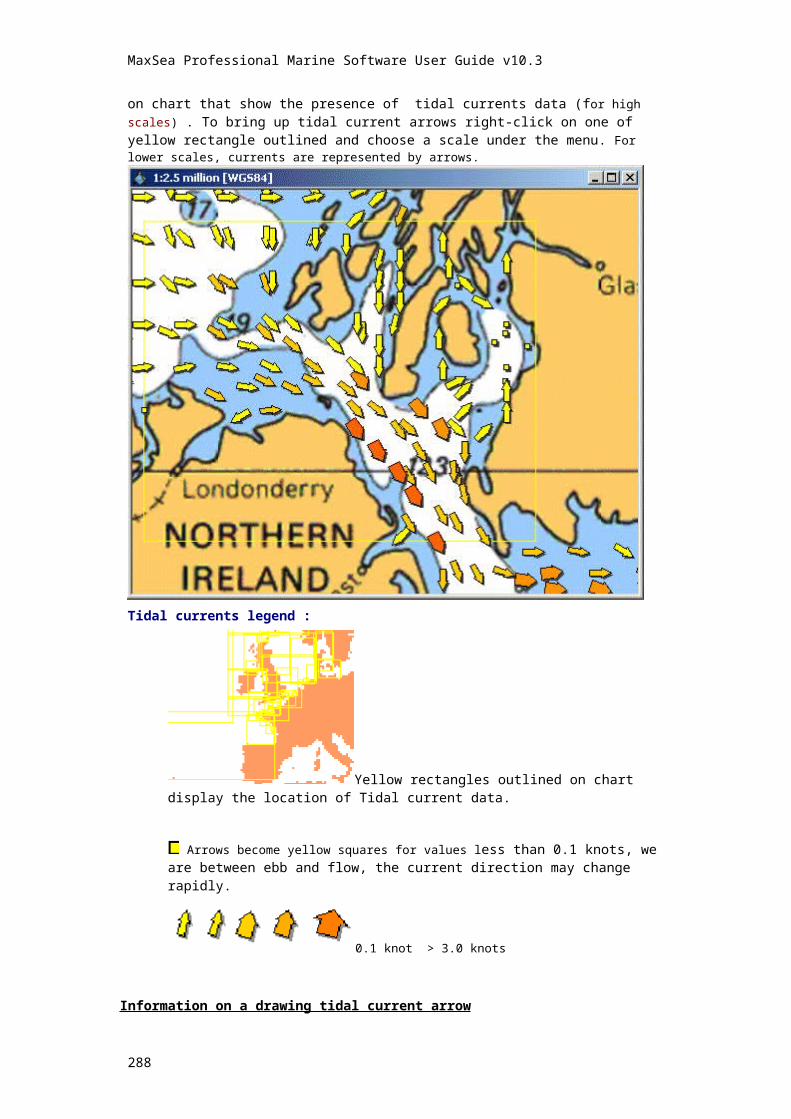
User Guide
Then, click on the Change settings button and follow instruction below, depending of your mode choice.
Mode Repeater:
After clicking Change setting button the Configure network repeater windows appears:
First, choose the protocol :
- TCP/IP
- UDP
If default configuration is not the good one you can change the IP port on which each COM has to repeat the information.
COM1 Repeat on TCP/IP 1001
COM2 Repeat on TCP/IP 1002
...
Mode Listener:
After clicking Change setting button the Configure network listener windows appears:
You just have to enter the network repeater address.
Backup and Restore configuration
With the Backup, you can create a duplicate copy of input/output configuration on your hard disk. If the original configuration is accidentally erased or modified, you can easily restore it from the disk by using the Restore function.
Select [Data Input-Output Settings] from the [Utilities] menu or press [F4]
Select the Preferences tab
Backup / Restore configuration
Backup
You can only backup one configuration.
289

MaxSea Professional Marine Software User Guide v10.3
Therefore, it is strongly recommended that you verify your configuration before backing it up. You risk writing over your backup with an invalid configuration otherwise.
After you verified your configuration, click on the Backup button.
CAUTIONThe backup configuration can not be changed .If you try to do a new backup an information dialog box is displayed saying : "The configuration has already been backed up, and cannot be erased. Contact you dealer if you really want to backup again."
Restore
You can restore the configuration previously saved at any time by clicking on the Restore button.
IMPORTANT The current configuration will be permanently replaced by the Backup configuration.
Note : Restoration of the default configuration is possible even if you erase your Input/Output preferences. (CTRL key during MaxSea's launch)
PC computer cable diagram
We invite you to always use an opto-isolator to protect against electrical noise. Refer to your dealer for installation.
Meanwhile, you will find information to directly link electronic equipment to your computer.
The serial ports on your computer, as well as those of the internal PCI board, comply with RS 232 type electrical characteristics; a standard generally used in marine electronics by most existing GPS receivers and equipment.
Consequently, the connection of a GPS receiver to the computer is generally limited to a 2-wire connection with a NMEA 183 output from the GPS receiver ( GPS ) to input (RxD) and ground (Gnd) pins of the computer.
IMPORTANT If your electronic equipment comply to RS 422 type electrical characteristics, you cannot use the following process; please contact your dealer. Nearly all manufacturers adhere to the RS 232 standard .
Connections at serial port of the computer:
9 Pin Type D Connector
290
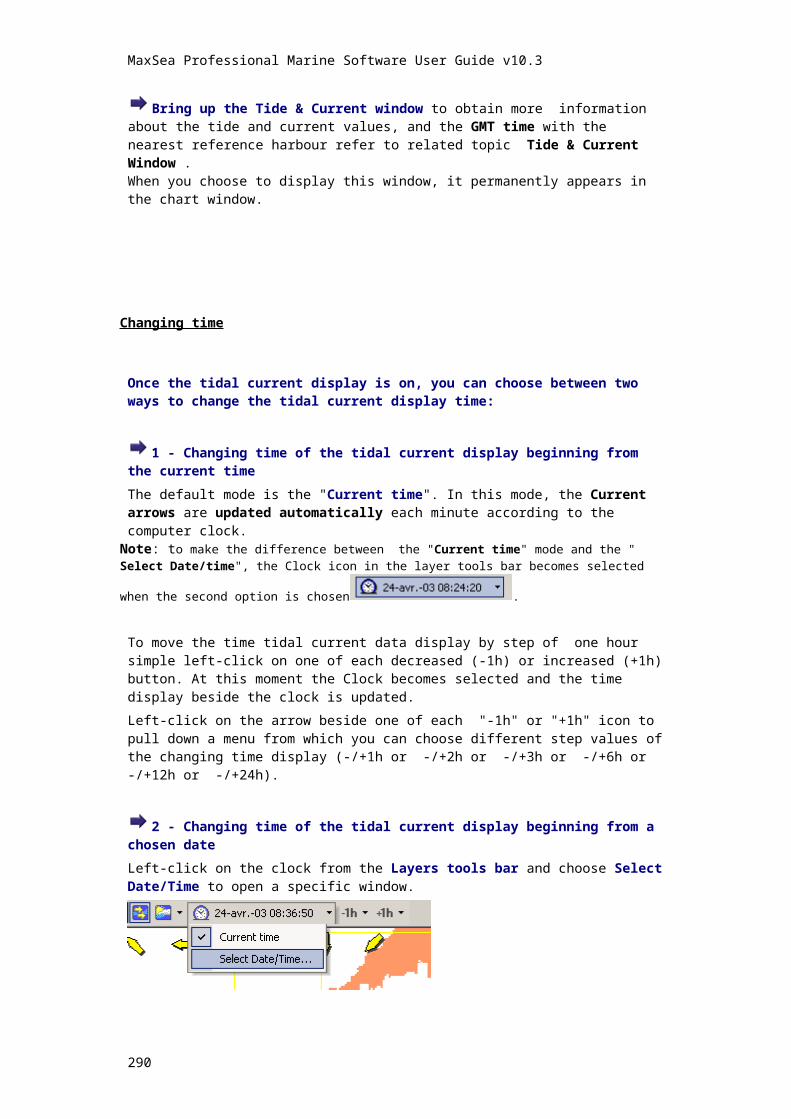
User Guide
Pin Signal Information
2 Data reception Rx Connection to GPS
3 Data transmission Tx
Connection to automatic pilot
5 Ground Gnd
25 Pin Type D Connector
Pin Signal Information
2 Data transmission Tx
Connection to automatic pilot
3 Data reception Rx Connection to GPS
7 Ground Gnd
Problems with ground loops
On certain ships which have multiple interfaces, there can exist electrical phenomena called ground loops. In fact, certain devices may have masses which are at different potentials.
Take the example of a GPS connected in parallel to a computer and a radar. The simple fact of connecting the GPS to the radar and the computer can disturb output signals (mass reference different between the 3 devices). An extraneous current may result which prevents correct reading of NMEA chains on the computer.
Temporary solution
Connect only the TxD equipment wire and not the Gnd (Ground) wire to the computer’s serial port.
Permanent solution
First, isolate the computers power supply using a converter with galvanic isolation (isolation of the negative pole of the battery with the reference mass of the computer).
Then opto-couple serial links between the computer and all connected electronic equipment (contact your dealer).
291

MaxSea Professional Marine Software User Guide v10.3
An opto-isolator, also known as an optical coupler or optocoupler, is a semiconductor device that allows signals to be transferred between circuits or systems, while keeping those circuits or systems electrically isolated from each other.
GPS opto isolation:
Installing the cartography
Installing charts on the hard drive
As a hard drive is much faster than a CD-ROM drive, using an installed catalog will increase the speed of chart manipulations (opening, scrolling…). An installed catalog allows you to use several regions at the same time, even if you have only one CD-ROM drive.
With installed catalogs, you can work without your CD-ROM. All the charts are kept inside your computer, and your CD-ROM drive is free for other uses.
To install Mapmedia, Maptech chart Pack, a Maptech chart Kit or a ARCS CD-ROM on the hard disk :
First create a new folder for example named "charts" on one of your hard disks root for example on "C:\" disk or in the folder "My documents".
Then copy all the chart files in it.
To install a C-Map CD-ROM, FULLY copy the CM93 directory of your CD-ROM on your hard disk root.
The software now can automatically detect the cartography situated on C:\ charts\.
Then, refer to each topics to install:
1. Mapmedia raster charts
2. 3D Mapmedia charts
3. C-MAP NT charts
4. C-MAP NT charts via PCMCIA
5. S57 Mapmedia vector charts
6. Arcs seafarer charts
7. C-MAP CM93ed2 vector charts
8. C-MAP CM93ed3 vector charts
9. Vector charts S57 compatible
Table of chart compatibility
Software v10.1.x Win98 SE Win ME Win 2000 Win XPWin NT &
292
User Guide
Win95
MapMedia OK OK OK OK
not
supported
BSB OK OK OK OK
ARCS OK OK OK OK
PCMCIA NT OK* OK* OK* OK*
C-Card NT Printer reader OK** OK** NO NO
C-Card NT USB reader OK* OK* OK* OK*
C-Map NT PC release 2.0 OK OK OK OK
C-Map NT PC release 3.0 OK OK OK OK
CM93 Ed2 OK OK OK OK
CM93 Ed3 NO NO OK OK
Note:(*) CMapDriversSetup100.exe is needed before plugging the PCMCIA into the system and is installed during the MaxSea installation(**) PPIDriver installation delivered with MaxSea CD (directory TOOLS)
When upgraded your system from Win98, ME to 2000 or XP you must change your C-Card NT Printer reader to a C-Card NT USB reader.
MAPmedia
How to install Mapmedia raster charts
Before installing your Mapmedia CD-ROM, check the following two points:
• If you are using a hardware key, check that it is correctly connected to the computer (see the Installation chapter).
• check that the MapmediaConfig software is in the MaxSea Utilities folder
(reinstall MaxSea if necessary as indicated in the Installation chapter).
Enter codes
You have to launch the MapmediaConfig software located in the MaxSea Utilities.
Either select "MapmediaConfig" in the "MaxSea Utilities" folder from the Program group in the Start menu.
Or directly from the [File] menu select [Mapmedia User Permits...]. Then click the Chart's codes to call up the following dialog box which allows you to enter Mapmedia charts codes without quitting the software .
293

MaxSea Professional Marine Software User Guide v10.3
1. Click in each text area to enter all unlocked codes
2. Use the [TAB] key on the keyboard to move from one zone to another.
3. Once you have entered and checked all the codes, click OK to confirm the configuration.
Enter Mapmedia 3D codes
If you have a hardware key, first check that the hardware key is correctly connected to the computer (see chapter Installing on a PC),
Go to [File] menu and select [Mapmedia User permits...]
This brings up a window in which you have to choose the "3D chart" under options menu.
Then enter your codesNote: If your configuration requires several codes, enter one by one your codes and click on Add repeat and do again for each codes you have.
1. Once all the codes entered, you can verify your list codes which is displayed on the right frame of the window.
2. To delete or to correct code, just select the wrong code and select the Erase touch of your keyboard.
3. Then type again the code and click on OK to valid your codes in the software definitively.
How to install Vector S57 charts using the MAPmedia CD ROM
The user receives a CD containing a geographic zone which is delivered with the CD ROM MaxSea marine software .
Insert, the MAPmedia CD ROM . After a short while, the dialog box to install the S57 vector charts appears:
294

User Guide
Click on "Start Install" to launch the installation.
In case your hard drive has not enough free memory to contain the whole CD-ROM, a message will warn you about it.
Then, choose the path where you want to copy all the "Vector / S57" charts (NOAA charts).
Cartography must be copied onto the hard disk. It is advised to copy the data base to the hard disk, to improve the access speed. However, for old computers having little disk space, it is possible to work directly on the CD.
The database is now installed and so it becomes accessible in MaxSea.
BSB
Installing a BSB CD-ROM on your hard disk
As a hard drive is much faster than a CD-ROM drive, using an installed catalog will increase the speed of chart manipulations (opening, scrolling).
An installed catalog allows you to use several regions at the same time, even if you have only one CD-ROM drive.
With an installed catalog, you can work without your BSB CD-ROM. All the charts are kept inside your computer, and your CD-ROM drive is free for other uses.
295

MaxSea Professional Marine Software User Guide v10.3
To install a BSB chart catalog on your hard disk, you will have to use the windows explorer.
You want to install the whole CD-ROM (all the charts) onto your hard disk
First, make sure that your hard drive has enough free memory to contain the whole CD-ROM. Then:
• create a new folder, that will contain your installed catalog
• drag the CD-ROM to this folder
To open your installed catalog, you will have, as previously, to select the folder "BSBCHARTS" located in your new folder, and choose a .kap file.
You want to install only a part of the CD-ROM
For example, you want to install 2 charts, corresponding to the area you’re using to navigate.
Take note of the identification number of charts you want to install.
In our example, 11385_1 and 11388_1
On your hard disk, create a new folder, that will contain your installed catalog and copy the 11385_1.kap and 11388_1.kap from the "BSBCHART" folder of the CD-ROM to your new hard drive’s folder.
To open your installed catalog, select the new folder and click on a .kap file.
ARCS & Seafarer
ARCS & SeaFarer charts installation
IMPORTANT
Look after your CD-ROMs, cleaning them when necessary with a product designed specifically for this purpose.
A dirty CD-ROM may lead to the malfunctioning of MaxSea and/or the system software.
This manual is intended to help you to install ARCS and SeaFarer charts for use with MaxSea.
If you have already ordered ARCS charts from British Admiralty (UKHO), you have received a Navigator or Skipper user guide. We recommend you to read this guide before installing charts. This guide will make you familiar with ARCS terms and concepts.
You can buy ARCS charts according to two different kinds of licenses: Skipper and Navigator. SeaFarer charts are sold according two licenses : Chart and Update. This manual is about all licenses, when differences occurs, they are indicated.
296

User Guide
Essential information
Contents of the received package
You should have received from the UKHO / AUSHO:
• 1 or more Chart CD ROMs, containing charts
• 1 Update CD containing the latest ARCS chart corrections. SeaFarer charts may not include update CD.
• 1 floppy disc containing the License and chart permits
You should have received from Informatique et Mer:
• MaxSea software
• ARCS&SeaFarerConfig software, located in the ARCS&SeaFarer folder along MaxSea software
• 1 User Permit number (needed to order charts)
• 1 PIN number (the same for all MaxSea users : "1234")
Chart permits, license, installation
Before using ARCS / SeaFarer charts, you have to install the chart license and chart permits provided by the HO. Charts and Updates you have permits for will be automatically copied to your hard disk. The software needs to have access to the Update CD and Chart CD.
Each chart permit is a text sentence, of encrypted hexadecimal codes.
Before continuing, be sure you have the License floppy disk and Update and Chart CD provided by the HO.
The Arcs&SeaFarerConfig software can be accessed from the Windows start menu : Start / Programs / MaxSea Utilities.
The first time you launch ARCS&SeaFarerConfig, a dialog box will ask you to provide your license.
297

MaxSea Professional Marine Software User Guide v10.3
Insert the floppy disk that contains your license and open the GB.LCN or AUS.LCN file.
A dialog box asks you to provide your UPDATE CD (or SeaFarer CHART CD if no update CD provided).
Insert the required CDs. The software will automatically detect the CD insertion and read the needed information from the CD, so you have no button to press, just insert the required CDs. You will be asked to insert :
1. UPDATE CD (if not present, use SeaFarer Chart CD).
2. One or more charts CDs (ARCS RC1..RC11)
3. again the same UPDATE CD (if no updates needs to be installed, the update CD will not be required).
Please insert each CD when required, chart CD and UPDATE CD.
298

User Guide
A progress dialog will be displayed while the charts are installed or updated.
Once the installation is finished, the license and permit window is displayed. Quit using File/Quit menu.
C-MAP NT
Via C-Card reader PCMCIA
Material Configuration
Windows 95/98 (the module does not work under Windows NT)
Screen configuration in 65,000 colors at least, 16 million colors or genuine colors
C-Card reader or PCMCIA reader
Note : the C-Map NT charts can not be considered as real vectorial charts for they do not have the same "interactive" functions as the C-Map CM93 charts.
Connecting the C-MAP NT Cartridge Reader
C-Card
No installation is required for using C-Card cartridges. Just connect the cartridge reader with the printer port (behind the Dongle). The reader is then ready for use.
PCMCIA
First, install the PCMCIA reader's driver supplied with the reader
Then install the PCMCIA C-MAP cards' driver supplied by C-MAP.
Via CD-Rom
299
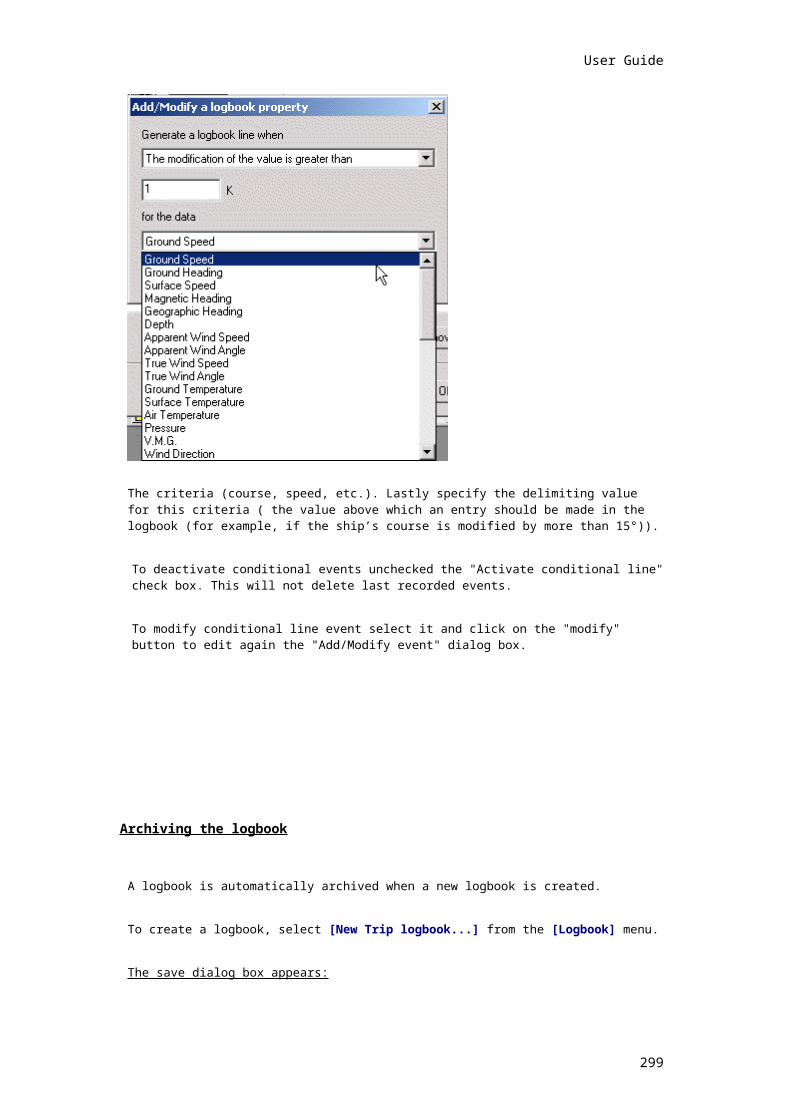
MaxSea Professional Marine Software User Guide v10.3
NTPC Selector access
In this chapter, you will learn how to obtain your own access rights to the C-Map NT cartography via the CD-ROM.
CAUTION : the C-Map charts are only available on PC computers
Before starting, you have to install the C-MAP NT Selector software from the C-MAP NT/PC CD.
1. Insert the CMAP NT/PC Chart Selector vol1 CD-ROM,
2. From the Windows Start Bar, click Run and the following dialog box appears:
3. Then click on the Browse button to access to the CD-ROM,
4. Select the NTCSelectorSetup folder,
5. At last click on Setup, The setup program prompts you through the installation process.
6. Follow the instructions on the screen.
This software is designed to control the access (or extend an existing access) to C-Map charts. You will select geographical areas for which you wish to obtain available charts in MaxSea. The program will connect you on the C-MAP WEB SITE and will generate a user’s code by Email.
IMPORTANT For cards on CD it is necessary in advance to install them and to order licenses.
Two cases appear then, corresponding to the two versions of the NTPCSELECTOR software:
If you have NT PC v2: all the licenses are stored on the HardDisk. Install NTPCselector and your software and before ordering C-Map NT charts launch your software.
If you have NT PC v3: all the licenses are stored on the HardDisk or on the Dongle if this one is connected.
Starting up C-MAP NT Selector software
From the [Start] menu, select [Programs], choose the C-MAP NT PC Selector folder, and then select "C-MAP NT Selector".
When you first start C-MAP NT Selector, a window appears and consists in three parts:
The Chart Catalog
The Charts selected from MAP
The MAP view window located in the right-hand of the window . Note: For Help on an item, click at the top of the dialog box on the Help button.
To order a C-MAP NTPC code
300

User Guide
1. First you have to select a zone area into the MAP window.
2. The charts selected are surrounded by a red line.
3. The charts name appears in the "Charts selected from Map" window like in the following example:
4. After choosing charts, click on the "buy selected chart" button. Then the charts are added in the "Shopping Cart".
5. To see all your order before buying online, click on the "Shopping Cart" button.
6. To order charts click on the "Shopping Online" button. Then follow the instructions on the screen.
Note: for more information about the C-MAP NT PC Selector software refer you to the Help menu.
Insert Chart License
The Chart License Codes are sent to you after you have provided the Chart License Code Request for each NT/PC Chart you want to purchase. The Chart License Codes unlock the purchased NT/PC Charts and cannot work on other computers. If you reinstall your operating system you will be able to use the same codes. If you perform a hardware change you will have to contact C-MAP to obtain new Chart License Codes.
The C-MAP Operator will provide a Chart License Code to unlock the purchased chart.
Click on the "Insert Chart Licence" button on the top of the "Call Center Window". The "Shopping Cart" window will be displayed.
Insert the provided Chart License Code in the "Chart Licence" field at the bottom of the "Shopping Cart" window.
301

MaxSea Professional Marine Software User Guide v10.3
Click on the "Register" Button to register.
Setting the registration
Before Order charts you have to set the registration:
Click on the Settings Button
Set the source path (CD Data Path)
Set the path where you want to save the selected charts (Target Application Path).Note: the selected charts will be saved in the destination path folder.
Backup Registration Information
This button opens a "File Save as..." dialog box for you to choose a path and save the NT/PC Chart License Code information. It is very important that you backup this data on a blank, newly formatted Floppy Disk and safely guard it in case of an Operating System Crash or a total system reinstallation.
It is highly recommended that you perform a Backup, on a new blank floppy disk, to store the data in a safe place every time you purchase an NT/PC Chart.
Note that whenever you purchase a new NT/PC Chart, the Backup Procedure will start.
Restore Registration Information
To restore previously saved purchased NT/PC Chart License Code information you must insert the floppy disk where you have previously saved the data.
C-MAP CM93 v2
C-Map Access
In this chapter, you will be told how to obtain licenses for C-Map charts.
This software is designed to control the access (or extend an existing access) to C-Map charts. You will select geographical areas for which you wish to obtain available charts in MaxSea. This selection will generate a user’s code,
302

User Guide
which you will send to your C-Map retailer. They will send an unlock code back to you to so that you can access the charts in MaxSea.
Starting up the software
Insert your C-Map CD-ROM into the CD reader and click on C-Map Access.
Under [Windows] click [Programs], point to [Maxsea Utilities], click [C-MapEd2Access]
The following dialog box appears :
Select either areas, or zones (i.e. groups of areas).
Zone or area selection
Following the previous step, you can select a list of zones (or areas). This selection can be achieved in two different ways :
By clicking on boxes to be ticked off in the zone (or area) list,
By selecting the required zones (or areas) on the planisphere.
303

MaxSea Professional Marine Software User Guide v10.3
Note : This selection appears in the following way : a tick appears in front of the selected zones (or areas) in the list, and said zones (or areas) are prominently indicated geographically by means of hachures on the planisphere.
User code generation
Once the selection has been made, just generate a "User Code".
To do so, you have to click on the button "Generate User Code". A confirmation dialogue will appear, providing the list of the selected zones (or areas).
304
User Guide
Then, click " OK".
After a few-second wait, the generated user code appears :
Caution: You have to send this User code to your C-Map retailer to obtain your "Auth Code" in return.
Auth Code entry
Start with the C-Map Access program.
305
MaxSea Professional Marine Software User Guide v10.3
Click on the "Enter Auth Code" button .A dialogue appears, in which entry of this "Auth Code" is needed.
MaxSea is now ready to use your C-Map charts on CD, with your own access rights.
C-MAP CM93 v3
How to install the vector charts CM93v3
CM93 v3 is an evolution of the library CM93 v2. The main difference with the library v2 is its compatibility with the S57 / S52 format, the new international standard of the hydrographic services for the electronic charts production.
306

User Guide
The Vector S57 difference between S52 is that lighthouses representation are in the standard form (50 pixels height with a cone and a colored circle), probes are in police verdana 12, and colors are corresponding to the S52 standard.
If you want to read S57 charts produced by other companies than C-Map in particular by national hydrographic services; so allowing to use official charts... you have to convert them before Refer you to " Convert S57 vector data files " chapter
The user can choose the display of his charts either with or without lighthouses, with or without names, with or without lines of probes, …
Refer to Installing CM93 v3 vector charts
Vector charts installation process
The user receives a CD containing a geographic zone, ordered from C-Map commercial services or more simply from his distributor .
He can then insert the CD. Cartography can be used from the CD or copied onto the hard disk. It is advised to copy the data base to the hard disk, to improve the access speed and thus display of charts. However, for old computers having little disk space, it is possible to work directly on the CD.
This operation can be done with Windows explorer as well as with the application "GDB Admin" described below.
Reference the CM93 v3 cartography to make it accessible :
Select [Manage CM93ed3 & S57 charts] under [File]menu, a window is displayed and allows to manage CM93 v3 and S57 databases.
Then click on the "Databases manager" button.
Then the "CM93/3 database Administrator" dialog box appears and allows you to Reference the base and assign it by default.
Select the database which you wish to reference in the right-hand window as it's shown above (the "WORLD" is the C-MAP database by default). To display more details you have
to order C-Map licenses Licences order
Note: if you don't have ordered licenses the Register Database button is not available.
Click on the " Register Database " button to valid.
The available database which appears in the left window is checked with one green mark on his left.
307

MaxSea Professional Marine Software User Guide v10.3
Click on the "Copy Database to HD" to save all the database on your hard disk
RemarksThis World database is automatically assigned by default, but if you want to assign the S57 vector charts you can change the default database by selecting the database in the left window and then
click on " Set as default ".
The selected database is assigned by default, this is shown by the green mark.
The database referenced but not assigned by default is displayed with a red mark.
You should use this utility for cancel or to update databases, what can be useful if you wish to abolish a database for example.
The CMap93 v3 library allows to read files in the S57 format, new hydrographic services standard. But the software can not however read directly charts in this format; it is necessary to convert them before reading.
Refer to paragraph Convert Files S57.
IMPORTANTThe possible problems are bound to incoherence of the database you want to reference or assign by default. Then "Bad Data" box appear, which can have two previous history:
If you select a database in the right window and what you try to reference it, the message appears if the base is not valid. It is necessary to use a new CD either to redo the copy or to contact again C-Map.
If you select a database in the left window and you try to assign it by default, the message appears if the base is not valid any more. It is thus that you have erase this base of your disc or that you removed the CD. It is necessary to put it back to the initial place or better, to do" Unregister Database " then to reference this one.
Licences Installation process
The installation process is automatic :
Select [Manage CM93ed3 & S57] from the [File] menu
Click on the "License order..." button to display the "LicenseAdmin" dialog box.
308

User Guide
Then C-Map returns :
A FILE
Choose " Add License from file ".
A new dialog box appears suggesting you to select the file you just received, so click OK, the license is automatically installed. The installed Licenses appears in the right window as below .
select the receive file and click on OK.
A NUMBER
Choose " Add License manually ".
A new dialog box appears suggesting you to enter the number you just received, so click OK, the license is automatically installed. Licenses installed appear in the right window.
Add a license manually.
Troubleshooting You should choose the file returned by C-Map, so that the installation of licenses from a file
works.
309

MaxSea Professional Marine Software User Guide v10.3
During the addition of the licenses whether it is by file or manually, the operation will not work if you have reinstalled your system. Indeed, licenses are delivered for a UNIQUE System PC / MaxSea .
configuration /Installation
Data Base you referenced before placing your order should be localized at the same place as it was during the order.
If you encounter problem using file, please open it with the "NotePad" and copy the license using "Add License Manually" be careful you have selected the right zones.
The software launches a process which allows the licenses verification. If it finds a previous installation the following message appears: "A PREVIOUS INSTALLATION OF THE CMAP93 MODULE HAS BEEN FOUND. WOULD YOU LIKE TO OVERWRITE IT AND THEN LOOSE ALL YOUR LICENSES?". You have to valid this option, only in the case you want to delete all your previous licenses.
A next message appears to confirm your choice : "YOU ARE ABOUT TO REMOVE YOUR S57 LICENSES AND DATA FROM PREVIOUS INSTALLATION. CHOOSE OK TO CONTINUE"
A failure appears when you install the licence number, please verify the "cipher strength" from internet explorer. select first from the [Help] menu of Internet Explorer, the option [About Internet Explorer] and the cipher number must be equal to 128-bit. If this number is lower than 128-bit please click on the nearest Update Information button to update
Licenses order process
To view detailed C-Map CM93ed3 charts, you have to order and to install from C-Map Norway.
Start " LicenseAdm " utility since the [File] menu and select [Manage CM93ed3 & S57]
Click on [ License order ]. Select the zone / area to order by double click in the central frame (they appear in
the right frame). Check the Subscription box to get license for a while. Un-check the Subscription box to purchase the license. Click on Save Order to valid your order. Then Click on No to select your own path.
Finally you should send to C-Map [email protected] accompanied with:
The user.usr file created during the installation of the module.
The InfoMerFRxxxx.usr file created during the licence order operating.
By default the [user.usr] is generated in the folder : [Program files / CM93_Ed3 & S57 / ]
Then C- Map will send you back a license file. See The Licenses installation process
IMPORTANT Every license is unique for a system and one software installation. This means that if you
reinstall your system, you will lose all your licenses.
310

User Guide
The function " Add Dataset " requires Dataset's valid name, if need be an error message appears.
Updating vector charts
To update vector charts go to [file], then select [Manage CM93ed3 & S57 charts], this brings up the dialog box.
Click on the "Update databases" button to bring up the "Choose update type" dialog box which presents two options :
1 - Updating from a file
Select "Generate update file order" to update to C-MAP.
C-Map will send a file: [Order.ord], this file can be imported from the "My Documents" folder.
Check the "Update using received file" radio button.
Click on Next to continue.
Then select the update received file path using the Browse button.
The "Finish " button becomes active. Click on it to valid the update.
2 - Updating from a Network transfer:
Check the [Update via the network (internet)] radio button.
Click on the Next button to continue.
The software informs you that this may take several minutes and you have to confirm if you want to continue.
To continue the network transfer click on the "Next" button and a new dialog box appears:
311

MaxSea Professional Marine Software User Guide v10.3
Get information about the size of the file before downloading (in case the size is too large, you can cancel the network transfer). Click on the "Get Update Size..." button.
click on the "Get Update..." button to download the updated file .
When the network transfer is finished, click on the "Finish" button.
IMPORTANT
In case the "Unable to initialize the default database " message appears in the location of the connection status, it means that the selected database is not available in the C-Map database.
1. The software is unable to continue the process. To continue click on Cancel .
2. Select the corresponding C-Map database as the default database. For more informations see the "Installation CM93 v3 & S57 vector charts" chapter.
3. Launch the network transfer again.
S57 vector charts
S57 vector charts
You can also read S57 vector charts produced by other companies than C-Map in particular by national hydrographic services; so allowing to use official charts...
The user can choose the display of his charts either with or without lighthouses, with or without names, with or without lines of probes, …The S57 vector charts informations become priority at the display.
Before reading the S57 vector charts in the software you have to:
Convert S57 vector charts data files You can also install S57 vector charts provided by :
C-Map CM93 v3
MAPmedia vector charts
312

User Guide
Convert S57 vector charts data files
MaxSea must convert S57 charts before loading and displaying them.
This can be done within MaxSea :
1. Select [Manage CM93_Ed3 & S57] from the [File] menu. This brings up the "C-Map management" dialog box.
2. Click on the "Import S57 data..." button, the following dialog box appears:
Converter of data S57 in the CM93 v3 format ( MaxSea).
Then follow one by one each steps :
1. Select the base folder which you want to convert in the left window:
2. Enter two capitals identifying the data produced by the corresponding hydrographic service in
" GeoDatabase name " (NOrway, RUssia, FRance, GB).
3. Check the "Turn Off Error Report" box.
4. Click on " Execute " to convert the file.
5. The present converted file appears in the right window, and a message informs you about the successful or the failure of the conversion.
What are the available features between CM93 v2 & CM93 v3?
The available features in MaxSea are similar to those already available for CM93 v2 charts.
However, two major features have been added:
CM93 v3 display with the international standard ECDIS S52 of representation of the data.
313

MaxSea Professional Marine Software User Guide v10.3
Ability to read S57 charts , after converting them without a loss of data. All installed data is displayed, with the S57data showing over the CM93v3 charts.
Utilities
Customer Services
On-line services allow you to reach in last ones information. You can open and download at any time the information which you need without having to leave software.
For more information, do not hesitate to consult at any time MaxSea [HELP] menu :
To open MaxSea help software, choose [User Guide] or click directly on F1
To show / hide help software at the next start up. Choose [Display user guide at startup].
To access to the most common of [Troubleshooting...].
To subscribe to our services by [Register my Email address..] item.
To show / hide the registration form at the next start up. Choose [Display my registration at startup].
To access to MaxSea Web site. Choose [maxsea.com...].
To obtain the distributors list. Choose [Dealers.com...].
To access to the weather services Web site. Choose [navcenter.com...].
To access to MAPmedia Web site. Choose [mapmedia.com...].
To show information about the software. Choose [About].
Software User Guide
Overview
The Help Viewer provides an integrated table of contents, an index, and a full-text search feature so you can find information easily. Book icons open to reveal topic entries and sub-books. The Help Viewer has the added benefit of allowing you to see the table of contents, index, or search results at the same time you are viewing a Help topic. This orients you within the Help system and allows you to see all of the other applicable Help topics at a glance.
Three ways to open the Help software
1. Directly from the Installer program, to do it you have to click on HOW TO INSTALL THE SOFTWARE Button .
2. From your MaxSea software to select [User Guide] from the [Help] menu or directly click on F1 key.
3. From the [Start] windows menu, select [Programs] > [MaxSea Utilities] > [User Guide].
Topics are marked as new with a red asterisk.
To find a Help topic
314

User Guide
In the Help Viewer, click one of the following tabs:
Contents tabTo browse through the table of contents, click the Contents tab. Double-click the book icons to reveal topic entries and sub-books.Click a table of contents entry to display the corresponding topic.
Index tabTo see a list of index entries, click the Index tab, and then either type a word or scroll through the list. Topics are often indexed under more than one entry.Double-click an index entry to display the corresponding topic.
Search tabTo locate every occurrence of a word or phrase, click the Search tab, type the word or phrase for which you want to search, and then click List Topics. See Find it fast for more information about refining and narrowing your search.Double-click a search results entry to display the corresponding topic.Three options allow to search into : search previous results, match similar words (checked by default) and search titles only.
Favorites tabTo bookmark a topic, use the Contents, Index, or Search tabs to locate and then display a topic. Click the Favorites tab, and then click Add to save the topic title to the Topics list.Double-click a bookmark in the Topics list to quickly display the topic.
Glossary tabTo find a term in the glossary, click the term and then the definition appears in the frame bellow.
Print help software:
To print the User Guide you need Microsoft Word 97 or greater.
To print a help topic Right-click the topic you want to print, and then click Print.
To print all topics within a book, on the Contents tab, select the book. On the Help toolbar, click Options, click Print, and then click Print the selected heading and all subtopics.
To print all the Help manual references: under [Windows] click [Programs], point to [Maxsea Utilities], click [UserGuide.doc] to open the document.
Keyboard shortcuts
Using the Palette
The palettes are accessed with the right and the left buttons of your mouse.
Single-Left Mouse Click to Select
Any time you want to select a tool,simply place the cursor over the tool,and then use
the left button one time. You have now selected this tool,and you ’ll see that the cursor
looks like the tool you ’ve selected.
Double-Left Mouse Click to Delete
If you double-left-click over a given tool you will erase whatever it is you have been
315

MaxSea Professional Marine Software User Guide v10.3
using that tool to work on. If you mess up —and for us that happens a lot —this is an easy
way to get a clean chart from which to start over.
Right-Click Mouse to Choose the palette configuration
Right-click any tool in the palette brings up the context menu which allows you to change the button display size, degrees of opacity and the text labels display.
Accessibility MaxSea usual functions keyboard shortcuts
Press on the keyboard To
Ctrl + O Open file in MaxSea
Ctrl + S Save the current file
Ctrl + W Close a file from MaxSea
Ctrl + P Print
Ctrl + A Select all object from the current file
Ctrl + X Delete a selected object from the current file
Ctrl + C Copy a selected object from the current file
Ctrl + V Paste a selected object from the current file
Accessibility MaxSea Options keyboard shortcuts
Press the keyboard: To:
F1 Access to the User Guide
F2 Activate the Zoom In function
F3 Activate the Zoom Out function
F4 Activate the Center On/Off function
F5 Activate the Track On/Off function
F6 Create a logbook entry
F7 Select the next Waypoint
F8 Select the previous Waypoint
F9 Display Tide Height On/Off
F10 Display Tidal Current On/Off
F11 Display Weather On/Off
F12 Activate the Man Overboard function
Shift +F1 Select tool (switch between tools: zoom, Pan, Divider, Bearing Planning route, Active route, Add, Insert, Delete, Split)
Shift +F2 Switch Day/Dusk/Night
Shift +F4 Switch NorthUp/CourseUp/LegUp
Shift +F5 Activate the PBG On/Off function
316
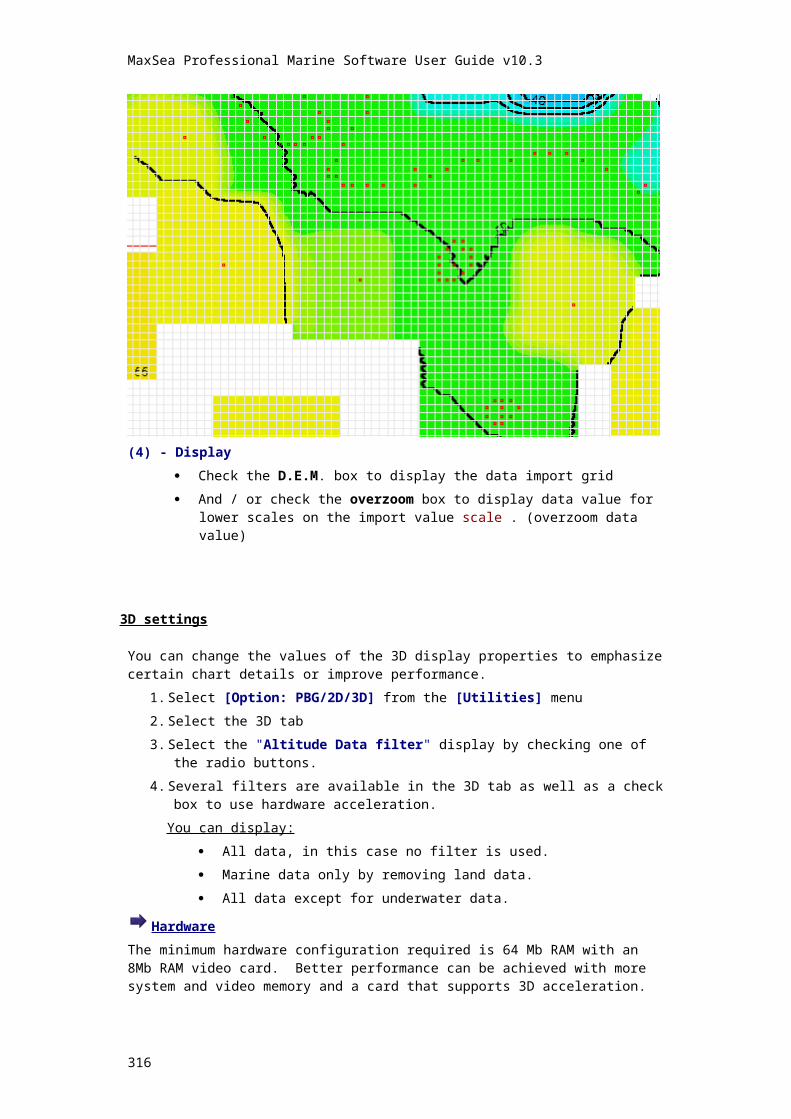
User Guide
Shift +F6 Plot an Event
Shift +F7 Activate the automatic Event On/Off function
Shift +F9 Display the Profile On/Off
Shift +F10 Display 2D On/Off
Shift +F11 Display 3D On/Off
Shift +F12 Display Radar Overlay On/Off
Right/Left/Up/Down Arrows
scroll chart function (only available if the active window is the Chart window)
The + and - Zoom in or zoom out (only available if the active window is the Chart window)
Accessibility Windows Options keyboard shortcuts
Press on the keyboard
To:
Alt Activate the menu bar of MaxSea software with out using the mouse, only available if the active window is the Chart window.
Activate the moving function in a active window.
Then use the keyboard Arrows.
RIGHT ARROW Open the next menu to the right, or open submenu * or move to the next right cell.
LEFT ARROW Open the next menu to the left, or close a submenu * or move to the next left cell.
UP ARROW Move up in the menu * or move to the next upper cell.
DOWN ARROW Move down in the menu * or move to the next down cell.
(*) in case the Alt keyboard is selected then use the Arrows keyboard to move in the menu bar.
Troubleshooting
Troubleshooting
Occasional problems may occur during installation or use of the software. Here is a list of common issues and their solutions.
1. PROBLEM: Can not open a serial port
2. PROBLEM: Serial port conflicts
3. PROBLEM: Unable to find a hardware key nor License
4. PROBLEM: 24 bits display settings is not appropriate
5. How to reinitialize the software settings
317

MaxSea Professional Marine Software User Guide v10.3
6. INFORMATION: Warning and Error messages search engine This link is only available for Microsoft Internet Explorer 6.
7. Using the Search engine of the help software to find a Message Error number
Software license protection
Running the software without Dongle
When can this window appear?
After having answered "Yes" when the software cannot find a software License protection or a Dongle.
What to do?
Answer "I want to continue, I DO NOT NEED A HARDWARE KEY" :
o Yes if your software version does not require a Hardware key ( version without Dongle ).
o Or Yes you wish to activate your software automatically or manually.
o What happens when you choose this option...?
Answer "I have forgotten to connect the Dongle... ":
318

User Guide
If during the installation or during the start up, you disconnected or forgot to connect your hardware key.
o What happens when you choose this option...?
The application ends automatically to allow you to connect your key.
Unable to find a hardware key nor License
When can this window appear?
When starting the application. During the execution (in case neither a software or hardware key is found).
Cause of appearance of this window:
No license key was found
What to do?
Answer "YES":
o If it is the first time starting MaxSea.
o Or If you are running a version without a hardware key
o If you forgot to connect your hardware key
o Or If you wish to activate your software with a software key
What happens when you choose this option?
Answer "NO":
o If your hardware key seems correctly connected.
o If you lost your key.
o If you wish to generate a temporary license to continue to use software for lack of hardware key
What happens when you choose this option?
319

MaxSea Professional Marine Software User Guide v10.3
Choose the activation method
When can this window appear?
Directly following activating software window.
Cause of appearance of this window:
Obligation to choose a method of activation.
What to do?
Answer " I want to use Manual Activation ":
If you do not have an Internet access or access to email on this PC.
Or If you received your code of activation by email or through your distributor.
Or If you wish communicate your computer identification code (Site Codes) to your distributor.
What happens when you choose this option?
Answer " I want to use automatic activation ":
If you have internet access or access to email on this PC.
What happens when you choose this option?
Manual activation
320

User Guide
When can this window appear?
If you chose the manual activation method in the window method choice.
If the generation of a temporary license failed.
Cause of appearance of this window:
Program requires the activation code (Site Key) that corresponds to the identification codes (Site Codes).
What to do?
Enter your activation code (Site Key) for validation by clicking "OK".
What happens when you choose this option?
If your code is correct, you will be informed about the success and the program will continue normally.
Otherwise, it will ask you of re-enter your code.
OR
If you do not know your Site Key and which you do not have a connection to the internet, get in touch with your dealer with the following information:
Your Site Codes (to see image above)
Your serial number
They will provide an activation key (Site Key) to enter into this box and to confirm.
NB: This is the same with both temporary and permanent licenses.
OR
If you wish validate your activation later or if you made a mistake during previous choice, you can click "Cancel".
321

MaxSea Professional Marine Software User Guide v10.3
Program must be activated
When can this window appear ?
After having answered "I do not need Dongle..." in previous window.
Why is this window displayed
A valid software license is not present, and must be applied.
What to do ?
Answer "OK" ( there is no other choice ) .
What will happen when you choose this option?
Activation wizard process (1)
322

User Guide
When can this window appear ?
If you have an Internet connection or email access on the same machine as MaxSea.
What to do ?
Answer "Next" to begin automatic activation
What happens when you choose this option?
Answer "Cancel" to leave the assistant.
Activation wizard process (2)
323
MaxSea Professional Marine Software User Guide v10.3
When can this window appear?
Continuation of the automatic ACTIVATION WIZARD process.
Cause of appearance of this window:
Enter your required serial number.
What to do?
Enter your serial number.
What happens when you chose this option?
click on " Previous" to return to the previous window.
click on "cancel" to leave the assistant in case of error.
What happens when you chose this option?
Program ends and warns you that you must activate software.
Activation wizard process (3)
324

User Guide
When can this window appear?
Continuation of the automatic ACTIVATION WIZARD process.
Cause of appearance of this window:
Required to enter your Personal Information. Fields marked with an asterisk (*) are mandatory. Be careful to enter your email address correctly. This is where future activation codes are sent.
What to do?
To enter your Personal Information and to confirm by clicking " According to (Next ")
o What happens when you choose this option?
The following window displays by asking you to confirm the entry of your email address
If your information is correct, confirm by clicking "YES" otherwise click "NO" to correct.
What happens when you confirm your address email?
To click " Previous" to return in the previous window. To click "Cancel" to leave the assistant in case of error.
o What happens when you choose this option?
325

MaxSea Professional Marine Software User Guide v10.3
Program ends having informed you about the necessity of software activation.
Activation wizard process (4)
When can this window appear?
Continuation of the automatic activation wizard process.
Cause of appearance of this window:
Connection with the server for activation request
What to do?
Wait for the result of the operation
o If the operation is a success you will see the following window and the program will continue normally.
326

User Guide
Click "FINISH" to continue launch.
o If the operation fails because of a problem accessing the server , an error message suggests activating by email.
o It will recommend that you activate by email.
What happens when you chose this option?
If another error is displayed, we try the operation again or contact your dealer with the error message.
Activation under Email
327

MaxSea Professional Marine Software User Guide v10.3
When can this window appear?
When activation by Internet failed.
Cause of appearance of this window:
An email activation is attempted.
What to do?
Follow instructions displayed on screen and verify that the mail was sent.
Wait for the email of answer and to enter the code by using manual activation.
Dongle failure
When can this window appear?
Having chosen "NO" in the previous window.
Cause of appearance of this window:
A hardware key failure is suspected.
What to do?
Answer "Generate a temporary license":
o If you suspect that the hardware key has failed.
o Or if you wish to generate a temporary license to continue to use software with out using a hardware key.
328

User Guide
What happens when you choose this option...?
Answer "Quit to verify the hardware key ":
o If your hardware key seems correctly connected and if the message appears for the first time.
o Or If you have lost your key.
What happens when you choose this option...?
The program ends to allows you to verify the hardware key.
Enter codes
When can this window appear?
When you have decided to generate a temporary license.
Cause of appearance of this window:
To verify your configuration.
What to do?
o Enter your configuration codes.
What happens when you have chosen this option...?
If your codes are correct, process will continue and a temporary license will be generated (if it is possible).
What happens in that case?
Otherwise, it will ask you to enter your codes again.
o If you wish to leave the application, click on " Cancel".
Temporary license
329

MaxSea Professional Marine Software User Guide v10.3
If the creation of the temporary license is a success, you will not see this window but a message informs you about the success of the operation and the launch of the program will continue on the following window.
When can this window appear?
If the generation of temporary license failed. Several explanations are possible:
o You have already used this feature.
o Your temporary license has expired.
o An system error occurred during the attempt.
Cause of the appearance of this window:
Failure during generation of temporary license.
What to do?
Click on "OK" and follow the instructions to launch the manual activation process with help from your distributor or of our technical services.
Next...
Activating a temporary license
330

User Guide
This window is displayed the first time you launch MaxSea if you don't have a hardware key (dongle) attached.
Click on NO If you wish to generate a temporary license. The following dialog box appears.
Click on "Generate a temporary license" if you wish to generate a temporary license which will allow you to use the software for four days.
Enter the codes in the following dialog box.
331
MaxSea Professional Marine Software User Guide v10.3
Click OK
If the creation of the temporary license is a success, a message notifies you and the program will continue.
Note that this license must be applied within 4 days.
If your license is going to expire the software will warn you.
New codes provided by your distributor must be applied before the end of the Demo trial period.
Then start the Software Key Activation Wizard.
To get a new software key go to [Start] windows menu, select [Programs] open [MaxSea Utilities] and choose [Software Key Activation Wizard].
PROBLEM: Can not open a serial port
Selecting from one of following sentences will help you to resolve your problem.
My computer has a standard serial port (RS232) and Hyper Terminal can not establish a connection.
My computer has Universal serial Bus controllers and Hyper Terminal can not establish a connection.
My computer has a standard serial port (RS232) and Hyper Terminal can establish a connection.
My computer has Universal serial Bus controllers and Hyper Terminal can establish a connection.
My computer has no serial port.
I want to skip this step and try something else.
To get information about Operational System installed on my computer.
To view the list of serial port presence under Windows 98v2 or ME.
To view the list of serial port presence under Windows 2000 or XP.
To verify reserved serial ports communication with Hyper Terminal application.
PROBLEM: the software does not work as well as before.
332
User Guide
When should you should reinitialize the software preferences ?
Problems in icon or palette display
The interface colors have changed
Recorded marks or tracks have disappeared
Charts are opened but do not display
After re-installing MaxSea
--> Reset : Program Preferences
The software is no longer receiving a position
The software is no longer receiving a position after re-installing MaxSea
--> Reset : Data /Input Preferences
To reinitialize the software preferences:
Quit the software, if you have not already done so.
Restart the software while holding down the Control key.
Choose to erase the software preferences only (without erasing Data /Input Preferences)
If you have chosen to reinitialize the input and output preferences as well, this will erase the input/output configuration.
Note:
1. hold the key down while the software is starting until the preferences dialog box appears.
2. The dialog box allows you to confirm the reinitializing.
3. The check boxes allow you to reinitialize the software (without resetting the input and output preferences).
4. If you have chosen to reinitialize the input and output preferences as well, refer to the Equipment Connection chapter.
IMPORTANTAfter remilitarization of the IN/OUT and MaxSea preferences, all configurations will be erased and it will be necessary to re-configure the inputs/outputs (see Equipment Connection) and re-open your MaxSea files (charts, layers, etc.).
Only use this function if you are aware of how it is going to effect your installation.
PROBLEM: 24 bit display setting is not appropriate
To configure the display settings, first close MaxSea:
1. Right-click on Windows desktop to bring up Windows settings menu.
2. Choose [Properties] from the menu to bring up the "Display Properties" windows.
3. Select Settings Tab.
4. Choose Medium (16 bits) from the Color quality pop-up menu.
5. Click on the Apply button to take in account new display settings
6. Close the Display Properties window.
333

MaxSea Professional Marine Software User Guide v10.3
How to reinitialize the software settings
Quit the software, if you have not already done so.
Restart the software while holding down the Ctrl key.
Choose to erase the software preferences only (without erasing Data /Input Preferences)
If you have chosen to reinitialize the input and output preferences as well, this will erase the input/output configuration.
You should reinitialize the program settings.
1. either when the program does not work as well as before.
2. or after a defect during the use of the program.
Five levels of reset are available to reinitialize the software settings according to a defect.
Problem appears when : Choose the option:
The display of the Icons or the palettes is corrupted.
the colors of the interface colors have changed.
Level 1 --> Reset display settings
recorded marks or tracks have disappeared
opened charts are not display
Level 2 --> Reset charts and files loadings settings
after upgrading your software. Level 3 --> Reset all
opening a route, file or initializing a route... Level 4 --> Reset all but user settings
The software is no longer receiving a position
The software is no longer receiving a position after re-installing MaxSea
Level 5 --> Reset : Data Output/Input Preferences
IMPORTANTAfter having reinitialized the data INPUT / OUTPUT preferences, all configurations will be erased and it will be necessary to re-configure the input/output settings (see Equipment Connection) and re-open the files which were opened before (charts, layers, etc.).
Only use this function if you are aware of how it is going to effect your installation.
334

Glossary
AActivation: Process that grants access to the software.The user submits first his Site Code
and Serial number and then receives a custom Site Key.
Activation Wizard: The Activation Wizard makes the software activation easier providing a user friendly interface made of windows and forms.Activation can be automated (trough the Internet), delayed (by automatic email or manual one) or totally manual.
Active route: If an autopilot is enabled, it will steer the boat along an active route, heading for each successive waypoint as it is activated.
Active Waypoint: The active waypoint or mark is the waypoint or mark towards which you are currently traveling. An active waypoint slowly flashes to make it stand out on your screen.
Alarm (XTE): Cross Track Error Alarm is activated when the boat has deviated from the desired path of travel. In certain areas, deviation from the route could put the vessel in danger. If you are using a route to travel from point to point, you can select an amount of cross track error allowable before an alarm will sound.
Automatic activation: This email is automatically generated by the Activation wizard and sent to our server to be processed.If sent data are correct, the user receives an answer email enclosing the Site Key to be entered into the Activation Wizard.
Automatic Activation Email: This email is automatically generated by the Activation wizard and sent to our server to be processed.If sent data are correct, the user receives an answer email enclosing the Site Key to be entered into the Activation Wizard.
Autopilot: A self-steering device which attaches to a vessel's steering mechanism to control the vessel's bearing.
AWD: Apparent Wind Direction. This is abbreviated as AWD. In order to overcome the effects of drift and wind, a vessel which is trying to reach a given waypoint may not bear straight towards it. As a result, onboard wind direction measurements - the AWD - may not be the same as the True Wind Direction (TWD). Your Visual Series product derives TWD from AWD by taking any bearing deviation into account.
AWS: Apparent Wind Speed . This is abbreviated as AWS. When the vessel is in motion, onboard wind speed measurements - the AWS - will differ from stationary measurements (True Wind Speed, or TWS). Your Visual Series product derives TWS from AWS by taking the vessel's motion into account.
BBearing: a horizontal angle, measured from 0 to 90 degrees, fixing the direction of a line or
direction of travel with respect to either a north or south direction.
Bench mark: a relatively permanent material object, natural or man-made, with a known elevation. A bench mark can be used as a reference point when navigating a route or in determining the elevation of nearby land features.
Bitmapped Image: A bitmapped image is one made from an array of dots rather than continuous lines or areas.
BMP: Bitmapped image format (Microsoft Corp.) BMP was developed by Microsoft and is the native graphics format for Windows.
Broadcast: To simultaneously send the same message to multiple recipients. Broadcasting is a useful feature in e-mail systems.
335

BSB Chart: BSB Electronic Charts was a company that held the exclusive license from the U.S. Department of Commerce, NOAA to develop and license electronic versions of NOAA nautical charts. Maptech now holds this license and refers to the BSB charts as the Chart Kit format. The BSB charts are in a proprietary format. Northport Systems Inc., the creator of Fugawi, has been licensed by NOAA and BSB Electronic Charts (now Maptech) to create BSB-compatible software and BSB charts in Europe and Canada. Nautical Data International, Inc. holds the exclusive license to produce Canadian electronic nautical charts, which are also available in BSB format.
CChartTiff: ChartTiff maps are collarless DRGs. ChartTiff raster images allow for easy
panning from one map to another, without worrying about map overlap. The U.S. topographic maps in ChartTiff format are converted to UTM projection.
CIB: Controlled image base
CITS: Close Air Support Integrated Targeting System (CITS) is a program developed by Northport Systems Inc. for integrating the Global Positioning System (GPS) with laser target locators.
COG: Course Over Ground - the direction, reported in true or magnetic north values, in which a GPS receiver and the person operating it are moving with respect to the earth.
COM port: The interface through which your Visual Series product and your PC can communicate with peripherals.
Configuration: This word refers both to the set of features/modules available inside the software and to the action of setting them. This action is performed during the manual input of personalized codes (configuration codes) using DungleUpdate( ?).
Configuration codes: They belong to a unique user and allow him to define the features/modules he is entitled to use: his configuration.They must be entered before the first use or when the functions/modules are updated whatever may be the using mode (with or without dongle).
Contour line: a line on a map that connects points of equal elevation. The vertical distance between contour lines is equal to the contour interval.
DData sentence: The unit of information sent between peripherals and your Visual Series
product.
Datum: a reference system for surveying which involves using a plane, level, line, etc., from which to calculate heights and depths. A vertical datum is a level surface to which heights are referred. The horizontal datum is used as a reference for position.
DDE: Dynamic Data Exchange. A Windows protocol that allows communication between applications. When information is updated in one application, related information will be updated in other applications.
Dead reckoning: A method of navigation, available in your Visual Series product, where known values are used to calculate unknown values. Also known as deduced reckoning.
Dongle: This key, connected to the parallel port or to the USB one, allows the use of the software (starter key).It also provides the opportunity of using a given configuration on a second computer without previous activation: it acts as a mobile license / configuration.
DongleUpdate: A tool allowing the configuration codes manual input.
336

Glossary
Drift: The cumulative effect of wind and current on the vessel.
EElevation: the vertical distance of a point above or below a reference surface, such as sea
level.
Ephemerides: Data giving the location of satellites for each day of the year or for other regular intervals.
GGFS: The GFS model is a generic, worldwide model covering land as well as sea areas.
This is the most common of the models, and the one other software suppliers make available.
GIF: Graphics Interchange Format. This is a format for saving graphics files with data compression.
GLL: A data sentence that is part of the NMEA protocol for transferring information between electronic devices. The GLL sentence contains position information.
GPS: Global Positioning System - a global navigation system that is based on triangulation from a constellation of 24 satellites orbiting the earth. A GPS receiver pinpoints its position on earth by measuring its distance from the satellites. It does so by calculating the time it takes for a coded radio message to pass from the satellite to the GPS unit. A GPS unit needs at least three measurements to determine its exact position.
GRIB: GRIB file is a WMO (World Meteorological Organisation) standard format for archivingandexchanging gridded data
Gulf Stream model: is a weather model which adds current information to the East Coast High Resolution model.
HHardware key: This key, connected to the parallel port or to the USB one, allows the use of
the software (starter key).It also provides the opportunity of using a given configuration on a second computer without previous activation: it acts as a mobile license / configuration.
IIonosphere: That part of the atmosphere, extending from about 70 to 500 kilometers, in
which ions and free electrons exist in sufficient quantities to reflect electromagnetic waves.
JJPG: Joint Photographic Experts Group Format - Standard format for image storage created
by this group. JPG allows large images to be significantly compressed. Along with the GIF format, it is one of the most common and widely supported image formats used for raster graphics.
LLatitude: the distance north or south of the equator of a point on the earth's surface. This
distance is measured in degrees, minutes, and seconds. Lines (parallels) of latitude
337

MaxSea Professional Marine Software User Guide v10.3
circle the earth horizontally and are parallel to one another. One minute of latitude equals one nautical mile.
License: It is the proof that the use of the software is granted and it contains the data relative to the use restrictions (deadline, runs…).It is generated after a successful activation process.
Longitude: the distance east or west of the prime meridian of a point on the earth's surface. Longitude is measured in degrees, minutes and seconds. Lines (meridians) of longitude create a geographic grid around the world and are not parallel, but rather converge at the poles.
MMagnetic north: the area to which all compass needles point, located roughly 1300 miles
south of true north. Magnetic north moves west slightly each year due to the earth's rotation and the friction created between the earth's liquid center and its solid crust.
Manual Activation: It is made of a dialog box displaying to the user his Site Code and requesting for the matching Site Key.It meets two needs:- to be able of entering a Site Key after a email activation request.- To be able of performing a fully manual activation.
Manual activation email: It's one of the methods suggested by the Activation Wizard. It's a helper designed for the user to manually create an activation request email using copy & paste. This method must be applied if the automatic activation email failed.
Map projection: the systematic arrangement of the earth's spherical or geographic coordinate system onto a plane; the process of transforming a globe into a flat map with the least amount of distortion; a transformation process.
Meridian: an imaginary line that circles the earth, passing through the geographic poles and any given point on the earth's surface. All points on a given meridian have the same longitude.
MOB: Man-over-board
Modules: They must be considered as the available features offered by the software.
NNMEA: National Maritime Electronics Association. The association sets standards for
interfacing nautical electronic devices, including Global Positioning System receivers.
OOceanic Experimental model: is a weather model, covering only the ocean areas (and not
close to shore).
OnlineActivation: It's the more simple activation method available for an user who has access to the Internet.The process is fully performed by the Activation Wizard.
PPacket Messaging: Radio transmitted message system.
PCMCIA Card: Personal Computer Memory Card International Association Card. A Sunnyvale, California nonprofit trade association created to standardize the connection of peripherals to portable computers. PCMCIA developed the PCMCIA card, a lightweight, removable module about the size of a credit card that adds features to a portable computer.
338

Glossary
PCX: PCX is a graphics file format for graphics programs running on PCs. It is supported by most optical scanners, fax programs, and desktop publishing systems.
Pixel: Picture element. Definable locations (dots) on a display that are used to form images on the screen.
PNG: Portable Network Graphics. A file format for the portable, well-compressed storage of raster images.
Position fixing: determining your position on a map in terms of its coordinate system. This can be done visually, by referencing the terrain and comparing it to contour lines and other map features, by using a GPS receiver.
Protocol: An agreed-upon format for transmitting data between two devices
PTF: PTF is the extension of specific vector files which stack there transparency on displayed chart and on which user add marks and save his data.
RRaster: Computer graphics term describing a predetermined pattern of line that provides
uniform coverage of a display space. Raster graphics are computer graphics that are composed of an array of pixels arranged in rows and columns.. Raster maps are stored as a series of pixels. Vector maps are stored as line segments.
Relief: changes in terrain; elevations or depressions in the land.
Relief shading: a technique for showing the ups and downs of the land portrayed on a topographic map. The process makes land look three-dimensional by the use of graded shadow effects. Traditionally, maps are shaded as though the light source is coming from the northwest.
RMS: Root Mean Square. The standard deviation of the error in the GPS location.
SScale: the distance between two points on a map as they relate to the distance between
those same points on the earth.
Serial Number: It identifies the product (software) and proves the purchase act.It is requested by the Activation Wizard.
Sighting line: The line that you sight along to take a bearing.
Site Code: The Site Code is a critical data with regard to the Activation. It is the query part during the activation phase and identify user machine in a unique way.
Site Key: The Site Key is a critical data with regard to the Activation. It is the answer part of the activation process.It is the "Activation Code".
Slope: When land deviates from the horizontal plane it has slope. On a topographic map, the closer the contour lines are placed together, the greater the slope of the land being portrayed.
SOG: Speed Over Ground is abbreviated as SOG. SOG is the actual fixed geographic speed of a vessel. It is essentially the Speed over Water (SOW), plus the cumulative effect of wind and current.
TTCP/IP: Abbreviation of Transmission Control Protocol, and pronounced as separate
letters.TCP is one of the main protocols in TCP/IP networks. Whereas the IP protocol dealsonly with packets, TCP enables two hosts to establish a connection and exchange streamsof data. TCP guarantees delivery of data and also guarantees that packets will bedelivered in the same order in which they were sent.
339
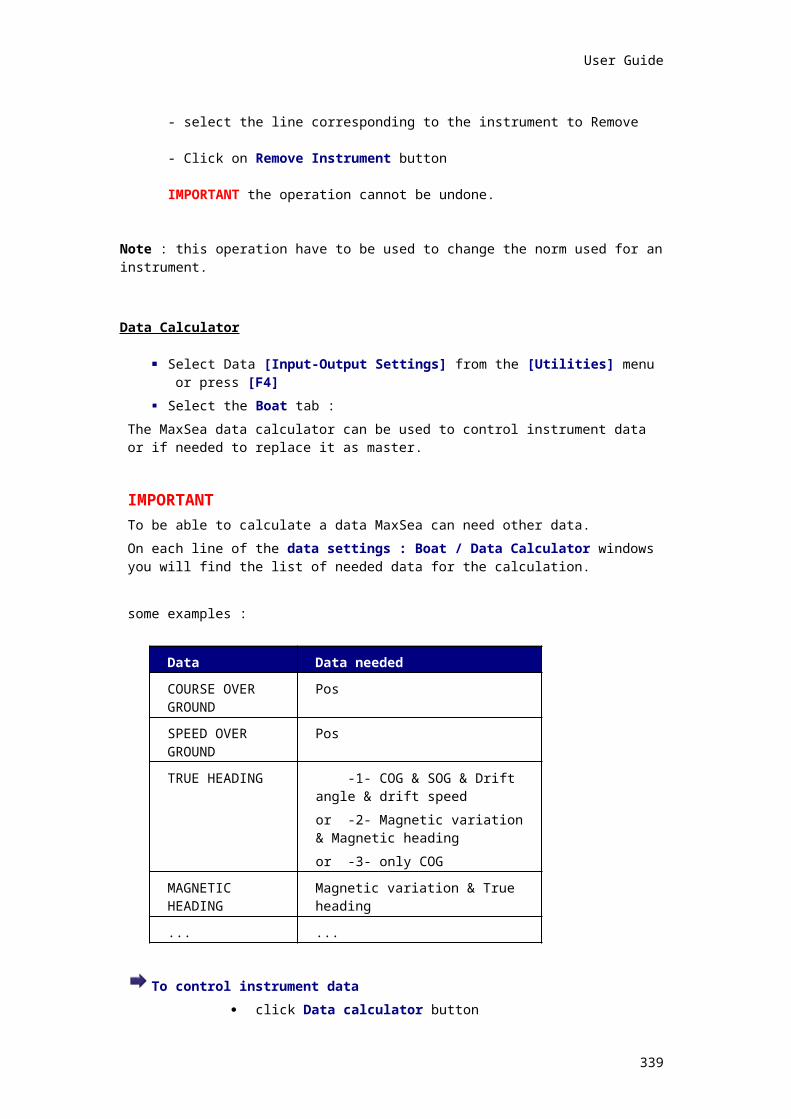
MaxSea Professional Marine Software User Guide v10.3
Temporary License: During a dongle failure, the software automatically generates a Temporary License.This license allows the user to keep on using his software normally for a limited time while he is waiting for a dongle replacement.The temporary license is renewable if the user contact the technical support.
Tif: Tagged image file format. One of the most widely supported file formats for storing bit-mapped images on personal computers (both PCs and Macintosh computers).
Topography: relief of the land surface; the graphic portrayal of that relief in map form by the use of contour lines.
Track: An onscreen and/or logged record of a vessel's previous movements.
Troposphere: The portion of the atmosphere from the earth's surface to the stratosphere; that is, the lowest 10 to 20 kilometers of the atmosphere.
True north: the geographical North Pole.
TTG: Time To Go is abbreviated as TTG. The amount of time estimated until the vessel reaches an active mark, assuming no intervening change in course or speed.
TWD: True Wind Direction is abbreviated as TWD. In order to overcome the effects of drift and wind, a vessel which is trying to reach a given waypoint may not bear straight towards it. As a result, onboard wind direction measurements - the AWD - may not be the same as the True Wind Direction (TWD). Your Visual Series product derives TWD from AWD by taking any bearing deviation into account.
TWS: True Wind Speed is abbreviated as TWS. When the vessel is in motion, onboard wind speed measurements - the AWS - will differ from stationary measurements (TWS). Your Visual Series product derives TWS from AWS by taking the vessel's motion into account.
UUDP: User Datagram Protocol connectionless protocol that, like TCP, runs on top of
IPnetworks. Unlike TCP/IP, UDP/IP provides very few error recovery services, offeringinstead a direct way to send and receive datagrams over an IP network. It's usedprimarily for messages over network broadcast .
USGS: United States Geological Survey.
UTM: Universal Transverse Mercator grid - a grid coordinate system that appears on most USGS maps. It provides a perpendicular grid with constant linear surface distance values between each of its grid lines in all directions, except near the poles. The UTM system divides the area of the earth between 84 degrees N and 80 degrees S into 60 zones. While coordinates reported in degrees, minutes, and seconds of latitude and longitude are often called true coordinates, those reported in terms of the UTM grid are referred to as false eastings and northings.
VVector: Images defined by sets of straight lines that are defined by the locations of the end-
points. Vector graphics require much less storage space than raster or bitmapped graphics.
VMG: Velocity Made Good The speed at which the boat is moving toward its intended destination, regardless of the vessel's direction.
WWaypoint: A predetermined geographical position used for navigation along a route or for
storing the position of a particular feature.
340

Glossary
XXTE: Cross Track Error - The distance of a line drawn from the vessel perpendicularly to an
active route leg. This determines to what extent the vessel is straying from the course of a route.
341
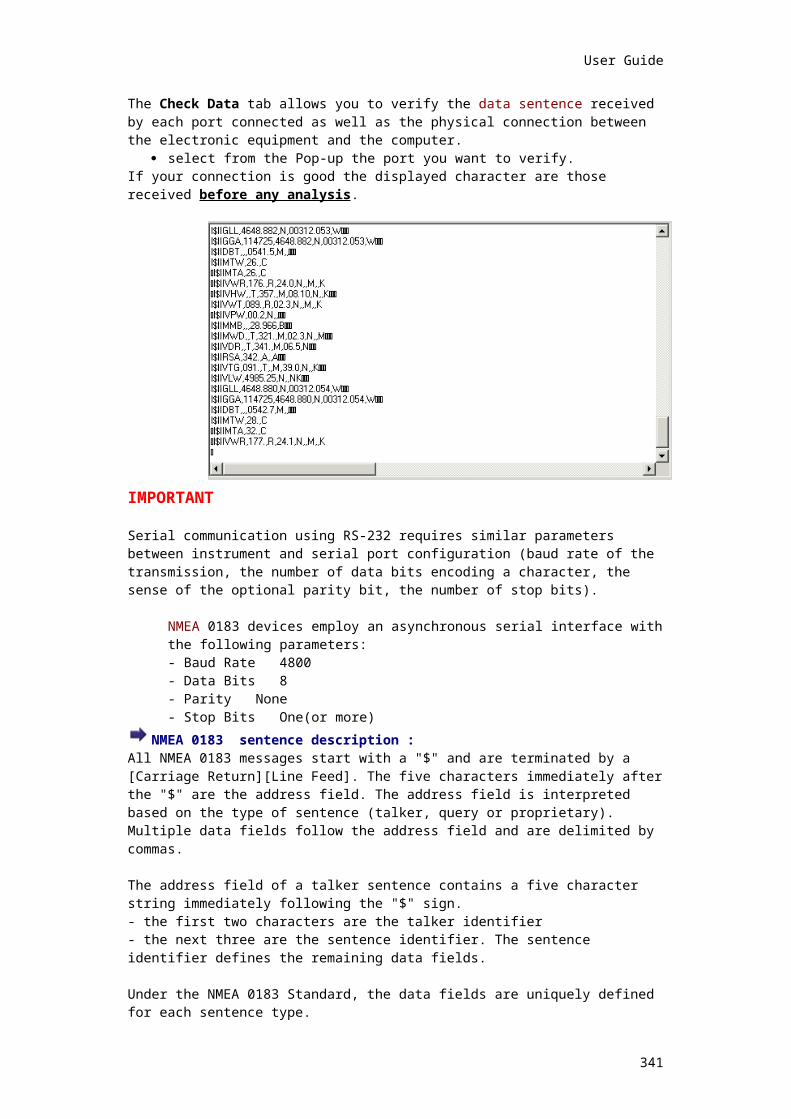
Index
2
2D bathy config palette.......................141
2D color gradient................................144
2D display configuration.....................144
2D view..............................................141
2D/3D database......................................185
2D/3D modules..................................148
3
3D camera options.............................159
3D database.......................................180
3D display..........................................148
3D settings.........................................150
3D view contrast.................................158
A
A
Activate the track............................192
Activating a list of points.............57, 74
Activating route.................................49
Active route or your boat present route......................................................49
Active route window..........................53
Applying a configuration to a track..196
Archived Database.........................188
ARCS charts...................................297
Areas................................................83
Auth Code entry..............................306
Automatic centering zone.................68
Automatic events..................................100
Automatic pilot connection................59
Auto-Scale function...........................63
A 332
B
B
Backup and Restore configuration..290
Backup data base.................................185
Bearings...........................................70
Before importing...................................166
Before importing data.....................160
Before installing..............................294
Between two points...........................41
By a bearing and a range.................71
By three bearings..............................71
By two bearings................................70
Bathy 2D settings...............................145
C
C
Cable diagram................................201
Capture and modify tools................108
Centered ship...................................67
Change a track into a Route Plan...............98Change a track into an active route (Waypoints)
......................................................98
Change display date.......................224
Change the prediction time.............242
Change your 3D database password.........186
Changing log.......................................254
Changing the prediction time..........236
Chart choice............................100, 101
Chart permits_ license_ catalog installation...................................298
Close the forecast file.....................226
Closing............................................124
Closing a chart................................109
Closing a User data layer.........................75
Closing the route plan.......................47
CM93v3 chart opening....................133
C-Map Access................................303
C-Map introduction.........................132
C-MAP NT windows Management..124
COG...............................................288
Compact Database...............................186
Configuration Preferences..............288
Configure the 3D view....................157
Configure the forecast file display...221
Configuring a Seabed classification194
Configuring CM93 v3......................133
Convert files S57............................314
Copying marks and tracks Fish Ship 92
Create a movie...............................238
Creating a movies...........................225
Creating centering points..................67
Creating user's data layer file (s)......75
343

Current tip.......................................241
Cursor palette.............................20, 34
Customize Icons...............................81
Cutting a line in two..........................90
Cutting a track in half........................99
Deleting the Active Route.................55
D
D
Data transfer from personal computer to GPS..........................................60
Data transfer from the GPS to personal computer.......................................60
Datum conflict.................................110
Dead Reckoning function..................68
Delete non accurate values.....................183
Display............................................214
Display Center On/Off mode...........256
Display centering points..................255
Display Day/Dusk/Night..................258
Display line distance or area calculation.......84
Display of the Cursor palette..........258
Display Options..............................129
Display options C-MAP NT.............125
Display several chart windows........260
Display simultaneous different layers147
Display Strength and direction of the wind.............................................223
Display the chart orientation. . .256, 257
Display the Nav Data palette..........259
Display Tide and Current window...260
Display type and presence of imported data.............................................143
Displaying data...............................162
Displaying the target display...........208
Download a forecast file from an e-mail....................................................218
Download a forecast file from the WEB....................................................233
Dredge function..............................200
Drift and surface speed vector..........62
dumped file........................................77, 78
E
E
Edit Colour Range............................97
Edit data base.....................................181
Editing a track.......................................92
Engineer adjustment dialog box.....195
Enter codes....................................294
Enter Mapmedia 3D codes.............295
Entering text.....................................85
Equipment Connection...................278
Erasing a track..................................96
Erasing marks...................................89
Essential information......................298
Events.................................................99
Events palette.......................................99
F
F
Flow control data parameters.........286
Foreword............................................3
From a downloaded file..................217
From a local disk.............................218
From the ship position with one or several points................................41
Furuno..............................................77, 79
G
G
GPS................................................288
GPS data transfer.............................59
Ground Discrimination module.......188
H
H
Hardware and system requirements273
Hardware configuration...................162
HDOP & Security circle.....................63
Headings and distances...................40
Help software..............................6, 315
Horizontal datum conflict................110
How to configure a Range Data Import.......173
How to configure an Area Data Import........172
How to configure Data Import..................171
How to configure PBG Data Import.176
How to configure the Boat Data Import.......173
How to configure the Filter Data Import......175
How to configure the Offset Data Import.....173
How to configure the Tide Data Import.......174
How to configure the Time Out for a Radar Target...............................208
How to Connect the C-MAP Cartridge Reader........................................300
How to display Roughness (E1)/ Hardness (E2) on the chart.........189
344

Index
How to export a 3D database..................187
How to install the vector charts CM93v3 & S57............................307
How to order a C-MAP NTPC code 301
How to repair the 3D database.......186
How to use a C-MAP NT/PC chart..126
How to use Cmap 93 v3 & S57.......134
How to use C-Map charts...............128
H 63
I
I
Image Overlay................................210
Import................................164, 167, 170
Import data from old DataBase.................163
Import data to Maxsea 3D data base.........163
Import Digital Evaluation Model................168
Importing plan from other plotters...............77
Importing plan from QuodFish plotter...........78
In which cases you should reinitialize MaxSea?.....................................334
Information on charts......................108
Input-Output port configuration.......280
Input-Output Settings......................279
Insert Chart Licence........................302
Inserting a point................................90
Inserting lines and points........................165
Installation......................................214
Installation of CM93 v3 / S57 cartography data from the C-MAP CD ROM.....................................308
Installation of licenses.....................309
Installation of vector S57 charts using the MAPmedia CD ROM.............295
Installing a CD-ROMon your hard disk....................................................296
Installing charts on the hard drive...293
Introduction AIS..............................213
Introduction tidal currents...............239
Introduction tides............................234
Introduction User's guide....................5
L
L
Licenses Management CM93 v3 & S57....................................................311
M
M
Between two points.........................118
Magnetic Variation..........................267
Man overboard function....................66
Manual event......................................100
Maptech chart kit............................121
Maptech chart pack........................120
Marks................................................86
Material Configuration.....................300
MaxSea Chopper............................227
MaxSea Chopper weather forecast models........................................228
MaxSea Online Services................315
MaxSea short cuts..........................316
Modify54, 88, 89, 90, 91, 92, 96, 97, 98, 99
Moving into the stage......................153
Moving the chart.............................105
N
N
Network Repeater function.............289
NTPC Selector access....................301
Planning Route center................20, 34
O
O
Obtain information about an object.131
Open a C-Map chart.......................128
Open an ARCS / SeaFarer catalog.119
Open the plan in the good datumsystem...............................140
Opening..........................................124
Opening a chart..............................101
Opening a M.C. Kit Chart file..........121
Opening a M.C. Pack Chart file......121
Opening a route plan........................49
Opening a user data layer.........................76
Opening an Active Route..................58
Opening C-MAP NT/PC chart.........125
Opening the Radar Overlay............210
Operation to follow up of mobiles
Problems with ground loops........292
Options..223, 261, 264, 266, 267, 269, 270, 272
Olex.................................................77, 79
P
P
PACHA/GEONET SYSTEM setting
PBG / Real Time / 2D/3D Properties175
345

MaxSea Professional Marine Software User Guide v10.3
PBG options...................................179
Personal Bathy Generator settings.291
Plotting a target..............................212
Plotting an active route.....................49
Plotting areas....................................83
Plotting isolated points......................82
Plotting lines.....................................83
Prediction time................................242
Profile...............................................95
R
R
Radar Configuration Palette
Register to MaxSea Chopper.........232
Render modes in the 3D window....154
Repair the 3D database..................186
Restore data base................................185
Route properties.............................270
S
S
Saving User data layers...........................74
Scale choice...................................103
Seabed classification preferences. .193
Selecting mark type and icon............80
Selecting objects..............................90
Setting the 3D display.....................156
Setting the registration....................303
Several positioning systems connected........94
Shift................................................110
Ship out limits...................................65
Short cuts.......................................316
SIMRAD ITI SYSTEM setting
Simulating the TCPA......................210
Slope size Representation..............151
Software configuration....................254
Splitting User data layer in half...................76
Start the 3D data import.........................170
Starting up the software..................304
Starting up the software C-MAP NT Selector.......................................301
Stopping the track save....................93
The Ground Discrimination palette
shift.....................................................110
T
T
Target AIS......................................214
Target display.................................207
Targets...........................................212
Text properties................................271
Tidal current tip...............................241
Tide current window........................260
Tide tip and graph...........................237
To create a movie...........................243
To free a target...............................213
To obtain information on a target....213
Tracking (Track on).................................92
Transforming objects........................91
Trawl display...................................199
Trawl positionning with PACHA or GEONET.....................................197
Tuna fishing logbook.............................252
U
U
Upgrading your software.................276
User code generation.....................305
User data Fishing...................................80
User data Layers....................................73
User's Guide...............................6, 315
V
V
Vector direction display..........................253
Viewing current arrows...................240
Viewing tide bars............................235
W
W
Steering Data & Steering display windows........................................63
Waypoint properties..........................52
Weather module.............................216
Weather properties.........................223
346