manpower planning in the civil service · manpower planning in the civil service this report has...
TRANSCRIPT

Report by the Comptroller and
NATIONAL AUDIT SICE Auditor General
Manpower Planning in the Civil Service
Ordered by the House of Commons to be printed 23 May 1989
Her Majesty’s Stationery Office, London E6.40 net 398

MANPOWER PLANNING IN THE CIVIL SERVICE
This Report has been prepared under Section 6 of the National Audit Act, 1963 for presentation to the House of Commons in accordance with Section 9 of the Act.
John Bourn Comptroller and Auditor General National Audit Office
15 May 1969
The Comptroller and Auditor General is the head of the National Audit Office employing some 900 staff. He, and the NAO, are totally independent of Government. He certifies the accounts of all Government departments and a wide range of other public sector bodies: and he has statutory authority to report to Parliament on the economy, efficiency and effectiveness with which departments and other bodies use their resources.

Contents
Summary and conclusions Pages
1
Part 1: Introduction and Background 7
Part 2: The Role of the Treasury 13
Part 3: The Audited Departments-Nature, Organisation and Management Processes 18
Part 4: The Elements of Departmental Manpower Planning 22
Appendix
Manpower Planning in Other Organisations 37

MANPOWER PLANNING IN THE CIVIL SERVICE
Summary and conclusions
1. The Civil Service has 580,000 staff, 24 times as many as the largest private sector employer in the UK, and costs El4 billion a year to run.
2. The Service is facing several major challenges in its management of staff. Numbers have fallen by 20 per cent under the present Government. The recommendation of a recent Efficiency Unit report for the conversion of much of the Service into executive agencies is now being implemented. The relocation of work away from London and the South East is back on the agenda. Working patterns are changing. All this is being handled against the background of a labour market which, in key respects, is contracting rapidly (paragraphs 1.4-1.10).
3. Manpower planning is intended to help managers in matching staff to job requirements. Practical benefits identified by the Institute of Personnel Management from a recent survey of its corporate members include improved identification of training and staff development needs, the achievement of appropriate staffing levels, increased productivity and decreased unit labour costs. In view of changes in the labour market and in the organisation of the Civil Service, the NAO believe that adequate arrangements for manpower planning in the Service are increasingly important. The Treasury has recently laid a firm requirement on all Government departments to undertake manpower planning (paragraphs 1.11-1.15 and Appendix).
4. This report looks at the role of the Treasury; the appropriateness of line departments’ structures and processes for getting the most out of manpower planning; and the adequacy and effectiveness of the planning itself (paragraph 1.16).
5. For these purposes manpower planning has been considered under three main headings:
[a) Assessment of demand for manpower. Effective demand forecasting requires two elements: establishing the likely future workload; and then, by assessing the amount of work which each person can do, translating workload into a required manpower level.
(b) Utilisation and stock analysis. Examination of present manpower characteristics and use can assist short-term staff allocation, the search for efficiency gains and the examination of future demand and supply questions.
(c) Manpower supply analysis. This involves examination of issues such as recruitment prospects and wastage rates to assess the best approach to matching future supply to forecast demand.
1

MANPOWER PLANNING IN THE CIVIL SERVICE
6. The NAO examined the arrangements in four departments: the Department of Employment Group, the non-prisons part of the Home Office, the Inland Revenue and the Intervention Board for Agricultural Produce. These departments are illustrative of the wide range of sizes, types of work, location and other factors found in the Civil Service, and consequently provide varied examples of the relevance of manpower planning. The examination focussed on central divisions and selected line divisions.
Findings and 7. The NAO’s main findings and conclusions on manpower planning conclusions in the Civil Service are as follows:
On the role of the Treasury
[a) The Treasury have a close interest in manpower planning, as a means of investigating and influencing Service-wide manpower issues themselves and as a technique for use in line departments (paragraph 2.2).
(b) Their investigative work is technically well undertaken. The results are used to monitor the impact of manpower developments and to guide decisions on specific issues affecting the Service as a whole. For example, monitoring of trends in the administration group has helped to identify a need for greater flexibility in recruitment and retirement policies, which has recently been provided; and a review of the employment of scientists has led to the creation of a fast stream for that discipline (paragraphs 2.4-2.8).
(c) Successive control regimes have been structured to take adequate account of line departments’ manpower planning, first in setting departmental manpower ceilings within Service-wide targets set by Ministers collectively, and subsequently in setting departmental running cost limits (paragraphs 2.9-2.12).
(d) A number of documents over the past decade have provided central guidance to line departments on aspects of manpower planning, the latest in October 1988. The guidance leaves departments free to adopt methods for analysing their manpower demands which are most appropriate for their purpose; but advice on techniques is available to departments from a small team of Treasury experts (paragraphs 2.3 and 2.13-2.19).
On line departments’ structure and processes
(e) All four departments examined have sensible structures and budgeting and personnel management processes. Inputs to the Public Expenditure Survey and management planning under the Financial Management Initiative are coordinated by central divisions, but line divisions contribute usefully. These arrangements enable the effective use of information from manpower planning where it is available. The Inland Revenue have fed such information into the Survey process to particular advantage (paragraphs 3.13-3.23).
2

On line departments’ manpower planning
@ The assessment of demand for manpower
(f) All departments examined collect basic outturn workload data covering the bulk of their manpower. To forecast future workload, the Inland Revenue use both a simulation model and extrapolation of known levels of workload, adjusted for foreseen changes in factors such as the size of the taxpayer population. The remaining departments rely on extrapolation. The more sophisticated techniques have generally produced the more reliable results, although all four departments have on occasion been unable to identify in advance substantial changes in workload.
(g) All departments examined have activities with variable levels of workload, producing uneven in-year demands for manpower which prove difficult to forecast. For example, the Passport Department of the Home Office is well aware of the general shape of its demand profile but is not able to forecast the precise timing of peak demand or the scale of the peak in any given year. The Intervention Board has similar problems (paragraphs 4.2-4.11).
(h) For substantial areas of their work, both the Department of Employment Group and the Inland Revenue can draw on detailed work measurement exercises to translate workload into manpower requirements. These exercises have been accompanied by grading reviews which have identified scope for substantial annual savings: El1 million in the Inland Revenue, f13.5 million in the Department of Employment.
(i) The Home Office and the Intervention Board carry out the translation by means of productivity indicators, coupled with general management judgement, though the Intervention Board have recently recognised the need for work measurement and are recruiting an operational researcher. The present methods can give a reasonable view of overall staff requirements but are of more limited value in determining precise grading, skills and deployment. But the extent of work measurement, which can be very costly, needs to be tailored to the scale of operation in these smaller departments (paragraphs 4.12-4.22).
@ Utilisation and stock analysis
(j) For staff allocation, the Department of Employment Group and the Inland Revenue are able to draw on their workload analysis and work measurement exercises to operate detailed complementing schemes, allowing for different local circumstances. Staff allocation is more straightforward in the Home Office and the Intervention Board because they do not have complex regional networks. Both departments mainly rely on a judgemental process, supported by staff inspection, though the Board have used formula complementing to a limited extent in some areas of their work (paragraphs 4.24-4.26).
(k) All the departments examined have some measures of staff productivity, often coupled with checks on quality. The more
3

MANPOWER PLANNING 1N THE CIVIL SERVICE
developed these are, the easier it is to set meaningful efficiency targets and to plan for and monitor their achievement (paragraphs 4.27-4.32).
(1) All the departments examined have basic data for manpower stock analysis, though the use made of them is variable. In some departments there are doubts about the accuracy of computerised records which need to be overcome before their full potential can be realised (paragraphs 4.33-4.36).
[iii) Manpower supply analysis - (m) The departments examined have sufficient data on staff and their movements to identify current manpower supply problems. They respond by (among other things) investigating flexible working patterns and relocation to ease the situation (paragraphs 4.37-4.39).
(n) Only the Department of Employment Group and the Inland Revenue undertake longer-term supply modelling. In both departments the analysis has revealed potential problems. In the Inland Revenue, forecast shortages of qualified staff have been countered by revised recruitment and career progression patterns. The Department of Employment Group have examined the potential effects of a stable or decreasing manpower total following several years of growth. This would affect promotion prospects and the average age of staff. These findings are being taken into account in the Group’s Human Resource Development Strategy, which embraces, among other things, revised approaches to staff appraisal and development, communications, the working environment, pay, qualifications and staff mobility [paragraphs 4.40-4.42).
General conclusions 8. The NAO believe that the evidence gathered during the study about the manpower planning undertaken by the departments examined and the results obtained has been sufficient to demonstrate clearly the value of manpower planning in the management process. The benefits include both direct efficiency savings and improvements in personnel management. The financial gains are difficult to quantify because other factors such as capital investment, policy changes or changes in the labour market confuse the picture. But manpower planning is potentially an important tool in the search for annual efficiency gains of 1 f per cent-the minimum level which the Treasury expect departments to offer in the Public Expenditure Survey. Across the Service that level of saving would be worth E200 million.
9. During the course of the study, suggestions were put to the NAO by some departments that the value of manpower planning was undermined in certain circumstances: where departments were severely constrained on factors such as pay, grading and overall resources; where workload was highly volatile; and in small organisations.
10. However, the existence of constraints on manpower is not a convincing argument against manpower planning, since the purpose of planning is to identify potential problems and investigate ways of
4

MANPOWER PLANNING IN THE CIVIL SER”lCE
avoiding them or minimising their effect. The tighter the constraints within which an organisation is operating, the more important it is to undertake adequate forward planning so that those problems which do arise can be foreseen and dealt with in good time. In the Home Office, for example, the difficulty in foreseeing peaks of demand in the Passport Department has proved crucial precisely because the department has to be in a position to bring in casual staff and overtime working quickly when the peaks arise.
11. Similarly, although volatile workloads certainly present difficulties in the production of accurate forecasts, such uncertainties argue for manpower planning rather than against it. Planning would have relatively more limited value in a very stable environment where little change occurred. Its advantages are most apparent where forecasting can be reasonably precise, for example in the Inland Revenue’s modelling of outcomes from possible tax changes. Where forecasting cannot be achieved at the desired level of accuracy, a different aspect of manpower planning can come into play: the organisation then needs to investigate the implications of different levels of demand and form a view on contingent responses to possible outcomes. Without such analysis, organisations can find themselves faced with unacceptable reductions in service and, in certain circumstances, with consequential financial loss.
12. Undoubtedly, very small organisations can be run effectively by a few managers with local knowledge. This does not mean that factors such as workload, utilisation, manpower stocks and supply prospects are not relevant in such a case: it simply means that the necessary data can be derived and analysed without recourse to formal systems. Once organisations grow to a size where, for example, substantial numbers of central personnel and finance staff are deemed necessary, then those staff need more formal arrangements for collecting information, analysing it and communicating results. This is a matter of degree: one would not expect the Intervention Board with 771 staff to have the same need for sophisticated systems and computerised modelling as the Inland Revenue with more than 80 times as many staff and three major local office networks. But a small organisation is more vulnerable to change than a larger one and may sometimes need to devote proportionally more effort to exploring alternative scenarios. A change in workload requiring 100 extra or fewer staff would be major at the Intervention Board but less important at the Inland Revenue.
13. Of the departments examined, the Department of Employment Group and the Inland Revenue have manpower planning arrangements providing adequate information which is sensibly used in resource and personnel mangement processes. There is some scope for development of the detailed application of techniques and analyses, but the main elements of a manpower planning system are in place and functioning well.
14. In the non-prisons part of the Home Office and in the Intervention Board, basic information is available on workload and manpower and increasingly on utilisation as well, and the requirements of processes
5

MANPOWER PLANNING IN THE CIVIL SERVICE
such as the Public Expenditure Survey are met. But the manpower planning arrangements in these departments are less comprehensive than in the other two, though further developments are taking place in this area.
15. The NAO do not suggest that all Government departments need the degree of sophistication in their manpower planning processes which is shown in the larger departments covered by this study. But there are potential benefits for all departments in ensuring that a level of manpower planning information appropriate to their circumstances is available and is being used to best effect.
6

MANPOWER PLANNING IN THE CIVIL SERVICE
Part 1: Introduction and Background
1.1 Manpower planning is intended to help managers to identify their staffing requirements and minimise any problems in meeting them efficiently. In the Civil Service, the employment situation is becoming increasingly complex and the need for such help correspondingly greater. The Service is always liable to changes in the nature and volume of its work, in response to political or economic pressures, and it is currently facing major organisational change as well. The labour market, too, is changing: in some areas and for some categories of staff there are now serious recruitment and retention problems, and these problems will increase over the next few years.
1.2 There is no generally agreed definition of manpower planning. It is a generic term, embracing a range of management processes. For the purposes of this study, the NAO have taken manpower planning to comprise:
[a) the assessment of demand for manpower, by forward projections of workload and associated manpower requirements:
(b) the analysis of the current stock of manpower and its utilisation:
Figure 1
(c) the assessment of manpower supply prospects;
(d) the identification of problems from the above analysis; and
(e) the analysis of potential solutions.
1.3 The rest of this part of the report looks in more detail at the present situation in the Civil Service and in the national labour market, since this provides the backdrop to Civil Service manpower planning, and then describes the background to the planning itself.
Civil Service manpower
1.4 The number of civil servants increased dramatically during each World War. There was some decline after 1945, then a further increase in the 1960s and early 1970s. Since 1976, when the equivalent of 748,000 full-time staff were employed, numbers have fallen almost continuously to a figure of 530,000 at 1 April 1966. Figure 1 illustrates these trends.
Trends in Civil Service manpower numbers Number of staff in post, 1902-1988
Thousands
2 2
,/ Total ,/ Total
1200 1200
- 1000 1000
- 800 800
- 600
Non-Industrials Non-Industrials ,,,, ,,,,
1902 1908 1918 1928 1938 1948 1958 1968 1978 1988
7

MANPOWER PLANNING IN THE CIVIL SERVICE
1.5 The pace of reduction increased after 1979; reflecting the policy of the present Government to achieve a substantial cut in total Civil Service manpower. This has been achieved through the impact of technology and efficiency reviews and a continuing review of Government activities. Some functions have been discontinued, others reduced in scope or scale, and others hived off. Table 1 identifies the reasons for changes in staff numbers under the present Government.
Table 1
Reasons for changes in Civil Service staff numbers, 1979-1988
Workload 79,800 41,200 + 38,600 Efficiency 37,400 - 37,400 Streamlining 73,400 - 73,400 New Activities 46,500 + 46,500 Dropping Functions 58,700 - 58,700 Privatisation/
Contracting Out 42,900 - 42,900 Hiving Off 25,300 - 25,300
Total 126,300 278,900 -152,600
1.6 Analysis of manpower by grade shows a sharply tapering profile, with just under 80 par cent of non-industrial civil servants at Executive Officer (junior management) level or below and fewer than 1 per cent in the senior management grades from Grade 5 (Assistant Secretary or equivalent) upwards. The decrease in the size of the Service has not greatly affected the profile. Figure 2, which shows the profile, also demonstrates that women, although they make up almost exactly half of the workforce, are overwhelmingly concentrated in the lower grades.
Developments in the Civil Service
1.7 Current developments such as the Financial Management Initiative and work on decentralised budgeting are aimed at improving efficiency, including efficiency in the use of manpower. Manpower planning has a contribution to make to the successful implementation of changes of this kind. Appropriate manpower planning arrangements will therefore he relevant to executive agencies under the Government’s Next Steps initiative. In February 1988, the Prime Minister announced that the Government had accepted the four main recommendations of a report by the Efficiency Unit
entitled “Improving Management in Government: the Next Steps”. To the greatest extent practicable the executive function of Government would be carried out by units designated as agencies headed by a Chief Executive. The Government committed itself to a continuing programme for establishing agencies, applying progressively the lessons of the experience gained. The main aim of the Next Steps initiative is “to deliver services more efficiently and effectively, within available resources, for the benefit of taxpayers, customers and staff”. This is to be achieved by operating departmental services and functions as executive agencies established within a framework of policy and resources set by the responsible Minister in consultation with the Cabinet Office [Office of the Minister for the Civil Service) and the Treasury. The intention is that, while strategic control of the agenCy will remain with the Minister, responsibility for day-to-day operations of each agency should be delegated to a Chief Executive. The Chief Executive’s responsibilities and authority will be set out in a framework document which will normally be published. Most agencies will remain in the Civil Service. When he was examined on Next Steps in May 1988 by the Treasury and Civil Service Committee of the House of Commons, the Project Manager appointed to oversee the programme said that he thought at least three-quarters of the Civil Service might be covered by agencies within ten years. The Efficiency Unit report says that “a wide range of new arrangements will be needed” to ensure that agencies are staffed by people with the right managerial skills. Increasingly agencies will need to be responsible for their own manpower planning, as much else. The Intervention Board as a whole and three operational units in other departments covered by the study-the Employment Service, the Training Agency and the Passport Department-are candidates for agency status (see Part 3 of this report].
1.8 Another live topic is the location of work. The centrally directed programme of dispersal from London in response to the Hardman Plan of 1973 has been superseded by a new relocation policy announced in March 1988. Under this, as part of the 1988 Public Expenditure Survey, the Treasury asked departments to look again at the prospects for relocating work in areas with lower accommodation costs, improved labour supply prospects or other management advantages. Figure 3 shows the present geographical distribution of the Civil Service. London and the South East does not have a significantly higher proportion of its working population in the Civil Service than several other areas. But it does still have almost 40 per cent of the
8

MANPOWER PLANNING IN THE CIVIL SERVICE
total Civil Service, despite its high accommodation approaches to staffing. Developments under costs and highly competitive labour market. consideration include greater use of short-service
contracts, part-time working and job-sharing. The aim is to make best use of all available sources of
1.9 The Treasury have also been looking at the manpower and to ensure that the Civil Service does possibility of broadening traditional Civil Service not get out of step with employment practices and
Figure 2
Grade profile of the Civil Service Numbers in the non-industrial Civil Service, by grade and sex, 1 April 1988
Grade Level1 Numbers2 % Women
l-4 986 0 5%
5 2,600 iIl 9%
6 5,100 pJ 10%
7 14,900 q 10% SE0 22,000 9% HE0 69,300 16%
,
EO 128,500
A0 160.800
AA 96,000
37%
66%
1. Broadly equivalent grades in the Open Structure/Administration Group based on a comparison of salary scales
2. Full-time equivalents
0 Men
q Women
9

MANPOWER PLANNING IN THE CIVIL SERVICE
Figure 3
Geographical distribution of the Civil Service Number of non-industrial civil servants in each economic planning region, 1 April 1988
10

MANPOWER PLANNING IN THE CIVIL SERVICE
career patterns elsewhere. Such changes may not have a dramatic impact in the near future, but
is particularly vulnerable to such a change, because
departments will increasingly need to take account as a career service it seeks to recruit a high
of non-traditional working patterns in their proportion of young people. It also seeks highly
planning. qualified staff, for whom there is likely to be increasing competition from other employers as overall supply dwindles.
The labour market Table 2
1.10 These initiatives reflect the expectation that the labour market will become increasingly competitive between now and the end of the
Forecast numbers of 16-19 year olds in the civilian labour force
century. Figure 4 shows that the number of economically active people is expected to continue to grow slightly into the 199Os, though at a lesser pace than in recent years. But this reflects an overall 1988 ageing of the working population and a growing
2,510,000
tendency for women to remain in or return to 1989 2,430,ooo 1990
employment. Table 2 shows that the number of 2,330,ooo
1991 16-19 year olds in the civilian labour force (either in
2,200,000
work or looking for it), which has been dropping 1992 2,100,000
during the 198Os, is expected to decline at a greater 1993 2,000,000
rate from now on, reaching 78 per cent of its 1988 1994 1,960,000
level by 1995. The Civil Service in its present form 1995 1,970,000
Figure 4
Developments in the size of the labour force Number of economically active people in Great Britain, 1971-1995
Thousands
30,000
28,000
26,000 - -_-- ce---_ A -.j
,,’ 24,000 - _/_---’
-All ages ----Workingage
i I ,
‘I I I
I
Estimates Projections I, I I I I I I I I I I I I I I I I I I I I I I
q’ 2% 4 q*\ 19 + s”J & %gi ‘@ 91 95 95 19 he 9 @ ?.? 29 19 19 e.? + ?q 29 19
11

The development of manpower planning
1.11 In its early stages, manpower planning largely comprised quantitative modelling processes. It first became a regular feature of the Civil Service in the 197Os, when the Civil Service Department developed computerised models for analysis of manpower stocks and supply in the Service as a whole and in individual departments. Such models ware used somewhat mechanistically to determine the manpower structures and levels appropriate to the achievement of specific Government plans and objectives.
1.1~ Whilst these models are still in use in the MANPLAN suite of programs operated in Treasury and elsewhere, no attempt is now made to use modelling as a decision-taking process. Instead, manpower planning is regarded as a means of providing information on manpower issues and thereby assisting managers to take their own decisions on such matters as personnel policy, recruitment and levels of service provision. This view of manpower planning is reflected both in the NAO definition given at paragraph 1.2 above and in the guidance issued to line departments by the Treasury.
Requirements for manpower planning in the Civil Service
1.13 When this study started, the Treasury did not consider that further guidance on manpower planning was a priority issue, given the range of other efficiency initiatives on hand. There had been a number of recent documents, described in more detail in Part 2 of this report, offering guidance both on modelling and on the benefits which could accrue from the manpower planning process. In particular, in April 1986 the Government published ^.
1.16 In deciding to undertake this study, the NAO expected to find that Civil Service departments needed to undertake some form of manpower planning in order to cope effectively with the requirements of standard Government resource allocation processes and the increasing complexity of manpower management. Private sector experience helps to confirm the value of such planning, and departments now have an obligation laid upon them. But the NAO did not assume, and the Treasury have not required, that one method or level of activity in such planning should be adopted universally. The objectives of the NAO study were to assess the adequacy of departmental manpower planning systems and of the Treasury’s diagnostic, advisory and control activities; and to investigate the application of manpower planning in particular
a report of a multi-departmental review of budgeting instances. The NAO are grateful for expert advice which stated that progress towards greater efficiency on manpower planning from the Institute of in the use of manpower “depends fundamentally on Management in the University of Kent. departments developing effective manpower planning”. 1.17 The NAO examination covered the Treasury
and four line departments, chosen because they
requires those departments with more than 10,000 staff to send summaries of their analyses to Treasury each November, beginning with November 1988.
Manpower planning in other organisations
1.18 This requirement helps to bring the Civil Service more in line with practice elsewhere. 70 per cent of organisations responding to a recent Institute of Personnel Management survey undertook some form of manpower planning. Initial analysis of the returns indicates that over 80 per cent of respondents with formal manpower planning systems found them beneficial in identifying training needs, setting appropriate staff levels and improving management development; and that 60 per cent benefitted through increased productivity and reduced unit labour costs. A fuller summary of the results of the survey is in the Appendix.
The NAO study
1.14 In July 1988, however, the Treasury issued a were illustrative of a range of sizes and draft of further guidance on manpower planning, circumstances. Part 2 of this report comments on the which went into aspects not covered by the earlier role of the Treasury. Part 3 describes the guidance. Following acceptance of its terms by organisation and functions of the line departments Principal Establishment Officers of line departments, and the budgetary and other operations which are it was given substantive force at the end of October served by manpower planning. Part 4 looks in detail 1988. It instructs all line departments to undertake at the way in which manpower planning is applied manpower planning for certain specific purposes and in the line departments.
12
MANPOWER PLANNING IN THE CIVIL SERVICE
Part 2: The Role of the Treasury
2.1 The Treasury’s responsibilities, as listed in the 1986 Public Expenditure White Paper (Cmnd 9702), included “the control of public expenditure, manpower, and the efficient use of resources, Civil Service pay, conditions and industrial relations”. The 1988 list (Cm 288) omits manpower. This reflects the fact that the Treasury no longer directly set a ceiling on departments’ manpower numbers: from 1 April 1988 the control has been over total running costs, of which manpower costs are one element.
2.2 The Treasury nevertheless retain a substantial interest in manpower planning:
(a) as a tool for their own use, both for assessing future Civil Service employment requirements alongside the overall labour supply position, so that an appropriate pay and conditions framework may be put in place, and for investigating the effect of different types and levels of control over Civil Service resources; and
(b) as a departmental management practice, for which the Treasury may set out processes, outputs or standards as guidance or as a requirement.
Structure
2.3 A number of Treasury divisions have an interest in ensuring that departments carry out adequate manpower planning:
(a) Expenditure divisions are responsible for the control of expenditure and the oversight of efficiency measures for the departments which they shadow, including running costs expenditure and efficiency issues.
(b) Three policy divisions are involved:
- Personnel Management Division is responsible for the overall manpower structure of the Civil Service and employment conditions within it. It seeks to ensure that personnel management and employment practices in the Service are efficient, reflect Government policies for the management of change and adapt to the changing labour market. This division was transferred to the Treasury from the Management and Personnel Office in 1987.
- Running Costs Division is responsible for the development of running cost controls, the monitoring of Civil Service manpower numbers, the development of job evaluation and the provision of policy guidance on relocation. - Financial Management Division is responsible for the overall development of budgeting in the Civil Service.
(cl Personnel Statistics Division supports the policy divisions by collecting and analysing manpower data from departments and offers departments a limited advisory service on manpower modelling. (d) Staff Inspection and Evaluation Division is responsible for policy and practice on staff inspection and work measurement. Again, it provides advice both within the Treasury and to line departments.
The divisions (other than the Expenditure divisions) were regrouped in a reorganisation which took effect in November 1988, aimed at giving a better focus for value for money work in the Treasury. They are brigaded in two distinct arms of the Treasury whose chains of command come together formally only at Permanent Secretary level: Personnel Management and Personnel Statistics Divisions are under the command of the Grade 1A (Second Permanent Secretary) responsible for management and pay, while Expenditure, Financial Management, Running Costs and Staff Inspection and Evaluation Divisions are under the Grade 1A responsible for public services. The Treasury consider this a natural division, supported by proper liaison at working level across the boundaries.
Central manpower planning
2.4 The developments described in Part 1 of this report--recent manpower reductions, stiff competition for staff, changing employment practices, new technology, prospective structural changes to the Civil Service and the imminent decline in the number of young people in the workforce-all give rise to potential employment problems. Personnel Management Division has investigated, or is investigating, such matters as wastage and promotion blockages, fast-stream careers, short-service contracts, and recruitment strategies, to assess the seriousness of potential problems and the efficiency of various solutions.

MANPOWER PLANNING IN THE CIVIL SERVICE
2.5 These investigations are based on information from various sources, including Establishment Officers and personnel managers within the Civil Service. One very important sourca is the analyses provided by Personnel Statistics Division of Civil Service manpower stocks and supply prospects, based on computerised records on the bulk of the Civil Service held on the MANDATE database. The database is fed from departmental computerised records. The data received in this way are checked against manual returns on total manpower which departments also submit. Any significant differences-generally those in excess of 2 per cent--are checked with departments.
2.6 Figures 5 and 6 illustrate ways in which these analyses have been used:
- Figure 5 is a diagram published in a passage on manpower modelling in “Civil Service Statistics 1984”. It shows the number of staff at each grade in the Administration Group, the annual outflow of leavers and movement of promotees, and the consequential requirement for new recruits.
- Figure 6, which is derived from statistics produced during a 1985 investigation of promotion blockages, predicts the career progression of administrative staff by use of the modelling facilities in the MANPLAN suite of programs. It forecasts the proportion of the total staff in each grade who will be promoted each year to 1994, on two different assumptions about change in the overall size of the Civil Service, and compares the projections with the actual level of promotions in the 10 years up to 1984.
Such analyses of the major manpower elements of the Civil Service are used in continuing reviews of the overall career structure of the Service. Where particular problems are identified, more focussed analyses may be undertaken. For example, an earlier analysis of promotion blockages in 1983 led to the formation of an interdepartmental working group whose report made recommendations on the use of early retirement, flexible recruitment philosophies and performance related pay. These ideas were subsequently developed further and have now led to changes in the regulations governing Civil Service employment.
2.7 In other instances, Personnel Management Division has used information on the situation in the private sector. For example, as part of a review of the employment of scientists the division employed consultants to examine private sector employment practices and career patterns. This gave rise to proposals to offer short-service contracts for scientists. At about the same time, Personnel
Statistics Division were asked to investigate the implications of establishing a fast stream in the Science Group. Following an analysis of manpower stocks and career progression, a decision was taken to proceed with this proposal.
2.8 Whilst Personnel Management Division coordinates such exercises, the results and proposals are usually discussed in a wider forum before, if necessary, being put to Ministers. The forum may be an interdepartmental working group or an Establishment Officers’ Meeting.
Control systems
2.9 Departments have been required to project their manpower requirements as part of the annual Public Expenditure Survey for some years. Since 1986 they have also been required to project their overall running costs for personnel and other general administrative expenditure; and from 1987 to submit forward management plans, linking efficiency gain targets with medium-term funding agreements.
2.10 Running Costs Division, which is responsible for the policy aspects of the running costs regime, was also responsible for the earlier policy on manpower ceilings. The method chosen to achieve the Government’s explicit objective of reducing the size of the Civil Service was a system of progressively reducing manpower targets. Each department agreed a manpower ceiling to be met at 1 April each year; taken together the ceilings showed the desired reduction in manpower. Two main formal targets were set for the Service as a whole, one as at 1 April 1984 and a final one as at 1 April 1988, since when control has been exerted through the running costs regime instead. Table 3 shows that both targets were met.
Table 3
Reductions in Civil Service staff numbers
1 April 1984 630,000 623,972 1 April 1988 592,723 579,627
14

MANPOWER PLANNING IN THE CIVIL SERVICE
Figure 5
Movements of staff in the Administration Group Average annual number of staff in post, recruits, leavers and promotees, by grade, in the Administration Group of the Home Civil Service (excluding the Inland Revenue), 1979-1984
i?incipai 4,100
SE0 7.400
Figure 6
Promotion prospects for the Administration Group Percentage of each grade in the Administration Group expected to be promoted each year on average in the period 1985-1994, compared with actual average percentage 1975-1984
0 1 2 3 4 5 Rate of promotion
1.5% Contraction n 0% Growth m 1975 - 84 Actual
15
2.11 The two main formal targets were set by comments from departments. It addressed the Ministers collectively and reflected their judgement principles of manpower budgeting, acknowledged on the desired scale of activity. The Civil Service the links between manpower budgeting and Department (later the Treasury) had the task of manpower planning and noted that the multi- coordinating the planned ceilings of departments to departmental review had not related to manpower construct a viable path to each target. The Treasury planning as there defined. Departments had been developed the running costs control regime as a experiencing difficulty in applying delegated more efficient successor to manpower ceilings, but manpower budgeting against the background of believe that ceilings were effective in achieving an overall resource budgets in financial terms and initial impetus in manpower reductions. They also separate manpower ceilings. The Treasury believe believe &at they incr&ed management’s recognition of manpower as a valuable but costly asset.
2.12 The rationale for the move to control of running costs was to ensure that control was exerted over the full range of relevant resource inputs, and to provide departments with the opportunity and incentive to look for the most efficient mix of staffing and non-staffing expenditure and the most efficient distribution and grade mix of staff. Expenditure divisions are responsible for negotiating running cost provision with individual departments as part of the Public Expenditure Survey. As part of this process, they have to be satisfied that departments’ management plans will deliver efficiency gains of at least lf per cent a yea*; in some cases they will press for a higher figure.
Guidance to departments
2.13 The Civil Service Department issued detailed guidance to departments on the use of the MANPLAN programs in 1975. This was revised in 1985 and supplemented by a brief summary document “A Management Guide to Manpower Planning”, which outlined the possible uses of manpower planning and the available techniques. This summary was re-issued in 1987.
2.14 In the past three years there has been a succession of documents which have drawn attention to the benefits which can accrue from manpower planning analyses, leading to the requirement on departments to undertake manpower planning referred to in Part 1.
2.15 The first such document appeared in April 1986, when the Government published the report of a multi-departmental review of budgeting and undertook that its recommendations would be the basis for action in each department. In line with its comment cm the need for manpower planning quoted in paragraph 1.13 above, the report recommended that the Treasury should prepare more detailed central guidance on manpower . .
2.16 In December 1987, the Treasury issued revised guidance on the role and responsiblities of Principal Establishment Officers and Principal Finance Officers in departments. This indicated that each Accounting Officer should delegate to one of the Principal Officers, acting in consultation with the
! other, responsibility for planning manpower consistently with the department’s running costs limit.
that the decision to replace manpower ceilings with financial controls over running costs has greatly facilitated delegated budgeting as recommended in the multi-departmental review.
2.17 As mentioned in paragraph 1.14 above, further guidance was issued in draft form in July 1966 and confirmed in October 1966 after consultation with Principal Establishment Officers. The new guidance is intended to amplify the 1987 statement of Principal Officers’ responsibilities. It states that “an analysis of key manpower statistics and the construction of forward manpower planning projections are essential tools for informing departmental planning and personnel management policy work” and gives five reasons why departments need to carry out effective manpower planning:
(a] to ensure that there are appropriate personnel policies to provide the staff needed for current and prospective workloads;
(b) to plan the action necessary to recruit, retain and develop such staff;
(c) to deal with current or foreseen shortages or surpluses of staff;
(d) to resolve problems affecting the supply of skills: and
(e) to foresee, plan and manage the staffing implications of changes in department size, organisation, location and technology.
The guidance also points to a need for Treasury to have information about departments’ manpower analyses and plans “to help in reaching a timely and co-ordinated view of any Service-wide problems which may impact on central personnel management . planning and budgeting. A preliminary note was
issued by the Treasury in July 1986. It produced few policies”.
16

MANPOWER PLANNING IN THE CIVIL SERVICE
2.18 Departments are informed in the guidance that their planning process should be linked with the allocation and monitoring of resources through the Public Expenditure Survey and Estimates. Manpower plans are to be consistent with the resources available to departments and are to be regularly reviewed. The guidance instructs departments to undertake manpower planning to assess:
“ (i) the staff resources necessary to achieve planned output levels: and
(ii) the likely future demand for and supply of staff by grade or job level and discipline, and geographical area, covering all the main groups of staff in the department”.
The guidance does not prescribe the methods by
which such assessments are to be made; individual departments are free to adopt the methods most appropriate to their circumstances. Departments with more than 10,000 staff are instructed to send summaries of their analyses to the Treasury each November. These summaries will not automatically be used to support Survey bids. Departments may make use of such work to back up their bids if they wish, but they will then be considered alongside other bids.
2.19 Departments are advised to contact Personnel Statistics Division for further guidance, or in the event of difficulties in producing their initial reports. Part of the time of two professional staff in the manpower planning branch is available to attend to departmental queries.
17
MANPOWER PLANNING IN THE CI”!.L SERVICE
Part 3: The Audited Departments-Nature, Organisation and Management Processes
3.1 The NAO examined manpower planning in four line departments: the Department of Employment Group, the Home Office, the Inland Revenue and the Intervention Board for Agricultural Produce. These departments are illustrative of the wide range of sizes, types of work, locations and other factors found in the Civil Service, and consequently provide varied examples of the relevance of manpower planning. In each case the NAO looked at the department’s overall structure and procedures. But in all except the Intervention Board it was necessary to concentrate on particular operational units when selecting examples of the application of manpower planning.
Employment Service and the Training Agency are candidates to become executive agencies. The study concentrated on the part of the Employment Service dealing with the administration of unemployment benefit.
3.2 The Department of Employment has very close links on manpower and many other matters with two statutory bodies, the Advisory, Conciliation and Arbitration Service and the Health and Safety Executive. The three organisations are known collectively as the Department of Employment Group. The Department itself comprises a headquarters staff, the Employment Service and the Training Agency. The Employment Service was created in October 1987 from the unemployment benefit service within departmental headquarters and the Jobcentre network, which had until then been part of the Manpower Services Commission. The rest of the work of the Manpower Services Commission was taken over by the Training Commission; the Training Commission was in turn wound up in September 1988 and succeeded by the Training Agency.
3.4 The Home Office comprises the Prison Service (which accounts for 76 per cent of all Home Office staff) and a large number of other units covering a wide range of functions. It is the non-prisons part of the Home Office which is relevant to this study, because its component parts deal with widely disparate subjects and it is of interest to consider the applicability of manpower planning in such a case. The Home Office point out that they have made extensive use of manpower planning in the Prison Service, which is not covered by this report.
3.6 The functions of the non-prisons part of the Home Office include the administration of justice: criminal policy and constitutional matters: the police; immigration and nationality matters; the issuing of passports; community relations; and broadcasting. There were 9,393 staff at 1 April 1988, mainly in London and Croydon, but also in immigration offices at ports and airports and in a small network of regional passport offices. The study concentrated an the Passport Department-being considered for establishment as an executive agency-and B4 Division, the part of the Immigration and Nationality Department which deals with applications for British nationality.
3.3 All five parts of the Group are staffed by civil 3.6 The Inland Revenue are responsible for the servants and there is full transferability from one administration and collection of direct taxes: and for part to another for most staff, other than some the valuation of property for the purposes of specialists. The Group has as its primary aims the taxation, compensation and compulsory purchase, promotion of a competitive and efficient labour and rating. The department comprises a head office, market conducive to the growth of employment, and mainly in London, and three networks of local the reduction of unemployment. Its work includes offices, covering tax assessment, collection and administering unemployment be⁢ running valuation. There are two networks of regional programmes to help people into work; securing offices: one covws both tax and collection offices, arrangements for training; promoting good industrial and the other valuation offices. There are also a relations; and encouraging industry to maintain and small number of stamp offices and some single improve health and safety at work. The Group had offices dealing with (for example) pension schemes 58,302 staff at 1 April 1988, mainly in London and and inheritance tax. The Inland Revenue is the Sheffield and in a local office network. The largest of the departments examined, with 67,352
,:
18

staff at 1 April 1988. The study concentrated on the regional and local office networks.
3.7 The Intervention Board for Agricultural Produce was created in 1972 to implement in the United Kingdom most of the market support schemes of the Common Agricultural Policy of the European Community. The work arising on the schemes is dependent on market conditions, world prices and decisions taken by the European Agriculture Ministers. It is statutory and demand- led. Workloads are affected by changes in Community legislation, in support levels and exchange rates and in the response of producers, processors and traders. Change is continuous, often unpredictable and beyond the department’s effective influence or control. It was recently announced that the Board is to be a candidate for executive agency status. On 31 March 1988 it had 771 staff, mainly in Reading.
3.8 Table 4 shows how the total staff numbers for each department given in the preceding paragraphs
were distributed between the major components of the departments. It also shows how the total size of each department has changed in recent years; two of the departments have in fact grown significantly, because of major changes in workload, despite the cuts in the Service as a whole.
3.9 The rest of this part of the report outlines departments’ budgetary and other management processes and indicates broadly how manpower planning contributes to them. The next part describes the manpower planning processes and their application in more detail.
Organisational structure
3.10 The uniformity of Civil Service employment conditions and grading, and of accountability and control arrangements, leads to considerable similarity in the personnel structures and manpower responsibilities within Civil Service departments. Despite the great differences in size and function,
Table 4
Breakdown of departmental staff numbers
Department of Employment Group 58,302 +9.0 Department of Employment including Employment Service 42,102 Training Commission 12,165 Health and Safety Executive 3,410 Advisory, Conciliation and Arbitration Service 625
Home Office (non-prisons) Central Services Immigration Police Passport Department Other
1,634 3,265 2,603
948 943
9,393 +0.3
Inland Revenue Taxes Collection Valuation Other
43,333 8,304 6,004 9,711
67,352 -20.5
Intervention Board for Agricultural Produce 771 +48.6 Finance and Accounts 145 Central Services 181 External Trade 199 Livestock 149 Crops 97
19

the departments examined have many common features:
- Each has a central establishments division dealing with personnel management and policy issues and a central finance division coordinating resource management and bidding procedures. Where specialist units have been established to deal with staff inspection, organisation and methods or operational research, they are attached to a central division.
- Line divisions (those parts of each department responsible for policy and executive action on the department’s substantive functions) have responsibility for day-to-day personnel management. They are also generally responsible for making annual bids for staff resources: all four departments assess their overall manpower needs at least partly by aggregation of such bids, although other factors may also be taken into account.
consider the department’s material for the Public Expenditure Survey before its presentation to Ministers and also receive other management information-from systems established under the Financial Management Initiative or on an ad hoc basis-which makes use of manpower planning.
Budgetary processes
3.13 All departments must comply with Treasury requirements for the annual Public Expenditure Survey, which looks forward three years over programme and administrative expenditure and requires explicit coverage of manpower and running costs. During the 1987 Survey departments were required to prepare a full management plan covering their administrative expenditure, showing output and performance measures and value for money targets for the major areas of departmental activity. Running cost management plans are now a firm feature of Public Expenditure Surveys.
- Until recently most departments operated 3.14 In the departments examined, the preparation highly centralised control of manpower, but of bids for manpower resources is a two-way under the Financial Management Initiative line process. The baseline to be used, derived from the divisions have in many cases now obtained previous year’s settlement, is communicated by the some freedom in areas such as determination of centre to line divisions, together with any grade mix, recruitment of clerical staff, instructions arising from existing policy decisions authorisation of overtime and employment of and, where appropriate, indicative levels of future casuals, subjecl LU overall ruudng posts budgets. manpower requirements derived from centrally
operated forecasting and allocation models. Line 3.11 In the Department of Employment Group, each divisions then put forward their own bids, amending of the five component parts of the Group has its own any indicative levels given to them in the light of personnel and finance staff, although some parts local circumstances or prospective developments. have most of their finance services provided by the Both central and line division processes involve central Department of Employment finance division. elements of manpower planning. Senior The headquarters has units which coordinate management then take a view on any conflicting personnel and finance matters for the Group as a demands in preparing an overall departmental bid. whole. The Department of Employment and the Inland Revenue, the two departments with substantial local office networks, are also organised on a regional basis, with delegation of routine manpower functions such as clerical recruitment and staff deployment to regional personnel staff.
3.15 Departmental bids are considered by the Treasury, and subsequently in bilateral and collective Ministerial discussion, in the light of the overall availability of resources. Up to 1987, one of the outcomes of the Survey was an agreed manpower ceiling for each department. From the 1986Survey, the& have been-running costs limits
3.12 Each department has its own senior management structure for the consideration of
on all administrative expenditure, of which
departmental management issues. In the Department manpower expenditure is the dominant element; f ram 1988 these limits constitute the sole Survey-
of Employment, for example, the Permanent Secretary chairs two committees, the Senior
based control on manpower.
Management Group and the Secretary’s Strategy 3.16 Following the Survey, each department’s Group. The Grade 2 officers, the Principal running costs limit has to be allocated among the Establishment and Finance Officers and the heads of component parts of the department. In the larger the Employment Service and the Training Agency departments, manpower planning techniques are all members of one or both of these committees. contribute to this process. The outcome of the As another example, the Intervention Board has a Survey is also used as the basis for obtaining Senior Management Group chaired by the Chief financial provision through the Estimates Executive of the Board. Such committees usually procedures.
20

3.17 The Financial Management Initiative requires departments to introduce systems to improve the allocation and control of resources. The Initiative, together with the subsequent work on budgeting, has emphasised the need for departments’ internal systems to be integrated with the Public Expenditure Survey process. As a result, divisional reviews of performance and plans are submitted to the centre of departments. Manpower issues such as deployment, productivity and unit costs feature in the analyses provided by line divisions in the four departments examined, and often form the basis for value for money targets in the management plan. The review processes are timed so that decisions on targets and priorities can feed into the budgeting process, and any longer term issues which are revealed can be taken up in the Survey.
3.18 The departments examined had a variety of approaches to manpower budgeting, complementing and control. The Department of Employment, the Home Office and the Inland Revenue all operate devolved budgeting systems. Line managers are allocated running costs budgets, within which they generally have freedom to authorise overtime, employ casual staff, redeploy staff and vary grade mix. In doing so, they are expected to observe Treasury grading criteria and their decisions remain subject to staff inspection: in the Inland Revenue there also continues to be a system of indicative complements. Because of the comparatively small size of its units, the Intervention Board has decided to retain a formal, centralised complementing system, given a measure of flexibility by the use of “conceded posts”, posts which are approved subject to subsequent verification by staff inspection.
3.19 The management processes described above all draw on manpower planning analyses covering the demand for and utilisation of staff. On the demand side, where there are well-developed systems for workload forecasting, work measurement and staff deployment, they are used to inform Survey bids and budgeting and to monitor subsequent performance. Similarly, utilisation and productivity data and projections feed into the setting of value for money targets and the search for efficiency improvements. Information from such analyses cannot establish a single correct level of manpower resources, but it does provide a base from which to negotiate and enable the operational implications of the outcome to be understood.
3.20 The Inland Revenue provides an example of what can be achieved by the application of effective planning systems. The department, which has achieved the largest percentage reduction in staff in
recent years of the departments examined, used analysis of manpower stocks and wastage to help the smooth attainment of successive manpower ceilings. Subsequently, the department’s work measurement studies provided the basis for the increased manpower resources agreed in the 1987 Survey.
3.21 Developments following the Financial Management Initiative, and the Treasury’s insistence on management plans, are improving the quality of information available. The Intervention Board, for example, by agreement with the Treasury, made a token zero growth assumption in the Public Expenditure Survey up to 1986 because of the degree of uncertainty about their workload. In the 1987 Survey, however, the Board did make a growth assumption, based on historic trends; in 1988 attempts were made to introduce productivity indicators to link manpower estimates to forecast programme activity; and in 1989 the Board plan to take this process further. (These changes are described in more detail in paragraph 4.13 below.)
Personnel management
3.22 All departments’ personnel management activities are based on common terms and conditions of employment and pay and grading regulations. Some activities such as staff appraisal and recruitment are governed by requirements or guidance promulgated by the Treasury or the Cabinet Office, or take place to centrally imposed timetables. Departments therefore have similar aims of and approaches to personnel management. But there is no personnel process which has the same effect as the Public Expenditure Survey of imposing a rigid discipline and common procedural requirements on all departments. There are therefore some differences in the ways in which departments approach personnel management.
3.23 The approach to the use of manpower planning in this area is, however, similar in all the departments examined, although the details of its application vary according to the scope of the information available. Regular activities such as postings, promotions and recruitment draw on manpower planning analyses of workload and utilisation-often indirectly via the resource allocation processes-and on stock and supply analyses undertaken in establishment divisions. Stock and supply analysis also underpins the formulation of personnel policies. Activities such as the identification of training needs and skills analyses make little use of manpower planning.
21

MANPOWER PLANNING IN THE CIVIL SERVICE
Part 4: The Elements of Departmental Manpower Planning
4.1 The following paragraphs describe the manpower planning activities in the four line departments examined. In line with the definition of manpower planning given in paragraph 1.2 above, the processes are considered under the headings of demand; utilisation and manpower stock analysis; and supply.
Assessment of demand for manpower
4.2 There are two stages in the assessment of demand for manpower: first the assessment of workload, which establishes the amount of work which needs to be done; and then work measurement, which establishes the numbers and grades of staff which are required to process a given quantity of work. Both elements are necessary for an accurate assessment of the staffing level required by a department in a particular set of circumstances. But the ease of assessment will vary with the nature of the work: workload can be assessed more readily where the variables are within the control of the department than where they are demand-led; work measurement is more suitable for repetitive executive functions than for policy work.
u Workload
4.3 Each department examined maintains records of workload, usually in terms of number of cases handled-for example, the number of Pay As You Earn and self-employed taxpayers, unemployment benefit payments made, passport applications processed, grant claims met. For each department there are many such measures, adding up to a total covering the bulk of departmental staff but usually excluding staff engaged on policy analysis or certain central activities. The effort which departments put into forecasting future workload varies, depending both on the view taken by management of the value of such forecasts and on the technical problems associated with achieving the desired degree of accuracy. The following paragraphs illustrate ways in which this basic tool of manpower planning is handled in each of the departments.
4.4 The Inland Revenue have a simulation model, the Personal Tax Model, which can be used to calculate the tax liability of each type of taxpayer with different assumptions about income tax rates
and allowances. It can, for example, be used to estimate the effect of raising tax allowances on tax yields, the size of individuals’ tax bills and the number of people liable for tax and hence the effect on staffing requirements.
4.8 Another technique, which the Inland Revenue use to forecast the future workload of the Taxes and Collection Networks for the purposes of the Public Expenditure Survey, is the extrapolation of known levels of workload for past years, adjusted for projections of future changes in relevant factors such as the size of the taxpayer population. Thus for the 1987 Survey forecasts of workload for the years 1988-89 to 1990-91 were based on the actual load for the last four available years, statistically updated from various sources, including Treasury and Department of Employment forecasts of the size of the labour force and the level of economic activity. As part of an internal exercise in June 1988 the original forecasts of workload, and hence of manpower requirements, were compared with the actual April 1988 figures. In terms of manpower requirements the overall variation between the two was 10 staff years in a total requirement of 43,000. This difference masks some larger variations from individual components of the original forecast.
4.6 On occasion even the relatively sophisticated forecasting carried out by the Inland Revenue has not been enough to avoid manning problems. For example, in the early 1980s the combination of a very rapid rise in self-employment, general pressure on manpower levels and a reorganisation of the tax office network led to significant backlogs of work in 1984 and 1985. In 1985 the Inland Revenue instituted measures, known as the Workstate Initiative, to counter this problem, drawing on manpower planning information in framing the corrective measures.
4.7 The Department of Employment Group has to assess the likely workload for its unemployment services on the basis of assumptions about the level of unemployment drawn from an analysis of past trends: as a matter of Government policy, more detailed forecasting of unemployment is not undertaken. These assumptions underlie both the Survey process and the budgeting and Estimates
22

MANPOWER PLANNING IN THE CIVIL SERVICE
processes. The fact that the assumptions are derived from past trends means that they are generally quite accurate when the movement in unemployment levels is reasonably constant; they were less impressive around the turn in the trend of unemployment in 1987. Table 5 shows the variation between the assumption of average annual unemployment for recent years, made about six months before the start of the year in question, and actual levels of unemployment in those years. Because of the seasonality of unemployment, assumptions are also made about quarterly unemployment levels; from these, monthly assumptions are derived and fed into budgeting and complementing arrangements.
Table 5
Unemployment assumption compared with outturn
1984-85 - 3.95%
1985-86 - 1.89%
1986-87 - 1.33%
1987-88 +16.78%
4.8 In the Home Office, the Passport Department has to cater for the continuing growth in travel and therefore in the demand for passports. In estimating future annual workload, the Passport Department takes account of historical trends, forecasts made by the travel industry and an apparent lo-year cycle in the growth of demand. But it has no prescribed method of pulling these factors together, and actual demand in any given year is affected both by short- term factors such as the weather, currency fluctuations and political instability and by medium- term factors such as the state of the economy. Table 6 compares the number of passports issued in each of the last two financial years with the Passport Department’s pre-year forecasts. The Passport Department informed the NAO that they use issue figures as a basis for planning. In the view of the
Table 6
The demand for passports Number of passports issued compared with forecast
1986-87 Z&063,586 2,186,142 + 5.9
1987-88 2,404,755 2,098,879 -12.7
NAO, issue figures give a less effective guide to the volatility of workload than application figures would. There is a marked seasonal variation in demand, with a large peak in applications from February to August. The Passport Department is well aware of the general shape of the demand profile but is not able to forecast the precise timing of peak demand or the scale of the peak in any given year.
4.9 The workload of B4 Division increased recently as a result of provisions in the British Nationality Act 1981, which required certain categories of people to apply by 31 December 1987 if they wished to register as British citizens. As Figure 7 shows, this led to two very sharp peaks in the monthly level of applications, one in 1983 following implementation of the Act and one in 1987 prior to the deadline. [The figure understates the 1987 peak because it excludes applications not sent to casework staff groups by September 1988.)
4.10 In 1986, a forecast was produced of the scale of the expected 1987 peak. Home Office statisticians used the 1983 Labour Force Survey data to help to estimate the population of potential applicants, but there was little evidence on which to base the crucial assumption about the proportion of that population who would actually apply. The forecast produced was of 90,000 applications in 1987-88. This compared with an average intake of 60,000 applications over the previous few years. The estimated number of applications actually received in 1987-88 was 306,000, of which 116,000 were not subject to the 31 December 1987 deadline. The number of staff dealing with citizenship applications increased by 112 per cent between 1986-87 and 1988-89. By 1 April 1989, 37,000 of the applications for registration made before December 1987 had been completed. But there is still a substantial backlog of unprocessed applications, meaning significantly extended processing times for applicants. The estimate is that the backlog will not be cleared until April 1990.
4.11 The levels of workload in the Intervention Board are also subject to short-term factors. Fluctuations in market prices can lead to significant variations in the amount of buying and selling of a product undertaken by the department, or alternatively in the level and take-up of market support subsidies. In addition the department has on occasion to face the introduction of new schemes at short notice. There are cycles of demand in various Intervention Board schemes, but these are less regular than, for example, those in the Passport Department. In the short term, the department monitor market prices to help predict likely demand
23

Figure 7
Applications for British nationality Number of applications for British nationality passed to casework groups in B4 Division of the Home Office for action each month, and moving average, 1983-1988
20000
15000
10000
5000
0
Actual
_-_--_ Moving average
IIIIIII E ~.-.“““““““““““‘IIIIIIIIIIIIIIIII D-r E E’-” cm 6 E‘^” c (D g 8-m ~‘~‘~‘~‘.“~‘b’~‘:,‘~‘.! PO_ .50 .m_ .- .-
Note: This figure excludes 127,000 applications received by the Home Office but not sent to casework groups at September 1988
for intervention buying. For longer-term purposes, which they are able to make of the material. The including the Public Expenditure Survey, the following paragraphs give examples of the Intervention Board until recently made no approaches which the NAO found in each considered forecast of its workload prospects. department. (The term “work measurement” is Latterly, however, it has adopted a more structured variously used: in a broad sense, to describe the approach, as described in paragraphs 4.13-4.15 translation process, however achieved; and in a below. narrower sense, to describe a particular kind of
exercise, as described below for the two larger m Work measurement
4.12 The departments examined have different approaches to the translation of forecast workload into manpower requirements. The degree of sophistication employed directly affects the use
24
departments in this study.)
4.13 At the Intervention Board, manpower requirements for Year 1 of the Public Expenditure Survey are produced by each branch on a monthly
MANPOWER PLANNING IN THE CIVIL SERVICE
profile. Up to and including the 1986 Survey, the requirements were extrapolated to Years 2 and 3 assuming a constant future workload. The Treasury were content with this approach because of the problems of making accurate forecasts of future workload, but it regularly resulted in in-year requests for extra re.sources as significant growth in activities actually occurred.
4.14 When the requirement for a management plan was introduced in the 1987 Survey, in view of a tendency towards more--and more complex- schemes, the Board assumed for Years 2 and 3 that its manpower would need to grow at 4 per cent a year. Historical staffing growth had been 8 per cent, but the Board set itself the task of absorbing half the growth by increased efficiency. In the 1988 management plan attempts were made for the first time to link workload to forecasts of intervention activity, mainly produced by the Ministry of Agriculture, Fisheries and Food, reflecting volatile factors such as market prices or commodity production. Nevertheless in that year’s Survey the department again relied on a standard assumption of 4 per cent growth in manpower.
4.15 For 1989, the Board plan to take the process a stage further. Line managers have been asked to provide forecasts of their requirements for all three years of the Survey period based on predicted levels of activity. After making allowance for unforeseen developments and an adjustment for efficiency savings, these forecasts will be used both for the management plan and as the basis for the Board’s Survey manpower bid. The Board is also recruiting an operational researcher to assist the introduction of work measurement in the longer term.
4.16 The Home Office have used a performance indicator approach. In B4 Division this approach has been developed to express workload in “case unit equivalents”, where cases of different complexity are accorded different weightings. The total forecast of case units is then translated into a manpower requirement by the application of “case factors”, standard expected outputs of case units per staff member.
4.17 The Department of Employment Group have used work measurement techniques for many years to aid their assessment of manpower requirements for the administration of unemployment benefit. Every four years or so a formal exercise is carried out, covering all grades in the regional office network. The department use activity sampling and work diary techniques to establish the actual time spent on activities. Using statistical analysis, the results are combined with workload measures to
provide standard work times. The standard times are then multiplied with workload measures to provide appropriate manpower levels for each office. The system permits some allowance to be made for the different circumstances found in different regions. The results of these exercises are fed into the Staffing Basis Scheme, which is used to determine manpower levels in the unemployment benefit service. The 1983 review led to revisions to the Scheme which would have saved 1,100 posts if applied to 1982-83. A further review was undertaken in 1988; it reported after the NAO’s fieldwork was complete.
4.18 The Inland Revenue use work measurement techniques in their three local office networks. For example, until 1981 the clerical complementing of local offices in the Taxes and Collection Networks was based on a combination of staff inspection and management judgements, but this approach was superseded by a range of activity sampling exercises which reported in 1983 and 1984. But inconsistencies and other limitations were found in the results, and in April 1984 work was initiated on a new more extensive and rigorous work measurement regime for clerical staff in the Taxes and Collection Networks. The Inland Revenue’s justification for this exercise was as follows:
“If the sole objective were to ascertain overall network needs, work measurement is a costly method and one which takes a long time to produce results. But where, as in this case, the objectives of the exercise go deeper than overall needs, to enable principal activities to be measured so as to provide a better basis for costing the effects of change and for distributing overall resources between regions, no alternative approach offering the same degree of reliability is available.”
4.19 The approach employed was similar to that adopted by the Department of Employment, but with more emphasis on direct activity analysis as opposed to work diaries, and with activities broken down into more, smaller categories. As a result of the work measurement exercise started in 1984, the Treasury and the Inland Revenue agreed an increase from 1988-89 of around 1,000 staff in tax offices at Revenue Executive and Revenue Officer level. The introduction of an allowance for trainees, to reflect their below average effectiveness, was the most significant factor in the changed staffing estimate.
4.20 In applying the results of work measurement exercises, departments need to take into account the Government’s policy of efficiency gain targets for departments. The departments examined respond to
25

MANPOWER PLANNING IN THE CIVIL SERVICE
this in different ways. In the Home Office the B4 and on analysing the initial data. Both systems work Division casework factor-the number of units of to a statistical accuracy of t 3 per cent; but the work expected of each member of staff-was Inland Revenue collect activity data in more detail projected to increase by 3 per cent a year over the and make greater use of the more reliable but more period of the 1987 Survey. The Department of expensive direct activity studies. Although it is not Employment and the Inland Revenue generally plan easy to attribute savings directly to these exercises, efficiency gains in the light of staff inspection both departments appear to have gained a reports or in response to changes in basic substantial net benefit from them. For example, the procedures, resulting from such events as efficiency Inland Revenue as a result has a better system for reviews or changes in the nature of the work. allocating rescmrces cost effectively and for
estimating the staffing consequences of tax changes; 4.21 The level of effort which the departments it has also been able to make substantial reductions have put into work measurement is reflected in the in the rescmrces devoted to staff inspection. use which they are able to make of the results. All have obtained a general indication of overall resource requirements and a basis for monitoring Utilisation and manpower stock analysis progress. Results from the more detailed systems can inform staff allocation, complementing and grading 4.23 The application of manpower planning decisions in some detail, and provide a basis for techniques to issues concerning an organisation’s assessing the scope for efficiency improvements and existing manpower stock has three purposes. First, managing changes in the organisation of work. Both manpower planning can assist in the allocation of the Department of Employment and the Inland staff; second, it can monitor the use to which staff Revenue have associated their work measurement are being put, to measure such factors as efficiency exercises with grading reviews. Three reviews of the gains; and third, it can analyse characteristics of the local office networks in the Inland Revenue between existing manpower stock to provide a base for 1985 and 1988 led to increased use of lower grade considering future questions of demand and supply. posts, with annual savings of fll million. The Department of Employment’s 1983 review recommended the regrading of work to save around E13.5 million.
4.22 Detailed work measurement exercises carry a substantial additional cost, though they can to some degree replace other types of staffing survey which also carry costs. Simpler systems use information which would in any case be available for general management purposes, and the marginal cost of their application to manpower planning is low. By contrast, the Department of Employment spend about EZO,OOO every four years or so on in-house updates of their work measurement information on unemployment benefit. The Inland Revenue have spent mere than E:2 million over a period of four years-10 per cent of which was consultants’ fees-on setting up the work measurement
m Staff allocation
4.24 The departments examined approach the allocation of staff to particular operational units in different ways. The Department of Employment Group and the Inland Revenue have the closest links between complementing and formal manpower planning procedures. Both departments use complementing models to allocate staff to their regional networks. In the Inland Revenue this process was extended in 1988 when the clerical complementing model became operational alongside the existing one for Inspector grades. The Home Office and the Intervention Board mainly rely on a more judgemental process, supported by staff inspection, though the Board have used formula complementing to a limited extent in some areas of
framework for the Taxes and Collection Networks their work,
26

MANPOWER PLANNING IN THE CIVIL SERVICE
4.25 The complementing models draw on the outputs of the departments’ work measurement exercises and combine them with forecasts of workload to produce indicative staff allocations at both regional and local levels. Where available resources are less than these indicative allocations, the models can allocate resources between regions on the basis of established priorities. The complementing models are also operated using actual workload data to compare with earlier forecasts. This provides a monitoring mechanism. Table 7 is taken from an explanatory document, prepared for managers, about the Inland Revenue model. It shows with illustrative figures how the model might be used in a hypothetical tax office to compare forecast staff usage with actual staff usage in the Revenue Officer grade.
4.26 The use of complementing models helps to ensure a degree of consistency in staff utilisation. But the systems depend on the accuracy of both workload and work measurement data, neither of which can be wholly accurate. Moreover, the achievement of good utilisation depends on the ability to take the necessary personnel actions quickly: in practice, agreements with staff, employment regulations and local staffing
m Monitoring staff utilisation
4.27 The monitoring of staff utilisation can take a number of forms. The necessary data may be derived from the flow of information required for the operation of complementing systems, where these exist. Otherwise, management information systems usually provide data on output, productivity or unit costs which can provide indications of manpower utilisation. Local management is usually free to redeploy staff within its area of responsibility, but if revisions to overall resources are required, central finance or establishment units (or, where appropriate, regional management) must be consulted.
4.28 Overall trends in manpower utilisation are not easily extracted or interpreted: many management information systems are of recent origin, and changes in the nature of activities can cloud the picture. Nevertheless, all the departments examined have made some attempt at such analysis.
4.29 The Inland Revenue use a wide range of performance indicators (including unit costs and volume and quality targets) to monitor or‘ target the amount and quantity of their output. One simple example directly related to staff usage is caseload per staff year. A 1987 analysis of clerical staff productivity in the Taxes and Collection Networks ^. .
circumstances all impose constraints on the speed of showed a 16 per cent increase in productivity adjustment. Nevertheless, the complementing between 1982-83 and 1986-87. This figure is of systems provide useful information on the extent of particular interest because the period covered is that any problems and hence the background against at which the major work measurement exercises which personnel decisions should be made. were taking place. But it must be viewed with
Table 7
Comparison of actual with forecast workload at Revenue Officer level for a hypothetical tax office
Schedule E Schedule D and
Corporation Tax Claims Trusts Other
Total 25.40 24.50 -0.90 - 3.5%
27

Figure 8
Productivity in the Valuation Office in England and Wales relative to the 1980-81 level, 1981-82 - 1986-87
124-
= 2 120- e 2 118-
z 6 116-
% d 114-
% 3 112-
9 E llO-
108-
106-
104-
102-
100* 1980-81 1981-82 1982-83 1983-84 1984-85 1985-86 1986-87
YekiT = PES 86 + PES 87
caution, because at the same time there was a million (at 1987 prices) in 1988-89; this figure is serious deterioration in the workstate in these expected to be more than doubled in 1989-90. networks, followed by the Workstate Initiative which included a number of remedial actions, such as the temporary abandonment of some procedures 4.30 In the Department of Employment’s and additional overtime and casual working. These unemployment benefit service, cost per payment developments well illustrate the difficulty in made is used as an indicator of efficiency, and costs producing meaningful time series in this area. In the are dominated by manpower costs. Table 8 shows Valuation Office Network, however, the same performance over the latest three available years, in problems did not arise: Figure 8 shows a 28 per cent cash and real terms. There have been some increase in productivity between 1980-81 and fluctuations. and the figures conceal greater changes 1986-87. Taking the department as a whole, the in the pattern of work: an increasing number of staff greatest gains have come from computerisation deployed to ensure that claimants satisfy the programmes. Computerisation of Pay As You Earn regulations governing entitlement to benefit, had secured its target saving of 4,600 posts by 1 countered by savings from the introduction of April 1989. Schedule D work too has now been computerised systems. Another relevant measure is computerised; this achieved savings of 1,200 posts the number of claimants per staff member. The by 1 April 1989 and is expected to save a further annual average rose from 114 in 1983-84 to 122 in 1,065 posts by 1 April 1992. These systems have 1984-85 as a result of revisions to the Staffing Basis already produced estimated savings of cover El5 Scheme following the 1983 work measurement
28
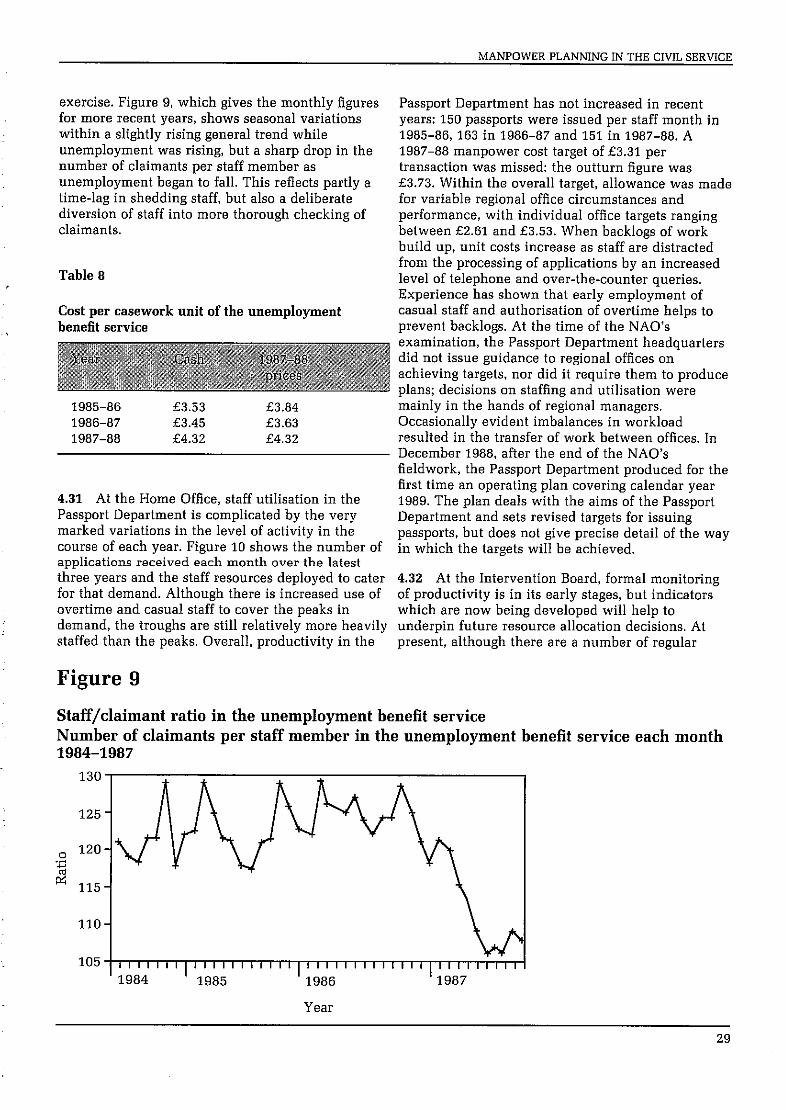
MANPOWER PLANNING IN THE CIVIL SERVICE
exercise. Figure 9, which gives the monthly figures for more recent years, shows seasonal variations within a slightly rising general trend while unemployment was rising, but a sharp drop in the number of claimants per staff member as unemployment began to fall. This reflects partly a time-lag in shedding staff, but also a deliberate diversion of staff into more thorough checking of claimants.
Table 8
Cost per casework unit of the unemployment benefit service
Passport Department has not increased in recent years: 150 passports were issued per staff month in 1985-86,163 in 1986-87 and 151 in 1987-88. A 1987-88 manpower cost target of f3.31 par transaction was missed: the outturn figure was f3.73. Within the overall target, allowance was made for variable regional office circumstances and performance, with individual office targets ranging between f2.61 and f3.53. When backlogs of work build up, unit costs increase as staff are distracted from the processing of applications by an increased level of telephone and over-the-counter queries. Experience has shown that early employment of casual staff and authorisation of overtime helps to prevent backlogs. At the time of the NAO’s examination, the Passport Department headquarters did not issue guidance to regional offices on achieving targets. nor did it require them to produce plans; decisions on staffing and utilisation were
1985-86 f3.53 E3.84 mainly in the hands of regional managers. 1986-87 E3.45 f3.63 Occasionally evident imbalances in workload 1987-88 f4.32 f4.32 resulted in the transfer of work between offices. In
December 1988, after the end of the NAO’s fieldwork, the Passport Department produced for the first time an operating plan covering calendar year
4.31 At the Home Office, staff utilisation in the 1989. The plan deals with the aims of the Passport Passport Department is complicated by the very marked variations in the level of activity in the
Department and sets revised targets for issuing
course of each year. Figure 10 shows the number of passports, but does not give precise detail of the way
applications received each month over the latest in which the targets will be achieved,
three years and the staff resources deployed to cater 4.32 At the Intervention Board, formal monitoring for that demand. Although there is increased use of of productivity is in its early stages, but indicators overtime and casual staff to cover the peaks in which are now being developed will help to demand, the troughs are still relatively more heavily underpin future resource allocation decisions. At staffed than the peaks. Overall, productivity in the present, although there are a number of regular
Figure 9
Staff/claimant ratio in the unemployment benefit service Number of claimants per staff member in the unemployment benefit service each month 1984-1987
125 -
105 I,, , , , , , , , , , , , , , , , , ( , , , , , , , , ,, ( , , , , , , , , 1984 ’ 1985 ’ 1986 ’ 1987
Year
29

MANPOWER PLANNING IN THE CIVIL SERVICE
Figure 10
Workload and staffing in the Passport Department Number of passport applications received, and levels of permanent and casual staffing and overtime working, in the Passport Department, 1985-88 - 1987-88
1800
1500 22 2 cn
1200
900
600
Permanent Casual pJ
Overtime - Applications 480
360 ‘;; z z z .s z ;r:
230 5
Note: The Passport Department informed the NAO that they consider the applications received figures to be liable to error and consequently use issue figures as a basis for planning.
30
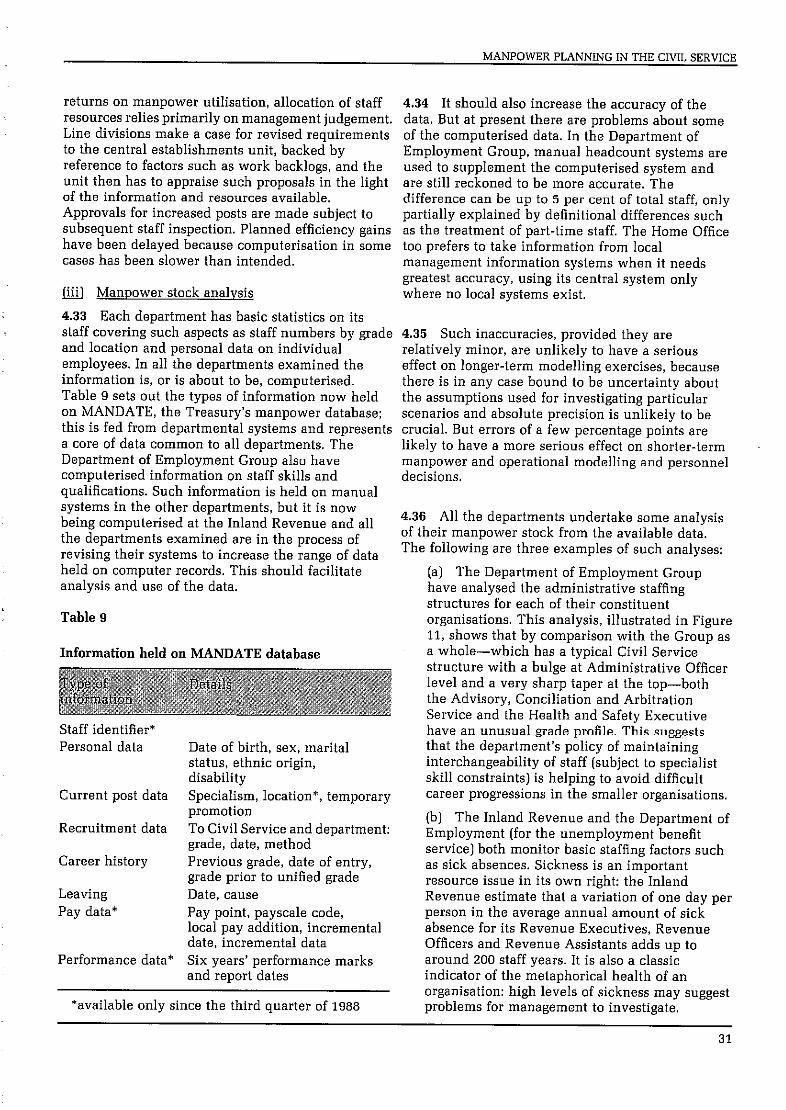
MANPOWER PLANNING IN THE CIVIL SERVICE
returns on manpower utilisation, allocation of staff resources relies primarily on management judgement. Line divisions make a case for revised requirements to the central establishments unit, backed by reference to factors such as work backlogs, and the unit then has to appraise such proposals in the light of the information and resources available. Approvals for increased posts are made subject to subsequent staff inspection. Planned efficiency gains have been delayed because computerisation in some cases has been slower than intended.
u Manpower stock analysis
4.33 Each department has basic statistics on its staff covering such aspects as staff numbers by grade and location and personal data on individual employees. In all the departments examined the information is, or is about to be, computerised. Table 9 sets out the types of information now held on MANDATE, the Treasury’s manpower database; this is fed from departmental systems and represents a core of data common to all departments. The Department of Employment Group also have computerised information on staff skills and qualifications. Such information is held on manual systems in the other departments, but it is now being computerised at the Inland Revenue and all the departments examined are in the process of revising their systems to increase the range of data held on computer records. This should facilitate analysis and use of the data.
Table 9
Information held on MANDATE database
Staff identifier* Personal data
Current post data
Recruitment data
Career history
Leaving Pay data*
Performance data*
Date of birth, sex, marital status, ethnic origin, disability Specialism, location*, temporary promotion To Civil Service and department: grade, date, method Previous grade, date of entry, grade prior to unified grade Date, cause Pay point, payscale code, local pay addition, incremental date, incremental data Six years’ performance marks . and report dates
*available only since the third quarter of 1988
4.34 It should also increase the accuracy of the data. But at present there are problems about some of the computerised data. In the Department of Employment Group, manual headcount systems are used to supplement the computerised system and are still reckoned to be more accurate. The difference can be up to 5 per cent of total staff, only partially explained by definitional differences such as the treatment of part-time staff. The Home Office too prefers to take information from local management information systems when it needs greatest accuracy, using its central system only where no local systems exist.
4.35 Such inaccuracies, provided they are relatively minor, are unlikely to have a serious effect on longer-term modelling exercises, because there is in any case bound to be uncertainty about the assumptions used for investigating particular scenarios and absolute precision is unlikely to be crucial. But errors of a few percentage points are likely to have a more serious effect on shorter-term manpower and operational modelling and personnel decisions.
4.36 All the departments undertake some analysis of their manpower stock from the available data. The following are three examples of such analyses:
[a) The Department of Employment Group have analysed the administrative staffing structures for each of their constituent organisations. This analysis, illustrated in Figure 11, shows that by comparison with the Group as a whole-which has a typical Civil Service structure with a bulge at Administrative Officer level and a very sharp taper at the top-both the Advisory, Conciliation and Arbitration Service and the Health and Safety Executive have an unusual grade profile. This suggests that the department’s policy of maintaining interchangeability of staff (subject to specialist skill constraints) is helping to avoid difficult career progressions in the smaller organisations.
(b) The Inland Revenue and the Department of Employment (for the unemployment benefit service) both monitor basic staffing factors such as sick absences. Sickness is an important resource issue in its own right: the Inland Revenue estimate that a variation of one day per person in the average annual amount of sick absence for its Revenue Executives, Revenue Officers and Revenue Assistants adds up to around 200 staff years. It is also a classic indicator of the metaphorical health of an organisation: high levels of sickness may suggest problems for management to investigate.
31

MANPOWER PLANNING IN THE CIVIL SERVICE
Figure 11
Grade profiles in the Department of Employment Group Number of staff at each grade in the Advisory, Conciliation and Arbitration Service and the Health and Safety Executive compared with the Department of Employment Group as a whole
I
I
ACAS HSE
Note: Each green band represents one grade, from Administrative Assistant at the bottom to the Senior Open Structure at the top. Grade bands are to scale within each organisation, but not from one organisation to another.
32

(c) The Inland Revenue, in common with other departments, have a database on wastage rates covering all grades at all their regional and local offices. For clerical grades this shows low wastage in the north but high and increasing wastage in London and the South East. Similar patterns are noted in the other departments. The picture for staff up to Grade 7 in the Department of Employment Group is shown in Figure 12. Wastage among Intervention Board staff in Reading and staff turnover in B4 Division of the Home Office at Croydon were both running at 26 per cent in 1987-88.
Manpower supply analysis
4.37 In the short term all the departments examined are aware of problems in recruiting the staff they need, particularly in London and the South East. These problems are well illustrated by Figure 13, which shows the Intervention Board’s experiences in recruiting Administrative Officers, Administrative Assistants and support staff in
Figure 12
Reading over the past three years. In spite of continuous recruitment efforts, the number of both applications and applicants has been falling, though the position recovered somewhat in 1987-88.
4.38 A system of local pay additions has recently been introduced to ease recruitment and retention problems at some locations. Another potential solution is relocation of work. The Inland Revenue are in the course of completing a project, known as Exit London, to move a range of inspector posts out of London, and have developed a model to help them plan these moves. The Home Office opened a new office in Liverpool in August 1988 to handle certain nationality work, easing the load on the Croydon office. The London branch of the Passport Department will have all its postal work transferred to Glasgow. A study is also under way on whether any parts of the Immigration and Nationality Department could be moved away from London. In the case of the Intervention Board, proposals for a wholesale relocation from Reading to Newcastle or Cardiff were rejected in 1986. The Board are now drawing up plans to move a third of their staff away
Wastage in the Department of Employment Group Number of resignations of staff in the grades Administrative Assistant to Grade 7 from the Department of Employment Group, by region each quarter, 1987-88
600 1
Scot NW N Y&H Wales Mids L&SE SW
33

MANPOWER PLANNING IN THE CIVIL SERVICE
Figure 13
Recruitment to the Intervention Board for Agricultural Produce Numbers of applications for and appointments to posts at Administrative Officer, Administrative Assistant and Support Services levels in the Intervention Board, 1985-88 to 1987-88
225
‘85-86’86-87’87-8t 85 - 86 86 - 87 87 - 8
Applications 0 Appointments
Support Services
85 - 86’ 86 - 87’87 - 8,
from Reading. They have also established a temporary outstation at Newcastle to assist in clearing a backlog of work. The Department of Employment Group are drawing up plans for the possible transfer of most headquarters staff out of London.
based on the MANPLAN suite of programs. In the former department, this modelling has been under development for some years but has been fully applied only since 1987. The department is in the early stages of using the results to identify problems. Such information underpins the Group’s Human Resource Development Strategy. The results of some
4.39 Departments have also looked for other of the early modelling are illustrated in Figure 14. solutions to the immediate problem. As an example, Chart (a) shows the prospect of reduced average the Intervention Board have actively pursued rates of promotion across the Administration Group, measures such as local pay additions, part-time exacerbated if the overall size of the Group were to working, job sharing and flexible working in order to shrink. The results of this trend are a build-up of tap all parts of the labour market, and are surplus promotable staff, again more serious if the continually looking for new channels for Group size decreases-chart (b-and an associated recruitment publicity. Their efforts in this direction upward shift in the age profile of the Group-chart are among the topics covered in a new three-year (c). Analysis is continuing on these and related Personnel Management Plan, produced in February problems with the aim of including in the Strategy 1989, which sets out the present position on the full recommendations for revised approaches to staff range of the Board’s personnel management appraisal and development, communications, the responsibilities. working environment, pay, qualifications and staff
mobility. 4.40 While manpower planning can contribute to identifying possible short-term solutions, supply 4.41 Modelling at the Inland Revenue has been in modelling is particularly relevant to the longer term. place since the early 1980s. Routine modelling of The Department of Employment Group and the flows is carried out, similar to that in the Inland Revenue have developed modelling facilities Department of Employment Group, to identify
34
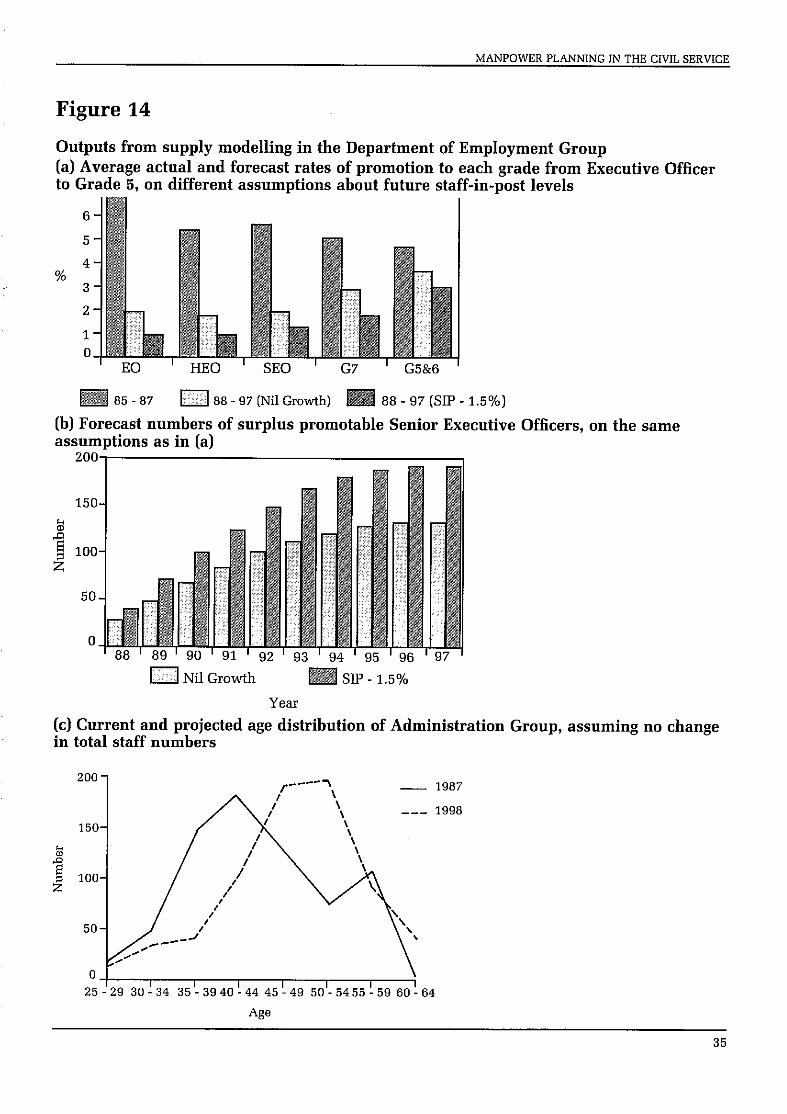
Figure 14
Outputs from supply modelling in the Department of Employment Group (a) Average actual and forecast rates of promotion to each grade from Executive Officer to Grade 5, on different assumptions about future staff-in-post levels
6
5
4 % 3
2
1 0
85 - 87 m 88 - 97 [Nil Growth) 88-97(SIP-1.5%)
(b) Forecast numbers of surplus promotable Senior Executive Officers, on the same assumptions as in [a)
D Nil Growth SIP - 1.5%
Y&ST
(c) Current and projected age distribution of Administration Group, assuming no change in total staff numbers
* /Y----1,, 1 :I;;
” I I I I I I I I
25-29 30-34 35-3940-4445-49 50-5455-5960-64
35

MANPOWER PLANNING IN THE CIVIL SERVICE
potential problems. When such a problem emerges 4.42 In 1985, the Institute of Manpower Studies more detailed analysis is carried out and solutions reviewed the Inland Revenue’s manpower planning are sought. For example, a shortage of Non-Fully and concluded that their planning and management Trained Inspectors has been identified. A modal was of human resources were carried out as effectively developed to define the extent of the problem and to as in any organisation known to the Institute. investigate the implications for career prospects. As Following the review, further improvements were a result, the Inland Revenue has created alternative made by the development of regional modelling career patterns, to help the more able tax officers facilities and of databases on wastage. move up into the Inspector grades and to take near- misses from the Fully Trained Inspector graduate entry scheme.

Appendix
Manpower planning in other organisations
Summary of a survey by the Institute of Personnel Management
1. In 1988, the Institute of Personnel Management undertook a survey of its membership to determine the extent to which personnel practitioners were making use of the kinds of manpower planning practices and techniques recommended by the Institute. This appendix summarises the Institute’s initial analysis of the responses.
2. A questionnaire was issued to all corporate members of the Institute in March 1968. It contained a sequence of questions about specific manpower planning practices, the use of computers in manpower planning, the inclusion of manpower issues in strategic business plans and departmental responsibility for manpower planning issues.
3. 245 questionnaires were returned, from members in a wide range of business sectors and sizes of organisation. From these responses, the Institute drew a number of broad conclusions.
4. First, the responses overall indicated a high general level of manpower planning activity. In all but one of the activity areas covered by the questionnaire, 70 per cent or more of the respondents were taking some form of action, on either a regular or an ad hoc basis.
5. Second, particularly high levels of activity were evident in a number of areas, including reviewing the external business environment, assessing the need for structural change resulting from business plans, analysing current manpower stocks and identifying future training, retraining and development needs.
6. Third, there was a significant level of computer use in manpower planning among the respondents.
38 per cent of the sample indicated that they were using computers for manpower supply and demand forecasting.
7. Fourth, in the overwhelming majority of cases, the personnel function was responsible for operating manpower planning systems. Of those respondents who operated a formal manpower planning system, over 85 per cent indicated that this was administered by personnel.
6. Fifth, 43 per cent of respondents indicated that manpower issues were covered in the strategic business plans of their organisations at both an organisation-wide and a departmental level. Only 17 per cent indicated that manpower issues were not automatically covered in their strategic business plans.
9. Sixth, a very large majority of the respondents had obtained business benefits from operating manpower planning systems. Over 80 per cent of the respondents operating formal manpower planning systems had found them beneficial in improving identification of training needs, achieving more appropriate staffing levels and improving management development. Over 60 per cent had found that manpower planning had led to increased employee productivity and savings in unit labour costs. Table 10 details the responses to the questions about benefits.
10. Finally, the most significant obstacle to the introduction of formal manpower planning systems appeared to be the low priority given to planning compared with immediate management concerns. 58 per cent of the respondents quoted this as a major difficulty. Table 11 summarises the responses on this point.
37
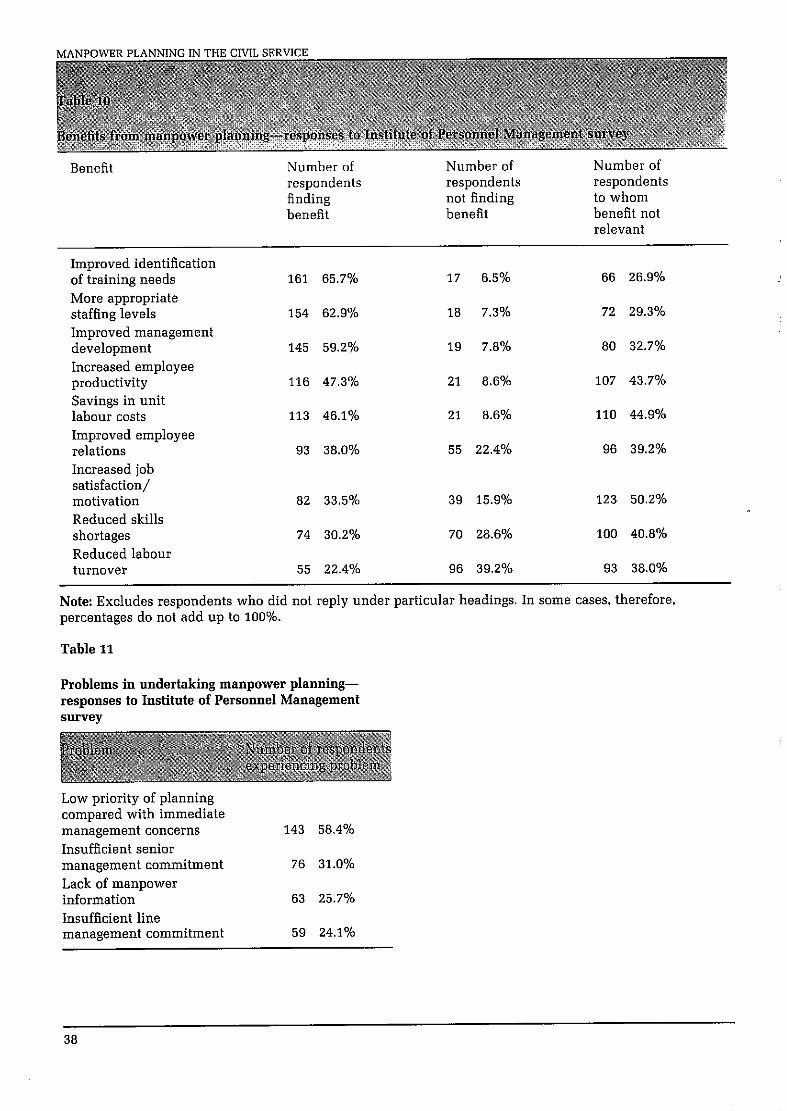
Benefit Number of Number of respondents respondents finding not finding benefit benefit
Number of respondents to whom benefit not relevant
Improved identification of training needs More appropriate staffing levels Improved management development Increased employee productivity Savings in unit labour costs Improved employee relations Increased job satisfaction/ motivation Reduced skills shortages Reduced labour turnover
161 65.7%
154
145
116
113
93
62.9%
59.2%
47.3%
46.1%
38.0%
82
74
55
33.5%
30.2%
22.4%
17
18
19
21
21
55
39 15.9% 123 50.2%
70 28.6% 100 40.8%
96 39.2% 93 38.0%
6.5%
7.3%
7.8%
8.6%
8.6%
22.4%
66 26.9%
72 29.3%
80 32.7%
107 43.7%
110 44.9%
96 39.2%
Note: Excludes respondents who did not reply under particular headings. In some cases, therefore, percentages do not add up to 100%.
Table 11
Problems in undertaking manpower planning- responses to Institute of Personnel Management survey
Low priority of planning compared with immediate management concerns Insufficient senior management commitment Lack of manpower information Insufficient line management commitment
143 58.4%
76 31.0%
63 25.7%
59 24.1%
38