managing operational well integrity prioritising repairs ... · managing operational well integrity...
TRANSCRIPT
Title Page IMPERIAL COLLEGE LONDON
Department of Earth Science and Engineering
Centre for Petroleum Studies
MANAGING OPERATIONAL WELL INTEGRITY – PRIORITISING REPAIRS TO MINI-
MISE RISK.
By
Chimdike Emmanuel Ihe
A report submitted in partial fulfilment of the requirements for
the MSc and/or the DIC
September 2012
Imperial College London
ii Managing Operational Well Integrity – Prioritising Repairs to Minimise Risk
DECLARATION OF OWN WORK
I declare that this thesis
‘Managing Operational Well Integrity – Prioritising Repairs to Minimise Risk’
is entirely my own work and that where any material could be construed as the work of others, it is
fully cited and referenced, and/or with appropriate acknowledgement given.
Signature:………………………………………………………….
Name of student: Chimdike Emmanuel Ihe
Name of supervisor: PROFESSOR PETER KING (Imperial College)
MR. IAN TAYLOR (Industry)
Managing Operational Well Integrity – Prioritising Repairs to Minimise Risk iii
ACKNOWLEDGEMENTS
This project would not have been completed without the support of my supervisors Prof. Peter
King (Imperial College) and Ian Taylor (Shell) whose confidence in this work, assistance and gentle
steer has resulted in this product. Special thanks to Stathis Kitsios (Shell) for the opportunity. I am
grateful to the staff of Shell U.K. Limited for access to the database used in this work and for the help
received.
I am indebted to Petroleum Technology Development Fund (PTDF) and the government of
Nigeria, without whose sponsorship I may not have had a great program at Imperial College London.
Finally, I appreciate my wife and daughter, Hope and Chimemerie, for their support, patience
and understanding throughout my MSc programme.
London, August 2012.
Chimdike Ihe
iv Managing Operational Well Integrity – Prioritising Repairs to Minimise Risk
Table of Contents Title Page ............................................................................................................................................................... i
DECLARATION OF OWN WORK ......................................................................................................................... ii
ACKNOWLEDGEMENTS ..................................................................................................................................... iii
Table of Contents ................................................................................................................................................. iv
LIST OF FIGURES ............................................................................................................................................... vi
LIST OF TABLES ................................................................................................................................................ vii
ABBREVIATIONS ............................................................................................................................................... viii
Abstract ................................................................................................................................................................. 1
Introduction ........................................................................................................................................................... 1
Problem Statement/Justification......................................................................................................................................... 2
Objectives. ......................................................................................................................................................................... 2
Literature Review .................................................................................................................................................. 2
Explanation of Terms. ........................................................................................................................................................ 3
Well Barrier. .................................................................................................................................................. 3
Failures, Faults and Errors ............................................................................................................................ 4
Wellhead Integrity Test (WIT). ..................................................................................................................... 4
Well Failure Model (WFM). .......................................................................................................................... 5
Deviation. ...................................................................................................................................................... 5
Methodology ......................................................................................................................................................... 5
Data Extraction. ................................................................................................................................................................. 5
Data Filtration. .............................................................................................................................................. 6
Well Failure Frequency. ................................................................................................................................ 6
Failure repair profile ..................................................................................................................................... 6
Deviation and Failure Causes........................................................................................................................ 6
Data Set-up. ....................................................................................................................................................................... 6
Default Information. ..................................................................................................................................... 7
Derived Information. .................................................................................................................................... 7
Results and Discussion ........................................................................................................................................ 7
Failure History Analysis. ................................................................................................................................................... 7
Observations .................................................................................................................................................................... 10
Severity Frequency (SF). .................................................................................................................................................. 11
Use of Severity Frequency (SF) in Sparing Level Determination .................................................................................... 12
Qualitative Risk Assessment of Deviated Wells. ............................................................................................................. 15
Conclusions ........................................................................................................................................................ 15
Recommendation for Further Studies ................................................................................................................. 16
Nomenclature ..................................................................................................................................................... 16
References.......................................................................................................................................................... 16
Managing Operational Well Integrity – Prioritising Repairs to Minimise Risk v
APPENDIX A - Critical Literature Review ........................................................................................................... 17
APPENDIX B – Definitions ................................................................................................................................. 35
APPENDIX C - WIMS Database ........................................................................................................................ 38
APPENDIX D – Failure Rate, MTTF and Reliability. .......................................................................................... 40
APPENDIX E – Qualitative Risk Assessment. ................................................................................................... 43
vi Managing Operational Well Integrity – Prioritising Repairs to Minimise Risk
LIST OF FIGURES
Figure 1: Well Barriers (NORSOK D-010) ............................................................................................................................ 3 Figure 2: Illustration of the difference between failure, fault and error (Rausand and Høyland, 2004) ................................. 4 Figure 3: Schematic of a typical WIT Procedure .................................................................................................................... 5 Figure 4: Workflow Schematic ............................................................................................................................................... 6 Figure 5: Data Set-up Spread Sheet ........................................................................................................................................ 6 Figure 6: Valve Failure Contribution (NNS) .......................................................................................................................... 8 Figure 7: Repair Performance (NNS) ..................................................................................................................................... 8 Figure 8: Valve Failure Contribution (SNS) ........................................................................................................................... 9 Figure 9: Repair Performance (SNS) .................................................................................................................................... 10 Figure 10: Causes of Deviation ............................................................................................................................................. 10 Figure 11: Reliability Confidence Limits (Gaslift Wells) ..................................................................................................... 14 Figure 12: Reliability Confidence Limits (with Integrity Level) .......................................................................................... 14 Figure 13: Cut set diagram .................................................................................................................................................... 15
Figure C - 1: WIMS Interface ............................................................................................................................................ 38 Figure C - 2: The grace period is based on the Well Failure Model ........................................................................... 39 Figure C - 3: Action Codes................................................................................................................................................ 39
Figure E- 1: Well Cross-section (Corneliussen, 2006) ................................................................................................. 43 Figure E- 2: Barrier Vectors (Corneliussen, 2006) ........................................................................................................ 44 Figure E- 3: Simplified Cut Sets Diagram ....................................................................................................................... 45
Managing Operational Well Integrity – Prioritising Repairs to Minimise Risk vii
LIST OF TABLES
Table 1: Well Type Classification in NNS ............................................................................................................................. 7 Table 2: Failure Analysis Result (NNS) ................................................................................................................................. 8 Table 3: Well Classification on SNS ...................................................................................................................................... 9 Table 4: Failure Analysis Result (SNS) .................................................................................................................................. 9 Table 5: IR and SF values of different well types (NNS) ....................................................................................................... 12 Table 6: IR and SF values of different well types (SNS) ........................................................................................................ 12 Table 7: SF result for Claron field ........................................................................................................................................ 13 Table 8: MTBF values per well type..................................................................................................................................... 13 Table 9: Failure rate determination ....................................................................................................................................... 13 Table 10: Valve Availability ................................................................................................................................................. 13 Table 11: Expected failures in period ................................................................................................................................... 14 Table 12: PWV stocking levels and test frequency ............................................................................................................... 15 Table A- 1: Milestone in Well Integrity Management. ................................................................................................... 18 Table B-1: Definition of terms. .......................................................................................................................................... 37
Table E- 1: Cut Sets of Barrier Vectors (Corneliussen, 2006) ..................................................................................... 45
viii Managing Operational Well Integrity – Prioritising Repairs to Minimise Risk
ABBREVIATIONS
ALARP As Low As Reasonably Practicable
AMV Annulus Master Valve
AOGCC Alaska Oil & Gas Conservation Commission
AV Annulus Valve
AWV Annulus Wing Valve
CTRL Control Line
ELC External Leak Check
ESD Emergency Shut Down
KV Kill Valve
KPI Key Performance Indicator
MTBF Mean Time Between Failures
MV Master Valve
MVNPT Master Valve Non Pressure Test
NCS Norwegian Continental Shelf
NNS Northern North Sea
NORSOK Norsk Sokkels Konkurranseposisjon
OLF Oljeindustriens Landsforening (The Norwegian
Oil Industry Association)
PLMV Production Lower Master Valve
PRA Pressure Reading ‘A’ Annulus
PSA Petroleum Safety Authority
PUMV Production Upper Master Valve
PWV Production Wing Valve
RAM Risk Assessment Matrix
SCCR Surface Casing Corrosion Review
(SC)SSSV (Surface Controlled) Sub-Surface Safety Valve
SIL Safety Integrity Level
SIT Subsurface Integrity Test
SNS Southern North Sea
SV Swab Valve
SWED Significant Well Event Data
UKCS United Kingdom Continental Shelf.
WBE Well Barrier Elements
WFM Well Failure Model
WIF Well Integrity Forum
WIMS Well Integrity Management System
WIT Wellhead Integrity Test
WIM Wellhead Integrity Management
WVNPT Wing Valve Non Pressure Test
Managing Operational Well Integrity – Prioritising Repairs to Minimise Risk ix
It is highly “....recommended that the operating companies review their in-
house management systems for compliance with the requirements in the
regulations for barriers and how this is distributed and actively used inter-
nally in order to reduce the chances for any incidents.”
– PSA Audit, 2006.

Managing Operational Well Integrity – Prioritising Repairs to Minimise Risk Chimdike Emmanuel Ihe
Supervisors: Prof. Peter King (Imperial College, London) and Ian Taylor (Shell U.K. Limited, Aberdeen)
Abstract A well provides the conduit through which hydrocarbon flows from the reservoir to the production facility at the surface,
and is the containment barrier once hydrocarbons are released from the reservoir. Although the integrity of all well barrier
components is constantly threatened by wear, tear and degradation, it has to be assured all through the life of the well.
Active vigilance and attention is therefore required to ensure a continuous operation with minimal risk of damage to lives,
environment and assets. Operators are however faced with the challenge of prioritising and meeting the target time of risk
reducing activities such as repairs, integrity testing, etc.
This study presents a data-driven philosophy for well integrity management and repair strategy based on the well integrity
measures of one North Sea operator. It investigates the failure and repair data of 504 wells in two areas of the North Sea
section on the United Kingdom Continental Shelf (UKCS) namely Northern North Sea (NNS) and Southern North Sea
(SNS) from Jan. 2006 to June 2012.
This study shows the need to effect well integrity management on a well duty basis. This is because of some observed
connection between failure drivers and frequencies of well component failures on one hand, and the operating philosophy
of the well on the other. This invariably enhances well integrity management by helping operators prioritize on integrity
activities.
The Severity Frequency (SF) concept is developed and introduced as a basis for failure trend comparison among well types
or groups and well components. This parameter which has the potential for application in planning, well integrity
management and performance assessment is applied in evaluating well integrity test intervals, expected annual failures and
limiting levels of valve spares. The outcome of the analysis showed that there is indeed a link between well type and flow
conditions The Severity Frequency (SF) is derived from failure history data.
Introduction The basic function of an oil and gas producing well is to provide a safe and cost effective conduit for hydrocarbon fluids
from the reservoir to processing facilities at surface. Safety is defined by IEC 61508 as “freedom from unacceptable risk”.
Risk is defined as the combination of the probability of occurrence of harm and the severity from that harm (NORSOK Z-
013). A well therefore should be designed and operated to minimize blowout or well release risk. Although the importance
of well safety has been recognised for a long time in the industry, the focus on operational well integrity monitoring has
only heightened in recent years after regulators and government agencies investigated several incidents which occurred in
the oil industry. Significant amongst which is the Snorre A gas blow out incident which was reviewed by the Petroleum
Safety Authority (PSA). It was considered to be the worst to have occurred on the Norwegian shelf in terms of the potential
of the blow out (Petroleum Safety Authority, 2005).
Regulations require that an operator develops its internal procedures based on the principles in the regulations, while ‘the
role of the authorities is to ensure that operators follow their own procedures’ (Corneliussen, 2006). The operator should
ensure that the well is managed to as low as is reasonably practicable (ALARP) (ref. DCR regulations) and must minimise
Imperial College London
2 Managing Operational Well Integrity – Prioritising Repairs to Minimise Risk
blowout risk by the use of well barriers, control the well barrier status when in operation and take necessary actions given
unacceptable risk.
Operators have risen in various ways to manage operational well integrity. Operations and integrity management manuals
have been developed and deployed by operators; management systems to comply with local legislations are also in use in-
cluding the application of web-based well integrity management tools. For instance Shell, a major operator in Europe has
deployed a web-based Well Integrity Management System (WIMS) tool which helps in the continuous monitoring of well
integrity data. Its standards are applied through this tool and therefore ensure rapid identification of non-conformance and
timely remedial action.
Problem Statement/Justification.
Despite improvements in well integrity, operators are still faced with the challenge of prioritising risk reducing activities
(e.g. well head maintenance, repairs and integrity testing) without deferring critical activities. This is often followed up by
the struggle to meet the target time for these activities, such as the inability to fix well component failures within a defined
time frame. These challenges are recognised in the industry as they could have an impact on well integrity. This study is
therefore driven by a strong need for a continuous 100% control of well integrity.
Objectives.
The objectives of this study are:
To analyse failure data – specifically to establish systematic tendencies in failures.
To recommend well integrity improvement options including a stocking strategy – to mitigate risk.
To carry out a risk exposure examination – so as to understand to what extent integrity is compromised.
Literature Review Well Integrity is defined as the “application of technical, operational and organisational solutions to reduce risk of uncon-
trolled release of formation fluids throughout the life cycle of a well” (NORSOK D-010, 2004). This is the widely accepted
definition in the industry.
A well undergoes different phases in its life cycle – design, construction, operations and abandonment. NORSOK D-010
(2004) standard requires that there should be at least two well barriers in place throughout the life cycle of the well. Alt-
hough Well Integrity has long had the attention of the industry, operational Well Integrity Management as it is known today
commenced in the early 21st century. Joint efforts in the industry (e.g. OLF in Norway) have resulted in the introduction of
common best practices for Well Integrity Management.
The early oil boom eras, resulting from the high demand for energy by expanding world economies witnessed the fast track
development of oil and gas fields wherein direct costs and drilling time became key performance indicators (KPIs). Wells
became stretched beyond their projected life span and soon started having problems leading to incidents (Sultan, 2009)
some of which include the Prudhoe Bay explosion and fire in August, 2002 (AOGCC, 2003) and the Snorre A gas blow out
which occurred in November 2004 (PSA, 2005). According to Pettersen et al (2006), the incident did not appear to be the
result of chance or “bad luck” but it emerged that the Snorre A organisation had operated with a relatively high operational
risk. This particular incident was characterised as one of the most serious to occur on the Norwegian shelf based on its po-
tential (PSA, 2005). The PSA (2006) executed an audit in which it recommended the creation of Well Barrier Schematics
(WBS) for each well on the Norwegian Continental Shelf (NCS) in accordance with NORSOK D-010 standard. NORSOK
D-010 (2004) standard describes requirements of well integrity and barrier system design and maintenance. The OLF 117
(2011) guidelines developed barrier schematics for wells in the operational phase and a system for classifying a well based
on its integrity status. The American Petroleum Institute RP14B (1994) and RP14H (1994) documents specify allowable
leak rate across the Subsurface Safety and Upper Master Valves and describes how it can be determined. It also describes
testing procedure of these valves and how failures should be reported. Guidelines on the determination of minimum Safety
Integrity Levels (SIL) are reflected in OLF 070 (2004) which it adapted from IEC 61508 and 61511 standards.
Individual as well as groups of companies, have put in resources to develop well integrity management systems, tools and
procedures to ensure the integrity of newly drilled wells and older producing ones (Corneliussen et al., 2007). Some of the
packages incorporated into these tools include; well parameter monitoring and recording, casing and cement design and
Managing Operational Well Integrity – Prioritising Repairs to Minimise Risk 3
evaluation, leak detection, corrosion erosion monitoring and wellhead integrity monitoring. Furthermore, application of
real-time technology has advanced Well Integrity Management (Chitale et al., 2010) and improved processes are being
developed to manage the Integrity of idle and mature wells better (Kairon et al., 2008).
Although many improvements in well integrity have occurred in recent years, there has been little or no focus on testing
frequencies and stocking levels per well duty. Testing tends to be done on a calendar basis. This study seeks to improve the
process by introducing a data driven philosophy for well integrity testing and repair strategy.
Explanation of Terms.
This section will briefly explain some terms on which this study is based. Appendix B contains an extensive list of defini-
tions commonly used in this field of study.
Well Barrier.
NORSOK D-010 (2004) defines a well barrier is an envelope consisting of one or several dependent well barrier elements
(WBEs) that together prevent fluids from escaping from the formation into another formation or to the surface. This implies
that the failure of one well barrier element (WBE) results in the failure of the well barrier system. The barriers which are
meant to reduce the overall risk associated with the well, have a great influence on well risk in the operational phase. There
must be “at least two well barriers available during all well activities and operations, including suspended or abandoned
wells.....” (NORSOK D-010, 2004). The industry has adopted this two barrier policy. In the event of the breakdown of a
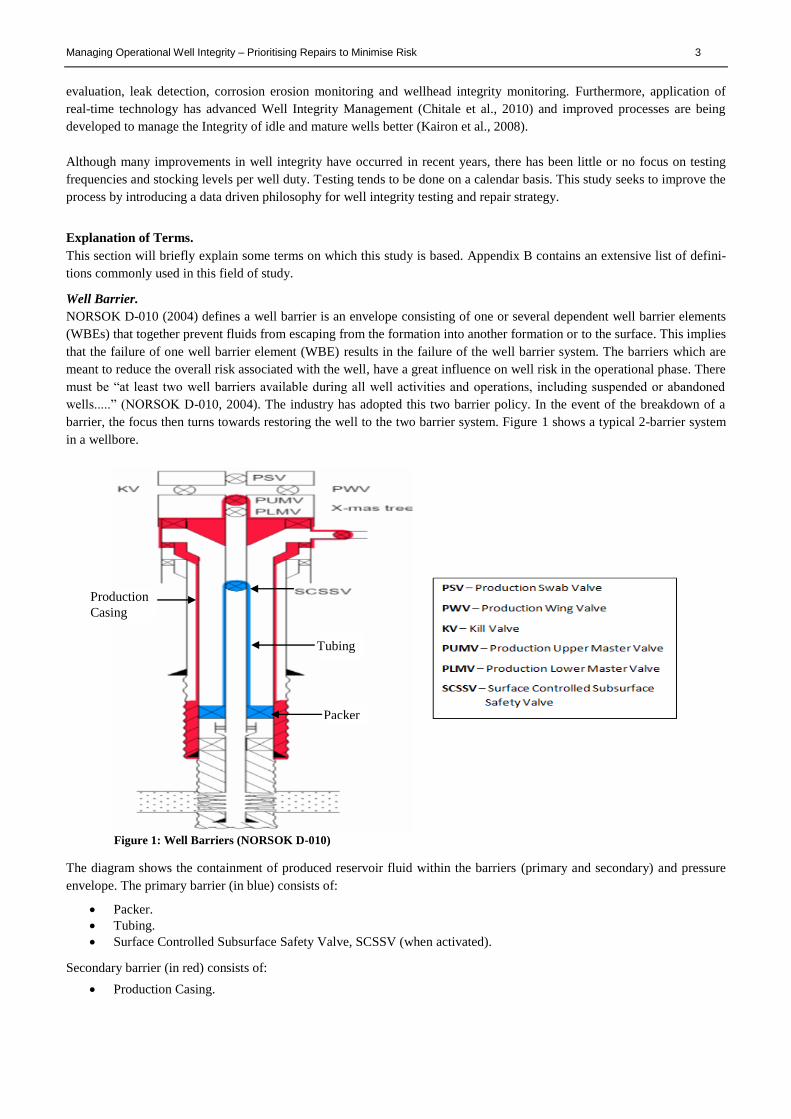
barrier, the focus then turns towards restoring the well to the two barrier system. Figure 1 shows a typical 2-barrier system
in a wellbore.
Figure 1: Well Barriers (NORSOK D-010)
The diagram shows the containment of produced reservoir fluid within the barriers (primary and secondary) and pressure
envelope. The primary barrier (in blue) consists of:
Packer.
Tubing.
Surface Controlled Subsurface Safety Valve, SCSSV (when activated).
Secondary barrier (in red) consists of:
Production Casing.
Tubing
Packer
Production
Casing
4 Managing Operational Well Integrity – Prioritising Repairs to Minimise Risk
Wellhead and side outlet valves.
Christmas (xmas) tree valves
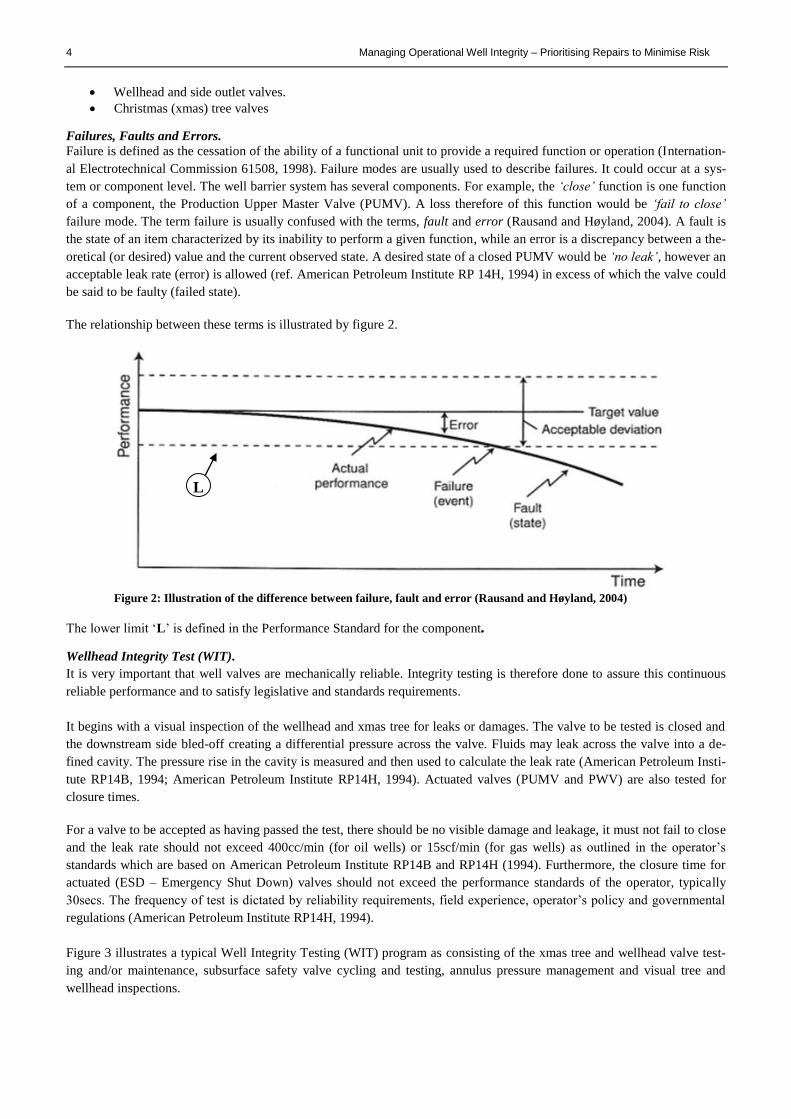
Failures, Faults and Errors.
Failure is defined as the cessation of the ability of a functional unit to provide a required function or operation (Internation-
al Electrotechnical Commission 61508, 1998). Failure modes are usually used to describe failures. It could occur at a sys-
tem or component level. The well barrier system has several components. For example, the ‘close’ function is one function
of a component, the Production Upper Master Valve (PUMV). A loss therefore of this function would be ‘fail to close’
failure mode. The term failure is usually confused with the terms, fault and error (Rausand and Høyland, 2004). A fault is
the state of an item characterized by its inability to perform a given function, while an error is a discrepancy between a the-
oretical (or desired) value and the current observed state. A desired state of a closed PUMV would be ‘no leak’, however an
acceptable leak rate (error) is allowed (ref. American Petroleum Institute RP 14H, 1994) in excess of which the valve could
be said to be faulty (failed state).
The relationship between these terms is illustrated by figure 2.
Figure 2: Illustration of the difference between failure, fault and error (Rausand and Høyland, 2004)
The lower limit ‘L’ is defined in the Performance Standard for the component.
Wellhead Integrity Test (WIT).
It is very important that well valves are mechanically reliable. Integrity testing is therefore done to assure this continuous
reliable performance and to satisfy legislative and standards requirements.
It begins with a visual inspection of the wellhead and xmas tree for leaks or damages. The valve to be tested is closed and
the downstream side bled-off creating a differential pressure across the valve. Fluids may leak across the valve into a de-
fined cavity. The pressure rise in the cavity is measured and then used to calculate the leak rate (American Petroleum Insti-
tute RP14B, 1994; American Petroleum Institute RP14H, 1994). Actuated valves (PUMV and PWV) are also tested for
closure times.
For a valve to be accepted as having passed the test, there should be no visible damage and leakage, it must not fail to close
and the leak rate should not exceed 400cc/min (for oil wells) or 15scf/min (for gas wells) as outlined in the operator’s
standards which are based on American Petroleum Institute RP14B and RP14H (1994). Furthermore, the closure time for
actuated (ESD – Emergency Shut Down) valves should not exceed the performance standards of the operator, typically
30secs. The frequency of test is dictated by reliability requirements, field experience, operator’s policy and governmental
regulations (American Petroleum Institute RP14H, 1994).
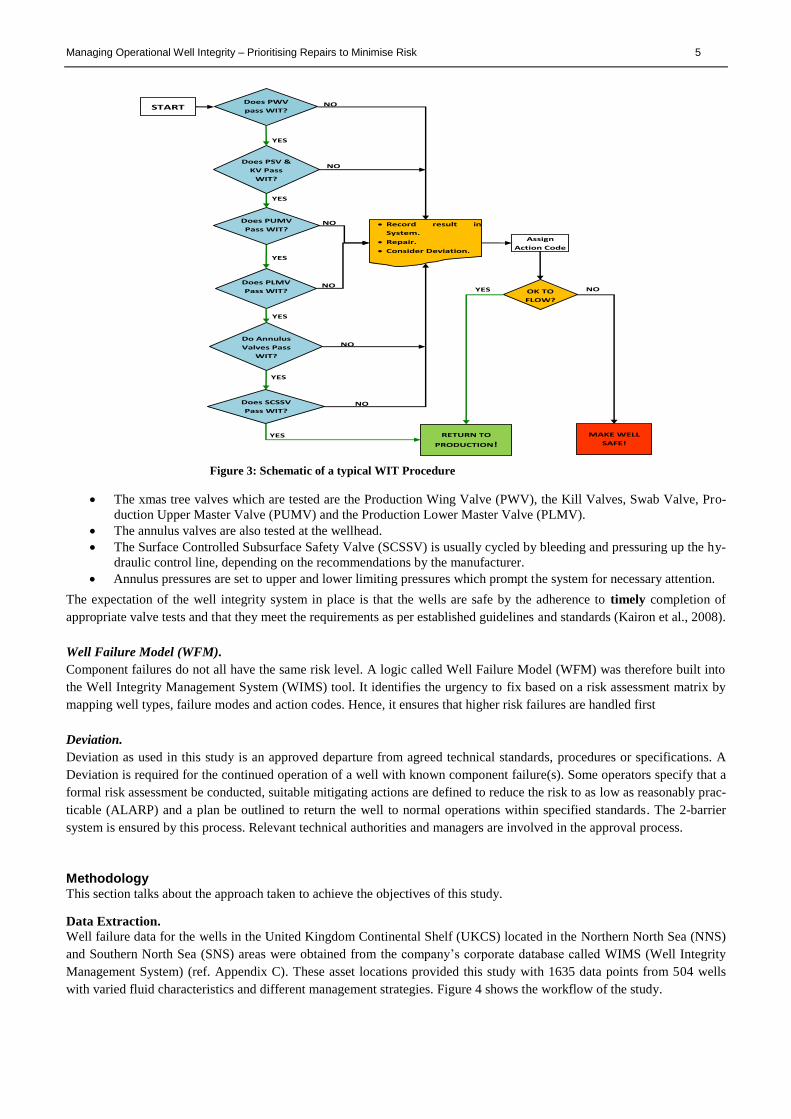
Figure 3 illustrates a typical Well Integrity Testing (WIT) program as consisting of the xmas tree and wellhead valve test-
ing and/or maintenance, subsurface safety valve cycling and testing, annulus pressure management and visual tree and
wellhead inspections.
L
Managing Operational Well Integrity – Prioritising Repairs to Minimise Risk 5
Figure 3: Schematic of a typical WIT Procedure
The xmas tree valves which are tested are the Production Wing Valve (PWV), the Kill Valves, Swab Valve, Pro-
duction Upper Master Valve (PUMV) and the Production Lower Master Valve (PLMV).
The annulus valves are also tested at the wellhead.
The Surface Controlled Subsurface Safety Valve (SCSSV) is usually cycled by bleeding and pressuring up the hy-
draulic control line, depending on the recommendations by the manufacturer.
Annulus pressures are set to upper and lower limiting pressures which prompt the system for necessary attention.
The expectation of the well integrity system in place is that the wells are safe by the adherence to timely completion of
appropriate valve tests and that they meet the requirements as per established guidelines and standards (Kairon et al., 2008).
Well Failure Model (WFM).
Component failures do not all have the same risk level. A logic called Well Failure Model (WFM) was therefore built into
the Well Integrity Management System (WIMS) tool. It identifies the urgency to fix based on a risk assessment matrix by
mapping well types, failure modes and action codes. Hence, it ensures that higher risk failures are handled first
Deviation.
Deviation as used in this study is an approved departure from agreed technical standards, procedures or specifications. A
Deviation is required for the continued operation of a well with known component failure(s). Some operators specify that a
formal risk assessment be conducted, suitable mitigating actions are defined to reduce the risk to as low as reasonably prac-
ticable (ALARP) and a plan be outlined to return the well to normal operations within specified standards. The 2-barrier
system is ensured by this process. Relevant technical authorities and managers are involved in the approval process.
Methodology This section talks about the approach taken to achieve the objectives of this study.
Data Extraction.
Well failure data for the wells in the United Kingdom Continental Shelf (UKCS) located in the Northern North Sea (NNS)
and Southern North Sea (SNS) areas were obtained from the company’s corporate database called WIMS (Well Integrity
Management System) (ref. Appendix C). These asset locations provided this study with 1635 data points from 504 wells
with varied fluid characteristics and different management strategies. Figure 4 shows the workflow of the study.
YES
YES
YES
YES
YES
YES
NO
NO
NO
NO
Does PWV
pass WIT?
Does PSV &
KV Pass
WIT?
RETURN TO
PRODUCTION!
Does PLMV
Pass WIT?
START
Do Annulus
Valves Pass
WIT?
NO
NO
Record result in
System.
Repair.
Consider Deviation.
Assign
Action Code
OK TO
FLOW?
MAKE WELL
SAFE!
NO YES
Does PUMV
Pass WIT?
Does SCSSV
Pass WIT?
6 Managing Operational Well Integrity – Prioritising Repairs to Minimise Risk
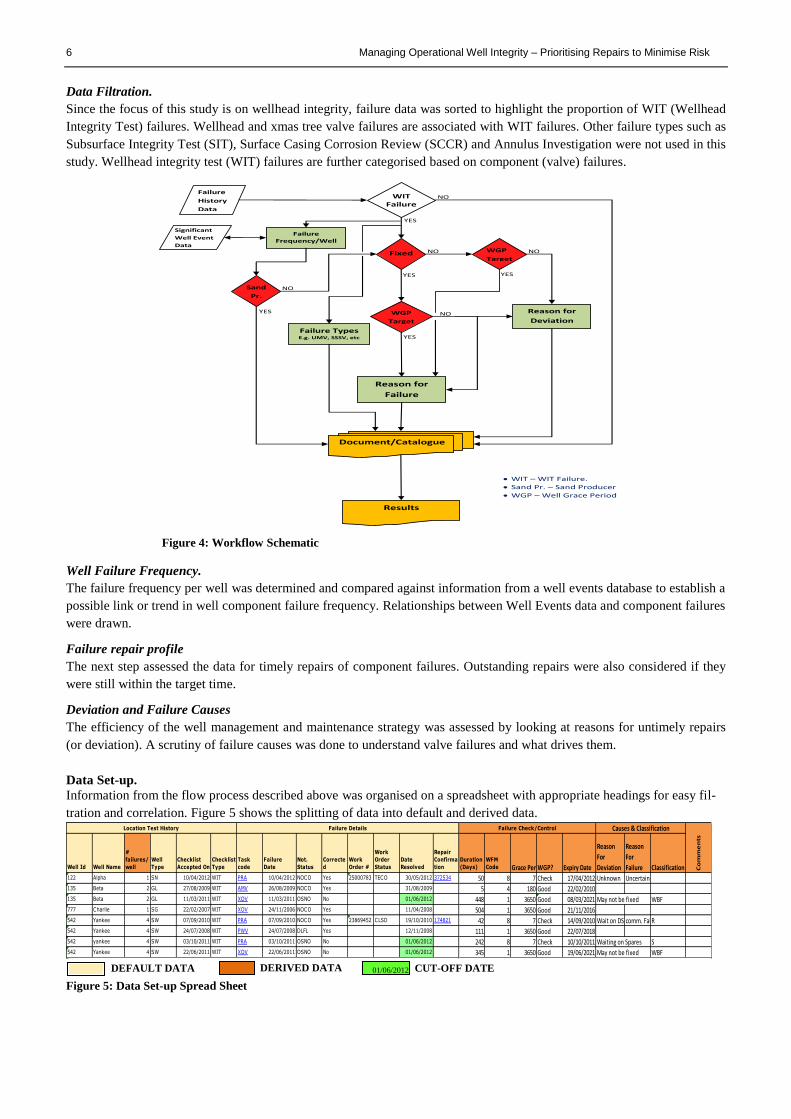
Data Filtration.
Since the focus of this study is on wellhead integrity, failure data was sorted to highlight the proportion of WIT (Wellhead
Integrity Test) failures. Wellhead and xmas tree valve failures are associated with WIT failures. Other failure types such as
Subsurface Integrity Test (SIT), Surface Casing Corrosion Review (SCCR) and Annulus Investigation were not used in this
study. Wellhead integrity test (WIT) failures are further categorised based on component (valve) failures.
Figure 4: Workflow Schematic
Well Failure Frequency.
The failure frequency per well was determined and compared against information from a well events database to establish a
possible link or trend in well component failure frequency. Relationships between Well Events data and component failures
were drawn.
Failure repair profile
The next step assessed the data for timely repairs of component failures. Outstanding repairs were also considered if they
were still within the target time.
Deviation and Failure Causes
The efficiency of the well management and maintenance strategy was assessed by looking at reasons for untimely repairs
(or deviation). A scrutiny of failure causes was done to understand valve failures and what drives them.
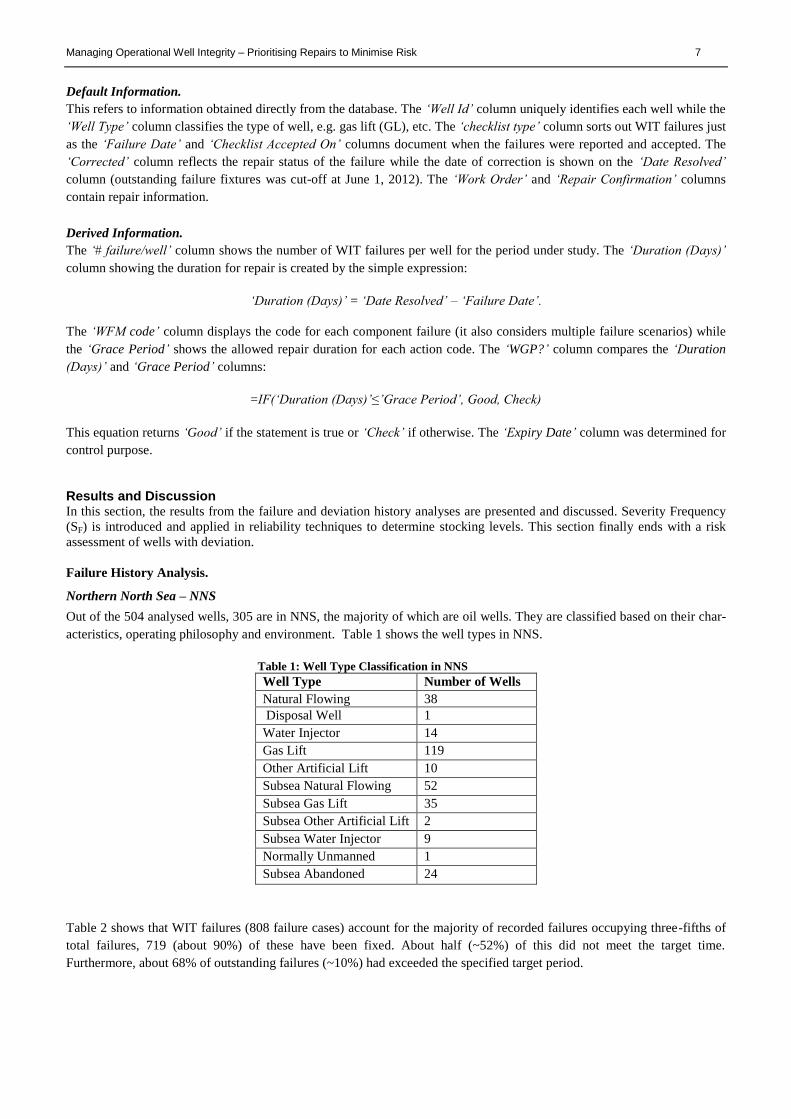
Data Set-up.
Information from the flow process described above was organised on a spreadsheet with appropriate headings for easy fil-
tration and correlation. Figure 5 shows the splitting of data into default and derived data.
Figure 5: Data Set-up Spread Sheet
Failure
History
Data
WIT Failure
Fixed
WGP
Target
WGP
Target
Sand
Pr.
Reason for
Failure
Reason for
Deviation
Failure Types
E.g. UMV, SSSV, etc
Document/Catalogue
Results
NO
NO NO
NO
YES
YES
YES
YES
Significant
Well Event
Data
Failure Frequency/Well
NO
YES
WIT – WIT Failure.
Sand Pr. – Sand Producer
WGP – Well Grace Period
Well Id Well Name
#
failures/
well
Well
Type
Checklist
Accepted On
Checklist
Type
Task
code
Failure
Date
Not.
Status
Correcte
d
Work
Order #
Work
Order
Status
Date
Resolved
Repair
Confirma
tion
Duration
(Days)
WFM
Code Grace PeriodWGP? Expiry Date
Reason
For
Deviation
Reason
For
Failure Classification122 Alpha 1 SN 10/04/2012 WIT PRA 10/04/2012 NOCO Yes 25000783 TECO 30/05/2012 372534 50 8 7 Check 17/04/2012 Unknown Uncertain135 Beta 2 GL 27/08/2009 WIT AMV 26/08/2009 NOCO Yes 31/08/2009 5 4 180 Good 22/02/2010135 Beta 2 GL 11/03/2011 WIT XOV 11/03/2011 OSNO No 01/06/2012 448 1 3650 Good 08/03/2021 May not be fixed WBF777 Charlie 1 SG 22/02/2007 WIT XOV 24/11/2006 NOCO Yes 11/04/2008 504 1 3650 Good 21/11/2016542 Yankee 4 SW 07/09/2010 WIT PRA 07/09/2010 NOCO Yes 23869452 CLSD 19/10/2010 174821 42 8 7 Check 14/09/2010 Wait on DSVcomm. FailureR542 Yankee 4 SW 24/07/2008 WIT PWV 24/07/2008 DLFL Yes 12/11/2008 111 1 3650 Good 22/07/2018542 yankee 4 SW 03/10/2011 WIT PRA 03/10/2011 OSNO No 01/06/2012 242 8 7 Check 10/10/2011 Waiting on Spares S542 Yankee 4 SW 22/06/2011 WIT XOV 22/06/2011 OSNO No 01/06/2012 345 1 3650 Good 19/06/2021 May not be fixed WBF
Location Test History Failure Details Failure Check/Control Causes & Classification
Co
mm
en
ts
DERIVED DATA 01/06/2012 CUT-OFF DATE DEFAULT DATA
Managing Operational Well Integrity – Prioritising Repairs to Minimise Risk 7
Default Information.
This refers to information obtained directly from the database. The ‘Well Id’ column uniquely identifies each well while the
‘Well Type’ column classifies the type of well, e.g. gas lift (GL), etc. The ‘checklist type’ column sorts out WIT failures just
as the ‘Failure Date’ and ‘Checklist Accepted On’ columns document when the failures were reported and accepted. The
‘Corrected’ column reflects the repair status of the failure while the date of correction is shown on the ‘Date Resolved’
column (outstanding failure fixtures was cut-off at June 1, 2012). The ‘Work Order’ and ‘Repair Confirmation’ columns
contain repair information.
Derived Information.
The ‘# failure/well’ column shows the number of WIT failures per well for the period under study. The ‘Duration (Days)’
column showing the duration for repair is created by the simple expression:
‘Duration (Days)’ = ‘Date Resolved’ – ‘Failure Date’.
The ‘WFM code’ column displays the code for each component failure (it also considers multiple failure scenarios) while
the ‘Grace Period’ shows the allowed repair duration for each action code. The ‘WGP?’ column compares the ‘Duration
(Days)’ and ‘Grace Period’ columns:
=IF(‘Duration (Days)’≤’Grace Period’, Good, Check)
This equation returns ‘Good’ if the statement is true or ‘Check’ if otherwise. The ‘Expiry Date’ column was determined for
control purpose.
Results and Discussion In this section, the results from the failure and deviation history analyses are presented and discussed. Severity Frequency
(SF) is introduced and applied in reliability techniques to determine stocking levels. This section finally ends with a risk
assessment of wells with deviation.
Failure History Analysis.
Northern North Sea – NNS
Out of the 504 analysed wells, 305 are in NNS, the majority of which are oil wells. They are classified based on their char-
acteristics, operating philosophy and environment. Table 1 shows the well types in NNS.
Table 1: Well Type Classification in NNS
Well Type Number of Wells
Natural Flowing 38
Disposal Well 1
Water Injector 14
Gas Lift 119
Other Artificial Lift 10
Subsea Natural Flowing 52
Subsea Gas Lift 35
Subsea Other Artificial Lift 2
Subsea Water Injector 9
Normally Unmanned 1
Subsea Abandoned 24
Table 2 shows that WIT failures (808 failure cases) account for the majority of recorded failures occupying three-fifths of
total failures, 719 (about 90%) of these have been fixed. About half (~52%) of this did not meet the target time.
Furthermore, about 68% of outstanding failures (~10%) had exceeded the specified target period.
8 Managing Operational Well Integrity – Prioritising Repairs to Minimise Risk
Table 2: Failure Analysis Result (NNS)
Number of failures cases (from Jan. 1, 2006 – June 1, 2012) 1349
Number of component failures from WITs 808, about 60% of total failures
Number of repaired failures (as at June 1, 2012) 719
Failures fixed outside target time 373
Outstanding repairs exceeding target time (as at June 1,
2012)
57
Master Valve related failures 256
SCSSSV related failures 134
Wing Valve failures 136
WIT failure deviation with documented reasons 101 (This is for 2009 – 2012. Pre-2009 data
for deviation was not recorded).
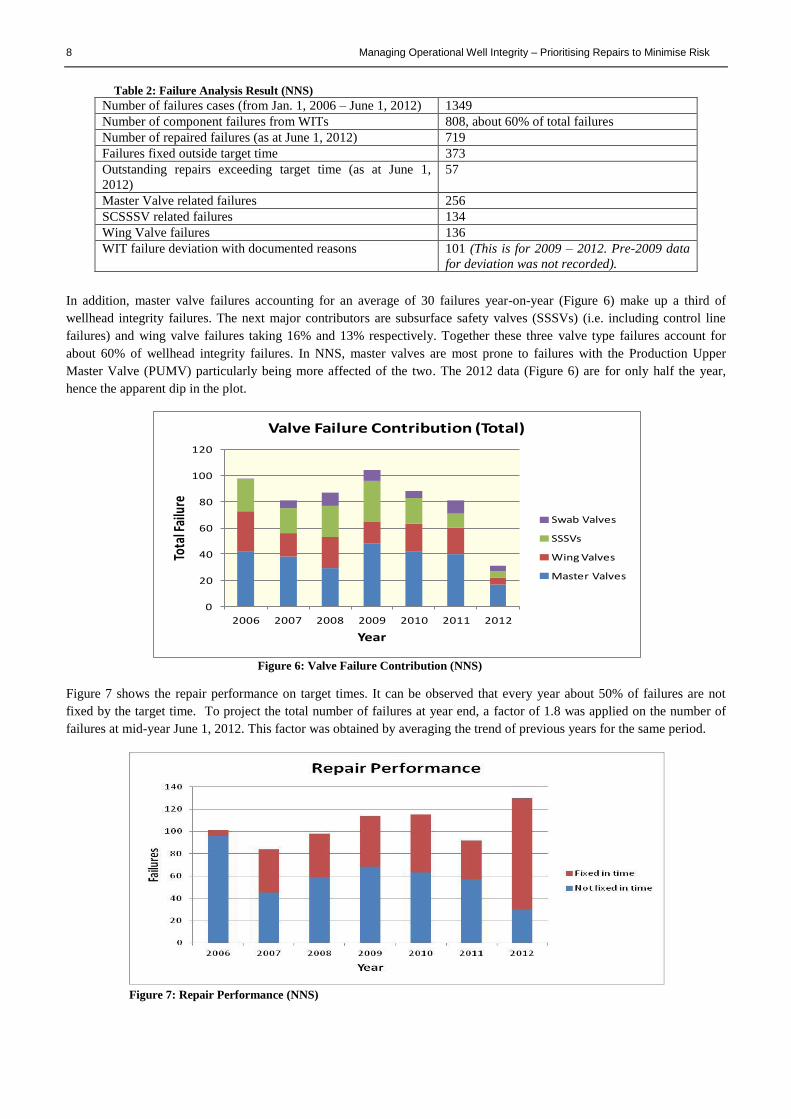
In addition, master valve failures accounting for an average of 30 failures year-on-year (Figure 6) make up a third of
wellhead integrity failures. The next major contributors are subsurface safety valves (SSSVs) (i.e. including control line
failures) and wing valve failures taking 16% and 13% respectively. Together these three valve type failures account for
about 60% of wellhead integrity failures. In NNS, master valves are most prone to failures with the Production Upper
Master Valve (PUMV) particularly being more affected of the two. The 2012 data (Figure 6) are for only half the year,
hence the apparent dip in the plot.
Figure 6: Valve Failure Contribution (NNS)
Figure 7 shows the repair performance on target times. It can be observed that every year about 50% of failures are not
fixed by the target time. To project the total number of failures at year end, a factor of 1.8 was applied on the number of
failures at mid-year June 1, 2012. This factor was obtained by averaging the trend of previous years for the same period.
Figure 7: Repair Performance (NNS)
0
20
40
60
80
100
120
2006 2007 2008 2009 2010 2011 2012
Tota
l Fai
lure
Year
Valve Failure Contribution (Total)
Swab Valves
SSSVs
Wing Valves
Master Valves
Managing Operational Well Integrity – Prioritising Repairs to Minimise Risk 9
Southern North Sea – SNS
The SNS has 199 gas wells which are managed under a slightly different management approach. Table 3 shows the well
types in SNS.
Table 3: Well Classification on SNS
Well Type Number of Wells
Natural Flowing 47
Normally Unmanned 151
Subsea Abandoned 1
The data from table 4 again shows that WIT failures (196 failure cases) account for a majority of the failures, occupying
over three-quarters in this instance. This underscores the importance of the focus on well integrity failures. Out of this, 93%
(182) have already been repaired. However, about 45% (82) of these fixed cases did not meet the target repair time and
93% (13) of outstanding failures have exceeded the target repair period.
Table 4: Failure Analysis Result (SNS)
Number of failures cases (from Jan. 1, 2006 – June 1, 2012) 255
Number of component failures from WITs 196, about 77% of total failures
Number of fixed failures (as at June 1, 2012) 182
Failures fixed outside grace period 82
Outstanding repairs exceeding grace period (as at June 1, 2012) 13
Master Valve related failures 55
SCSSSV related failures 50
Wing Valve failures 60
WIT failure deviation with known reasons 25 (This is for 2009 – 2012. Pre-2009
data for deviation was not recorded).
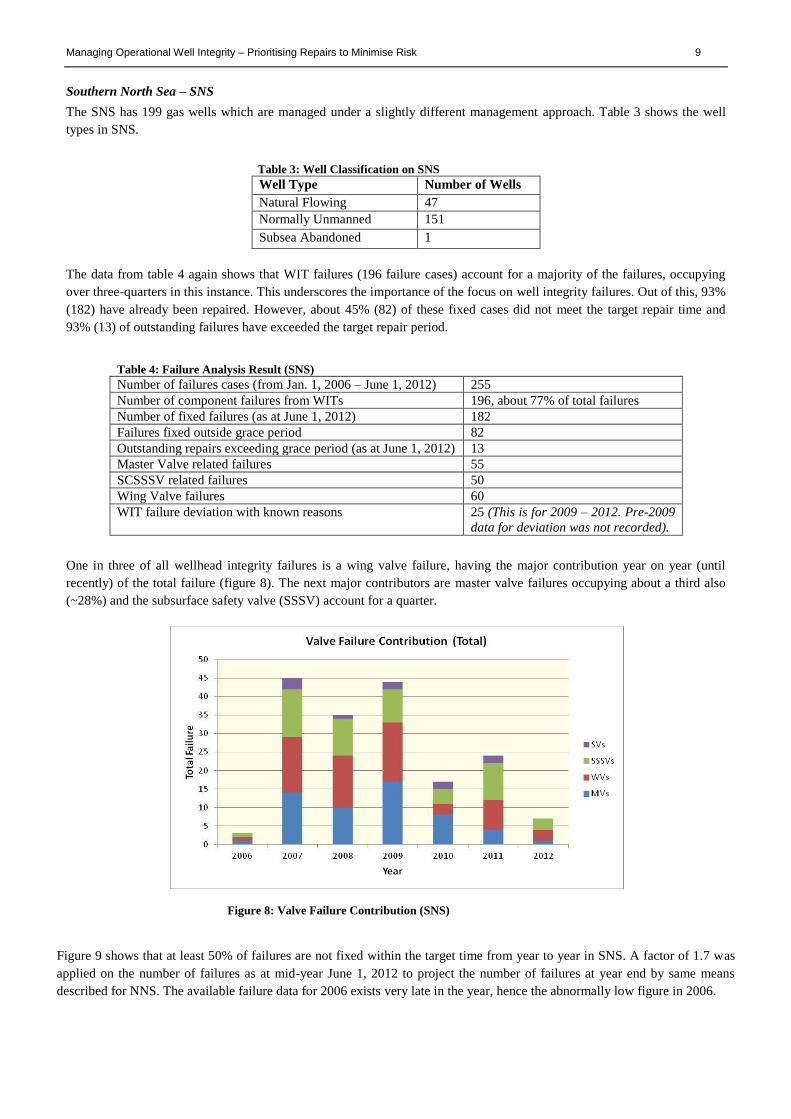
One in three of all wellhead integrity failures is a wing valve failure, having the major contribution year on year (until
recently) of the total failure (figure 8). The next major contributors are master valve failures occupying about a third also
(~28%) and the subsurface safety valve (SSSV) account for a quarter.
Figure 8: Valve Failure Contribution (SNS)
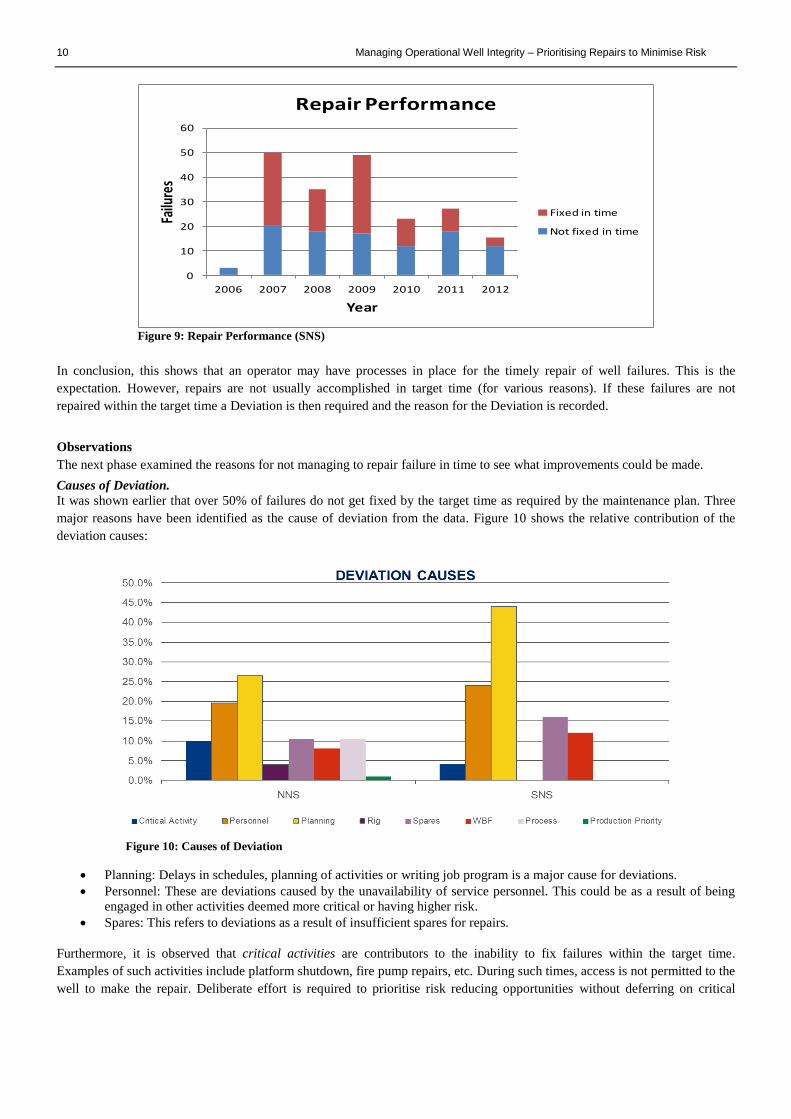
Figure 9 shows that at least 50% of failures are not fixed within the target time from year to year in SNS. A factor of 1.7 was
applied on the number of failures as at mid-year June 1, 2012 to project the number of failures at year end by same means
described for NNS. The available failure data for 2006 exists very late in the year, hence the abnormally low figure in 2006.
10 Managing Operational Well Integrity – Prioritising Repairs to Minimise Risk
Figure 9: Repair Performance (SNS)
In conclusion, this shows that an operator may have processes in place for the timely repair of well failures. This is the
expectation. However, repairs are not usually accomplished in target time (for various reasons). If these failures are not
repaired within the target time a Deviation is then required and the reason for the Deviation is recorded.
Observations
The next phase examined the reasons for not managing to repair failure in time to see what improvements could be made.
Causes of Deviation.
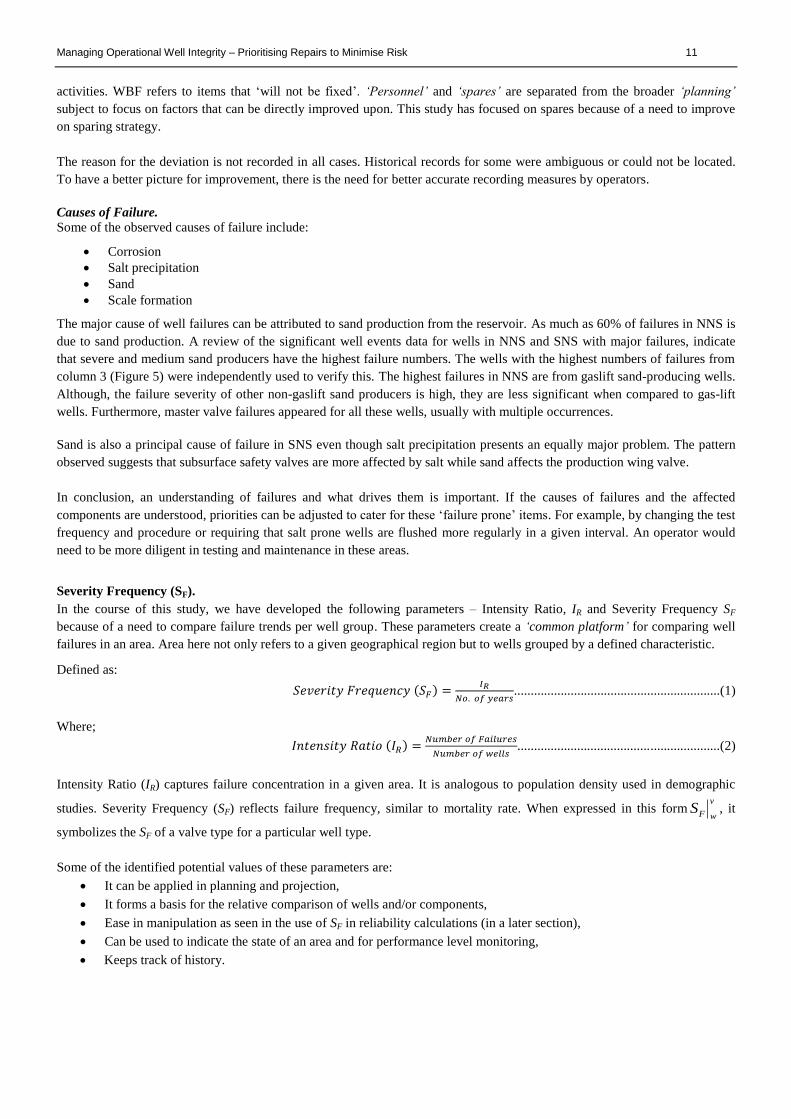
It was shown earlier that over 50% of failures do not get fixed by the target time as required by the maintenance plan. Three
major reasons have been identified as the cause of deviation from the data. Figure 10 shows the relative contribution of the
deviation causes:
Figure 10: Causes of Deviation
Planning: Delays in schedules, planning of activities or writing job program is a major cause for deviations.
Personnel: These are deviations caused by the unavailability of service personnel. This could be as a result of being
engaged in other activities deemed more critical or having higher risk.
Spares: This refers to deviations as a result of insufficient spares for repairs.
Furthermore, it is observed that critical activities are contributors to the inability to fix failures within the target time.
Examples of such activities include platform shutdown, fire pump repairs, etc. During such times, access is not permitted to the
well to make the repair. Deliberate effort is required to prioritise risk reducing opportunities without deferring on critical
0
10
20
30
40
50
60
2006 2007 2008 2009 2010 2011 2012
Failu
res
Year
Repair Performance
Fixed in time
Not fixed in time
Managing Operational Well Integrity – Prioritising Repairs to Minimise Risk 11
activities. WBF refers to items that ‘will not be fixed’. ‘Personnel’ and ‘spares’ are separated from the broader ‘planning’
subject to focus on factors that can be directly improved upon. This study has focused on spares because of a need to improve
on sparing strategy.
The reason for the deviation is not recorded in all cases. Historical records for some were ambiguous or could not be located.
To have a better picture for improvement, there is the need for better accurate recording measures by operators.
Causes of Failure.
Some of the observed causes of failure include:
Corrosion
Salt precipitation
Sand
Scale formation
The major cause of well failures can be attributed to sand production from the reservoir. As much as 60% of failures in NNS is
due to sand production. A review of the significant well events data for wells in NNS and SNS with major failures, indicate
that severe and medium sand producers have the highest failure numbers. The wells with the highest numbers of failures from
column 3 (Figure 5) were independently used to verify this. The highest failures in NNS are from gaslift sand-producing wells.
Although, the failure severity of other non-gaslift sand producers is high, they are less significant when compared to gas-lift
wells. Furthermore, master valve failures appeared for all these wells, usually with multiple occurrences.
Sand is also a principal cause of failure in SNS even though salt precipitation presents an equally major problem. The pattern
observed suggests that subsurface safety valves are more affected by salt while sand affects the production wing valve.
In conclusion, an understanding of failures and what drives them is important. If the causes of failures and the affected
components are understood, priorities can be adjusted to cater for these ‘failure prone’ items. For example, by changing the test
frequency and procedure or requiring that salt prone wells are flushed more regularly in a given interval. An operator would
need to be more diligent in testing and maintenance in these areas.
Severity Frequency (SF).
In the course of this study, we have developed the following parameters – Intensity Ratio, IR and Severity Frequency SF because of a need to compare failure trends per well group. These parameters create a ‘common platform’ for comparing well
failures in an area. Area here not only refers to a given geographical region but to wells grouped by a defined characteristic.
Defined as:
𝑆𝑒𝑣𝑒𝑟𝑖𝑡𝑦 𝐹𝑟𝑒𝑞𝑢𝑒𝑛𝑐𝑦 (𝑆𝐹) =𝐼𝑅
𝑁𝑜. 𝑜𝑓 𝑦𝑒𝑎𝑟𝑠..............................................................(1)
Where;
𝐼𝑛𝑡𝑒𝑛𝑠𝑖𝑡𝑦 𝑅𝑎𝑡𝑖𝑜 (𝐼𝑅) =𝑁𝑢𝑚𝑏𝑒𝑟 𝑜𝑓 𝐹𝑎𝑖𝑙𝑢𝑟𝑒𝑠
𝑁𝑢𝑚𝑏𝑒𝑟 𝑜𝑓 𝑤𝑒𝑙𝑙𝑠.............................................................(2)
Intensity Ratio (IR) captures failure concentration in a given area. It is analogous to population density used in demographic
studies. Severity Frequency (SF) reflects failure frequency, similar to mortality rate. When expressed in this formv
wFS , it
symbolizes the SF of a valve type for a particular well type.
Some of the identified potential values of these parameters are:
It can be applied in planning and projection,
It forms a basis for the relative comparison of wells and/or components,
Ease in manipulation as seen in the use of SF in reliability calculations (in a later section),
Can be used to indicate the state of an area and for performance level monitoring,
Keeps track of history.
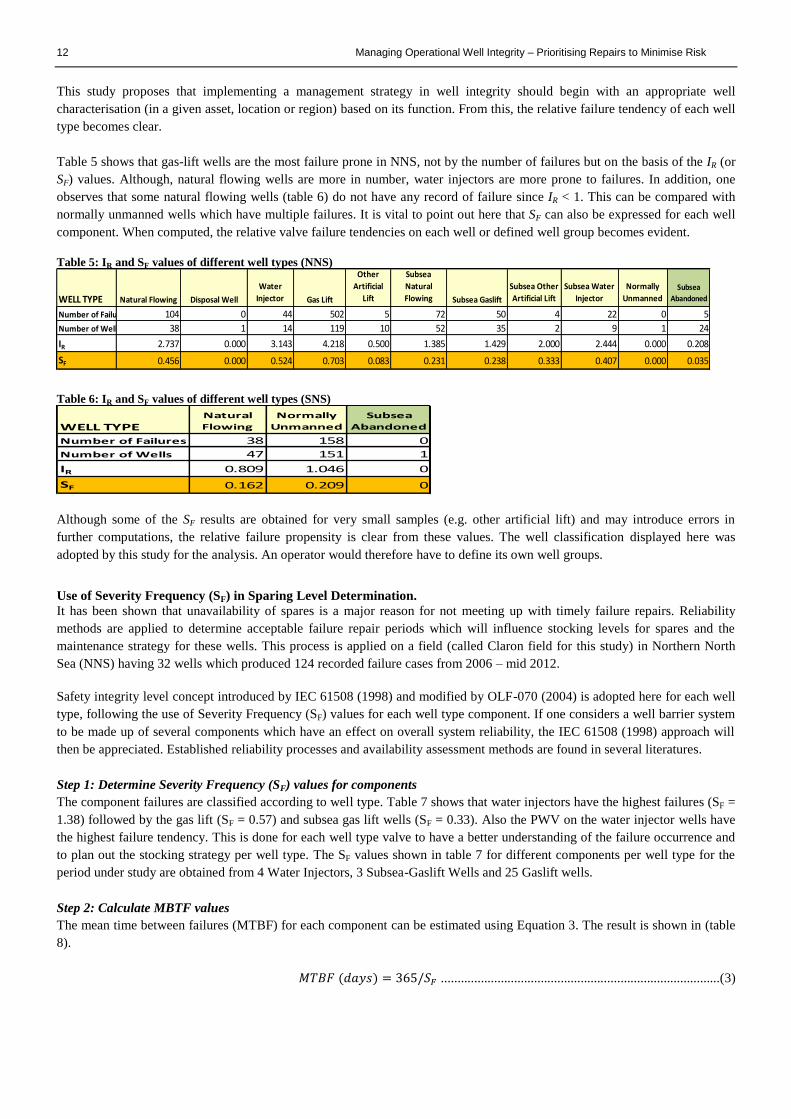
12 Managing Operational Well Integrity – Prioritising Repairs to Minimise Risk
This study proposes that implementing a management strategy in well integrity should begin with an appropriate well
characterisation (in a given asset, location or region) based on its function. From this, the relative failure tendency of each well
type becomes clear.
Table 5 shows that gas-lift wells are the most failure prone in NNS, not by the number of failures but on the basis of the IR (or
SF) values. Although, natural flowing wells are more in number, water injectors are more prone to failures. In addition, one
observes that some natural flowing wells (table 6) do not have any record of failure since IR < 1. This can be compared with
normally unmanned wells which have multiple failures. It is vital to point out here that SF can also be expressed for each well
component. When computed, the relative valve failure tendencies on each well or defined well group becomes evident.
Table 5: IR and SF values of different well types (NNS)
Table 6: IR and SF values of different well types (SNS)
Although some of the SF results are obtained for very small samples (e.g. other artificial lift) and may introduce errors in
further computations, the relative failure propensity is clear from these values. The well classification displayed here was
adopted by this study for the analysis. An operator would therefore have to define its own well groups.
Use of Severity Frequency (SF) in Sparing Level Determination.
It has been shown that unavailability of spares is a major reason for not meeting up with timely failure repairs. Reliability
methods are applied to determine acceptable failure repair periods which will influence stocking levels for spares and the
maintenance strategy for these wells. This process is applied on a field (called Claron field for this study) in Northern North
Sea (NNS) having 32 wells which produced 124 recorded failure cases from 2006 – mid 2012.
Safety integrity level concept introduced by IEC 61508 (1998) and modified by OLF-070 (2004) is adopted here for each well
type, following the use of Severity Frequency (SF) values for each well type component. If one considers a well barrier system
to be made up of several components which have an effect on overall system reliability, the IEC 61508 (1998) approach will
then be appreciated. Established reliability processes and availability assessment methods are found in several literatures.
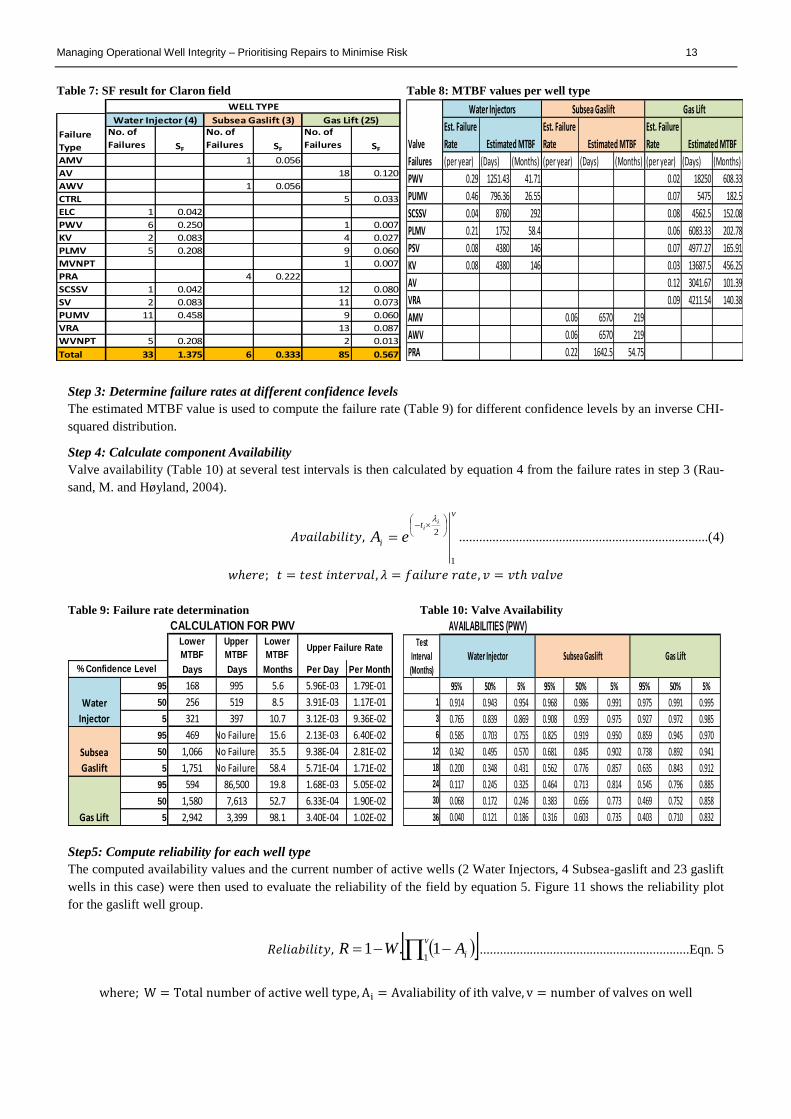
Step 1: Determine Severity Frequency (SF) values for components
The component failures are classified according to well type. Table 7 shows that water injectors have the highest failures (SF =
1.38) followed by the gas lift (SF = 0.57) and subsea gas lift wells (SF = 0.33). Also the PWV on the water injector wells have
the highest failure tendency. This is done for each well type valve to have a better understanding of the failure occurrence and
to plan out the stocking strategy per well type. The SF values shown in table 7 for different components per well type for the
period under study are obtained from 4 Water Injectors, 3 Subsea-Gaslift Wells and 25 Gaslift wells.
Step 2: Calculate MBTF values
The mean time between failures (MTBF) for each component can be estimated using Equation 3. The result is shown in (table
8).
𝑀𝑇𝐵𝐹 (𝑑𝑎𝑦𝑠) = 365/𝑆𝐹 ....................................................................................(3)
WELL TYPE Natural Flowing Disposal Well
Water
Injector Gas Lift
Other
Artificial
Lift
Subsea
Natural
Flowing Subsea Gaslift
Subsea Other
Artificial Lift
Subsea Water
Injector
Normally
UnmannedSubsea
Abandoned
Number of Failures 104 0 44 502 5 72 50 4 22 0 5
Number of Wells 38 1 14 119 10 52 35 2 9 1 24
IR 2.737 0.000 3.143 4.218 0.500 1.385 1.429 2.000 2.444 0.000 0.208
SF 0.456 0.000 0.524 0.703 0.083 0.231 0.238 0.333 0.407 0.000 0.035
WELL TYPENatural
Flowing
Normally
Unmanned
Subsea
Abandoned
Number of Failures 38 158 0
Number of Wells 47 151 1
IR 0.809 1.046 0
SF 0.162 0.209 0
Managing Operational Well Integrity – Prioritising Repairs to Minimise Risk 13
Table 7: SF result for Claron field Table 8: MTBF values per well type
Step 3: Determine failure rates at different confidence levels
The estimated MTBF value is used to compute the failure rate (Table 9) for different confidence levels by an inverse CHI-
squared distribution.
Step 4: Calculate component Availability
Valve availability (Table 10) at several test intervals is then calculated by equation 4 from the failure rates in step 3 (Rau-
sand, M. and Høyland, 2004).
𝐴𝑣𝑎𝑖𝑙𝑎𝑏𝑖𝑙𝑖𝑡𝑦,
v
t
i
ii
eA
1
2
...........................................................................(4)
𝑤ℎ𝑒𝑟𝑒; 𝑡 = 𝑡𝑒𝑠𝑡 𝑖𝑛𝑡𝑒𝑟𝑣𝑎𝑙, 𝜆 = 𝑓𝑎𝑖𝑙𝑢𝑟𝑒 𝑟𝑎𝑡𝑒, 𝑣 = 𝑣𝑡ℎ 𝑣𝑎𝑙𝑣𝑒
Table 9: Failure rate determination Table 10: Valve Availability
Step5: Compute reliability for each well type
The computed availability values and the current number of active wells (2 Water Injectors, 4 Subsea-gaslift and 23 gaslift
wells in this case) were then used to evaluate the reliability of the field by equation 5. Figure 11 shows the reliability plot
for the gaslift well group.
𝑅𝑒𝑙𝑖𝑎𝑏𝑖𝑙𝑖𝑡𝑦, v
iAWR1
1.1 ...............................................................Eqn. 5
where; W = Total number of active well type, Ai = Avaliability of ith valve, v = number of valves on well
No. of
Failures SF
No. of
Failures SF
No. of
Failures SF
AMV 1 0.056
AV 18 0.120
AWV 1 0.056
CTRL 5 0.033
ELC 1 0.042
PWV 6 0.250 1 0.007
KV 2 0.083 4 0.027
PLMV 5 0.208 9 0.060
MVNPT 1 0.007
PRA 4 0.222
SCSSV 1 0.042 12 0.080
SV 2 0.083 11 0.073
PUMV 11 0.458 9 0.060
VRA 13 0.087
WVNPT 5 0.208 2 0.013
Total 33 1.375 6 0.333 85 0.567
Failure
Type
Water Injector (4) Subsea Gaslift (3) Gas Lift (25)
WELL TYPE
Est. Failure
Rate
Est. Failure
Rate
Est. Failure
Rate
(per year) (Days) (Months) (per year) (Days) (Months) (per year) (Days) (Months)
PWV 0.29 1251.43 41.71 0.02 18250 608.33
PUMV 0.46 796.36 26.55 0.07 5475 182.5
SCSSV 0.04 8760 292 0.08 4562.5 152.08
PLMV 0.21 1752 58.4 0.06 6083.33 202.78
PSV 0.08 4380 146 0.07 4977.27 165.91
KV 0.08 4380 146 0.03 13687.5 456.25
AV 0.12 3041.67 101.39
VRA 0.09 4211.54 140.38
AMV 0.06 6570 219
AWV 0.06 6570 219
PRA 0.22 1642.5 54.75
Valve
Failures
Water Injectors Subsea Gaslift Gas Lift
Estimated MTBF Estimated MTBF Estimated MTBF
CALCULATION FOR PWV
Lower
MTBF
Upper
MTBF
Lower
MTBF
Days Days Months Per Day Per Month
95 168 995 5.6 5.96E-03 1.79E-01
50 256 519 8.5 3.91E-03 1.17E-01
5 321 397 10.7 3.12E-03 9.36E-02
95 469 No Failures 15.6 2.13E-03 6.40E-02
50 1,066 No Failures 35.5 9.38E-04 2.81E-02
5 1,751 No Failures 58.4 5.71E-04 1.71E-02
95 594 86,500 19.8 1.68E-03 5.05E-02
50 1,580 7,613 52.7 6.33E-04 1.90E-02
5 2,942 3,399 98.1 3.40E-04 1.02E-02
Water
Injector
Subsea
Gaslift
Gas Lift
Upper Failure Rate
% Confidence Level
Test
Interval
(Months)
95% 50% 5% 95% 50% 5% 95% 50% 5%
1 0.914 0.943 0.954 0.968 0.986 0.991 0.975 0.991 0.995
3 0.765 0.839 0.869 0.908 0.959 0.975 0.927 0.972 0.985
6 0.585 0.703 0.755 0.825 0.919 0.950 0.859 0.945 0.970
12 0.342 0.495 0.570 0.681 0.845 0.902 0.738 0.892 0.941
18 0.200 0.348 0.431 0.562 0.776 0.857 0.635 0.843 0.912
24 0.117 0.245 0.325 0.464 0.713 0.814 0.545 0.796 0.885
30 0.068 0.172 0.246 0.383 0.656 0.773 0.469 0.752 0.858
36 0.040 0.121 0.186 0.316 0.603 0.735 0.403 0.710 0.832
Water Injector Subsea Gaslift Gas Lift
AVAILABILITIES (PWV)
14 Managing Operational Well Integrity – Prioritising Repairs to Minimise Risk
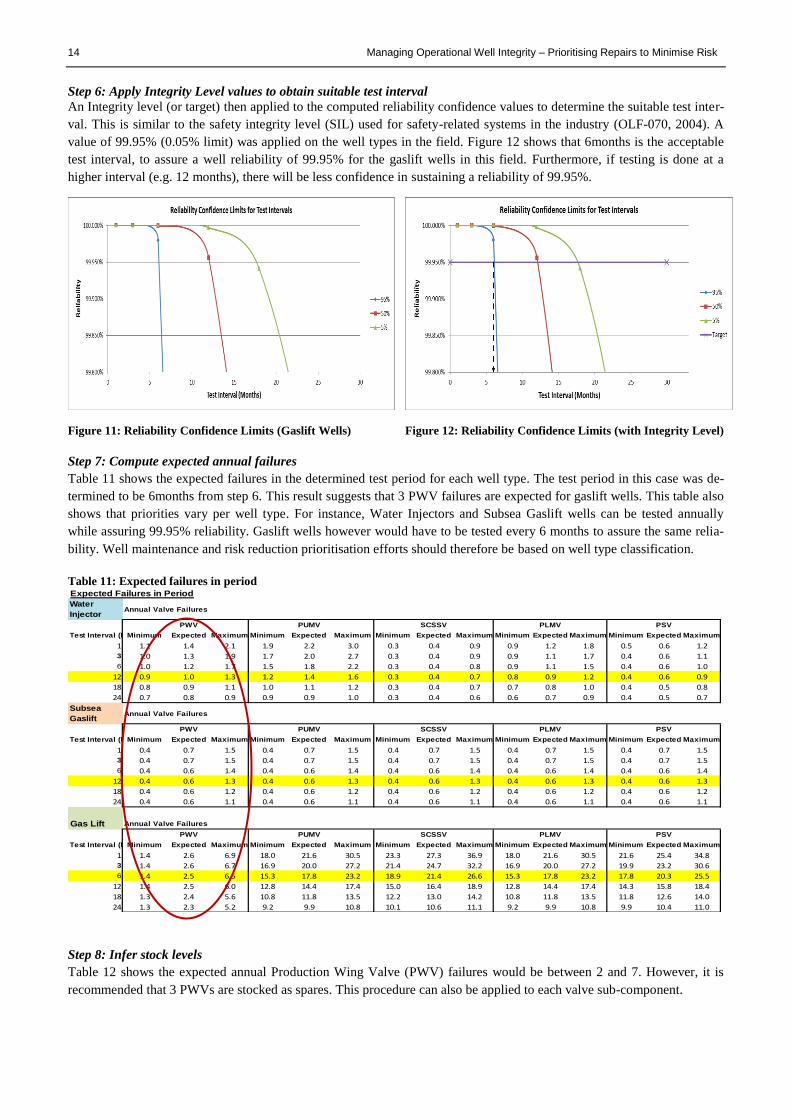
Step 6: Apply Integrity Level values to obtain suitable test interval
An Integrity level (or target) then applied to the computed reliability confidence values to determine the suitable test inter-
val. This is similar to the safety integrity level (SIL) used for safety-related systems in the industry (OLF-070, 2004). A
value of 99.95% (0.05% limit) was applied on the well types in the field. Figure 12 shows that 6months is the acceptable
test interval, to assure a well reliability of 99.95% for the gaslift wells in this field. Furthermore, if testing is done at a
higher interval (e.g. 12 months), there will be less confidence in sustaining a reliability of 99.95%.
Figure 11: Reliability Confidence Limits (Gaslift Wells) Figure 12: Reliability Confidence Limits (with Integrity Level)
Step 7: Compute expected annual failures
Table 11 shows the expected failures in the determined test period for each well type. The test period in this case was de-
termined to be 6months from step 6. This result suggests that 3 PWV failures are expected for gaslift wells. This table also
shows that priorities vary per well type. For instance, Water Injectors and Subsea Gaslift wells can be tested annually
while assuring 99.95% reliability. Gaslift wells however would have to be tested every 6 months to assure the same relia-
bility. Well maintenance and risk reduction prioritisation efforts should therefore be based on well type classification.
Table 11: Expected failures in period
Step 8: Infer stock levels
Table 12 shows the expected annual Production Wing Valve (PWV) failures would be between 2 and 7. However, it is
recommended that 3 PWVs are stocked as spares. This procedure can also be applied to each valve sub-component.
Expected Failures in Period
Water
InjectorAnnual Valve Failures
PWV PUMV SCSSV PLMV PSV
Test Interval (Months)Minimum Expected Maximum Minimum Expected Maximum Minimum Expected Maximum Minimum Expected Maximum Minimum Expected Maximum
1 1.1 1.4 2.1 1.9 2.2 3.0 0.3 0.4 0.9 0.9 1.2 1.8 0.5 0.6 1.2
3 1.0 1.3 1.9 1.7 2.0 2.7 0.3 0.4 0.9 0.9 1.1 1.7 0.4 0.6 1.1
6 1.0 1.2 1.7 1.5 1.8 2.2 0.3 0.4 0.8 0.9 1.1 1.5 0.4 0.6 1.0
12 0.9 1.0 1.3 1.2 1.4 1.6 0.3 0.4 0.7 0.8 0.9 1.2 0.4 0.6 0.9
18 0.8 0.9 1.1 1.0 1.1 1.2 0.3 0.4 0.7 0.7 0.8 1.0 0.4 0.5 0.8
24 0.7 0.8 0.9 0.9 0.9 1.0 0.3 0.4 0.6 0.6 0.7 0.9 0.4 0.5 0.7
Subsea
GasliftAnnual Valve Failures
PWV PUMV SCSSV PLMV PSV
Test Interval (Months)Minimum Expected Maximum Minimum Expected Maximum Minimum Expected Maximum Minimum Expected Maximum Minimum Expected Maximum
1 0.4 0.7 1.5 0.4 0.7 1.5 0.4 0.7 1.5 0.4 0.7 1.5 0.4 0.7 1.5
3 0.4 0.7 1.5 0.4 0.7 1.5 0.4 0.7 1.5 0.4 0.7 1.5 0.4 0.7 1.5
6 0.4 0.6 1.4 0.4 0.6 1.4 0.4 0.6 1.4 0.4 0.6 1.4 0.4 0.6 1.4
12 0.4 0.6 1.3 0.4 0.6 1.3 0.4 0.6 1.3 0.4 0.6 1.3 0.4 0.6 1.3
18 0.4 0.6 1.2 0.4 0.6 1.2 0.4 0.6 1.2 0.4 0.6 1.2 0.4 0.6 1.2
24 0.4 0.6 1.1 0.4 0.6 1.1 0.4 0.6 1.1 0.4 0.6 1.1 0.4 0.6 1.1
Gas Lift Annual Valve Failures
PWV PUMV SCSSV PLMV PSV
Test Interval (Months)Minimum Expected Maximum Minimum Expected Maximum Minimum Expected Maximum Minimum Expected Maximum Minimum Expected Maximum
1 1.4 2.6 6.9 18.0 21.6 30.5 23.3 27.3 36.9 18.0 21.6 30.5 21.6 25.4 34.8
3 1.4 2.6 6.7 16.9 20.0 27.2 21.4 24.7 32.2 16.9 20.0 27.2 19.9 23.2 30.6
6 1.4 2.5 6.5 15.3 17.8 23.2 18.9 21.4 26.6 15.3 17.8 23.2 17.8 20.3 25.5
12 1.4 2.5 6.0 12.8 14.4 17.4 15.0 16.4 18.9 12.8 14.4 17.4 14.3 15.8 18.4
18 1.3 2.4 5.6 10.8 11.8 13.5 12.2 13.0 14.2 10.8 11.8 13.5 11.8 12.6 14.0
24 1.3 2.3 5.2 9.2 9.9 10.8 10.1 10.6 11.1 9.2 9.9 10.8 9.9 10.4 11.0
Managing Operational Well Integrity – Prioritising Repairs to Minimise Risk 15
Table 12: PWV stocking levels and test frequency
The underlying assumption here is that a failure is equivalent to a valve change-out. More data (e.g. stock history) would
be required to take this work to the next level to determine actual stocking values for valve sub-components like seals, etc.
Please note that the process terminating in equation 5 was built around a batch production process. Application of a relia-
bility procedure would start on single wells and then aggregated to the well type group. No two wells are entirely the same.
They differ in characteristics and failure modes. Refer to appendix D for more on availability and reliability basics.
Qualitative Risk Assessment of Deviated Wells.
Risk is defined as the combination of the probability of occurrence of harm and the severity of that harm (NORSOK Z-
013, 2001). It is hence made up of two components – the probability (of an event) and the consequence (usually
represented by a factor) of that event. The event considered in well integrity is a leak to the environment.
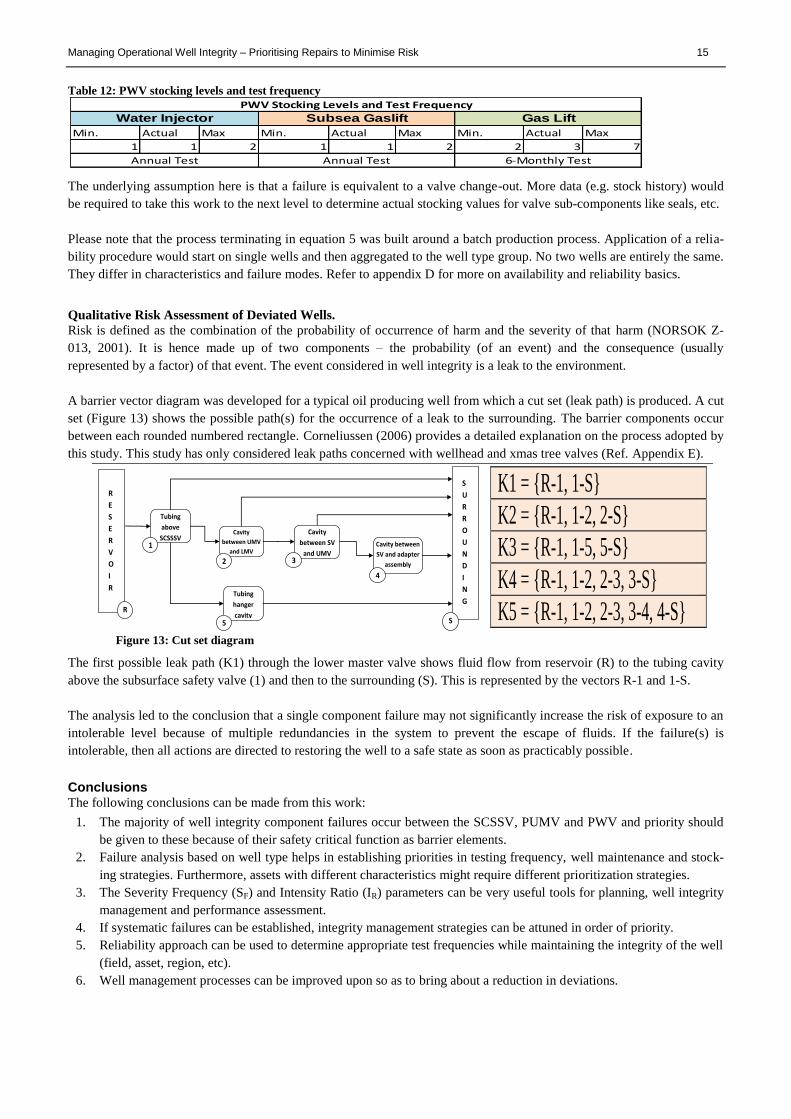
A barrier vector diagram was developed for a typical oil producing well from which a cut set (leak path) is produced. A cut
set (Figure 13) shows the possible path(s) for the occurrence of a leak to the surrounding. The barrier components occur
between each rounded numbered rectangle. Corneliussen (2006) provides a detailed explanation on the process adopted by
this study. This study has only considered leak paths concerned with wellhead and xmas tree valves (Ref. Appendix E).
Figure 13: Cut set diagram
The first possible leak path (K1) through the lower master valve shows fluid flow from reservoir (R) to the tubing cavity
above the subsurface safety valve (1) and then to the surrounding (S). This is represented by the vectors R-1 and 1-S.
The analysis led to the conclusion that a single component failure may not significantly increase the risk of exposure to an
intolerable level because of multiple redundancies in the system to prevent the escape of fluids. If the failure(s) is
intolerable, then all actions are directed to restoring the well to a safe state as soon as practicably possible.
Conclusions The following conclusions can be made from this work:
1. The majority of well integrity component failures occur between the SCSSV, PUMV and PWV and priority should
be given to these because of their safety critical function as barrier elements.
2. Failure analysis based on well type helps in establishing priorities in testing frequency, well maintenance and stock-
ing strategies. Furthermore, assets with different characteristics might require different prioritization strategies.
3. The Severity Frequency (SF) and Intensity Ratio (IR) parameters can be very useful tools for planning, well integrity
management and performance assessment.
4. If systematic failures can be established, integrity management strategies can be attuned in order of priority.
5. Reliability approach can be used to determine appropriate test frequencies while maintaining the integrity of the well
(field, asset, region, etc).
6. Well management processes can be improved upon so as to bring about a reduction in deviations.
Min. Actual Max Min. Actual Max Min. Actual Max
1 1 2 1 1 2 2 3 7
Water Injector Subsea Gaslift Gas Lift
Annual Test Annual Test 6-Monthly Test
PWV Stocking Levels and Test Frequency
R
E
S
E
R
V
O
I
R
R
Tubing
above
SCSSSV 1
Cavity
between UMV
and LMV
2
Tubing
hanger
cavity 5
Cavity
between SV
and UMV 3
Cavity between
SV and adapter
assembly
4
S
U
R
R
O
U
N
D
I
N
G
S
K1 = {R-1, 1-S}
K2 = {R-1, 1-2, 2-S}
K3 = {R-1, 1-5, 5-S}
K4 = {R-1, 1-2, 2-3, 3-S}
K5 = {R-1, 1-2, 2-3, 3-4, 4-S}
16 Managing Operational Well Integrity – Prioritising Repairs to Minimise Risk
7. A well with a deviation does not necessarily have a significant increase in its risk. Risk increases in multiple failures.
8. The quality of analysis and resulting decisions depends on the quality of failure and repair data, good data capture,
storage and retrieval is therefore very important.
Recommendation for Further Studies The underlying assumption in this study is that a failure is equivalent to a complete valve change-out. It is therefore rec-
ommended that actual stocking values for valve sub-components like seals, etc be determined from more data like order
history.
Nomenclature
λ = Failure Rate (failure/month).
t = test time (months)
SF = Severity Frequency (Failures per well type/year)
References
Alaska Oil & Gas Conservation Commission (AOGCC). Investigation of Explosion and Fire at Prudhoe Bay Well A-22 North Slope,
Alaska August 16, 2002. Alaska Oil & Gas Conservation Commission (AOGCC) Staff Report. 2003. Alaska, Canada.
American Petroleum Institute RP 14B. Design, Installation, Repair and Operation of Subsurface Safety Valve Systems, fourth edition.
1994. Washington, DC: API.
American Petroleum Institute RP 14H. Recommended Practice for Installation, Maintenance, and Repair of Surface Safety valves and
Underwater Safety Valves Offshore, fourth edition. 1994. Washington DC: API.
Brattbakk, M., Østvold, L., Van der Zwaag, C., and Hiim, H. Investigation of Gas Blowout on Snorre A, Well 34/7-P31A, 28 November
2004 (Gransking av gassutblåsning på Snorre A, brønn 34/7-P31 A 28.11.2004). 2005. Norway: PSA.
Chitale, A. A., Blosser, W. R., and Arias, B. J.: “Use of Real-Time Data in Well Integrity Management,” SPE 128688 paper prepared
for presentation at the SPE Intelligent Energy Conference and Exhibition held in Utrecht, The Netherlands, 23-25 March 2010.
Corneliussen, K.: Well Safety – Risk Control in the Operational Phase of Offshore Wells. PhD dissertation, 2006. Department of
Production and Quality Engineering, The Norwegian University of Science and Technology, Trondheim.
Corneliussen, K., Sørli, F., Brandanger Haga, H., Tenoid, E., Menezes, C., Grimbert, B., and Owren, K.: “Well Integrity Management
System (WIMS)–A Systematic Way of Describing the Actual and Historic Integrity Status of Operational Wells,” SPE 110347,
paper presented at the 2007 SPE Annual Technical Conference and Exhibition of the Society of Petroleum Engineers, Anaheim,
California, U.S.A., 11-14 November 2007.
[DCR guidance], A guide to the well aspects of the Offshore Installations and Wells (Design and Construction, etc) Regulations 1996.
L84, second edition 2008. ISBN 978 0 7176 6296 8. United Kingdom: HSE .(http://www.hse.gov.uk/pubns/priced/l84.pdf)
Haga, J., Corneliussen, K., and Sørli, F.: “Well Integrity Management: A Systematic Way of Describing and Keeping Track of the
Integrity Status for Wells in Operation,” SPE 120946 paper prepared for presentation at the 2009 SPE Americas E&P
Environmental & Safety Conference held in San Antonio, Texas, U.S.A., 23-25 March 2009.
Hon. Lord Cullen: “The Public Inquiry into the Piper Alpha Disaster”, Vol. 1 & 2, 1990.
International Electrotechnical Commission 61508, Functional Safety of Electrical/Electronic/Programmable Electronic Safety-Related
Systems, part 1 – 7. 1997. Geneva, Switzerland: International Electrotechnical Commission.
Kairon, S., Lane, T., and Murrey, M. D.: “Optimizing Well Integrity Surveillance and Maintenance,” IPTC 12624 paper prepared for
presentation at the International Petroleum technology Conference held in Kuala Lumpur, Malaysia, 3-5 December 2008.
Nichol. J. R., Kariyawasam, S. N. Risk Assessment of Temporarily Abandoned or Shut-in Wells. Final Report, Contract No. 1435-01-
99-RP-3995, Project 99041, US DOI, Minerals Management Service (MMS), Washington, DC (October 2000).
NORSOK D-010. Well Integrity in Drilling and Well Operations, Rev. 3, 2004. Lysaker, Norway: NORSOK.
NORSOK Z-013. Risk and emergency preparedness analysis, Rev. 2, 2001. Oslo, Norway: NORSOK (see http://www.standard.no/).
The Norwegian Oil Industry Association OLF 070, Guideline on the application of IEC 61508 and IEC 61511 in the petroleum
activities on the Norwegian Continental Shelf. The Norwegian Oil Industry Association, OLF Report 070 rev. 2. 2004. Stavanger,
Norway: OLF (see http://www.itk.ntnu.no/sil).
The Norwegian Oil Industry Association OLF 117, OLF Recommended Guidelines for Well Integrity. The Norwegian Oil Industry
Association, OLF Report 117 rev. 4. 2011. Stavanger, Norway: OLF (see http://www.olf.no).
Pettersen, G., Moldskred, I. O., and Ytredal, E. B.: “The Snorre-A Incident 28 November 2004: Lessons learned,” SPE 98739 paper
prepared for presentation at the SPE International Conference on Health, Safety, and Environment in Oil and Gas Exploration and
Production held in AbuDhabi, U.A.E, 2-4 April, 2006.
Rausand, M. and Høyland, A. System Reliability Theory. Models, Statistical Methods, and Applications, second edition, 2004. Hoboken,
New Jersey: Wiley series in probability and statistics, John Wiley & Sons, Inc. Smith, L., and Milanovic, D.: “The Total Control of Well Integrity Management,” SPE 117121 paper presented at the 2008 Abu Dhabi
International Petroleum Exhibition and Conference held in Abu Dhabi, UAE, 3-6 November 2008.
Sultan, A. A.: “Well Integrity management Systems; Achievements versus Expectations,” IPTC 13405 paper prepared for presentation
at the International Petroleum Technology Conference held in Doha, Qatar, 7-9 December 2009.
Vignes, B., Andreassen, J., and Tonning, S. A.: PSA Well Integrity Survey, Phase 1 Summary Report, 21 September 2006.
Wallace, G., Kiddie, N., Kearns, J., Robinson, P.: “A Compliance-based Approach to Well Integrity Management,” SPE 115585, paper
presented at the SPE Annual Technical Conference and Exhibition held in Denver, Colorado, U.S.A., 21-24 September 2008.
Well integrity guidelines. Issue 1. 2012. Oil & Gas UK, London, United Kingdom: ISBN 1 903 003 82 9.
Managing Operational Well Integrity – Prioritising Repairs to Minimise Risk 17
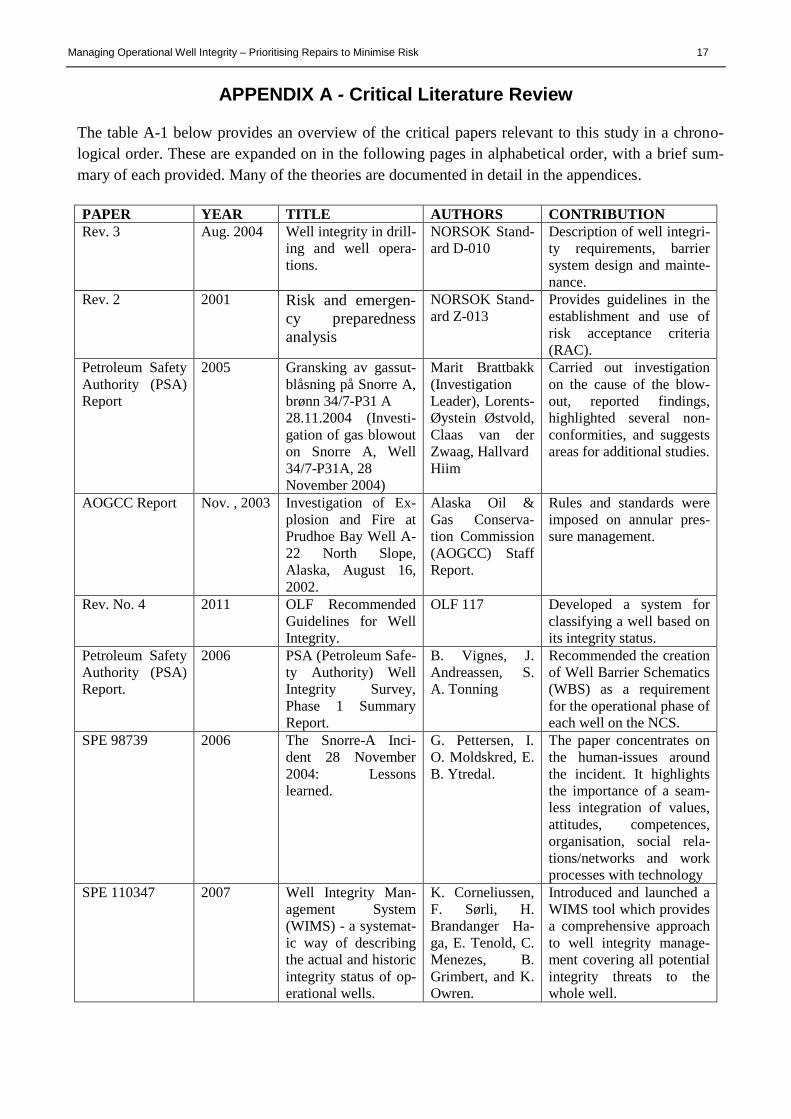
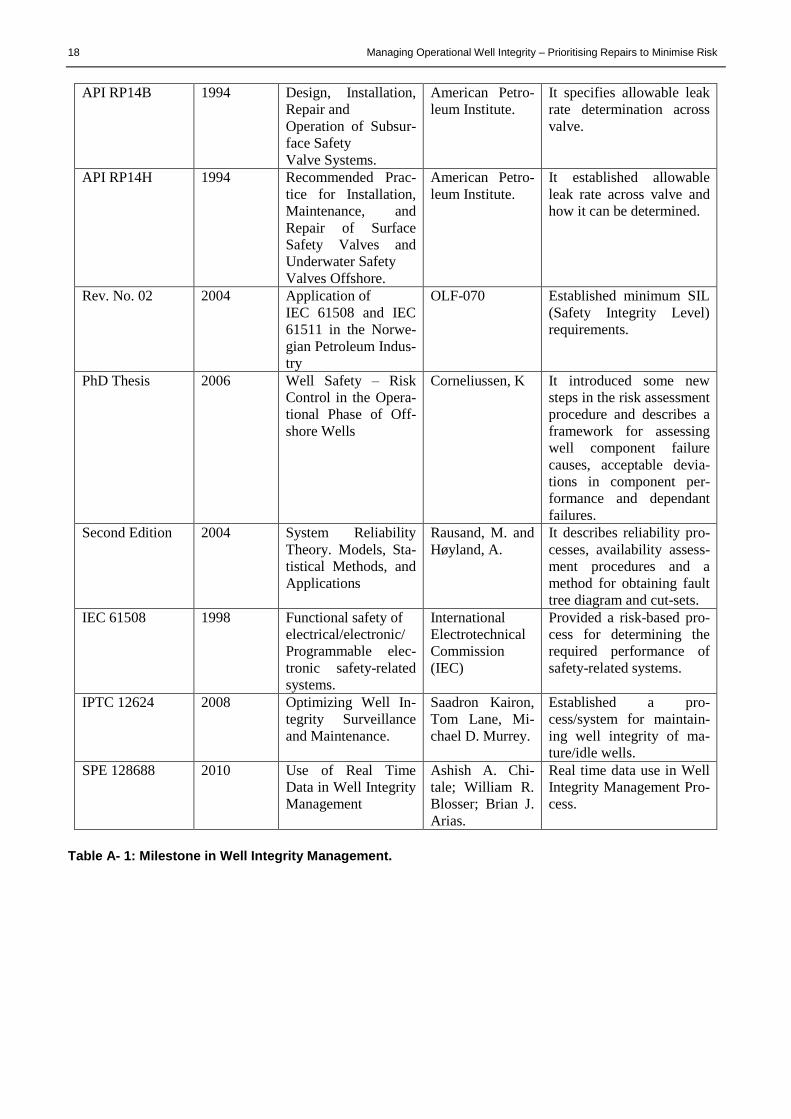
APPENDIX A - Critical Literature Review
The table A-1 below provides an overview of the critical papers relevant to this study in a chrono-
logical order. These are expanded on in the following pages in alphabetical order, with a brief sum-
mary of each provided. Many of the theories are documented in detail in the appendices.
PAPER YEAR TITLE AUTHORS CONTRIBUTION
Rev. 3 Aug. 2004 Well integrity in drill-
ing and well opera-
tions.
NORSOK Stand-
ard D-010
Description of well integri-
ty requirements, barrier
system design and mainte-
nance.
Rev. 2 2001 Risk and emergen-
cy preparedness
analysis
NORSOK Stand-
ard Z-013
Provides guidelines in the
establishment and use of
risk acceptance criteria
(RAC).
Petroleum Safety
Authority (PSA)
Report
2005 Gransking av gassut-
blåsning på Snorre A,
brønn 34/7-P31 A
28.11.2004 (Investi-
gation of gas blowout
on Snorre A, Well
34/7-P31A, 28
November 2004)
Marit Brattbakk
(Investigation
Leader), Lorents-
Øystein Østvold,
Claas van der
Zwaag, Hallvard
Hiim
Carried out investigation
on the cause of the blow-
out, reported findings,
highlighted several non-
conformities, and suggests
areas for additional studies.
AOGCC Report Nov. , 2003 Investigation of Ex-
plosion and Fire at
Prudhoe Bay Well A-
22 North Slope,
Alaska, August 16,
2002.
Alaska Oil &
Gas Conserva-
tion Commission
(AOGCC) Staff
Report.
Rules and standards were
imposed on annular pres-
sure management.
Rev. No. 4 2011 OLF Recommended
Guidelines for Well
Integrity.
OLF 117 Developed a system for
classifying a well based on
its integrity status.
Petroleum Safety
Authority (PSA)
Report.
2006 PSA (Petroleum Safe-
ty Authority) Well
Integrity Survey,
Phase 1 Summary
Report.
B. Vignes, J.
Andreassen, S.
A. Tonning
Recommended the creation
of Well Barrier Schematics
(WBS) as a requirement
for the operational phase of
each well on the NCS.
SPE 98739 2006 The Snorre-A Inci-
dent 28 November
2004: Lessons
learned.
G. Pettersen, I.
O. Moldskred, E.
B. Ytredal.
The paper concentrates on
the human-issues around
the incident. It highlights
the importance of a seam-
less integration of values,
attitudes, competences,
organisation, social rela-
tions/networks and work
processes with technology
SPE 110347 2007 Well Integrity Man-
agement System
(WIMS) - a systemat-
ic way of describing
the actual and historic
integrity status of op-
erational wells.
K. Corneliussen,
F. Sørli, H.
Brandanger Ha-
ga, E. Tenold, C.
Menezes, B.
Grimbert, and K.
Owren.
Introduced and launched a
WIMS tool which provides
a comprehensive approach
to well integrity manage-
ment covering all potential
integrity threats to the
whole well.
18 Managing Operational Well Integrity – Prioritising Repairs to Minimise Risk
API RP14B 1994 Design, Installation,
Repair and
Operation of Subsur-
face Safety
Valve Systems.
American Petro-
leum Institute.
It specifies allowable leak
rate determination across
valve.
API RP14H 1994 Recommended Prac-
tice for Installation,
Maintenance, and
Repair of Surface
Safety Valves and
Underwater Safety
Valves Offshore.
American Petro-
leum Institute.
It established allowable
leak rate across valve and
how it can be determined.
Rev. No. 02 2004 Application of
IEC 61508 and IEC
61511 in the Norwe-
gian Petroleum Indus-
try
OLF-070 Established minimum SIL
(Safety Integrity Level)
requirements.
PhD Thesis 2006 Well Safety – Risk
Control in the Opera-
tional Phase of Off-
shore Wells
Corneliussen, K It introduced some new
steps in the risk assessment
procedure and describes a
framework for assessing
well component failure
causes, acceptable devia-
tions in component per-
formance and dependant
failures.
Second Edition 2004 System Reliability
Theory. Models, Sta-
tistical Methods, and
Applications
Rausand, M. and
Høyland, A.
It describes reliability pro-
cesses, availability assess-
ment procedures and a
method for obtaining fault
tree diagram and cut-sets.
IEC 61508 1998 Functional safety of
electrical/electronic/
Programmable elec-
tronic safety-related
systems.
International
Electrotechnical
Commission
(IEC)
Provided a risk-based pro-
cess for determining the
required performance of
safety-related systems.
IPTC 12624 2008 Optimizing Well In-
tegrity Surveillance
and Maintenance.
Saadron Kairon,
Tom Lane, Mi-
chael D. Murrey.
Established a pro-
cess/system for maintain-
ing well integrity of ma-
ture/idle wells.
SPE 128688 2010 Use of Real Time
Data in Well Integrity
Management
Ashish A. Chi-
tale; William R.
Blosser; Brian J.
Arias.
Real time data use in Well
Integrity Management Pro-
cess.
Table A- 1: Milestone in Well Integrity Management.
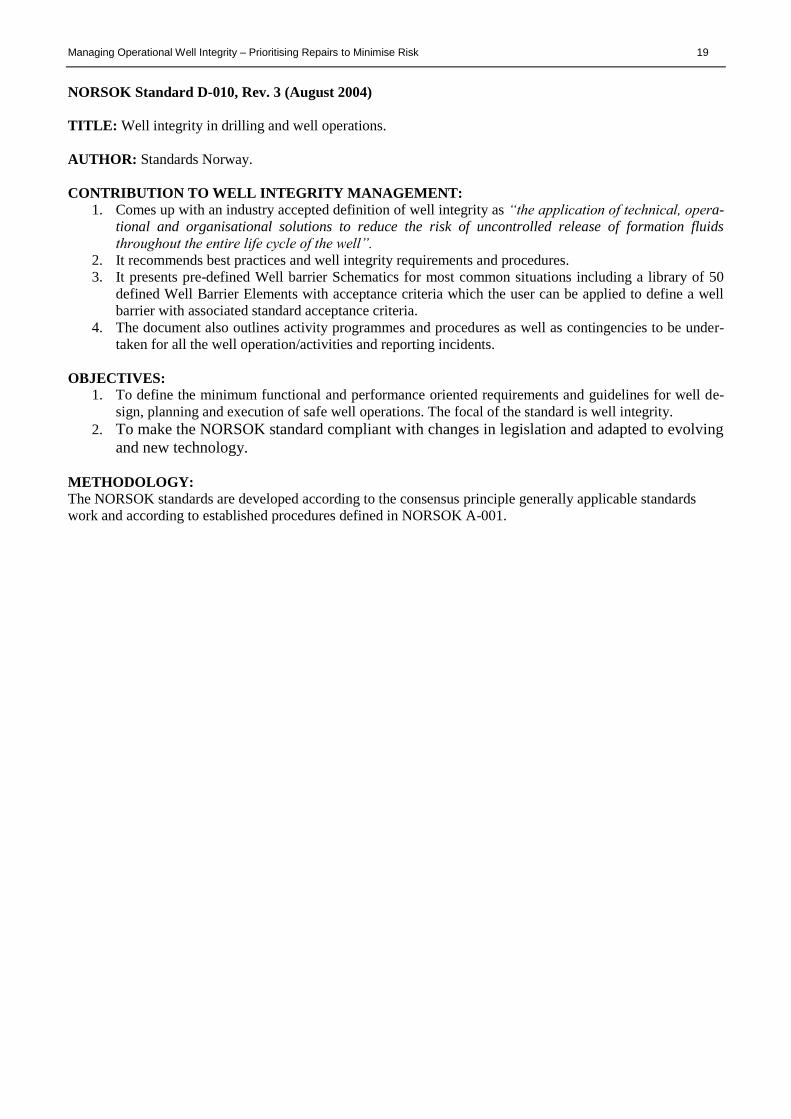
Managing Operational Well Integrity – Prioritising Repairs to Minimise Risk 19
NORSOK Standard D-010, Rev. 3 (August 2004)
TITLE: Well integrity in drilling and well operations.
AUTHOR: Standards Norway.
CONTRIBUTION TO WELL INTEGRITY MANAGEMENT: 1. Comes up with an industry accepted definition of well integrity as “the application of technical, opera-
tional and organisational solutions to reduce the risk of uncontrolled release of formation fluids
throughout the entire life cycle of the well”.
2. It recommends best practices and well integrity requirements and procedures.
3. It presents pre-defined Well barrier Schematics for most common situations including a library of 50
defined Well Barrier Elements with acceptance criteria which the user can be applied to define a well
barrier with associated standard acceptance criteria.
4. The document also outlines activity programmes and procedures as well as contingencies to be under-
taken for all the well operation/activities and reporting incidents.
OBJECTIVES: 1. To define the minimum functional and performance oriented requirements and guidelines for well de-
sign, planning and execution of safe well operations. The focal of the standard is well integrity.
2. To make the NORSOK standard compliant with changes in legislation and adapted to evolving
and new technology.
METHODOLOGY:
The NORSOK standards are developed according to the consensus principle generally applicable standards
work and according to established procedures defined in NORSOK A-001.
20 Managing Operational Well Integrity – Prioritising Repairs to Minimise Risk
NORSOK Standard Z-013, Rev. 2 (September 2001)
TITLE: Risk and emergency preparedness analysis.
AUTHOR: Norwegian Technology Centre.
CONTRIBUTION TO WELL INTEGRITY MANAGEMENT: 1. Gives guidelines in the establishment and use of risk acceptance criteria (RAC).
2. Presents steps and specific requirements to quantitative risk analysis (QRA) of well.
OBJECTIVES: To establish requirements for effective planning, execution and use of risk and EPA (Emer-
gency Preparedness Analysis).
METHODOLOGY:
The NORSOK standards are developed according to the consensus principle generally applicable standards
work and according to established procedures defined in NORSOK A-001.
Managing Operational Well Integrity – Prioritising Repairs to Minimise Risk 21
PETROLEUM SAFETY AUTHORITY (PSA) REPORT, 2005
TITLE: Gransking av gassutblåsning på Snorre A, brønn 34/7-P31 A 28.11.2004 (Investigation of gas blowout
on Snorre A, Well 34/7-P31A, 28 November 2004).
AUTHORS: Marit Brattbakk (Investigation Leader), Lorents-Øystein Østvold, Claas van der Zwaag, Hallvard
Hiim.
CONTRIBUTION TO WELL INTEGRITY MANAGEMENT: Carried out investigation on the cause of
the blow-out and reported its findings, highlighting on the effects of non-conformities and suggests areas for
additional studies.
OBJECTIVE OF PAPER: The following are the objectives of the report:
1. To chart the course of the incident
2. To identify triggering and underlying causes,
3. To evaluate the potential of the incident,
4. To identify potential breaches of the regulations as well
5. To propose use of policy instruments and recommendations for additional follow up.
METHODOLOGY: An MTO (Man, Technology and organisation) diagram was prepared to map the underly-
ing and direct causes. This was followed up by interviews, verifications on the facility and evaluation of docu-
ments.
CONCLUSION: 1. The investigation showed that the list of non-conformities and items that could be improved is exten-
sive.
2. The incident therefore could not have been caused by chance circumstances.
3. The non-conformities found in the investigation would all have been intercepted and corrected if the
barriers had functioned.
4. Failure of barriers should have been corrected at an earlier point in time.
22 Managing Operational Well Integrity – Prioritising Repairs to Minimise Risk
ALASKA OIL AND GAS CONSERVATION COMMISSION (AOGCC), NOV. 17, 2003
TITLE: Investigation of Explosion and Fire at Prudhoe Bay Well A-22 North Slope, Alaska, August 16, 2002.
AUTHORS: AOGCC
CONTRIBUTION TO WELL INTEGRITY: A product of the investigation was the casing annuli pressure
of the well, the internal gas pressure exceeded the burst strength of the surface casing, helped in defining Well
Integrity Standards.
OBJECTIVE OF PAPER: To present findings of the investigation conducted as a result of explosion and fire
at Prudhoe Bay Well A-22 North Slope, Alaska.
METHODOLOGY: The commission carried out the investigation in a systematic way by audits, inspections,
meeting reviews and interviews. This helped the commission classify its findings into the following:
Well design.
Drilling history.
Workover history.
Pressure history.
Safety devices.
Inspection reports.
Casing failure analysis.
CONCLUSION: The commission deemed it inappropriate to continue Self-regulated annular pressure man-
agement. The commission therefore imposed annular pressure management rules.
Managing Operational Well Integrity – Prioritising Repairs to Minimise Risk 23
Rev. 4, 2011.
TITLE: OLF Recommended Guidelines for Well Integrity.
AUTHOR: OLF – 117.
CONTRIBUTION TO WELL INTEGRITY: Developed a system for classifying a well based on its integrity
status.
OBJECTIVE:
1. To summarise WIF’s guideline of minimum data to be presented on WBSs of all NCS wells in the op-
erational phase.
2. To summarise and promote common understanding of the well categorisation system developed by
WIF as a method of ranking well integrity across NCS.
METHODOLOGY: A survey was completed by WIF members, which formed the basis for discussion and
development of this guidance. It was then prepared with the broad-based participation of interested parties in
the Norwegian petroleum industry.
24 Managing Operational Well Integrity – Prioritising Repairs to Minimise Risk
PSA Well Integrity Survey, Phase 1 Summary Report (2006)
AUTHORS: B. Vignes, J. Andreassen, S. A. Tonning
CONTRIBUTION TO WELL INTEGRITY MANAGEMENT: Exposed lapses in Well Integrity Manage-
ment compliance and enhanced a better mutual understanding of Well Integrity Standards. It established the
requirement for the creation of well barrier schematics (WBS) for the operational phase of each well on the
NCS.
OBJECTIVE: To get a picture of the Well Integrity Status of operating companies and assess areas for im-
provement.
METHODOLOGY: This was done by spot-checking compliance with laid down procedures and well integrity
Standards for selected wells. The plan for the pilot project (Phase 1) was presented to the OLF-Drilling Manag-
ers Forum in a meeting to promote and get initial feedback prior to launching it. The focus on well barriers and
plans for a pilot project was positively responded to by the participants of that meeting. Seven selected operat-
ing companies received an audit notification from PSA at the end of February 2006 and were requested to pro-
vide status of well integrity issues for certain pre-selected offshore facilities/wells as of 1.3.2006. From a total
number of development wells on the Norwegian Continental Shelf (NCS), 12 installations with associated 581
wells were originally identified as potential candidates for the pilot project. The feedback from the industry was
followed by a questionnaire.
CONCLUSION: 1. Gaps and challenges exist within and between companies. The industry needs to have increased focus
on its barrier philosophy.
2. There’s a need for improved visualization of essential well information and more complete overview of
the condition of wells in the NCS.
Managing Operational Well Integrity – Prioritising Repairs to Minimise Risk 25
SPE 98739 (2006)
TITLE: The Snorre A Incident 28 November 2004: Lessons learned.
AUTHORS: G. Pettersen, I. O. Moldskred, E. B. Ytredal.
CONTRIBUTION TO WELL INTEGRITY MANAGEMENT: The paper concentrates on the human is-
sues around the incident. It highlights the importance of a seamless integration of values, attitudes, competenc-
es, organisation, social relations/networks and work processes with technology.
OBJECTIVE OF PAPER: This is meant to reflect the comprehensive analysis carried out by Statoil in the aftermath of a gas seabed blow-
out on the Snorre field in the North Sea based on the Pentagon model.
METHODOLOGY: A causal analysis was carried out which is based on the “Pentagon Model” made up of:
- Technology and operators.
- Organisation.
- Values, attitudes and competence.
- Social relations and networks.
- Work processes.
CONCLUSION: Measure were being undertaken to correct the deficiencies in the system leading to the
Snorre-A gas blow-out.
26 Managing Operational Well Integrity – Prioritising Repairs to Minimise Risk
SPE 110347 (2007)
TITLE: Well Integrity Management System (WIMS) - A Systematic Way of Describing the Actual and Histor-
ic Integrity Status of Operational Wells.
AUTHORS: K. Corneliussen, F. Sørli, H. Brandanger Haga, E. Tenold, C. Menezes, B. Grimbert, and K. Ow-
ren.
CONTRIBUTION TO WELL INTEGRITY MANAGEMENT: Introduction, implementation and assess-
ment of the WIMS (Well Integrity Management System) tool in the Joint Industry Project (JIP) made up of
Statoil, Norsk Hydro, Total E&P UK & ExproSoft.
OBJECTIVES OF PAPER: To discuss the philosophy behind how WIMS handles well integrity information
from when the well completion is installed until the well is permanently abandoned and the experience from the
evaluation and implementation of WIMS.
METHODOLOGY USED:
For each well, information relevant to identify well integrity problems is presented, aggregated and summarised
to give an overview for any defined cluster of wells ensuring a new level of control within well integrity man-
agement. The information available for an individual well is divided into three main categories: well infor-
mation, well monitoring and well status.
CONCLUSION: WIMS can make a contribution to better control and safe well operations by providing an
easy to use and standardised way of documenting well integrity. However, it requires organisational implemen-
tation.
Managing Operational Well Integrity – Prioritising Repairs to Minimise Risk 27
API RP 14B, 1994.
TITLE: Design, Installation, Repair and Operation of Subsurface Safety Valve Systems.
AUTHOR: American Petroleum Institute.
CONTRIBUTION TO WELL INTEGRITY: It describes the components and the engineering principles for
the design calculations, installation, and operation of subsurface safety valve system. It established allowable
leak rate across valve and how it can be determined.
OBJECTIVE: To describe the components and the engineering principles for the design calculations, installa-
tion, and operation of subsurface safety valve system.
28 Managing Operational Well Integrity – Prioritising Repairs to Minimise Risk
API RP 14H, 1994.
TITLE: Recommended Practice for Installation, Maintenance, and Repair of Surface Safety Valves and Un-
derwater Safety Valves Offshore.
AUTHOR: American Petroleum Institute.
CONTRIBUTION TO WELL INTEGRITY: It describes the components and the engineering principles for
the design calculations, installation, and operation of Surface safety valve and underwater safety valves off-
shore. It established allowable leak rate across valve and how it can be determined.
OBJECTIVE: To provide guidance for inspecting, installing, operating, maintaining, and repairing
SSSVs/USVs manufactured according to API specification 14D.
Managing Operational Well Integrity – Prioritising Repairs to Minimise Risk 29
Rev. 2, 2004.
TITLE: Application of IEC 61508 and IEC 61511 in the Norwegian Petroleum Industry.
AUTHOR: OLF – 070.
CONTRIBUTION TO WELL INTEGRITY: Established minimum SIL (Safety Integrity Level) require-
ments on a petroleum production installation.
OBJECTIVE: To adapt and simplify the application of IEC 61508 and IEC 61511 standards for use in the
Norwegian Petroleum Industry.
METHODOLOGY: Adopted a methodology in accordance with IEC 61508.
30 Managing Operational Well Integrity – Prioritising Repairs to Minimise Risk
Second Edition, 2004.
TITLE: System Reliability Theory. Models, Statistical Methods, and Applications.
AUTHORS: Marvin Rausand and Arnljot Høyland.
CONTRIBUTION TO WELL INTEGRITY: 1. It describes reliability processes and availability assessment procedures which could be applied in well
integrity reliability determination.
2. Describes a method for obtaining fault tree diagram and cut-sets.
OBJECTIVE: The main objectives of this book are:
1. To present and discuss the terminology and main models used in reliability studies.
2. To present analytical methods that are fundamental within reliability engineering and analysis of relia-
bility data.
METHODOLOGY: Adopted a mathematical approach in showing the basics and application of reliability
studies.
CONCLUSION: Reliability analysis has very broad application areas including well integrity studies.
Managing Operational Well Integrity – Prioritising Repairs to Minimise Risk 31
PhD Thesis, 2006.
TITLE: Well Safety – Risk Control in the Operational Phase of Offshore Wells.
AUTHOR: Kjell Corneliussen.
CONTRIBUTION TO WELL INTEGRITY: 1. Introduced some new steps in the risk assessment procedure.
2. Established a set of well risk factors for assessing well risk in the operational phase.
3. A method for constructing barrier diagrams is introduced.
4. It describes a framework for assessing well component failure causes, acceptable deviations in compo-
nent performance and dependant failures.
5. It shows a method for calculating safety unavailability of safety functions and a method for calculating
safety unavailability for different configurations of surface controlled subsurface safety valves.
OBJECTIVE: To develop a systematic approach for risk assessment of oil and gas wells in the operational
phase.
METHODOLOGY: The thesis consists of a main report that describes a framework for use of well risk as-
sessment in the operational phase. A set of papers is included as appendixes to the main report which describe
detailed methods or procedures that are part of the framework. The risk assessment procedure presented in the
main report was developed in cooperation with Norsk Hydro.
CONCLUSION: New methods have been proposed; improvements to old ones have been suggested.
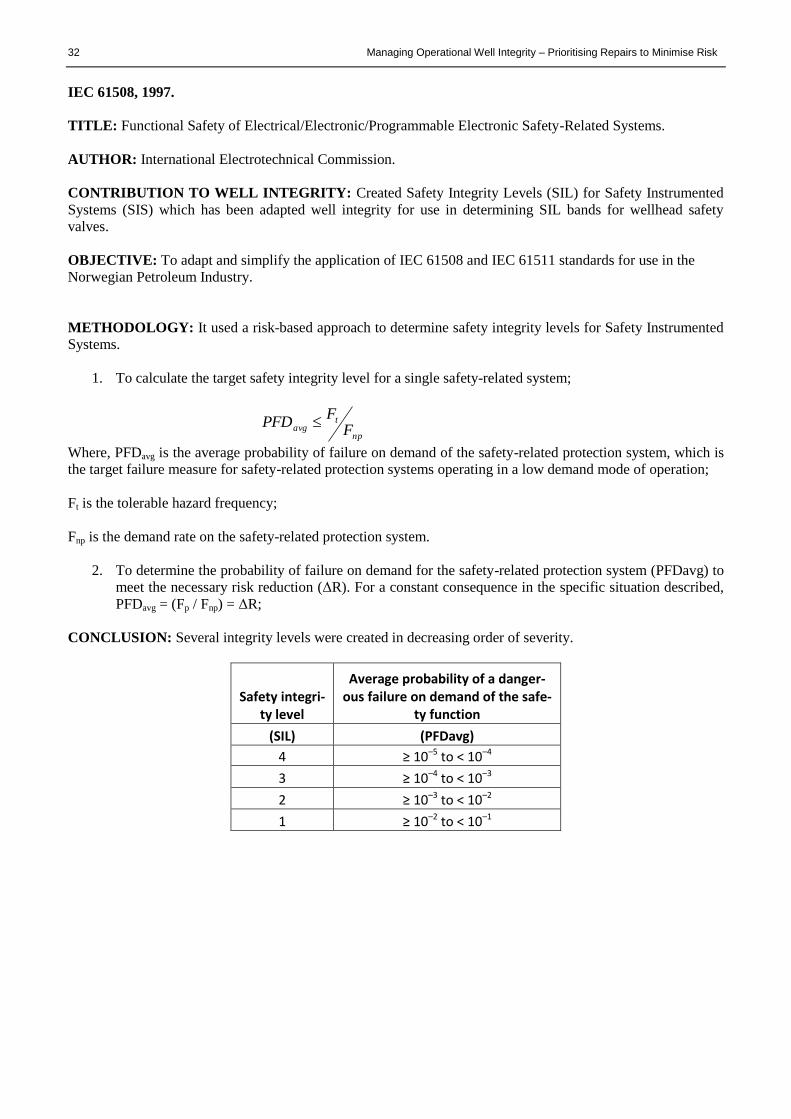
32 Managing Operational Well Integrity – Prioritising Repairs to Minimise Risk
IEC 61508, 1997.
TITLE: Functional Safety of Electrical/Electronic/Programmable Electronic Safety-Related Systems.
AUTHOR: International Electrotechnical Commission.
CONTRIBUTION TO WELL INTEGRITY: Created Safety Integrity Levels (SIL) for Safety Instrumented
Systems (SIS) which has been adapted well integrity for use in determining SIL bands for wellhead safety
valves.
OBJECTIVE: To adapt and simplify the application of IEC 61508 and IEC 61511 standards for use in the
Norwegian Petroleum Industry.
METHODOLOGY: It used a risk-based approach to determine safety integrity levels for Safety Instrumented
Systems.
1. To calculate the target safety integrity level for a single safety-related system;
np
tavg F
FPFD
Where, PFDavg is the average probability of failure on demand of the safety-related protection system, which is
the target failure measure for safety-related protection systems operating in a low demand mode of operation;
Ft is the tolerable hazard frequency;
Fnp is the demand rate on the safety-related protection system.
2. To determine the probability of failure on demand for the safety-related protection system (PFDavg) to
meet the necessary risk reduction (ΔR). For a constant consequence in the specific situation described,
PFDavg = (Fp / Fnp) = ΔR;
CONCLUSION: Several integrity levels were created in decreasing order of severity.
Safety integri-ty level
Average probability of a danger-ous failure on demand of the safe-
ty function
(SIL) (PFDavg)
4 ≥ 10–5 to < 10–4
3 ≥ 10–4 to < 10–3
2 ≥ 10–3 to < 10–2
1 ≥ 10–2 to < 10–1
Managing Operational Well Integrity – Prioritising Repairs to Minimise Risk 33
IPTC 12624 (2008)
TITLE: Optimizing Well Integrity Surveillance and Maintenance.
AUTHORS: Saadron Kairon, Tom Lane, Michael D. Murrey.
CONTRIBUTION TO WELL INTEGRITY MANAGEMENT: Established a process/system for maintain-
ing well integrity of mature/idle wells.
PAPER OBJECTIVE: To describe the issues and actions taken for idle wells to ensure compliance with the
ExxonMobil Exploration & Production Malaysia Inc. (EMEPMI) well integrity surveillance and maintenance
standards for offshore platform facilities.
METHODOLOGY: A staged approach was implemented: 1.) Well integrity expectation were clarified, pro-
cedures were updated and refresher training conducted; 2.) Current processes were compared with these expec-
tations; 3.) A pilot to obtain operations feedback and evaluation of manning efficiency was conducted; 4.) An
action plan was developed to address the well integrity and operability issues.
CONCLUSION:
1. Establishing expectations and KPIs (Key Performance Indicators) to evaluate the well integrity surveil-
lance and maintenance processes are essential.
2. Work processes and people’s roles and responsibilities should be clarified.
3. Independent assessment of the performance of the overall well integrity surveillance and maintenance
process is important.

34 Managing Operational Well Integrity – Prioritising Repairs to Minimise Risk
SPE 128688 (2010)
TITLE: Use of Real Time Data in Well Integrity Management
AUTHORS: Ashish A. Chitale; William R. Blosser; Brian J. Arias
OBJECTIVE OF PAPER: To demonstrate through case studies the ability to use innovative workflows and
technologies, enabled by real time data, to identify and mitigate well integrity risks.
CONTRIBUTION TO WELL INTEGRITY MANAGEMENT: Real time data use in Well Integrity Man-
agement process.
METHODOLOGY: BP deployed the field of the future technology in obtaining real-time products and by this
addressed the following areas: Production optimization, Production protection and reserves addition. The ISIS
(Integrated Surveillance Information System) technology which is at the heart of the production surveillance is
used in support of three key workflows (Mechanical well equipment integrity, Sand management, Annuli moni-
toring) to help manage well integrity. Illustrations of the application of this technology were given.
CONCLUSION:
BP has employed cutting edge surveillance technologies driven by real time data which allows better decisions
to be taken faster. There is a striving for continuous improvement in well integrity and production optimisation
by the consistent deployment of this technology. Real time data driven technologies will allow IOCs (Interna-
tional Oil Companies) to maximise safely the life of oil and gas wells.
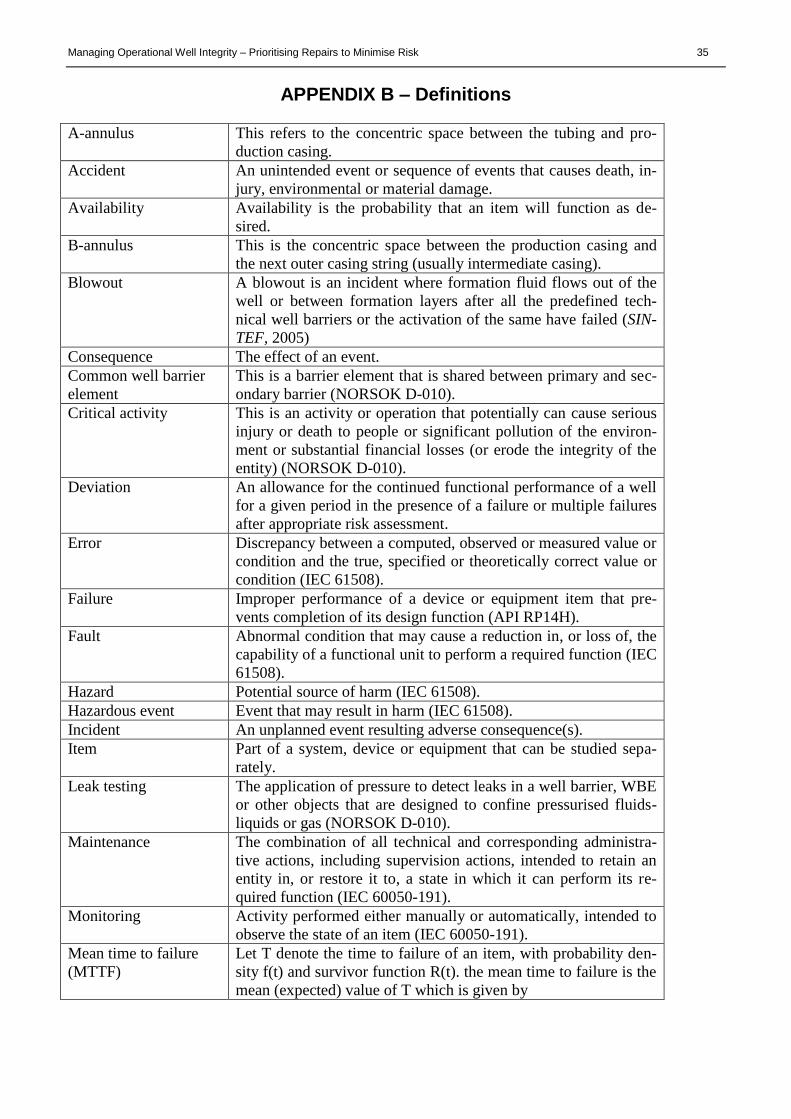
Managing Operational Well Integrity – Prioritising Repairs to Minimise Risk 35
APPENDIX B – Definitions
A-annulus This refers to the concentric space between the tubing and pro-
duction casing.
Accident An unintended event or sequence of events that causes death, in-
jury, environmental or material damage.
Availability Availability is the probability that an item will function as de-
sired.
B-annulus This is the concentric space between the production casing and
the next outer casing string (usually intermediate casing).
Blowout A blowout is an incident where formation fluid flows out of the
well or between formation layers after all the predefined tech-
nical well barriers or the activation of the same have failed (SIN-
TEF, 2005)
Consequence The effect of an event.
Common well barrier
element
This is a barrier element that is shared between primary and sec-
ondary barrier (NORSOK D-010).
Critical activity This is an activity or operation that potentially can cause serious
injury or death to people or significant pollution of the environ-
ment or substantial financial losses (or erode the integrity of the
entity) (NORSOK D-010).
Deviation An allowance for the continued functional performance of a well
for a given period in the presence of a failure or multiple failures
after appropriate risk assessment.
Error Discrepancy between a computed, observed or measured value or
condition and the true, specified or theoretically correct value or
condition (IEC 61508).
Failure Improper performance of a device or equipment item that pre-
vents completion of its design function (API RP14H).
Fault Abnormal condition that may cause a reduction in, or loss of, the
capability of a functional unit to perform a required function (IEC
61508).
Hazard Potential source of harm (IEC 61508).
Hazardous event Event that may result in harm (IEC 61508).
Incident An unplanned event resulting adverse consequence(s).
Item Part of a system, device or equipment that can be studied sepa-
rately.
Leak testing The application of pressure to detect leaks in a well barrier, WBE
or other objects that are designed to confine pressurised fluids-
liquids or gas (NORSOK D-010).
Maintenance The combination of all technical and corresponding administra-
tive actions, including supervision actions, intended to retain an
entity in, or restore it to, a state in which it can perform its re-
quired function (IEC 60050-191).
Monitoring Activity performed either manually or automatically, intended to
observe the state of an item (IEC 60050-191).
Mean time to failure
(MTTF)
Let T denote the time to failure of an item, with probability den-
sity f(t) and survivor function R(t). the mean time to failure is the
mean (expected) value of T which is given by
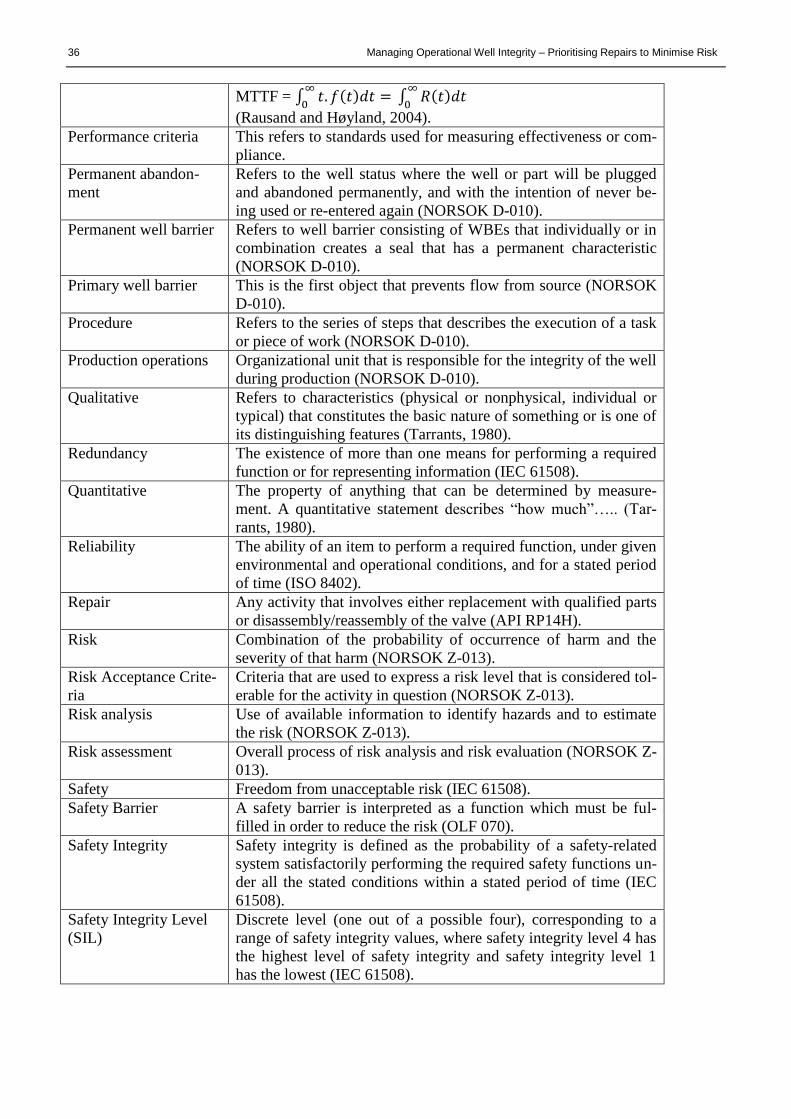
36 Managing Operational Well Integrity – Prioritising Repairs to Minimise Risk
MTTF = ∫ 𝑡. 𝑓(𝑡)𝑑𝑡 =∞
0 ∫ 𝑅(𝑡)𝑑𝑡
∞
0
(Rausand and Høyland, 2004).
Performance criteria This refers to standards used for measuring effectiveness or com-
pliance.
Permanent abandon-
ment
Refers to the well status where the well or part will be plugged
and abandoned permanently, and with the intention of never be-
ing used or re-entered again (NORSOK D-010).
Permanent well barrier Refers to well barrier consisting of WBEs that individually or in
combination creates a seal that has a permanent characteristic
(NORSOK D-010).
Primary well barrier This is the first object that prevents flow from source (NORSOK
D-010).
Procedure Refers to the series of steps that describes the execution of a task
or piece of work (NORSOK D-010).
Production operations Organizational unit that is responsible for the integrity of the well
during production (NORSOK D-010).
Qualitative Refers to characteristics (physical or nonphysical, individual or
typical) that constitutes the basic nature of something or is one of
its distinguishing features (Tarrants, 1980).
Redundancy The existence of more than one means for performing a required
function or for representing information (IEC 61508).
Quantitative The property of anything that can be determined by measure-
ment. A quantitative statement describes “how much”….. (Tar-
rants, 1980).
Reliability The ability of an item to perform a required function, under given
environmental and operational conditions, and for a stated period
of time (ISO 8402).
Repair Any activity that involves either replacement with qualified parts
or disassembly/reassembly of the valve (API RP14H).
Risk Combination of the probability of occurrence of harm and the
severity of that harm (NORSOK Z-013).
Risk Acceptance Crite-
ria
Criteria that are used to express a risk level that is considered tol-
erable for the activity in question (NORSOK Z-013).
Risk analysis Use of available information to identify hazards and to estimate
the risk (NORSOK Z-013).
Risk assessment Overall process of risk analysis and risk evaluation (NORSOK Z-
013).
Safety Freedom from unacceptable risk (IEC 61508).
Safety Barrier A safety barrier is interpreted as a function which must be ful-
filled in order to reduce the risk (OLF 070).
Safety Integrity Safety integrity is defined as the probability of a safety-related
system satisfactorily performing the required safety functions un-
der all the stated conditions within a stated period of time (IEC
61508).
Safety Integrity Level
(SIL)
Discrete level (one out of a possible four), corresponding to a
range of safety integrity values, where safety integrity level 4 has
the highest level of safety integrity and safety integrity level 1
has the lowest (IEC 61508).
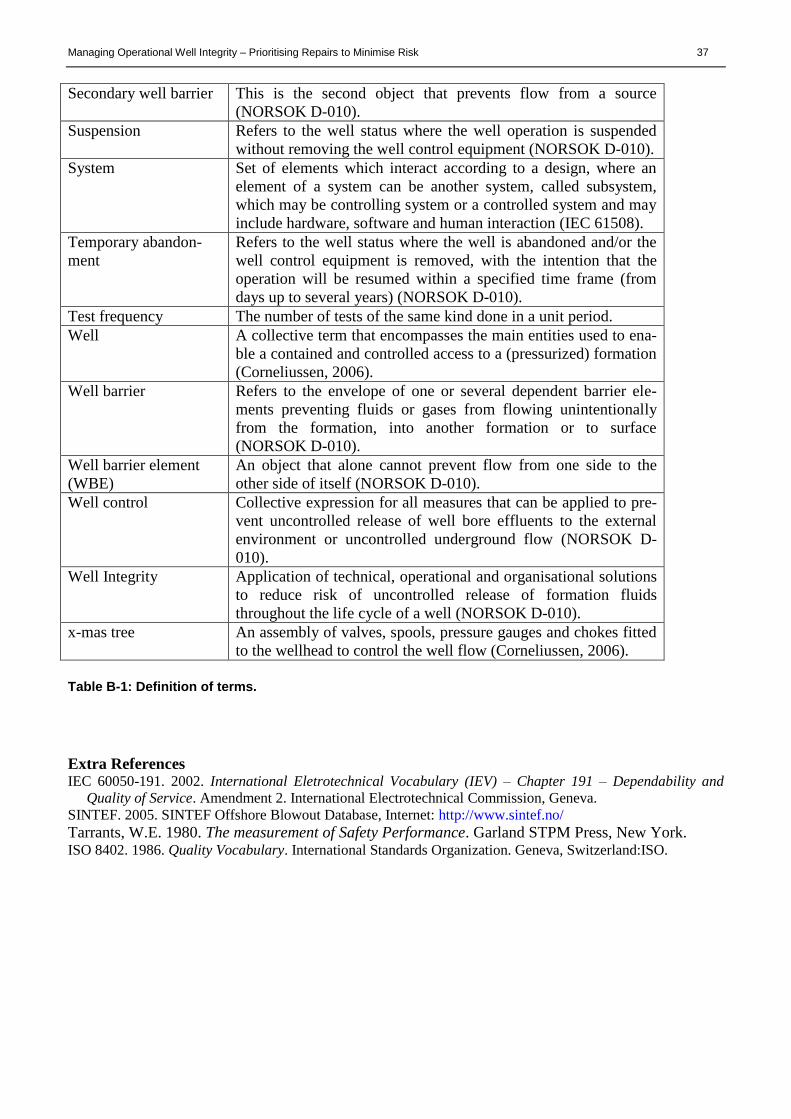
Managing Operational Well Integrity – Prioritising Repairs to Minimise Risk 37
Secondary well barrier This is the second object that prevents flow from a source
(NORSOK D-010).
Suspension Refers to the well status where the well operation is suspended
without removing the well control equipment (NORSOK D-010).
System Set of elements which interact according to a design, where an
element of a system can be another system, called subsystem,
which may be controlling system or a controlled system and may
include hardware, software and human interaction (IEC 61508).
Temporary abandon-
ment
Refers to the well status where the well is abandoned and/or the
well control equipment is removed, with the intention that the
operation will be resumed within a specified time frame (from
days up to several years) (NORSOK D-010).
Test frequency The number of tests of the same kind done in a unit period.
Well A collective term that encompasses the main entities used to ena-
ble a contained and controlled access to a (pressurized) formation
(Corneliussen, 2006).
Well barrier Refers to the envelope of one or several dependent barrier ele-
ments preventing fluids or gases from flowing unintentionally
from the formation, into another formation or to surface
(NORSOK D-010).
Well barrier element
(WBE)
An object that alone cannot prevent flow from one side to the
other side of itself (NORSOK D-010).
Well control Collective expression for all measures that can be applied to pre-
vent uncontrolled release of well bore effluents to the external
environment or uncontrolled underground flow (NORSOK D-
010).
Well Integrity Application of technical, operational and organisational solutions
to reduce risk of uncontrolled release of formation fluids
throughout the life cycle of a well (NORSOK D-010).
x-mas tree An assembly of valves, spools, pressure gauges and chokes fitted
to the wellhead to control the well flow (Corneliussen, 2006).
Table B-1: Definition of terms.
Extra References IEC 60050-191. 2002. International Eletrotechnical Vocabulary (IEV) – Chapter 191 – Dependability and
Quality of Service. Amendment 2. International Electrotechnical Commission, Geneva.
SINTEF. 2005. SINTEF Offshore Blowout Database, Internet: http://www.sintef.no/
Tarrants, W.E. 1980. The measurement of Safety Performance. Garland STPM Press, New York. ISO 8402. 1986. Quality Vocabulary. International Standards Organization. Geneva, Switzerland:ISO.
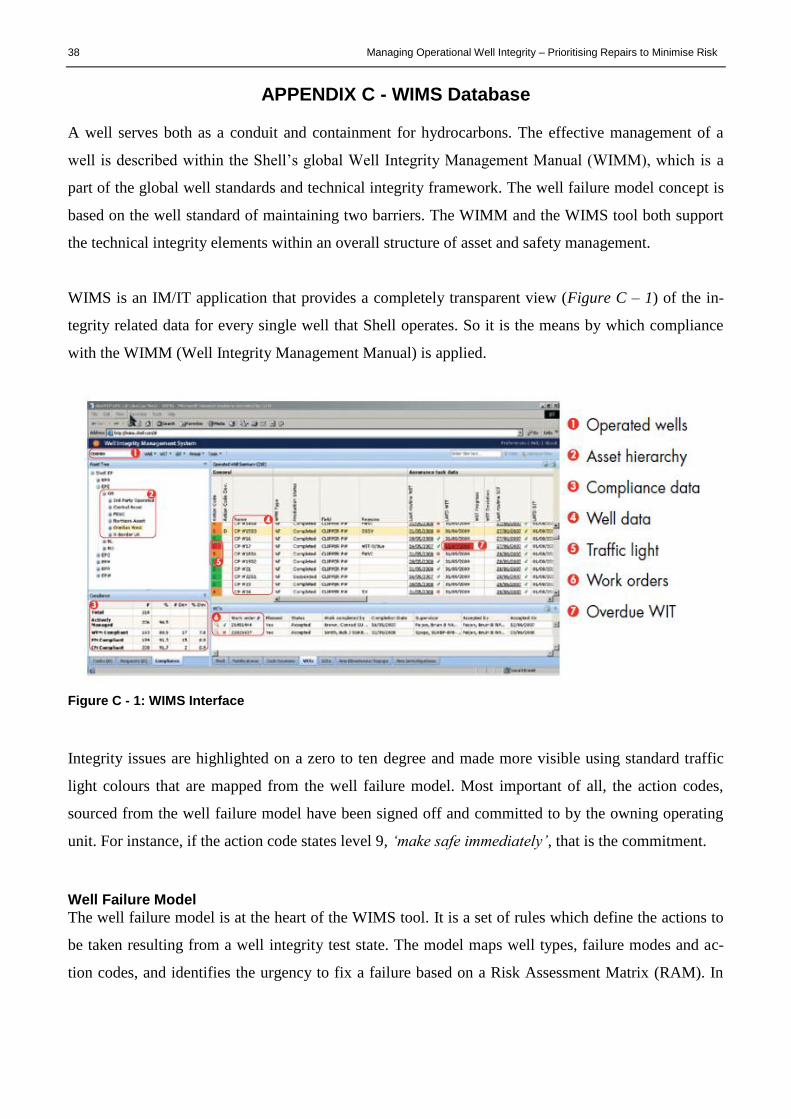
38 Managing Operational Well Integrity – Prioritising Repairs to Minimise Risk
APPENDIX C - WIMS Database
A well serves both as a conduit and containment for hydrocarbons. The effective management of a
well is described within the Shell’s global Well Integrity Management Manual (WIMM), which is a
part of the global well standards and technical integrity framework. The well failure model concept is
based on the well standard of maintaining two barriers. The WIMM and the WIMS tool both support
the technical integrity elements within an overall structure of asset and safety management.
WIMS is an IM/IT application that provides a completely transparent view (Figure C – 1) of the in-
tegrity related data for every single well that Shell operates. So it is the means by which compliance
with the WIMM (Well Integrity Management Manual) is applied.
Figure C - 1: WIMS Interface
Integrity issues are highlighted on a zero to ten degree and made more visible using standard traffic
light colours that are mapped from the well failure model. Most important of all, the action codes,
sourced from the well failure model have been signed off and committed to by the owning operating
unit. For instance, if the action code states level 9, ‘make safe immediately’, that is the commitment.
Well Failure Model
The well failure model is at the heart of the WIMS tool. It is a set of rules which define the actions to
be taken resulting from a well integrity test state. The model maps well types, failure modes and ac-
tion codes, and identifies the urgency to fix a failure based on a Risk Assessment Matrix (RAM). In
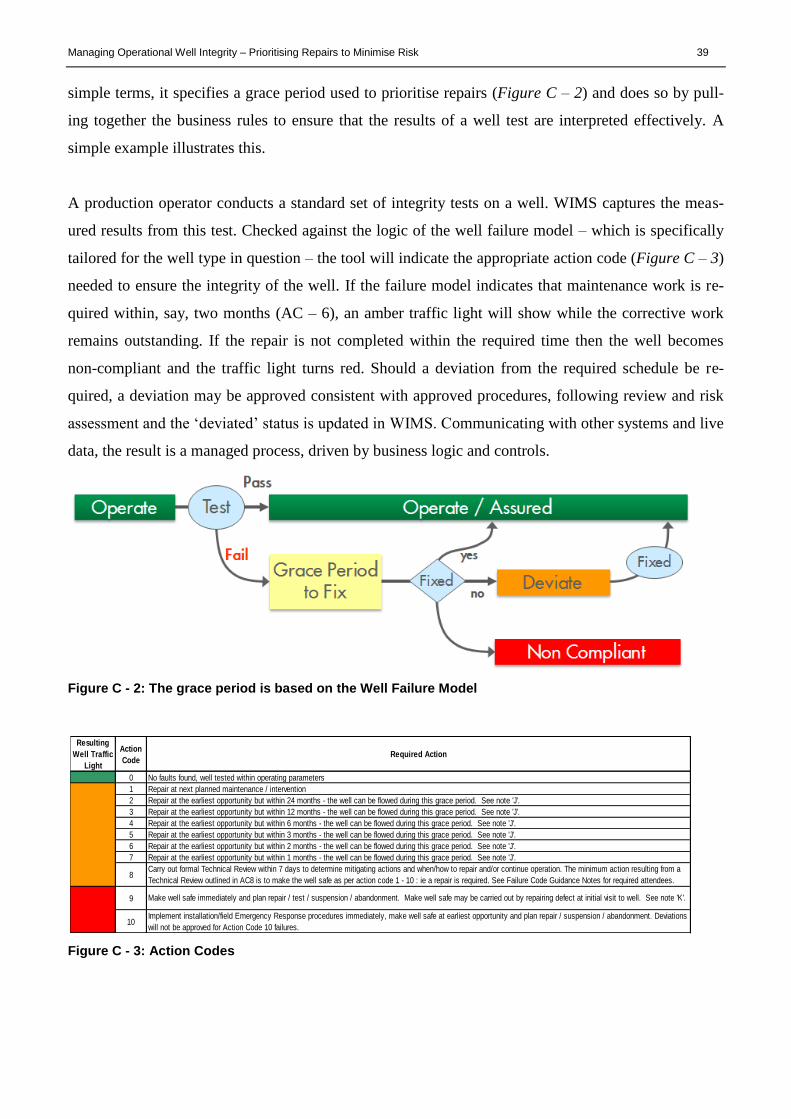
Managing Operational Well Integrity – Prioritising Repairs to Minimise Risk 39
simple terms, it specifies a grace period used to prioritise repairs (Figure C – 2) and does so by pull-
ing together the business rules to ensure that the results of a well test are interpreted effectively. A
simple example illustrates this.
A production operator conducts a standard set of integrity tests on a well. WIMS captures the meas-
ured results from this test. Checked against the logic of the well failure model – which is specifically
tailored for the well type in question – the tool will indicate the appropriate action code (Figure C – 3)
needed to ensure the integrity of the well. If the failure model indicates that maintenance work is re-
quired within, say, two months (AC – 6), an amber traffic light will show while the corrective work
remains outstanding. If the repair is not completed within the required time then the well becomes
non-compliant and the traffic light turns red. Should a deviation from the required schedule be re-
quired, a deviation may be approved consistent with approved procedures, following review and risk
assessment and the ‘deviated’ status is updated in WIMS. Communicating with other systems and live
data, the result is a managed process, driven by business logic and controls.
Figure C - 2: The grace period is based on the Well Failure Model
Figure C - 3: Action Codes
Resulting
Well Traffic
Light
Action
Code
G 0
1
2
3
4
5
6
7
8
9
10
R
Repair at the earliest opportunity but within 2 months - the well can be flowed during this grace period. See note 'J'.
Implement installation/field Emergency Response procedures immediately, make well safe at earliest opportunity and plan repair / suspension / abandonment. Deviations
will not be approved for Action Code 10 failures.
Make well safe immediately and plan repair / test / suspension / abandonment. Make well safe may be carried out by repairing defect at initial visit to well. See note 'K'.
O Repair at the earliest opportunity but within 3 months - the well can be flowed during this grace period. See note 'J'.
Required Action
Repair at next planned maintenance / intervention
Carry out formal Technical Review within 7 days to determine mitigating actions and when/how to repair and/or continue operation. The minimum action resulting from a
Technical Review outlined in AC8 is to make the well safe as per action code 1 - 10 : ie a repair is required. See Failure Code Guidance Notes for required attendees.
Repair at the earliest opportunity but within 1 months - the well can be flowed during this grace period. See note 'J'.
Repair at the earliest opportunity but within 6 months - the well can be flowed during this grace period. See note 'J'.
Repair at the earliest opportunity but within 24 months - the well can be flowed during this grace period. See note 'J'.
Repair at the earliest opportunity but within 12 months - the well can be flowed during this grace period. See note 'J'.
No faults found, well tested within operating parameters
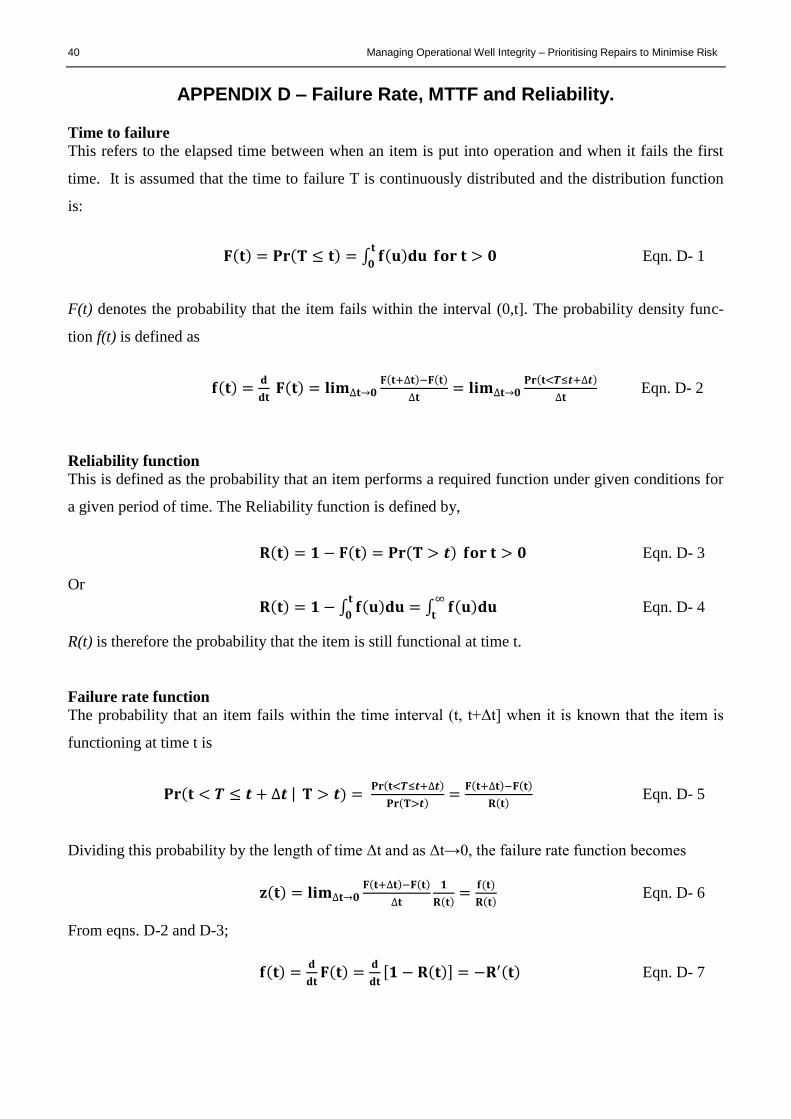
40 Managing Operational Well Integrity – Prioritising Repairs to Minimise Risk
APPENDIX D – Failure Rate, MTTF and Reliability.
Time to failure
This refers to the elapsed time between when an item is put into operation and when it fails the first
time. It is assumed that the time to failure T is continuously distributed and the distribution function
is:
𝐅(𝐭) = 𝐏𝐫(𝐓 ≤ 𝐭) = ∫ 𝐟(𝐮)𝐝𝐮𝐭
𝟎 𝐟𝐨𝐫 𝐭 > 𝟎 Eqn. D- 1
F(t) denotes the probability that the item fails within the interval (0,t]. The probability density func-
tion f(t) is defined as
𝐟(𝐭) =𝐝
𝐝𝐭 𝐅(𝐭) = 𝐥𝐢𝐦∆𝐭→𝟎
𝐅(𝐭+∆𝐭)−𝐅(𝐭)
∆𝐭= 𝐥𝐢𝐦∆𝐭→𝟎
𝐏𝐫(𝐭<𝑻≤𝒕+∆𝒕)
∆𝐭 Eqn. D- 2
Reliability function
This is defined as the probability that an item performs a required function under given conditions for
a given period of time. The Reliability function is defined by,
𝐑(𝐭) = 𝟏 − 𝐅(𝐭) = 𝐏𝐫(𝐓 > 𝒕) 𝐟𝐨𝐫 𝐭 > 𝟎 Eqn. D- 3
Or
𝐑(𝐭) = 𝟏 − ∫ 𝐟(𝐮)𝐝𝐮𝐭
𝟎= ∫ 𝐟(𝐮)𝐝𝐮
∞
𝐭 Eqn. D- 4
R(t) is therefore the probability that the item is still functional at time t.
Failure rate function
The probability that an item fails within the time interval (t, t+Δt] when it is known that the item is
functioning at time t is
𝐏𝐫(𝐭 < 𝑻 ≤ 𝒕 + ∆𝒕 | 𝐓 > 𝒕) = 𝐏𝐫(𝐭<𝑻≤𝒕+∆𝒕)
𝐏𝐫(𝐓>𝒕)=
𝐅(𝐭+∆𝐭)−𝐅(𝐭)
𝐑(𝐭) Eqn. D- 5
Dividing this probability by the length of time Δt and as Δt→0, the failure rate function becomes
𝐳(𝐭) = 𝐥𝐢𝐦∆𝐭→𝟎𝐅(𝐭+∆𝐭)−𝐅(𝐭)
∆𝐭
𝟏
𝐑(𝐭)=
𝐟(𝐭)
𝐑(𝐭) Eqn. D- 6
From eqns. D-2 and D-3;
𝐟(𝐭) =𝐝
𝐝𝐭𝐅(𝐭) =
𝐝
𝐝𝐭[𝟏 − 𝐑(𝐭)] = −𝐑′(𝐭) Eqn. D- 7
Managing Operational Well Integrity – Prioritising Repairs to Minimise Risk 41
Therefore,
𝐳(𝐭) = −𝐑′(𝐭)
𝐑(𝐭)= −
𝐝
𝐝𝐭𝐥𝐧 𝐑(𝐭) Eqn. D- 8
And,
𝐑(𝐭) = 𝐞𝐱𝐩 (− ∫ 𝐳(𝐮)𝐝𝐮𝐭
𝟎) Eqn. D- 9
From eqn. D-6 𝐟(𝐭) = 𝐳(𝐭). 𝐑(𝐭) Eqn. D- 10
Therefore,
𝐟(𝐭) = 𝐳(𝐭). 𝐞𝐱𝐩 (− ∫ 𝐳(𝐮)𝐝𝐮𝐭
𝟎) , 𝐭 > 𝟎 Eqn. D- 11
Mean Time to Failure
The mean time to failure (MTTF) of an item is defined by,
𝐌𝐓𝐓𝐅 = 𝐄(𝐓) = ∫ 𝐭. 𝐟(𝐭)𝐝𝐭∞
𝟎 Eqn. D- 12
When the time required to repair a failed item is very short compared to the MTTF, then MTTF also
represents mean time between failures (MTBF).
Substituting eqn. D-7 in D-12,
𝐌𝐓𝐓𝐅 = − ∫ 𝐭 𝐑′(𝐭)∞
𝟎 𝐝𝐭 Eqn. D- 13
By partial integration,
𝐌𝐓𝐓𝐅 = −[𝐭𝐑(𝐭)]𝟎∞ + ∫ 𝐑(𝐭)
∞
𝟎𝐝𝐭 Eqn. D- 14
It can be shown that [𝑡𝑅(𝑡)]0∞ = 0. Therefore,
𝐌𝐓𝐓𝐅 = ∫ 𝐑(𝐭)∞
𝟎𝐝𝐭 Eqn. D- 15
Using Exponential Distribution
Time to failure T of an item put into operation at time, t=0 has the probability density function
𝐟(𝐭) = {𝛌𝐞−𝛌𝐭 𝐟𝐨𝐫 𝐭 > 𝟎, 𝝀 > 𝟎𝟎 𝐨𝐭𝐡𝐞𝐫𝐰𝐢𝐬𝐞
Eqn. D- 16
42 Managing Operational Well Integrity – Prioritising Repairs to Minimise Risk
The Reliability function of the item is
𝐑(𝐭) = 𝐏𝐫(𝐓 > 𝒕) = ∫ 𝐟(𝐮)∞
𝐭𝐝𝐮 = 𝐞−𝛌𝐭 𝐟𝐨𝐫 𝐭 > 𝟎 Eqn. D- 17
The mean time to failure is
𝐌𝐓𝐓𝐅 = ∫ 𝐑(𝐭)∞
𝟎𝐝𝐭 = ∫ 𝐞−𝛌𝐭∞
𝟎𝐝𝐭 =
𝟏
𝛌 Eqn. D- 18
The failure rate function is
𝐳(𝐭) =𝐟(𝐭)
𝐑(𝐭)=
𝛌𝐞−𝛌𝐭
𝐞−𝛌𝐭= 𝛌 Eqn. D- 19
Availability, 𝑨(𝒕)
Availability, 𝐴(𝑡) at time t is the probability that an item is functioning in time t.
𝑨(𝒕) = 𝑷𝒓(𝑿(𝒕) = 𝟏) Eqn. D- 20
If an item is not repaired, then the availability is equal to the survivor function 𝑅(𝑡) expression.
𝑨(𝒕) = 𝑹(𝒕) = 𝒆−𝝀𝒕 Eqn. D- 21
The unavailability of an item is the probability that the item is not functioning in time t.
�̅�(𝒕) = 𝟏 − 𝑨(𝒕) = 𝑷𝒓(𝑿(𝒕) = 𝟎) Eqn. D- 22
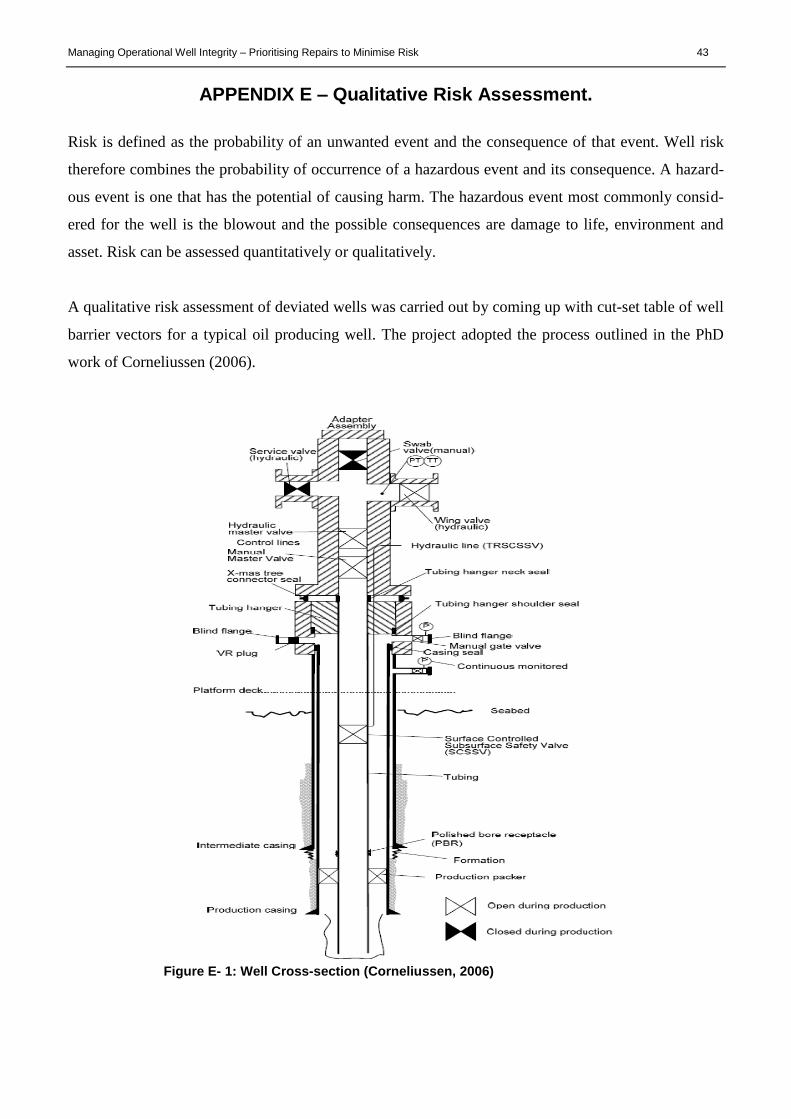
Managing Operational Well Integrity – Prioritising Repairs to Minimise Risk 43
APPENDIX E – Qualitative Risk Assessment.
Risk is defined as the probability of an unwanted event and the consequence of that event. Well risk
therefore combines the probability of occurrence of a hazardous event and its consequence. A hazard-
ous event is one that has the potential of causing harm. The hazardous event most commonly consid-
ered for the well is the blowout and the possible consequences are damage to life, environment and
asset. Risk can be assessed quantitatively or qualitatively.
A qualitative risk assessment of deviated wells was carried out by coming up with cut-set table of well
barrier vectors for a typical oil producing well. The project adopted the process outlined in the PhD
work of Corneliussen (2006).
Figure E- 1: Well Cross-section (Corneliussen, 2006)
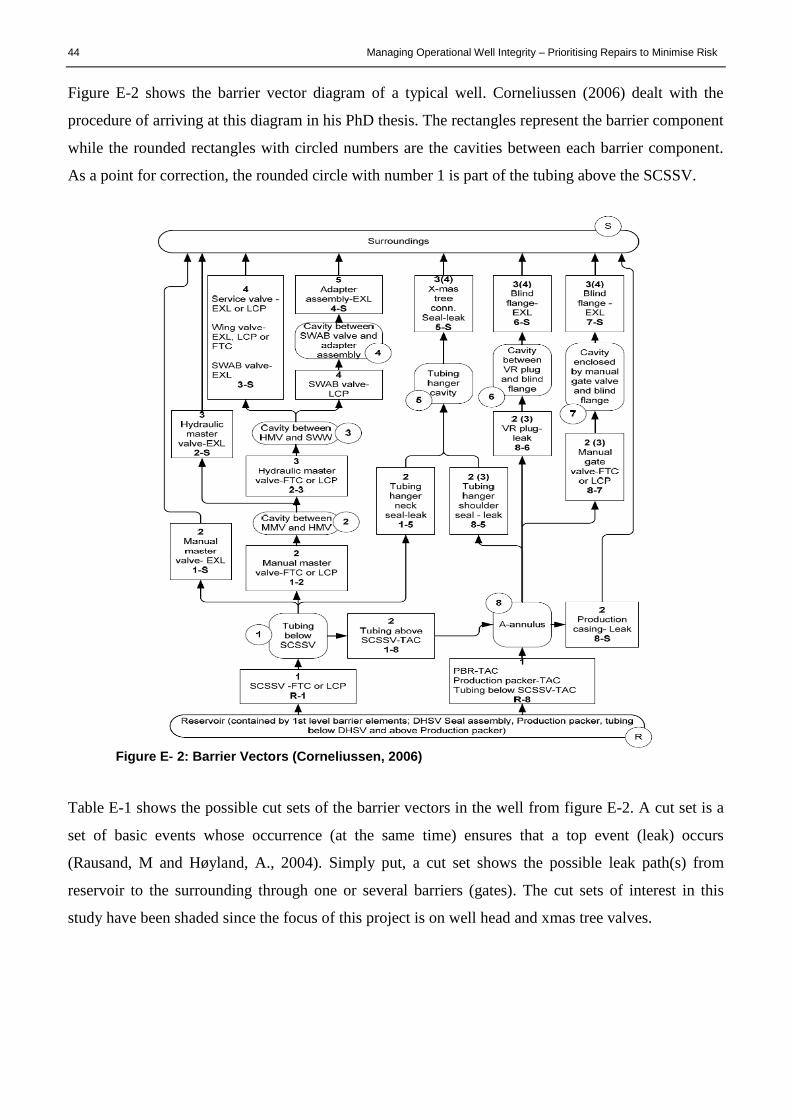
44 Managing Operational Well Integrity – Prioritising Repairs to Minimise Risk
Figure E-2 shows the barrier vector diagram of a typical well. Corneliussen (2006) dealt with the
procedure of arriving at this diagram in his PhD thesis. The rectangles represent the barrier component
while the rounded rectangles with circled numbers are the cavities between each barrier component.
As a point for correction, the rounded circle with number 1 is part of the tubing above the SCSSV.
Figure E- 2: Barrier Vectors (Corneliussen, 2006)
Table E-1 shows the possible cut sets of the barrier vectors in the well from figure E-2. A cut set is a
set of basic events whose occurrence (at the same time) ensures that a top event (leak) occurs
(Rausand, M and Høyland, A., 2004). Simply put, a cut set shows the possible leak path(s) from
reservoir to the surrounding through one or several barriers (gates). The cut sets of interest in this
study have been shaded since the focus of this project is on well head and xmas tree valves.
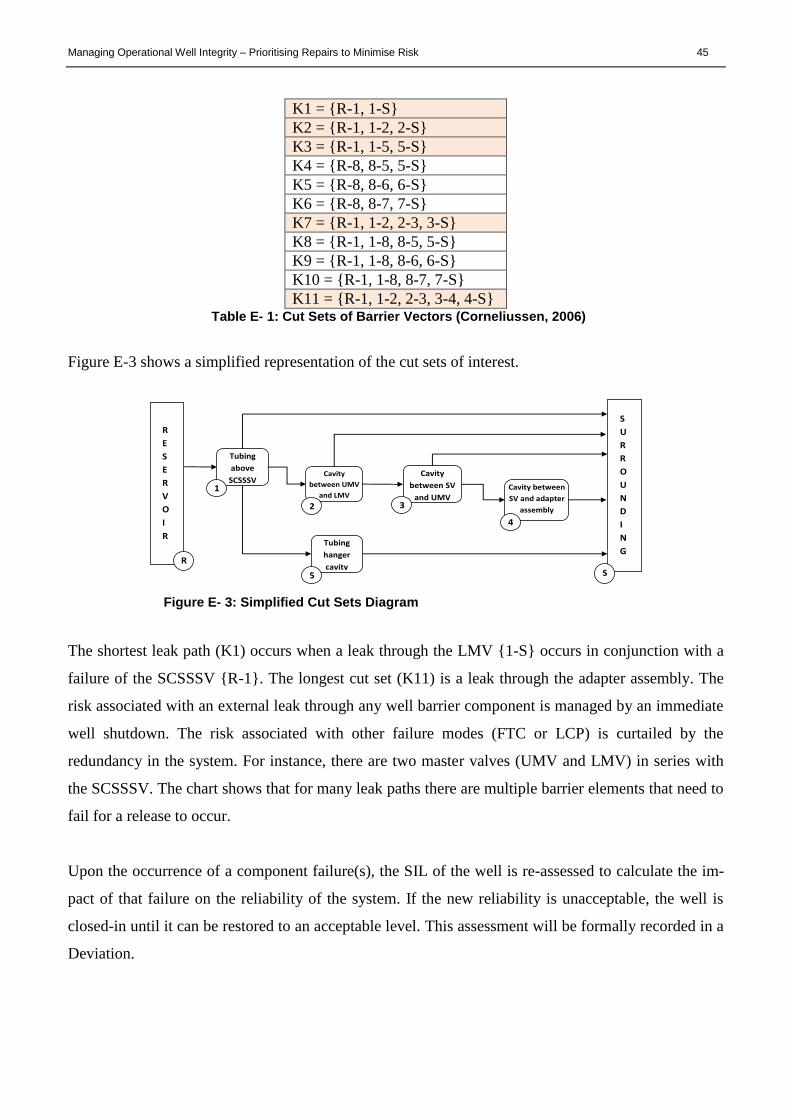
Managing Operational Well Integrity – Prioritising Repairs to Minimise Risk 45
K1 = {R-1, 1-S}
K2 = {R-1, 1-2, 2-S}
K3 = {R-1, 1-5, 5-S}
K4 = {R-8, 8-5, 5-S}
K5 = {R-8, 8-6, 6-S}
K6 = {R-8, 8-7, 7-S}
K7 = {R-1, 1-2, 2-3, 3-S}
K8 = {R-1, 1-8, 8-5, 5-S}
K9 = {R-1, 1-8, 8-6, 6-S}
K10 = {R-1, 1-8, 8-7, 7-S}
K11 = {R-1, 1-2, 2-3, 3-4, 4-S} Table E- 1: Cut Sets of Barrier Vectors (Corneliussen, 2006)
Figure E-3 shows a simplified representation of the cut sets of interest.
Figure E- 3: Simplified Cut Sets Diagram
The shortest leak path (K1) occurs when a leak through the LMV {1-S} occurs in conjunction with a
failure of the SCSSSV {R-1}. The longest cut set (K11) is a leak through the adapter assembly. The
risk associated with an external leak through any well barrier component is managed by an immediate
well shutdown. The risk associated with other failure modes (FTC or LCP) is curtailed by the
redundancy in the system. For instance, there are two master valves (UMV and LMV) in series with
the SCSSSV. The chart shows that for many leak paths there are multiple barrier elements that need to
fail for a release to occur.
Upon the occurrence of a component failure(s), the SIL of the well is re-assessed to calculate the im-
pact of that failure on the reliability of the system. If the new reliability is unacceptable, the well is
closed-in until it can be restored to an acceptable level. This assessment will be formally recorded in a
Deviation.
R
E
S
E
R
V
O
I
R
R
Tubing
above
SCSSSV 1
Cavity
between UMV
and LMV
2
Tubing
hanger
cavity 5
Cavity
between SV
and UMV 3
Cavity between
SV and adapter
assembly
4
S
U
R
R
O
U
N
D
I
N
G
S
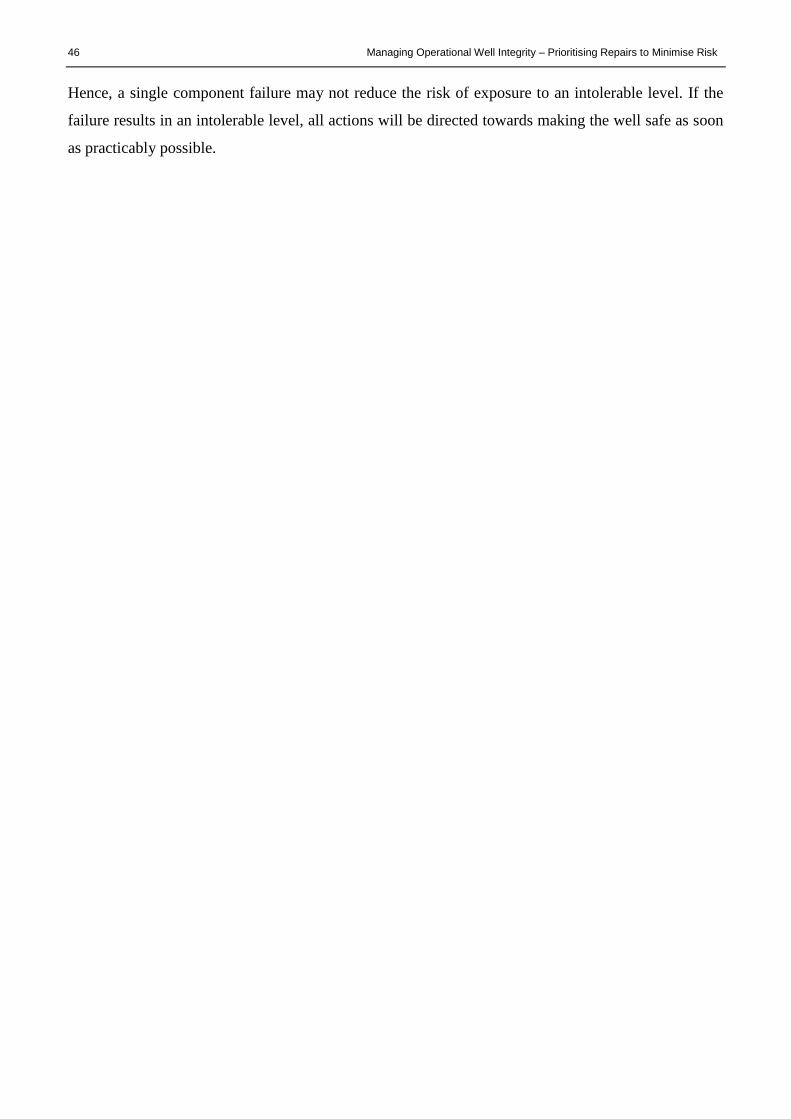
46 Managing Operational Well Integrity – Prioritising Repairs to Minimise Risk
Hence, a single component failure may not reduce the risk of exposure to an intolerable level. If the
failure results in an intolerable level, all actions will be directed towards making the well safe as soon
as practicably possible.