management’s discussion and analysis … financial statements and ... the company’s reliance on...
TRANSCRIPT

WESTERNONE INC.
Suite 910, 925 West Georgia Street • Vancouver • British Columbia • Canada • V6C 3L2 • Telephone (604) 678-4042 • Fax (604) 681-5969
MANAGEMENT’S DISCUSSION AND ANALYSIS
March 9, 2018

Page 2
MANAGEMENT’S DISCUSSION AND ANALYSIS
March 9, 2018
The following management’s discussion and analysis (“MD&A”) should be read in conjunction with the
consolidated financial statements and accompanying notes (“Financial Statements”) of WesternOne Inc.
and its direct and indirect subsidiaries (collectively known as “WesternOne” or the “Company” below,
unless the context otherwise requires) for the year ended December 31, 2017. Results have been prepared
in accordance with International Financial Reporting Standards (“IFRS”) and reported in Canadian
dollars unless otherwise indicated.
This MD&A contains forward-looking information. Please see “Forward-Looking Information” and “Risk
Factors” for a discussion of the risks, uncertainties and assumptions relating to such information. This
MD&A also makes reference to certain non-IFRS measures to assist in assessing the Company’s financial
performance. Non-IFRS measures do not have any standard meaning prescribed by IFRS and are therefore
unlikely to be comparable to similar measures presented by other issuers. See “Non-IFRS Measures”.
FORWARD-LOOKING INFORMATION
Certain statements in this MD&A may constitute ‘forward-looking’ information within the meaning of
applicable securities laws that involve known and unknown risks, uncertainties and other factors that may
cause actual results, performance or achievements or industry results, to be materially different from any
future results, performance, achievements or industry results expressed or implied by such forward-looking
information. Forward-looking information is identified by the use of terms and phrases such as “anticipate”,
“believe”, “could”, “estimate”, “expect”, “intend”, “may”, “plan”, “predict”, “project”, “will”, “would”,
and similar terms and phrases, including references to assumptions. Such information includes, but is not
limited to, statements with respect to strategies, expectations, planned operations, projections or other
characterizations of future events or circumstances, and the Company’s objectives, goals, strategies, beliefs,
intentions, plans, estimates, projections and outlook. Forward-looking information in this MD&A includes,
but is not limited to, statements with respect to: the Company’s reliance on its credit facilities for working
capital financing; the expectation of management that the Company’s liabilities will be discharged by
means of cash flow generated from operations, existing cash reserves and refinancing of debt instruments;
plans and expectations with respect to the NCIB (as defined herein); the impact of seasonality on the
Company’s operations; the Company’s growth strategy; the maturity date of the leasehold improvement
loan; the timing of principal and interest repayments required for outstanding loans; rental, finance lease,
operating lease and 2013 Debenture commitments; the intention of the Company to vigorously defend the
securities class action filed against the Company; the limitation of amounts drawn under the ABL Facility
(as defined herein) by a borrowing base calculation and the inclusion of certain eligible assets of the
Company in respect of the borrowing base; the security granted by the Company for the ABL Facility; the
interest rates on borrowing in respect of the ABL Facility; the increased financial flexibility from the ABL
Facility in managing the company’s working capital and future growth including capital expenditures and
acquisitions; the potential impact of critical accounting estimates on results of operations, financial
condition and cash flows from continuing operations; the maturity dates of the Company’s leased premises;
management’s expectation that: (i) rental activity levels will continue its moderate growth trend in Western
Canada; (ii) rental activity levels in BC’s construction and film and TV production sectors will remain
consistent with historical levels; (iii) rental rates, particularly relating to aerial rental equipment, will
continue to be impacted in Western Canada by ongoing supply-related and competitive pressure; and (iv)

Page 3
physical utilization of construction heating rental equipment for the remaining construction heat season in
early 2018 will remain consistent with the first half of the season in late 2017; and management’s intention
to continue to refine its marketing strategy to focus sales efforts to its target customers, evaluate returns on
fleet investments and redeploy and/or right-size the fleet as necessary, and monitor operational efficiency
through cost management.
Forward-looking information in this MD&A is based on certain key expectations and assumptions made
by the Company, including, without limitation: that net receivables are collectible and payments to suppliers
will continue under current terms; the stability of the economy in Western Canada; the impact of the current
economic climate in Western Canada on the Company’s operations will remain consistent with the
Company’s current expectations; the increased competitive environment in which the Company and its
business units operate; a protracted period of lower crude oil prices; rental rates will be subject to supply-
related and competitive pressure in 2018; the supply of and demand for the Company’s products and
services and the related impact on the pricing on such products and services will remain consistent with the
Company’s current expectations; management’s assessment of future plans and operations; the Company
will be able to purchase and cancel shares pursuant to the NCIB; the Company will have adequate cash to
conduct the NCIB as contemplated; purchases made under the NCIB will be advantageous to shareholders;
the Company will be able to grow through acquisitions and organic expansion; the Company will be able
to: (i) fund debt maturities and to meet current and future obligations; (ii) collect net receivables; (iii)
integrate newly acquired businesses; (iv) maintain payments to suppliers under current terms; and (v)
expand its product offering and customer base; critical accounting estimates; the Company will be able to
discharge its liabilities; the impact from the wind-down of the Britco Australia (as defined herein)
operations will remain consistent with the Company’s current expectations; no scheduled repayments will
be required under the ABL Facility prior to maturity; the impact on rental rates from supply-related and
competitive pressure will remain consistent with the Company’s current expectations; rental activity levels
are expected to continue its moderate growth trend; and the contractual requirements of the Company under
the ABL Facility are met. Although forward-looking information contained in this MD&A is based upon
what the Company’s management believes to be reasonable assumptions, the Company cannot assure
investors that actual results will be consistent with such information. Undue reliance should not be placed
on the forward-looking information since no assurance can be given that it will prove to be correct.
Forward-looking information in this MD&A reflects current expectations of management regarding future
events and operating performance as of the date of this MD&A. Such information involves significant risks
and uncertainties, should not be read as guarantees of future performance or results, and will not necessarily
be accurate indications of whether or not such results will be achieved. A number of factors could cause
actual results to differ materially from the results discussed in the forward-looking information, including,
but not limited to, the following factors: current economic conditions; industry conditions and cyclicality;
competition; dependence on significant customers; volatility of commodity industry conditions; failure to
access financing; credit facilities risk; financial health of the Company and cash flows; leverage and
restrictive covenants; adverse weather conditions; seasonality and fluctuations in results; reliance on key
personnel; workforce availability; employee relations; dependence on information systems and technology;
security breach or cyber-attack; dependence on existing sites; supply disruptions; resale of rental fleet;
inventory obsolescence; insurance coverage; foreign exchange; interest rate fluctuations; import product
restrictions and foreign trade risks; unpredictability and volatility of security prices; dilution of existing
shareholders; prior ranking indebtedness; discontinuation of tax incentives and change in provincial sales
tax structure; environmental regulation, health and safety matters and other government regulations;
regulatory risk; regulatory filing and licensing requirements; income taxes; legal proceedings; unknown
liabilities; winding down of the Britco Australia operations; expansion; failure to realize anticipated benefits
of acquisitions; competition for acquisition targets; limitations on future growth and cash flow; indemnities
under acquisition agreements; prevailing yields on similar securities; investment eligibility; borrowing base
fluctuations under the ABL Facility; dependence on a significant customer; and conflict of interest. Readers

Page 4
are cautioned that the foregoing list is not exhaustive. For additional information with respect to risks and
uncertainties, readers should carefully review and consider the risk factors described under the section “Risk
Factors” elsewhere in this MD&A.
The forward-looking information contained herein is expressly qualified in its entirety by this cautionary
statement. Forward-looking information reflects management’s current beliefs and is based on information
currently available to the Company. Such information reflects current assumptions regarding future events
and operating performance, and speaks only as of the date of this discussion. The forward-looking
information is made as of the date of this MD&A and the Company assumes no obligation to update or
revise such information to reflect new events or circumstances, except as may be required by applicable
law.
BASIS OF MANAGEMENT’S DISCUSSION AND ANALYSIS
On July 29, 2014, the Company announced the winding down of its Australian operations (“Britco
Australia”) through voluntary administration. In addition, on May 2, 2017, the Company completed the
sale of substantially all of the assets of its subsidiary Pacific Coast Modular Construction LP (formerly
Britco LP) (“Pacific Coast”) (the “Pacific Coast Sale”). The Company applied IFRS 5 – Non Current
Assets Held for Sale and Discontinued Operations and classified Britco Australia and Pacific Coast as
discontinued operations for the three and twelve months ended December 31, 2017 and the related
comparative prior periods. For the purposes of discussing the Company’s operating results in this MD&A,
management has presented the Company’s financial information based on the Company’s continuing
operations for WIS (as defined herein) and has excluded the Pacific Coast operations, unless otherwise
noted.
On October 31, 2016, the Company completed a consolidation of its issued and outstanding common shares
on the basis of one post-consolidation common share for every 35 pre-consolidation common shares (the
“Consolidation”). The Company’s common shares began trading on a post-consolidation basis on the
Toronto Stock Exchange (the “Exchange”) on November 3, 2016. All common share and per share
information in this MD&A give effect to the Consolidation on a retroactive basis, unless otherwise
indicated.
The term “Debentures” collectively refers to the Company’s series 2 extendible convertible unsecured
subordinated debentures (the “2011 Debentures”), which were redeemed on August 5, 2016, and the series
3 unsecured convertible subordinated debentures (the “2013 Debentures”).
OVERVIEW OF THE COMPANY
The Company is headquartered in Vancouver, British Columbia (“BC”), and seeks to acquire and grow
businesses in the construction and infrastructure services sectors in Western Canada. The Company was
incorporated on July 1, 2012 under the Canada Business Corporations Act (“CBCA”), and it is the
successor to WesternOne Equity Income Fund following the completion of a conversion from an income
trust structure to a corporation according to the previously announced plan of arrangement under Section
192 of the CBCA.
The Company’s principal business platform is WesternOne Infrastructure Services (“WIS”). WIS is a
leading provider of construction heat services and aerial equipment rentals to businesses in the construction,
infrastructure, film and television industries in Western Canada. WIS has 13 locations in BC, Alberta and
Manitoba.

Page 5
As at December 31, 2017, the Company had $100.1 million of assets and employed approximately 360
employees in Western Canada.
The Company’s common shares and 2013 Debentures trade on the Exchange under the respective symbols
WEQ and WEQ.DB.
RECENT EVENTS
Bank Credit Facilities
On November 21, 2017, the Company completed the closing of a three-year $35.0 million secured asset-
based revolving credit facility (the “ABL Facility”) with Canadian Imperial Bank of Commerce (the
“Bank”). In conjunction with the closing, the Company drew funds under the ABL Facility to fully repay
the outstanding balance of the previous $20.0 million demand facility with a Canadian chartered bank. The
ABL Facility will provide the Company with increased financial flexibility to manage working capital and
future growth including capital expenditures and acquisitions. For more information, see “Capital
Resources”.
Normal Course Issuer Bid
On December 12, 2017, the Company commenced a normal course issuer bid (the “NCIB”) whereby it
may purchase for cancellation during the twelve-month period ending December 11, 2018 up to the lesser
of: (i) 1,077,154 common shares of the Company, representing 10% of the Company’s “public float” (as
defined in the Exchange’s Company Manual) as of December 8, 2017; and (ii) common shares of the
Company having an aggregate purchase price of $1.8 million. As at the date of this MD&A, the Company
has purchased and cancelled 382,400 common shares at an average price of $1.50 per common share
pursuant to the NCIB.

Page 6
SUMMARY FINANCIAL REVIEW
Notes:
(1) See definition of adjusted EBITDA under “Non-IFRS Measures” below. (2) The comparative amount for 2017, 2016, and 2015 represent the year-end balances as at December 31 for each year presented.
FINANCIAL HIGHLIGHTS FOR 3-MONTH PERIOD ENDING DECEMBER 31, 2017
Total revenue increased 28.7% or $6.0 million mainly due to increased activity in the Alberta
construction sector, colder weather which led to increased demand for heaters, generators and
related fuel sales, and the Company’s competitive sales strategy.
OEC (as defined herein) on rent increased 15.0% and dollar utilization increased to 62.1% from
53.2% in the prior year period indicating higher rental activity levels and increased revenue on fleet
capital, for reasons discussed above.
Adjusted EBITDA increased 67.2% or $2.1 million and adjusted EBITDA margin improved from
14.9% in the prior year to 19.3% due to revenue growth and management’s focus on cost
containment.
OPERATING METRICS AND PERFORMANCE
The following table illustrates WIS’s key operating metrics for the three and twelve months ended
December 31, 2017 and 2016.
($000's except per share amounts) 2017 2016 2015 2017 2016 2015
Total revenue from continuing operations 26,691$ 20,733$ 20,463$ 79,610$ 68,926$ 83,039$
Net income (loss) from continuing operations
attributable to shareholders (1,155) (31,893) 29,312 (22,441) (62,665) 18,112
- Basic income (loss) per share (0.07) (1.87) 25.87 (1.32) (8.25) 16.03
- Diluted income (loss) per share (0.07) (1.87) 20.24 (1.32) (8.25) 15.93
Net loss from discontinued operations
attributable to shareholders (144) (10,586) (39,484) (1,803) (20,143) (37,647)
- Basic loss per share (0.01) (0.62) (34.85) (0.11) (2.65) (33.31)
- Diluted loss per share (0.01) (0.62) (25.82) (0.11) (2.65) (26.87)
Total net loss attributable to shareholders (1,299) (42,479) (10,172) (24,244) (82,808) (19,535)
- Basic loss per share (0.08) (2.50) (8.98) (1.43) (10.90) (17.28)
- Diluted loss per share (0.08) (2.50) (5.58) (1.43) (10.90) (10.94)
Adjusted EBITDA (1)
5,150 3,080 4,547 7,771 7,983 18,221
Total assets (2)
100,078 148,037 213,632 100,078 148,037 213,632
Long term liabilities (2)
69,197 69,398 99,895 69,197 69,398 99,895
December 31 December 31
Three months ended Twelve months ended

Page 7
Notes:
(1) Represents the average original equipment costs (“OEC”) of fleet that were on rent for the period.
(2) Rental fleet dollar utilization for the period is calculated as annualized rental and related services revenue divided by the average total OEC fleet value for the period.
Discussion for the three months ended December 31, 2017
The company uses OEC on rent as a measure of rental activity levels. OEC on rent of heat equipment
increased from the prior year period primarily due to more heaters and generators on rent from increased
construction activity and a comparatively colder winter season in Alberta. OEC on rent of aerial equipment
also increased from the prior year period due to overall growth in rental demand, WIS’s increased sales
efforts, and more effective fleet redeployment within existing branches.
Dollar utilization increased from the prior year period mainly due to an increase in rental volumes and other
related service revenues. Average total fleet base for the period increased due to replacing aging and
underutilized equipment and meeting incremental demand in specific sectors. WIS continues to approach
the markets with competitive pricing and a focus on customer service to maintain existing market share and
generate sales from newly targeted sectors.
Fuel sales volume increased by 25.9% from the prior year period as a result of more heaters and generators
on rent as discussed above which increased related fuel sales. The higher rental activity levels in the current
period also prompted a 5.9% increase in total headcount as compared to the prior year period to service the
additional demand.
Discussion for the twelve months ended December 31, 2017
OEC on rent of heat equipment increased from the prior year period due to increased construction activity
and comparatively colder temperatures in Alberta, prompting higher heat-related rentals and fuel sales.
OEC on rent of aerial equipment increased from the prior year period due to overall growth in rental
demand, increased sales efforts and more effective fleet redeployment within existing branches.
Dollar utilization increased as a result of increased rental volumes due to the factors discussed above.
Fuel sales volume increased by 30.6% from the prior year period as the comparatively colder weather in
Alberta gave rise to higher demand for heater rentals and related fuel, and increased construction activity
gave rise to higher demand for generators on rent and related fuel.
OPERATING METRICS AND PERFORMANCE
2017 2016 2017 2016 $ % $ %
OEC on rent(1)
(000s)
Heat 21,320 17,192 16,290 13,008 4,128 24.0% 3,282 25.2%
Aerial 37,218 33,722 35,540 34,224 3,496 10.4% 1,316 3.8%
Total 58,538 50,914 51,830 47,232 7,624 15.0% 4,598 9.7%
Dollar utilization of rental fleet(2)
62.1% 53.2% 49.5% 48.2%
Fuel volume sales (000's of Litres) 12,524 9,951 31,725 24,301 2,573 25.9% 7,424 30.6%
Total headcount (people) 360 340 360 340 20 5.9% 20 5.9%
Three months ended
Increase/(Decrease) Increase/(Decrease)
Twelve months ended Three months ended Twelve months ended
December 31 December 31December 31 December 31
Page 8
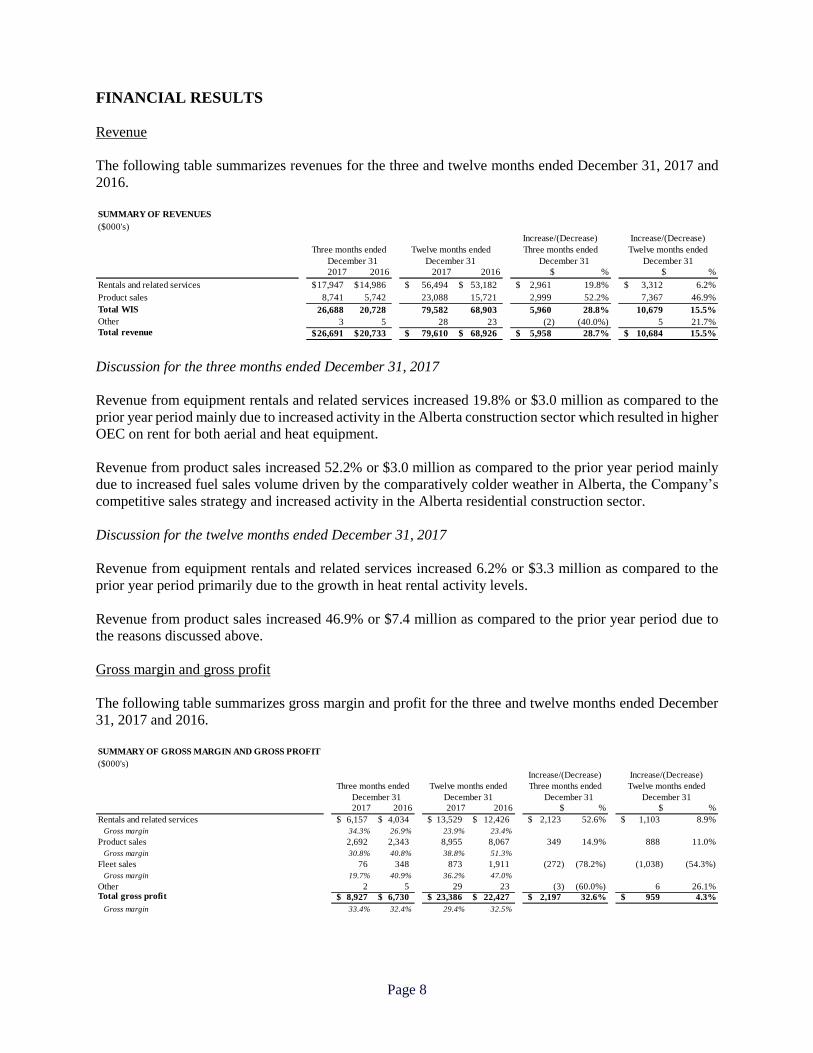
FINANCIAL RESULTS
Revenue
The following table summarizes revenues for the three and twelve months ended December 31, 2017 and
2016.
Discussion for the three months ended December 31, 2017
Revenue from equipment rentals and related services increased 19.8% or $3.0 million as compared to the
prior year period mainly due to increased activity in the Alberta construction sector which resulted in higher
OEC on rent for both aerial and heat equipment.
Revenue from product sales increased 52.2% or $3.0 million as compared to the prior year period mainly
due to increased fuel sales volume driven by the comparatively colder weather in Alberta, the Company’s
competitive sales strategy and increased activity in the Alberta residential construction sector.
Discussion for the twelve months ended December 31, 2017
Revenue from equipment rentals and related services increased 6.2% or $3.3 million as compared to the
prior year period primarily due to the growth in heat rental activity levels.
Revenue from product sales increased 46.9% or $7.4 million as compared to the prior year period due to
the reasons discussed above.
Gross margin and gross profit
The following table summarizes gross margin and profit for the three and twelve months ended December
31, 2017 and 2016.
SUMMARY OF REVENUES
($000's)
2017 2016 2017 2016 $ % $ %
Rentals and related services 17,947$ 14,986$ 56,494$ 53,182$ 2,961$ 19.8% 3,312$ 6.2%
Product sales 8,741 5,742 23,088 15,721 2,999 52.2% 7,367 46.9%
Total WIS 26,688 20,728 79,582 68,903 5,960 28.8% 10,679 15.5%
Other 3 5 28 23 (2) (40.0%) 5 21.7%Total revenue 26,691$ 20,733$ 79,610$ 68,926$ 5,958$ 28.7% 10,684$ 15.5%
December 31 December 31December 31 December 31
Increase/(Decrease) Increase/(Decrease)
Three months ended Twelve months ended Three months ended Twelve months ended
2017 2016 2017 2016 $ % $ %
Rentals and related services 6,157$ 4,034$ 13,529$ 12,426$ 2,123$ 52.6% 1,103$ 8.9%
Gross margin 34.3% 26.9% 23.9% 23.4%
Product sales 2,692 2,343 8,955 8,067 349 14.9% 888 11.0%
Gross margin 30.8% 40.8% 38.8% 51.3%
Fleet sales 76 348 873 1,911 (272) (78.2%) (1,038) (54.3%)
Gross margin 19.7% 40.9% 36.2% 47.0%
Other 2 5 29 23 (3) (60.0%) 6 26.1%Total gross profit 8,927$ 6,730$ 23,386$ 22,427$ 2,197$ 32.6% 959$ 4.3%
Gross margin 33.4% 32.4% 29.4% 32.5%
SUMMARY OF GROSS MARGIN AND GROSS PROFIT
Increase/(Decrease) Increase/(Decrease)
($000's)
December 31 December 31
Three months ended Twelve months ended Three months ended
December 31 December 31
Twelve months ended

Page 9
Discussion for the three months ended December 31, 2017
Gross margin and gross profit relating to equipment rentals and related services were 34.3% and $6.2
million, respectively, compared to 26.9% and $4.0 million for the prior year period. The increases in gross
profit and gross margin were primarily due to higher rental volumes along with cost containment measures
implemented by management.
Gross margin and gross profit relating to product sales were 30.8% and $2.7 million, respectively, compared
to 40.8% and $2.3 million for the prior year period. Gross margin and gross profit under this category
mostly relate to sales of new equipment, fuel, retail merchandise and parts. Despite an increase in fuel sales
volume and price per litre which generated increased gross profit, fuel-related margins were compressed
due to higher commodity input costs and competition. Higher gross margins were realized on the sale of
new equipment, retail merchandise and parts due to product mix compared to the prior year period.
Gross margin and gross profit relating to rental fleet sales were 19.7% or $0.1 million compared to 40.9%
and $0.3 million for the period year period. Margins under this category tend to fluctuate from time to time
depending on the type and age of fleet equipment sold and customers’ specific product needs.
Discussion for the twelve months ended December 31, 2017
Gross margin and gross profit relating to equipment rentals and related services were 23.9% and $13.5
million, respectively, compared to 23.4% and $12.4 million for the prior year period. The growth was
primarily due to a general increase in rental activity levels during the year, although partially offset by rate
compression due to competition.
Gross margin and gross profit relating to product sales were 38.8% and $9.0 million, respectively, compared
to 51.3% and $8.1 million for the prior year period. Despite an increase in fuel sales volume and price per
litre which generated increased gross profit, fuel-related margins were compressed due to higher
commodity input costs and competition.
Gross margin and gross profit relating to rental fleet sales were 36.2% and $0.9 million, respectively,
compared to 47.0% and $1.9 million for the prior year period due to reasons as mentioned in the three-
month discussion above.
General and administration expenses
The following table summarizes the general and administration expenses for the three and twelve months
ended December 31, 2017 and 2016.
($000's)
2017 2016 2017 2016 $ % $ %
Operating expenses
WIS 6,209$ 6,255$ 24,435$ 22,591$ (46)$ (0.7%) 1,844$ 8.2%
Corporate 697 802 3,228 4,098 (105) (13.1%) (870) (21.2%)
Total operating expenses 6,906 7,057 27,663 26,689 (151) (2.1%) 974 3.6%
Depreciation and amortization of operating and
intangible assets 1,133 1,272 4,165 5,696 (139) (10.9%) (1,531) (26.9%)
Total general and administration expenses 8,039$ 8,329$ 31,828$ 32,385$ (290)$ (3.5%) (557)$ (1.7%)
December 31 December 31December 31 December 31
SUMMARY OF GENERAL AND ADMINISTRATION EXPENSES
Increase/(Decrease) Increase/(Decrease)
Three months ended Twelve months ended Three months ended Twelve months ended

Page 10
Discussion for the three months ended December 31, 2017
WIS’s operating expenses were $6.2 million (23.3% of WIS’s total revenue), compared with $6.3 million
(30.2% of WIS’s total revenue) in the prior year period. While relatively consistent in dollar amounts, the
decrease as a percentage of revenue reflects management’s focus on cost efficiency while managing the
growth in rental activity levels.
Corporate operating expenses were $0.7 million (2.6% of the Company’s total revenue), compared with
$0.8 million (3.9% of the Company’s total revenue) in the prior year period. The decrease was primarily
due to lower payroll expenses.
The Company’s depreciation and amortization of operating and intangible assets decreased by 10.9% or
$0.1 million, as compared to the prior year period due mainly to decreased amortization expenses relating
to lower intangible assets.
Discussion for the twelve months ended December 31, 2017
WIS’s operating expenses were $24.4 million (30.7% of WIS’s total revenue), compared with $22.6
million (32.8% of WIS’s total revenue) in the prior year period. Despite the improved cost efficiency as a
percentage of revenue, the dollar increase in operating expenses was primarily due to increased business
activity levels.
Corporate operating expenses were $3.2 million (4.1% of the Company’s total revenue), compared with
$4.1 million (5.9% of the Company’s total revenue) in the prior year period. The decrease was primarily
due to lower payroll expense and professional fees.
The Company’s depreciation and amortization of operating and intangible assets decreased by 26.9% or
$1.5 million, as compared to the prior year period. The decrease was mainly due to reasons as mentioned
in the three-month discussion above.
Adjusted EBITDA
The following table summarizes adjusted EBITDA (see “Non-IFRS Measures”) for the three and twelve
months ended December 31, 2017 and 2016.
Changes in the Company’s adjusted EBITDA for the three and twelve months ended December 31, 2017,
compared to the respective prior year periods, are due to factors explained above.
Finance costs
Finance costs were $2.0 million for the three months ended December 31, 2017 compared to $1.3 million
in the prior year period. Excluding non-cash items relating to the revaluation of the liability component of
the Debentures resulting in a loss of $0.8 million (2016 - gain of $0.2 million), the interest rate swap and
amortization of financing-related transaction costs in accordance with IFRS, finance costs were $1.1
SUMMARY OF ADJUSTED EBITDA
($000's)
2017 2016 2017 2016 $ % $ %
WIS 5,824$ 3,880$ 10,791$ 11,852$ 1,944$ 50.1% (1,061)$ (9.0%)
Corporate (674) (800) (3,020) (3,869) 126 15.8% 849 21.9%
Total adjusted EBITDA 5,150$ 3,080$ 7,771$ 7,983$ 2,070$ 67.2% (212)$ (2.7%)
December 31 December 31
Increase/(Decrease) Increase/(Decrease)
Three months ended Twelve months ended Three months ended Twelve months ended
December 31 December 31

Page 11
million for the three months ended December 31, 2017, compared to $1.5 million in the prior year period.
The decrease was primarily due to lower interest costs as a result of lower bank indebtedness and interest
rates.
Finance costs were $14.0 million for the twelve months ended December 31, 2017 compared to $34.2
million in the prior year period. Excluding non-cash items relating to the revaluation of the liability
component of the Debentures resulting in a loss of $8.8 million (2016 - $24.9 million), the interest rate
swap and amortization of financing-related transaction costs in accordance with IFRS, finance costs were
$4.7 million for the twelve months ended December 31, 2017, compared to $9.2 million in the prior year
period. The decrease was primarily due to lower interest costs as a result of the redemption of the 2011
Debentures in August 2016 and lower bank indebtedness.
Net loss from continuing operations attributable to shareholders
Net loss from continuing operations attributable to shareholders was $1.2 million ($0.07 per share) for the
three months ended December 31, 2017, compared to $31.9 million ($1.87 per share) for the prior year
period. The change was due to the factors discussed above.
Net loss from continuing operations attributable to shareholders was $22.4 million ($1.32 per share) for the
twelve months ended December 31, 2017, compared to $62.7 million ($8.25 per share) for the prior year
period. The change was due to the factors discussed above.
Net loss from discontinued operations attributable to shareholders
Net loss from discontinued operations attributable to shareholders was $0.1 million ($0.01 per share) for
the three months ended December 31, 2017, compared to $10.6 million ($0.62 per share) for the prior year
period.
Net loss from discontinued operations attributable to shareholders was $1.8 million ($0.11 per share) for
the twelve months ended December 31, 2017, compared to $20.1 million ($2.65 per share) for the prior
year period.
Total assets
Total assets were $100.1 million as at December 31, 2017, compared with $148.0 million as at December
31, 2016. The decrease was mainly due to the elimination of assets held for sale following the completion
of the Pacific Coast Sale. The related proceeds were in part used to reduce bank indebtedness.
Long-term liabilities
Long-term liabilities were $69.2 million as at December 31, 2017, compared with $69.4 million as at
December 31, 2016. The decrease was mainly due to a $10.3 million repayment of bank loans which was
partially offset by revaluation of the liability component of the 2013 Debentures in accordance with IFRS
and changes in other long-term liabilities.
Deferred income tax
Deferred income taxes are recorded on the temporary differences arising between the accounting and tax
bases of assets and liabilities on the statement of financial position.
Page 12
As at December 31, 2017, in accordance with IFRS, the Company concluded that it was not probable that
sufficient taxable profits would be available against which deductible temporary differences could be
utilized; therefore, the Company did not recognize any deferred income tax assets.
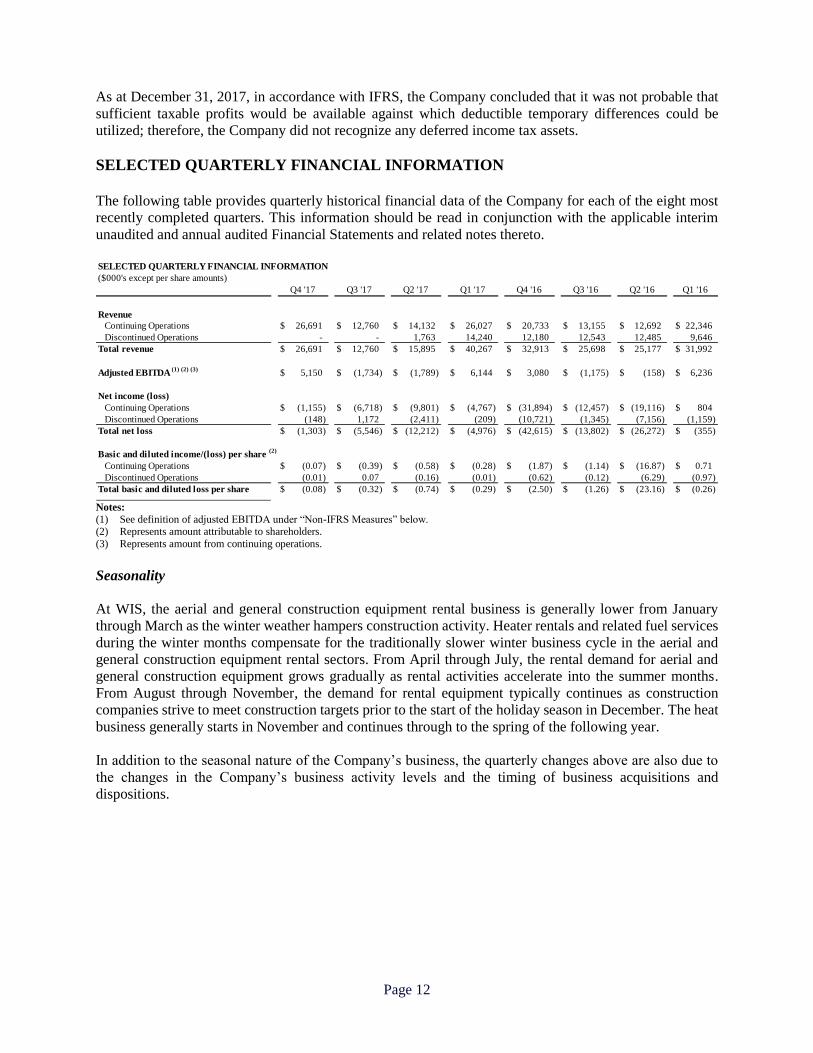
SELECTED QUARTERLY FINANCIAL INFORMATION
The following table provides quarterly historical financial data of the Company for each of the eight most
recently completed quarters. This information should be read in conjunction with the applicable interim
unaudited and annual audited Financial Statements and related notes thereto.
Notes:
(1) See definition of adjusted EBITDA under “Non-IFRS Measures” below. (2) Represents amount attributable to shareholders.
(3) Represents amount from continuing operations.
Seasonality
At WIS, the aerial and general construction equipment rental business is generally lower from January
through March as the winter weather hampers construction activity. Heater rentals and related fuel services
during the winter months compensate for the traditionally slower winter business cycle in the aerial and
general construction equipment rental sectors. From April through July, the rental demand for aerial and
general construction equipment grows gradually as rental activities accelerate into the summer months.
From August through November, the demand for rental equipment typically continues as construction
companies strive to meet construction targets prior to the start of the holiday season in December. The heat
business generally starts in November and continues through to the spring of the following year.
In addition to the seasonal nature of the Company’s business, the quarterly changes above are also due to
the changes in the Company’s business activity levels and the timing of business acquisitions and
dispositions.
SELECTED QUARTERLY FINANCIAL INFORMATION
($000's except per share amounts)
Q4 '17 Q3 '17 Q2 '17 Q1 '17 Q4 '16 Q3 '16 Q2 '16 Q1 '16
Revenue
Continuing Operations 26,691$ 12,760$ 14,132$ 26,027$ 20,733$ 13,155$ 12,692$ 22,346$
Discontinued Operations - - 1,763 14,240 12,180 12,543 12,485 9,646
Total revenue 26,691$ 12,760$ 15,895$ 40,267$ 32,913$ 25,698$ 25,177$ 31,992$
Adjusted EBITDA (1) (2) (3)
5,150$ (1,734)$ (1,789)$ 6,144$ 3,080$ (1,175)$ (158)$ 6,236$
Net income (loss)
Continuing Operations (1,155)$ (6,718)$ (9,801)$ (4,767)$ (31,894)$ (12,457)$ (19,116)$ 804$
Discontinued Operations (148) 1,172 (2,411) (209) (10,721) (1,345) (7,156) (1,159)
Total net loss (1,303)$ (5,546)$ (12,212)$ (4,976)$ (42,615)$ (13,802)$ (26,272)$ (355)$
Basic and diluted income/(loss) per share (2)
Continuing Operations (0.07)$ (0.39)$ (0.58)$ (0.28)$ (1.87)$ (1.14)$ (16.87)$ 0.71$
Discontinued Operations (0.01) 0.07 (0.16) (0.01) (0.62) (0.12) (6.29) (0.97)
Total basic and diluted loss per share (0.08)$ (0.32)$ (0.74)$ (0.29)$ (2.50)$ (1.26)$ (23.16)$ (0.26)$

Page 13
CASH FLOWS AND LIQUIDITY
The following table provides an overview of the Company’s cash flows for the three and twelve months
ended December 31, 2017 and 2016.
As discussed above, the revenue and operating results of the Company have historically displayed seasonal
variations throughout a year. While certain of the Company’s variable costs can be managed to match
seasonal patterns, a significant portion of its costs are fixed and cannot be adjusted for seasonality. The
fluctuation in future results of operations may require the Company to rely on its credit facilities for working
capital financing at certain times of the year.
The Company recorded a cash outflow of $3.1 million from operating activities for the three months ended
December 31, 2017, compared with a cash outflow of $3.4 million for the same period in the prior year.
The increase in cash flow generation from operating activities was due to higher earnings offset by changes
in working capital.
As at December 31, 2017, the Company had available the $35.0 million ABL Facility with the Bank, subject
to limitations of a borrowing base calculation which includes certain eligible assets of the Company. As at
December 31, 2017, the Company had $8.7 million of cash and cash equivalents on hand.
Working capital management continues to be an important element of cash generation for the Company.
As at December 31, 2017, management expected that net receivables were collectible, payments to suppliers
would continue under current terms, and the bank guarantees would follow the terms in the ABL Facility.
During the three months ended December 31, 2017, the Company purchased rental equipment and other
operating assets for $6.5 million and received proceeds of $0.4 million from the sale of equipment. Net of
advances, the Company repaid $9.5 million under the previous $20.0 million demand facility with a
Canadian chartered bank in connection with the completion of the ABL Facility financing. The Company
also paid $1.1 million of interest (net of interest income received) primarily for bank loans and 2013
Debentures.
Liquidity Risks
Liquidity risk is the risk that the Company will not be able to meet its obligations as they fall due.
The Company manages its liquidity risk through cash and debt management. As at December 31, 2017, the
Company had available unused ABL Facility of $13.7 million. The Company also had accounts receivable
of $21.0 million and cash and cash equivalents totaling $8.7 million. Management expects to discharge the
SUMMARY OF CASH FLOWS
($000's)
2017 2016 2017 2016
Net change of cash related to:
Operations
Cash generated from operating earnings 3,032$ 2,293$ 6,528$ 5,732$
Changes in working capital (6,112) (5,719) 160 (187)
Investing (6,111) (3,256) 36,871 (8,280)
Financing 7,946 (536) (32,823) (14,775)
Net change in cash during the period from continuing operations (1,245)$ (7,218)$ 10,736$ (17,510)$
Three months ended Twelve months ended
December 31December 31

Page 14
Company’s liabilities by means of cash flow generated from operations, existing cash reserves, and
refinancing of debt instruments.
A centralized treasury function ensures that the Company maintains funding flexibility by assessing future
cash flow expectations. Cash flow estimates are based on rolling forecasts of operating, investing and
financing cash flows. Such forecasting also takes into account borrowing limits, cash restrictions and
compliance with bank covenants.
CAPITAL RESOURCES
Bank Credit Facilities
On November 21, 2017, the Company completed the closing of a three-year $35.0 million secured ABL
Facility with the Bank. In conjunction with the closing, the Company drew funds under the ABL Facility
to fully repay the outstanding balance of the previous $20.0 demand facility with a Canadian chartered
bank.
Drawn amounts under the ABL Facility are limited by a borrowing base calculation which includes certain
eligible assets of the Company. The ABL Facility is supported by security in favour of the Bank over all of
the assets of the Company and its material subsidiaries. Interest rates on borrowings are, at the Company’s
option, based on banker’s acceptances, London Interbank Offered Rate, or the Bank’s Canadian prime rate
or US base rate, plus in each case an applicable margin.
The ABL Facility does not have scheduled repayments until its maturity.
The ABL Facility contains restrictive covenants, including restrictions on the incurrence of indebtedness,
financial maintenance covenants and restrictions on payments to affiliates, debenture holders and
shareholders, as well as events of default and representations and warranties.
As at December 31, 2017, the Company was in compliance with all bank covenants associated with the
ABL Facility.
Equipment Financing Loan
The Company has a non-revolving equipment financing loan which bears interest at a banker’s acceptance
rate plus 3.7% and is secured by the related equipment. The loan will mature on July 24, 2020.
Leasehold Improvement Loan
On January 12, 2017, the Company obtained a leasehold improvement loan of $1.4 million which bears
interest at 6.0%. The leasehold improvement loan was for the branch location in Burnaby, BC. The loan
will mature on January 31, 2022.
NON-IFRS MEASURES
References in this MD&A to “adjusted EBITDA” are to net income or loss from continuing operations
before interest, taxes, depreciation and amortization, and other specified items that would impact
comparability including, where applicable, non-operational income and expenses, securities-based
compensation and other gains or losses. The use of the term “non-operational income and expenses” is
defined by the Company as those that do not impact operating decisions taken by the Company’s
management as well as items of an unusual nature that do not reflect the Company’s ongoing operations.

Page 15
In addition to results reported in accordance with IFRS, the Company uses adjusted EBITDA as a
supplemental indicator of its financial and operating performance. Adjusted EBITDA is not an earnings
measure recognized by IFRS, does not have standardized meanings prescribed by IFRS and is therefore
unlikely to be comparable to similar measures presented by other issuers. The Company’s management
believes that adjusted EBITDA is an important supplemental financial measure in evaluating the
Company’s performance and discloses adjusted EBITDA to capture the profitability of its business before
the impact of items not considered in management’s evaluation of operating performance.
The following table reconciles the Company’s net loss and adjusted EBITDA for the three and twelve
months ended December 31, 2017 and 2016.
OFF-BALANCE SHEET FINANCING
The Company has no off-balance sheet arrangements, except for the operating leases relating to the
Company’s various operating assets. The operating lease arrangements represent a normal course of the
Company’s businesses.
CONTRACTUAL OBLIGATIONS
As at December 31, 2017, the minimum principal repayments required for the then outstanding loans are
as follows:
The Company expects to discharge the loan obligations with cash flow generated from operations, existing
cash reserves and refinancing of debt instruments. The above table represents the principal repayment
schedule in respect of the ABL Facility and other loans.
RECONCILIATION OF NET LOSS FROM CONTINUING OPERATIONS AND ADJUSTED EBITDA
2017 2016 2017 2016
Net loss from continuing operations (1,155)$ (31,893)$ (22,441)$ (62,665)$
Finance costs 2,044 1,321 13,993 34,241
Depreciation and amortization 4,035 4,231 15,920 17,386
Income tax expense (recovery) - 10,457 6 (50)
Share based compensation expense (recovery) 1 22 (9) 239
Severance - 302 370 302
Impairment of tangible and intangible assets - 18,516 - 18,516
Others 225 124 (68) 14
Adjusted EBITDA 5,150$ 3,080$ 7,771$ 7,983$
($000's)
Three months ended Twelve months ended
December 31December 31
(000's)
2018 2019 2020 2021 2022 Thereafter
Bank loans $ - $ - $ 19,918 $ - $ - $ -
Other loans 1,072 1,127 804 317 28 -
$ 1,072 $ 1,127 $ 20,722 $ 317 $ 28 $ -
LOANS PAYABLE
Page 16
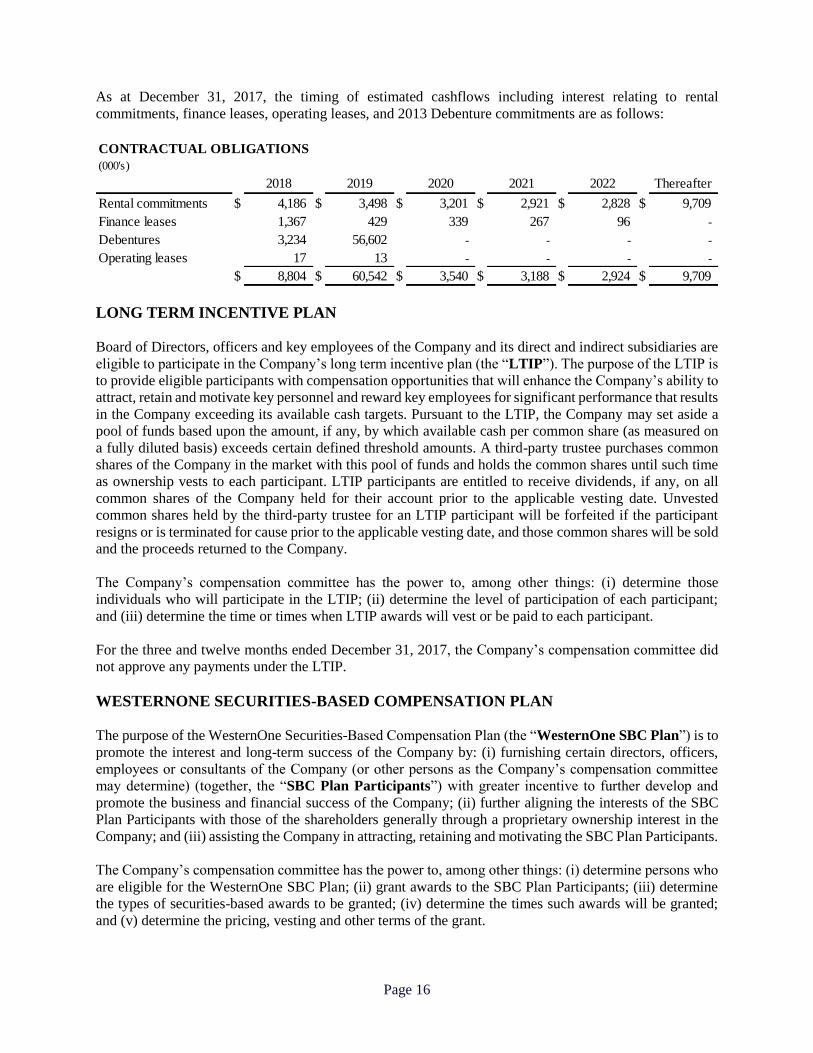
As at December 31, 2017, the timing of estimated cashflows including interest relating to rental
commitments, finance leases, operating leases, and 2013 Debenture commitments are as follows:
LONG TERM INCENTIVE PLAN
Board of Directors, officers and key employees of the Company and its direct and indirect subsidiaries are
eligible to participate in the Company’s long term incentive plan (the “LTIP”). The purpose of the LTIP is
to provide eligible participants with compensation opportunities that will enhance the Company’s ability to
attract, retain and motivate key personnel and reward key employees for significant performance that results
in the Company exceeding its available cash targets. Pursuant to the LTIP, the Company may set aside a
pool of funds based upon the amount, if any, by which available cash per common share (as measured on
a fully diluted basis) exceeds certain defined threshold amounts. A third-party trustee purchases common
shares of the Company in the market with this pool of funds and holds the common shares until such time
as ownership vests to each participant. LTIP participants are entitled to receive dividends, if any, on all
common shares of the Company held for their account prior to the applicable vesting date. Unvested
common shares held by the third-party trustee for an LTIP participant will be forfeited if the participant
resigns or is terminated for cause prior to the applicable vesting date, and those common shares will be sold
and the proceeds returned to the Company.
The Company’s compensation committee has the power to, among other things: (i) determine those
individuals who will participate in the LTIP; (ii) determine the level of participation of each participant;
and (iii) determine the time or times when LTIP awards will vest or be paid to each participant.
For the three and twelve months ended December 31, 2017, the Company’s compensation committee did
not approve any payments under the LTIP.
WESTERNONE SECURITIES-BASED COMPENSATION PLAN
The purpose of the WesternOne Securities-Based Compensation Plan (the “WesternOne SBC Plan”) is to
promote the interest and long-term success of the Company by: (i) furnishing certain directors, officers,
employees or consultants of the Company (or other persons as the Company’s compensation committee
may determine) (together, the “SBC Plan Participants”) with greater incentive to further develop and
promote the business and financial success of the Company; (ii) further aligning the interests of the SBC
Plan Participants with those of the shareholders generally through a proprietary ownership interest in the
Company; and (iii) assisting the Company in attracting, retaining and motivating the SBC Plan Participants.
The Company’s compensation committee has the power to, among other things: (i) determine persons who
are eligible for the WesternOne SBC Plan; (ii) grant awards to the SBC Plan Participants; (iii) determine
the types of securities-based awards to be granted; (iv) determine the times such awards will be granted;
and (v) determine the pricing, vesting and other terms of the grant.
(000's)
2018 2019 2020 2021 2022 Thereafter
Rental commitments $ 4,186 $ 3,498 $ 3,201 $ 2,921 $ 2,828 $ 9,709
Finance leases 1,367 429 339 267 96 -
Debentures 3,234 56,602 - - - -
Operating leases 17 13 - - - -
$ 8,804 $ 60,542 $ 3,540 $ 3,188 $ 2,924 $ 9,709
CONTRACTUAL OBLIGATIONS

Page 17
The number of securities that may be allotted and issued under the WesternOne SBC Plan is determined by
the compensation committee, provided that the maximum number of securities to be reserved for issuance
from treasury under the WesternOne SBC Plan does not exceed 10% of the issued and outstanding common
shares of the Company on a “rolling” basis, net of the 14,285 common shares that may be issued under the
EPP, as described in further detail below.
As at the date of this MD&A, the Company had 34,334 options, 66,994 equity-settled restricted stock units
and 1,268,431 cash-settled restricted stock units outstanding.
On June 19, 2017, the Company’s compensation committee granted 85,612 equity-settled restricted stock
units to the directors of the Company under the WesternOne SBC Plan for their services provided in 2017.
These equity-settled restricted stock units will vest upon the earlier of: (i) June 19, 2020; (ii) the director
ceasing to be a director of the Company; and (iii) a Change in Control (as defined in the WesternOne SBC
Plan).
On January 1, 2018, the Company’s compensation committee granted 107,664 equity-settled restricted
stock units to the directors of the Company under the WesternOne SBC Plan for their services to be provided
in 2018. These equity-settled restricted stock units vest in four tranches throughout 2018, with the last
tranche vesting on October 1, 2018 (the “Initial Vesting Conditions”). Upon completion of the Initial
Vesting Conditions, the vested equity-settled restricted stock units will entitle the holder to receive common
shares of the Company upon the earlier of: (i) January 1, 2021; (ii) the director ceasing to be a director of
the Company; and (iii) a Change in Control.
EMPLOYEE PURCHASE PLAN
The purpose of the Employee Purchase Plan (“EPP”) is to promote the interests of the Company and its
shareholders by enabling the Company to attract and retain highly talented employees who are in a position
to make significant contributions to the success of the Company, to reward them for their contributions to
the success of the Company and to encourage them, through ownership, to increase their proprietary interest
in the Company and their personal interest in its continued success and progress.
Officers and key employees of the Company and its direct and indirect subsidiaries are eligible to participate
in the EPP. Under the EPP, an eligible participant elects to make a personal contribution to the plan based
on the type and amount of cash remuneration received by such individual during a year, up to a maximum
percentage of the remuneration. The percentage is determined based on criteria including but not limited to
the participant’s position within the Company, his or her past performance and contributions to the
Company’s success and remuneration received during the year. The Company makes a contribution to the
EPP on behalf of that participant in an amount equal to that percentage of the participant’s personal
contribution. A third-party trustee administers the EPP through using the contributions to either purchase
common shares of the Company in the market or through treasury issuances at fair market value. The
common shares of the Company purchased under the EPP are subject to vesting and hold period
requirements.
The Company’s compensation committee has the power to determine, among other things: (i) those
individuals who will participate in the EPP; (ii) the level of participation of each participant and the level
of contribution by the Company; (iii) the purchase of common shares of the Company in the open market
or through treasury issuances; and (iv) the vesting and hold period requirements of common shares under
the EPP.
The number of common shares of the Company that may be allotted and issued under the EPP is determined
by the Board of Directors, provided that the maximum number of common shares of the Company to be
Page 18
reserved for issuance from treasury under the EPP does not exceed 14,285 common shares in the aggregate,
as adjusted following the completion of the Consolidation.
For the three and twelve months ended December 31, 2017, the Company’s compensation committee did
not approve any contributions to the EPP.
TRANSACTIONS WITH RELATED PARTIES
For the three and twelve months ended December 31, 2017, the Company rented premises in Calgary,
Alberta from Eastlake Properties Inc. which an officer of the Company holds an interest in. The Company
paid an aggregate of $0.1 million (2016 - $0.1 million) and $0.3 million (2016 - $0.3 million) in rent to
related parties and maintained a rental deposit of $36,858 (2016 - $36,858) during the three and twelve
months ended December 31, 2017. The rent between the parties was at fair market value. The term of the
lease matures in July 2023 with an option to renew.
During the three and twelve months ended December 31, 2017, the Company forgave a $0.1 million loan
with an officer of the Company.
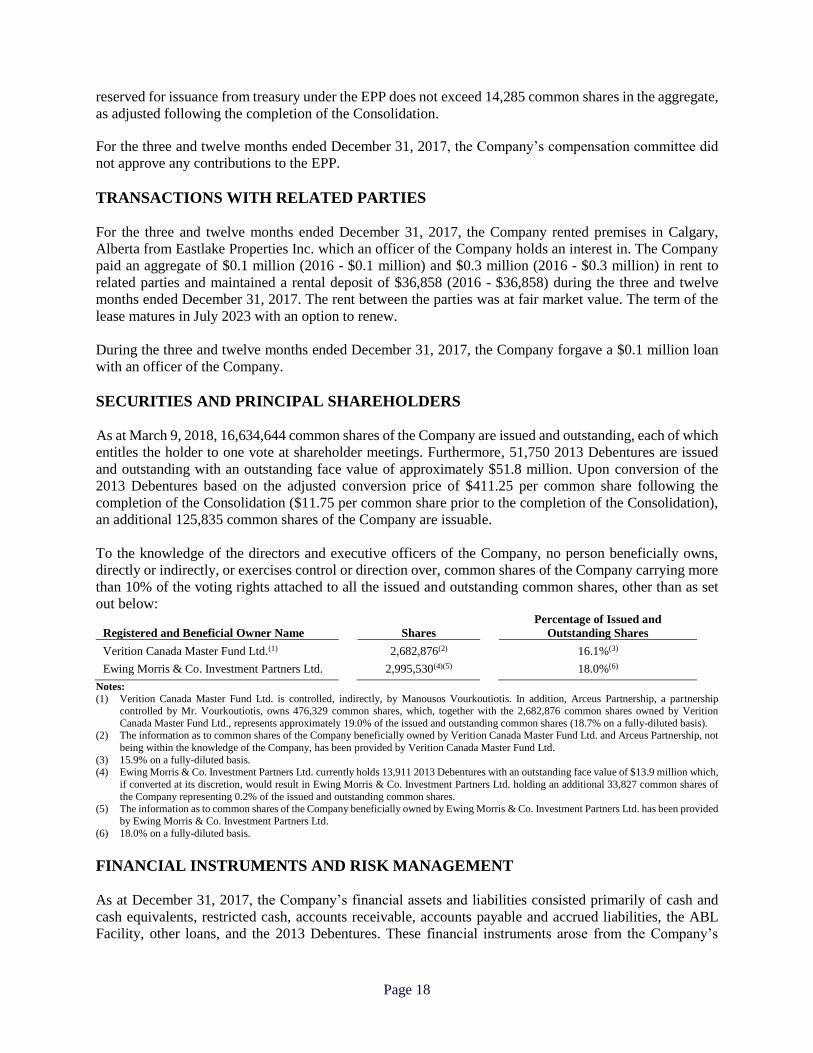
SECURITIES AND PRINCIPAL SHAREHOLDERS
As at March 9, 2018, 16,634,644 common shares of the Company are issued and outstanding, each of which
entitles the holder to one vote at shareholder meetings. Furthermore, 51,750 2013 Debentures are issued
and outstanding with an outstanding face value of approximately $51.8 million. Upon conversion of the
2013 Debentures based on the adjusted conversion price of $411.25 per common share following the
completion of the Consolidation ($11.75 per common share prior to the completion of the Consolidation),
an additional 125,835 common shares of the Company are issuable.
To the knowledge of the directors and executive officers of the Company, no person beneficially owns,
directly or indirectly, or exercises control or direction over, common shares of the Company carrying more
than 10% of the voting rights attached to all the issued and outstanding common shares, other than as set
out below:
Registered and Beneficial Owner Name Shares
Percentage of Issued and
Outstanding Shares
Verition Canada Master Fund Ltd.(1) 2,682,876(2) 16.1%(3)
Ewing Morris & Co. Investment Partners Ltd. 2,995,530(4)(5) 18.0%(6)
Notes: (1) Verition Canada Master Fund Ltd. is controlled, indirectly, by Manousos Vourkoutiotis. In addition, Arceus Partnership, a partnership
controlled by Mr. Vourkoutiotis, owns 476,329 common shares, which, together with the 2,682,876 common shares owned by Verition
Canada Master Fund Ltd., represents approximately 19.0% of the issued and outstanding common shares (18.7% on a fully-diluted basis). (2) The information as to common shares of the Company beneficially owned by Verition Canada Master Fund Ltd. and Arceus Partnership, not
being within the knowledge of the Company, has been provided by Verition Canada Master Fund Ltd.
(3) 15.9% on a fully-diluted basis. (4) Ewing Morris & Co. Investment Partners Ltd. currently holds 13,911 2013 Debentures with an outstanding face value of $13.9 million which,
if converted at its discretion, would result in Ewing Morris & Co. Investment Partners Ltd. holding an additional 33,827 common shares of
the Company representing 0.2% of the issued and outstanding common shares. (5) The information as to common shares of the Company beneficially owned by Ewing Morris & Co. Investment Partners Ltd. has been provided
by Ewing Morris & Co. Investment Partners Ltd. (6) 18.0% on a fully-diluted basis.
FINANCIAL INSTRUMENTS AND RISK MANAGEMENT
As at December 31, 2017, the Company’s financial assets and liabilities consisted primarily of cash and
cash equivalents, restricted cash, accounts receivable, accounts payable and accrued liabilities, the ABL
Facility, other loans, and the 2013 Debentures. These financial instruments arose from the Company’s

Page 19
normal course of business, with respect to the financing of its day-to-day operations, capital expenditures
and acquisitions.
The carrying values of the financial instruments, except for the ABL Facility, other loans, and the 2013
Debentures, were considered to approximate their fair values due to their short-term nature. The carrying
values of the ABL Facility and other loans approximated their fair values as the related interest rates of the
loans were at market as at December 31, 2017. The Company has considered credit risk in making this
determination and concluded no material adjustments would be required. The fair value of the liability
component of the 2013 Debentures was determined based on discounted cash flow analysis using expected
future cash flows and a market-related discount rate.
In addition to liquidity risk described in “Cash Flows and Liquidity” above, the Company is exposed to
credit, interest rate and foreign exchange risks associated with its financial assets and liabilities. Overall,
the Board of Directors has the responsibility for the establishment and approval of the Company’s risk
management policies. Management continually performs risk assessments to ensure that all significant risks
related to the Company’s operations have been reviewed and assessed to reflect changes in market
conditions and the Company’s operating activities.
Credit risk
Credit risk is the risk of financial loss to the Company if a customer or counterparty to a financial instrument
fails to meet its contractual obligation. The maximum exposure to credit risk is the full carrying value of
the financial instrument. The Company is exposed to credit risk with respect to its accounts receivable,
particularly from customers in the construction and resource industries in Western Canada due to its
concentration of business in those sectors. The Company mitigates the risk by means of a diverse customer
base in construction (industrial, commercial, infrastructure and residential), resource (oil and gas and
energy) as well as other sectors. As at December 31, 2017, there was one accounts receivable balance in
excess of 10% of the Company’s consolidated accounts receivable balance. In general, in assessing the
credit risks in relation to accounts receivable balances, management has considered the financial health of
the respective companies in terms of working capital position, financial leverage, ability to generate
operating cash flow, revenue base and profitability. Management also reviews the payment history and
average collection cycle of these accounts and makes provisions where necessary. The Company mitigates
its credit risk by following a program of credit evaluations of customers and limits the amount of credit
extended when deemed necessary. The Company maintains provisions for potential credit losses. As at
December 31, 2017, the Company had provisions for potential uncollectible accounts receivable of $1.1
million. Related bad debt expenses of $0.1 million and $0.9 million for the three and twelve months ended
December 31, 2017 were recorded in general and administration expenses in the Company’s statement of
income.
Interest rate risk
Interest rate risk is the risk that the fair value or future cash flows of a financial instrument will fluctuate
because of changes in market interest rates. The Company’s finance leases, leasehold improvement loan
and the 2013 Debentures all bear fixed interest rates, and hence are not exposed to any interest rate risk.
The Company’s bank credit facilities and equipment financing loan bear interest at variable rates. The
Company manages its interest rate risk relating to bank credit facilities and other loans through entering
into an interest rate swap agreement as needed. As at December 31, 2017, the Company did not have any
interest rate swap agreements outstanding. The Company does not hold or use any derivative instruments
for trading or speculative purposes. Interest expense is classified as part of finance costs in the Company’s
statement of income.
Page 20
Foreign exchange risk
Foreign exchange risk is the risk that the fair value or future cash flow of a financial instrument will
fluctuate because of changes in foreign exchange rates.
The Company’s cash flow exposure to foreign exchange risk mainly relates to purchases of rental
equipment and replacement parts from suppliers in the United States.
For the three and twelve months ended December 31, 2017, the Company recorded foreign exchange loss
of $0.2 million (2016 - $0.1 million) and foreign exchange gain of $0.2 million (2016 - loss of $0.1 million),
respectively. Foreign exchange gains or losses are classified as part of general and administration expenses
in the Company’s statement of income.
As at December 31, 2017, the Company’s consolidated statement of financial position included $0.3 million
of accounts receivable (2016 - $0.4 million), $1.4 million of accounts payable and other liabilities (2016 -
$1.1 million) and $0.9 million of cash (2016 - $3.1 million operating loans net of cash) which were foreign
currency denominated and were subject to foreign exchange risk.
The Company does not use, hold or issue foreign exchange contracts for trading or speculative purposes.
At December 31, 2017, the Company had no foreign exchange contracts outstanding.
CRITICAL ACCOUNTING ESTIMATES
The preparation of the Financial Statements in conformity with IFRS requires management to make
estimates and assumptions that affect the reported amounts of assets and liabilities and disclosures of
contingent assets and liabilities as at the date of the Financial Statements and the reported amounts of
revenue and expenses during the reporting period. The Company has taken into account the current
economic environment when determining the provision for inventory obsolescence, provision for doubtful
accounts and any impairment of goodwill and other assets. As conditions change, actual results could differ
from those estimates. The Company’s significant accounting policies are described in note 3 of the
Financial Statements for the year ended December 31, 2017. The Company bases its estimates on historical
experience and various other assumptions that are believed to be reasonable in the circumstances. The
Company considers the following to be most critical in understanding the judgments that are involved in
preparing the Financial Statements and the uncertainties that could affect the Company’s results of
operations, financial condition and cash flows.
Provision of obsolescence of inventory
The value of the Company’s inventory, which includes equipment for resale and parts inventories, is
evaluated by management throughout each year. When required, reserves are recorded to ensure that the
book value of the resale equipment is valued at the lower of cost or estimated net realizable value.
Management identifies slow moving or obsolete parts inventories (if any) and estimates appropriate
obsolescence provisions related thereto. Assumptions underlying management’s evaluation of inventory
obsolescence include stability in inventory price levels, estimates of customer demand and projected level
of repairs and maintenance needed for the rental fleet. Depending on the future economic environment,
there is a risk that the Company could have an increase in inventory obsolescence which would result in an
increased charge to the statement of income.

Page 21
Provision for doubtful accounts
The Company is exposed to credit risks with respect to its accounts receivable. In general, the Company
mitigates the risk by following a program of credit evaluations of customers and limits the amount of credit
extended when deemed necessary. The Company maintains provisions for potential credit losses, and any
such losses to date have been within management’s expectations. Assumptions underlying management’s
evaluation of provision for doubtful accounts include stability of the business environment that customers
operate in and financial health of customers. The provision for doubtful accounts at December 31, 2017 did
not reflect any significant increase in expected losses compared to prior years. However, depending on the
future economic environment, there is a risk that the Company could experience a greater number of
defaults which would result in an increased charge to the statement of income.
Impairment of assets
Management reviews the Company’s non-financial assets, inventories and deferred tax assets (if any) at
each reporting date to determine whether there is any indication of impairment. If any such indication exists,
then the asset’s recoverable amount is estimated. Management also reviews goodwill and intangible assets
that have indefinite useful lives or that are not yet available for use for impairment at least annually or
whenever events or changes in circumstances indicate possibility of impairment.
Impairment is recognized if the recoverable amount determined as the higher of the estimated fair value
less cost to sell or the discounted future cash-flows generated from use and eventual disposal from an asset
or cash generating unit (“CGU”) is less than their carrying value. Impairment losses are recognized in profit
or loss. Impairment losses recognized in respect of a CGU are allocated first to reduce the carrying value
of goodwill allocated to the CGU and any excess is allocated to the carrying amount of the other assets in
the CGU on a pro rata basis.
Assumptions underlying management’s evaluation of asset impairment include estimates of future
operations of, and related cash flow generated from, the assets or CGUs, marketplace data, and future costs
of capital. Depending on the future economic environment, there is a risk that the Company could have an
increase in impairment which would result in an increased charge to the statement of income.
Accrual of unbilled revenue
Revenue from rental contracts and related services is generated through cycle billing to customers. Accrual
of revenue relating to invoices not yet issued to customers at period-end is estimated by management based
on rental rates specified in rental contracts and expected length of rental periods. Depending on the
magnitude of the difference between management’s estimates and the actual rental rates and length of rental
periods, there is a risk that the Company could have to adjust for the related difference, which would result
in an increased charge to the statement of income.
Deferred income taxes
Deferred income tax assets and liabilities are determined based on the temporary differences between the
tax basis of the Company’s assets and liabilities and the amounts reported in the Financial Statements, to
the extent that such temporary differences are expected to reverse in future periods. Deferred tax assets or
liabilities are calculated using the tax rates for the periods in which the differences are expected to be settled.
Deferred tax assets are recognized to the extent that they are considered more likely than not to be realized.
Assumptions underlying the composition of deferred income tax assets include estimates of future results
of operations, the timing of reversal of temporary differences, as well as the tax rates and laws in each
jurisdiction at the time of the expected reversal. The composition of deferred income tax assets is reasonably

Page 22
likely to change from period to period due to the uncertainties surrounding these assumptions, and therefore
would result in an increased charge to the statement of income.
Loss on sale of discontinued operations
The loss on the sale of Britco Australia was calculated using the best estimates from management and the
administrators of the voluntary administration and liquidation of Britco Australia. Such estimates include:
(i) the recoverable value of the net assets of Britco Australia; (ii) costs required to complete the disposal of
Britco Australia; and (iii) costs to terminate outstanding lease commitments. Depending on the actual results
of these items, there is a risk that the Company could incur additional costs which would result in increased
charges to the statement of income. This accounting estimate is applicable to Britco Australia.
The gain (loss) on the sales of the Pacific Coast businesses were calculated using best estimates from
management. Such estimates include costs to terminate outstanding lease commitments. Depending on the
actual results of these items, there is a risk that the Company could incur additional costs which would
result in increased charges to the statement of income. This accounting estimate is applicable to Pacific
Coast.
CONTINGENCY
On December 10, 2014, Robert Krten and 2381371 Ontario Inc. filed a securities class action against the
Company and certain of its directors and executives alleging misrepresentation. The proceeding was
commenced by a statement of claim filed in the Windsor registry of the Ontario Superior Court. The claim
was subsequently amended to substitute Frederick Cass and Edward Allan McCaffrey as the plaintiffs. The
action was transferred to Toronto. The Company intends to vigorously defend the claim. The case remains
in its initial phase of pleading and a reasonable estimate of the obligation cannot be made at this time.
RISK FACTORS
For a detailed description of the risk factors associated with the Company and its business, refer to the
Company’s annual information form dated March 30, 2017 (the “Annual Information Form”). The
Company is not aware of any significant changes to its risk factors from those disclosed in the Annual
Information Form except for (i) the elimination of the risk factor relating to the ongoing ownership of the
Canadian manufacturing division of Pacific Coast since the division was sold during 2017; and (ii) the
completion of the ABL Facility on November 21, 2017, as described below.
ABL Facility
The ABL Facility’s borrowing base calculation fluctuates with the value of certain eligible assets. Should
the value of certain eligible assets decline, the Company’s borrowing base could also decline. Many factors
could affect the future value of certain eligible assets including, but not limited to, changes in market
demand for used equipment, changes in the cost of new equipment, and foreign currency fluctuations that
impact the Canadian equivalent value of equipment at time of purchase. A reduction in the Company's
borrowing base could negatively impact the Company's financial condition and its cash flow management,
require that a portion of the ABL Facility be repaid, or limit the Company from taking advantage of
opportunities including future growth and capital expenditures.
Economic Dependence
For the year ended December 31, 2017, more than 10% of the consolidated revenue of the Company was
derived from one customer. The Company has entered into a service agreement with such customer that is

Page 23
subject to annual renewal. There is no guarantee that such customer will continue to renew the service
agreement with the Company on an annual basis or, if renewed, that such renewal will be on the same terms
and conditions. Termination of, or a failure to renew, the service agreement with the customer may
adversely affect the Company’s financial condition, operating results and cash flow.
DISCLOSURE CONTROLS AND PROCEDURES AND INTERNAL CONTROL OVER
FINANCIAL REPORTING
The Company’s management, under the supervision and with the participation of its Chief Executive
Officer (“CEO”) and Chief Financial Officer (“CFO”), is responsible for establishing and maintaining
disclosure controls and procedures (“DC&P”) and internal control over financial reporting (“ICFR”).
DC&P are designed to provide reasonable assurance that information required to be disclosed by the
Company in annual filings, interim filings or other reports filed or submitted under securities legislation is
recorded, processed, summarized and reported within the time periods specified in the securities legislation.
Furthermore, DC&P are designed to ensure that information required to be disclosed by the Company in
annual filings, interim filings or other reports filed or submitted under securities legislation is accumulated
and communicated to the Company’s management, including its CEO and CFO, as appropriate to allow
timely decisions regarding required disclosure. ICFR is designed to provide reasonable assurance regarding
the reliability of financial reporting and the preparation of financial statements for external purposes in
accordance with IFRS.
The Company’s ICFR may not prevent or detect all misstatements because of the inherent limitations of
any control system. Due to these inherent limitations, DC&P and ICFR can provide only reasonable, not
absolute, assurance that controls will be effective in preventing and/or detecting and correcting
misstatements that may be material. Additionally, projections of any evaluation of effectiveness to future
periods are subject to the risk that controls may become inadequate because of changes in conditions or
deterioration in the degree of compliance with the Company’s policies and procedures.
The Company’s management, under the supervision of and with the participation of the CEO and CFO,
completed an evaluation of the design and operating effectiveness of the Company’s DC&P and ICFR. In
making this evaluation, management used a top-down risk-based approach using the criteria established in
the Internal Control – Integrated Framework (2013), issued by the Committee of Sponsoring Organizations
of the Treadway Commission (“COSO”). Based on this evaluation, the CEO and CFO have concluded that
the Company’s DC&P and ICFR were effective as at December 31, 2017.
There has been no change in the Company’s DC&P and ICFR that occurred during the twelve months
ended December 31, 2017 that has materially affected, or is reasonably likely to materially affect, the
Company’s DC&P and ICFR.
OUTLOOK
The following discussion is qualified in its entirety by the section “Forward-Looking Information” at the
beginning of this MD&A, and the section titled “Risk Factors”.
Management expects rental activity levels, measured as OEC on rent, to continue its moderate growth trend
as the Western Canadian economy continues to recover at a very gradual pace, particularly in the residential
and industrial construction sectors in Alberta. In BC, management expects the rental activity levels in the
construction and film and TV production sectors to remain consistent with historical levels. Rental rates,
particularly relating to aerial rental equipment, continue to be impacted across the region by ongoing
supply-related and competitive pressure, prompting the need to redeploy equipment to enhance fleet returns.

Page 24
In respect of the remaining construction heat season in early 2018, management expects the physical
utilization of the construction heating rental equipment to remain consistent with the first half of the season
in late 2017, subject to a consistent level of construction activity and external factors including but not
limited to weather and commodity price levels.
Management will continue to: (i) refine its marketing strategy to focus sales efforts to its target customers,
including identification of new markets and/or closure of existing branches and leveraging its
environmental monitoring capability; (ii) evaluate returns on fleet investments and redeploy and/or right-
size the fleet as necessary; and (iii) monitor operational efficiency through cost management.
ADDITIONAL INFORMATION
Additional information relating to the Company, including the Annual Information Form and other public
filings, is available on SEDAR at www.sedar.com or on the Company’s website at www.weq.ca.
For more information about this MD&A, please contact:
Carlos Yam, Chief Financial Officer
WesternOne Inc.
Suite 910, 925 West Georgia Street
Vancouver, BC V6C 3L2
Phone: (604) 678-4042
E-mail: [email protected]
For investor relations information, please contact:
Andrew Greig, Manager of Investor Relations
WesternOne Inc.
Suite 910, 925 West Georgia Street
Vancouver, BC V6C 3L2
Phone: (604) 678-4042
E-mail: [email protected]
TRADING SYMBOLS
Toronto Stock Exchange: WEQ and WEQ.DB