management of food safety risk in tasmanian primary...
TRANSCRIPT
Management of food safety risk in
Tasmanian primary industries
November 2004
Dr John Sumner2 Hayley Court
Deviot 7275

1
Contents
1 Background2 Scope of the present project3 Methodology used in the present study
3.1 Risk estimates3.2 Gold standard
4 Responsibility for food safety regulation in Tasmania4.1 TDIA4.2 DHHS4.3 Local government4.4 DPIWE
5 Potential constraints on food safety regulation in Tasmania5.1 Primary production and processing standard5.2 Food safety standard 3.2.1 (Food safety programs)5.3 Shared responsibility for regulation of food safety5.4 Lack of industry databases5.5 Lack of resources5.6 Fragmentation of food safety management
6 Red meat6.1 Regulation6.2 Practice6.3 Hazards in meat and poultry6.4 Illness associated with meat and meat products6.5 Recalls of meat and meat products6.6 Microbiological quality of Tasmanian meat produced at VSPs6.7 Risk scenarios6.8 Issues surrounding the red meat industry
7 Smallgoods7.1 Regulation7.2 Practice7.3 Illness associated with smallgoods7.4 Recalls of smallgoods7.5 Risk scenarios
Scenario 1: Enterohaemorrhagic E. coli (EHEC) in UCFMScenario 2: Salmonella in UCFM made from game meat
7.6 Issues surrounding the smallgoods industry8 Game meat
8.1 Regulation8.2 Practice8.3 Risk scenarios8.4 Issues surrounding the smallgoods industry
9 Poultry9.1 Regulation9.2 Practice9.3 Illness associated with poultry9.4 Recalls of poultry9.5 Microbiological status of poultry carcases in Tasmania9.6 Risk scenarios9.7 Issues surrounding the poultry industry
10 Eggs10.1 Regulation10.2 Practice10.3 Illness associated with eggs

2
10.4 Recalls of egg products10.5 Risk scenarios10.6 Issues surrounding regulating the egg industry
11 Dairy11.1 Regulation of the industry11.2 Practice11.3 Illness from dairy products11.4 Risk scenarios11.5 Issues for the dairy industry
12 Seafood12.1 Regulation of the industry12.2 Practice12.3 Illness associated with seafoods12.4 Recalls of seafoods12.5 Risk scenarios12.6 Issues for the seafood industry
13 Vegetables13.1 Regulation of the industry13.2 Practice13.3 Illness from vegetables13.4 Recalls of vegetables13.5 Risk scenarios13.6 Issues for the vegetable industry
14 Fruits14.1 Regulation of the industry14.2 Practice14.3 Illnesses caused by fruit14.4 Recalls of fruits14.5 Risk scenarios14.6 Issues for the fruit industry
15 Extensive agriculture15.1 Regulation of the industry15.2 Practice15.3 Illnesses caused by seed products15.4 Recalls of seed and nut products15.5 Risk scenarios15.6 Issues for the seeds industry
16 Apiary16.1 Regulation of the industry16.2 Practice16.3 Illness from honey16.4 Recalls of honey16.5 Chemical hazards16.6 Risk scenarios16.7 Issues for the industry
AcknowledgmentsReferencesAppendix 1: Data and assumptions used in risk scenariosAppendix 2: Risk Ranger
1 Background to developing Risk Ranger2 User Interface – the Risk Ranger shopfront

3
About the authorDr John Sumner has an academic background, teaching food microbiology at universities inUK, Canada, New Zealand and Australia and is Honorary Research Professor at theUniversity of Tasmania.
He is the author of several hundred research and technical publications and is a Fellow of theAustralian, New Zealand and UK Institutes of Food Science and Technology.
He combines an academic career with a consulting practice. His specialties are qualityassurance and HACCP systems, food safety and risk assessment. He is Technical Adviser tothe food safety program of Meat and Livestock Australia and to Seafood Services Australia.
He is a member of the FAO/WHO roster of experts for the UN’s risk assessment program.

4
Summary1. Data have been gathered from branches of the Department of Primary Industries Water
and the Environment (DPIWE) to assess the degree to which each branch regulates foodsafety of commodities within its responsibility.
2. Some regulators e.g. Meat Hygiene Standards (MHS) have legislation which clearlyidentifies them as the State’s lead jurisdiction for food safety for that specific sector. TheTasmanian Dairy Industry Authority (TDIA) has legislation which similarly empowers it.
3. Other branches, such as Horticulture, Vegetables, Extensive Agriculture do not have theregulatory underpinning which gives them responsibility for food safety.
4. Some sectors have Food Safety Programs (FSPs) as the basis for food safetymanagement, while others do not.
5. Local authorities can require companies to implement a FSP under Standard 3.2.1 of theFood Standards Code. Such plans are not consistent with HACCP as defined by CodexAlimentarius which could result in inconsistency between sectors.
6. The proposed Primary Production and Processing Standards (PPPSs) could lead toconfusion over regulatory responsibility between branches of DPIWE and Department ofHealth and Human Services (DHHS); the TDIA may have similar issues. Confusion isintroduced via the term “substantial transformation” which demarcates which jurisdictionis responsible. Until substantial transformation is defined for activities such as washing offruit and vegetables and growing of sprouts, regulatory responsibility remains unclear.
7. Responsibility for smallgoods manufacture is confusing with DPIWE responsible forplants which have an integrated slaughter facility and DHHS/LG for plants without such afacility. When smallgoods manufacturers are regulated by DPIWE the AustralianStandard is used and it is assumed that, when manufacturers are regulated by DHHS/LG,the Food Standards Code is used.
8. Smallgoods are also manufactured by virtually all butcher shops in Tasmania and will berequired to implement FSPs because manufactured and fermented meats have beenidentified by the National Risk Validation Project as a high-risk sector. It is expected thatthis sector will be regulated via the Food Standards Code which introduces the potentialfor inconsistency both within the State between sectors, and nationally where jurisdictionshave elected to regulate butcher shops via the Australian Standard.
9. While some regulators e.g. MHS, TDIA and the Licensing and Administration Branch ofDPIWE’s Primary Industry Division have consolidated lists of manufacturers togetherwith their products and processes this is lacking across other areas of the State’s foodindustry. Without knowing who does what by which process, food safety managementcan only operate reactively, not proactively.
10. Lack of sector information has prevented the semi-quantitative profiling approach toprocessing of vegetables, fruits, sprouts and some smallgoods; for these sectors aqualitative profile has been done.
11. Specific actions are suggested for consideration under each of the commoditiescomprising this report.
12. A summary table is provided of risk rating for various scenarios within industry sectors.Two risk tools have been used to generate ratings, a qualitative tool and the semi-quantitative tool, Risk Ranger. A more detailed description of Risk Ranger is presented inAppendix 2.
13. In general, risk ratings have been generated to indicate compliance with the prescribedstandard versus non-compliance using examples from local, national and internationalbreakdowns in regulation.

5
Summary of risk ratings and estimated illness according to industry sectorsSector Risk Rating
Qualitative Semi-quantitative (Risk Ranger)Rating (0-100) Estimated Tasmanian illnesses/annum
Meat, poultry and game 0* (Low) 0*SmallgoodsPathogenic E. coli in salami – process within Standard 1.6.2 15 (Low) 2/million yearsPathogenic E. coli in salami – process outside Standard 1.6.2 51 (High) 5Salmonella in salami made from game meat – process outside Standard 1.6.2 57 (High) 60EggsSalmonella in lightly cooked eggs 54 (High) 18Salmonella in raw egg drinks 54 (High) 15Salmonella in egg butter used for Asian meat rolls 62 (High) 23DairySalmonella in ice cream made without a food safety plan 54 (High) 150L. monocytogenes in dips 52 (High) 75SeafoodOysters grown in waters under a Seafood QA Program (SQAP) 25 (Low) 1/centuryOysters grown without a SQAP 55 (High) 2250VegetablesFaecal pathogens in washed vegetables ModerateL. monocytogenes in packaged vegetables HighFruitFaecal pathogens in washed fruit ModerateL. monocytogenes in packaged fruit salad HighFaecal pathogens in unpasteurised fruit juice HighSeedsSalmonella in bean sprouts HighHoneyC. botulinum in honey LowAgricultural chemicals and antibiotics in honey Low
* Products are consumed cooked – illness may result from handling at retail, food service or home sectors causing cross contamination to final products
6
1 BackgroundInvolving risk as part of food safety management is a relatively new concept. In the past,hazard management was the primary tool, with the Hazard Analysis Critical Control Point(HACCP) concept coming to the fore during the 1990s. Despite the fact that the first HACCPprinciple required an evaluation of hazards and risks, the latter were rarely considered inHACCP plans. In the past decade, management of risks, as well as of hazards, has become apart of food safety management at the enterprise and regulatory levels.As part of its evolution, risk management has evolved a series of terms, the most important ofwhich are risk analysis, risk assessment and risk profile.
Risk Analysis is a process which is used to enhance protection of public health and has threeparts:
• Risk Assessment• Risk Management• Risk Communication
Risk Assessment is the science component of risk analysis used to establish standards,guidelines and other recommendations for food safety to enhance consumer protection. Risk Profiling is defined by the Codex Alimentarius Commission (CAC 2002) as adescription of a food safety problem and its context developed for the purpose of identifyingthose elements of a hazard or risk which are relevant to risk management decisions.
2 Scope of the present project For the present exercise, the terms of reference are to:1 Gather information on the exposure of consumers to food safety hazards from the
following broad commodity areas:• Meats, poultry, eggs• Seafoods• Vegetables• Horticultural products• Grains and other extensive agricultural products• Dairy products• Honey
2 Identify potential food safety issues which may impact adversely on Tasmanianconsumers.
3 Select and develop various risk-based scenarios for specific hazard:commodity pairswhich have relevance in the state.
4 Confer with Department of Health and Human Services (DHHS) staff on matters offood safety as they apply to the above commodities and to Tasmanian consumers.
5 Confer with the Department of Health and Human Services to arrange one or moremeetings with EHOs to discuss their role in food safety, together with resourcesneeded to enhance their role in a changing national climate of food safety.
6 Discuss the implications of food safety risk for Tasmanian consumers within thecontext of current food safety management regimes operating within the state.
7 Present the final report to the Tasmanian Primary Industries Food Safety Forum and,if requested, to senior DPIWE and DHHS officials.

7
3 Methodology used in the present study The present study involves several areas within DPIWE, the Tasmanian Dairy IndustryAuthority (TDIA) and the DHHS. It has been progressed in several stages: Stage 1: Discussion of key food safety issues with staff in each area Stage 2: Research of hazards and exposure – gathering of data Stage 3: Submission of a draft report to personnel in each areaStage 4: Preparation of risk ratings for scenarios illustrating how perceived
weaknesses in management of food safety can lead to enhanced risk. Forsectors where information is lacking a qualitative profile has been done
Stage 5: Discussion with stakeholders at DPIWE, DHHS, TDIA and local governmentStage 6: Preparation of a draft final report for feedback by stakeholdersStage 7: Submission of a final report
Two rating tools have been used, a qualitative tool based on the International Commission forMicrobiological Specifications in Foods (ICMSF) and Food Science Australia (2002) and asemi-quantitative tool, Risk Ranger, which is described in Appendix 2.
3.1 Risk estimatesRisk estimates from the qualitative framework give ratings of Low, Medium and High.Ratings from Risk Ranger spread from 0-100 where zero is equivalent to 1 illness/10 billionpeople/century from the hazard:product combination while 100 is equivalent to everyoneeating a lethal dose on one day.A change of “6” in risk rating is equivalent to a 10-fold change in risk. Thus the differencebetween a rating of 30 and 60 is five orders of magnitude (100,000x difference in risk).Estimates of illness are probably accurate only to an order of magnitude and serve to illustraterelative changes in illness pattern.Risk ratings may be aggregated into categories of risk:• Low risk (risk rating <30)• Medium risk (risk rating 30-50)• High risk (risk rating >50)
3.2 Gold standardAmong suggested actions for various entities is the establishment of a Gold Standard. Thisapproach has been used by South Australia’s Department of Primary Industries and Resources(PIRSA) to identify areas for improvement at South Australia’s smallgoods and poultryplants. A Gold Standard is basically a compilation of:1. Hazard management
• Process validation• Verification• Corrective action
2. Factory layout and operation3. Cleandown4. Monitoring of cleandownEach plant is assessed for its compliance against a range of criteria under each broad heading.
A similar approach could be undertaken for the activities and operations of food safety riskmanagers.

8
4 Responsibility for food safety regulation in TasmaniaTasmania’s food industry is regulated by four entities:
1. Tasmanian Dairy Industry Authority (TDIA)2. Department of Health and Human Services (DHHS)3. Local government via health departments in 29 local councils4. Department of Primary Industries, Water and Environment (DPIWE)
Broad responsibilities of each entity are explained in Regulation of Food Safety inTasmania’s Primary Industries: Draft Issues Paper (March 2004). In summary:
4.1 TDIAThe TDIA is established under the Dairy Industry Act 1994, administers the Act and licensesdairy farmers, dairy processors, dairy manufacturers and milk vendors. The Authority also isthe authorized agent of the Australian Quarantine and Inspection Service (AQIS) forTasmanian dairy exports.
The TDIA’s responsibilities embrace the supply chain from farm to delivery to retail and areexercised by licences or certificates of competency according to HACCP and risk-based foodsafety procedures. Licence conditions include compliance with the appropriate AustralianStandards for dairy foods.
The TDIA participates in joint food safety audits with appropriate third party certifyingbodies and is authorised under the Food Act 2003 as the competent authority in dairy foodsafety matters.
In summary, the TDIA provides a regulatory umbrella under which most of the Tasmaniandairy processing industry (excluding ice-cream manufacture) operates via suitably-trainedstaff capable of modern regulation (HACCP/audit) of hazard management.
4.2 DHHSThe DHHS administers the Food Act 2003, the stated objectives of which are to:• Ensure food for sale is both safe and suitable for human consumption• Prevent misleading conduct in connection with the sale of food• Provide for the application in this jurisdiction of the Food Standards Code
The Food Act 2003 is the “default” Act for Tasmania in relation to food safety issues andregulates all areas of the food production chain. The Act includes provisions that limit thescope and application of the Act in relation to “primary food production”. Primary foodproduction includes growing, raising, cultivating, harvesting, collecting or catching of food.The Act exempts primary food production from the application of certain provisions such asimprovement notices, auditing, notification and registration. However, primary foodproduction is not exempt from the general requirement to produce safe food.
The DHHS administers the Tasmanian Shellfish Quality Assurance Program (TSQAP) forshellfish aquaculture operations. This program carries out continual and extensive monitoringof all commercial shellfish growing areas in the state and assigns a classification to each areabased on the level of public health risk found.
4.3 Local governmentLocal Government Environmental Health Officers (EHOs) in conjunction with DHHS areresponsible for the administration of the Food Act 2003 and the Australia New Zealand FoodStandards Code (although practically with regards to the Code, most EHOs are mainlyinvolved with the Food Safety Standards aspect only).

9
While DHHS largely focuses on statewide legislative and broad policy issues, localgovernment EHOs’ primary responsibility is the enforcement of this legislation. The majorityof EHOs’ regulatory activities are associated with retail activities, including bakeries,restaurants, takeaway food stores, butcher and fish shops. While defined primary foodproduction operations are generally not regulated by EHOs due to their exemptions, suchoperations may “default” to local government because of the lack of an alternative regulatoryframework. If this occurs, food safety matters can be regulated under the general provisionsof the Food Act 2003.
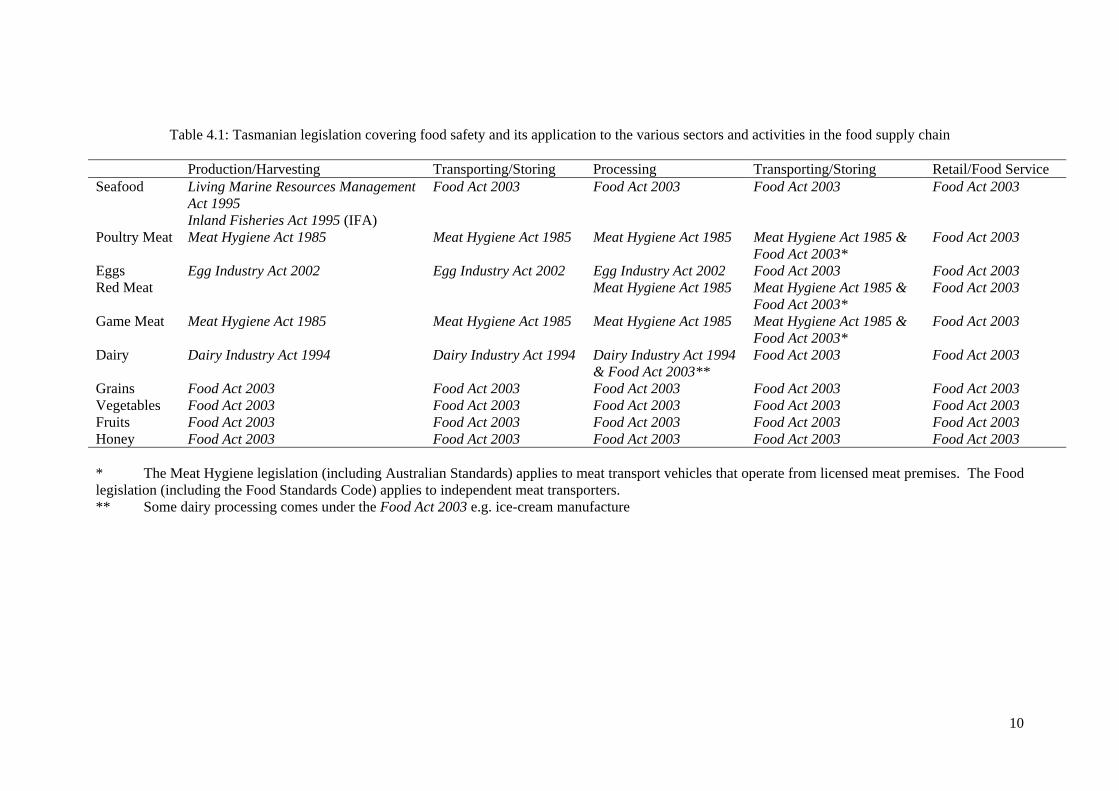
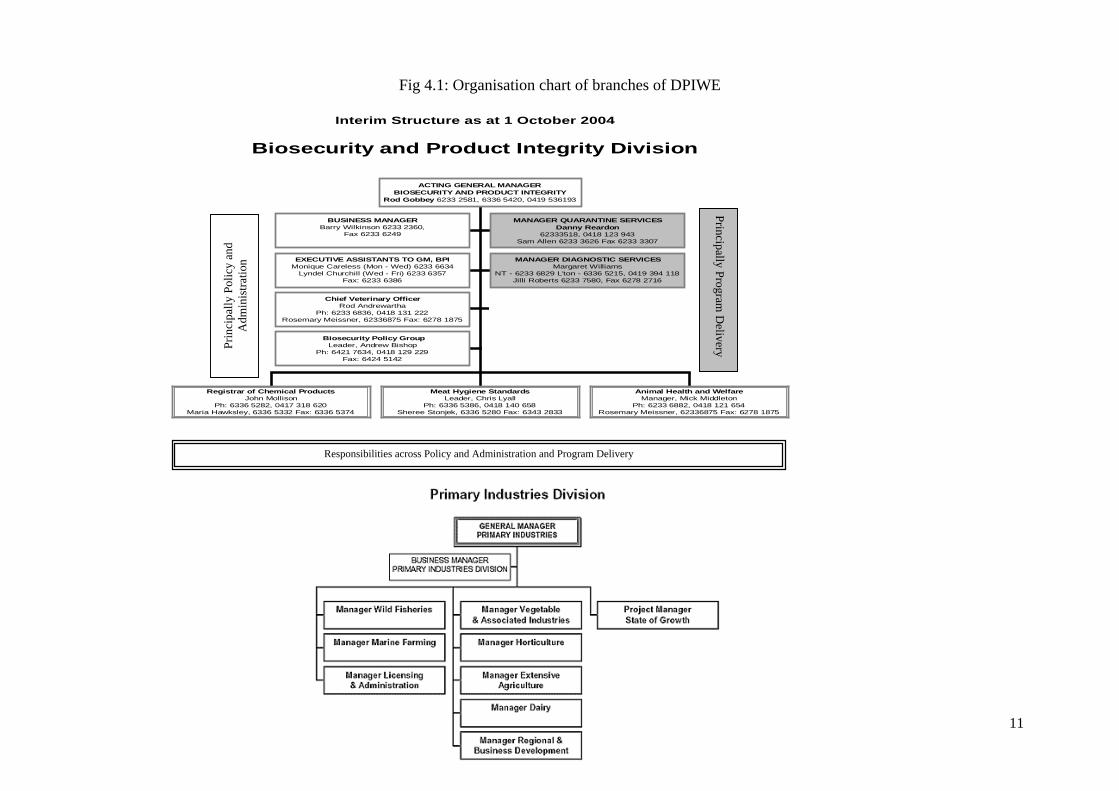
4.4 DPIWEWithin DPIWE there are a series of branches within the Biosecurity and Product Integrity(BPI) and Primary Industries Divisions of DPIWE which have the potential to administerfood safety management (Fig 4.1). Some branches have obvious responsibility for food safetymanagement. For example, Meat Hygiene Standards (MHS) Section (to be located within thenew Food Safety Branch of BPI) administers the Meat Hygiene Act 1985 and will assumeadministration of the Egg Industry Act 2002 during 2004, both Acts including production ofsafe, quality food within their objectives. By contrast, branches such as Vegetables,Horticulture and Extensive Agriculture have no legislation which gives them responsibilityfor food safety.
There is linkage between DPIWE and the TDIA via the Acting General Manager - BPI, whochairs the TDIA. There is also a relationship between Agriculture and DHHS which has beenformalized at the ministerial and CEO levels.
10
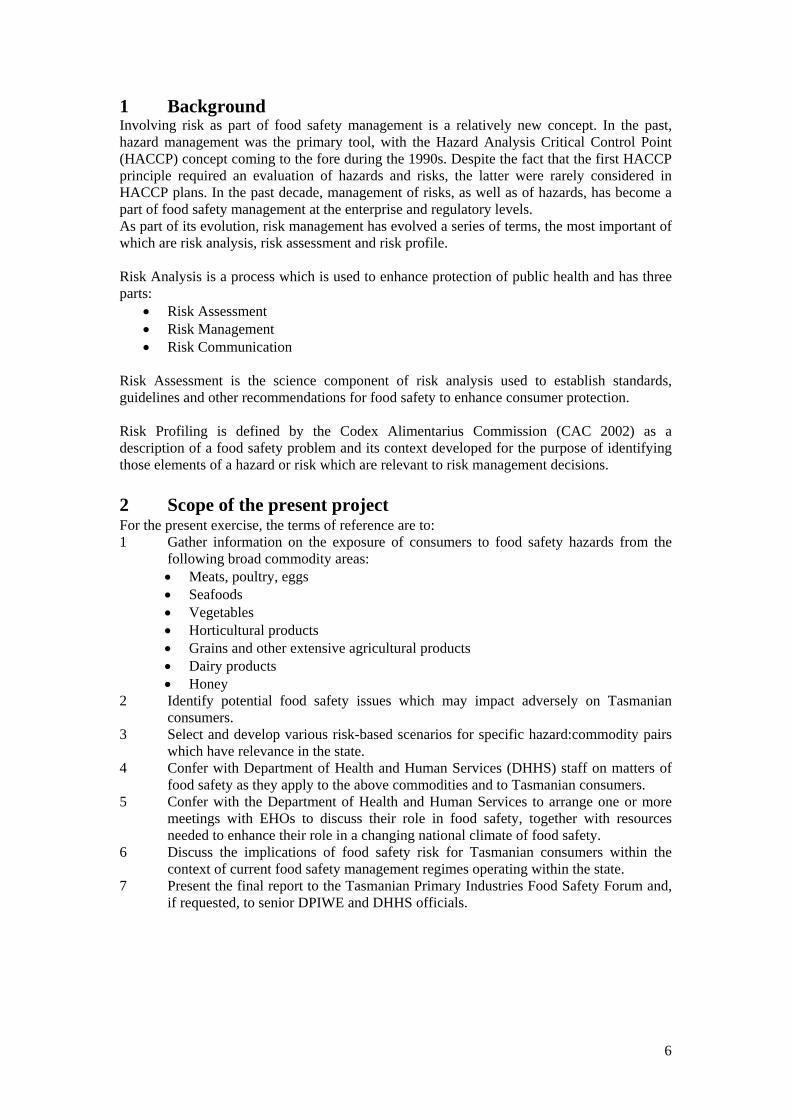
Table 4.1: Tasmanian legislation covering food safety and its application to the various sectors and activities in the food supply chain
Production/Harvesting Transporting/Storing Processing Transporting/Storing Retail/Food ServiceSeafood Living Marine Resources Management
Act 1995Inland Fisheries Act 1995 (IFA)
Food Act 2003 Food Act 2003 Food Act 2003 Food Act 2003
Poultry Meat Meat Hygiene Act 1985 Meat Hygiene Act 1985 Meat Hygiene Act 1985 Meat Hygiene Act 1985 &Food Act 2003*
Food Act 2003
Eggs Egg Industry Act 2002 Egg Industry Act 2002 Egg Industry Act 2002 Food Act 2003 Food Act 2003Red Meat Meat Hygiene Act 1985 Meat Hygiene Act 1985 &
Food Act 2003*Food Act 2003
Game Meat Meat Hygiene Act 1985 Meat Hygiene Act 1985 Meat Hygiene Act 1985 Meat Hygiene Act 1985 &Food Act 2003*
Food Act 2003
Dairy Dairy Industry Act 1994 Dairy Industry Act 1994 Dairy Industry Act 1994& Food Act 2003**
Food Act 2003 Food Act 2003
Grains Food Act 2003 Food Act 2003 Food Act 2003 Food Act 2003 Food Act 2003Vegetables Food Act 2003 Food Act 2003 Food Act 2003 Food Act 2003 Food Act 2003Fruits Food Act 2003 Food Act 2003 Food Act 2003 Food Act 2003 Food Act 2003Honey Food Act 2003 Food Act 2003 Food Act 2003 Food Act 2003 Food Act 2003
* The Meat Hygiene legislation (including Australian Standards) applies to meat transport vehicles that operate from licensed meat premises. The Foodlegislation (including the Food Standards Code) applies to independent meat transporters.** Some dairy processing comes under the Food Act 2003 e.g. ice-cream manufacture
11
Interim Structure as at 1 October 2004
Biosecurity and Product Integrity Division
BUSINESS MANAGERBarry Wilkinson 6233 2360,
Fax 6233 6249
MANAGER QUARANTINE SERVICESDanny Reardon
62333518, 0418 123 943Sam Allen 6233 3626 Fax 6233 3307
EXECUTIVE ASSISTANTS TO GM, BPIMonique Careless (Mon - Wed) 6233 6634
Lyndel Churchill (Wed - Fri) 6233 6357Fax: 6233 6386
MANAGER DIAGNOSTIC SERVICESMargaret Williams
NT - 6233 6829 L'ton - 6336 5215, 0419 394 118Jilli Roberts 6233 7580, Fax 6278 2716
Chief Veterinary OfficerRod Andrewartha
Ph: 6233 6836, 0418 131 222Rosemary Meissner, 62336875 Fax: 6278 1875
Biosecurity Policy GroupLeader, Andrew Bishop
Ph: 6421 7634, 0418 129 229Fax: 6424 5142
Registrar of Chemical ProductsJohn Mollison
Ph: 6336 5282, 0417 318 620Maria Hawksley, 6336 5332 Fax: 6336 5374
Meat Hygiene StandardsLeader, Chris Lyall
Ph: 6336 5386, 0418 140 658Sheree Stonjek, 6336 5280 Fax: 6343 2833
Animal Health and WelfareManager, Mick Middleton
Ph: 6233 6882, 0418 121 654Rosemary Meissner, 62336875 Fax: 6278 1875
ACTING GENERAL MANAGERBIOSECURITY AND PRODUCT INTEGRITY
Rod Gobbey 6233 2581, 6336 5420, 0419 536193
Fig 4.1: Organisation chart of branches of DPIWE
Prin
cipa
lly P
olic
y an
dA
dmin
istra
tion
Principally Program D
elivery
Responsibilities across Policy and Administration and Program Delivery

12
5 Potential constraints on food safety regulation in TasmaniaPotential constraints on effective management of food safety in Tasmania include:
5.1 Primary production and processing standardIn Regulation of Food Safety in Tasmania’s Primary Industries: Draft Issues Paper (March 2004)the genesis of primary production and processing standards is described. In 2000, the Council ofAustralian Governments (COAG) agreed to a nationally coordinated approach to food regulation andfor the first time a single national framework was brought into existence for the development of alldomestic food standards covering the entire food supply chain. The COAG Food RegulationAgreement created a clear responsibility for Food Standards Australia New Zealand (FSANZ) todevelop all domestic food standards, including primary production and processing standards. Thesestandards will form Chapter 4 of the Food Standards Code and focus on food safety risks. The policyresponsibility for PPP standards rests with the Australia and New Zealand Food RegulationMinisterial Council (ANZFRMC) and its subordinate, the Food Regulation Standing Committee(FRSC).
Clearly the PPPS has importance for DPIWE firstly, because of its primary industries focus andsecondly, because of its shared responsibilities with DHHS and LG. The Food Standards Codedefines primary food production as “the growing, cultivation, picking, harvesting, collection orcatching of food”. The Code adds further definition that primary production includes “packing,treating (for example washing) or storing of food on the premises on which it was grown, cultivated,picked, harvested, collected or caught”. The Code eliminates any process involving:• Substantial transformation (for example, manufacturing or canning)• Sale or service of food directly to the public
The term “substantial transformation” remains largely undefined at the national level and, forDPIWE, this lack of definition is important. For example, when fruits and vegetables go through awashing step, is this substantial transformation? When seeds are used for sprouting is this substantialtransformation? Clearly the advent of PPPSs requires close liaison between DPIWE and DHHS/LG.
5.2 Food safety standard 3.2.1 (Food safety programs)Food safety programs (FSPs) are the current tool of choice for managing hazards and risks. Theycomprise an underpinning of Good Manufacturing Processes (GMPs) and Standard SanitationOperating Procedures (SSOPs) on which can be erected a HACCP system. Codex Alimentarius hasdefined how HACCP systems are to be implemented and operated under seven General Principles(Codex, 1997).
In Australia the Food Standards Code requires that, where a State or Territory decides to implement arequirement for FSPs, it must use Standard 3.2.1. However, Standard 3.2.1 lacks definition in severalkey aspects. While Standard 3.2.1 mentions that a FSP must be based on “HACCP concepts” theseare undefined. The Standard refers to Clause 5 for definition of content of the FSP in which there aresix elements which align broadly with six of the seven HACCP principles. Missing is Principle 3(Establish Critical Limits, CLs) an omission without which a HACCP system cannot be operatedsince it is against CLs that monitoring is assessed and Corrective Actions implemented if CLs arebreached.
Thus Standard 3.2.1 allows food establishments to have a FSP which is not Codex compliant withrespect to HACCP principles. In the present context, Standard 3.2.1 is not mandated in Tasmania butit is open for DHHS and LG to require establishments to implement a FSP system under Standard3.2.1. Were that to happen in the smallgoods sector it would result in some plants operating under theAustralian Standard for the hygienic production and transportation of meat and meat products forhuman consumption (AS 2002:4696) and others (butcher shops) under Standard 3.2.1; the former
13
would operate Codex-compliant HACCP while the latter would not.
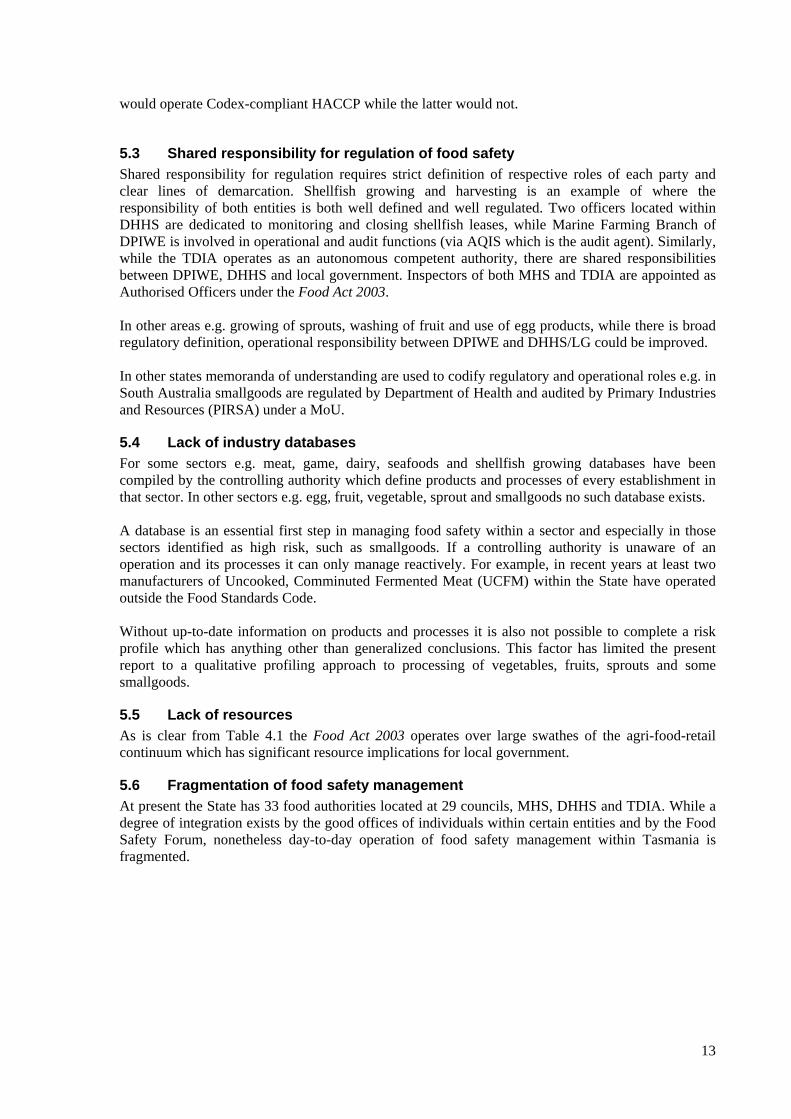
5.3 Shared responsibility for regulation of food safetyShared responsibility for regulation requires strict definition of respective roles of each party andclear lines of demarcation. Shellfish growing and harvesting is an example of where theresponsibility of both entities is both well defined and well regulated. Two officers located withinDHHS are dedicated to monitoring and closing shellfish leases, while Marine Farming Branch ofDPIWE is involved in operational and audit functions (via AQIS which is the audit agent). Similarly,while the TDIA operates as an autonomous competent authority, there are shared responsibilitiesbetween DPIWE, DHHS and local government. Inspectors of both MHS and TDIA are appointed asAuthorised Officers under the Food Act 2003.
In other areas e.g. growing of sprouts, washing of fruit and use of egg products, while there is broadregulatory definition, operational responsibility between DPIWE and DHHS/LG could be improved.
In other states memoranda of understanding are used to codify regulatory and operational roles e.g. inSouth Australia smallgoods are regulated by Department of Health and audited by Primary Industriesand Resources (PIRSA) under a MoU.
5.4 Lack of industry databasesFor some sectors e.g. meat, game, dairy, seafoods and shellfish growing databases have beencompiled by the controlling authority which define products and processes of every establishment inthat sector. In other sectors e.g. egg, fruit, vegetable, sprout and smallgoods no such database exists.
A database is an essential first step in managing food safety within a sector and especially in thosesectors identified as high risk, such as smallgoods. If a controlling authority is unaware of anoperation and its processes it can only manage reactively. For example, in recent years at least twomanufacturers of Uncooked, Comminuted Fermented Meat (UCFM) within the State have operatedoutside the Food Standards Code.
Without up-to-date information on products and processes it is also not possible to complete a riskprofile which has anything other than generalized conclusions. This factor has limited the presentreport to a qualitative profiling approach to processing of vegetables, fruits, sprouts and somesmallgoods.
5.5 Lack of resourcesAs is clear from Table 4.1 the Food Act 2003 operates over large swathes of the agri-food-retailcontinuum which has significant resource implications for local government.
5.6 Fragmentation of food safety managementAt present the State has 33 food authorities located at 29 councils, MHS, DHHS and TDIA. While adegree of integration exists by the good offices of individuals within certain entities and by the FoodSafety Forum, nonetheless day-to-day operation of food safety management within Tasmania isfragmented.

14
6 Red meat
6.1 RegulationAll plants are regulated under the Meat Hygiene Act 1985 which, from the food safety viewpoints,mandates Quality Assurance (QA) plans which are based on Hazard Analysis Critical Control Point(HACCP). The Act is administered by MHS.
6.2 PracticeMHS is responsible for 26 licensed meat premises, of which the three larger were previously classedas “domestic abattoirs”. Around 23 very small premises (VSPs, formerly known as“slaughterhouses”) are located Statewide and on King and Flinders Islands. Since 1996, MHS hassupported the uptake of QA/HACCP systems in slaughterhouses:• Implementation of workshops to explain the concept• Provision of one-on-one advice to support successful desk audit of the system• Routine audit by trained auditors, of whom four are registered by the Quality Society of
Australasia (QSA); the branch has one Lead Auditor.MHS oversees red meat production from domestic slaughtering premises in the State. Production ispresented in Tables 6.1 and 6.2 from which it can be seen that, in recent years, the proportion ofproduct from VSPs has increased to almost 40% of that produced by domestic abattoirs so that, in2003, domestic meat premises produced 225,000 and 520,000 units, respectively.
Beef and sheep/lamb carcases form the vast bulk of production, with domestic abattoirs producing43,000 beef and 435,000 sheep carcases in 2003, compared with 19,000 and 189,000, respectively,from VSPs. Abattoirs and VSPs produced 41,000 and 15,000 pig carcases, respectively, with theremainder of production coming from deer and goats.
Since meat from export plants is also sold on the local market, data from export establishments isincluded in Table 6.3. It is estimated that 10% of meat from export establishments enters the localmarket.
Table 6.1: Slaughter numbers from domestic abattoirs (1996-2003)
Cattle Calves Sheep Lambs Pigs Goats Deer Other Total1996 500800 25735 314847 304860 76113 271 464 39 12231291997 45873 32083 318432 347851 76250 1 154 145 8207891998 44408 35161 270542 355881 75941 16 370 0 7823191999 39332 35944 308485 337123 74611 36 226 0 7957572000 30556 27391 355114 341171 59487 109 285 0 8141132001 25419 18842 198669 267747 53119 42 147 0 5639852002 22464 9582 66555 187138 38573 4 0 0 3243162003 27385 15991 206738 228099 41540 0 2 0 519755
Table 6.2: Slaughter numbers from slaughterhouses (1996-2003)
Cattle Calves Sheep Lambs Pigs Goats Deer Other Total1996 6632 2141 44133 5685 2517 448 2983 248 647871997 8593 1991 69068 5869 2837 474 2256 801 918891998 9148 1203 65445 9391 3108 422 2399 85 912011999 7719 825 112570 15791 3557 79 991 793 1423252000 6774 2704 114829 13077 3532 165 595 0 1416762001 5294 552 84546 14454 3654 159 939 232 1098302002 10649 832 75060 53361 11595 164 883 9 1525532003 16721 2395 122520 65603 15581 400 1662 996 225878
15
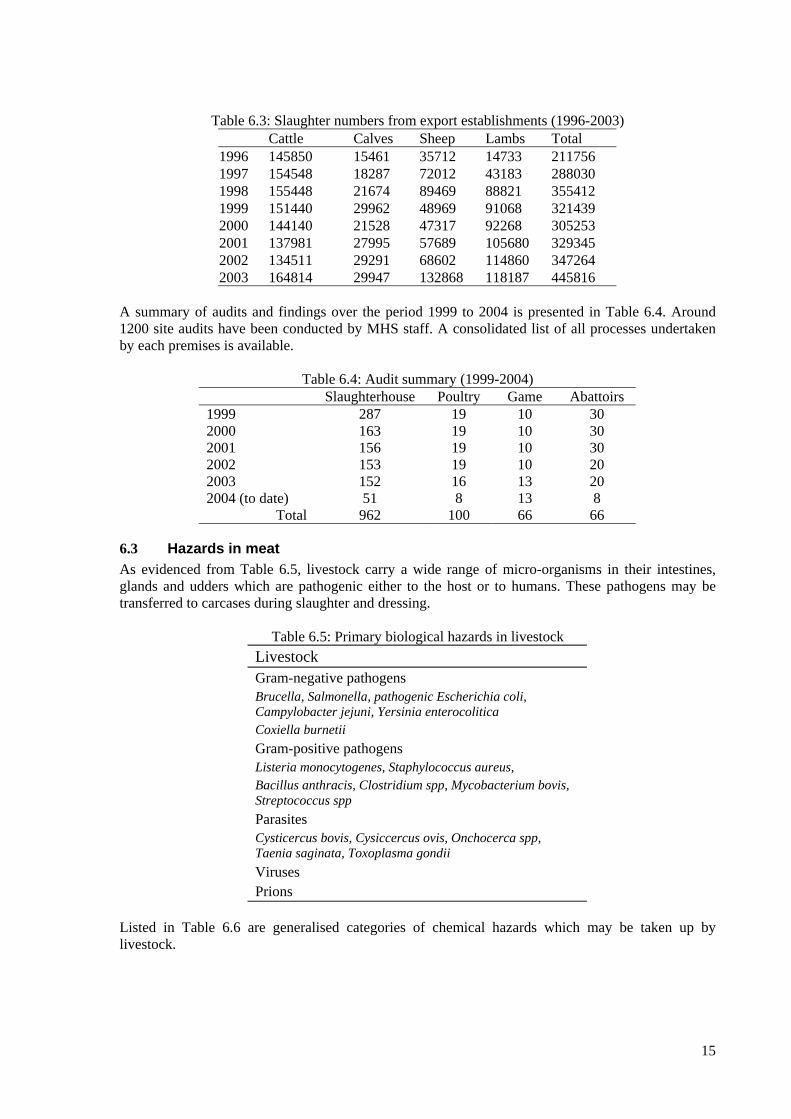
Table 6.3: Slaughter numbers from export establishments (1996-2003)Cattle Calves Sheep Lambs Total
1996 145850 15461 35712 14733 2117561997 154548 18287 72012 43183 2880301998 155448 21674 89469 88821 3554121999 151440 29962 48969 91068 3214392000 144140 21528 47317 92268 3052532001 137981 27995 57689 105680 3293452002 134511 29291 68602 114860 3472642003 164814 29947 132868 118187 445816
A summary of audits and findings over the period 1999 to 2004 is presented in Table 6.4. Around1200 site audits have been conducted by MHS staff. A consolidated list of all processes undertakenby each premises is available.
Table 6.4: Audit summary (1999-2004)Slaughterhouse Poultry Game Abattoirs
1999 287 19 10 302000 163 19 10 302001 156 19 10 302002 153 19 10 202003 152 16 13 202004 (to date) 51 8 13 8
Total 962 100 66 66
6.3 Hazards in meat As evidenced from Table 6.5, livestock carry a wide range of micro-organisms in their intestines,glands and udders which are pathogenic either to the host or to humans. These pathogens may betransferred to carcases during slaughter and dressing.
Table 6.5: Primary biological hazards in livestock Livestock Gram-negative pathogens Brucella, Salmonella, pathogenic Escherichia coli,Campylobacter jejuni, Yersinia enterocolitica Coxiella burnetii Gram-positive pathogens Listeria monocytogenes, Staphylococcus aureus, Bacillus anthracis, Clostridium spp, Mycobacterium bovis,Streptococcus spp Parasites Cysticercus bovis, Cysiccercus ovis, Onchocerca spp,Taenia saginata, Toxoplasma gondii Viruses Prions
Listed in Table 6.6 are generalised categories of chemical hazards which may be taken up bylivestock.

16
Table 6.6: Primary chemical hazards in livestock Livestock
Agricultural and veterinary chemical residues Environmental contaminants Cadmium and heavy metals
6.4 Illness associated with meat and meat productsMeatborne outbreaks in Australia during the period 1990-2002, due primarily to the manufacturingprocess, indicate salmonellae as the most common cause (Table 6.7).
Table 6.7: Meat-borne outbreaks associated with the processing sector in Australia 1990-2002(Sumner et al. in press)
Year Product Hazard Cases (deaths)1994 Pork sausage S. Enteritidis 141996 Unknown* E. coli O157 61996 Meat rolls S. Typhimurium PT 135 711996 Cold roast meat C. perfringens 331997 Unknown* S. Typhimurium PT 43 7 (1?)1997 Unknown* S. Chester 252000 Asian food S. Typhimurium RDNC 62000 Asian food S. Typhimurium PT 44 11* Meat was the suspected vehicle
Table 6.8: Meatborne outbreaks in Australia in the food service sector in 1991-2002 (Sumner et al. inpress)
Year Product Hazard1995 Roast pork S. Typhimurium PT91999 Pork C. perfringens1993 Roast beef or pork C. perfringens1991 Curry and rice C. perfringens1994 Spit roast C. perfringens1997 Curry & rice C. perfringens/S. Typhimurium PT 1351997 Roast lamb C. perfringens1997 Pork Rolls S. Typhimurium PT 11999 Pan rolls S. Hessarek1999 Roast lamb Viral2000 Thai beef salad Salmonella2000 Lamb curry C. perfringens2000 Roast beef or pork C. perfringens1998 Steak roll Unknown1997 Pork rolls S. Typhimurium PT 11996 Meat rolls S. Typhimurium PT 1351993 Roasted, minced beef C. perfringens1997 Beef casserole C. perfringens1999 Meat pie C. perfringens1999 Pizza E. coli O1572001 Kebabs Salmonella2001 Eye fillet meal S. Typhimurium PT 992001 Lambs fry S. Typhimurium PT 992001 Beef curry C. perfringens2001 Reef and Beef meal C. perfringens2002 Lamb curry C. perfringens2002 Spit roast beef and/or pork C. perfringens
17
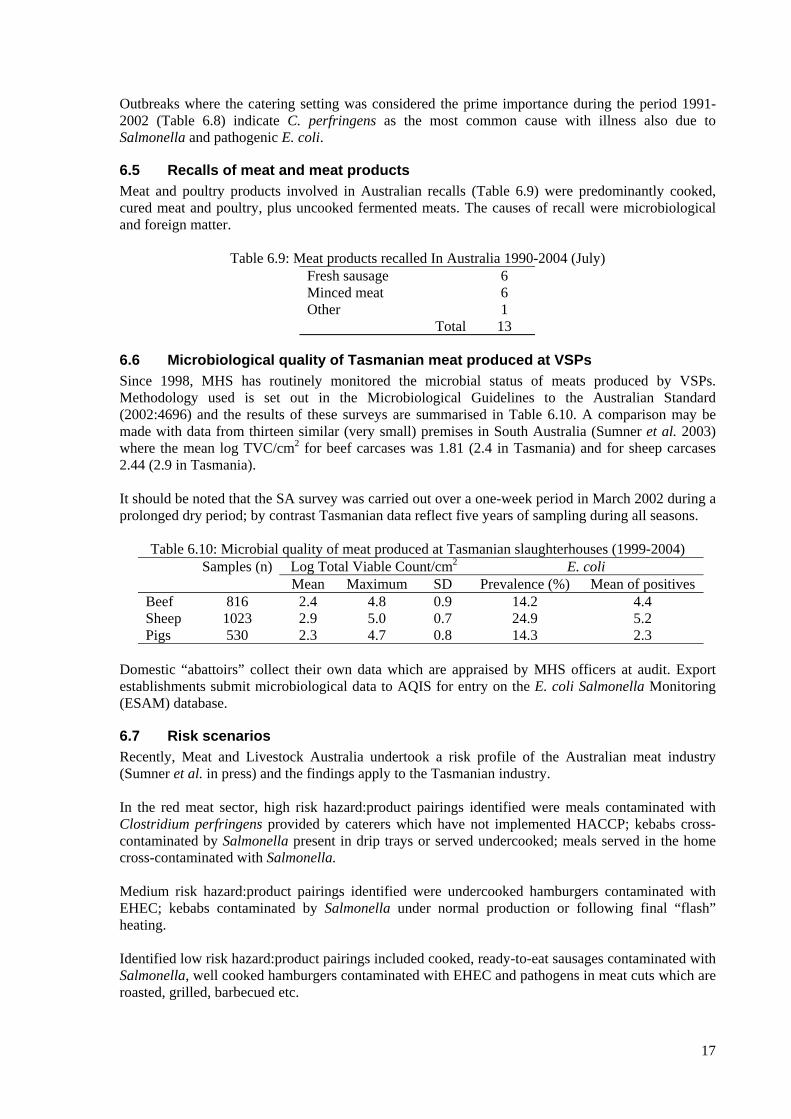
Outbreaks where the catering setting was considered the prime importance during the period 1991-2002 (Table 6.8) indicate C. perfringens as the most common cause with illness also due toSalmonella and pathogenic E. coli.
6.5 Recalls of meat and meat products Meat and poultry products involved in Australian recalls (Table 6.9) were predominantly cooked,cured meat and poultry, plus uncooked fermented meats. The causes of recall were microbiologicaland foreign matter.
Table 6.9: Meat products recalled In Australia 1990-2004 (July) Fresh sausage 6 Minced meat 6 Other 1
Total 13
6.6 Microbiological quality of Tasmanian meat produced at VSPsSince 1998, MHS has routinely monitored the microbial status of meats produced by VSPs.Methodology used is set out in the Microbiological Guidelines to the Australian Standard(2002:4696) and the results of these surveys are summarised in Table 6.10. A comparison may bemade with data from thirteen similar (very small) premises in South Australia (Sumner et al. 2003)where the mean log TVC/cm2 for beef carcases was 1.81 (2.4 in Tasmania) and for sheep carcases2.44 (2.9 in Tasmania).
It should be noted that the SA survey was carried out over a one-week period in March 2002 during aprolonged dry period; by contrast Tasmanian data reflect five years of sampling during all seasons.
Table 6.10: Microbial quality of meat produced at Tasmanian slaughterhouses (1999-2004)Samples (n) Log Total Viable Count/cm2 E. coli
Mean Maximum SD Prevalence (%) Mean of positivesBeef 816 2.4 4.8 0.9 14.2 4.4Sheep 1023 2.9 5.0 0.7 24.9 5.2Pigs 530 2.3 4.7 0.8 14.3 2.3
Domestic “abattoirs” collect their own data which are appraised by MHS officers at audit. Exportestablishments submit microbiological data to AQIS for entry on the E. coli Salmonella Monitoring(ESAM) database.
6.7 Risk scenariosRecently, Meat and Livestock Australia undertook a risk profile of the Australian meat industry(Sumner et al. in press) and the findings apply to the Tasmanian industry.
In the red meat sector, high risk hazard:product pairings identified were meals contaminated withClostridium perfringens provided by caterers which have not implemented HACCP; kebabs cross-contaminated by Salmonella present in drip trays or served undercooked; meals served in the homecross-contaminated with Salmonella.
Medium risk hazard:product pairings identified were undercooked hamburgers contaminated withEHEC; kebabs contaminated by Salmonella under normal production or following final “flash”heating.
Identified low risk hazard:product pairings included cooked, ready-to-eat sausages contaminated withSalmonella, well cooked hamburgers contaminated with EHEC and pathogens in meat cuts which areroasted, grilled, barbecued etc.

18
6.8 Issues surrounding the red meat industryIn view of the overall compliance of companies and the industry in general with the MicrobiologicalGuidelines which accompany the Australian Standard for the Hygienic Production andTransportation of Meat and Meat Products for Human Consumption (AS 2002:4696) it isrecommended that MHS:1. Undertake microbiological product testing of carcases from VSPs on an annual basis (note that
other states e.g. Queensland have an annual testing regime).2. Maintain responsibility for taking samples via officers taking samples (if testing could be linked
with audit this would be most cost-effective for MHS and companies).3. Arrange for analysis of samples at an authorised laboratory.4. Maintain the database on a company and industry basis.5. Continue a proactive stance with companies regarding their testing results.6. Concentrate testing more towards carcase hygiene rather than surface testing.

19
7 Smallgoods
7.1 RegulationSmallgoods manufacturers are regulated under the Food Standards Code (Standard 3.2.1) by localauthorities. Production at plants with an integrated slaughter/smallgoods facility are regulated byMHS under the Meat Hygiene Act 1985 which defers to the Australian Standard for the HygienicProduction and Transportation of Meat and Meat Products for Human Consumption (AS2002:4696).
7.2 PracticeNo consolidated list exists which identifies the State’s smallgoods manufacturers, their products orthe processes used. It is thought that there are around six smallgoods manufacturers in the State and,currently, all are regulated by local government. It is not known whether manufacturers operate to theAustralian Standard or the Food Standards Code. Those manufacturers which service the majorsupermarket chains are audited by third-party auditors. As part of regulatory requirements under theFood Act 2003, they are also inspected at intervals by EHOs.
In addition to the main manufacturers smallgoods are processed by most, if not all, retail butchershops in the State. It is estimated that there are around 130 butcher shops (Eric Johnson, pers.comm.). No consolidated list of manufacturers, products or processes is available. It is believed thatuncooked, comminuted fermented meats (UCFM) are not produced by retail butchers.
7.3 Illness associated with smallgoodsThe vast majority of outbreaks and illnesses have stemmed from fermented meats, with Salmonellaand pathogenic E. coli the causes (Table 7.1). Thus, in Australia over the last decade, there have beenalmost 400 cases of foodborne illness involving smallgoods that were of sufficient severity to requiremedical treatment; there were at least three deaths from consumption of contaminated meat.
Table 7.1: Meat-borne outbreaks associated with the processing sector in Australia 1990-2002(Sumner et al. in press)
Year Product Hazard Cases (deaths)1991 Salami S. Anatum >1201992 Salami S. Typhimurium >201995 Salami E. coli O111 >150 (1)1997 Cured, cooked meat S. Muenchen 24 (2)1997 Cured, cooked meats S. Anatum 251997 Unknown* S. Chester 252000 Sucuk (fermented sausage) S. Typhimurium PT 170 62001 Fermented sausage (home-made) S. Typhimurium PT 135a 32002 Uncooked fermented meat (cacciatore) E. coli O157 1* Meat was the suspected vehicle
In the food service sector there have been two outbreaks during the period 1991-2002 associatedwith smallgoods (Table 7.2).
Table 7.2: Reported meat and meat-associated outbreaks in Australia in the food service sector in1991-2002 (Sumner et al. in press)
Year Product Hazard1998 Ham Sh. sonnei biotype G2000 Frankfurters S. Typhimurium PT 9

20
7.4 Recalls of smallgoodsIn Australia, there have been a total of 48 recalls of smallgoods during the period 1990-July, 2004.Around 50% of recalls were for cooked, cured meats contaminated with E. coli, while most of the 19recalls for UCFM were associated with the 1995 Mettwurst incident.
Table 7.3: Meat and poultry products recalled In Australia 1990-2004 (July) Bacon 1 Cooked and cured meat 26 Fermented sausages 19 Slow cured meat 1 Pâté 1
Total 48
7.5 Risk scenariosThe National Risk Validation Project identified fermented and manufactured meats as high-riskproducts, requiring mandatory Food Safety Plans (FSPs) for their manufacture. Other States arecurrently implementing uptake of FSPs for retail butcher shops.
Recently, Meat and Livestock Australia undertook a risk profile of processed meats. No high riskhazard:product pairings were identified.
Medium risk hazard:product pairings identified were ready-to-eat meats contaminated with Listeriamonocytogenes and which have extended shelf life, Uncooked Comminuted Fermented Meat(UCFM)/Salami contaminated with Enterohaemorrhagic E. coli (EHEC) and Salmonella;
Identified low risk hazard:product pairings included UCFM/Salami contaminated with Listeriamonocytogenes.
In the Tasmanian context, two scenarios are developed for the present study based on a smallgoodsmanufacturer making UCFM with a process which has not been validated by the controllingauthority. Since 1996 it has been necessary to file a process for UCFM manufacture forapproval/verification by the controlling authority; in some cases processes have been referred to aFSANZ expert panel for advice. The primary criterion for acceptance of a process was the perceivedability to reduce the level of generic E. coli in the UCFM batter by 99.9% (3-log reduction).
More recently, Clause 9 of Standard 1.6.2 of the Food Standards Code was implemented in whichmanufacturers are required to develop a protocol of assessment which must include the followingcontrol parameters:
• use of starter culture and starter culture specifications• pH monitoring and nature of monitoring• fermentation time and temperature• maturation time and temperature• water activity or weight loss• temperature of meat storage• monitoring of E. coli in raw materials• monitoring of E. coli in final products• review of previous history/records
Thus, manufacture of UCFM is a highly-regulated operation in which manufacturer and controllingauthority (and their auditing agents) are required to have competence in a range of process hygienedisciplines (e.g. the effect of temperature, time, water activity and pH on inactivation of Gram-negative pathogens). Assistance is provided by recourse to the FSANZ expert panel and byinformation in Guidelines for the safe manufacture of smallgoods (pub MLA).

21
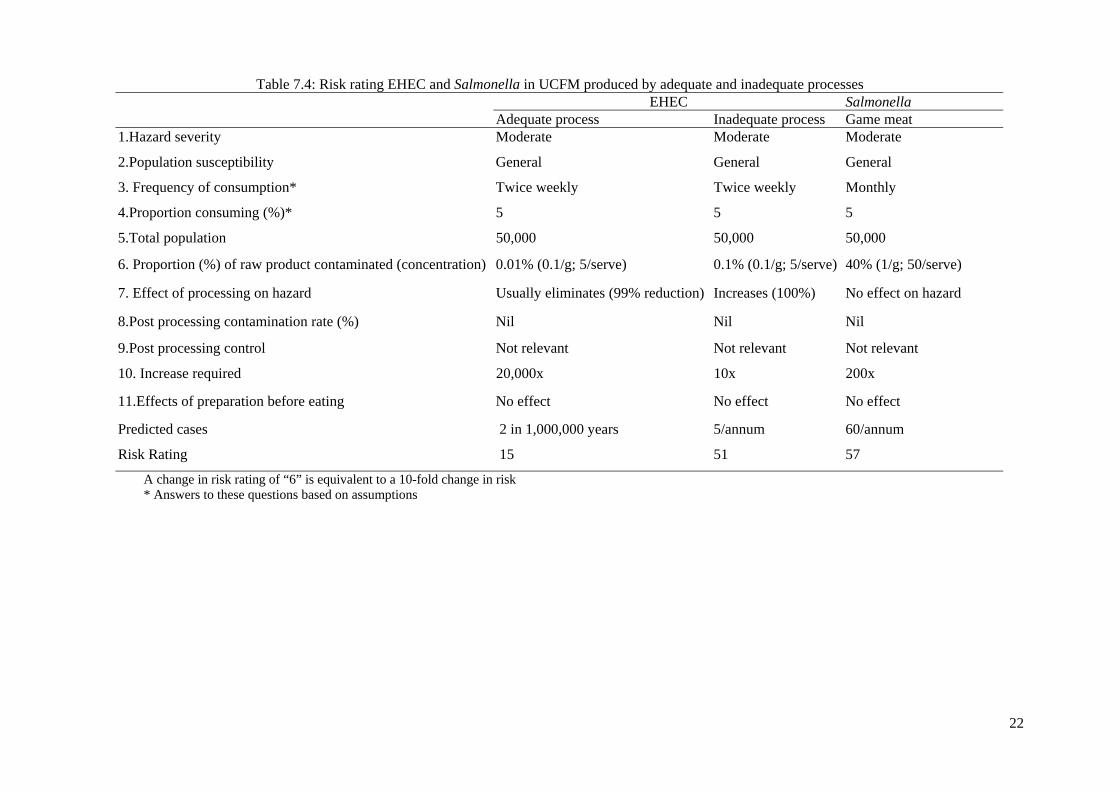
Scenario 1: Enterohaemorrhagic E. coli (EHEC) in UCFMIn this scenario comparison is made between UCFM made by a process which is adequate and onewhich is not, the latter operating in breach of Standard 1.6.2. Risk Ranger outputs are summarized inTable 7.4 (see Appendix 1.1 for details of inputs to Risk Ranger).
The risk rating for an adequate process is 15 with illnesses predicted only rarely. An inadequateprocess, however, rates 51 (1,000,000-fold increase in risk with 5 cases of EHEC per annum). Thedifference in inputs is in the ability of the process to inactivate EHEC, possibly by not having correctstarter cultures which allows the hazard to increase. No other “negative” aspects are included fromthis scenario of a manufacturer processing in breach of Standard 1.6.2.
Scenario 2: Salmonella in UCFM made from game meatIn this scenario UCFM is made from game meat trimmings (venison and wallaby) by a manufacturerwho does not operate Standard 1.6.2. While there are no published data on prevalence andconcentration, data from South Australia (Department of Health) indicates that kangaroo trim mayhave Salmonella at 40% prevalence.
The risk rating for UCFM manufacture using an inadequate process from game meat is 57 with anestimated 60 illnesses per annum (Table 7.4).
7.6 Issues surrounding the smallgoods industryThe present situation where legislative responsibility is decided by whether there is a slaughterfacility linked with a smallgoods manufacture could lead to inconsistency and there is a need for:1. DHHS/LG and DPIWE to consider regularising responsibility for managing the smallgoods
sector in Tasmania either under the Australian Meat Standard or the Food Standards Code; thisneed will become more acute when more than 100 butcher shops are required to implement FSPs
2. Production of a consolidated list of smallgoods manufacturers, their products and processes withspecial reference to manufacturers of UCFM.
3. A uniform approach to managing food safety risks in the sector based on scheduled andunscheduled audit of the FSP by auditors registered with QSA.
4. A proactive approach to the sector involving training based on MLA’s Guidelines for the safemanufacture of smallgoods.
5. Assessment of the degree to which each manufacturer’s processes have been validated. A GoldStandard approach similar to that implemented by PIRSA would be an effective modus operandi.
22
Table 7.4: Risk rating EHEC and Salmonella in UCFM produced by adequate and inadequate processesEHEC Salmonella
Adequate process Inadequate process Game meat1.Hazard severity Moderate Moderate Moderate
2.Population susceptibility General General General
3. Frequency of consumption* Twice weekly Twice weekly Monthly
4.Proportion consuming (%)* 5 5 5
5.Total population 50,000 50,000 50,000
6. Proportion (%) of raw product contaminated (concentration) 0.01% (0.1/g; 5/serve) 0.1% (0.1/g; 5/serve) 40% (1/g; 50/serve)
7. Effect of processing on hazard Usually eliminates (99% reduction) Increases (100%) No effect on hazard
8.Post processing contamination rate (%) Nil Nil Nil
9.Post processing control Not relevant Not relevant Not relevant
10. Increase required 20,000x 10x 200x
11.Effects of preparation before eating No effect No effect No effect
Predicted cases 2 in 1,000,000 years 5/annum 60/annum
Risk Rating 15 51 57
A change in risk rating of “6” is equivalent to a 10-fold change in risk* Answers to these questions based on assumptions

23
8 Game meat
8.1 RegulationGame meat establishments are regulated under the Meat Hygiene Act 1985 and operate in accordancewith the Australian Standard for Hygienic Production of Game Meat for Human Consumption (AS4464:1997). The Standard mandates Quality Assurance (QA) plans which are HACCP-based andCodex-compliant. The Act is administered by MHS.
8.2 PracticeMHS regulates some 13 game premises located statewide including on King, Flinders, Trefoil andGreat Dog Islands, of which eight premises process exclusively muttonbirds. A consolidated list isavailable of processors, products and processes.
Production of game meats (excluding mutton birds) is summarised in Table 8.1 and is based onslaughter of wallaby, possum, rabbit/hare and wild turkey.
Table 8.1: Production of game meats in Tasmania (1996-2003)Production (kg)
1996 696171997 580551998 509741999 679992000 616422001 636542002 675122003 86018
MHS regulates the game meat industry by audit of plant-operated systems which are based onQA/HACCP concepts. Over the period 1999-2004 some 66 audits have been undertaken of theindustry.
MHS undertakes routine sampling of game meats for microbiological analysis for which summarydata are presented in Table 8.2. For deer and wallaby carcases the mean TVC was log 2-3; E. coliwere detected on 3-20.5% of carcases.
Table 8.2: Summary statistics for game meat carcases processed at very small plants and at gamemeat establishments (1999-2004)
Samples (n) Log Total Viable Count/cm2 E. coliMean Maximum SD Prevalence (%) Mean of positives
Very small plantsDeer* 73 2.0 3.5 0.9 20.5 0.8Wallaby 44 2.3 4.3 1.0 13.6 1.0Game meat establishmentsWallaby** 35 2.9 4.5 0.9 3 1
* All deer are farmed, hence, not classed as ‘game’ in Tasmania. Culling feral deer for humanconsumption is currently not permitted by DPIWE’s Nature Conservation Branch.** Also contain data for rabbit, goat and possum
In 2004, regulation of mutton birds passed to MHS. An initial survey of mutton bird processorsindicates all are in compliance with the Australian Standards for either game meat or poultry, asappropriate.
24
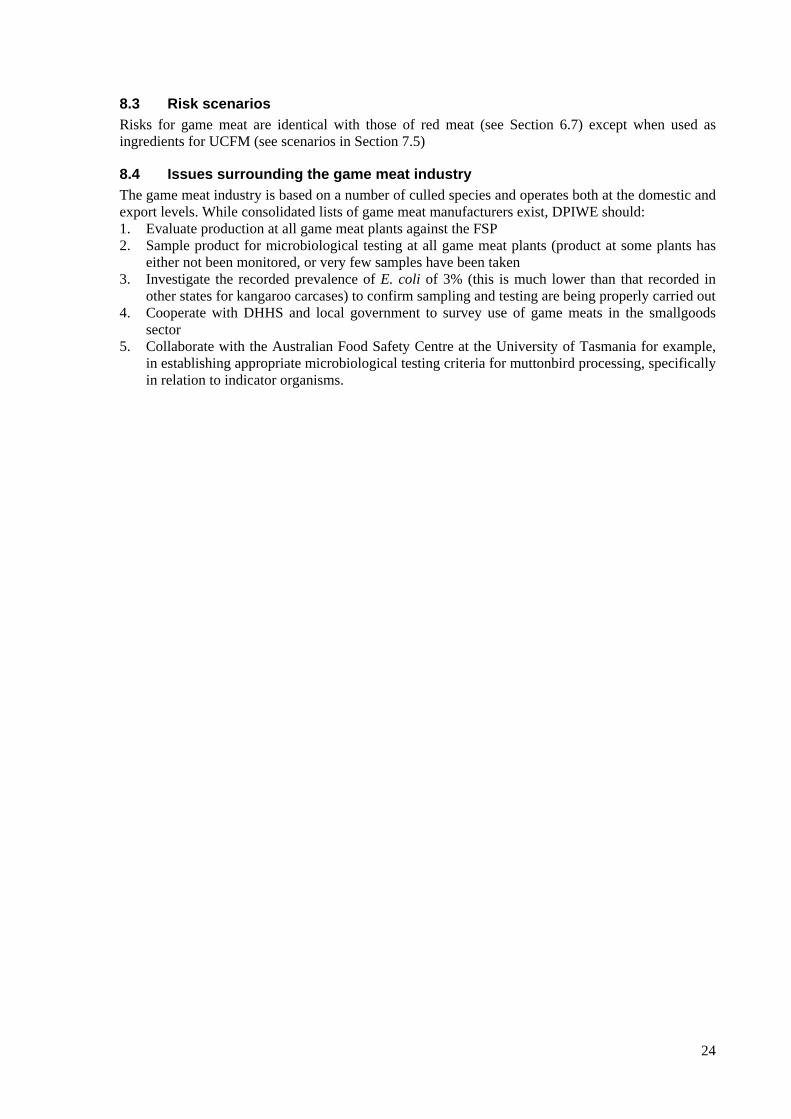
8.3 Risk scenariosRisks for game meat are identical with those of red meat (see Section 6.7) except when used asingredients for UCFM (see scenarios in Section 7.5)
8.4 Issues surrounding the game meat industryThe game meat industry is based on a number of culled species and operates both at the domestic andexport levels. While consolidated lists of game meat manufacturers exist, DPIWE should:1. Evaluate production at all game meat plants against the FSP2. Sample product for microbiological testing at all game meat plants (product at some plants has
either not been monitored, or very few samples have been taken3. Investigate the recorded prevalence of E. coli of 3% (this is much lower than that recorded in
other states for kangaroo carcases) to confirm sampling and testing are being properly carried out4. Cooperate with DHHS and local government to survey use of game meats in the smallgoods
sector5. Collaborate with the Australian Food Safety Centre at the University of Tasmania for example,
in establishing appropriate microbiological testing criteria for muttonbird processing, specificallyin relation to indicator organisms.

25
9 Poultry
9.1 RegulationPoultry processors are regulated under the Meat Hygiene Act 1985 and operate in accordance with theAustralian Standard for Construction of Premises and Hygienic Production of Poultry Meat forHuman Consumption (AS 4465:2001). The standard mandates Quality Assurance (QA) plans whichare based on the Hazard Analysis Critical Control Point (HACCP) concept. The Act is administeredby MHS.
Transport of poultry meat from processing plants to retail premises is covered by the Food Act 2003and is administered by DHHS/LG.
9.2 PracticeMHS regulates some five premises processing poultry meat. A consolidated list of processorsproducts and processes is available. As can be seen from Table 9.1, poultry meat production hasincreased in recent years so that almost 7 million birds are produced in the State annually. More than6 million chickens are processed by one national manufacturer, with the remainder also includingturkey and quail. All five plants process chickens, while one also processes turkeys and anotherprocesses quail.
Table 9.1: Production of poultry meat in Tasmania (1996-2003)Poultry (,000)
1996 51801997 49681998 36461999 57772000 54812001 45862002 62832003 6989
9.3 Illness associated with poultryIt is generally accepted that poultry is responsible for a large proportion of the salmonelloses andcampylobacterioses in Australia which annually amount to around 6,000 and 16,000 cases,respectively.
9.4 Recalls of poultryIn Australia during the period 1990-July, 2004 there were nine recalls of poultry products mainly forpresence of E. coli and of foreign matter.
9.5 Microbiological status of poultry carcases in TasmaniaA survey was carried out during 2001 of all five poultry processors of which all but one are classifiedas Very Small Premises (VSP) for the purposes of Meat Standards Committee poultry guidelines formicrobiological testing. The summary data (Table 9.2) indicate a mean log TVC of 2.70/cm2 with E.coli detected on 36/69 (44%) of carcases.
Table 9.2: Summary microbiological data of Tasmanian poultry meat (2001)
Samples Log TVC/cm2
Mean SD Minimum Maximumn=69 2.70 0.9 1.40 4.06
26
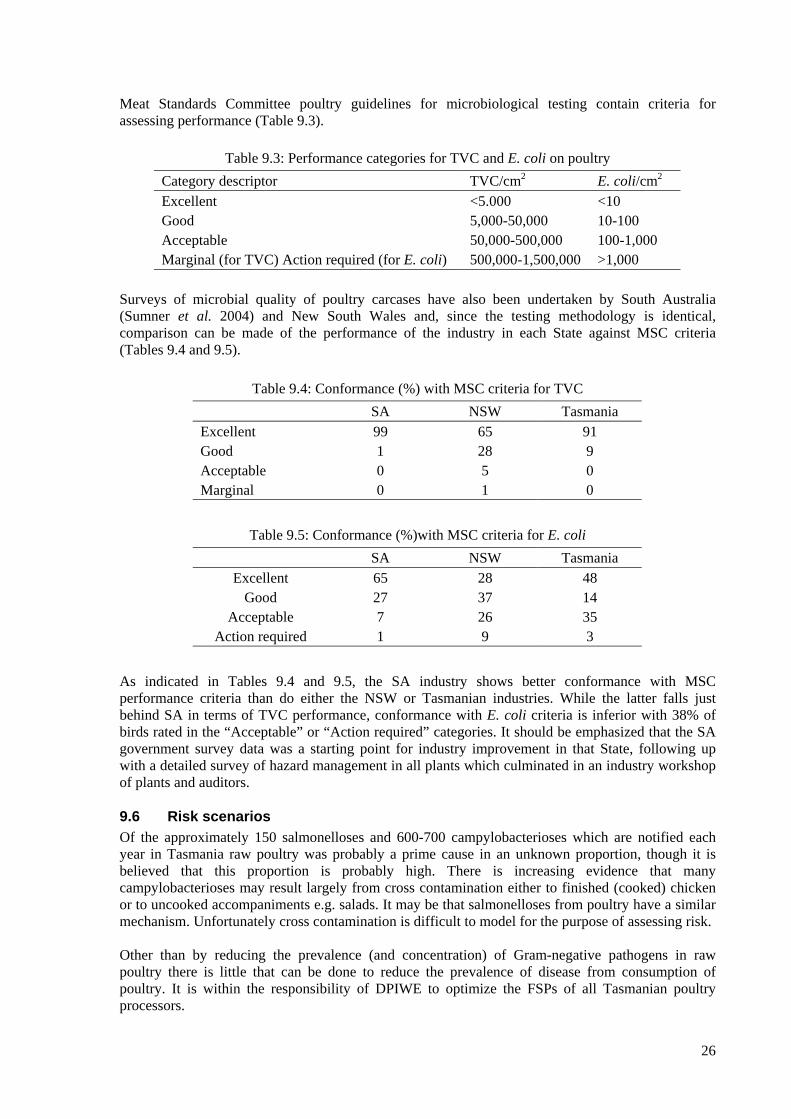
Meat Standards Committee poultry guidelines for microbiological testing contain criteria forassessing performance (Table 9.3).
Table 9.3: Performance categories for TVC and E. coli on poultryCategory descriptor TVC/cm2 E. coli/cm2
Excellent <5.000 <10Good 5,000-50,000 10-100Acceptable 50,000-500,000 100-1,000Marginal (for TVC) Action required (for E. coli) 500,000-1,500,000 >1,000
Surveys of microbial quality of poultry carcases have also been undertaken by South Australia(Sumner et al. 2004) and New South Wales and, since the testing methodology is identical,comparison can be made of the performance of the industry in each State against MSC criteria(Tables 9.4 and 9.5).
Table 9.4: Conformance (%) with MSC criteria for TVCSA NSW Tasmania
Excellent 99 65 91Good 1 28 9Acceptable 0 5 0Marginal 0 1 0
Table 9.5: Conformance (%)with MSC criteria for E. coliSA NSW Tasmania
Excellent 65 28 48Good 27 37 14
Acceptable 7 26 35Action required 1 9 3
As indicated in Tables 9.4 and 9.5, the SA industry shows better conformance with MSCperformance criteria than do either the NSW or Tasmanian industries. While the latter falls justbehind SA in terms of TVC performance, conformance with E. coli criteria is inferior with 38% ofbirds rated in the “Acceptable” or “Action required” categories. It should be emphasized that the SAgovernment survey data was a starting point for industry improvement in that State, following upwith a detailed survey of hazard management in all plants which culminated in an industry workshopof plants and auditors.
9.6 Risk scenariosOf the approximately 150 salmonelloses and 600-700 campylobacterioses which are notified eachyear in Tasmania raw poultry was probably a prime cause in an unknown proportion, though it isbelieved that this proportion is probably high. There is increasing evidence that manycampylobacterioses may result largely from cross contamination either to finished (cooked) chickenor to uncooked accompaniments e.g. salads. It may be that salmonelloses from poultry have a similarmechanism. Unfortunately cross contamination is difficult to model for the purpose of assessing risk.
Other than by reducing the prevalence (and concentration) of Gram-negative pathogens in rawpoultry there is little that can be done to reduce the prevalence of disease from consumption ofpoultry. It is within the responsibility of DPIWE to optimize the FSPs of all Tasmanian poultryprocessors.
27
It is believed that South Australia will begin, in late-2004, a radical initiative to reduce prevalence ofpathogens on raw poultry. It may be that, by being a partner in this initiative, DPIWE can have a realeffect on the burden of disease from poultry.
9.7 Issues surrounding the poultry industryWhile a consolidated list of poultry processors exists, DPIWE should:1. Ensure the list is comprehensive and contains all very small poultry plants2. Evaluate the food safety management of all processors against a Gold Standard, similar to that
undertaken by PIRSA3. Adopt a proactive stance towards industry improvement4. Undertake systematic microbiological monitoring of product from all processors (a survey of 69
samples in 2001 is the sole industry database)5. Work proactively with initiatives in other States to radically reduce the prevalence of
Campylobacter and Salmonella in poultry
28
10 Eggs
10.1 RegulationFrom 2004, egg processors are regulated under the Egg Industry Act 2002. The Act is administeredby MHS. Transportation and retailing of eggs are regulated by DHHS/LG.
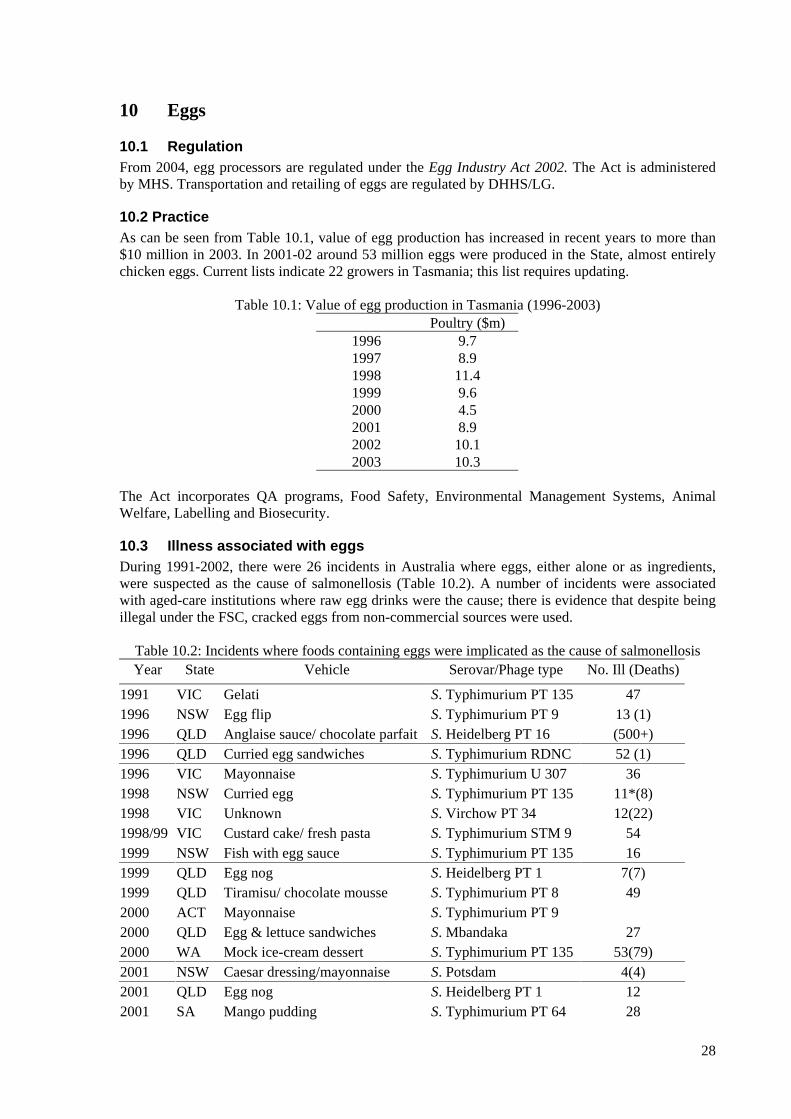
10.2 PracticeAs can be seen from Table 10.1, value of egg production has increased in recent years to more than$10 million in 2003. In 2001-02 around 53 million eggs were produced in the State, almost entirelychicken eggs. Current lists indicate 22 growers in Tasmania; this list requires updating.
Table 10.1: Value of egg production in Tasmania (1996-2003)Poultry ($m)
1996 9.71997 8.91998 11.41999 9.62000 4.52001 8.92002 10.12003 10.3
The Act incorporates QA programs, Food Safety, Environmental Management Systems, AnimalWelfare, Labelling and Biosecurity.
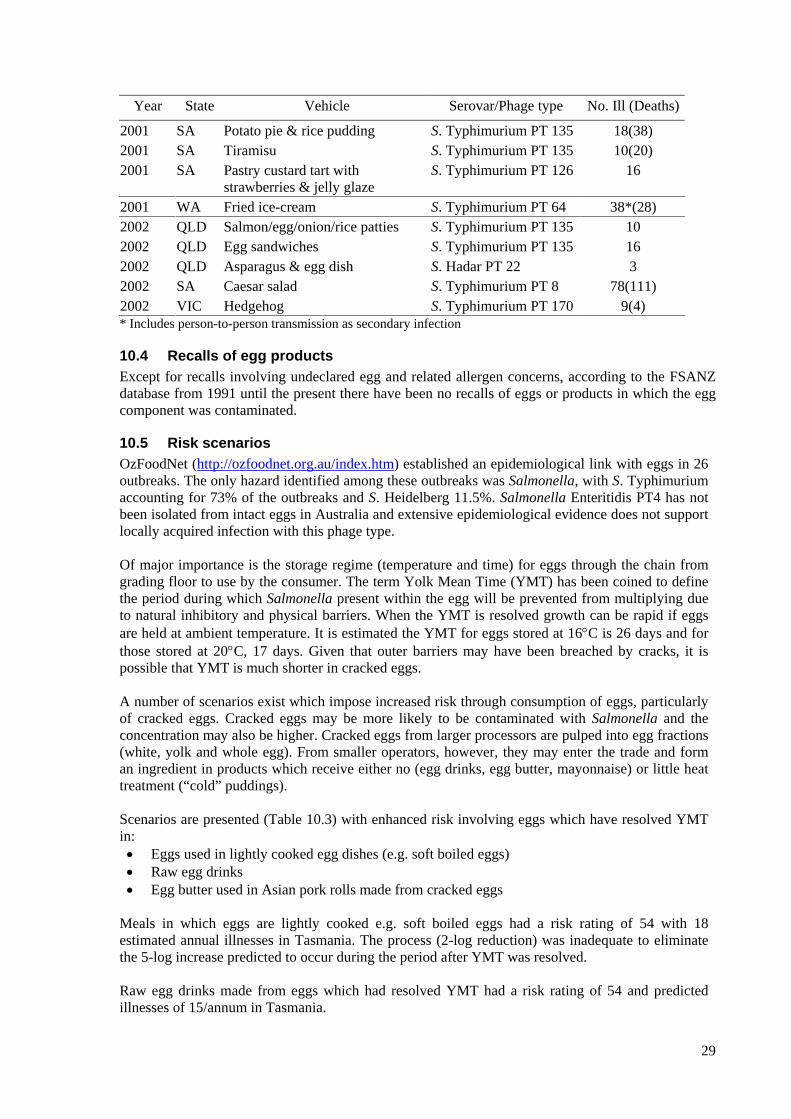
10.3 Illness associated with eggsDuring 1991-2002, there were 26 incidents in Australia where eggs, either alone or as ingredients,were suspected as the cause of salmonellosis (Table 10.2). A number of incidents were associatedwith aged-care institutions where raw egg drinks were the cause; there is evidence that despite beingillegal under the FSC, cracked eggs from non-commercial sources were used.
Table 10.2: Incidents where foods containing eggs were implicated as the cause of salmonellosisYear State Vehicle Serovar/Phage type No. Ill (Deaths)
1991 VIC Gelati S. Typhimurium PT 135 471996 NSW Egg flip S. Typhimurium PT 9 13 (1)1996 QLD Anglaise sauce/ chocolate parfait S. Heidelberg PT 16 (500+)1996 QLD Curried egg sandwiches S. Typhimurium RDNC 52 (1)1996 VIC Mayonnaise S. Typhimurium U 307 361998 NSW Curried egg S. Typhimurium PT 135 11*(8)1998 VIC Unknown S. Virchow PT 34 12(22)1998/99 VIC Custard cake/ fresh pasta S. Typhimurium STM 9 541999 NSW Fish with egg sauce S. Typhimurium PT 135 161999 QLD Egg nog S. Heidelberg PT 1 7(7)1999 QLD Tiramisu/ chocolate mousse S. Typhimurium PT 8 492000 ACT Mayonnaise S. Typhimurium PT 92000 QLD Egg & lettuce sandwiches S. Mbandaka 272000 WA Mock ice-cream dessert S. Typhimurium PT 135 53(79)2001 NSW Caesar dressing/mayonnaise S. Potsdam 4(4)2001 QLD Egg nog S. Heidelberg PT 1 122001 SA Mango pudding S. Typhimurium PT 64 28
29
Year State Vehicle Serovar/Phage type No. Ill (Deaths)
2001 SA Potato pie & rice pudding S. Typhimurium PT 135 18(38)2001 SA Tiramisu S. Typhimurium PT 135 10(20)2001 SA Pastry custard tart with
strawberries & jelly glazeS. Typhimurium PT 126 16
2001 WA Fried ice-cream S. Typhimurium PT 64 38*(28)2002 QLD Salmon/egg/onion/rice patties S. Typhimurium PT 135 102002 QLD Egg sandwiches S. Typhimurium PT 135 162002 QLD Asparagus & egg dish S. Hadar PT 22 32002 SA Caesar salad S. Typhimurium PT 8 78(111)2002 VIC Hedgehog S. Typhimurium PT 170 9(4)* Includes person-to-person transmission as secondary infection
10.4 Recalls of egg productsExcept for recalls involving undeclared egg and related allergen concerns, according to the FSANZdatabase from 1991 until the present there have been no recalls of eggs or products in which the eggcomponent was contaminated.
10.5 Risk scenariosOzFoodNet (http://ozfoodnet.org.au/index.htm) established an epidemiological link with eggs in 26outbreaks. The only hazard identified among these outbreaks was Salmonella, with S. Typhimuriumaccounting for 73% of the outbreaks and S. Heidelberg 11.5%. Salmonella Enteritidis PT4 has notbeen isolated from intact eggs in Australia and extensive epidemiological evidence does not supportlocally acquired infection with this phage type.
Of major importance is the storage regime (temperature and time) for eggs through the chain fromgrading floor to use by the consumer. The term Yolk Mean Time (YMT) has been coined to definethe period during which Salmonella present within the egg will be prevented from multiplying dueto natural inhibitory and physical barriers. When the YMT is resolved growth can be rapid if eggsare held at ambient temperature. It is estimated the YMT for eggs stored at 16°C is 26 days and forthose stored at 20°C, 17 days. Given that outer barriers may have been breached by cracks, it ispossible that YMT is much shorter in cracked eggs.
A number of scenarios exist which impose increased risk through consumption of eggs, particularlyof cracked eggs. Cracked eggs may be more likely to be contaminated with Salmonella and theconcentration may also be higher. Cracked eggs from larger processors are pulped into egg fractions(white, yolk and whole egg). From smaller operators, however, they may enter the trade and forman ingredient in products which receive either no (egg drinks, egg butter, mayonnaise) or little heattreatment (“cold” puddings).
Scenarios are presented (Table 10.3) with enhanced risk involving eggs which have resolved YMTin:• Eggs used in lightly cooked egg dishes (e.g. soft boiled eggs)• Raw egg drinks• Egg butter used in Asian pork rolls made from cracked eggs
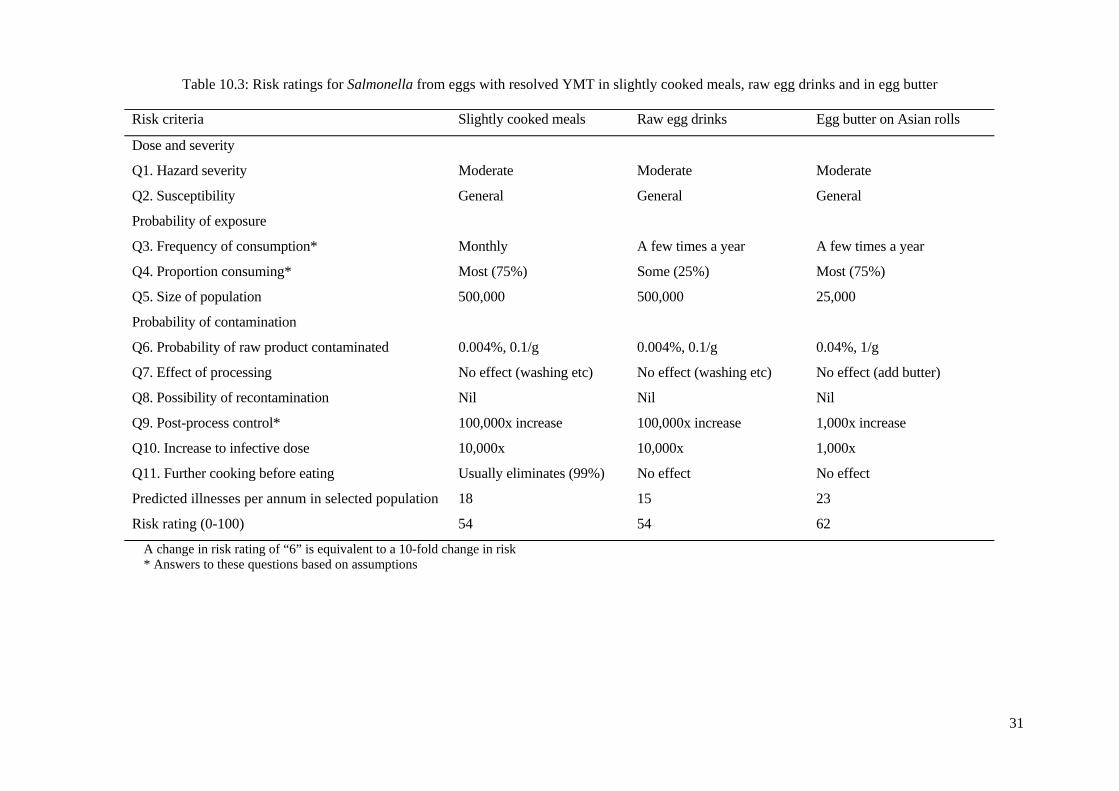
Meals in which eggs are lightly cooked e.g. soft boiled eggs had a risk rating of 54 with 18estimated annual illnesses in Tasmania. The process (2-log reduction) was inadequate to eliminatethe 5-log increase predicted to occur during the period after YMT was resolved.
Raw egg drinks made from eggs which had resolved YMT had a risk rating of 54 and predictedillnesses of 15/annum in Tasmania.
30
Egg butter in which cracked eggs were used (illegally) for Asian meat rolls had a risk rating of 62with 23 predicted illnesses each year in Tasmania.
More detail of inputs to Risk Ranger are given in Appendix 1.2.
10.6 Issues surrounding regulating the egg industryThere is a lack of knowledge of the Tasmanian egg industry and the following elements need urgentattention by DPIWE:1. Production of a consolidated list of producers and processors2. Assessment of each operation’s management of food safety against a Gold Standard3. Reconciliation of egg production with egg utilisation with special reference to small (non-
commercial) producers4. Estimation of cracked egg production and identification of any illegal use (i.e. eggs not
submitted for heat processing at a recognised establishment)5. Cooperation with DHHS and local government to prevent use of cracked eggs in retail and
catering, particularly for institutional care.6. Communication and collaboration with LG about the new Egg Act and respective roles and
functions.
31
Table 10.3: Risk ratings for Salmonella from eggs with resolved YMT in slightly cooked meals, raw egg drinks and in egg butter
Risk criteria Slightly cooked meals Raw egg drinks Egg butter on Asian rolls
Dose and severity
Q1. Hazard severity Moderate Moderate Moderate
Q2. Susceptibility General General General
Probability of exposure
Q3. Frequency of consumption* Monthly A few times a year A few times a year
Q4. Proportion consuming* Most (75%) Some (25%) Most (75%)
Q5. Size of population 500,000 500,000 25,000
Probability of contamination
Q6. Probability of raw product contaminated 0.004%, 0.1/g 0.004%, 0.1/g 0.04%, 1/g
Q7. Effect of processing No effect (washing etc) No effect (washing etc) No effect (add butter)
Q8. Possibility of recontamination Nil Nil Nil
Q9. Post-process control* 100,000x increase 100,000x increase 1,000x increase
Q10. Increase to infective dose 10,000x 10,000x 1,000x
Q11. Further cooking before eating Usually eliminates (99%) No effect No effect
Predicted illnesses per annum in selected population 18 15 23
Risk rating (0-100) 54 54 62
A change in risk rating of “6” is equivalent to a 10-fold change in risk* Answers to these questions based on assumptions

32
11 Dairy
11.1 Regulation of the industryThe industry is regulated by an autonomous body, the Tasmanian Diary Industry Authority (TDIA)under the Dairy Industry Act 1994. The legislation enables the TDIA to regulate the industry based onmodern food safety management practices including Codex-based HACCP systems and auditprotocols via second and third parties. Manufacture of ice cream and retailing of dairy products areregulated by DHHS/LG under the Food Act 2003.
11.2 PracticeThe Tasmanian dairy industry comprises:• 560 dairy farms (bovine)• 140,000 dairy cows• 120 tanker drivers• 100 vendors• 1 sheep milk farm• 8-9 goat milk producers• 28 processors
Around 600 million litres of milk are produced each year and processed as indicated in Table 11.1.
Table 11.1: Major dairy processors in TasmaniaCompany Volume (Lx106)Bonlac (Wynyard and Spreyton) 400Cadbury (Cooee) 70Lactos (Burnie) 70Classic Foods (Edith Creek) 35National Foods (Hobart) 35
The ambit of the TDIA extends from dairy farms to domestic and export processing via a range ofdocumented systems:• Tasmanian On Farm Food Safety (TOFFS)• TOFFS Audit Protocol• Tasmanian Code of Practice for Dairy Food Safety• Food Safety Plan Verification Report• Quality Systems for Tasmanian Dairy Factories• Quality Assurance Support Services• Code of Practice for Managing Dairy Farm Effluent
The audit system is operated by auditors registered with the Quality Society of Australasia (QSA) andcomplies with the AQIS Criteria for State Authorities Conducting Export Inspection.
The TDIA licenses milk and cream vendors, of which there are about 100 across the State and all ofwhom need to implement a FSP.
11.3 Illness from dairy products In Table 11.2 are listed outbreaks in which dairy products were the cause and, in Table 11.3 are listedrecalls of dairy products over the period 1990-July 2004. In all, in Australia there were 79 recalls ofdairy products, mainly involving cheese (31 recalls), liquid milk (19) and ice cream (15). Reasons for the recalls were microbiological in 70% cases, with foreign matter and chemicalcontamination making up the remainder (Table 11.4).

33
Table 11.2: Causes of dairy-borne outbreaks in Australia, 1996-2001
Organism State Cases Outbreaks Cause Salmonella Oranienberg SA 102 1 Gelati Salmonella Typhimurium PT 44 SA 11 1 Raw milk Campylobacter SA 12 1 Raw milk Cryptosporidium Qld 6 1 Raw milk (pet cow) Campylobacter (suspected) Vic 6 1 Raw milk (suspected)
Table11.3: Recalls of dairy products as monitored by FSANZ (1990-2004)
Product category Number of recalls Cheese 31 Butter 1 Cream 4 Milk 19 Yoghurt 5 Ice cream 15 Cream cheese 1 Custard 2 Milk powder 1
Total 79
Table 11.4: Causes of recalls of dairy products as monitored by FSANZ (1990-2004) Cause of recall Number
Contamination - detergent 5 Contamination - chemical 4 Foreign matter 13 Labelling 2 Spoilage 12 E. coli 13 L. monocytogenes 24 Salmonella 3 S. aureus 3
Total 79
11.4 Risk scenariosTwo risk scenarios are presented:• Salmonella in ice cream• Listeria monocytogenes in dips
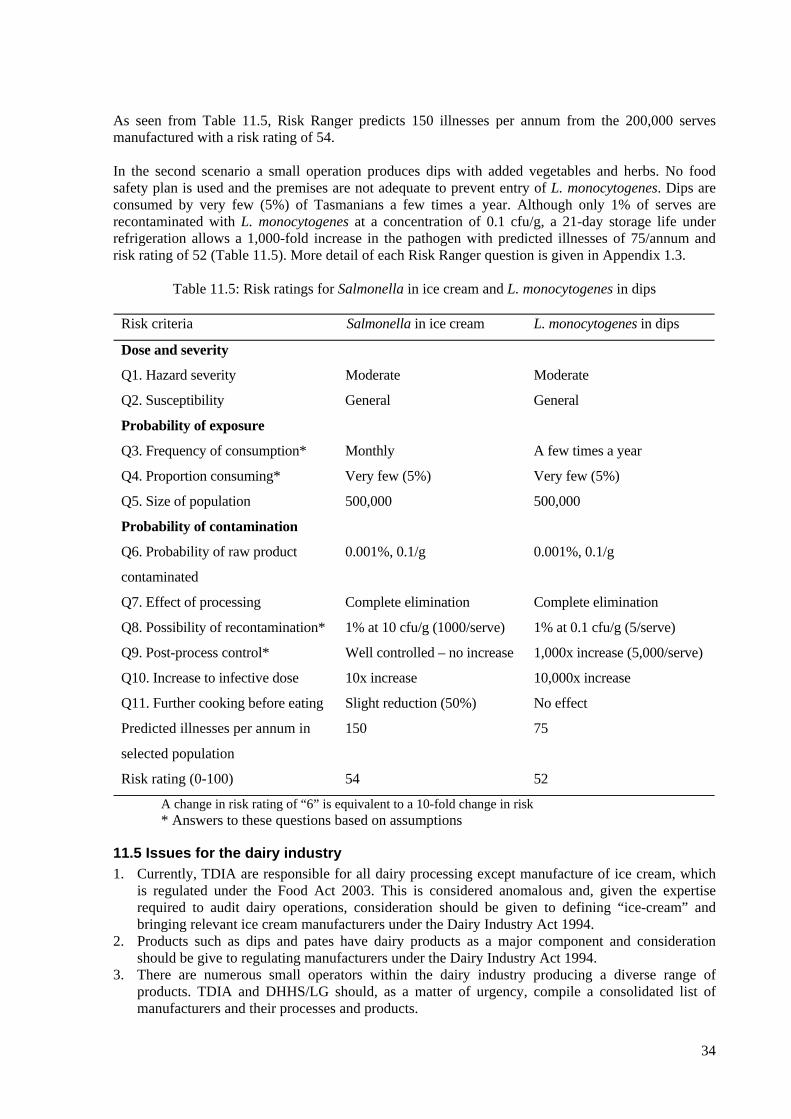
In the first scenario the manufacturer produces around 20t/annum of specialist ice creams whichcontain “organic” fruits and eggs. No food safety plan is required and, although milk is pasteurized,eggs from a small producer are added without sufficient heat treatment to eliminate all Gram-negativepathogens.
In the scenario 25% of eggs used have resolved YMT and salmonellae have increased to 100,000cfu/g. Since eggs comprise 1% of the weight of the ice cream the loading in the product is 1000 cfu/g.Since frozen storage can cause some reduction in concentration of Gram-negative pathogens a 50%reduction is factored in prior to consumption.
34
As seen from Table 11.5, Risk Ranger predicts 150 illnesses per annum from the 200,000 servesmanufactured with a risk rating of 54.
In the second scenario a small operation produces dips with added vegetables and herbs. No foodsafety plan is used and the premises are not adequate to prevent entry of L. monocytogenes. Dips areconsumed by very few (5%) of Tasmanians a few times a year. Although only 1% of serves arerecontaminated with L. monocytogenes at a concentration of 0.1 cfu/g, a 21-day storage life underrefrigeration allows a 1,000-fold increase in the pathogen with predicted illnesses of 75/annum andrisk rating of 52 (Table 11.5). More detail of each Risk Ranger question is given in Appendix 1.3.
Table 11.5: Risk ratings for Salmonella in ice cream and L. monocytogenes in dips
Risk criteria Salmonella in ice cream L. monocytogenes in dips
Dose and severity
Q1. Hazard severity Moderate Moderate
Q2. Susceptibility General General
Probability of exposure
Q3. Frequency of consumption* Monthly A few times a year
Q4. Proportion consuming* Very few (5%) Very few (5%)
Q5. Size of population 500,000 500,000
Probability of contamination
Q6. Probability of raw product
contaminated
0.001%, 0.1/g 0.001%, 0.1/g
Q7. Effect of processing Complete elimination Complete elimination
Q8. Possibility of recontamination* 1% at 10 cfu/g (1000/serve) 1% at 0.1 cfu/g (5/serve)
Q9. Post-process control* Well controlled – no increase 1,000x increase (5,000/serve)
Q10. Increase to infective dose 10x increase 10,000x increase
Q11. Further cooking before eating Slight reduction (50%) No effect
Predicted illnesses per annum in
selected population
150 75
Risk rating (0-100) 54 52
A change in risk rating of “6” is equivalent to a 10-fold change in risk* Answers to these questions based on assumptions
11.5 Issues for the dairy industry1. Currently, TDIA are responsible for all dairy processing except manufacture of ice cream, which
is regulated under the Food Act 2003. This is considered anomalous and, given the expertiserequired to audit dairy operations, consideration should be given to defining “ice-cream” andbringing relevant ice cream manufacturers under the Dairy Industry Act 1994.
2. Products such as dips and pates have dairy products as a major component and considerationshould be give to regulating manufacturers under the Dairy Industry Act 1994.
3. There are numerous small operators within the dairy industry producing a diverse range ofproducts. TDIA and DHHS/LG should, as a matter of urgency, compile a consolidated list ofmanufacturers and their processes and products.

35
12 Seafood
12.1 Regulation of the industryThe Licensing and Administration Branch of the Primary Industries Division regulates processors viathe Living Marine Resources Management Act 1995 (LMRMA) and the Inland Fisheries Act 1995(IFA); small operators processing <10t/annum are not licensed. The Acts are intended primarily forlicensing Tasmania’s fishery, They have no food safety emphasis in the same way that the MeatHygiene Act or Dairy Industry Act.
Regulatory responsibility for the abalone and oyster sectors is shared between DPIWE, DHHS andAQIS. The roles are well defined:• DHSS is responsible for monitoring oyster leases, for their closure and reopening.• DPIWE is responsible for relaying oysters.• AQIS audits the Tasmanian Shellfish Quality Assurance Program (TASQAP).
It is stated (C. Midgeley pers. comm.) that there are also a large number of processors currentlyexempted under the LMRMA licensing requirements. However, like other seafood processors, theseare regulated under the Food Act 2003.
12.2 PracticeIn 2000-01, Tasmanian fisheries production was valued at $m307 (Table 12.1).
Table 12.1: Value of main fishery sectors in the Tasmanian industrySpecies Value ($ x106) Volume (t x 103)Abalone 129.4 2.7Rock lobster 58.0 1.5Wild caught fish 3.6 1.2Salmonids 95.3 12.2Oysters 14.4 5.2Giant crab 2.6 0.1
Total 306.7 23.4
The Licensing and Administration Branch has consolidated lists of all operators within the varioussectors of the State’s seafood industry (Table 12.2).
Table 12.2: Operators in the Tasmanian fishing industry and applicable legislationNumber of operators
Inland Fisheries Act 1995Freshwater fish farms and hatcheries 14Freshwater eel licences 12Fish dealers 26Living Marine Resources Management Act 1995Marine farmers 110Fishing vessels 850Fish processors (not premises) 85*Fish handlers 10
* Approximately 50% are registered with AQIS
No consolidated list of processors, products or processes exists for those companies regulated underthe Food Act 2003.
Around eighty operations are registered by AQIS (Table 12.3).

36
Table 12.3: Operations registered with AQISNumber of operators
Vessels (factory boats) 6Live fish exporters 11Storage premises 11Fish processors 44*Registered buildings (non export) 9
* Three have an Approved Quality Arrangement (AQA) and 31 have a Food ProcessingArrangement (FPA)
12.3 Illness associated with seafoodsIn Table 12.4 are collated seafood-based outbreaks in Australia over the decade 1990-2000, sincewhich time there have been additional outbreaks of ciguatera and norovirus in imported oyster meat.The data in Table 12.4 serve to illustrate the profile of seafood-borne illness in Australia. Relevant forTasmania is an outbreak of listeriosis from imported smoked mussels where the use-by date had beenextended by the retailer.
Table 12.4: Causes of seafood-borne outbreaks in Australia, 1990-2000Category Cases Outbreaks Cases/outbreakCiguatera 616* 10 12Histamine 28 10 3Viruses 1737 3 579Bacterial pathogens 159 6 27Biotoxins 102 3 34Total 2642 32 82
* Includes an annual estimate of 48 cases/annum in coastal Queensland (Lehane and Lewis, 2000)
12.4 Recalls of seafoods In Table 12.5 are listed national seafood recalls monitored by FSANZ during the period 1993-July,2004. In all, there were 50 recalls of seafoods, 36 for microbiological and 14 for chemical hazards,some of which involved imported products.
Table 12.5: Recalls of seafoods as monitored by FSANZ (1993-July, 2004)Product category Number of recalls DefectsMicrobiologicalCanned seafood 7 Faulty seams or gas productionSmoked seafood 19 E. coliShellfish 6 MicrobiologyFrozen seafood 3 Microbiology or packagingCooked seafood 1 S. Lexington
Subtotal 36ChemicalReef fish 1 CiguateraShellfish 6 Biotoxin
1 Aflatoxin1 Zinc1 Lead
Canned fish 3 Histamine Shellfish 1 Additive
Subtotal 14
37
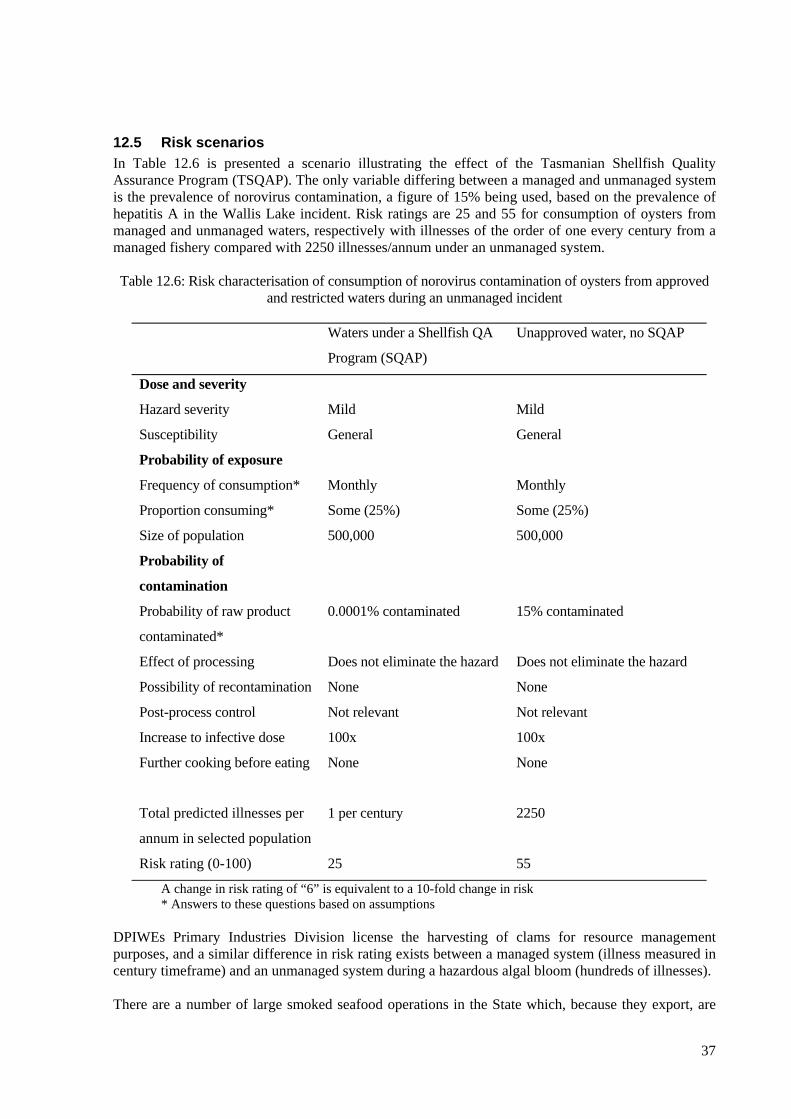
12.5 Risk scenariosIn Table 12.6 is presented a scenario illustrating the effect of the Tasmanian Shellfish QualityAssurance Program (TSQAP). The only variable differing between a managed and unmanaged systemis the prevalence of norovirus contamination, a figure of 15% being used, based on the prevalence ofhepatitis A in the Wallis Lake incident. Risk ratings are 25 and 55 for consumption of oysters frommanaged and unmanaged waters, respectively with illnesses of the order of one every century from amanaged fishery compared with 2250 illnesses/annum under an unmanaged system.
Table 12.6: Risk characterisation of consumption of norovirus contamination of oysters from approvedand restricted waters during an unmanaged incident
Waters under a Shellfish QA
Program (SQAP)
Unapproved water, no SQAP
Dose and severity
Hazard severity Mild Mild
Susceptibility General General
Probability of exposure
Frequency of consumption* Monthly Monthly
Proportion consuming* Some (25%) Some (25%)
Size of population 500,000 500,000
Probability of
contamination
Probability of raw product
contaminated*
0.0001% contaminated 15% contaminated
Effect of processing Does not eliminate the hazard Does not eliminate the hazard
Possibility of recontamination None None
Post-process control Not relevant Not relevant
Increase to infective dose 100x 100x
Further cooking before eating
None None
Total predicted illnesses per
annum in selected population
1 per century 2250
Risk rating (0-100) 25 55
A change in risk rating of “6” is equivalent to a 10-fold change in risk* Answers to these questions based on assumptions
DPIWEs Primary Industries Division license the harvesting of clams for resource managementpurposes, and a similar difference in risk rating exists between a managed system (illness measured incentury timeframe) and an unmanaged system during a hazardous algal bloom (hundreds of illnesses).
There are a number of large smoked seafood operations in the State which, because they export, are

38
registered with AQIS. However, should a small processor enter the business for domestic consumptiononly, the operation could be undertaken without a FSP. The risk of L. monocytogenes contaminationwould approximate that established for production of dips without a FSP (see Section 11.4).
12.6 Issues for the seafood industry1. There is confusion over the stage of processing at which “substantial transformation” occurs but,
in the finfish sector, it is believed to be at sea. This locates responsibility with DHHS/LG.2. The Licensing and Administration Branch licenses premises for resource management purposes
while DHHS/LG enforces the Food Act 2003.3. There are two high risk product categories in the seafood sector e.g. oysters and smoked seafoods.
While the former is regulated to a high level of compliance with a Gold Standard by TSQAP, thelatter is not and DHHS/LG, in collaboration with DPIWE should:• Produce a consolidated list of producers and processors.• Assess each operation’s management of food safety against a Gold Standard
4. Currently, food safety programs are not required for domestic processors, despite the potentialrisk associated with some seafood products (shellfish and smoked products).
39
13 Vegetables
13.1 Regulation of the industryThe Vegetable and Associated Industries Branch of DPIWE has no statutory responsibility for foodsafety. The industry is regulated by the Food Act 2003 via local government officers. Use of recycledwater is regulated by the Environment Division of DPIWE.
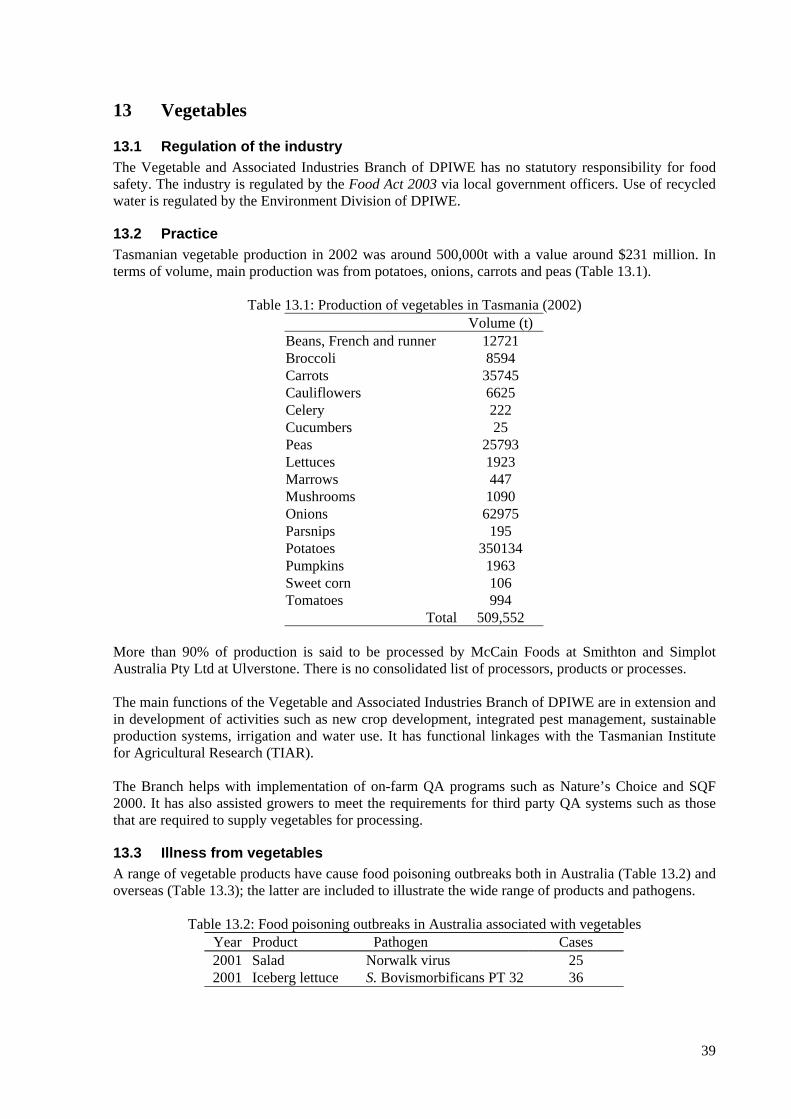
13.2 PracticeTasmanian vegetable production in 2002 was around 500,000t with a value around $231 million. Interms of volume, main production was from potatoes, onions, carrots and peas (Table 13.1).
Table 13.1: Production of vegetables in Tasmania (2002)Volume (t)
Beans, French and runner 12721Broccoli 8594Carrots 35745Cauliflowers 6625Celery 222Cucumbers 25Peas 25793Lettuces 1923Marrows 447Mushrooms 1090Onions 62975Parsnips 195Potatoes 350134Pumpkins 1963Sweet corn 106Tomatoes 994
Total 509,552
More than 90% of production is said to be processed by McCain Foods at Smithton and SimplotAustralia Pty Ltd at Ulverstone. There is no consolidated list of processors, products or processes.
The main functions of the Vegetable and Associated Industries Branch of DPIWE are in extension andin development of activities such as new crop development, integrated pest management, sustainableproduction systems, irrigation and water use. It has functional linkages with the Tasmanian Institutefor Agricultural Research (TIAR).
The Branch helps with implementation of on-farm QA programs such as Nature’s Choice and SQF2000. It has also assisted growers to meet the requirements for third party QA systems such as thosethat are required to supply vegetables for processing.
13.3 Illness from vegetablesA range of vegetable products have cause food poisoning outbreaks both in Australia (Table 13.2) andoverseas (Table 13.3); the latter are included to illustrate the wide range of products and pathogens.
Table 13.2: Food poisoning outbreaks in Australia associated with vegetables Year Product Pathogen Cases 2001 Salad Norwalk virus 25 2001 Iceberg lettuce S. Bovismorbificans PT 32 36

40
Table 13.3: Outbreaks associated with intact products in contact with soil and/or water Product Country Organism Ref
Salad UK S. Enteritidis PT4 1 Potato salad UK S. Enteritidis PT4 1 Lettuce, tomato UK E. coli O157 1 Mixed salad UK E. coli O157 1 Lettuce US E. coli O157:H7 2 Salads US E. coli O157 4 Lettuce UK Campylobacter 1 Salad vegetables UK Shigella flexneri 1 Salad UK Shigella sonnei 1 Iceberg lettuce UK, GDR, Sweden Shigella sonnei 5 Baby corn Denmark Shigella spp 4 Parsley US Shigella spp 3 Lettuce US Hepatitis A virus 2 Carrot UK Small Round Structured Virus 1 Salad (mixed) UK Small Round Structured Virus 1 Salad (green) UK Small Round Structured Virus 1 Salad (raw) UK Small Round Structured Virus 1 Salad (raw) UK Small Round Structured Virus 1 Watercress UK Small Round Structured Virus 1 Celery US Norwalk virus 2 Onions US Cryptosporidium sp 2 Mesclun lettuce US Cyclospora cayetanensis 2 Lettuce, onion US Giardia lambia 4 Basil US Cyclospora cayetanensis 3
1: Personal communications to the EU Commission; 2: Tauxe et al. (1997); 3: US FDA (2000) 4: Anonymous (2000); 5: Gilbert (2000); 6: Taormina et al. (2000)
13.4 Recalls of vegetables National recalls over the period 1990-July, 2004 are recorded in Table 13.4.
Table 13.4: Recalls of vegetables recorded by FSANZ 1990-July, 2004 Date Product Cause 1990 Potato salad Metal Canned beetroot Underfilling 1995 Onion dip E. coli 1996 Parsley E. coli 1997 Pickled vegetables Chemical contamination Vegetables Plastic 2003 Coleslaw E. coli Spinach Foreign matter Lettuce E. coli
Table 13.5: Outbreaks associated with cut, sliced, skinned and shredded products Product Organism Location Reference*
Shredded lettuce Shigella US 2 Coleslaw E. coli O157 US 4 Cabbage? E. coli Canada 5 Sliced raw vegetables Giardia lambia US 4
* References listed beneath Table 13.3
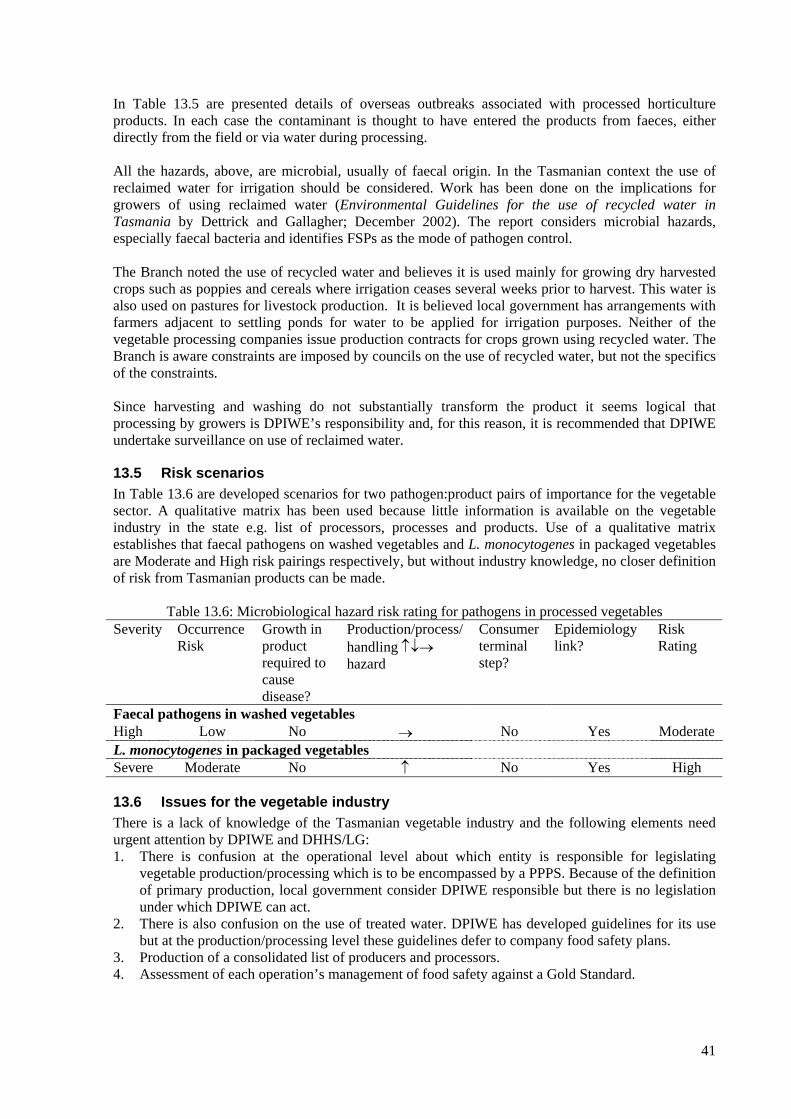
41
In Table 13.5 are presented details of overseas outbreaks associated with processed horticultureproducts. In each case the contaminant is thought to have entered the products from faeces, eitherdirectly from the field or via water during processing. All the hazards, above, are microbial, usually of faecal origin. In the Tasmanian context the use ofreclaimed water for irrigation should be considered. Work has been done on the implications forgrowers of using reclaimed water (Environmental Guidelines for the use of recycled water inTasmania by Dettrick and Gallagher; December 2002). The report considers microbial hazards,especially faecal bacteria and identifies FSPs as the mode of pathogen control. The Branch noted the use of recycled water and believes it is used mainly for growing dry harvestedcrops such as poppies and cereals where irrigation ceases several weeks prior to harvest. This water isalso used on pastures for livestock production. It is believed local government has arrangements withfarmers adjacent to settling ponds for water to be applied for irrigation purposes. Neither of thevegetable processing companies issue production contracts for crops grown using recycled water. TheBranch is aware constraints are imposed by councils on the use of recycled water, but not the specificsof the constraints. Since harvesting and washing do not substantially transform the product it seems logical thatprocessing by growers is DPIWE’s responsibility and, for this reason, it is recommended that DPIWEundertake surveillance on use of reclaimed water.
13.5 Risk scenariosIn Table 13.6 are developed scenarios for two pathogen:product pairs of importance for the vegetablesector. A qualitative matrix has been used because little information is available on the vegetableindustry in the state e.g. list of processors, processes and products. Use of a qualitative matrixestablishes that faecal pathogens on washed vegetables and L. monocytogenes in packaged vegetablesare Moderate and High risk pairings respectively, but without industry knowledge, no closer definitionof risk from Tasmanian products can be made.
Table 13.6: Microbiological hazard risk rating for pathogens in processed vegetablesSeverity Occurrence
RiskGrowth inproductrequired tocausedisease?
Production/process/handling ↑↓→hazard
Consumerterminalstep?
Epidemiologylink?
RiskRating
Faecal pathogens in washed vegetablesHigh Low No → No Yes ModerateL. monocytogenes in packaged vegetablesSevere Moderate No ↑ No Yes High
13.6 Issues for the vegetable industryThere is a lack of knowledge of the Tasmanian vegetable industry and the following elements needurgent attention by DPIWE and DHHS/LG:1. There is confusion at the operational level about which entity is responsible for legislating
vegetable production/processing which is to be encompassed by a PPPS. Because of the definitionof primary production, local government consider DPIWE responsible but there is no legislationunder which DPIWE can act.
2. There is also confusion on the use of treated water. DPIWE has developed guidelines for its usebut at the production/processing level these guidelines defer to company food safety plans.
3. Production of a consolidated list of producers and processors.4. Assessment of each operation’s management of food safety against a Gold Standard.
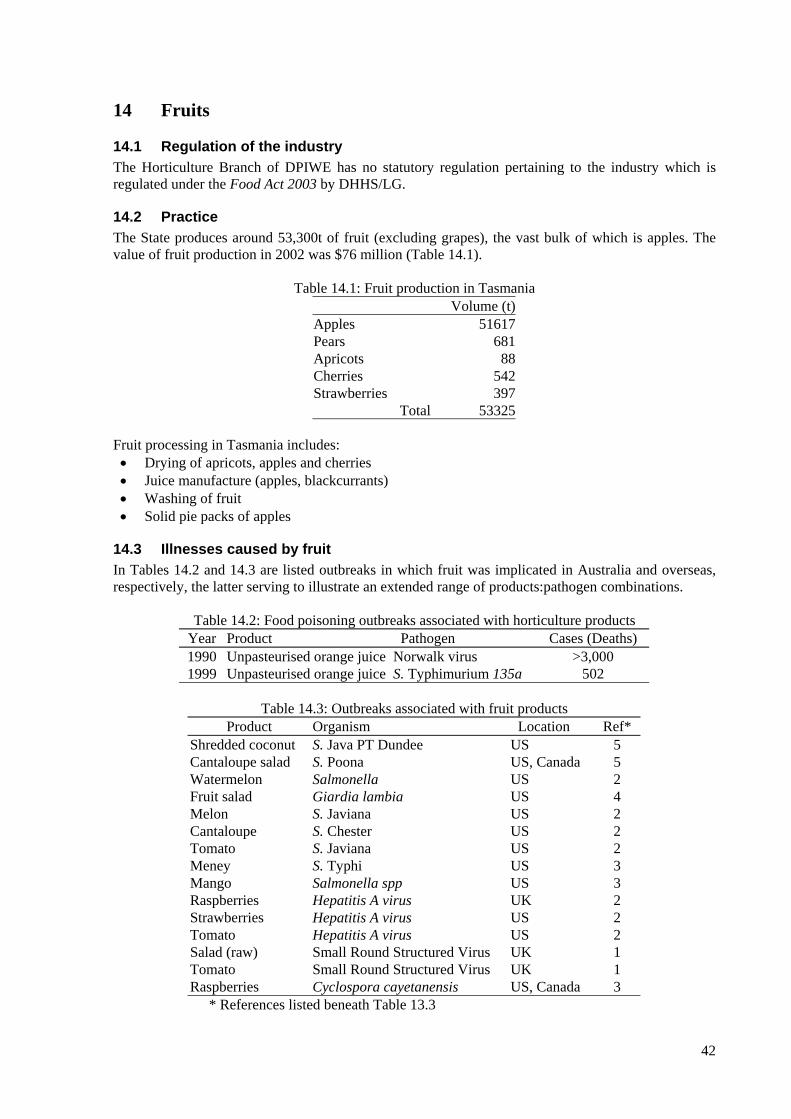
42
14 Fruits
14.1 Regulation of the industryThe Horticulture Branch of DPIWE has no statutory regulation pertaining to the industry which isregulated under the Food Act 2003 by DHHS/LG.
14.2 PracticeThe State produces around 53,300t of fruit (excluding grapes), the vast bulk of which is apples. Thevalue of fruit production in 2002 was $76 million (Table 14.1).
Table 14.1: Fruit production in TasmaniaVolume (t)
Apples 51617Pears 681Apricots 88Cherries 542Strawberries 397
Total 53325
Fruit processing in Tasmania includes:• Drying of apricots, apples and cherries• Juice manufacture (apples, blackcurrants)• Washing of fruit• Solid pie packs of apples
14.3 Illnesses caused by fruitIn Tables 14.2 and 14.3 are listed outbreaks in which fruit was implicated in Australia and overseas,respectively, the latter serving to illustrate an extended range of products:pathogen combinations.
Table 14.2: Food poisoning outbreaks associated with horticulture products Year Product Pathogen Cases (Deaths) 1990 Unpasteurised orange juice Norwalk virus >3,000 1999 Unpasteurised orange juice S. Typhimurium 135a 502
Table 14.3: Outbreaks associated with fruit products
Product Organism Location Ref* Shredded coconut S. Java PT Dundee US 5 Cantaloupe salad S. Poona US, Canada 5 Watermelon Salmonella US 2 Fruit salad Giardia lambia US 4 Melon S. Javiana US 2 Cantaloupe S. Chester US 2 Tomato S. Javiana US 2 Meney S. Typhi US 3 Mango Salmonella spp US 3 Raspberries Hepatitis A virus UK 2 Strawberries Hepatitis A virus US 2 Tomato Hepatitis A virus US 2 Salad (raw) Small Round Structured Virus UK 1 Tomato Small Round Structured Virus UK 1 Raspberries Cyclospora cayetanensis US, Canada 3
* References listed beneath Table 13.3
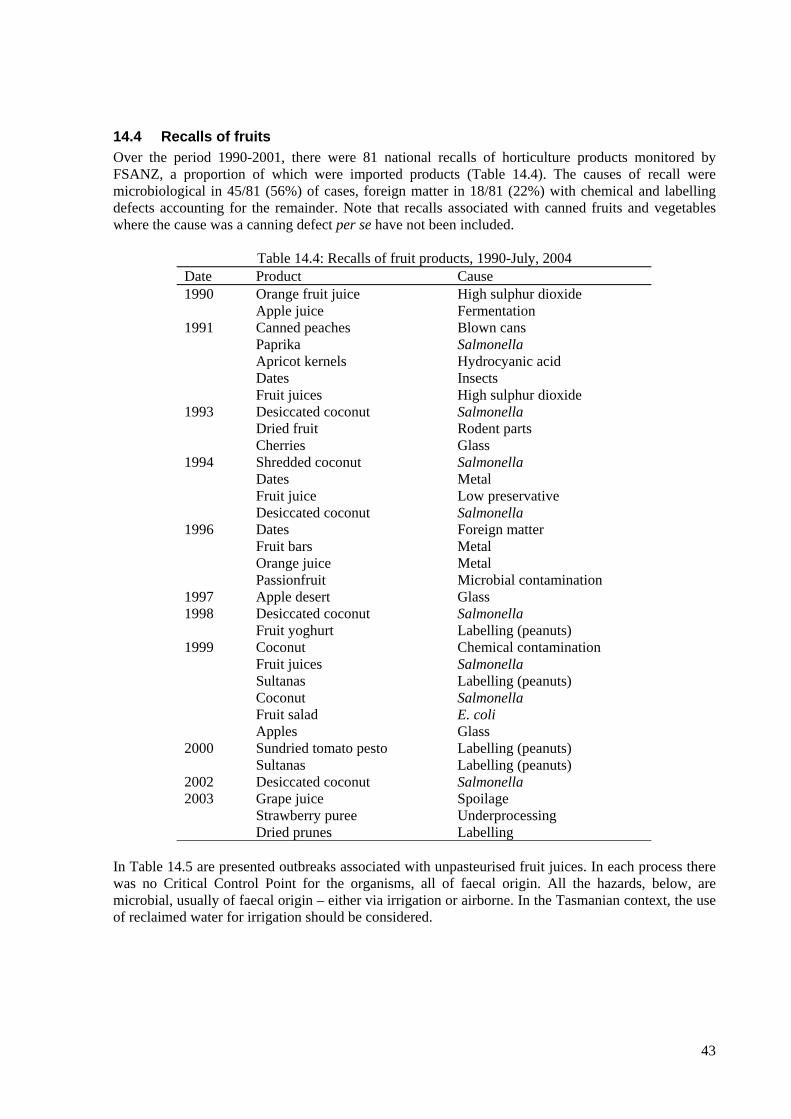
43
14.4 Recalls of fruits Over the period 1990-2001, there were 81 national recalls of horticulture products monitored byFSANZ, a proportion of which were imported products (Table 14.4). The causes of recall weremicrobiological in 45/81 (56%) of cases, foreign matter in 18/81 (22%) with chemical and labellingdefects accounting for the remainder. Note that recalls associated with canned fruits and vegetableswhere the cause was a canning defect per se have not been included.
Table 14.4: Recalls of fruit products, 1990-July, 2004 Date Product Cause 1990 Orange fruit juice High sulphur dioxide Apple juice Fermentation 1991 Canned peaches Blown cans Paprika Salmonella Apricot kernels Hydrocyanic acid Dates Insects Fruit juices High sulphur dioxide 1993 Desiccated coconut Salmonella Dried fruit Rodent parts Cherries Glass 1994 Shredded coconut Salmonella Dates Metal Fruit juice Low preservative Desiccated coconut Salmonella 1996 Dates Foreign matter Fruit bars Metal Orange juice Metal Passionfruit Microbial contamination 1997 Apple desert Glass 1998 Desiccated coconut Salmonella Fruit yoghurt Labelling (peanuts) 1999 Coconut Chemical contamination Fruit juices Salmonella Sultanas Labelling (peanuts) Coconut Salmonella Fruit salad E. coli Apples Glass 2000 Sundried tomato pesto Labelling (peanuts) Sultanas Labelling (peanuts) 2002 Desiccated coconut Salmonella 2003 Grape juice Spoilage Strawberry puree Underprocessing Dried prunes Labelling
In Table 14.5 are presented outbreaks associated with unpasteurised fruit juices. In each process therewas no Critical Control Point for the organisms, all of faecal origin. All the hazards, below, aremicrobial, usually of faecal origin – either via irrigation or airborne. In the Tasmanian context, the useof reclaimed water for irrigation should be considered.

44
Table 14.5: Outbreaks associated with fruit juices
Product Organism Location Reference* Melon & papaya SRSV UK 1 Apple juice E. coli O157:H7 US 2 Apple juice S. Typhimurium US 2 Apple juice Cryptosporidium spp US 2 Coconut milk Vibrio cholerae 01 US 4 Orange juice S. Hartford US 2 Orange juice S. Anatum US 3 Orange juice S. Typhi US 3 Orange juice S. Muenchen US, Canada 3
* References listed beneath Table 13.3
14.5 Risk scenariosIn Table 14.6 are developed scenarios for three pathogen:product pairs of importance for the fruitsector. A qualitative matrix has been used because little information is available on the vegetableindustry in the state e.g. list of processors, processes and products. Use of a qualitative matrixestablishes that faecal pathogens on washed fruit, L. monocytogenes in prepared fruit salads andpathogenic E. coli in unpasteurised fruit juice are Moderate, High and High risk pairings, respectively.However, there is no industry knowledge which could further define risk from such products and therisk profiles are included to indicate risk, should there be any such processing in the State.
Table 14.6: Microbiological hazard risk rating for fruits and fruit juicesSeverity Occurrence
RiskGrowth inproductrequired tocausedisease?
Production/process/handling ↑↓→hazard
Consumerterminalstep?
Epidemiologylink?
RiskRating
Faecal pathogens in washed fruitHigh Low No → No Yes Moderate
L. monocytogenes in prepared fruit saladsSevere High No ↑ No Yes High
Pathogenic E. coli in unpasteurised fruit juiceSevere High No → No Yes High
14.6 Issues for the fruit industryThere is a lack of knowledge of the Tasmanian fruit industry and the following elements need urgentattention by DPIWE and DHHS/LG:1. There is confusion at the operational level about which entity is responsible for legislating fruit
production/processing. Because of the definition of primary production, in some cases localgovernment may consider DPIWE is responsible but there is no legislation under which DPIWEcan act.
2. Production of a consolidated list of producers, processors and their products.3. Assessment of each operation’s management of food safety against a Gold Standard.
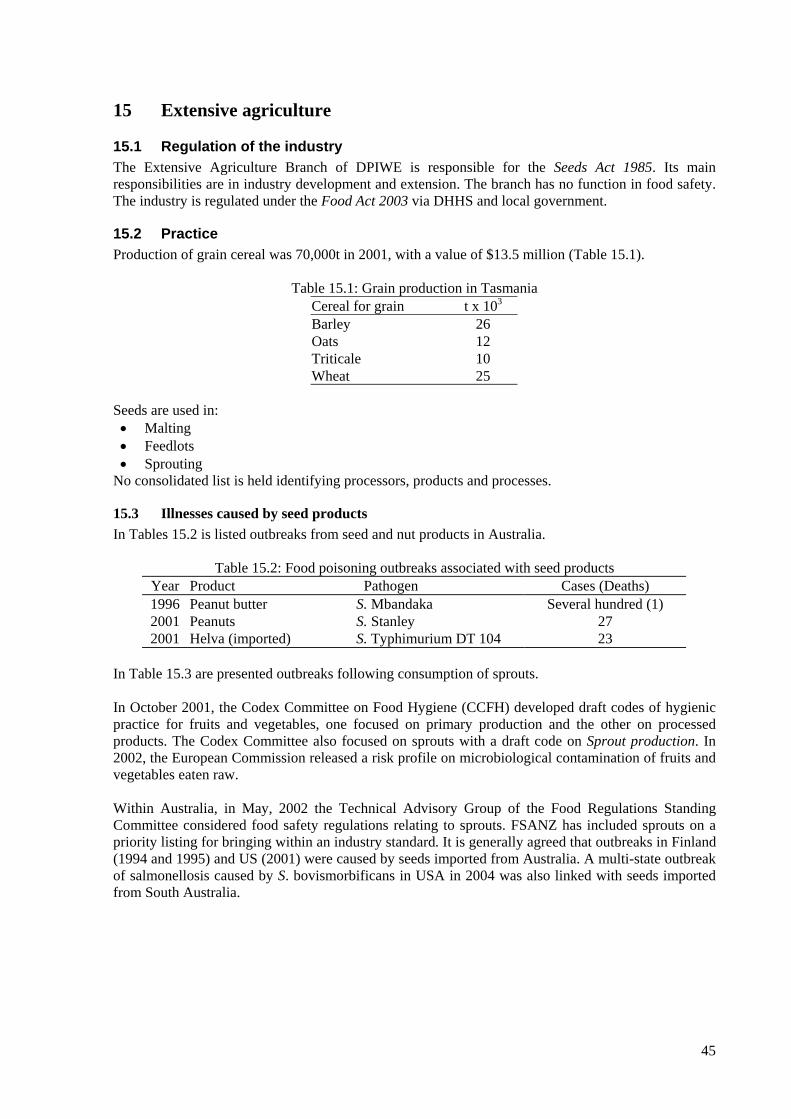
45
15 Extensive agriculture
15.1 Regulation of the industryThe Extensive Agriculture Branch of DPIWE is responsible for the Seeds Act 1985. Its mainresponsibilities are in industry development and extension. The branch has no function in food safety.The industry is regulated under the Food Act 2003 via DHHS and local government.
15.2 PracticeProduction of grain cereal was 70,000t in 2001, with a value of $13.5 million (Table 15.1).
Table 15.1: Grain production in TasmaniaCereal for grain t x 103
Barley 26Oats 12Triticale 10Wheat 25
Seeds are used in:• Malting• Feedlots• Sprouting
No consolidated list is held identifying processors, products and processes.
15.3 Illnesses caused by seed productsIn Tables 15.2 is listed outbreaks from seed and nut products in Australia.
Table 15.2: Food poisoning outbreaks associated with seed products Year Product Pathogen Cases (Deaths) 1996 Peanut butter S. Mbandaka Several hundred (1) 2001 Peanuts S. Stanley 27 2001 Helva (imported) S. Typhimurium DT 104 23
In Table 15.3 are presented outbreaks following consumption of sprouts. In October 2001, the Codex Committee on Food Hygiene (CCFH) developed draft codes of hygienicpractice for fruits and vegetables, one focused on primary production and the other on processedproducts. The Codex Committee also focused on sprouts with a draft code on Sprout production. In2002, the European Commission released a risk profile on microbiological contamination of fruits andvegetables eaten raw. Within Australia, in May, 2002 the Technical Advisory Group of the Food Regulations StandingCommittee considered food safety regulations relating to sprouts. FSANZ has included sprouts on apriority listing for bringing within an industry standard. It is generally agreed that outbreaks in Finland(1994 and 1995) and US (2001) were caused by seeds imported from Australia. A multi-state outbreakof salmonellosis caused by S. bovismorbificans in USA in 2004 was also linked with seeds importedfrom South Australia.
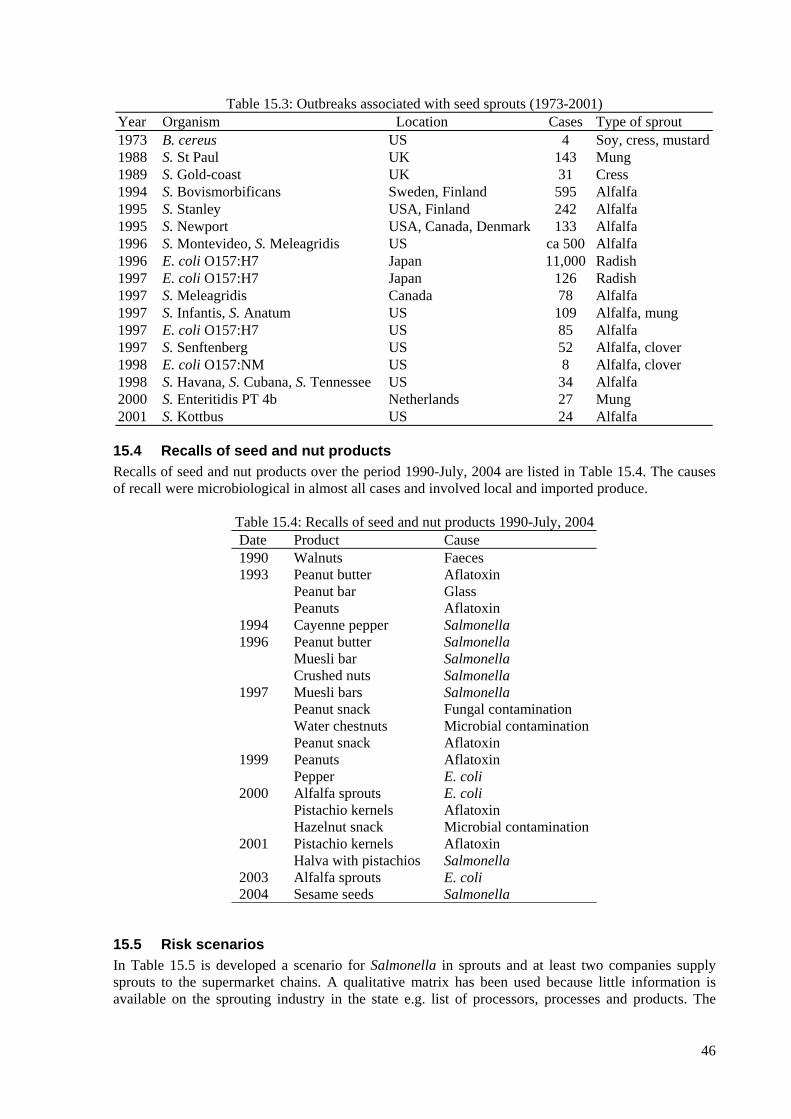
46
Table 15.3: Outbreaks associated with seed sprouts (1973-2001) Year Organism Location Cases Type of sprout 1973 B. cereus US 4 Soy, cress, mustard 1988 S. St Paul UK 143 Mung 1989 S. Gold-coast UK 31 Cress 1994 S. Bovismorbificans Sweden, Finland 595 Alfalfa 1995 S. Stanley USA, Finland 242 Alfalfa 1995 S. Newport USA, Canada, Denmark 133 Alfalfa 1996 S. Montevideo, S. Meleagridis US ca 500 Alfalfa 1996 E. coli O157:H7 Japan 11,000 Radish 1997 E. coli O157:H7 Japan 126 Radish 1997 S. Meleagridis Canada 78 Alfalfa 1997 S. Infantis, S. Anatum US 109 Alfalfa, mung 1997 E. coli O157:H7 US 85 Alfalfa 1997 S. Senftenberg US 52 Alfalfa, clover 1998 E. coli O157:NM US 8 Alfalfa, clover 1998 S. Havana, S. Cubana, S. Tennessee US 34 Alfalfa 2000 S. Enteritidis PT 4b Netherlands 27 Mung 2001 S. Kottbus US 24 Alfalfa
15.4 Recalls of seed and nut products Recalls of seed and nut products over the period 1990-July, 2004 are listed in Table 15.4. The causesof recall were microbiological in almost all cases and involved local and imported produce.
Table 15.4: Recalls of seed and nut products 1990-July, 2004 Date Product Cause 1990 Walnuts Faeces 1993 Peanut butter Aflatoxin Peanut bar Glass Peanuts Aflatoxin 1994 Cayenne pepper Salmonella 1996 Peanut butter Salmonella Muesli bar Salmonella Crushed nuts Salmonella 1997 Muesli bars Salmonella Peanut snack Fungal contamination Water chestnuts Microbial contamination Peanut snack Aflatoxin 1999 Peanuts Aflatoxin Pepper E. coli 2000 Alfalfa sprouts E. coli Pistachio kernels Aflatoxin Hazelnut snack Microbial contamination 2001 Pistachio kernels Aflatoxin Halva with pistachios Salmonella 2003 Alfalfa sprouts E. coli 2004 Sesame seeds Salmonella
15.5 Risk scenariosIn Table 15.5 is developed a scenario for Salmonella in sprouts and at least two companies supplysprouts to the supermarket chains. A qualitative matrix has been used because little information isavailable on the sprouting industry in the state e.g. list of processors, processes and products. The
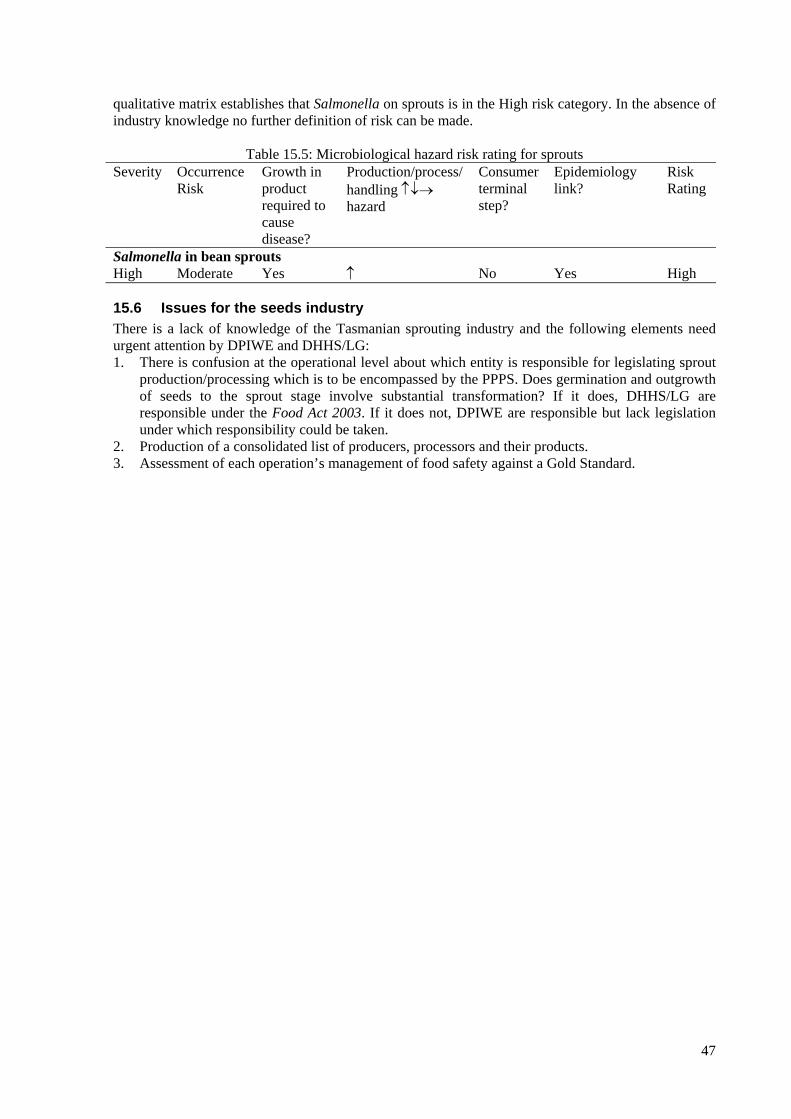
47
qualitative matrix establishes that Salmonella on sprouts is in the High risk category. In the absence ofindustry knowledge no further definition of risk can be made.
Table 15.5: Microbiological hazard risk rating for sproutsSeverity Occurrence
RiskGrowth inproductrequired tocausedisease?
Production/process/handling ↑↓→hazard
Consumerterminalstep?
Epidemiologylink?
RiskRating
Salmonella in bean sproutsHigh Moderate Yes ↑ No Yes High
15.6 Issues for the seeds industryThere is a lack of knowledge of the Tasmanian sprouting industry and the following elements needurgent attention by DPIWE and DHHS/LG:1. There is confusion at the operational level about which entity is responsible for legislating sprout
production/processing which is to be encompassed by the PPPS. Does germination and outgrowthof seeds to the sprout stage involve substantial transformation? If it does, DHHS/LG areresponsible under the Food Act 2003. If it does not, DPIWE are responsible but lack legislationunder which responsibility could be taken.
2. Production of a consolidated list of producers, processors and their products.3. Assessment of each operation’s management of food safety against a Gold Standard.

48
16 Apiary
16.1 Regulation of the industryThe Animal Health and Welfare Branch administers the Animal Health Act 1996 and the AnimalHealth Regulations 1996. The Food Act 2003 covers food safety in honey manufacture.
16.2 PracticeThe branch also facilitates the BQAL program and has run four workshops in Tasmania. In 2001-02the value of the Tasmanian honey industry was $2 million; there are no data for production volumecontained in the ABS annual return.
There are 259 registered apiarists with 18,300 hives, of which six apiarists own 90% of the hives.Tasmanian production is rich in leatherwood honey which, because of its usefulness in blending, issold in bulk to large mainland companies.
Three packers supply the local supermarket system and also export. They have Food Safety Plans andthe branch facilitates audits via a registered auditor in the State.
16.3 Illness from honey There have been few reports of illness associated with honey and apiary products. Honey has causedcases of infant botulism, some of which have been linked with Sudden Infant Death Syndrome(SIDS). In many countries, including Australia, infant botulism is the most common form ofbotulism. It occurs in children under 1 year with 95% occurring in infants younger than 6 months.Infant botulism occurs when ingested spores of C. botulinum germinate, multiply and produceneurotoxin in the gastrointestinal tract. Intensive care facilities have reduced the incidence of deathfrom infant botulism to around 2%. Honey has been implicated as one source of the spores of C. botulinum and is not recommended forinfants of less than 1 year. In one case, 80 spores/g were reported in one sample of incriminatedhoney (Midura et al., 1979), but in a UK survey spores were not isolated from 122 samples (Berry etal., 1987). Royal jelly has also been implicated in a case of haemorrhagic colitis involving a 53-year-old woman.Prior to the onset of symptoms the patient had taken royal jelly for 25 days.
16.4 Recalls of honey Table 16.1: National recalls of honey and honey-containing products as monitored by FSANZ (1990-
2004) Product category Number of recalls Defects Honey coated peanut bar 1 Fungal contamination Honey in glass jar 1 Glass
16.5 Chemical hazards Several categories of chemicals have been associated with honey:
• Agricultural chemicals - pesticides, herbicides, rodenticides• Antibiotics used to control bee diseases• Heavy metals which accumulate in environments• Cleaning compounds used to sanitise hives and processing equipment• Naturally-occurring toxins e.g. Pyrrolizidine alkaloids (PAs)

49
16.6 Risk scenarios There is no Critical Control Point in honey processing to prevent spores of C. botulinum enteringhoney, or to eliminate/reduce them to an acceptable level. Managing risk to the very young thereforeinvolves advising mothers to avoid feeding honey to babies until their gut microflora has maturedsufficiently to prevent spore germination and colonisation (usually 12 months). In line with other primary production sectors, suppliers will be required to operate Food Safety Plansfor production and processing of honey. The B-Qual system advocates a HACCP-based quality systembut has not rigorously identified hazards, critical control points and critical limits for variousagrichemicals, natural toxins such as PAs and antibiotics such as oxytetracyclene andchloramphenicol. NRS also does some testing
16.7 Issues for the industry1. DHHS/LG should review its advice to mothers re feeding honey to neonates.2. BQAL is voluntary – only 3 or 4 operators are in the scheme – DPIWE should consider promoting
(or even mandating) the quality system.3. Use oxytetracycline but only between honey flows (September-November)

50
AcknowledgmentsI am grateful to the following for information received either in discussion and/or in materialsprovided, however, any errors or omissions in the foregoing are entirely my responsibility.
At DPIWE, Rod Gobbey, Chris Lyall and David White (BPI), Robin Thompson, Craig Midgeley,Robert Gott, Michael Hart, Penny Domeney and David King (Primary Industries) and Don Sandman(TDIA), .At DHHS, Eric Johnson, Leanne Cleaver, Ray BrownAt West Tamar Council, Linda FinchA number of Environmental Health Officers attended briefings in Hobart and Launceston andimparted their views on risk management within Tasmania

51
ReferencesAnonymous (2000) Pathogens and Produce: Foodborne Outbreaks/Incidents. European Chilled FoodFederation. Presented to the EC Scientific Committee for Food, March 2000.Bates C.J., Spencer R.C. (1995) Survival of Salmonella species in eggs poached using a microwaveoven. Journal of Hospital Infection, 29, 121-127.Cassin, M., Paoli, G and Lammerding, A. (1998) Simulation modelling for microbial risk assessment.Journal of Food Protection. 61:1560-1566.Berry, P, Gilbert, R., Oliver, R and Gibson, A. (1987) Some preliminary studies on the low incidenceof infant botulism in the United Kingdom. Journal of Clinical Pathology, 40:121.Coates, K., Groves, M., Hamilton, D. et al. (1997) Australian national pig carcass and meatmicrobiology survey. Proceedings, 43rd ICOMST 1997, Auckland, NZ.Codex Alimentarius Commission (1993) Guidelines for the application of the Hazard Analysis CriticalControl Point (HACCP) system. Rome, 1993.Codex Alimentarius Commission (1997) Report of the 29th session of the Codex Committee on FoodHygiene. Washington, October 1996.Codex Alimentarius Commission (2002) Proposed draft principles and guidelines for the conduct ofmicrobiological risk management (at step 3 of the procedure). CX/FH 03/7. Joint FAO/WHO FoodStandards Programme.FSA (2000) Final Report - Scoping study on the risk of plant products (SafeFood NSW).Gilbert, R. (2000) Evaluation of the microbiological safety of fruits and vegetables eaten raw, andproducts thereof. European Commission Health & Consumer Protection Directorate-General.Humphrey T. (1994) Contamination of egg shell and contents with Salmonella enteritidis: a review.International Journal of Food Microbiology 21, 31-40.Humphrey T, Greenwood M, Gilbert R, et al. (1989) The survival of salmonellas in shell eggs cookedunder simulated domestic conditions. Epidemiol Infect 103, 35-45.ICMSF (2002) Microorganisms in Foods 7: Microbiological Testing in Food Safety Management.Kluwver Academic/Plenum Publishers. ISBN 0-306-47262-7.Lehane, L. and Lewis, R.J. (2000) Ciguatera: recent advances but the risk remains. InternationalJournal of Food Microbiology, 61:91-125.Midura, T, Snowden, S, Wood, R, et al. (1979) Isolation of Clostridium botulinum from honey.Journal of Clinical Microbiology, 9:282.Phillips D, Sumner J, Alexander J, and Dutton K. (2001a) Microbiological quality of Australian beef.Journal of Food Protection. 64:692-696.Phillips D, Sumner J, Alexander J, and Dutton K. (2001b) Microbiological quality of Australian sheepmeat. Journal of Food Protection. 64:697-700.Ross, T. and Shadbolt, C. (2001) Predicting Escherichia coli inactivation in uncooked comminutedfermented meat products. Meat and Livestock Australia, Sydney.Sumner, J, Petrenas, E. Dean, P. et al. (2003) Microbial contamination on beef and sheep carcases inSouth Australia. International Journal of Food Microbiology 81: 255-260.Sumner, J, Raven, G, Dean, P. et al. (2004) A microbiological profile of poultry processed in SouthAustralia. Food Australia 56(7): 335-340.Sumner, J, Cameron, S, Jordan, D. et al. (2004a) A risk profile of the Australian meat industry:hazard identification. Food Australia (submitted for publication).Sumner, J., Ross, T., Jenson, I and Pointon, A. (2004b) A risk profile of the Australian red meatindustry: Microbiological Risk Ratings. International Journal of Food Microbiology (submitted forpublication)Taormina, P, Beuchat, L, and Slutsker, L. (2000) Infections Associated with Eating Seed Sprouts: AnInternational Concern. University of Georgia and Centers for Disease Control and Prevention,Georgia, US) submitted by the Secretariat, March 2000.Tauxe, R, Kruse, H, Hedberg, C. et al. (1997) Microbiological hazards and emerging issues associatedwith produce. A preliminary report to the National Advisory Committee on Microbiologic Criteria forFoods. J. Food Prot. 60:1400-1408.US FDA. (2000) Experience with Microbial Hazards in Fresh Produce. Lee Anne Jackson, Center forFood Safety and Applied Nutrition Food and Drug Administration. Presented to the EC Scientific

52
Committee on Food, March 2000.Vanderlinde P, Shay B. and Murray J. (1998) Microbiological quality of Australian beef carcass meatand frozen bulk packed beef. Journal of Food Protection, 61:437-443.Vanderlinde, P, Shay, B. and J. Murray. (1999) Microbiological status of Australian sheep meat. 62:Journal of Food Protection, 380-385.WHO/FAO. (World Health Organisation/Food and Agriculture Organisation). (2002). Riskcharacterisation of Salmonella spp. in eggs and broilers and Listeria monocytogenes in ready to eatfoods.

53
Appendix 1: Data and assumptions used in risk scenarios1.1 Uncooked comminuted fermented meatIn this scenario the manufacturer operates outside of Standard 1.6.2, manufacturing around 12t ofproduct per annum of which 10% is made from game meats (wallaby and venison). Product is retailedlocally to a population around 50,000.
Question 1. Hazard SeverityFor EHEC clinical manifestations in humans include diarrhoea, Haemorrhagic Colitis (HC),Haemolytic Uraemic Syndrome (HUS), and Thrombotic Thrombocytopenic Purpura (TTP). Theaverage period between exposure and disease is 3 days, with most patients recovering within 7 days ifthey only suffer diarrhoea. Based on the above, “MODERATE hazard - requires medical interventionin most cases” was chosen as the response to Question 1.
For Salmonella MODERATE was also chosen, based on the apparent virulence of some serovars (S.Typhimurium, S. Virchow).
Question 2. How susceptible is the population of interestFor the current assessment, one population was considered: “GENERAL - all members of thepopulation”
Questions 3 and 4. Frequency of ConsumptionA nominal 50g serving size was chosen. Total consumption was based on the manufacturer producing12t of product/annum (equivalent to 240,000 serves). This was consumed by FEW (5%) people in aTasmanian city (50,000) which equates with each consuming UCFM twice weekly.
In the case of UCFM made from game meat there are 24,000 serves which equates with consumptionevery month.
Question 5. Size of Consuming PopulationThe local population is estimated as 50,000.
Question 6. Probability of Contamination of Raw Product per ServingUCFM production from pork, beefBased on MLA Baseline studies on beef and sheep meats (Vanderlinde et al. 1998; 1999; Phillips etal. 2001a; 2001b) and on pig meats (Coates et al. 1997), the prevalence of EHEC in raw materials forsalami manufacture was assumed to be 0.1%. More recently, information on prevalence on beefcarcases and trim over the period 1998-2002 was gathered as part of a submission to the United StatesDepartment of Agriculture (USDA), Food Safety Inspection Service (FSIS). EHEC was detected in32/185,000 (0.01%) samples.
In Australia, as elsewhere, since there are no data available on concentration of EHEC in rawmaterials used in UCFM manufacture, throughout this study, assumptions were made based onmaterial accumulated during the FAO/WHO risk assessment on E. coli in ready-to-eat foods.
While some risk assessments (FDA/USDA, 2000) have noted that pathogens are probablyheterogeneously distributed in some foods, all to date have assumed that pathogens present in foodsare distributed homogenously. This is a clearly a simplification.
A consequence of the assumption of homogeneity is that prevalence and concentration of pathogens infoods are often considered to be related properties particularly at very low concentrations. Theobserved prevalence will depend on the sample size and the extent of contamination of the batch. If
54
the batch is contaminated at a level of >1cfu/g, there is high probability that, in each 25g sample, thepathogen of concern would be detected. If, however, the sample size were only 1g, some sampleswould not contain cells of the pathogen. If the contamination level were 1/100g, we would expect onlyone in four 25g samples to “test positive”, and it is then more usual to describe this concentration as“25% prevalence”.
In fact, the distribution of bacteria in a sample is likely to follow a Poisson distribution. In that case, ifthe mean concentration is X per gram, and there are Y grams per sample the count per sample isPoisson distributed with mean X*Y. More importantly, the probability of a positive result for a sampleof Y grams is then: 1 - exp(-X*Y). Thus, for large amounts of product, prevalence and concentrationare related and that the estimate of the prevalence depends on the level of contamination and thesample size.
Similarly, products that permit the growth of pathogens may exhibit a low prevalence ofcontamination at the point of production and a higher prevalence at the point of consumption. This isnot necessarily due to re-contamination, but may arise because the product was initially contaminatedat a very low level. Subsequent growth in the product increases the probability of detection of thatcontamination.
Accordingly, in the present hazard:product profile, EHEC concentration was assumed to be 0.1/g.
UCFM from game meatIn the absence of data for prevalence of Salmonella in game meat trim in Tasmania, data from a SouthAustralian survey by Department of Health of kangaroo meat at retail are used. In mid-2002, a surveywas undertaken in Adelaide by Department of Health in which kangaroo samples were purchased atretail and samples (25g) tested for presence of Salmonella. Of 35 samples of kangaroo meat tested, 13(37%, 21%-55% 95% CI) had Salmonella, while 15/35 (43%, 26%-61% 95% CI) of samples ofkangaroo mince were positive.
For the present work a prevalence of 40% was used, with a concentration of 1/g.
Question 7. Effect of ProcessingBased on the work of an MLA expert panel on smallgoods, and of Ross and Shadbolt (2001) oninactivation of E. coli during fermentation and maturation of UCFM, a reduction in EHEC during theUCFM process by 2 log (99%) was assumed.
Question 8. RecontaminationRecontamination was considered not to occur.
Question 9. Effectiveness of Post-processing ControlsPost-process controls were considered to be Not Relevant; it was assumed the level of pathogen doesnot change, though this assumption may be conservative as inactivation may occur during storage atambient.
Question 10. Increase in the post-processing contamination level that would causeinfection or intoxication to the average consumer.UCFM infective doseAn infectious dose of 1,000 was chosen for healthy individuals which approximates that of ca. 2000used by Cassin et al. (1998). For UCFM with a concentration of 5/serve an increase to infective doseof 200x is required.
Salmonella infective doseInfective dose is often interpreted as the dose that leads to infection and illness in all of the people whoconsumed a contaminated food (ID100). Traditionally, the infective dose has been reported around 106
55
Salmonella, based on human feeding trials from the 1940s and 1950s (FAO/WHO, 2002). Morerecently, factors such as age (especially children and the elderly) and food composition, especiallyhigh fat foods such as cheese or chocolate, have been associated with infective doses around or lowerthan100 cells. The fat content of UCFM may range to 35%. As well, FAO/WHO (2002) work basedon outbreak data suggests an ID50 around 10,000 cells and this infective dose is used for the presentexercise.
Thus, for UCFM with a concentration of 50/serve an increase to infective dose of 200x is required.
Question 11. Effect of preparation before eatingIt is assumed that, during storage at ambient either at retail or in the home, no reduction inconcentration of EHEC occurs.
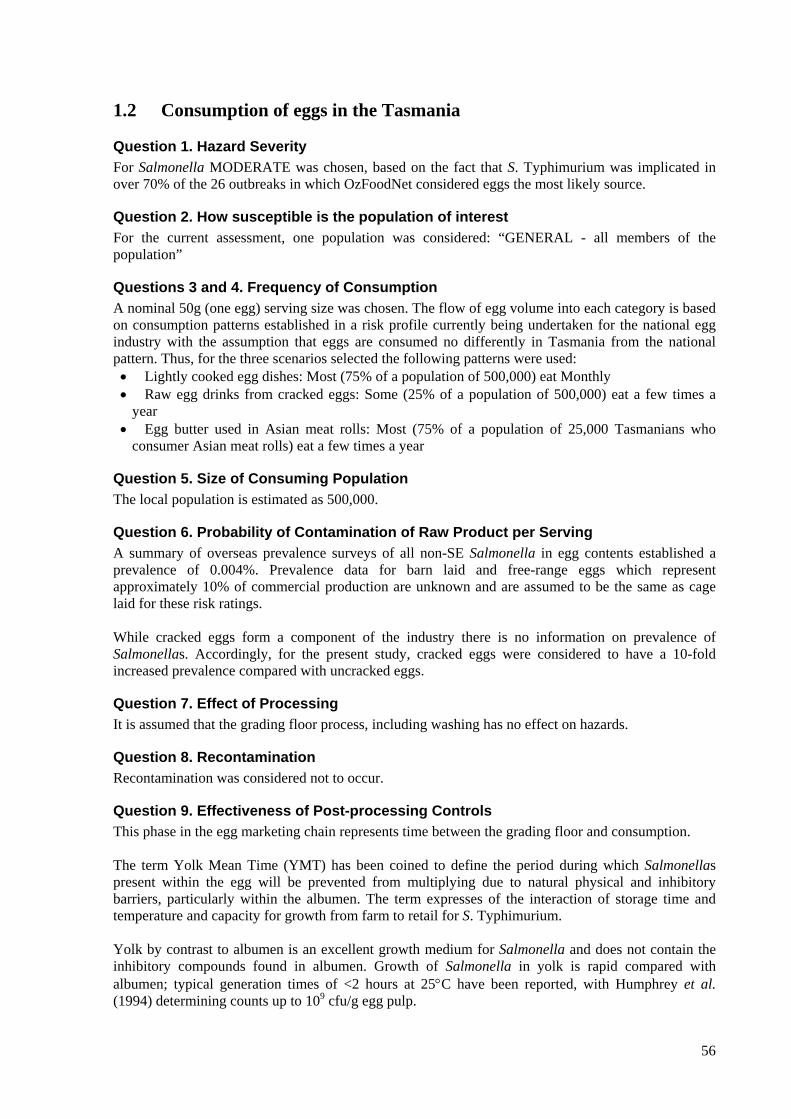
56
1.2 Consumption of eggs in the Tasmania
Question 1. Hazard SeverityFor Salmonella MODERATE was chosen, based on the fact that S. Typhimurium was implicated inover 70% of the 26 outbreaks in which OzFoodNet considered eggs the most likely source.
Question 2. How susceptible is the population of interestFor the current assessment, one population was considered: “GENERAL - all members of thepopulation”
Questions 3 and 4. Frequency of ConsumptionA nominal 50g (one egg) serving size was chosen. The flow of egg volume into each category is basedon consumption patterns established in a risk profile currently being undertaken for the national eggindustry with the assumption that eggs are consumed no differently in Tasmania from the nationalpattern. Thus, for the three scenarios selected the following patterns were used:• Lightly cooked egg dishes: Most (75% of a population of 500,000) eat Monthly• Raw egg drinks from cracked eggs: Some (25% of a population of 500,000) eat a few times a
year• Egg butter used in Asian meat rolls: Most (75% of a population of 25,000 Tasmanians who
consumer Asian meat rolls) eat a few times a year
Question 5. Size of Consuming PopulationThe local population is estimated as 500,000.
Question 6. Probability of Contamination of Raw Product per ServingA summary of overseas prevalence surveys of all non-SE Salmonella in egg contents established aprevalence of 0.004%. Prevalence data for barn laid and free-range eggs which representapproximately 10% of commercial production are unknown and are assumed to be the same as cagelaid for these risk ratings.
While cracked eggs form a component of the industry there is no information on prevalence ofSalmonellas. Accordingly, for the present study, cracked eggs were considered to have a 10-foldincreased prevalence compared with uncracked eggs.
Question 7. Effect of ProcessingIt is assumed that the grading floor process, including washing has no effect on hazards.
Question 8. RecontaminationRecontamination was considered not to occur.
Question 9. Effectiveness of Post-processing ControlsThis phase in the egg marketing chain represents time between the grading floor and consumption.
The term Yolk Mean Time (YMT) has been coined to define the period during which Salmonellaspresent within the egg will be prevented from multiplying due to natural physical and inhibitorybarriers, particularly within the albumen. The term expresses of the interaction of storage time andtemperature and capacity for growth from farm to retail for S. Typhimurium.
Yolk by contrast to albumen is an excellent growth medium for Salmonella and does not contain theinhibitory compounds found in albumen. Growth of Salmonella in yolk is rapid compared withalbumen; typical generation times of <2 hours at 25°C have been reported, with Humphrey et al.(1994) determining counts up to 109 cfu/g egg pulp.
57
For the present analysis it was assumed that:• 50% of cracked eggs are consumed before YMT is resolved• Increase of 100,00x (5-log) occurs when YMT is resolved
Question 10. Increase in the post-processing contamination level that would causeinfection or intoxication to the average consumer.The FAO/WHO (2002) estimate of ID50 around 10,000 cells is used for the present exercise.
Question 11. Effect of preparation before eatingThe end use pathway process has categorised egg meals and dishes into four groups (Table 1.2.1)based on their degree of pathogen reduction in preparation (Humphrey et al 1989). In the presentscenarios thermal treatment is either absent (raw egg drinks) or light, leading to a 2-log reduction.
Table 1.2.1: Thermal inactivation of S. Typhimurium in typical egg meals (after Humphrey et al.1989; Bates and Spencer 1995)
Thermaltreatment
Decimal reduction Types of meal
None Raw egg drinks, somedesserts
Light cooking 100-fold *Boiled 4 min, fried (“sunnyside up”), microwave
Medium cooking 10,000-fold Fried (“easy over”), lightlyscrambled or omelette, pasta
Heavy cooking 1,000,000,000 Hard boiled or scrambled,cakes, biscuits
* Where some liquid yolk remains

58
1.3 Consumption of dairy productsTwo scenarios are followed:• Salmonella in ice cream• Listeria monocytogenes in dips
1.3.1 Salmonella in ice creamThe scenario is based on manufacture of ice-cream from raw materials and ingredients not subject toscrutiny under a food safety program. Although milk is pasteurized, eggs and berry fruit are added,with the potential for recontamination with Salmonella.
Question 1. Hazard SeverityFor Salmonella MODERATE was chosen, based on the fact that S. Typhimurium was implicated inover 70% of the 26 outbreaks in which OzFoodNet considered eggs the most likely source.
Question 2. How susceptible is the population of interestFor the current assessment, one population was considered: “GENERAL - all members of thepopulation”
Questions 3 and 4. Frequency of ConsumptionThe manufacturer produces 20t of product per annum, which equates with 200,000 serves of 100g.This is modeled as Very few (5%) Tasmanians consuming monthly.
Question 5. Size of Consuming PopulationThe local population is estimated as 500,000.
Question 6. Probability of Contamination of Raw Product per ServingA prevalence of 0.001% of milk servings is assumed to be contaminated at a concentration of 0.1/mL.
Question 7. Effect of ProcessingThe process is sufficient to pasteurize milk. But the egg component is contaminated at 1,000 cfu/mL(YMT resolved). A one-log increase in the ice cream mix is selected to allow for 1:100 dilution of eggcomponent in the ice cream mix to give a concentration of 10/g (1000/serve).
Question 8. RecontaminationRecontamination of 1% serves is assumed to occur causing contamination of ice cream mix at 1000cfu/g (this is modeled by selecting 1000-fold increase at Question 7).
Question 9. Effectiveness of Post-processing ControlsPost-process storage is considered well-controlled (frozen storage) with no increase in contamination.
Question 10. Increase in the post-processing contamination level that would causeinfection or intoxication to the average consumer.Increase from 1000/serve to an ID50 of 10,000 cells is 10-fold.
Question 11. Effect of preparation before eatingIf the frozen storage time is sufficiently long there is the possibility of some reduction and 50%reduction is assumed.

59
1.3.2 Listeria monocytogenes in dipsThe scenario is based on manufacture of dips with added fruit or vegetables. Although milk ispasteurized, added ingredients bring the potential for recontamination with E. coli.
Question 1. Hazard SeverityFor E. coli MODERATE severity was chosen.
Question 2. How susceptible is the population of interestFor the current assessment, one population was considered: “GENERAL - all members of thepopulation”
Questions 3 and 4. Frequency of ConsumptionThe manufacturer produces sufficient product so that 50g serves are consumed by Few (5%)Tasmanians a few times a year.
Question 5. Size of Consuming PopulationThe local population is estimated as 500,000.
Question 6. Probability of Contamination of Raw Product per ServingRaw milk is assumed to be contaminated with E. coli at a prevalence of 0.001% and a concentration of0.1 cfu/mL.
Question 7. Effect of ProcessingIt is assumed that pasteurisation eliminates all pathogens.
Question 8. RecontaminationRecontamination with E. coli of 1% serves is assumed to occur at a concentration in the dip of0.1 cfu/g (5 cfu/serve).
Question 9. Effectiveness of Post-processing ControlsPost-process storage over 21 days under refrigeration is assumed to allow a 3-log increase in E. coli.Thus a serve now has a E. coli loading of 5,000 cfu/serve.
Question 10. Increase in the post-processing contamination level that would causeinfection or intoxication to the average consumer.Increase from 5,000/serve to an ID50 of 50,000,000 cells is 10,000-fold.
Question 11. Effect of preparation before eatingSince dips are eaten cold there is no reduction in contamination level during meal preparation.
60
1.4 Consumption of seafoodsA scenario is presented which shows the effectiveness of the State’s oyster monitoring protocol,compared with what might be expected were a system in place similar to that in the Wallis lakeincident of 1997; the hazard is norovirus, responsible for three large outbreaks from oysters in NSW.
Question 1. Hazard SeverityFor norovirus MILD severity was chosen.
Question 2. How susceptible is the population of interestFor the current assessment, one population was considered: “GENERAL - all members of thepopulation”
Questions 3 and 4. Frequency of ConsumptionA proportion of SOME (25%) of Tasmanians were considered to eat oysters once a month with aserving size of 100g (half dozen oysters).
Question 5. Size of Consuming PopulationThe local population is estimated as 500,000.
Question 6. Probability of Contamination of Raw Product per ServingOysters from approved waters were considered to have a prevalence of norovirus of 0.0001%compared with 15% from unapproved waters during a contamination incident.
Question 7. Effect of ProcessingIt was assumed that depuration and subsequent storage did not eliminate norovirus.
Question 8. RecontaminationRecontamination was considered not to occur.
Question 9. Effectiveness of Post-processing ControlsPost processing controls were considered to have no effect on prevalence or concentration of viruses.
Question 10. Increase in the post-processing contamination level that would causeinfection or intoxication to the average consumer.An increase of 100x was considered necessary for infection.
Question 11. Effect of preparation before eatingProduct was eaten raw with no effect on norovirus.

61
Appendix 2: Risk Ranger
1 Background to developing Risk RangerIf you’re a risk manager you need to be able to compare and prioritise risks. There are a number ofdecision support tools which will rank or rate a hazard:product combination. There are several semi-quantitative scoring systems such as those by Pierson and Corlett (1992), shown in Table 1 and byHuss et al. (2000), which is illustrated in Table 2.
Table 1: Hazard Classification of Corlett and Pierson (1992)Hazard Risk characteristicsA Special class restricted for at-risk populations, e.g. the aged immunocompromised, infantsB Product contains sensitive ingredientsC Process has no step which destroys sensitive organismsD Product is subject to re-contamination between processing and packagingE Potential for abuse by distributor or consumer which could render the product hazardousF Product is consumed without further process to kill micro-organisms
Table 2: Qualitative risk assessment based on the process of Huss et al.Risk criteria Raw molluscan
shellfishCanned
fishDriedfish
Bad safety record + + -No CCP for the hazard + - -Possibility of contamination orrecontamination
+ + -
Abusive handling possible + - -Growth of pathogens can occur + - -No terminal heating step + + +
Risk category High Low No risk
These tools can help you categorise risk but they can’t measure the way individual factors affectbecause they don’t focus on the steps or variables where control could be applied.
Risk Ranger is a simple food safety risk calculation tool intended to help determine relative risks fromvarious product/hazard combinations it. In particular, it’s intended to make the techniques of foodsafety risk assessment more accessible to non-expert users, and to users with limited resources, both asa decision-aid and an educational tool.
Risk Ranger incorporates all factors that affect the risk from a hazard in a particular commodityincluding:• Severity of the hazard and susceptibility of the population of interest• Likelihood of a disease-causing dose of the hazard being present in a meal• Number of meals consumed by a population of interest in a given period of time
A number of factors affect each of the above.Disease severity is affected by:
a) Intrinsic features of the pathogen/toxinb) Susceptibility of the consumer
Exposure to the food will depend on how much is consumed by the population of interest, how
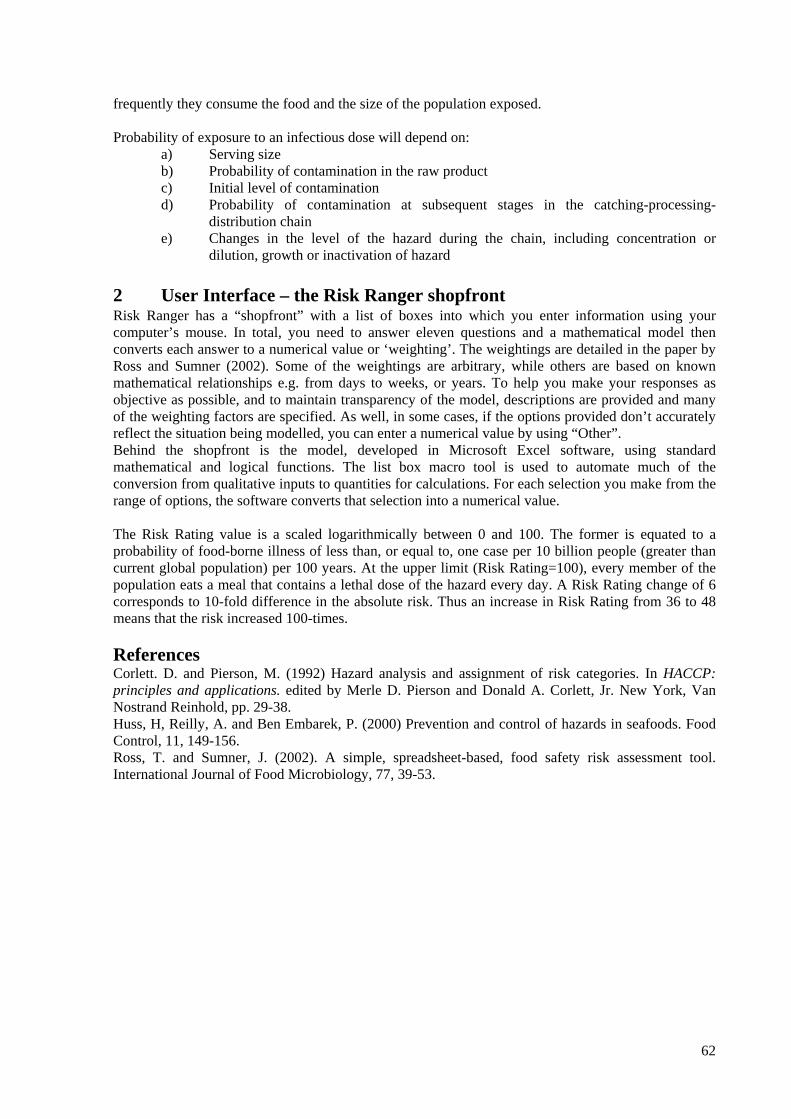
62
frequently they consume the food and the size of the population exposed.
Probability of exposure to an infectious dose will depend on:a) Serving sizeb) Probability of contamination in the raw productc) Initial level of contaminationd) Probability of contamination at subsequent stages in the catching-processing-
distribution chaine) Changes in the level of the hazard during the chain, including concentration or
dilution, growth or inactivation of hazard
2 User Interface – the Risk Ranger shopfrontRisk Ranger has a “shopfront” with a list of boxes into which you enter information using yourcomputer’s mouse. In total, you need to answer eleven questions and a mathematical model thenconverts each answer to a numerical value or ‘weighting’. The weightings are detailed in the paper byRoss and Sumner (2002). Some of the weightings are arbitrary, while others are based on knownmathematical relationships e.g. from days to weeks, or years. To help you make your responses asobjective as possible, and to maintain transparency of the model, descriptions are provided and manyof the weighting factors are specified. As well, in some cases, if the options provided don’t accuratelyreflect the situation being modelled, you can enter a numerical value by using “Other”.Behind the shopfront is the model, developed in Microsoft Excel software, using standardmathematical and logical functions. The list box macro tool is used to automate much of theconversion from qualitative inputs to quantities for calculations. For each selection you make from therange of options, the software converts that selection into a numerical value.
The Risk Rating value is a scaled logarithmically between 0 and 100. The former is equated to aprobability of food-borne illness of less than, or equal to, one case per 10 billion people (greater thancurrent global population) per 100 years. At the upper limit (Risk Rating=100), every member of thepopulation eats a meal that contains a lethal dose of the hazard every day. A Risk Rating change of 6corresponds to 10-fold difference in the absolute risk. Thus an increase in Risk Rating from 36 to 48means that the risk increased 100-times.
ReferencesCorlett. D. and Pierson, M. (1992) Hazard analysis and assignment of risk categories. In HACCP:principles and applications. edited by Merle D. Pierson and Donald A. Corlett, Jr. New York, VanNostrand Reinhold, pp. 29-38.Huss, H, Reilly, A. and Ben Embarek, P. (2000) Prevention and control of hazards in seafoods. FoodControl, 11, 149-156.Ross, T. and Sumner, J. (2002). A simple, spreadsheet-based, food safety risk assessment tool.International Journal of Food Microbiology, 77, 39-53.
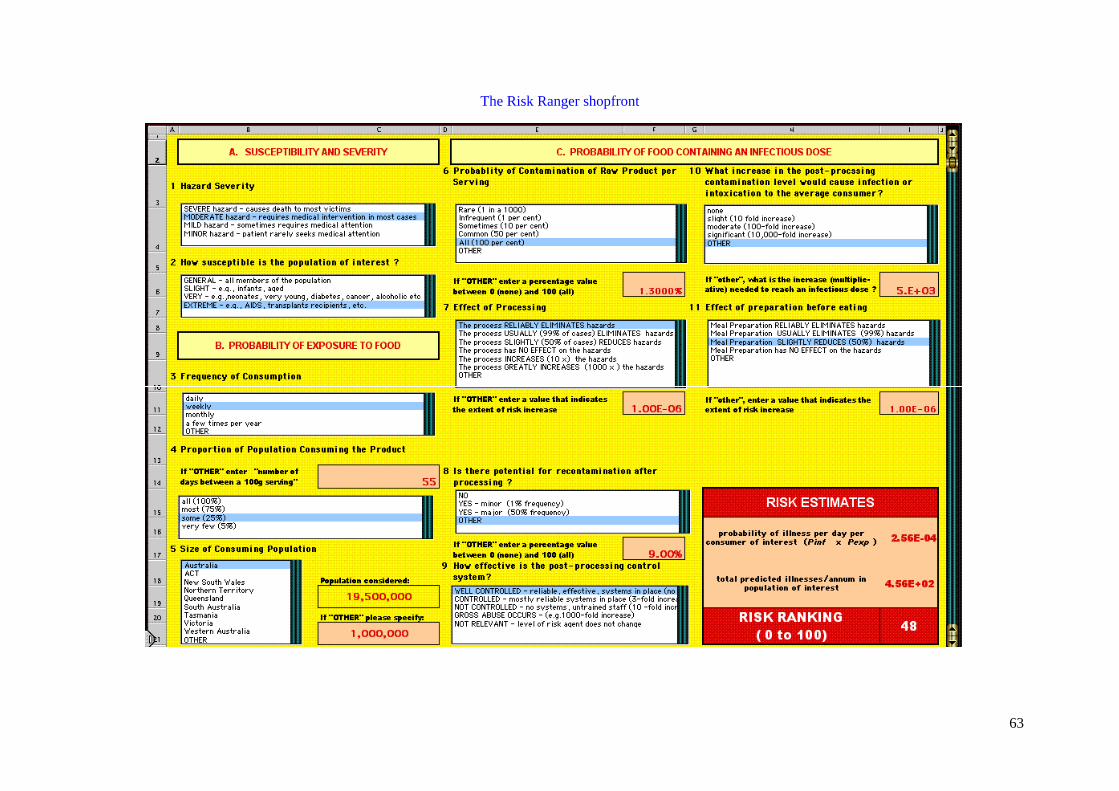
63
The Risk Ranger shopfront