management discussion & analysis · free cash flow 31 14. critical accounting estimates and...
TRANSCRIPT

Management Discussion& Analysis

MANAGEMENT’S DISCUSSION AND ANALYSISOF FINANCIAL CONDITION AND RESULTS OF OPERATIONSFor the year ended December 31, 2017
� Table of Contents
1. Reader Advisories 2
2. Executive Summary 3
3. Outlook 5
4. Market 6
5. Selected Annual Financial Information 10
6. Selected Quarterly Financial Information 11
7. Results of Operations 12
8. Same Store Results 19
9. Acquisitions, Relocations and Real estate 23
10. Liquidity and Capital Resources 26
11. Outstanding Shares 30
12. Dividends 30
13. Free Cash Flow 31
14. Critical Accounting Estimates and Accounting Policy
Developments 34
15. Disclosure Controls and Internal Controls over
Financial Reporting 34
16. Risk Factors 35
17. Forward looking Statements 35
18. Non-GAAP Measures 36

1. READER ADVISORIESThis Management’s Discussion & Analysis (“MD&A”)was prepared as of March 15, 2018 to assist readers inunderstanding AutoCanada Inc.’s (the “Company” or“AutoCanada”) consolidated financial performance forthe year ended December 31, 2017 and significanttrends that may affect AutoCanada’s futureperformance. The following discussion and analysisshould be read in conjunction with the audited annualconsolidated financial statements and accompanyingnotes (the “Consolidated Financial Statements”) ofAutoCanada as at and for the year endedDecember 31, 2017. Results are reported in Canadiandollars. Certain dollars have been rounded to thenearest thousand dollars, unless otherwise stated.Reference to the notes are to the Notes of theConsolidated Financial Statements of the Companyunless otherwise stated.
To provide more meaningful information, this MD&Atypically refers to the operating results for the threemonth period and year ended December 31, 2017 ofthe Company, and compares these to the operating
results of the Company for the three month periodand year ended December 31, 2016.
This MD&A contains forward-looking statements.Please see the section “FORWARD-LOOKINGSTATEMENTS” for a discussion of the risks,uncertainties and assumptions used to develop ourforward-looking information. This MD&A also makesreference to certain non-GAAP measures to assistusers in assessing AutoCanada’s performance.Non-GAAP measures do not have any standardmeaning prescribed by GAAP and are thereforeunlikely to be comparable to similar measurespresented by other issuers. These measures areidentified and described under the section“NON-GAAP MEASURES.”
Additional information regarding our Company,including our 2017 Annual Information Form, datedMarch 15, 2018, is available on SEDAR atwww.sedar.com and our website www.autocan.ca.Such additional information is not incorporated byreference herein, unless otherwise specified, andshould not be deemed to be made part of this MD&A.
Page M2 Š AutoCanada Š 2017 Annual Report

2. EXECUTIVE SUMMARYPerformance vs. the Fourth Quarter of Prior Year
The following table summarizes the Company’s operations for the quarter as well as year to date results:
Three months ended December 31 Year ended December 31Consolidated Operational Data 2017 2016 % Change 2017 2016 % Change
EBITDA attributable to AutoCanadashareholders1,2 28,127 25,260 11.3% 111,812 94,486 18.3%
Adjusted EBITDA attributable to AutoCanadashareholders1,2 21,880 19,038 14.9% 95,410 88,809 7.4%
Net earnings attributable to AutoCanadashareholders1,2 17,089 13,785 24.0% 57,844 2,596 2128.2%
Adjusted net earnings attributable toAutoCanada shareholders1,2 8,935 7,536 18.6% 42,665 39,926 6.9%
Basic EPS 0.62 0.50 24.0% 2.11 0.09 2244.4%Adjusted diluted EPS2 0.33 0.27 22.2% 1.55 1.45 6.9%Weighted average number of shares - Basic 27,389,167 27,353,431 0.1% 27,379,193 27,350,555 0.1%Weighted average number of shares - Diluted 27,498,724 27,469,439 0.1% 27,473,995 27,455,686 0.1%
New retail vehicles sold (units) 8,444 7,590 11.3% 36,076 32,991 9.4%New fleet vehicles sold (units) 1,378 859 60.4% 7,697 7,041 9.3%Used retail vehicles sold (units) 4,653 4,463 4.3% 19,379 19,561 -0.9%
Total vehicles sold 14,475 12,912 12.1% 63,152 59,593 6.0%Revenue 733,060 629,274 16.5% 3,101,560 2,891,581 7.3%Gross Profit 125,210 116,785 7.2% 518,629 486,133 6.7%Gross Profit % 17.1% 18.6% -8.2% 16.7% 16.8% -0.5%Operating expenses 104,626 97,397 7.4% 426,253 400,417 6.5%Operating expenses % of Gross Profit 83.6% 83.4% 0.2% 82.2% 82.4% -0.3%Operating Profit 26,505 20,761 27.7% 118,969 40,912 190.8%Free cash flow 29,496 23,424 25.9% 72,213 96,288 -25.0%Adjusted free cash flow 15,996 13,133 21.8% 90,786 68,566 32.4%
Same Store New retail vehicles sold (units) 7,196 6,845 5.1% 31,402 30,422 3.2%Same Store New fleet vehicles sold (units) 1,349 808 67.0% 7,600 6,932 9.6%Same Store Used retail vehicles sold (units) 4,051 4,162 -2.7% 17,233 18,560 -7.1%
Same Store Total vehicles sold 12,596 11,815 6.6% 56,235 55,914 0.6%Same Store Revenue 647,099 582,368 11.1% 2,784,999 2,730,659 2.0%Same Store Gross Profit 110,249 108,683 1.4% 467,030 459,984 1.5%Same Store Gross Profit % 17.0% 18.7% -8.7% 16.8% 16.8% -0.4%
1 Represents the portion attributable to AutoCanada Shareholders2 These financial measures have been calculated as described under “NON-GAAP MEASURES”.
2017 Full Year Highlights
Š Revenue was $3.1 billion, up 7.3% comparedwith 2016. Revenue from same stores was up2.0% year-over-year.
Š Operating expenses of $426.3 million, as apercentage of gross profit improved to 82.2%from 82.4% in 2016.
Š Gross profit was $518.6 million, up 6.7%compared with 2016, with gross profit as apercentage of revenue relatively flat at 16.7%from 16.8% in 2016.
Š Sales of new vehicles were 43,773 in the year,up 9.3% over the prior year. Revenue from thesale of new vehicles was $1.8 billion, up10.6% from 2016. New vehicles accounted for58.9% of the Company’s total revenue and25.3% of gross profit versus 57.2% of revenueand 24.3% of gross profit in 2016.
Š Sales of used vehicles were 19,379 in 2017,down 1.0% from last year. Revenue from usedvehicle sales was $716.0 million, down 1.3%from the prior year. Used vehicles accountedfor 23.1% of the Company’s total revenue and
AutoCanada Š 2017 Annual Report Š Page M3

8.4% of gross profit, versus 25.1% of revenueand 9.7% of gross profit in 2016.
Š Parts, service and collision repair generated$416.7 million of revenue, up 8.8% from2016. This accounted for 13.4% of theCompany’s total revenue and 41.3% of itsgross profit, versus 13.2% of revenue and41.4% of gross profit in 2016.
Š Finance insurance and other generated$141.3 million of revenue, an improvement of8.6% from 2016. This accounted for 4.6% ofthe Company’s total revenue and 25.0% of itsgross profit, up from 4.5% of revenue and24.6% of profit in 2016.
Š EBITDA attributable to AutoCanadashareholders increased by $17.3 million or18.3% to $111.8 million from $94.5 million inthe prior year.
Š The Company generated net earningsattributable to AutoCanada shareholders of$57.8 million ($42.7 million on an adjustedbasis), or $2.11 per share ($1.56 adjusted)versus $2.6 million in 2016 ($39.9 millionadjusted) or $0.09 per share ($1.46 adjusted).
Fourth Quarter Highlights
Š Revenue was $733.1 million, up 16.5%compared with the fourth quarter of 2016.Same store revenue growth was up 11.1% inthe fourth quarter of this year.
Š Operating expenses of $104.6 million, as apercentage of gross profit were up to 83.6%from 83.4% over the same period in 2016.
Š Gross profit was $125.2 million, up 7.2%compared with the same quarter in 2016,with gross profit as a percentage of revenuedecreasing to 17.1% from 18.6%.
Š Operating profit of $26.5 million is up 27.7%from 20.7 million in the fourth quarter of2016.
Š New vehicle sales were 9,822, up 16.3% fromsame period in 2016. Revenue from the saleof new vehicles was $417.6 million, up 20.0%from same period in 2016. The sale of newvehicles accounted for 57.0% of theCompany’s total revenue and 24.0% of grossprofit versus 55.3% of revenue and 21.4% ofgross profit in the fourth quarter of 2016.
Š Used vehicle sales were 4,653, up 4.3% fromthe same quarter last year. Revenue from thesale of used vehicles sales was $175.3 million,up 11.1% from same time last year. The saleof used vehicles accounted for 23.4% of theCompany’s total revenue and 6.0% of grossprofit, versus 21.4% of revenue and 8.6% ofgross profit in the fourth quarter of 2016.
Š Parts, service and collision repair generated$107.2 million of revenue, up 16.1% fromsame time 2016. This accounted for 14.6% ofthe Company’s total revenue and 45.5% of itsgross profit, versus 14.7% of revenue and45.3% of gross profit in the same quarter of2016.
Š Finance and insurance generated$33.0 million of revenue, an improvement of6.1% from same period in 2016. Thisaccounted for 4.5% of the Company’s totalrevenue and 24.5% of its gross profit, downfrom 4.9% of revenue and 24.6% of profit inthe fourth quarter of 2016.
Š EBITDA attributable to AutoCanadashareholders increased by $2.9 million or11.3% to $28.1 million from $25.3 millionsame time last year.
Š The Company generated net earningsattributable to AutoCanada shareholders of$17.1 million ($8.9 million on an adjustedbasis), or $0.62 per share ($0.33 adjusted)versus $13.8 million in 2016 ($7.5 millionadjusted) or $0.50 per share ($0.28 adjusted).
Page M4 Š AutoCanada Š 2017 Annual Report

3. OUTLOOKThe Canadian vehicle market established a new recordfor sales in 2017, surpassing the previous record set in2016. Sales topped two million for the first time, withSUVs and trucks accounting for close to 7 out of 10new vehicles sold in the country. Early projections for2018 speak of a strong Canadian market continuing –the economy is doing well and interest rates continueto be low, but are expected to increase. ForAutoCanada, a strong economy with lowunemployment provides a healthy macro environmentwhile the preference for trucks and SUVs sits well withthe Company’s current product mix.
AutoCanada will continue to add a wide range of newbrands and dealerships in new and growing markets.New vehicle sales continue to be the initial touchpointfor building and growing customer relationships,including resale of trade-ins, sale of third-party serviceor insurance products and recurring service and repairbusiness. Each of the Company’s business segmentsexperienced gains in the fourth quarter andthroughout 2017, with the exception of a slightdownturn of used vehicle sales over the year.
The Company’s continued focus on operationalexcellence resulted in enhanced dealershipperformance in 2017 and should continue to lead tofurther improvement in 2018. The Company’smulti-location model serves a diversified geographiccustomer and revenue base while its dealershipcluster strategy enables other scalable benefits. TheCompany’s operations continue to be decentralizedwhile it centralizes administration and strategy. It isable to provide strong support to its dealershipnetwork through brand team platforms, which arebetter positioned to meet the needs of both dealersand OEMs. The brand team platform approach had itsfirst full year of operation in 2017 and the Companysaw same store sales and profitability both increase.
Growth will continue to be driven by the Company’sacquisition strategy. Two single dealership businesseswere acquired in 2017, each adding a new OEMrelationship (Mercedes-Benz and Mazda) and bothjoining a cluster of dealerships in the same urban
market (Montreal). The Company also strengthened itsrelationship with General Motors in 2017, a move thatshould help foster further growth over the long-term.A Public Company Master Agreement (PCMA) permitsAutoCanada’s direct ownership and voting control ofGM Canada dealerships for the first time. OnJanuary 2, 2018 the Company closed an agreementwith CanadaOne Auto Group, a company controlledby Patrick Priestner, the Company’s former CEO andfounder. As part of that agreement, AutoCanadaassumed control of five of the nine dealerships whereit held a majority equity stake with no voting rightsand CanadaOne Auto Group bought AutoCanada’sinterest in the remaining four. Related to thisagreement, AutoCanada will see decreases toRevenue, Gross Profit and Unit sales figures, given itsdivestiture of the four dealerships.
Acquiring new dealerships and effectively integratingthem is key to AutoCanada’s long-term success. TheCompany has made significant progress and willcontinue to look for further incremental improvementsrelated to integration, operating efficiencies anddeeper IT and analytical capabilities across its entirenetwork of dealerships. AutoCanada is actively lookingto replace General Motors volume and net earningsthrough GM acquisitions.
In addition to acquisitions, the Company pursuesopportunisitic growth through planned capitalprojects, such as new dealership facilities, currentdealership expansion and imaging requirements, andselect open point opportunities. As at December 31,2017, the Company has earmarked $142.7 millionover five years for contemplated future capitalprojects.
While the Auto industry is experiencing disruptionincluding electric vehicles, ride sharing, autonomousvehicles and car ride service providers, AutoCanadaconsiders these changes in the industry to be positive.The company has indicated to our OEM partners thatwe are prepared to pilot any new trends in thedisruption looking for opportunities to improvecustomer sales and service interaction digitally and atour dealerships.
AutoCanada Š 2017 Annual Report Š Page M5

4. MARKET
The Company’s geographical profile is illustrated below by the number of dealerships, revenues and gross profitby province for the years ended December 31, 2017 and December 31, 2016.
December 31, 2017
Location of DealershipsNumber of
Franchises1Number of
Dealerships1 RevenueRevenue
% of TotalGrossProfit
Gross Profit% of Total
British Columbia 13 11 590,528 19% 95,269 18%Alberta 28 25 1,224,178 39% 219,738 42%Saskatchewan 4 4 243,321 8% 45,146 9%Manitoba 4 4 194,888 6% 35,145 7%Ontario 9 8 281,562 9% 44,764 9%Quebec 6 4 420,969 14% 57,955 11%Atlantic 2 2 146,114 5% 20,612 4%Total 66 58 3,101,560 100% 518,629 100%
1 “Dealerships” refers to each physical storefront while “Franchises” refers to each separate franchise agreement.
December 31, 2016
Location of DealershipsNumber of
Franchises1Number of
Dealerships1 Revenue
Revenue% of
TotalGrossProfit
Gross Profit% of Total
British Columbia 13 11 578,938 20% 92,404 19%Alberta 27 24 1,168,334 40% 213,108 44%Saskatchewan 4 4 236,354 8% 44,977 9%Manitoba 4 4 182,282 6% 33,789 7%Ontario 9 8 215,954 8% 31,879 6%Quebec 4 2 334,255 12% 47,441 10%Atlantic 2 2 175,464 6% 22,535 5%Total 63 55 2,891,581 100% 486,133 100%
1 “Dealerships” refers to each physical storefront while “Franchises” refers to each separate franchise agreement.
The Company’s manufacturers profile is illustrated below by number of dealerships and revenues bymanufacturer for the years ended December 31, 2017 and December 31, 2016.
December 31, 2017 December 31, 2016
ManufacturerNumber of
Franchises1Number of
Dealerships1 RevenueRevenue
% of TotalNumber of
Franchises1Number of
Dealerships1 Revenue
Revenue% of
Total
FCA 23 17 1,246,120 40% 23 17 1,285,894 44%General Motors 9 9 653,618 21% 9 9 579,337 20%Hyundai 9 9 240,843 8% 9 9 218,403 8%Nissan /Infiniti 7 7 234,824 8% 7 7 241,186 8%Volkswagen / Audi 8 8 256,063 8% 7 7 187,911 6%BMW / MINI 4 2 352,631 11% 4 2 334,254 12%Other 6 6 117,461 4% 4 4 44,596 2%Total 66 58 3,101,560 100% 63 55 2,891,581 100%
1 “Dealerships” refers to each physical storefront while “Franchises” refers to each separate franchise agreement.
Page M6 Š AutoCanada Š 2017 Annual Report

Performance vs. the Canadian New Vehicle Market
The Canadian automotive retail sector year to date has increased by 4.6% compared to the prior year. New lightvehicle sales in Alberta for the year ended December 31, 2017 were up 11.3% and up 7.0% in British Columbiawhen compared to the prior year.
The Company’s same store unit sales of new vehicles increased by 11.7% during the three month period endedDecember 31, 2017, and increased by 4.4% during the year ended December 31, 2017.
The following table summarizes Canadian new light vehicle sales for the years ended December 31, 2017 andDecember 31, 2016 by Province:
Canadian New Vehicle Sales by Province1,2
2017 2016PercentChange
UnitChange
British Columbia 233,615 218,235 7.0% 15,380Alberta 244,302 219,421 11.3% 24,881Saskatchewan 55,260 50,888 8.6% 4,372Manitoba 61,661 55,654 10.8% 6,007Ontario 837,480 806,500 3.8% 30,980Quebec 462,087 458,287 0.8% 3,800Atlantic 144,393 139,914 3.2% 4,479
Total 2,038,798 1,948,899 4.6% 89,899
1 DesRosiers Automotive Consultants Inc.2 Readers are cautioned that the above table includes sales channels that the Company does not fully participate in such as
daily rentals, and small and medium size leasing companies that are not part of the franchise dealership network.
December Year to Date Canadian New Vehicle Sales by Brand1,2
December 31,2017
December 31,2016
PercentChange
UnitChange
Audi 36,077 30,544 18.1% 5,533BMW 38,562 38,012 1.4% 550FCA 267,052 277,445 -3.7% -10,393General Motors 302,826 267,341 13.3% 35,485Hyundai 129,348 136,156 -5.0% -6,808Infiniti 12,433 12,094 2.8% 339Kia 76,504 71,670 6.7% 4,834Mercedes-Benz 51,930 46,445 11.8% 5,485MINI 7,051 6,609 6.7% 442Mitsubishi 22,706 22,293 1.9% 413Nissan 134,244 122,059 10.0% 12,185Subaru 54,570 50,190 8.7% 4,380Volkswagen 69,634 60,017 16.0% 9,617Mazda 74,056 69,210 7.0% 4,846
Total - AutoCanada Brands 1,276,993 1,210,085 5.5% 66,908
Other - Non-AutoCanada Brands 761,805 738,814 3.1% 22,991
Total 2,038,798 1,948,899 4.6% 89,899
1 DesRosiers Automotive Consultants Inc.2 Readers are cautioned that the above table includes sales channels that the Company does not fully participate in such as
daily rentals, and small and medium size leasing companies that are not part of the franchise dealership network.
AutoCanada Š 2017 Annual Report Š Page M7

List of Dealerships
The following table sets forth the dealerships that we currently own and operate and the date opened or acquiredby the Company or its predecessors, organized by location.
Location Operating Name FranchiseYear Opened
or AcquiredSame
Stores1Owned or
Leased2
Wholly-Owned Dealerships:Abbotsford, BC Abbotsford Volkswagen Volkswagen 2011 Y LeasedChilliwack, BC Chilliwack Volkswagen Volkswagen 2011 Y OwnedKelowna, BC Okanagan Chrysler Jeep Dodge FIAT FCA 2003 Y LeasedMaple Ridge, BC Maple Ridge Chrysler Jeep Dodge
FIAT ALFA ROMEO FCA 2005 Y LeasedMaple Ridge, BC Maple Ridge Volkswagen Volkswagen 2008 Y LeasedPrince George, BC Northland Chrysler Jeep Dodge FCA 2002 Y OwnedPrince George, BC Northland Hyundai Hyundai 2005 Y OwnedPrince George, BC Northland Nissan Nissan 2007 Y OwnedVictoria, BC Victoria Hyundai Hyundai 2006 Y OwnedAirdrie, AB Airdrie Chrysler Jeep Dodge Ram FCA 2015 Y LeasedCalgary, AB Courtesy Chrysler Dodge FCA 2013 Y LeasedCalgary, AB Calgary Hyundai Hyundai 2014 Y LeasedCalgary, AB Crowfoot Hyundai Hyundai 2014 Y LeasedCalgary, AB Courtesy Mitsubishi Mitsubishi 2014 Y LeasedCalgary, AB Northland Volkswagen Volkswagen 2014 Y LeasedCalgary, AB Fish Creek Nissan Nissan 2014 Y LeasedCalgary, AB Hyatt Infiniti Infiniti 2014 Y LeasedCalgary, AB Tower Chrysler Jeep Dodge Ram FCA 2014 Y LeasedEdmonton, AB Crosstown Chrysler Jeep Dodge FIAT FCA 1994 Y LeasedEdmonton, AB Capital Chrysler Jeep Dodge FIAT FCA 2003 Y LeasedEdmonton, AB North Edmonton Kia Kia 2014 Y OwnedGrande Prairie, AB Grande Prairie Chrysler Jeep Dodge
FIAT FCA 1998 Y OwnedGrande Prairie, AB Grande Prairie Hyundai Hyundai 2005 Y OwnedGrande Prairie, AB Grande Prairie Subaru Subaru 1998 Y OwnedGrande Prairie, AB Grande Prairie Mitsubishi Mitsubishi 2007 Y OwnedGrande Prairie, AB Grande Prairie Nissan Nissan 2007 Y OwnedGrande Prairie, AB Grande Prairie Volkswagen Volkswagen 2013 Y OwnedPonoka, AB Ponoka Chrysler Jeep Dodge FCA 1998 Y OwnedSherwood Park, AB Sherwood Park Hyundai Hyundai 2006 Y OwnedSherwood Park, AB Sherwood Park Volkswagen4 Volkswagen 2016 Q2 2019 OwnedSpruce Grove, AB Grove Dodge Chrysler Jeep FCA 2015 Q1 2018 LeasedSaskatoon, SK Dodge City Chrysler Jeep Dodge Ram FCA 2014 Y LeasedWinnipeg, MB Audi Winnipeg Audi 2013 Y OwnedWinnipeg, MB St. James Volkswagen Volkswagen 2013 Y OwnedWinnipeg, MB Eastern Chrysler Jeep Dodge FCA 2014 Y OwnedCambridge, ON Cambridge Hyundai Hyundai 2008 Y OwnedMississauga, ON 401 Dixie Hyundai Hyundai 2008 Y LeasedOttawa, ON Hunt Club Nissan Nissan 2015 Q1 2018 LeasedOttawa, ON 417 Nissan Nissan 2015 Q1 2018 LeasedOttawa, ON 417 Infiniti Infiniti 2015 Q1 2018 LeasedGuelph, ON Guelph Hyundai Hyundai 2016 Q1 2019 Owned
Page M8 Š AutoCanada Š 2017 Annual Report

Location Operating Name FranchiseYear Opened
or AcquiredSame
Stores1Owned or
Leased2
Guelph, ON Wellington Motors FCA 2016 Q1 2019 OwnedToronto, ON Toronto Chrysler Jeep Dodge Ram FCA 2014 Y LeasedMontreal, QC Mercedes-Benz Rive-Sud5 Mercedes-Benz 2017 Q2 2019 LeasedMoncton, NB Moncton Chrysler Jeep Dodge FCA 2001 Y OwnedDartmouth, NS Dartmouth Chrysler Jeep Dodge FCA 2006 Y Leased
Equity Investments:Duncan, BC Island Chevrolet Buick GMC General Motors 2013 Y LeasedKelowna, BC Kelowna Chevrolet7 General Motors 2015 Y OwnedEdmonton, AB Lakewood Chevrolet7 General Motors 2014 Y OwnedSherwood Park, AB Sherwood Park Chevrolet7 General Motors 2012 Y LeasedSherwood Park, AB Sherwood Buick GMC7 General Motors 2012 Y LeasedNorth Battleford, SK Bridges Chevrolet Buick GMC General Motors 2014 Y OwnedPrince Albert, SK Mann-Northway Auto Source General Motors 2014 Y LeasedSaskatoon, SK Saskatoon Motor Products General Motors 2014 Y LeasedWinnipeg, MB McNaught Cadillac Buick GMC General Motors 2014 Y OwnedLaval, QB BMW Laval and MINI Laval BMW / MINI 2014 Y OwnedMontreal, QB BMW Canbec and MINI Mont Royal BMW / MINI 2014 Y LeasedMontreal, QC Planète Mazda6 Mazda 2017 Q1 2020 Leased
Dealership Loan Financing:Edmonton, AB Southview Acura3 Acura 2016 N/A N/AWhitby, ON Whitby Honda3 Honda 2015 N/A N/A
1 Same store (indicated with the letter “Y” in the table above) means the franchised automobile dealership has been owned forat least 2 full years since acquisition. The dealership is then included in the quarter thereafter, for same store analysis.
2 This column summarizes whether the dealership real estate is owned or leased.3 For further detail on dealership loan financing, refer to “LIQUIDITY AND CAPITAL RESOURCES” section under Related Party
Transactions.4 On February 1, 2017, Sherwood Park Volkswagen open point opened for operations.5 On May 1, 2017, the Company purchased all of the issued and outstanding shares of Mercedes-Benz Rive-Sud in Montreal,
Quebec. See “ACQUISITIONS, RELOCATIONS, AND REAL ESTATE” for more information related to this dealership acquisition.6 On December 1, 2017 the Company purchase 95% of the issued and outstanding shares of Planète Mazda in Montreal,
Quebec. See “ACQUISITIONS, RELOCATIONS, AND REAL ESTATE” for more information related to this dealership acquisition.7 On January 2, 2018 as part of the General Motors Transaction (M24) the Company sold 100% of its non-voting equity
interests in these locations as disclosed in the annual consolidated financial statements of the company for the year endedDecember, 31, 2017 (Note 40).
AutoCanada Š 2017 Annual Report Š Page M9

5. SELECTED ANNUAL FINANCIAL INFORMATIONThe following table shows the results of the Company for the years ended December 31, 2017, December 31,2016 and December 31, 2015. The results of operations for these years are not necessarily indicative of theresults of operations to be expected in any given comparable period.
AutoCanada (in thousands of dollars, except Gross Profit %, Earningsper share, and Operating Data) 2017 2016 2015
Income Statement DataNew vehicles 1,827,559 1,652,795 1,668,237Used vehicles 716,045 725,430 704,569Parts, service and collision repair 416,690 382,933 387,614Finance, insurance and other 141,266 130,423 143,383
Revenue 3,101,560 2,891,581 2,903,803
New vehicles 130,984 118,297 122,408Used vehicles 43,738 47,192 40,629Parts, service and collision repair 214,310 201,259 193,868Finance, insurance and other 129,597 119,385 130,804
Gross profit 518,629 486,133 487,709
Gross Profit % 16.7% 16.8% 16.8%Operating expenses 426,253 400,417 395,877Operating expenses as a % of gross profit 82.2% 82.4% 81.2%Operating Profit2 118,969 40,912 78,919Impairment (recovery) of intangible assets and goodwill (816) 54,096 18,757Net earnings attributable to AutoCanada shareholders 57,844 2,596 22,821Adjusted net earnings attributable to AutoCanada shareholders2,4 42,665 39,926 40,343EBITDA attributable to AutoCanada shareholders2 111,812 94,486 89,838EBITDA % of Sales2 3.6% 3.3% 3.1%Free cash flow2 72,213 96,288 38,675Adjusted free cash flow2 90,786 68,566 38,796Basic earnings per share 2.11 0.09 0.93Diluted earnings per share 2.11 0.09 0.92Basic adjusted earnings per share2,4 1.56 1.46 1.64Diluted adjusted earnings per share2,4 1.55 1.45 1.64Dividends declared per share 0.40 0.55 1.00
Operating Data
Vehicles (new and used) sold 63,152 59,593 62,799New vehicles sold3 43,773 40,032 42,457New retail vehicles sold3 36,076 32,991 35,323New fleet vehicles sold3 7,697 7,041 7,134Used retail vehicles sold3 19,379 19,561 20,342# of service & collision repair orders completed3 870,616 863,970 847,702Absorption rate2 89% 86% 91%# of dealerships at year end 58 55 54# of same store dealerships 49 44 28# of service bays at year end 999 928 912Same store revenue growth1 2.0% (5.6)% (5.9)%Same store gross profit growth1 1.5% (5.4)% (11.7)%
1 Same stores revenue growth and same stores gross profit growth is calculated using franchised automobile dealerships thatwe have owned for at least 2 full years.
2 These financial measures have been calculated as described under “NON-GAAP MEASURES”.3 This number includes 100% of vehicles and service and collision repair orders sold by dealerships in which we have less than
100% investment.4 In Q1 2017, the Company redefined the calculation of adjusted net earnings.
Page M10 Š AutoCanada Š 2017 Annual Report

6. SELECTED QUARTERLY FINANCIAL INFORMATION
The following table shows the unaudited results of the Company for each of the eight most recently completedquarters. The results of operations for these periods are not necessarily indicative of the results of operations tobe expected in any given comparable period.
(in thousands of dollars, except Gross Profit %,Earnings per share, and Operating Data)
Q42017
Q32017
Q22017
Q12017
Q42016
Q32016
Q22016
Q12016
Income Statement DataNew vehicles 417,626 497,711 558,682 353,540 348,107 444,482 497,025 363,181Used vehicles 175,251 192,473 182,913 165,408 157,724 179,582 208,016 180,108Parts, service and collision repair 107,156 104,816 113,983 90,735 92,310 95,585 100,317 94,721Finance, insurance and other 33,027 39,571 39,324 29,344 31,133 33,529 36,899 28,862
Revenue 733,060 834,571 894,902 639,027 629,274 753,178 842,257 666,872New vehicles 30,033 36,806 38,555 25,590 25,042 31,578 34,410 27,267Used vehicles 7,563 11,140 13,095 11,940 10,064 12,950 13,758 10,420Parts, service and collision repair 56,915 53,805 56,306 47,284 52,957 47,676 52,957 47,669Finance, insurance and other 30,699 36,218 35,867 26,813 28,722 30,733 33,577 26,353
Gross profit 125,210 137,969 143,823 111,627 116,785 122,937 134,702 111,709Gross Profit % 17.1% 16.5% 16.1% 17.5% 18.6% 16.3% 16.0% 16.8%Operating expenses 104,626 110,560 112,897 98,170 97,397 99,041 107,932 96,047Operating expenses as a % of gross profit 83.6% 80.1% 78.5% 87.9% 83.4% 80.6% 80.1% 86.0%Operating profit2 26,505 30,287 46,539 15,638 20,761 (28,776) 28,442 20,483Impairment (recovery) of intangible assets
and goodwill (816) – – – – 54,096 – –Net earnings (loss) attributable to
AutoCanada shareholders 17,089 12,100 24,977 3,678 13,785 (32,619) 14,158 7,272Adjusted net earnings attributable to
AutoCanada shareholders 2,4 8,935 13,581 15,547 4,602 7,536 10,327 15,523 6,253EBITDA attributable to AutoCanada
shareholders 2 28,127 25,827 43,722 14,136 25,260 23,842 27,072 18,312EBITDA % of Sales2 3.8% 3.1% 4.9% 2.7% 4.5% 3.6% 3.7% 3.2%Free cash flow2 29,496 31,114 10,982 621 23,424 30,897 37,922 4,045Adjusted free cash flow2 15,996 23,296 36,277 15,217 13,133 27,766 21,632 6,035Basic earnings per share 0.62 0.44 0.91 0.13 0.50 (1.19) 0.53 0.27Diluted earnings per share 0.62 0.44 0.91 0.13 0.50 (1.19) 0.53 0.27Basic adjusted earnings per share2,4 0.33 0.50 0.57 0.17 0.28 0.38 0.57 0.23Diluted adjusted earnings per share2,4 0.33 0.50 0.57 0.17 0.27 0.38 0.57 0.23Dividends declared per share 0.10 0.10 0.10 0.10 0.10 0.10 0.10 0.25Operating DataVehicles (new and used) sold3 14,475 17,132 18,490 13,055 12,912 15,955 17,425 13,301New vehicles sold3 9,822 12,014 13,429 8,508 8,449 10,983 12,098 8,502New retail vehicles sold3 8,444 10,334 10,545 6,753 7,590 8,949 9,374 7,078New fleet vehicles sold3 1,378 1,680 2,884 1,755 859 2,034 2,724 1,424Used retail vehicles sold3 4,653 5,118 5,061 4,547 4,463 4,972 5,327 4,799# of service and collision repair orders
completed3 224,006 220,669 228,872 197,069 217,418 209,912 227,446 209,194Absorption rate2 90% 87% 87% 82% 86% 89% 90% 83%# of dealerships at period end 58 57 57 56 55 53 53 53# of same store dealerships1 49 48 47 47 44 33 27 27# of service bays at period end 999 977 977 949 928 898 898 898Same store revenue growth1 11.1% 2.9% 0.1% (7.1)% (10.0)% (9.2)% (3.2)% (3.1)%Same store gross profit growth1 1.4% 6.3% 1.1% (1.2)% (5.8)% (11.0)% (5.3)% (5.5)%
1 Same store revenue growth and same store gross profit growth is calculated using franchised automobile dealerships thatwe have owned for at least 2 full years. Same store growth is in comparison with the same quarter in the prior year.
2 These financial measures have been calculated as described under “NON-GAAP MEASURES”.3 This number includes 100% of vehicles and service and collision repair orders sold by dealerships in which we have less than
100% investment.4 In Q1 2017, the Company redefined the calculation of adjusted net earnings.
AutoCanada Š 2017 Annual Report Š Page M11

7. RESULTS OFOPERATIONSFourth Quarter Operating Results
EBITDA attributable to AutoCanada shareholders forthe quarter increased by $2.9 million or 11.3% to$28.1 million, from $25.3 million when compared tothe results of the Company for the same period in theprior year. The increase in EBITDA attributable to
AutoCanada shareholders for the quarter is a result ofan increase in gross profit as a result of additionalstores added since the prior year as well as improvedprofitability of existing stores.
Adjusted EBITDA attributable to AutoCanadashareholders for the quarter ended December 31,2017 increased by $2.9 million or 14.9% from$19.0 million to $21.9 million when compared to theresults of the Company for the same quarter in theprior year.
The following table illustrates EBITDA and adjusted EBITDA attributable to AutoCanada shareholders for the threemonth period ended December 31, for the last three years of operations:
(in thousands of dollars) 2017 2016 2015Period from October 1 to December 31Net earnings (loss) attributable to AutoCanada shareholders 17,089 13,785 (7,361)Impairment (recovery) of intangible assets and goodwill2 (3,136) – 18,126Income taxes2 4,964 2,531 3,474Depreciation of property and equipment2 4,947 4,634 4,866Interest on long-term indebtedness2 4,263 4,310 4,248
EBITDA attributable to AutoCanada shareholders1 28,127 25,260 23,353
Add back:Share-based compensation attributed to changes in share price 69 105 (30)Revaluation of redemption liabilities (4,397) (1,470) 2,566Revaluation of contingent consideration (416) (4,840) 149Unrealized gain on embedded derivative 15 (17) (8)Non-recurring settlement income (1,518) – –
Adjusted EBITDA attributable to AutoCanada shareholders1 21,880 19,038 26,030
1 This financial measure is identified and defined under the section “NON-GAAP MEASURES”.2 Represents the portion attributable to AutoCanada shareholders.
Net earnings attributable to AutoCanada shareholdersincreased by $3.3 million or 24.0% to $17.1 million inthe fourth quarter of 2017 from $13.8 million whencompared to the prior year. Income tax expenseattributable to AutoCanada shareholders increased by$2.5 million to $5.0 million in the fourth quarter of2017 from $2.5 million in the same period of 2016.
Page M12 Š AutoCanada Š 2017 Annual Report

Adjusted net earnings attributable to AutoCanada shareholders increased by $1.4 million or 18.6% to $8.9 millionfor the quarter from $7.5 million in the same period of the prior year.
The following table reconciles net earnings to adjusted net earnings for the three month period endedDecember 31:
(in thousands of dollars) 2017 2016 2015
Net earnings (loss) attributable to AutoCanada shareholders 17,089 13,785 (7,361)Add back:
Impairment (recovery) of intangible assets and goodwill, net of tax (2,296) – 13,286Share-based compensation attributed to changes in share price, net of tax 51 78 (22)Revaluation of redemption liabilities (4,397) (1,470) 2,566Revaluation of contingent consideration (416) (4,840) 149Unrealized gain on embedded derivative 15 (17) (8)Non-recurring settlement income, net of tax (1,111) – –
Adjusted net earnings attributable to AutoCanada shareholders1,2 8,935 7,536 8,610Weighted average number of shares - Basic 27,389,167 27,353,431 25,016,637Weighted average number of shares - Diluted 27,498,724 27,469,439 25,110,033Adjusted net earnings per share attributable to AutoCanada shareholders -
Basic1 0.33 0.28 0.34Adjusted net earnings per share attributable to AutoCanada shareholders -
Diluted1 0.33 0.27 0.34
1 This financial measure is identified and defined under the section “NON-GAAP MEASURES”.2 In Q1 2017, the Company redefined the calculation of adjusted net earnings.
Annual Operating Results
EBITDA attributable to AutoCanada shareholders forthe year ended December 31, 2017 increased by$17.3 million or 18.3% to $111.8 million, from$94.5 million when compared to the results of theCompany for the same period in the prior year. Theincrease in EBITDA attributable to AutoCanadashareholders for the year is a result of an increase in
gross profit as a result of additional stores added sincethe prior year as well as improved profitability ofexisting stores.
Adjusted EBITDA attributable to AutoCanadashareholders for the year ended December 31, 2017increased by $6.6 million or 7.4% from $88.8 millionto $95.4 million when compared to the results of theCompany in the prior year.
The following table illustrates EBITDA and adjusted EBITDA attributable to AutoCanada shareholders for the yearended December 31, for the last three years:
(in thousands of dollars) 2017 2016 2015
Period from January 1 to December 31Net earnings attributable to AutoCanada shareholders 57,844 2,596 22,821Impairment (recovery) of intangible assets and goodwill (3,136) 51,180 18,126Income taxes 19,800 5,826 16,171Depreciation of property and equipment 19,410 18,432 17,863Interest on long-term indebtedness 17,894 16,452 14,857EBITDA attributable to AutoCanada shareholders1 111,812 94,486 89,838Add back:
Share-based compensation attributed to changes in share price 30 (75) (272)Revaluation of redemption liabilities (2,869) (765) 4,329Unrealized loss (gain) on embedded derivative 15 3 (42)Revaluation of contingent consideration (416) (4,840) 149Non-recurring management transition cost 1,684 – –Non-recurring settlement income (14,846) – –
Adjusted EBITDA attributable to AutoCanada shareholder1 95,410 88,809 94,002
1 This financial measure is identified and defined under the section “NON-GAAP MEASURES”.
AutoCanada Š 2017 Annual Report Š Page M13

For the year ended December 31, 2017, pre-taxearnings attributable to AutoCanada shareholdersincreased by $69.2 million to $77.6 million from$8.4 million in the same period of the prior year. Netearnings attributable to AutoCanada shareholdersincreased by $55.2 million to $57.8 million in the yearended December 31, 2017 from $2.6 million whencompared to the prior year due to impairment ofintangible assets recognized during the prior year.
Income tax expense attributable to AutoCanadashareholders increased by $14.0 million to$19.8 million in the year ended December 31, 2017from $5.8 million in the same period of 2016.
Adjusted net earnings attributable to AutoCanadashareholders increased by $2.8 million or 6.9% to$42.7 million in 2017 from $39.9 million in the prioryear.
The following table reconciles net earnings to adjusted net earnings for the year ended December 31:
(in thousands of dollars) 2017 2016 2015
Net earnings attributable to AutoCanada shareholders 57,844 2,596 22,821Add back:
Impairment (recovery) of intangible assets and goodwill, net of tax (2,295) 42,987 13,286Share-based compensation attributed to changes in share price, net
of tax 22 (55) (200)Revaluation of redemption liabilities (2,869) (765) 4,329Revaluation of contingent consideration (416) (4,840) 149Unrealized loss (gain) on embedded derivative 15 3 (42)Non-recurring management transition cost, net of tax 1,231 – –Non-recurring settlement income, net of tax (10,867) – –
Adjusted net earnings attributable to AutoCanada shareholders1,2 42,665 39,926 40,343
Weighted average number of shares - Basic 27,379,193 27,350,555 24,574,022Weighted average number of shares - Diluted 27,473,995 27,455,686 24,674,083
Adjusted net earnings per share attributable to AutoCanadashareholders - Basic1 1.56 1.46 1.64
Adjusted net earnings per share attributable to AutoCanadashareholders - Diluted1 1.55 1.45 1.64
1 This financial measure is identified and defined under the section “NON-GAAP MEASURES”.2 In Q1 2017, the Company redefined the calculation of adjusted net earnings.
Page M14 Š AutoCanada Š 2017 Annual Report

Revenues
The following table summarizes revenue for the three months and year ended December 31:
Three Months Ended December 31 Year Ended December 312017
$2016
$Change
$2017
$2016
$Change
$
New vehicles 417,626 348,107 69,519 1,827,559 1,652,795 174,764Used vehicles 175,251 157,724 17,527 716,045 725,430 (9,385)Finance, insurance and other 33,027 31,133 1,894 141,266 130,423 10,843Parts, service and collision repair 107,156 92,310 14,846 416,690 382,933 33,757
733,060 629,274 103,786 3,101,560 2,891,581 209,979
Gross Profit
The following table summarizes gross profit for the three months and year ended December 31:
Three Months Ended December 31 Year Ended December 312017
$2016
$Change
$2017
$2016
$Change
$
New vehicles 30,033 25,042 4,991 130,986 118,297 12,689Used vehicles 7,563 10,064 (2,501) 43,738 47,192 (3,454)Finance, insurance and other 30,699 28,722 1,977 129,596 119,385 10,211Parts, service and collision repair 56,915 52,957 3,958 214,309 201,259 13,050
125,210 116,785 8,425 518,629 486,133 32,496
New vehicles
New vehicle revenue increased by 20.0% for thequarter and 10.6% for the year.
Gross profit increased in the quarter for newvehicles as a result of an increase in new vehiclessold of 1,373, and increased gross profit per unit of$94 compared to Q4, 2016.
The increase in gross profit in the year from newvehicles is due to an increase in new vehicles soldof 3,741 and an increase in gross profit per unit of$37 compared to the same period of the prior year.
Used vehicles
Used vehicle revenue increased by 11.1% for thequarter and incurred a decrease of 1.3% for theyear.
The decrease in gross profit in the quarter fromused vehicles is due to a decline in gross profit perunit of $630, offset by a quarterly increase in usedvehicles sold of 190 compared to Q4, 2016.
The decrease in gross profit in the year from usedvehicles is due to a decline in gross profit per unitof $156 and a decline in used vehicles sold of 182compared to the same period of the prior year.
Finance, insurance and other
Finance and insurance products are sold with bothnew and used retail vehicles, but a largerproportion are sold in conjunction with new retailvehicles.
Finance and insurance revenue increased by 6.1%for the quarter and 8.3% compared to prior year.This resulted in an increased gross profit of 6.9%for the quarter and 8.6% for the year.
Parts, service and collision repair
Parts, service and collision repair revenuesincreased by 16.1% in the quarter and 8.8% for theyear.
The increase in gross profit in the quarter fromparts, service and collision repair is due to anincrease in gross profit per order of $11 and aquarterly increase in repair orders of 6,588compared to Q4, 2016.
The increase in gross profit in the year from parts,service and collision repair is due to an increase ingross profit per order of $13 and an increase inrepair orders of 6,646 compared to the sameperiod of the prior year.
AutoCanada Š 2017 Annual Report Š Page M15

Absorption rate1
Absorption rate measures the extent to which the gross profits of a franchised automobile dealership from parts,service and collision repair cover the costs of these departments plus the fixed costs of operating the dealership.
The following table summarizes Absorption rate since the 2013 fiscal year:
87 % 85 %
91 %
86 %
89 %
2013 2014 2015 2016 2017
The positive change in Absorption rate for fiscal 2017 is a strong indicator that the increase in gross profit forParts, service and collision repair was greater than the corresponding increase in related departmental andoverall dealership fixed expenses.
1 This financial measure is identified and defined under the section “NON-GAAP MEASURES”.
Operating expenses
Operating costs consist of four major categories:
Employee costs
Employee costs are the costs associated withemploying staff both at the dealerships and atAutoCanada’s head office. Dealership employeesare largely commission based, resulting inemployee costs being substantially variable innature. Our dealership pay structures are tied tomeeting sales objectives, maintaining customersatisfaction indices, as well as improving grossprofit and net income.
Administrative costs
Administrative costs comprise the remaining costsof running our dealerships. Advertising, utilities,service shop consumables, information processing,insurance, and consulting costs comprise asignificant portion of the administrative costs.Administrative costs can be either fixed or variablein nature. The Company operates a centralizedmarketing department and information technology
department both of which provide services to thedealerships in order to leverage the size of thegroup as a means to lower the operating costs ofthe dealerships.
Facility lease costs
Facility lease costs relate to the cost of leasingdealership facilities not owned by AutoCanada.Facility lease costs are fixed in nature as leasecontracts are based on the market value of theproperty and are long-term.
Depreciation of property and equipment
Depreciation of property and equipment relates tothe depreciation of the dealership assets includingbuildings, machinery and equipment, leaseholdimprovements, company and lease vehicles,furniture, and computer hardware. Depreciationrates vary based on the nature of the asset.
Since many operating expenses are variable innature, Management considers operating expensesas a percentage of gross profit to be a goodindicator of expense control.
Page M16 Š AutoCanada Š 2017 Annual Report

The following tables summarize operating expenses as a percentage of gross profit, broken into their fixed andvariable components. Fixed expenses are costs that do not fluctuate with changes in sales volume while variableexpenses are costs that vary depending on sales volume.
Three Months EndedDecember 31
Year EndedDecember 31
Operating expenses as a % of Gross Profit 2017 2016 Change 2017 2016 Change
Employee costs before management transition costs 50.6% 51.1% (0.5)% 50.7% 50.7% –%Management transition costs –% –% –% 0.3% 0.5% (0.2)%Administrative costs - Variable 19.3% 18.0% 1.3% 17.8% 17.4% 0.4%Total Variable Expenses 69.9% 69.1% 0.8% 68.8% 68.6% 0.2%Administrative costs - Fixed 4.3% 5.0% (0.7)% 4.7% 4.9% (0.2)%Facility lease costs 5.1% 5.1% –% 4.7% 4.8% (0.1)%Depreciation of property and equipment 4.2% 4.2% –% 4.0% 4.1% (0.1)%Total fixed expenses 13.6% 14.3% (0.7)% 13.4% 13.8% (0.4)%Total operating expenses 83.5% 83.4% 0.1% 82.2% 82.4% (0.2)%
Total Operating expenses
Total operating expenses remained relatively flat inthe quarter and year over year.
Variable Expenses
Total variable expenses for the quarter and yearremained relatively flat, changing by 0.8% and 0.2%respectively.
Employee costs have decreased in the quarter by0.5% of operating expenses as a percentage ofgross profit and remained flat versus the previousyear.
Variable administrative costs increased 1.3% in thequarter and 0.4% year over year as a percentage ofgross profit.
Fixed Expenses
Total fixed expenses for the quarter decreased by0.7% and the year by 0.4%.
Fixed administrative costs decreased, for both thequarter and year to date, as a percentage of grossprofit. Facility lease costs and depreciation ofproperty and equipment saw a 0.1% decrease forthe year to date, as a percentage of gross profit.
Impairment of intangible assets and goodwill
The Company has a number of franchiseagreements for its individual dealerships which itclassifies as intangible assets. These intangibleassets are tested for impairment at least annually,or more frequently if events or changes incircumstances indicate that they may be impaired.
Under IFRS, previously recognized impairmentcharges, with the exception of impairment chargesrelated to goodwill, may potentially be reversed ifthe circumstances causing the impairment haveimproved or are no longer present. If suchcircumstances change, a new recoverable amountshould be calculated and all or part of theimpairment charge should be reversed to theextent the recoverable amount exceeds carryingvalue.
The Company performed a test for all cashgenerating units for the year ended December 31,2017. As a result of the test performed, theCompany recorded a recovery of $0.8 million ofintangible assets. (2016 impairment of$54.1 million).
AutoCanada Š 2017 Annual Report Š Page M17

Income Taxes
The following table summarizes income taxes for the three months and year ended December 31:
Three Months Ended December 31 Year Ended December 31
2017$
2016$ Change
2017$
2016$ Change
Current tax 13,254 (6,157) 19,411 20,901 12,316 8,585Deferred tax (8,193) 9,144 (17,337) 1,812 (3,741) 5,553
Income tax expense 5,061 2,987 2,074 22,713 8,575 14,138
Income tax expense is recognized based onmanagement’s best estimate of the weightedaverage annual income tax rate expected for thefull financial year. The estimated average annualrates used for the year ended December 31, 2017was 26.8% (December 31, 2016 - 27.2%).
Finance costs
The Company incurs finance costs on its revolvingfloorplan facilities, long-term indebtedness andbanking arrangements.
During the quarter ended December 31, 2017,finance costs on our revolving floorplan facilitiesincreased by 28.9% to $4.2 million from$3.2 million compared to Q4 2016, mainly due toincreased inventory as a result of the twodealership acquisitions and one open pointcompleted in 2017.
For the year ended December 31, 2017, financecosts on our revolving floorplan facilities increased
by 17.0% to $14.5 million from $12.4 million in thesame period of the prior year.
Some of our manufacturers provide non-refundablecredits on the finance costs for our revolvingfloorplan facilities to offset the dealership’s cost ofinventory that, on average, effectively provide thedealerships with interest-free floorplan financingfor the first 45 to 60 days of ownership of eachfinanced vehicle.
Accounting standards require the floorplan creditsto be accounted for as a reduction in the cost ofnew vehicle inventory and subsequently areduction in the cost of sales as vehicles are sold.
Management believes that a comparison offloorplan financing costs to floorplan credits can beused to evaluate the efficiency of our new vehiclesales relative to stocking levels.
The following table details the carrying cost of vehicles based on floorplan interest net of floorplan assistanceearned:
Three Months Ended December 31 Year Ended December 31
(in thousands of dollars) 2017 2016 Change 2017 2016 Change
Floorplan financing 4,187 3,247 940 14,515 12,408 2,107Floorplan credits earned (4,114) (3,860) (254) (17,054) (14,634) (2,420)
Net carrying cost of vehicle inventory 73 (613) 686 (2,539) (2,226) (313)
Page M18 Š AutoCanada Š 2017 Annual Report

8. SAME STORESRESULTSSame store is defined as a franchised automobiledealership that has been owned for at least two fullyears since acquisition. The dealership is thenincluded in the quarter thereafter, for same storeanalysis. The Company believes that it takes twoyears for an acquired dealership or Open Point toachieve normal operating results.
The dealerships which have been acquired over thepast two years are integrating well into theirrespective platforms and within the Company. Fivedealerships were added to same stores since thestart of 2017. We believe that there continues to beopportunities within these dealerships andcontinue to dedicate significant resources to newlyacquired dealerships to successfully integrateacquisitions in an efficient manner. As a result, weexpect to incur additional selling and administrativecosts in the future to successfully integrate newdealerships into our model.
Number of Same Stores by Province
The following table summarizes the number of same stores for the period ended December 31, 2017 by Province:
British Columbia Alberta Saskatchewan Manitoba Ontario Quebec Atlantic Total
FCA 4 7 1 1 1 – 2 16Hyundai 2 4 – – 2 – – 8General Motors 1 3 3 1 – – – 8Volkswagen 3 2 – 1 – – – 6Nissan/Infiniti 1 3 – – – – – 4Mitsubishi – 2 – – – – – 2BMW – – – – – 2 – 2Audi – – – 1 – – – 1Subaru – 1 – – – – – 1KIA – 1 – – – – – 1
Total 11 23 4 4 3 2 2 49
Same Store Revenue and Vehicles Sold
Three Months Ended December 31 Year Ended December 31
(in thousands of dollars) 2017 2016 % Change 2017 2016 % Change
New vehicles - Retail 305,414 263,304 16.0% 1,320,350 1,279,471 3.2%New vehicles - Fleet 60,883 55,818 9.1% 320,444 274,973 16.5%
Total New vehicles 366,297 319,122 14.8% 1,640,794 1,554,444 5.6%Used vehicles - Retail 108,508 104,085 4.2% 451,736 459,887 (1.8)%Used vehicles - Wholesale 48,866 43,149 13.2% 196,014 230,598 (15.0)%
Total Used vehicles 157,374 147,234 6.9% 647,750 690,485 (6.2)%Finance, insurance and other 30,367 29,409 3.3% 129,979 123,567 5.2%
Subtotal 554,038 495,765 11.8% 2,418,523 2,368,496 2.1%Parts, service and collision repair 93,061 86,603 7.5% 366,476 362,163 1.2%
Total 647,099 582,368 11.1% 2,784,999 2,730,659 2.0%
New retail vehicles sold 7,196 6,845 5.1% 31,402 30,422 3.2%New fleet vehicles sold 1,349 808 67.0% 7,600 6,932 9.6%Used retail vehicles sold 4,051 4,162 (2.7)% 17,233 18,560 (7.1)%
Total 12,596 11,815 6.6% 56,235 55,914 0.6%
Total vehicles retailed 11,247 11,007 2.2% 48,635 48,982 (0.7)%
AutoCanada Š 2017 Annual Report Š Page M19

Revenues - Same Store Analysis
Same store revenue increased by $64.7 million or11.1%, and $54.3 million or 2.0%, for the three monthperiod and the year ended December 31, 2017respectively when compared to the same period in theprior year.
New vehicle revenues increased by $47.2 million or14.8% for the fourth quarter of 2017 over the prioryear due to an increase in new vehicle sales of 892units or 11.7% and an increase in the average revenueper new vehicle sold of $1,168 or 2.8%. Same storenew vehicle revenues increased by $86.4 million or5.6% for the year ended December 31, 2017 over thesame period in the prior year due to a increase in newvehicle sales of 1,648 units or 4.4% and an increase inthe average revenue per new vehicle sold of $456 or1.1%.
Same store used vehicle revenues increased by$10.1 million or 6.9% for the three month periodended December 31, 2017 over the same period inthe prior year due to a decrease in used vehicle sales
of 111 units or 2.7% offset by a increase in theaverage revenue per used vehicle sold of $3,473 or9.8%. For the year ended December 31, 2017, usedvehicle revenues decreased by $42.7 million or 6.2%due to a decrease in used vehicle sales of 1,327 unitsor 7.1%, offset by an increase in the average revenueper used vehicle sold of $385 or 1.0%.
Same store parts, service and collision repair revenueincreased by $6.5 million or 7.5% for the fourthquarter of 2017 compared to the prior period. For theyear ended December 31, 2017, parts, service andcollision repair revenue increased by $4.3 million or1.2%.
Same store finance, insurance and other revenueincreased by $1.0 million or 3.3% for the three monthperiod ended December 31, 2017 over the sameperiod in 2016. For the year ended December 31,2017, same store finance, insurance and otherrevenue increased by $6.4 million or 5.2% over thesame period in 2016.
Same Store Gross Profit and Gross Profit Percentage
Three Months Ended December 31
Revenue Source Gross Profit Gross Profit %
(in thousands of dollars) 2017 2016 % Change 2017 2016
New vehicles - Retail 24,008 21,389 12.2% 7.9% 8.1%New vehicles - Fleet 1,677 1,580 6.1% 2.8% 2.8%
Total New vehicles 25,685 22,969 11.8% 7.0% 7.2%Used vehicles - Retail 6,588 8,220 (19.9)% 6.1% 7.9%Used vehicles - Wholesale 1,088 1,146 (5.1)% 2.2% 2.7%
Total Used vehicles 7,676 9,366 (18.0)% 4.9% 6.4%Finance, insurance and other 27,748 26,755 3.7% 91.4% 91.0%
Subtotal 61,109 59,090 3.4% 11.0% 11.9%Parts, service and collision repair 49,140 49,593 (0.9)% 52.8% 57.3%
Total 110,249 108,683 1.4% 17.0% 18.7%
Page M20 Š AutoCanada Š 2017 Annual Report

Year Ended December 31
Revenue Source Gross Profit Gross Profit %
(in thousands of dollars) 2017 2016 % Change 2017 2016
New vehicles - Retail 110,168 104,793 5.1% 8.3% 8.1%New vehicles - Fleet 5,934 6,665 (11.0)% 1.9% 2.9%
Total New vehicles 116,102 111,458 4.2% 7.1% 7.2%Used vehicles - Retail 36,706 39,667 (7.5)% 8.1% 8.7%Used vehicles - Wholesale 5,902 5,172 14.1% 3.0% 1.9%
Total Used vehicles 42,608 44,839 (5.0)% 6.6% 6.5%Finance, insurance and other 118,552 112,777 5.1% 91.2% 91.5%
Subtotal 277,262 269,074 3.0% 11.5% 11.4%Parts, service and collision repair 189,768 190,910 (0.6)% 51.8% 53.2%
Total 467,030 459,984 1.5% 16.8% 16.8%
Gross Profit - Same Store Analysis
Same store gross profit increased by $1.6 million or1.4% and $7.0 million or 1.5% for the three monthperiod and the year ended December 31, 2017respectively when compared to the same period in theprior year.
Same store new vehicle gross profit increased by$2.7 million or 11.8% in the three month period endedDecember 31, 2017 when compared to 2016 as aresult of an increase in new vehicle sales of 892 unitsor 11.7%, and an increase in the average gross profitper new vehicle sold of $5 or 0.2%. For the year endedDecember 31, 2017, new vehicle gross profitincreased by $4.6 million or 4.2% which can be mainlyattributed to a increase in new vehicle sales of 1,648units or 4.4% offset by an decrease in the averagegross profit per new vehicle sold of $7 or 0.2%.
Same store used vehicle gross profit decreased by$1.7 million or 18.0% in the three month period endedDecember 31, 2017 over the prior year. This was dueto a decrease in the number of used vehicles sold of111 units and an decrease in the average gross profitper used vehicle retailed of $355 or (15.8)%. For theyear ended December 31, 2017, same store used
vehicle gross profit decreased by $2.2 million or 5.0%which was mainly due to an increase in the averagegross profit per vehicle retailed of $57 or 2.4% offsetby a decrease in the number of vehicles retailed of1,327 units.
Same store parts, service and collision repair grossprofit decreased by $0.5 million or 0.9% in the threemonth period ended December 31, 2017 whencompared to the same period in the prior year. For theyear ended December 31, 2017, parts, service andcollision repair gross profit decreased by $1.1 millionor 0.6%.
Same store finance and insurance gross profitincreased by $1.0 million or 3.7% in the three monthperiod ended December 31, 2017 when compared tothe prior year as a result a increase in units retailed of1,165, offset by an decrease in the average grossprofit per unit sold of $188. For the year endedDecember 31, 2017, finance and insurance grossprofit increased by $5.8 million or 5.1% and can beattributed to a increase in units retailed of 583, and anincrease in the average gross profit per unit sold of$91.
AutoCanada Š 2017 Annual Report Š Page M21

The following table summarizes same store total revenue for the three months and year ended December 31,2017 by Province:
Three Months Ended December 31 Year Ended December 31
(in thousands of dollars) 2017 2016 % Change 2017 2016 % Change
British Columbia 133,885 116,036 15.4% 590,528 578,938 2.0%Alberta 259,195 236,376 9.7% 1,148,533 1,121,811 2.4%Saskatchewan 58,179 54,582 6.6% 243,321 236,354 2.9%Manitoba 45,688 42,626 7.2% 194,888 182,282 6.9%Ontario 26,681 21,042 26.8% 108,984 101,555 7.3%Quebec 93,012 81,198 14.5% 352,631 334,255 5.5%Atlantic 30,459 30,508 (0.2)% 146,114 175,464 (16.7)%
Total 647,099 582,368 11.1% 2,784,999 2,730,659 2.0%
The following table summarizes same store gross profit for the three months and year ended December 31, 2017by Province:
Three Months Ended December 31 Year Ended December 31
(in thousands of dollars) 2017 2016 % Change 2017 2016 % Change
British Columbia 21,879 20,578 6.3% 95,268 92,404 3.1%Alberta 49,135 49,817 (1.4)% 206,227 204,034 1.1%Saskatchewan 10,289 10,625 (3.2)% 45,146 44,977 0.4%Manitoba 8,142 7,663 6.3% 35,144 33,789 4.0%Ontario 3,991 3,463 15.2% 15,590 14,804 5.3%Quebec 12,323 12,045 2.3% 49,043 47,441 3.4%Atlantic 4,490 4,492 –% 20,612 22,535 (8.5)%
Total 110,249 108,683 1.4% 467,030 459,984 1.5%
Page M22 Š AutoCanada Š 2017 Annual Report

9. ACQUISITIONS,RELOCATIONS AND REALESTATEDealership Operations and Expansion
Our goals are to maximize the profit potential of everystore and to generate incremental growth throughaccretive acquisitions. In 2017 we acquired twostores, and opened a Volkswagen open point in early2017, bringing the total number of dealerships weoperate to 58, representing 66 franchises. Wecontinue to focus on our acquisition strategy,concentrating on growth throughout Canada with agreater diversification in both geography and brand.
The Company is being patient with our acquisitionstrategy, focusing on acquisitions that are accretiveand provide diversity. The Company plans to diversifyacross Canada through the acquisition of flagshipstores in major markets. Management and theCompany have excellent relationships with ourmanufacturer partners, providing the Company withgreater opportunities with brands we currentlyoperate.
Mercedes-Benz Rive-Sud
On May 1, 2017, the Company purchased all of thevoting shares of 8421722 Canada Inc., which ownsand operates a Mercedes-Benz dealership in Montreal,Quebec, along with all of the opearting and fixedassets of 9343091 Canada Inc. which owns andoperates the dealership’s collision centre (together“Mercedes-Benz Rive-Sud”), for total cashconsideration of $16.1 million. The acquisition wasfunded by drawing on the Company’s revolving termfacility. This dealership represents our firstMercedes-Benz franchise and we are extremelypleased to have added a top selling luxury brand toour portfolio and look forward to sustained successand growth with Mercedes-Benz.
Planete Mazda
On December 1, 2017, the Company purchased 95%of the issued and outstanding shares of PlaneteMazda, which owns and operates a Mazda dealershipin Montreal, Quebec, for total cash consideration of$5.8 million. The acquisition was funded by drawingon the Company’s revolving term facility. Thisdealership
represents our first Mazda dealership and becomesour 23rd brand.
History has shown that within two years a newlyacquired store adopts AutoCanada processes andculture. As we expand our presence into easternCanada we are establishing regional and brandspecialists whose role it is to ensure that every store inour portfolio meets not only our volume and profittargets but also every automaker sales and customersatisfaction objectives.
AutoCanada continues to diligently evaluateacquisition opportunities. We believe that we havesufficient capital to be able to acquire stores that meetour specific criteria. While our focus remains onflagship stores in each market, we are also targetingsmaller stores that offer both organic growth as wellas synergies with our other local stores.
General Motors Transaction
On December 7, 2017, we announced two newagreements that strengthened our relationship withGM Canada. We executed a Public Company MasterAgreement (PCMA) with GM Canada that permitsAutoCanada’s direct ownership and control of GMCanada dealerships. As part of that agreement, onJanuary 2, 2018 the company closed an agreementwith CanadaOne Auto Group, a company controlledby the Company’s former CEO and founder,Mr. Patrick Priestner, seeing AutoCanada assumecontrol of five of the nine GM Canada dealershipswhere it held a majority equity stake with no votingrights, and CanadaOne Auto Group buyingAutoCanada’s interest in four dealerships. AutoCanadareceived a one-time net payment of approximately$23 million from CanadaOne Auto Group as part ofthe transaction.
The New PCMA has allowed AutoCanada to outrightown and operate GM dealerships along with ourdealer partners. This creates an opportunity for us toevaluate future GM opportunities and further expandour relationship with GM Canada.
Related to the agreement made with CanadaOne AutoGroup, we will see decreases to Revenue, Gross Profit,and Unit sales figure in the interim as we evaluatecurrent and future opportunities.
AutoCanada Š 2017 Annual Report Š Page M23

Operating Data
For the year ended December 31,2017 Revenue
GrossProfit
Proportion ofownership
interest1
Newvehicles
sold
Newfleet
vehiclessold
Usedretail
vehiclessold
Vehicles(new and used)
sold
Kelowna Chevrolet 57,145 8,827 80% 524 334 276 1,134Lakewood Chevrolet 83,147 12,271 75% 688 661 310 1,659Sherwood Park Chevrolet 123,590 20,403 31% 1,265 120 675 2,060Sherwood Park Buick GMC 110,187 17,436 31% 1,067 197 569 1,833
Total 374,069 58,937 3,544 1,312 1,830 6,686
1 Through the various interest in subsidiaries as disclosed in the annual consolidated financial statements of the company forthe year ended December, 31, 2017 (Note 18).
Dealership Open Points
The retail automotive industry is a mature industry andrights to open new franchised automobile dealershipsare rarely awarded by the automobile manufacturers.However, from time to time automobile manufacturersmay seek to establish new dealerships in attractivemarkets. The right to open a new franchisedautomobile dealership in a specific location grantedby an automobile manufacturer to a dealer is referredto in the industry as an Open Point. Generally a newfranchised automobile dealership is fully performingwithin one to three years depending on themanufacturer and location.
The Company will review on a case-by-case basiswhether to own or lease a particular dealership facility.In either case, the Company would incur the costs ofequipping and furnishing these facilities, including thecosts relating to the integration of our managementinformation systems into the new dealerships. Thesecosts vary by dealership depending upon size andlocation.
Nissan – Calgary, Alberta
The dealership construction is expected to begin late2018 with anticipated opening in mid 2019. Thedealership will be constructed by a third party andsubsequently leased by the Company.
Capital Plan
The Company maintains a capital plan forcontemplated future capital projects. Details of thecapital plan are described below:
Dealership Relocations
Management estimates the total capital requirementsof currently planned dealership relocations to beapproximately $47.3 million to the end of 2021. TheCompany expects dealership relocations to providelong-term earnings sustainability and result insignificant improvements in revenues and overallprofitability. Management continually updates itscapital plan and as such the estimates provided mayvary as delays occur or projects are added or removed.
Current Dealership Expansion and ImagingRequirements
The Company has identified approximately$78.4 million in capital costs that it may incur in orderto expand or renovate various current locationsthrough to the end of 2022. The Company is requiredby its manufacturers to undertake periodic imagingupgrades to its facilities.
Open Point Opportunities
Management regularly reviews potential open pointopportunities. If successful in being awarded theseopportunities, management would then estimateadditional capital costs in order to construct suitablefacilities for open point. The Company estimatesapproximately $17.0 million in capital costs that it mayincur by the end of 2019 related to awarded OpenPoints. If awarded in the future, Management willprovide additional cost estimates and furtherinformation regarding the proposed timing ofconstruction. In order to be successful in someopportunities, Management may be required to secureappropriate land for the potential open point, in whichcase, additional land purchase costs may be incurredin the future.
Page M24 Š AutoCanada Š 2017 Annual Report

The following summarizes the capital plan for contemplated future capital projects:
(in millions of dollars) 2018 2019 2020 2021 2022 Total
Same StoreDealership Relocations 4.8 11.5 14.5 16.5 – 47.3Current Dealership Expansion and Imaging Requirements 19.4 15.3 8.4 11.5 18.1 72.7
Capital Plan 24.2 26.8 22.9 28.0 – 120.0
Expected to be financed 2.9 8.6 – – – 11.5
Cash Outlay1 21.3 18.2 22.9 28.0 18.1 108.5
Non Same StoreCurrent Dealership Expansion and Imaging Requirements 2.0 1.7 1.0 – 1.0 5.7Open Point Opportunities 3.9 13.1 – – – 17.0
Capital Plan 5.9 14.8 1.0 – 1.0 22.7
Expected to be financed 2.9 8.6 – – – 11.5
Cash Outlay1 3.0 6.2 1.0 – 1.0 11.2
Total Capital Plan 30.1 41.6 23.9 28.0 19.1 142.7
Total Cash outlay 24.3 24.4 23.9 28.0 19.1 119.7
1 Refers to amount expected to be funded by internal Company cash flow.
During the year, the Company re-examined its capitalexpenditures and has reduced its planned capitalbudgets. At December 31, 2016, the five year capitalplan was $145.3 million. As a result of increased focuson reducing capital expenditures, the five year capitalplan at December 31, 2017 is $142.7 million.
Notwithstanding the capital plan laid out above,expected capital expenditures are subject to deferraldue to issues in obtaining permits, constructiondelays, changes in reimaging requirements, economicfactors, or other delays that are normal to theconstruction process. The above is considered to be aguide for when the Company expects to perform
capital expenditures, however, significant deferralmay occur in the future. Management closelymonitors the capital plan and adjusts as appropriatebased on Company performance, manufacturerrequirements, expected economic conditions, andindividual dealership needs. Management performs arobust analysis on all future expenditures prior to theallocation of funds. Timing of dealership relocations isdetermined based on the dealership’s currentperformance, the market, and expected return oninvested capital. It is expected that a dealershiprelocation will result in improved performance andincreased profitability.
AutoCanada Š 2017 Annual Report Š Page M25

10. LIQUIDITY ANDCAPITAL RESOURCESOur principal uses of funds are for capitalexpenditures, repayment of debt, funding the futuregrowth of the Company and paying dividends toShareholders. We have historically met theserequirements by using cash generated from operatingactivities and through short-term and long-termindebtedness.
Under our franchise agreements, manufacturersrequire us to maintain a minimum level of workingcapital. We maintain working capital in excess ofmanufacturer requirements which may be used forcapital expenditures. The Company’s analysis of itsavailable capital based on the balance sheet atDecember 31, 2017 is as follows:
Š The Company had drawn $143.8 million on its$250.0 million revolving term facility.
As a result of the above, as at December 31, 2017, theCompany currently has approximately $106.2 millionin readily available liquidity, not including futureretained cash from operations, that it may deploy forgrowth expenditures including acquisitions.
Cash Flow from Operating Activities
Cash flow from operating activities (including changesin non-cash working capital) of the Company for theyear ended was $78.8 million (cash provided byoperating activities of $94.6 million minus net changein non-cash working capital of $15.8 million)compared to $104.7 million (cash provided byoperating activities of $76.1 million plus net change innon-cash working capital of $28.6 million) in the sameperiod of the prior year.
Cash Flow from Investing Activities
For the year ended December 31, 2017, cash flowfrom investing activities of the Company was a netoutflow of $49.2 million as compared to a net outflowof $100.9 million in the same period of the prior year.
Cash Flow from Financing Activities
For the year ended December 31, 2017, cash flowfrom financing activities was a net outflow of$38.1 million as compared to a net inflow of$37.8 million in the same period of 2016.
Credit Facilities and Floor Plan Financing
Details of the Company’s credit facilities and floorplanfinancing are included in Note 30 of the annualaudited consolidated financial statements for the yearended December 31, 2017.
Page M26 Š AutoCanada Š 2017 Annual Report

Key Financial Covenants
The Company is required by its debt agreements to comply with several financial covenants.
The following is a summary of the Company’s actual performance against its financial covenants as atDecember 31, 2017:
Financial Covenant RequirementQ4 2017 Actual
CalculationQ3 2017 Actual
Calculation
Syndicated Revolver:Senior Secured Leverage Ratio Shall not exceed 2.75 1.46 1.44Adjusted Total Leverage Ratio Shall not exceed 5.00 3.79 3.76Fixed Charge Coverage Ratio Shall not be less than 1.20 2.92 3.55Current Ratio Shall not be less than 1.05 1.18 1.13Syndicated Floorplan:Current Ratio Shall not be less than 1.05 1.12 1.15Tangible Net Worth (millions) Shall not be less than $40 million 81.8 87.2Debt to Tangible Net Worth Shall not exceed 7.50 5.56 4.59
The covenants above are based on consolidatedfinancial statements of the dealerships that arefinanced directly by the lender. As a result, the actualperformance against the covenant does notnecessarily reflect the actual performance ofAutoCanada. The Company is required to comply withother covenants under the terms of its remainingcredit agreements. The Company stress tests allcovenants on a monthly and quarterly basis and notesthat a significant further drop in performance wouldbe necessary to breach the covenants.
As at December 31, 2017, the Company is incompliance with all of its financial covenants.
Financial Instruments
Details of the Company’s financial instruments,including risks and uncertainties are included in
Note 27 of the annual audited consolidated financialstatements for the year ended December 31, 2017.
Growth vs. Non-Growth Capital Expenditures
Non-growth capital expenditures are capitalexpenditures incurred during the period to maintainexisting levels of service. These include capitalexpenditures to replace property and equipment andany costs incurred to enhance the operational life ofexisting property and equipment. Non-growth capitalexpenditures can fluctuate from period to perioddepending on our needs to upgrade or replaceexisting property and equipment. Over time, weexpect to incur annual non-growth capitalexpenditures in an amount approximating ouramortization of property and equipment reported ineach period.
Additional details on the components of non-growth property and equipment purchases are as follows:
(in thousands of dollars)
October 1, 2017to December 31,
2017
January 1, 2017to December 31,
2017
Leasehold improvements 298 755Machinery and equipment 409 1,770Furniture and fixtures 476 872Computer equipment 307 899
1,490 4,296
AutoCanada Š 2017 Annual Report Š Page M27

Amounts relating to the expansion of sales and servicecapacity are considered growth expenditures. Growthexpenditures are discretionary, represent cash outlaysintended to provide additional future cash flows andare expected to provide benefit in future periods.During the three month period and the year endedDecember 31, 2017, growth capital expenditures of
$7.0 million and $20.5 million were incurred,respectively. These expenditures relate primarily toland and buildings that were purchased for futuredealership operations during 2017. Dealershiprelocations are included as growth expenditures ifthey contribute to the expansion of sales and servicecapacity of the dealership.
The following table provides a reconciliation of the purchase of property and equipment as reported on theStatement of Cash Flows to the purchase of non-growth property and equipment as calculated in the free cashflow section below:
(in thousands of dollars)
October 1, 2017to December 31,
2017
January 1, 2017to December 31,
2017
Purchase of property and equipment from the Statement of Cash Flows 9,017 24,831Less: Amounts related to the expansion of sales and service capacity (7,527) (20,534)
Purchase of non-growth property and equipment 1,490 4,297
Repairs and maintenance expenditures are expensedas incurred and have been deducted from earnings forthe period. Repairs and maintenance expenseincurred during the three month period and the yearended December 31, 2017, were $1.8 million and$6.9 million (2016 - $1.7 million and $6.2 million),respectively.
Planned Capital Expenditures
Our capital expenditures consist primarily of leaseholdimprovements, the purchase of furniture and fixtures,
machinery and equipment, service vehicles, computerhardware and computer software. Managementexpects that our annual capital expenditures willincrease in the future, as a function of increases in thenumber of locations requiring maintenance capitalexpenditures, the cost of opening new locations andincreased spending on information systems.
For further information regarding planned capitalexpenditures, see “GROWTH, ACQUISITIONS,RELOCATIONS AND REAL ESTATE” above.
Financial Position
The following table shows selected audited balances of the Company (in thousands) for December 31, 2017 andDecember 31, 2016, as well as unaudited balances of the Company at September 30, 2017, June 30, 2017,March 31, 2017, September 30, 2016, June 30, 2016, and March 31, 2016:
(in thousands of dollars)Q4
2017Q3
2017Q2
2017Q1
2017Q4
2016Q3
2016Q2
2016Q1
2016
Cash and cash equivalents 94,660 104,966 95,417 100,402 103,221 96,368 77,582 72,878Trade and other receivables 79,931 137,155 157,275 113,688 85,587 108,363 115,427 116,092Inventories 659,593 636,685 629,171 701,559 619,718 597,831 555,957 628,641
Total Assets 1,761,046 1,693,533 1,698,290 1,707,063 1,600,615 1,547,344 1,548,879 1,578,225Revolving floorplan facilities 634,655 616,144 624,847 688,173 582,695 569,581 532,283 600,578Non-current debt and lease obligations 332,450 331,803 338,212 330,563 330,351 291,408 295,922 293,273
Page M28 Š AutoCanada Š 2017 Annual Report

Net Working Capital
The automobile manufacturers represented by theCompany require the Company to maintain networking capital for each individual dealership. AtDecember 31, 2017, the aggregate of net workingcapital requirements was approximately$109.0 million. At December 31, 2017, all workingcapital requirements had been met by eachdealership. The working capital requirements imposedby the automobile manufacturers’ may limit our abilityto fund capital expenditures, acquisitions, dividends,or other commitments in the future if sufficient fundsare not generated by the Company. Net workingcapital, as defined by automobile manufacturers, maynot reflect net working capital as determined usingGAAP measures. As a result, it is possible that theCompany may meet automobile manufacturers’ networking capital requirements without having sufficientaggregate working capital using GAAP measures. TheCompany defines net working capital amounts ascurrent assets less current liabilities as presented inthe consolidated financial statements. The networking capital requirements above restrict theCompany’s ability to transfer funds up from itssubsidiaries, as each subsidiary dealership is requiredto be appropriately capitalized as explained above. Inaddition, our VCCI Facilities require the VW and Audidealerships to maintain minimum cash and equity,which also restricts our ability to transfer funds up.
Off Balance Sheet Arrangements
The Company has operating lease commitments, withvarying terms through 2037, to lease premises andequipment used for business purposes. The Companyleases the majority of the lands and buildings used inits franchised automobile dealership operations fromrelated parties and other third parties.
The minimum lease payments over the upcomingfiscal years will be as follows:
2018 18,8922019 16,4292020 14,4302021 14,1992022 13,731Thereafter 130,759
Total 208,440
Information regarding our contractual obligations withrespect to long-term debt, capital lease obligationsand other long-term obligations is included in theLiquidity Risk section of Note 27 of the Company’sannual consolidated financial statements.
Related Party Transactions
Note 37 of the annual consolidated financialstatements of the Company for the year endedDecember 31, 2017 summarizes the transactionsbetween the Company and its related parties.
Transactions with Companies Controlled by the FormerChair of the Board of Directors of AutoCanada
Until May 5, 2017, Mr. Patrick Priestner was the Chairof AutoCanada and was a related party as a result ofhis position on the Board of Directors of AutoCanada.Prior to Priestner’s retirement on May 5, 2017, thecompany had financial transactions with entitiescontrolled by Priestner. Priestner is the controllingshareholder of Canada One Auto Group (“COAG”) andits subsidiaries, which beneficially own approximately8.6% (2016 – 8.6%) of the Company’s shares. Inaddition to COAG, Priestner is the controllingshareholder of other companies from whichAutoCanada earns administrative fees. Thesetransactions are measured at the exchange amount,which is the amount of consideration established andagreed to by the related parties. All significanttransactions between AutoCanada and companiescontrolled by Priestner were approved by theCompany’s independent members of the Board ofDirectors. The Company continues to provide servicesto entities controlled by Priestner, which are providedat market rates.
Loan to related parties
The Company has provided dealership loan financingto PPH Holdings Ltd. (“PPH”), a company controlledand formed by Priestner. The Company holds noownership interest in PPH or its subsidiaries. The loansto associates have been structured as executed tosatisfy the requirements of the manufacturer.
AutoCanada Š 2017 Annual Report Š Page M29

11. OUTSTANDINGSHARESAs at December 31, 2017, the Company had27,459,683 common shares outstanding. Basic anddiluted weighted average number of sharesoutstanding for the year ended December 31, 2017
were 27,379,193 and 27,473,995, respectively. As atDecember 31, 2017, the value of the shares held intrust was $1.8 million (2016 – $1.8 million) which wascomprised of 70,783 (2016 - 103,244) in shares with anil aggregate cost. As at March 15, 2018, there were27,459,683 shares issued and outstanding.
12. DIVIDENDSManagement reviews the Company’s financial results on a monthly basis. The Board of Directors reviews thefinancial results periodically to determine whether a dividend shall be paid based on a number of factors.
The following table summarizes the dividends declared by the Company in 2017:
Record date Payment datePer Share
$Total
$
February 28, 2017 March 15, 2017 0.10 2,735May 31, 2017 June 15, 2017 0.10 2,739August 31, 2017 September 15, 2017 0.10 2,739November 30, 2017 December 15, 2017 0.10 2,739
0.40 10,952
On February 23, 2018 the Board declared a quarterlyeligible dividend of $0.10 per common share onAutoCanada’s outstanding Class A shares, payable onMarch 15, 2018 to shareholders of record at the closeof business on March 1, 2018.
As per the terms of the HSBC facility, we are restrictedfrom declaring dividends and distributing cash if weare in breach of financial covenants or our availablemargin and facility limits or if such dividend wouldresult in a breach of our covenants or our availablemargin and facility limits. At this time, the Company iswithin these covenants.
Page M30 Š AutoCanada Š 2017 Annual Report
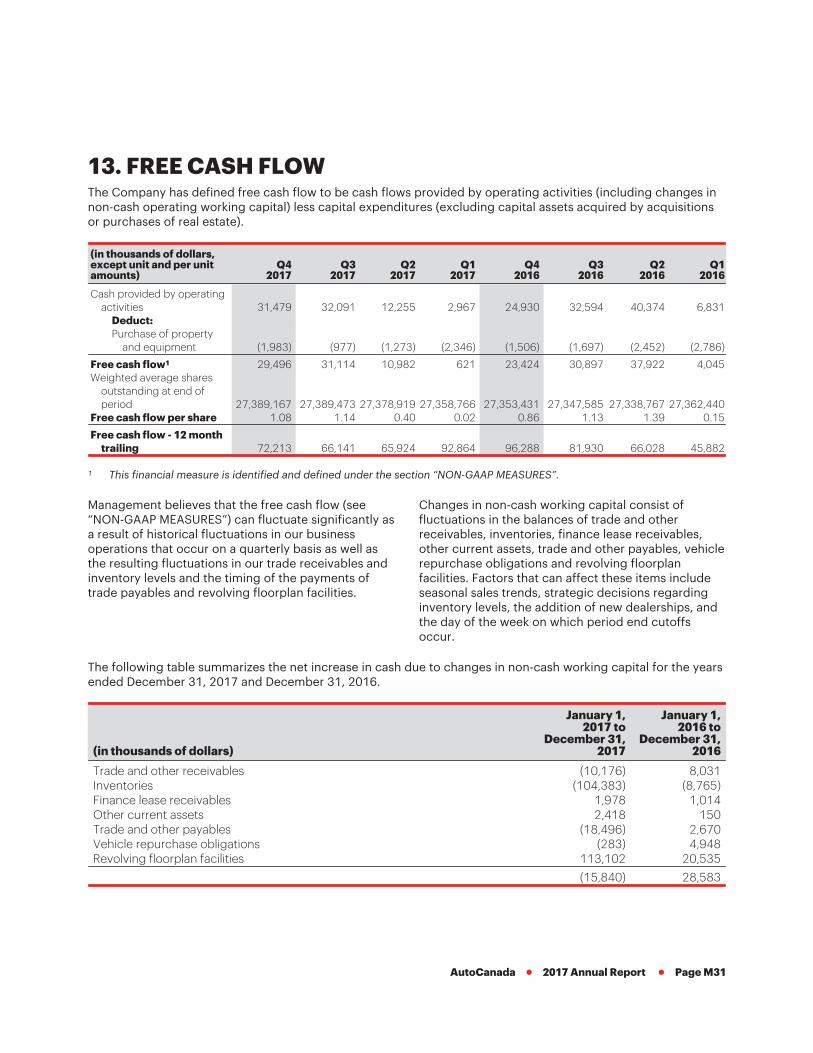
13. FREE CASH FLOWThe Company has defined free cash flow to be cash flows provided by operating activities (including changes innon-cash operating working capital) less capital expenditures (excluding capital assets acquired by acquisitionsor purchases of real estate).
(in thousands of dollars,except unit and per unitamounts)
Q42017
Q32017
Q22017
Q12017
Q42016
Q32016
Q22016
Q12016
Cash provided by operatingactivities 31,479 32,091 12,255 2,967 24,930 32,594 40,374 6,831
Deduct:Purchase of property
and equipment (1,983) (977) (1,273) (2,346) (1,506) (1,697) (2,452) (2,786)
Free cash flow1 29,496 31,114 10,982 621 23,424 30,897 37,922 4,045Weighted average shares
outstanding at end ofperiod 27,389,167 27,389,473 27,378,919 27,358,766 27,353,431 27,347,585 27,338,767 27,362,440
Free cash flow per share 1.08 1.14 0.40 0.02 0.86 1.13 1.39 0.15
Free cash flow - 12 monthtrailing 72,213 66,141 65,924 92,864 96,288 81,930 66,028 45,882
1 This financial measure is identified and defined under the section “NON-GAAP MEASURES”.
Management believes that the free cash flow (see“NON-GAAP MEASURES”) can fluctuate significantly asa result of historical fluctuations in our businessoperations that occur on a quarterly basis as well asthe resulting fluctuations in our trade receivables andinventory levels and the timing of the payments oftrade payables and revolving floorplan facilities.
Changes in non-cash working capital consist offluctuations in the balances of trade and otherreceivables, inventories, finance lease receivables,other current assets, trade and other payables, vehiclerepurchase obligations and revolving floorplanfacilities. Factors that can affect these items includeseasonal sales trends, strategic decisions regardinginventory levels, the addition of new dealerships, andthe day of the week on which period end cutoffsoccur.
The following table summarizes the net increase in cash due to changes in non-cash working capital for the yearsended December 31, 2017 and December 31, 2016.
(in thousands of dollars)
January 1,2017 to
December 31,2017
January 1,2016 to
December 31,2016
Trade and other receivables (10,176) 8,031Inventories (104,383) (8,765)Finance lease receivables 1,978 1,014Other current assets 2,418 150Trade and other payables (18,496) 2,670Vehicle repurchase obligations (283) 4,948Revolving floorplan facilities 113,102 20,535
(15,840) 28,583
AutoCanada Š 2017 Annual Report Š Page M31

Adjusted Free Cash Flow
The Company has defined adjusted free cash flow to be cash flows provided by operating activities (beforechanges in non-cash operating working capital) less non-growth capital expenditures.
(in thousands of dollars,except unit and per unitamounts)
Q42017
Q32017
Q22017
Q12017
Q42016
Q32016
Q22016
Q12016
Cash provided by operatingactivities before changesin non-cash workingcapital 17,486 24,070 37,355 15,721 14,344 28,996 24,050 8,754
Deduct:Purchase of non-growth
property andequipment (1,490) (774) (1,078) (504) (1,211) (1,230) (2,418) (2,719)
Adjusted free cash flow1 15,996 23,296 36,277 15,217 13,133 27,766 21,632 6,03527,389,167 27,389,473 27,378,919 27,358,766 27,353,431 27,347,585 27,338,767 27,362,440
Adjusted free cash flowper share 0.58 0.85 1.32 0.56 0.48 1.02 0.79 0.22
Adjusted free cash flow -12 month trailing 90,786 87,923 92,393 77,748 68,566 63,511 54,696 52,251
1 This financial measure is identified and defined under the section “NON-GAAP MEASURES”.
Management believes that non-growth property andequipment is necessary to maintain and sustain thecurrent productive capacity of the Company’soperations and cash available for growth.Management believes that maintenance capitalexpenditures should be funded by cash flow providedby operating activities. Capital spending for theexpansion of sales and service capacity is expected toimprove future free cash and as such is not deductedfrom cash flow provided by operating activities beforechanges in non-cash working capital in arriving atadjusted free cash flow. Adjusted free cash flow is ameasure used by management in forecasting anddetermining the Company’s available resources for
future capital expenditure, repayment of debt, fundingthe future growth of the Company and dividends toShareholders.
In the year ending December 31, 2017, the Companypaid approximately $9.9 million in 2016 corporateincome taxes and 2017 tax installments. Accordingly,this reduced our adjusted free cash flow by thisamount. The Company expects the payment ofcorporate income taxes to have a more significantnegative affect on free cash flow and adjusted freecash flow. See “RESULTS FROM OPERATIONS –Income Taxes” for further detail regarding the impactof corporate income taxes on cash flow.
Page M32 Š AutoCanada Š 2017 Annual Report

Adjusted Return on Capital Employed
The Company has defined Adjusted Return on Capital Employed to be EBIT (EBITDA, as defined in “NON-GAAPMEASURES”, less depreciation and amortization) divided by Average Capital Employed in the Company (averageof shareholders’ equity and interest bearing debt, excluding floorplan financing, for the period, less thecomparative adjustment defined below). Calculations below represent the results on a quarterly basis, except forthe adjusted return on capital employed – 12 month trailing which incorporates the results based on the trailing12 months for the periods presented.
(in thousands of dollars,except unit and per unit amounts)
Q42017
Q32017
Q22017
Q12017
Q42016
Q32016
Q22016
Q12016
EBITDA1,2 31,124 29,978 47,757 17,228 28,536 26,915 30,845 21,010Deduct:Depreciation of property and
equipment (5,213) (5,297) (5,082) (4,852) (4,921) (4,860) (4,822) (4,954)
EBIT1,2 25,911 24,681 42,675 12,376 23,615 22,055 26,023 16,056Average long-term debt 339,741 353,315 357,103 351,986 333,310 315,678 310,281 300,520Average shareholder’s equity 534,338 526,209 510,610 498,732 491,026 503,163 516,513 510,595
Average capital employed1 874,079 879,524 867,713 850,718 824,336 818,841 826,794 811,115Return on capital 3.0% 2.8% 4.9% 1.5% 2.9% 2.7% 3.1% 2.0%
Comparative adjustment3 24,371 25,959 25,959 25,959 25,959 (13,191) (13,191) (13,191)
Adjusted average capital employed1 899,244 905,482 893,672 876,677 830,720 805,650 813,603 797,924
Adjusted return on capital employed1 2.9% 2.7% 4.8% 1.4% 2.8% 2.7% 3.2% 2.0%
Adjusted return on capital employed -12 month trailing 12.2% 12.1% 11.8% 9.9% 10.9% 10.6% 11.2% 11.7%
1 These financial measures are identified and defined under the section “NON-GAAP MEASURES”.2 EBITDA and EBIT used in the calculation of Adjusted Return on Capital Employed is calculated using the financial results
including non-controlling interests.3 A comparative adjustment has been made in order to adjust for impairments and reversals of impairments of intangible
assets. Due to the increased frequency of impairments and reversals of impairments, management has provided anadjustment in order to freeze intangible assets at the pre-IFRS amount of $43,700. As a result, all differences from January 1,2010 forward under IFRS have been adjusted at the post-tax rate at the time the adjustment to the intangible asset carryingamount was made. Management believes that the adjusted return on capital employed provides more useful informationabout the return on capital employed.
Management believes that Adjusted Return onCapital Employed (see “NON-GAAP MEASURES”) isa good measure to evaluate the profitability of ourinvested capital. As a corporation, Management ofAutoCanada may use this measure to comparepotential acquisitions and other capital investmentsagainst our internally computed cost of capital to
determine whether the investment is expected tocreate value for our shareholders. Managementmay also use this measure to look at pastacquisitions, capital investments and the Companyas a whole in order to ensure shareholder value isbeing achieved by these capital investments.
AutoCanada Š 2017 Annual Report Š Page M33

14. CRITICALACCOUNTING ESTIMATESAND ACCOUNTINGPOLICY DEVELOPMENTSA complete listing of critical accounting policies,estimates, judgments and measurement uncertaintycan be found in Notes 3 and 6 of the annualconsolidated financial statements for the year endedDecember 31, 2017.
Certain new standards, interpretations, amendmentsand improvements to existing standards were issuedby the IASB or International Financial ReportingInterpretations Committee (“IFRIC”) that are not yeteffective for the period ended December 31, 2017. Alisting of the standards issued which are applicable tothe Company can be found in Note 5 of the annualconsolidated financial statements for the year endedDecember 31, 2017.
The Company adopted the amendments to IAS 7,Statement of Cash Flows, effective for the annualconsolidated financial statements commencingJanuary 1, 2017.
15. DISCLOSURECONTROLS AND INTERNALCONTROLS OVERFINANCIAL REPORTINGDisclosure Controls & Procedures
Disclosure controls and procedures are designed toensure that information required to be disclosed bythe Company in reports filed with securities regulatoryauthorities is recorded, processed, summarized, andreported on a timely basis, and is accumulated andcommunicated to the Company’s management,including the Chief Executive Office (“CEO”) and ChiefFinancial Officer (“CFO”), as appropriate, to allowtimely decisions regarding required disclosure.
As of December 31, 2017, the Company’smanagement, with participation of the CEO and CFO,evaluated the effectiveness of the design andoperation of its disclosure controls and procedures, asdefined in National Instrument 52–109 of the
Canadian Securities Administrators, and haveconcluded that the Company’s disclosure controlsand procedures are effective.
Internal Controls over Financial Reporting
Management of the Company is responsible forestablishing and maintaining adequate internalcontrols over financial reporting. These controlsinclude policies and procedures that (1) pertain to themaintenance of records that, in reasonable detail,accurately and fairly reflect the transactions anddispositions of the assets of the Company; (2) providereasonable assurance that transactions are recordedas necessary to permit preparation of financialstatements in accordance with GAAP, and thatreceipts and expenditures are being made only inaccordance with authorizations of management anddirectors of the Company; and (3) provide reasonableassurance regarding prevention or timely detection ofunauthorized acquisition, use or disposition of theCompany’s assets that could have a material effect onthe financial statements.
All control systems contain inherent limitations, nomatter how well designed. As a result, the Company’smanagement acknowledges that its internal controlsover financial reporting will not prevent or detect allmisstatements due to error or fraud. In addition,management’s evaluation of controls can provide onlyreasonable, not absolute, assurance that all controlissues that may result in material misstatements, ifany, have been detected.
Management, under the supervision of and with theparticipation of the Company’s CEO and CFO,evaluated the effectiveness of the Corporation’sinternal controls over financial reporting (as definedunder national Instrument 52–109 Certification ofDisclosure in Issuers’ Annual and Interim Filings). Inmaking this evaluation, management used the criteriaset forth by the Committee of SponsoringOrganizations of the Treadway Commissions (“COSO”)in Internal Control – Integrated Framework (2013).Based on that evaluation, management and the CEOand CFO have concluded that, as at December 31,2017, the Corporation’s internal controls over financialreporting were effective. This evaluation took intoconsideration the Corporation’s Corporate DisclosurePolicy and the functioning of its Disclosure PolicyCommittee.
Page M34 Š AutoCanada Š 2017 Annual Report

Changes in Internal Control over Financial Reporting
There have been no changes in the Company’sinternal control over financial reporting that havematerially affected, or are reasonably likely tomaterially affect, the Company’s internal control overfinancial reporting during the year endedDecember 31, 2017.
16. RISK FACTORSWe face a number of business risks that could causeour actual results to differ materially from thosedisclosed in this MD&A (See “FORWARD LOOKINGSTATEMENTS”). Investors and the public shouldcarefully consider our business risks, otheruncertainties and potential events as well as theinherent uncertainty of forward looking statementswhen making investment decisions with respect toAutoCanada. If any of the business risks identified byAutoCanada were to occur, our business, financialcondition, results of operations, cash flows orprospects could be materially adversely affected. Insuch case, the trading price of our shares coulddecline. Additional risks and uncertainties notpresently known to us or that we currently deemimmaterial may also adversely affect our business andoperations. A comprehensive discussion of the knownrisk factors of AutoCanada and additional businessrisks is available in our 2017 Annual Information Formdated March 15, 2018 available on the SEDAR websiteat www.sedar.com.
17. FORWARD LOOKINGSTATEMENTSCertain statements contained in the MD&A areforward-looking statements and information(collectively “forward-looking statements”), within themeaning of the applicable Canadian securitieslegislation. We hereby provide cautionary statementsidentifying important factors that could cause ouractual results to differ materially from those projected
in these forward-looking statements. Any statementsthat express, or involve discussions as to,expectations, beliefs, plans, objectives, assumptionsor future events or performance (often, but notalways, through the use of words or phrases such as“will likely result”, “are expected to”, “will continue”,“is anticipated”, “projection”, “vision”, “goals”,“objective”, “target”, “schedules”, “outlook”,“anticipate”, “expect”, “estimate”, “could”, “should”,“plan”, “seek”, “may”, “intend”, “likely”, “will”,“believe”, “shall” and similar expressions) are nothistorical facts and are forward-looking and mayinvolve estimates and assumptions and are subject torisks, uncertainties and other factors some of whichare beyond our control and difficult to predict.Accordingly, these factors could cause actual resultsor outcomes to differ materially from those expressedin the forward-looking statements. Therefore, anysuch forward-looking statements are qualified in theirentirety by reference to the factors discussedthroughout this document.
Details of the Company’s material forward-lookingstatements are included in the Company’s mostrecent Annual Information Form. The Company’s mostrecent Annual Information Form and other documentsfiled with securities regulatory authorities (accessiblethrough the SEDAR website www.sedar.com) describethe risks, material assumptions and other factors thatcould influence actual results and which areincorporated herein by reference.
Further, any forward-looking statement speaks only asof the date on which such statement is made, and,except as required by applicable law, we undertake noobligation to update any forward-looking statement toreflect events or circumstances after the date onwhich such statement is made or to reflect theoccurrence of unanticipated events. New factorsemerge from time to time, and it is not possible formanagement to predict all of such factors and toassess in advance the impact of each such factor onour business or the extent to which any factor, orcombination of factors, may cause actual results todiffer materially from those contained in anyforward-looking statement.
AutoCanada Š 2017 Annual Report Š Page M35

18. NON-GAAP MEASURESOur MD&A contains certain financial measures that donot have any standardized meaning prescribed byCanadian GAAP. Therefore, these financial measuresmay not be comparable to similar measures presentedby other issuers. Investors are cautioned thesemeasures should not be construed as an alternative tonet earnings (loss) or to cash provided by (used in)operating, investing, and financing activitiesdetermined in accordance with Canadian GAAP, asindicators of our performance. We provide thesemeasures to assist investors in determining our abilityto generate earnings and cash provided by (used in)operating activities and to provide additionalinformation on how these cash resources are used.We list and define these “NON-GAAP MEASURES”below:
Operating profit
Operating profit is a measure commonly reported andwidely used by investors as an indicator of acompany’s operating performance. The Companybelieves Operating profit assists investors in analyzinga company’s performance before the costs of debtand other financing, also excluding other gains orlosses and income taxes. References to “Operatingprofit” are to earnings before interest expense interestincome, other gains or losses and income taxes.
EBITDA
EBITDA is a measure commonly reported and widelyused by investors as an indicator of a company’soperating performance and ability to incur and servicedebt, and as a valuation metric. The Company believesEBITDA assists investors in comparing a company’sperformance on a consistent basis without regard todepreciation and amortization and asset impairmentcharges which are non-cash in nature and can varysignificantly depending upon accounting methods ornon-operating factors such as historical cost.References to “EBITDA” are to earnings before interestexpense (other than interest expense on floorplanfinancing and other interest), income taxes,depreciation, amortization and asset impairmentcharges. EBITDA attributable to AutoCanadashareholders refers to the parent portion ofconsolidated financial results. Non-controlling interest(the portion of ownership not attributable to theparent) is excluded.
Adjusted EBITDA
Adjusted EBITDA is an indicator of a company’soperating performance and ability to incur and servicedebt. The portion of share-based compensationrelated to changes in the share price and its impact onthe Company’s cash-settled portions of itsshare-based compensation programs, the revaluationof redemption liabilities, the unrealized gain or loss onembedded derivatives, gains or losses on dealershipdivestitures and certain non-recurring items are addedback to EBITDA to get to adjusted EBITDA. TheCompany believes adjusted EBITDA provides a betterrepresentation of continuing operations and improvedcontinuity with respect to the comparison of ouroperating results over a period of time. AdjustedEBITDA attributable to AutoCanada shareholdersrefers to the parent portion of consolidated financialresults. Non-controlling interest (the portion ofownership not attributable to the parent) is excluded.
Adjusted Net Earnings and Adjusted Net Earningsper Share
Adjusted net earnings and adjusted net earnings pershare are measures of our profitability. Adjusted netearnings is calculated by adding back the after-taxeffect of impairment or reversals of impairment ofintangible assets, impairments of goodwill, therevaluation of redemption liabilities, the unrealizedgain or loss on embedded derivatives, and the portionof share-based compensation related to changes inthe share price and its impact on the Company’scash-settled portions of its share-based compensationprograms, gains or losses on dealership divestituresand certain non-recurring items. Adding back theseamounts to net earnings allows management to betterassess the net earnings of the Company fromcontinuing operations. Adjusted net earnings pershare is calculated by dividing adjusted net earningsby the weighted-average number of sharesoutstanding.
EBIT
EBIT is a measure used by management in thecalculation of return on capital employed (definedbelow). Management’s calculation of EBIT is EBITDA(calculated above) less depreciation and amortization.
Page M36 Š AutoCanada Š 2017 Annual Report
Free Cash Flow
Free cash flow is a measure used by management toevaluate its performance. While the closest CanadianGAAP measure is cash provided by operatingactivities, free cash flow is considered relevantbecause it provides an indication of how much cashgenerated by operations is available after capitalexpenditures. It shall be noted that although weconsider this measure to be free cash flow, financialand non-financial covenants in our credit facilities anddealer agreements may restrict cash from beingavailable for distributions, re-investment in theCompany, potential acquisitions, or other purposes.Investors should be cautioned that free cash flow maynot actually be available for growth or distribution ofthe Company. References to “Free cash flow” are tocash provided by (used in) operating activities(including the net change in non-cash working capitalbalances) less capital expenditure (not includingacquisitions of dealerships and dealership facilities).
Adjusted Free Cash Flow
Adjusted free cash flow is a measure used bymanagement to evaluate its performance. Adjustedfree cash flow is considered relevant because itprovides an indication of how much cash generatedby operations before changes in non-cash workingcapital is available after deducting expenditures fornon-growth capital assets. It shall be noted thatalthough we consider this measure to be adjusted freecash flow, financial and non-financial covenants in ourcredit facilities and dealer agreements may restrictcash from being available for distributions,re-investment in the Company, potential acquisitions,or other purposes. Investors should be cautioned thatadjusted free cash flow may not actually be availablefor growth or distribution of the Company. Referencesto “Adjusted free cash flow” are to cash provided by(used in) operating activities (before changes innon-cash working capital balances) less non-growthcapital expenditures.
Absorption Rate
Absorption rate is an operating measure commonlyused in the retail automotive industry as an indicatorof the performance of the parts, service and collisionrepair operations of a franchised automobiledealership. Absorption rate is not a measurerecognized by GAAP and does not have astandardized meaning prescribed by GAAP. Therefore,
absorption rate may not be comparable to similarmeasures presented by other issuers that operate inthe retail automotive industry. References to‘‘absorption rate’’ are to the extent to which the grossprofits of a franchised automobile dealership fromparts, service and collision repair cover the costs ofthese departments plus the fixed costs of operatingthe dealership, but does not include expensespertaining to our head office. For this purpose, fixedoperating costs include fixed salaries and benefits,administration costs, occupancy costs, insuranceexpense, utilities expense and interest expense (otherthan interest expense relating to floor plan financing)of the dealerships only.
Average Capital Employed
Average capital employed is a measure used bymanagement to determine the amount of capitalinvested in AutoCanada and is used in the measure ofReturn on Capital Employed (described below).Average capital employed is calculated as the averagebalance of interest bearing debt for the period(including current portion of long-term debt,excluding revolving floorplan facilities) and theaverage balance of shareholders equity for the period.Management does not include future income tax,non-interest bearing debt, or revolving floorplanfacilities in the calculation of average capitalemployed as it does not consider these items to becapital, but rather debt incurred to finance theoperating activities of the Company.
Adjusted Average Capital Employed
Adjusted average capital employed is a measure usedby management to determine the amount of capitalinvested in AutoCanada and is used in the measure ofAdjusted Return on Capital Employed (describedbelow). Adjusted average capital employed iscalculated as the average balance of interest bearingdebt for the period (including current portion oflong-term debt, excluding revolving floorplanfacilities) and the average balance of shareholdersequity for the period, adjusted for impairments ofintangible assets, net of deferred tax. Managementdoes not include future income tax, non-interestbearing debt, or revolving floorplan facilities in thecalculation of adjusted average capital employed as itdoes not consider these items to be capital, but ratherdebt incurred to finance the operating activities of theCompany.
AutoCanada Š 2017 Annual Report Š Page M37
Return on Capital Employed
Return on capital employed is a measure used bymanagement to evaluate the profitability of ourinvested capital. As a corporation, management ofAutoCanada may use this measure to comparepotential acquisitions and other capital investmentsagainst our internally computed cost of capital todetermine whether the investment shall create valuefor our shareholders. Management may also use thismeasure to look at past acquisitions, capitalinvestments and the Company as a whole in order toensure shareholder value is being achieved by thesecapital investments. Return on capital employed iscalculated as EBIT (defined above) divided by AverageCapital Employed (defined above).
Adjusted Return on Capital Employed
Adjusted return on capital employed is a measureused by management to evaluate the profitability ofour invested capital. As a corporation, management ofAutoCanada may use this measure to comparepotential acquisitions and other capital investmentsagainst our internally computed cost of capital todetermine whether the investment shall create valuefor our shareholders. Management may also use thismeasure to look at past acquisitions, capitalinvestments and the Company as a whole in order toensure shareholder value is being achieved by thesecapital investments. Adjusted return on capital
employed is calculated as EBIT (defined above)divided by Adjusted Average Capital Employed(defined above).
Cautionary Note Regarding Non-GAAP Measures
EBITDA, EBIT, Free Cash Flow, Absorption Rate,Average Capital Employed, Return on CapitalEmployed, Adjusted Average Capital Employed andAdjusted Return on Capital Employed are not earningsmeasures recognized by GAAP and do not havestandardized meanings prescribed by GAAP. Investorsare cautioned that these non-GAAP measures shouldnot replace net earnings or loss (as determined inaccordance with GAAP) as an indicator of theCompany’s performance, of its cash flows fromoperating, investing and financing activities or as ameasure of its liquidity and cash flows. TheCompany’s methods of calculating EBITDA, EBIT, FreeCash Flow, Absorption Rate, Average CapitalEmployed, Return on Capital Employed. AdjustedAverage Capital Employed and Adjusted Return onCapital Employed may differ from the methods usedby other issuers. Therefore, the Company’s EBITDA,EBIT, Free Cash Flow, Absorption Rate, AverageCapital Employed, Return on Capital Employed,Adjusted Average Capital Employed and AdjustedReturn on Capital Employed may not be comparableto similar measures presented by other issuers.
Page M38 Š AutoCanada Š 2017 Annual Report

AutoCanada Inc.
200 - 15511 123 Avenue NWEdmonton, AB • T5V 0C3www.autocan.ca