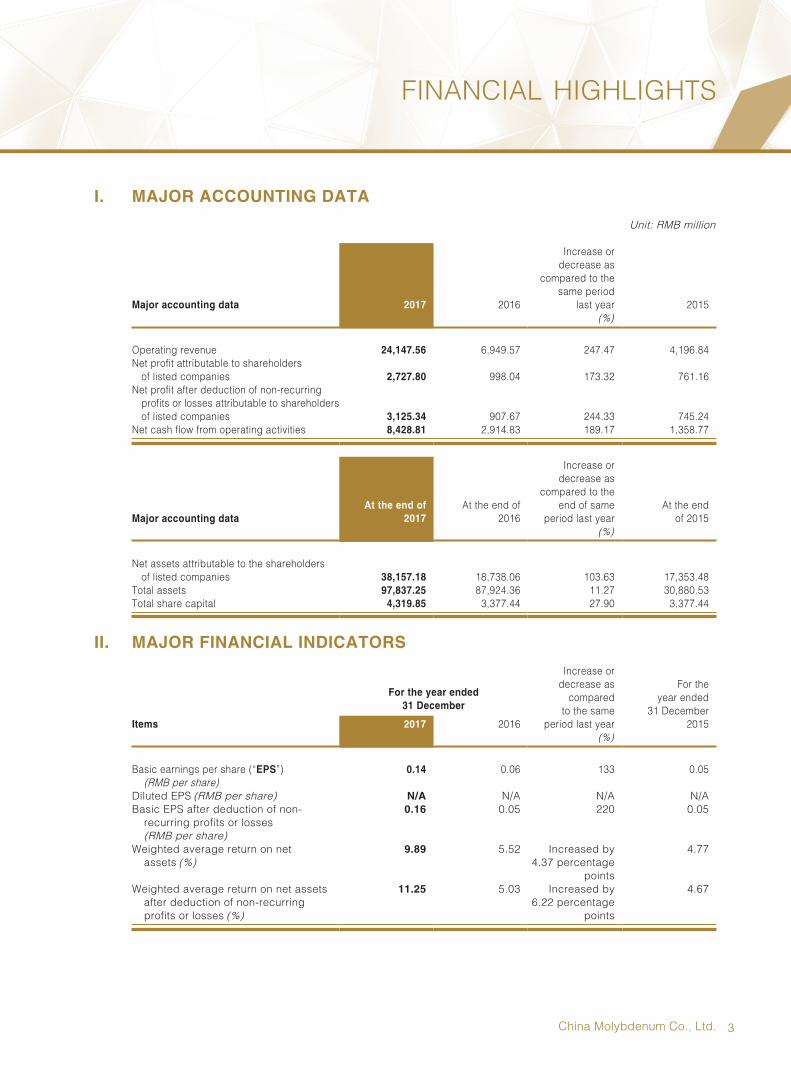
2017 · china molybdenum co., ltd. 3 financial highlights i. major accounting data unit: rmb...
TRANSCRIPT

Stock Code: 3993
*
* For identification purposes only* For identification purposes only
*
2017ANNUAL REPORT
2017 AN
NU
AL R
EP
OR
T

1China Molybdenum Co., Ltd.
CONTENTS
COMPANY PROFILE 2
FINANCIAL HIGHLIGHTS 3
CHAIRMAN’S LETTER 10
MARKET REVIEW AND PROSPECTS 12
BUSINESS REVIEW AND PROSPECTS 18
MANAGEMENT DISCUSSION AND ANALYSIS 21
RESOURCES AND RESERVES 31
MATERIAL EVENTS 34
MATERIAL EVENTS 34
HONOURS 35
DOMESTIC AND OVERSEAS INDUSTRY POLICIES 36
RISK WARNING 38
CORPORATE GOVERNANCE REPORT 41
REPORT OF THE BOARD OF DIRECTORS 55
REPORT OF THE SUPERVISORY COMMITTEE 73
PROFILES OF DIRECTORS, SUPERVISORS AND SENIOR MANAGEMENT 76
CORPORATE INFORMATION 81
AUDITOR’S REPORT 83
THIS ANNUAL REPORT INCLUDES FORWARD-LOOKING STATEMENTS. ALL STATEMENTS,
OTHER THAN STATEMENTS OF HISTORICAL FACTS, THAT ADDRESS BUSINESS ACTIVITIES,
EVENTS OR DEVELOPMENTS THAT THE COMPANY EXPECTS OR ANTICIPATES MAY OR
WILL OCCUR IN THE FUTURE (INCLUDING BUT NOT LIMITED TO PROJECTIONS, TARGETS,
ESTIMATES AND BUSINESS PLANS) ARE FORWARD-LOOKING STATEMENTS. THE COMPANY’S
ACTUAL RESULTS OR DEVELOPMENTS MAY DIFFER MATERIALLY FROM THOSE INDICATED
BY THESE FORWARD-LOOKING STATEMENTS AS A RESULT OF VARIOUS VARIABLES
AND UNCERTAINTIES. THE COMPANY MAKES THE FORWARD-LOOKING STATEMENTS IN
THE ANNUAL REPORT FOR THE YEAR REFERRED TO HEREIN AS AT 29 MARCH 2018 AND
UNDERTAKES NO OBLIGATION OR RESPONSIBILITY TO UPDATE THESE STATEMENTS, AND
DO NOT CONSTITUTE THE COMPANY’S SUBSTANTIVE UNDERTAKINGS TO INVESTORS.
INVESTORS ARE ADVISED TO PAY ATTENTION TO INVESTMENT RISKS.
Note: This annual report was prepared in both Chinese and English versions. Where there is discrepancy between the Chinese and English versions, the Chinese version shall prevail.

2 2017 Annual Report
COMPANY PROFILE
China Molybdenum Co., Ltd. (hereinafter referred to as “CMOC” or the “Company”, together with its subsidiaries, the “Group”) engages in non-ferrous metal mining, mainly the selection, smelting, and deep processing of copper, molybdenum, tungsten, cobalt, niobium and phosphate. With a relatively integrated industrial chain, the Company is globally one of the top five molybdenum manufacturers, the largest tungsten manufacturer, the second largest cobalt and niobium manufacturer, and a leading copper manufacturer; as well as the second largest phosphate fertilizer manufacturer in Brazil. The Company is currently listed on the Shanghai Stock Exchange (the “SSE”) (Stock Code: 603993) and The Stock Exchange of Hong Kong Limited (the “Stock Exchange”) (Stock Code: 03993).
CMOC has the highest molybdenum iron and molybdenum oxide production capacity in China. Sandaozhuang molybdenum and tungsten mine, wholly owned and operated by the Company, has the largest proven molybdenum reserves and the second largest proven tungsten reserves in the country, making it a very competitive, low cost producer of these metals. Shangfanggou molybdenum and iron mine, owned by the joint venture of the Company, has abundant high-grade molybdenum reserves. Donggebi molybdenum mine in Hami, Xinjiang, owned by a subsidiary of the Company, is the first super-scale porphyry molybdenum mine in Xinjiang, and features a large reserve that is high grade, shallow depth, and easy to exploit.
The overseas businesses of CMOC are in Brazil, the Democratic Republic of Congo (“DRC”) and Australia. CMOC International, located in Phoenix, Arizona U.S.A. is responsible for the operation and control of our International business.
Copebras Indústria Ltda. (“CIL”) and Niobras Mineração Ltda (“NML”) are located in Brazil. CMOC indirectly holds 100% equity of the phosphate business of CIL. CIL is a sophisticated producer of phosphate fertilizer and the second largest fertilizer manufacturer in Brazil, covering the entire phosphate industrial chain. The total annual amount of minerals that it processes reaches nearly 6 million tonnes, and the total production ranks second in Brazil. Its main products include high-analysis phosphate fertilizer (MAP, GTSP), low-analysis phosphate fertilizer (SSG and SSP powder), animal feed supplements (DCP), intermediate products (phosphoric acid and sulfuric acid, the latter mainly used by CIL), and relevant by-products (gypsum, fluosilicic acid). CMOC indirectly holds 100% equity of the niobium business of NML. NML is the world’s second largest niobium manufacturer and engages in exploiting and processing niobium minerals. Its main product is ferroniobium. NML produces niobium products that meet customer's requirements by processing niobium minerals, including crushing, screening, concentrating, leaching, and smelting. Its productive assets include the Boa Vista Mine, BV processing plant, BVFR processing plant, and a process plant for phosphate tailings.
Tenke Fungurume Mining (“TFM”) is located in the DRC. The Company holds 56% of its equity indirectly plus the exclusive right to purchase an additional 24% equity in TFM. TFM engages in exploration, mining, refining, processing and selling copper and cobalt in a mining concession that covers nearly 1,600 sq km. Its main products are copper cathode and cobalt hydroxide. TFM operates a large, high-grade copper deposit that also hosts one of the largest, high-grade cobalt deposits in the world.
The Company also holds 80% equity of Northparkes Copper and Gold Mine (“NPM”) in Australia, which utilizes both block cave and sublevel underground mining methods. Its advanced extraction process associated with the active block cave are fully automated.
Our vision is to develop a respected international resources company. While consolidating and maintaining our advantage of current low-cost business, we are also committed to investing in and integrating high-quality resources all over the world, relying on international management practices with the flexibility to raise funding via multi-channel financing platforms.
3China Molybdenum Co., Ltd.
FINANCIAL HIGHLIGHTS
I. MAJOR ACCOUNTING DATA
Unit: RMB million
Major accounting data 2017 2016
Increase or decrease as
compared to the same period
last year 2015(%)
Operating revenue 24,147.56 6,949.57 247.47 4,196.84Net profit attributable to shareholders
of listed companies 2,727.80 998.04 173.32 761.16Net profit after deduction of non-recurring
profits or losses attributable to shareholders of listed companies 3,125.34 907.67 244.33 745.24
Net cash flow from operating activities 8,428.81 2,914.83 189.17 1,358.77
Major accounting dataAt the end of
2017At the end of
2016
Increase or decrease as
compared to theend of same
period last yearAt the end
of 2015(%)
Net assets attributable to the shareholders of listed companies 38,157.18 18,738.06 103.63 17,353.48
Total assets 97,837.25 87,924.36 11.27 30,880.53Total share capital 4,319.85 3,377.44 27.90 3,377.44
II. MAJOR FINANCIAL INDICATORS
Items
For the year ended 31 December
Increase ordecrease as
comparedto the same
period last year
For the year ended
31 December 20152017 2016
(%)
Basic earnings per share (“EPS”) (RMB per share)
0.14 0.06 133 0.05
Diluted EPS (RMB per share) N/A N/A N/A N/ABasic EPS after deduction of non-
recurring profits or losses (RMB per share)
0.16 0.05 220 0.05
Weighted average return on net assets (%)
9.89 5.52 Increased by 4.37 percentage
points
4.77
Weighted average return on net assets after deduction of non-recurring profits or losses (%)
11.25 5.03 Increased by 6.22 percentage
points
4.67
4 2017 Annual Report
FINANCIAL HIGHLIGHTS
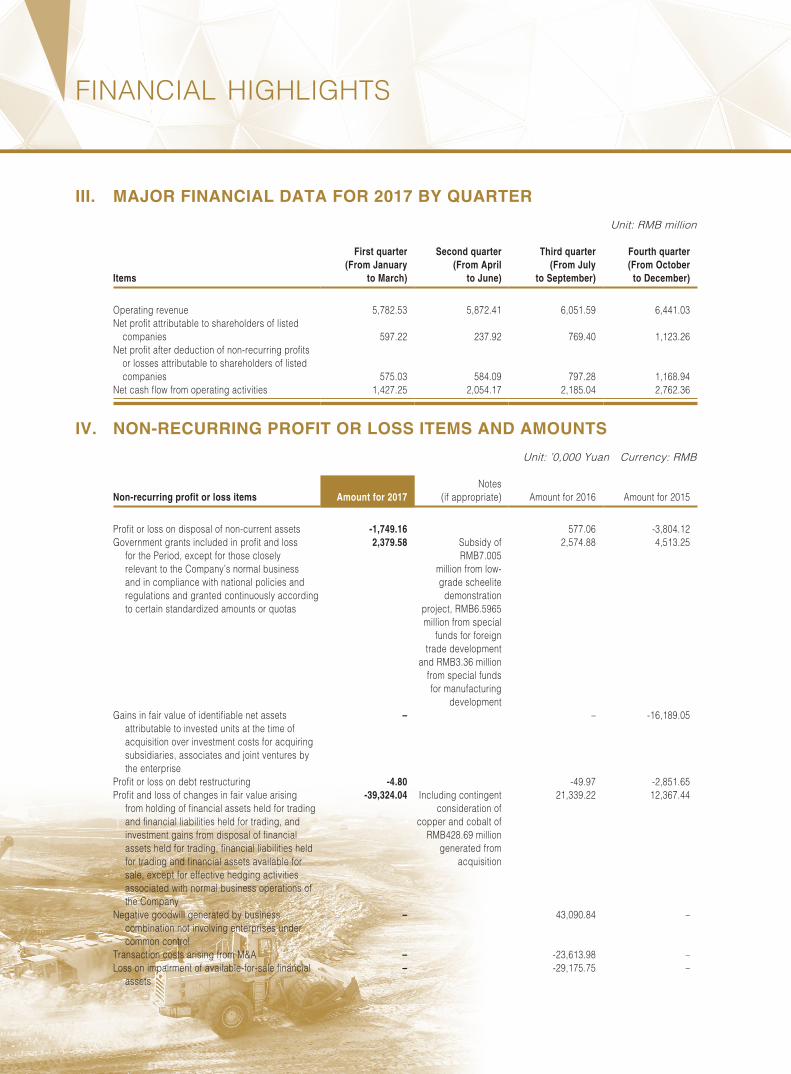
III. MAJOR FINANCIAL DATA FOR 2017 BY QUARTER
Unit: RMB million
Items
First quarter(From January
to March)
Second quarter(From April
to June)
Third quarter(From July
to September)
Fourth quarter(From October
to December)
Operating revenue 5,782.53 5,872.41 6,051.59 6,441.03Net profit attributable to shareholders of listed
companies 597.22 237.92 769.40 1,123.26Net profit after deduction of non-recurring profits
or losses attributable to shareholders of listed companies 575.03 584.09 797.28 1,168.94
Net cash flow from operating activities 1,427.25 2,054.17 2,185.04 2,762.36
IV. NON-RECURRING PROFIT OR LOSS ITEMS AND AMOUNTS
Unit: ’0,000 Yuan Currency: RMB
Non-recurring profit or loss items Amount for 2017Notes
(if appropriate) Amount for 2016 Amount for 2015
Profit or loss on disposal of non-current assets -1,749.16 577.06 -3,804.12Government grants included in profit and loss
for the Period, except for those closely relevant to the Company’s normal business and in compliance with national policies and regulations and granted continuously according to certain standardized amounts or quotas
2,379.58 Subsidy of RMB7.005
million from low-grade scheelite
demonstration project, RMB6.5965 million from special
funds for foreign trade development
and RMB3.36 million from special funds for manufacturing
development
2,574.88 4,513.25
Gains in fair value of identifiable net assets attributable to invested units at the time of acquisition over investment costs for acquiring subsidiaries, associates and joint ventures by the enterprise
– – -16,189.05
Profit or loss on debt restructuring -4.80 -49.97 -2,851.65Profit and loss of changes in fair value arising
from holding of financial assets held for trading and financial liabilities held for trading, and investment gains from disposal of financial assets held for trading, financial liabilities held for trading and financial assets available for sale, except for effective hedging activities associated with normal business operations of the Company
-39,324.04 Including contingent consideration of
copper and cobalt of RMB428.69 million
generated from acquisition
21,339.22 12,367.44
Negative goodwill generated by business combination not involving enterprises under common control
– 43,090.84 –
Transaction costs arising from M&A – -23,613.98 –Loss on impairment of available-for-sale financial
assets– -29,175.75 –

5China Molybdenum Co., Ltd.
FINANCIAL HIGHLIGHTS
Non-recurring profit or loss items Amount for 2017Notes
(if appropriate) Amount for 2016 Amount for 2015
Loss on impairment of long-term assets – -119.39 –Other non-operating income or expenses other
than the above items-515.10 RMB29.2353 million
for charitable donation expenditure
-2,295.54 -2,302.32
Effects of minority interests -10.23 0.42 -12.23Income tax effects -531.00 -3,290.56 9,871.04
Total -39,754.75 9,037.23 1,592.36
V. CONSOLIDATED FINANCIAL STATEMENTS
(I) Consolidated Balance Sheet
As at 31 December
Items 2017 2016 (restated) Increase(decrease)RMB million RMB million
Current assets:Cash and cash balances 26,508.76 9,970.22 165.88%Financial assets measured at fair
value through profit or loss – 55.60 -100.00%Notes receivable 1,750.69 950.86 84.12%Accounts receivable 2,144.63 1,461.81 46.71%Prepayments 110.58 295.57 -62.59%Interest receivable 656.70 40.49 1521.88%Other receivables 789.92 1,147.04 -31.13%Inventories 5,705.50 5,082.77 12.25%Other current assets 1,382.00 798.59 73.06%
Total current assets 39,048.80 19,802.96 97.19%
Non-current assets:Available-for-sale financial assets 3,246.90 3,000.60 8.21%Long-term equity investment 1,136.37 1,191.50 -4.63%Fixed assets 24,234.93 27,272.92 -11.14%Construction in progress 950.11 695.36 36.64%Long-term inventory 4,352.01 4,269.62 1.93%Intangible assets 21,536.18 24,501.31 -12.10%Goodwill 833.59 892.33 -6.58%Long-term prepaid expenses 116.19 115.25 0.82%Deferred tax assets 304.70 432.12 -29.49%Other non-current assets 2,077.45 5,750.40 -63.87%
Total non-current assets 58,788.45 68,121.40 -13.70%
Total assets 97,837.25 87,924.36 11.27%
6 2017 Annual Report
FINANCIAL HIGHLIGHTS
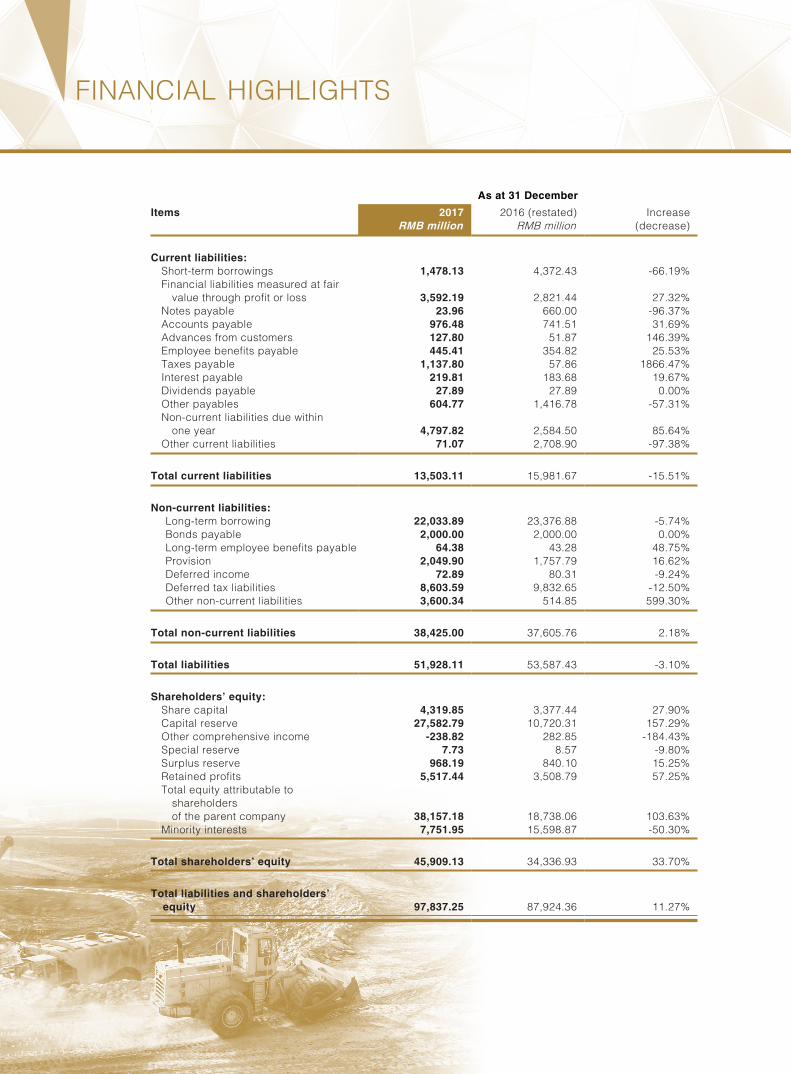
As at 31 December
Items 2017 2016 (restated) Increase(decrease)RMB million RMB million
Current liabilities:Short-term borrowings 1,478.13 4,372.43 -66.19%Financial liabilities measured at fair
value through profit or loss 3,592.19 2,821.44 27.32%Notes payable 23.96 660.00 -96.37%Accounts payable 976.48 741.51 31.69%Advances from customers 127.80 51.87 146.39%Employee benefits payable 445.41 354.82 25.53%Taxes payable 1,137.80 57.86 1866.47%Interest payable 219.81 183.68 19.67%Dividends payable 27.89 27.89 0.00%Other payables 604.77 1,416.78 -57.31%Non-current liabilities due within
one year 4,797.82 2,584.50 85.64%Other current liabilities 71.07 2,708.90 -97.38%
Total current liabilities 13,503.11 15,981.67 -15.51%
Non-current liabilities:Long-term borrowing 22,033.89 23,376.88 -5.74%Bonds payable 2,000.00 2,000.00 0.00%Long-term employee benefits payable 64.38 43.28 48.75%Provision 2,049.90 1,757.79 16.62%Deferred income 72.89 80.31 -9.24%Deferred tax liabilities 8,603.59 9,832.65 -12.50%Other non-current liabilities 3,600.34 514.85 599.30%
Total non-current liabilities 38,425.00 37,605.76 2.18%
Total liabilities 51,928.11 53,587.43 -3.10%
Shareholders’ equity:Share capital 4,319.85 3,377.44 27.90%Capital reserve 27,582.79 10,720.31 157.29%Other comprehensive income -238.82 282.85 -184.43%Special reserve 7.73 8.57 -9.80%Surplus reserve 968.19 840.10 15.25%Retained profits 5,517.44 3,508.79 57.25%Total equity attributable to
shareholders of the parent company 38,157.18 18,738.06 103.63%
Minority interests 7,751.95 15,598.87 -50.30%
Total shareholders’ equity 45,909.13 34,336.93 33.70%
Total liabilities and shareholders’ equity 97,837.25 87,924.36 11.27%
7China Molybdenum Co., Ltd.
FINANCIAL HIGHLIGHTS
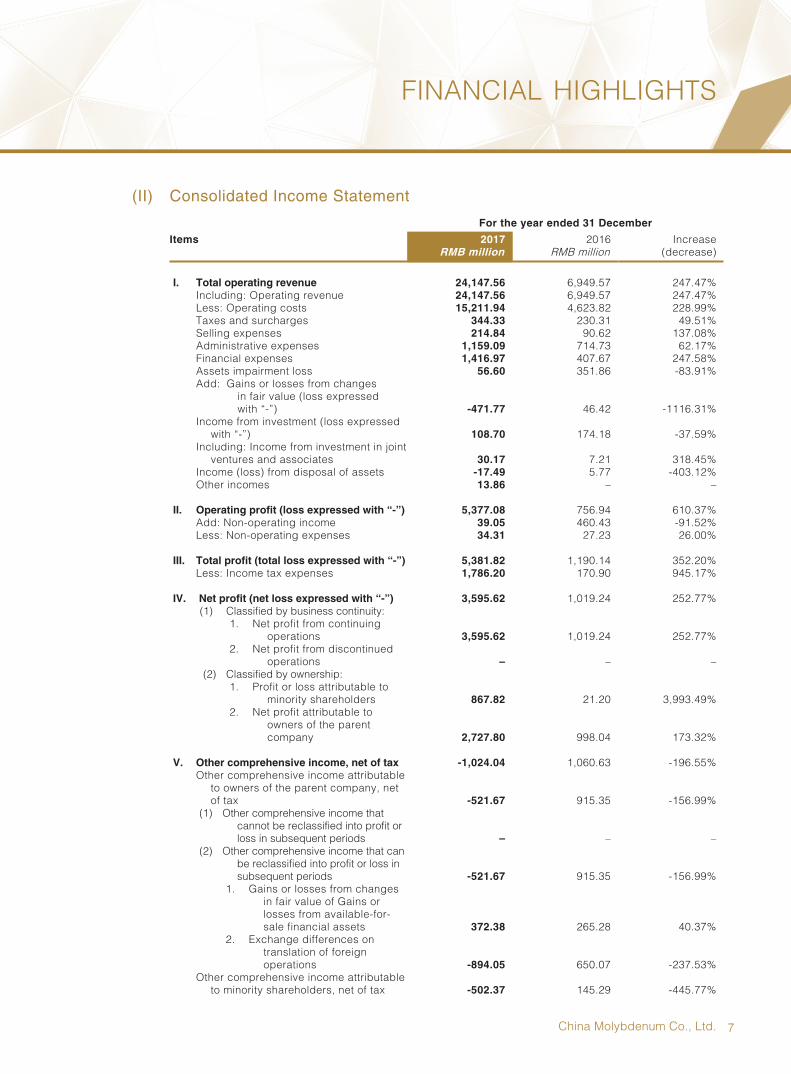
(II) Consolidated Income Statement
For the year ended 31 December
Items 2017 2016 Increase(decrease)RMB million RMB million
I. Total operating revenue 24,147.56 6,949.57 247.47%Including: Operating revenue 24,147.56 6,949.57 247.47%Less: Operating costs 15,211.94 4,623.82 228.99%Taxes and surcharges 344.33 230.31 49.51%Selling expenses 214.84 90.62 137.08%Administrative expenses 1,159.09 714.73 62.17%Financial expenses 1,416.97 407.67 247.58%Assets impairment loss 56.60 351.86 -83.91%Add: Gains or losses from changes
in fair value (loss expressed with “-”) -471.77 46.42 -1116.31%
Income from investment (loss expressed with “-”) 108.70 174.18 -37.59%
Including: Income from investment in joint ventures and associates 30.17 7.21 318.45%
Income (loss) from disposal of assets -17.49 5.77 -403.12%Other incomes 13.86 – –
II. Operating profit (loss expressed with “-”) 5,377.08 756.94 610.37%Add: Non-operating income 39.05 460.43 -91.52%Less: Non-operating expenses 34.31 27.23 26.00%
III. Total profit (total loss expressed with “-”) 5,381.82 1,190.14 352.20%Less: Income tax expenses 1,786.20 170.90 945.17%
IV. Net profit (net loss expressed with “-”) 3,595.62 1,019.24 252.77%(1) Classified by business continuity:
1. Net profit from continuing operations 3,595.62 1,019.24 252.77%
2. Net profit from discontinued operations – – –
(2) Classified by ownership:1. Profit or loss attributable to
minority shareholders 867.82 21.20 3,993.49%2. Net profit attributable to
owners of the parent company 2,727.80 998.04 173.32%
V. Other comprehensive income, net of tax -1,024.04 1,060.63 -196.55%Other comprehensive income attributable
to owners of the parent company, net of tax -521.67 915.35 -156.99%
(1) Other comprehensive income that cannot be reclassified into profit or loss in subsequent periods – – –
(2) Other comprehensive income that can be reclassified into profit or loss in subsequent periods -521.67 915.35 -156.99%
1. Gains or losses from changes in fair value of Gains or losses from available-for-sale financial assets 372.38 265.28 40.37%
2. Exchange differences on translation of foreign operations -894.05 650.07 -237.53%
Other comprehensive income attributable to minority shareholders, net of tax -502.37 145.29 -445.77%
8 2017 Annual Report
FINANCIAL HIGHLIGHTS
For the year ended 31 December
Items 2017 2016 Increase(decrease)RMB million RMB million
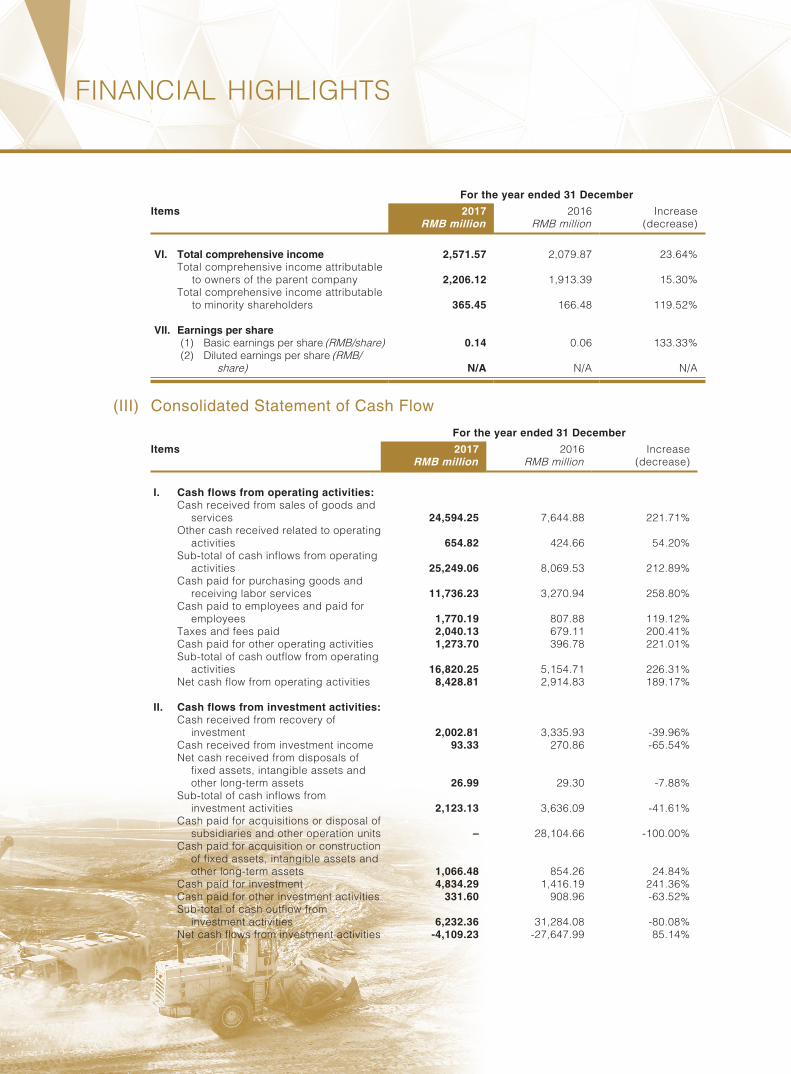
VI. Total comprehensive income 2,571.57 2,079.87 23.64%Total comprehensive income attributable
to owners of the parent company 2,206.12 1,913.39 15.30%Total comprehensive income attributable
to minority shareholders 365.45 166.48 119.52%
VII. Earnings per share(1) Basic earnings per share (RMB/share) 0.14 0.06 133.33%(2) Diluted earnings per share (RMB/
share) N/A N/A N/A
(III) Consolidated Statement of Cash Flow
For the year ended 31 December
Items 2017 2016 Increase(decrease)RMB million RMB million
I. Cash flows from operating activities:Cash received from sales of goods and
services 24,594.25 7,644.88 221.71%Other cash received related to operating
activities 654.82 424.66 54.20%Sub-total of cash inflows from operating
activities 25,249.06 8,069.53 212.89%Cash paid for purchasing goods and
receiving labor services 11,736.23 3,270.94 258.80%Cash paid to employees and paid for
employees 1,770.19 807.88 119.12%Taxes and fees paid 2,040.13 679.11 200.41%Cash paid for other operating activities 1,273.70 396.78 221.01%Sub-total of cash outflow from operating
activities 16,820.25 5,154.71 226.31%Net cash flow from operating activities 8,428.81 2,914.83 189.17%
II. Cash flows from investment activities:Cash received from recovery of
investment 2,002.81 3,335.93 -39.96%Cash received from investment income 93.33 270.86 -65.54%Net cash received from disposals of
fixed assets, intangible assets and other long-term assets 26.99 29.30 -7.88%
Sub-total of cash inflows from investment activities 2,123.13 3,636.09 -41.61%
Cash paid for acquisitions or disposal of subsidiaries and other operation units – 28,104.66 -100.00%
Cash paid for acquisition or construction of fixed assets, intangible assets and other long-term assets 1,066.48 854.26 24.84%
Cash paid for investment 4,834.29 1,416.19 241.36%Cash paid for other investment activities 331.60 908.96 -63.52%Sub-total of cash outflow from
investment activities 6,232.36 31,284.08 -80.08%Net cash flows from investment activities -4,109.23 -27,647.99 85.14%
9China Molybdenum Co., Ltd.
FINANCIAL HIGHLIGHTS
For the year ended 31 December
Items 2017 2016 Increase(decrease)RMB million RMB million
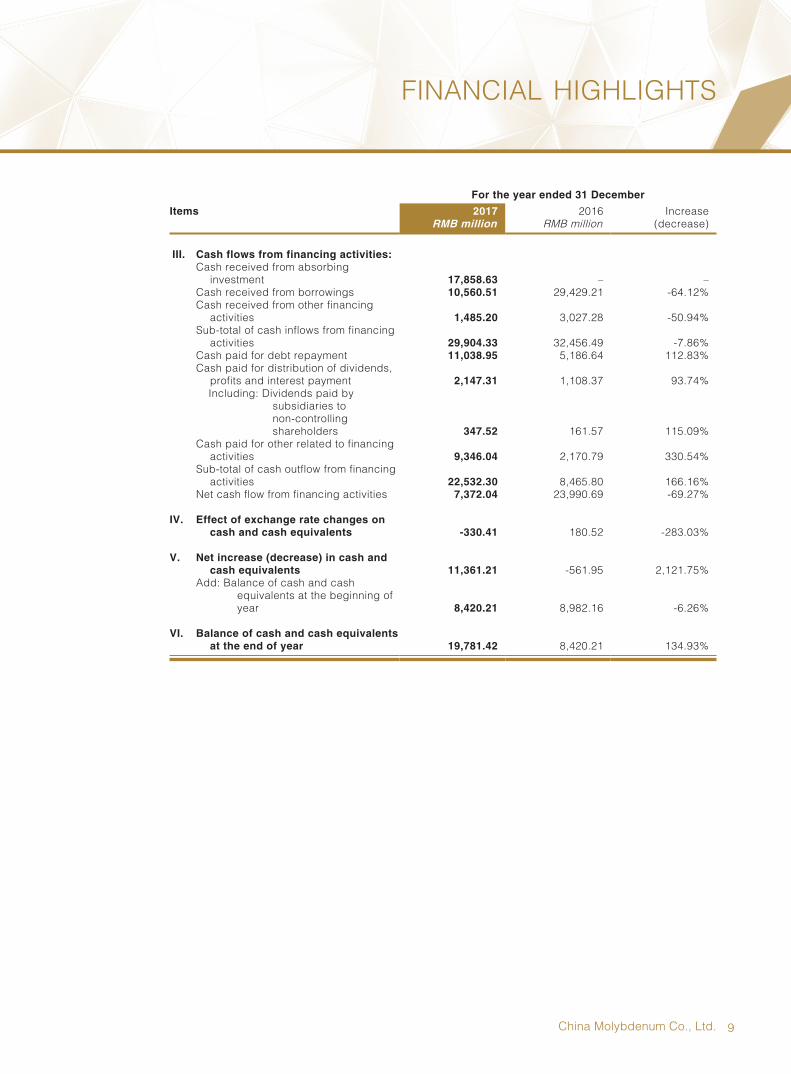
III. Cash flows from financing activities:Cash received from absorbing
investment 17,858.63 – –Cash received from borrowings 10,560.51 29,429.21 -64.12%Cash received from other financing
activities 1,485.20 3,027.28 -50.94%Sub-total of cash inflows from financing
activities 29,904.33 32,456.49 -7.86%Cash paid for debt repayment 11,038.95 5,186.64 112.83%Cash paid for distribution of dividends,
profits and interest payment 2,147.31 1,108.37 93.74%Including: Di vidends paid by
subsidiaries to non-controlling shareholders 347.52 161.57 115.09%
Cash paid for other related to financing activities 9,346.04 2,170.79 330.54%
Sub-total of cash outflow from financing activities 22,532.30 8,465.80 166.16%
Net cash flow from financing activities 7,372.04 23,990.69 -69.27%
IV. Effect of exchange rate changes on cash and cash equivalents -330.41 180.52 -283.03%
V. Net increase (decrease) in cash and cash equivalents 11,361.21 -561.95 2,121.75%
Add: Ba lance of cash and cash equivalents at the beginning of year 8,420.21 8,982.16 -6.26%
VI. Balance of cash and cash equivalents at the end of year 19,781.42 8,420.21 134.93%
10 2017 Annual Report
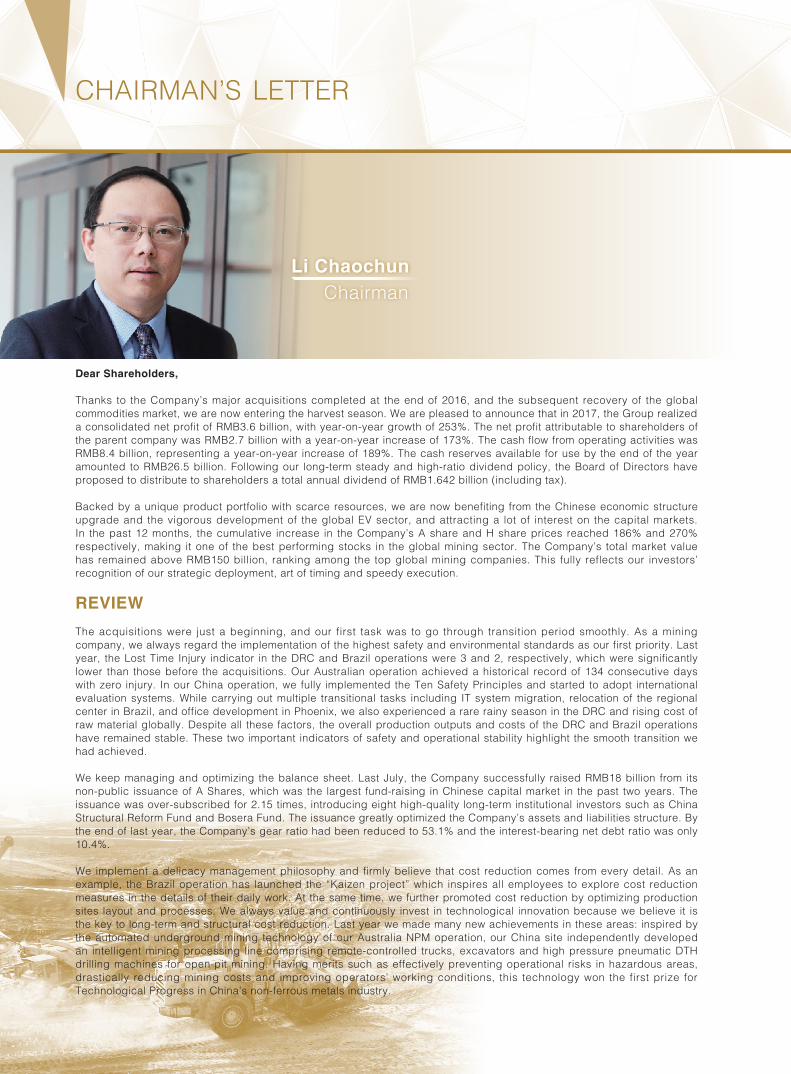
CHAIRMAN’S LETTER
Dear Shareholders,
Thanks to the Company’s major acquisitions completed at the end of 2016, and the subsequent recovery of the global commodities market, we are now entering the harvest season. We are pleased to announce that in 2017, the Group realized a consolidated net profit of RMB3.6 billion, with year-on-year growth of 253%. The net profit attributable to shareholders of the parent company was RMB2.7 billion with a year-on-year increase of 173%. The cash flow from operating activities was RMB8.4 billion, representing a year-on-year increase of 189%. The cash reserves available for use by the end of the year amounted to RMB26.5 billion. Following our long-term steady and high-ratio dividend policy, the Board of Directors have proposed to distribute to shareholders a total annual dividend of RMB1.642 billion (including tax).
Backed by a unique product portfolio with scarce resources, we are now benefiting from the Chinese economic structure upgrade and the vigorous development of the global EV sector, and attracting a lot of interest on the capital markets. In the past 12 months, the cumulative increase in the Company’s A share and H share prices reached 186% and 270% respectively, making it one of the best performing stocks in the global mining sector. The Company’s total market value has remained above RMB150 billion, ranking among the top global mining companies. This fully reflects our investors’ recognition of our strategic deployment, art of timing and speedy execution.
REVIEW
The acquisitions were just a beginning, and our first task was to go through transition period smoothly. As a mining company, we always regard the implementation of the highest safety and environmental standards as our first priority. Last year, the Lost Time Injury indicator in the DRC and Brazil operations were 3 and 2, respectively, which were significantly lower than those before the acquisitions. Our Australian operation achieved a historical record of 134 consecutive days with zero injury. In our China operation, we fully implemented the Ten Safety Principles and started to adopt international evaluation systems. While carrying out multiple transitional tasks including IT system migration, relocation of the regional center in Brazil, and office development in Phoenix, we also experienced a rare rainy season in the DRC and rising cost of raw material globally. Despite all these factors, the overall production outputs and costs of the DRC and Brazil operations have remained stable. These two important indicators of safety and operational stability highlight the smooth transition we had achieved.
We keep managing and optimizing the balance sheet. Last July, the Company successfully raised RMB18 billion from its non-public issuance of A Shares, which was the largest fund-raising in Chinese capital market in the past two years. The issuance was over-subscribed for 2.15 times, introducing eight high-quality long-term institutional investors such as China Structural Reform Fund and Bosera Fund. The issuance greatly optimized the Company’s assets and liabilities structure. By the end of last year, the Company’s gear ratio had been reduced to 53.1% and the interest-bearing net debt ratio was only 10.4%.
We implement a delicacy management philosophy and firmly believe that cost reduction comes from every detail. As an example, the Brazil operation has launched the “Kaizen project” which inspires all employees to explore cost reduction measures in the details of their daily work. At the same time, we further promoted cost reduction by optimizing production sites layout and processes. We always value and continuously invest in technological innovation because we believe it is the key to long-term and structural cost reduction. Last year we made many new achievements in these areas: inspired by the automated underground mining technology of our Australia NPM operation, our China site independently developed an intelligent mining processing line comprising remote-controlled trucks, excavators and high pressure pneumatic DTH drilling machines for open-pit mining. Having merits such as effectively preventing operational risks in hazardous areas, drastically reducing mining costs and improving operators’ working conditions, this technology won the first prize for Technological Progress in China’s non-ferrous metals industry.
Li ChaochunChairman

11China Molybdenum Co., Ltd.
CHAIRMAN’S LETTER
We further increase our profitability by improving product structure and quality. The APT project of our tungsten business is a Demonstration Base Project for Comprehensive Utilization of Resources supported by the Chinese Ministry of Land and Resources. With its production process being an innovation in China and internationally, this project created the fastest record for construction and ramping up in the tungsten hydrometallurgy industry. Its advantages include high recovery rate, low cost and efficient recycling. In particular, by achieving almost zero emissions of waste and used water, it solved the long-standing environmental problem in the tungsten industry. This project also significantly reduced production costs by recovering molybdenum and other by-products, and increased the sale price of our tungsten product. The ATP project has reached an internationally leading level and won the first prize for “innovation in universities – research institutions – industry cooperation” in China.
Last April, through an exclusive option we secured an additional 24% interest in TFM, our DRC mining operation, we increased our controlling interests in this world-class project to 80%. In addition, the Company participated in the establishment of the New China Capital Legend Natural Resources Fund, which signed at the end of last year an agreement to buy the world’s 3rd largest non-ferrous metals trading company. This transaction is expected to be closed in the first half of 2018.
OUTLOOK – MEETING GREATER CHALLENGES
In 2018, we achieved a smooth transition following these acquisitions, and our focus in 2018 will be on efficient integration. Our overseas operating assets of different kinds in Australia, South America and Africa, each formerly affiliated to a different major international mining company, have different languages and local environments; if we add to this the international office based in Phoenix, USA and the currently expanding Group headquarters in China, it is not an overstatement to say that integrating new teams from all corners of the globe, each with different culture and background, will represent one of the greatest challenges for our integration. But we all share something in common: we belong to the same CMOC big family. We will work hard to build unified, inclusive, and strong CMOC culture and values. We will prove to the market that CMOC is not only good at acquisitions, but is also a good operator. Efficient integration can bring additional value creation.
Mining is a traditional industry. Its products have homogeneous characteristics and its business logic is simple: be the best in the industry at maintaining a competitive cost advantage. Competitive cost advantage comes from two equally important aspects: resource and management. Quality resource is a gift from the nature but can also be obtained through successful exploration and acquisition. Excellent management, on the other side, depends on internal strength built through continuous efforts. Business management is an endless learning experience in which the East and the West have both their own strengths. Each company has a different style, and no model can be copied thoughtlessly. As an international company headquartered in China, we aim to promote Chinese values in the process of establishing corporate core values while at the same time maintaining a resolutely open and inclusive attitude.
Success belongs to the past. We will not be content with our current achievements and stop here. 2018 is the starting point of a new journey. We will keep on dreaming big, remain true to our original aspiration, act decisively and forge ahead.
SINCERE THANKS
I would like to express my earnest gratitude to shareholders, local governments and communities, customers and partners for their deep trust and long-term support. I also sincerely thank all Board members, domestic and international management teams, and all staff for their hard work and outstanding contribution to our Group's achievements.
Li ChaochunChairman
Beijing, the PRC29 March 2018

12 2017 Annual Report
MARKET REVIEW AND PROSPECTS
For the year ended 31 December 2017, the Company generated revenue mainly from the sales of copper, cobalt, molybdenum, tungsten, niobium, phosphates and other relevant products. The Company’s results are largely subject to the fluctuations in the prices of the above resources. At the same time, NPM of the Company has certain sales of gold as a by-product. Accordingly, the fluctuation of the prices in gold would also has an impact on results of the Company.
PRICES COMPARISON OF RELEVANT PRODUCTS OF THE COMPANY FOR THE YEAR OF 2017 AND THE CORRESPONDING PERIOD LAST YEAR
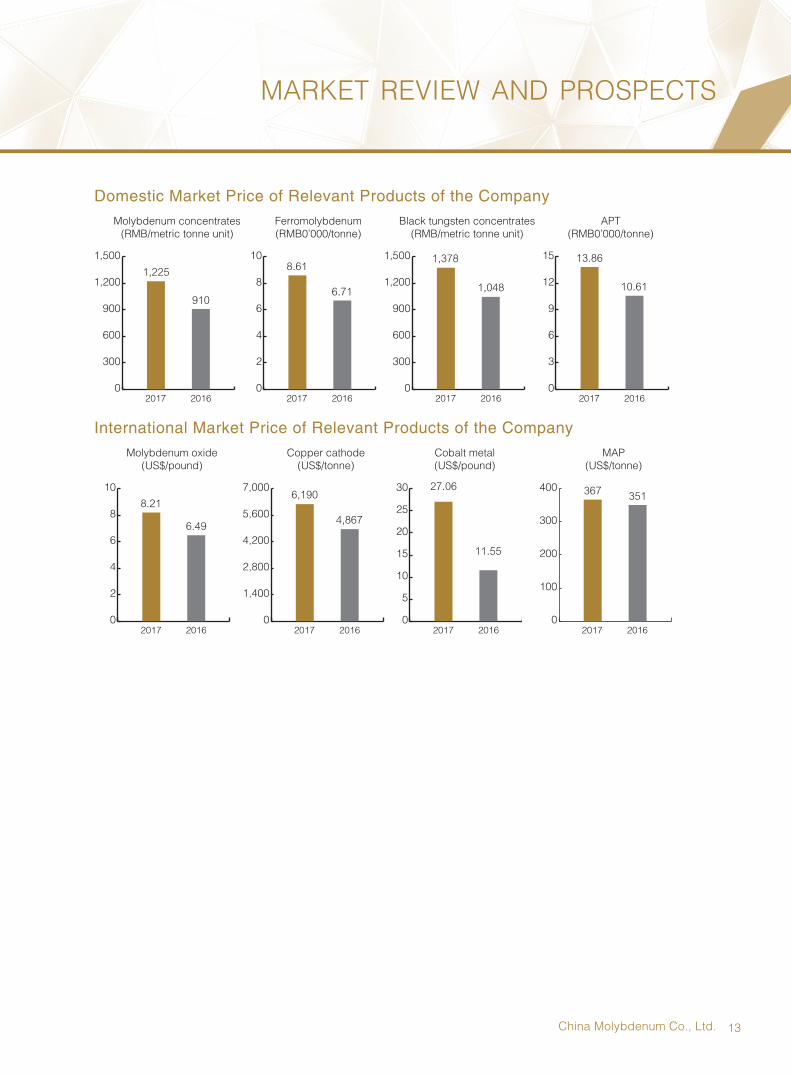
Domestic market price of the relevant products of the Company
Products 2017 2016
Increase/decrease on a
year-to-yearbasis
(%)
Molybdenum Molybdenum concentrates (RMB/metric tonne unit) 1,225 910 34.62
Ferromolybdenum (RMB0’000/tonne) 8.61 6.71 28.32Tungsten Black tungsten concentrates (RMB/metric
tonne unit) 1,378 1,048 31.49APT (RMB0’000/tonne) 13.86 10.61 30.63
Note: The prices of relevant products in the above table are extracted from relevant domestic websites.
International market price of the relevant products of the Company
Products 2017 2016
Increase/decrease on a
year-to-year basis
(%)
Molybdenum Molybdenum oxide (US$/pound) 8.21 6.49 26.50Copper Copper cathode (US$/tonne) 6,190 4,867 27.18Cobalt Cobalt metal (US$/pound) 27.06 11.55 134.29Phosphate MAP (US$/tonne) 367 351 4.56
Note: The prices of molybdenum oxide are extracted from the relevant international websites. The price of copper represented the average price quoted by the London Metal Exchange (“LME”). The prices of cobalt are extracted from the LME. The price of phosphate fertilizer represented the average price of MAP quoted by the CRU.
13China Molybdenum Co., Ltd.
MARKET REVIEW AND PROSPECTS
Domestic Market Price of Relevant Products of the Company
1,225
910
0
300
600
900
1,200
1,500
2017 2016
Molybdenum concentrates(RMB/metric tonne unit)
8.61
6.71
0
2
4
6
8
10
2017 2016
Ferromolybdenum(RMB0’000/tonne)
1,048
1,378
0
300
600
900
1,200
1,500
2017 2016
Black tungsten concentrates(RMB/metric tonne unit)
13.86
10.61
2017 2016
APT(RMB0’000/tonne)
0
3
6
9
12
15
International Market Price of Relevant Products of the Company
8.21
6.49
0
2
4
6
8
10
2017 2016
Molybdenum oxide(US$/pound)
6,190
4,867
0
1,400
2,800
4,200
5,600
7,000
2017 2016
Copper cathode(US$/tonne)
2017 2016
Cobalt metal(US$/pound)
11.55
27.06
0
5
10
15
20
25
30 367351
0
100
200
300
400
2017 2016
MAP(US$/tonne)

14 2017 Annual Report
MARKET REVIEW AND PROSPECTS
MARKET REVIEW ON EACH METAL SEGMENT IN 2017
(1) Molybdenum market
The major molybdenum product of the Company is ferromolybdenum, which is sold mainly in the domestic market. The macro economy witnessed stability and growth in the year of 2017. The steel sector has been affected by the supply-side reform and normalized environmental supervisions, output of stainless steel increases, and market players saw an improved business environment. In the raw material market, molybdenum supply and demand experienced periodic tensions, and the overseas molybdenum market also showed an upward trend. Both the internal and external factors stimulated the stages of rebound in the domestic molybdenum market. Without the support of demands, prices saw slight adjustments at the beginning of the first quarter, which was mainly attributable to the abundant stock of large-sized steel plants and the production halt of the small-and medium-sized plants. Later in the first quarter, the market saw rising actual demands with market speculation intentions, which boosted domestic raw material prices to new highs, and the price of ferromolybdenum recovered steadily. Early in the second quarter, the molybdenum raw material market stabilized at a high level, and the molybdenum market did not show any material changes due to the uncertainty about the impact of environmental policies in Northeast China. Output of molybdenum-bearing steel for steel companies decreased slightly later in the second quarter. Contracted demands against sufficient supply, and the accumulative stock led to price competition among market players, where the domestic molybdenum market saw corrections with a weak momentum. However, in the third quarter (an off-season for the molybdenum market), the molybdenum market saw unabated strong demand, recording stable trading volume of molybdenum concentrate and tight spot supply. Overall demands of steel plants grew amidst stability, while ferromolybdenum companies did not have sufficient stock. Therefore, the overall market trended upward with fluctuations. The molybdenum market continued to grow steadily in the fourth quarter, which was attributable to less capital and stock pressure of the mines, stable demands on the steel plants and the impact of environmental policies. Particularly, molybdenum prices in the domestic market saw positive development in December due to the tight supply in the molybdenum raw material market and the normal demands of downstream steel plants, plus their early stock preparation.
In 2017, the average price of molybdenum concentrate was RMB1,225/metric tonne unit, representing an increase of 34.62% as compared with the same period last year. The lowest price was RMB1,000/metric tonne unit, and the highest price was RMB1,500/metric tonne unit. The average price of ferromolybdenum was RMB86,100/tonne, representing an increase of 28.32% as compared with the same period last year. The lowest price was RMB71,000/tonne, and the highest price was RMB108,000/tonne.
The average MW price of molybdenum oxide in 2017 was US$8.21/pound of molybdenum, with a year-on-year increase of 26.5%. The lowest price was US$6.8/pound of molybdenum, and the highest price was US$10.5/pound of molybdenum.
(2) Tungsten market
Major tungsten products of the Company are tungsten concentrate and ammonium paratungstate (APT), which are sold mainly in the domestic market. In 2017, the domestic tungsten market staged rallies due to the little changes in the operation rate of the mines, derived from cost restrictions and environmental supervisions, the reluctance to sell out prevailing among large-sized companies, and the periodical tight supply in the raw material market. In the first quarter, large tungsten mining enterprises supply to purchase orders and long-term orders in the Chinese market, while small- and medium-sized tungsten mines maintained a low operation rate. Supply in the raw material market became tight, and stock of downstream companies stayed at a low level. Companies had to accept higher prices to maintain operation, and the tungsten market recovered moderately but steadily. Early in the second quarter, stricter environmental supervision led to further production halt in some tungsten companies, and the upstream raw material market saw a tight supply; the tungsten market remained strong because of the unabated demands from the downstream customers. Later in the quarter, which would be followed by the traditional off-season, buyers were bearish about future market development and demanded a lower price, which caused the overall tungsten market to trend downward. The third quarter was the traditional off-season for the tungsten market, during which, demands from end users saw little improvement; however, the tungsten market rebounded with the support from the low operation rate of mines and low output, which was due to environmental scrutiny and weather factors. There was a great stock consumption of low-cost tungsten concentrate. Demands from end users did not improve at the beginning of the fourth quarter, and had a limited consumption of raw materials supplied from the

15China Molybdenum Co., Ltd.
MARKET REVIEW AND PROSPECTS
upstream companies. As market players held a wait-and-see attitude, the tungsten market recorded a decline with fluctuations; however, later in the fourth quarter, the market recovered gradually due to a lower operation rate caused by weather factors, environmental supervision, inadequate supply of raw material and stronger reluctance to sell out.
In 2017, the average price of 65% of domestic black tungsten concentrates was RMB89,600/tonne, with a year-on-year increase of 31.49%. The lowest price was RMB72,000/tonne, and the highest price was RMB120,000/tonne. The average price of ammonium paratungstate (APT) was RMB138,600/tonne, with a year-on-year increase of 30.63%. The lowest price was RMB109,000/tonne, and the highest price was RMB185,000/tonne.
According to the data of Metal Bulletin (“MB”), the average price of APT in the European market in 2017 was US$242/metric tonne unit, representing a year-on-year increase of 26%. The lowest price was US$187/metric tonne unit, and the highest price was US$301/metric tonne unit.
(3) Copper market
The Company sells the majority of its copper as copper cathode, with a smaller amount sold as copper concentrates in the international markets. Copper prices maintained a mostly upward trend throughout 2017, increasing nearly 30% during the year. Much of the appreciation in the price of copper occurred during the second half of 2017 and was aided by better worldwide economic news and increasing investor demand. Price appreciation accelerated during December due to expectations of tighter supply-side fundamentals related to the many labor negotiations set to occur during 2018. The benchmark LME cash settlement price at the end of 2017 finished at US$7,207/tonne, about 30% higher than the beginning of the year. Stock levels on the combined LME, Comex and SSE saw periods of heavy inflows and outflows, ending with 6% lower at the end of 2017 as compared to the end of 2016. Annual copper concentrate benchmark processing and refining charges settled at US$92.50/tonne, while spot charges trended below benchmark for most of the year. There was little progress during December 2017 in the negotiations for 2018’s long-term TC/RC contracts. Under this condition, by early January 2018, the China Smelters Purchasing Team had agreed on 2018 benchmark processing and refining charges of US$82.25/tonne, a decrease of 12% from the perspective of copper producers.
(4) Cobalt market
The Company is the second largest producer of mined cobalt in the world. Cobalt products are hydrogenated cobalt and are sold in the international markets. At the beginning of 2017, the benchmark price of cobalt increased by approximately 145%, beginning the year at US$14.30/lb. and ending at US$35.00/lb. in December 2017 (based on the MB low grade price quotation). The higher cobalt price was primarily driven by strong demand from the battery segment, mostly owing to the automotive industry’s aggressive roadmap for electric vehicle production over the next several years. Higher cobalt prices were also fueled by other market participants not previously part of the cobalt market, including financial investors looking to capitalize on cobalt as an asset class.
(5) Niobium market
The Company is the world’s second largest producer of niobium. Niobium products are ferroniobium, mainly sold in the international market, with a small amount sold in China. The Company is a significant supplier to the global steel industry as the main end-use consumer (accounting for approximately 90% of total niobium consumption). Niobium demand is relatively less elastic compared to other commodities used in steel production, as niobium only accounts for a small proportion of the cost of steel production.
The overall world steel demand rose by 5.3% in 2017, significantly higher than that in recent years, and demand for niobium containing steels was strong, including applications in the automobile, building and construction sectors and a rebound in demand in oil and gas pipeline steels. During 2017, Brazilian ferroniobium exports were 27% higher than the previous year. This export growth was supported by strong demand in major end markets. China imports from Brazil grew by 36%, EU imports were up by 34% and imports into the United States were up by 11%. Moreover, ongoing recovery in the United States steel industry drove higher imports of ferroniobium, which rose by 11% during the year. Regarding prices, strong competition during the first half of the year kept pressure on prices that subsequently gave way to tighter supply conditions and better pricing during the second half of the year.

16 2017 Annual Report
MARKET REVIEW AND PROSPECTS
(6) Phosphates market in Brazil
The Company is the second largest supplier of phosphate fertilizer in Brazil, and the majority of its product in the Brazilian market is phosphate fertilizer. Brazil is one of the world’s main producers and exporters of agricultural products, including soybeans, corn, sugarcane, coffee, citrus, beef and chicken. With high demand for fertilizers, Brazil is the fourth largest fertilizer consumer in the world, with annual demand significantly exceeding its domestic production. Mono-ammonium phosphate (“MAP”) and single superphosphate (“SSP”) are the main high- and low-concentrated phosphate fertilizer products in the Brazilian market, respectively.
Brazilian fertilizer deliveries in 2017 were 1% higher than those in 2016, reaching approximately 34.5 million tonnes, mainly due to a favorable barter ratio (the cost of fertilizer relative to crop commodity prices) and an increased demand for phosphates (which exceeded 13 million tonnes). Increased demand particularly in the early of the year drove up prices in the first quarter. Although MAP CFR Brazil prices decreased through the second and third quarters, a price recovery was experienced toward the year-end with the price reaching US$405/tonne in December. The 2017 average MAP CFR was US$367/tonne.
MARKET PROSPECTS FOR MAJOR METAL SECTORS FOR 2018
1. Molybdenum market
Marking the first year to implement the policies of the 19th National People’s Congress of the Communist Party of China, the year 2018 will see better fundamental and favorable conditions for economic and social development. Employment and prices that are closely related to people’s life will remain stable. The quality and efficiency of development will continue to improve. The country’s economy will maintain stability and a strong momentum under the new normal. In view of the price hike, the molybdenum market is predicted to record a slight increase in supply in 2018; however, chances for significant increase will be slim, especially when ore grade of the large mines decreases and supply of high-quality raw materials might continue to be tight. Guided by the national environmental policies and the supply-side reform, steel plants will vigorously promote transformation and develop special high-quality steel in 2018, which will boost molybdenum demands. Therefore, the molybdenum demands in the domestic market are bound to further increase. In general, the molybdenum market will be better in the future because of the steady and positive economic development and the increasing demands stimulated by adjustments of product portfolios in the steel sector.
In the international market, the International Monetary Fund (IMF) projects that global GDP will grow by 3.7% in 2018, rallying by 0.1% as compared with last year. Driven by the European and American economies, the world economy will continue to recover, and emerging economies are expected to realize steady growth. As the steel sector will improve with the support of oil prices and other commodities, the molybdenum market is expected to see increasing demands. Although the production cut announced by Codelco in November 2017 will have a significant impact on molybdenum supply in the international market, the global molybdenum output will not change significantly given the planned production expansion of Collahuasi and Antamina.
2. Tungsten market
A number of agencies predict that China’s economy will maintain steady development in 2018, with GDP growing by 6.7% and economic growth entering into a stable range. It is expected that the tungsten market will record certain growth in demands of end users, as the country’s economy will blaze positive development and maintain stability, and sectors related to hard alloy, tungsten products and special steel will further improve. Affected by the tightening environmental policies in China, raw material prices will remain strong, and the tungsten market is expected to fare better.
17China Molybdenum Co., Ltd.
MARKET REVIEW AND PROSPECTS
3. Copper market
Global manufacturing continued to accelerate at the end of 2017. Rates of expansion in output and new orders strengthened to the highest levels since February 2011, leading to better job growth and business optimism. JPMorgan’s Global Manufacturing Index rose to the peak of the past seven years at 54.5 in December 2017 and has now signaled expansion in each of the past 22 months. The strong headline indicator suggests the global economy is firmly in place to maintain momentum in 2018. Subsequently, Wood Mackenzie estimates the health of the global economy is to drive a modest acceleration in copper consumption growth of 2% in 2018, and will expand to 2.2% in 2019. Future Chinese limitations on scrap could drive greater refined consumption within the country while supply disruptions related to 2018 labor negotiations in Peru and Chile could also provide further upside to prices during the year.
4. Cobalt market
Cobalt demand is expected to reach approximately 112,000 tonnes in 2018, delivering a small market surplus of 3,000 tonnes. The near-term tightness in the market and robust pricing reflects expectations of greater long-term future demand against the uncertainty of future supply. According to the CRU, demand is expected to grow at a compound annualized growth rate of 9% till 2023, largely driven by the battery segment and, to a lesser extent, cobalt alloys used in metallurgical applications. Regarding pricing, expectations of strong and steady sustained demand, including an increasing desire to trustworthy source cobalt, are anticipated to keep prices well supported.
5. Niobium market
According to the World Steel Association, global steel production is expected to increase by approximately 2% during 2018, as growth among developing economies, excluding China, is expected to lead the way. The World Steel Association forecasts that steel production in emerging and developing economies could rise to nearly 5% while more developed markets will experience flat to lower growth. China’s steel production increased at a strong pace of 5.7% during 2017; however, slower economic growth and tighter environmental regulations are forecasted to keep steel production flat in 2018. Elsewhere, steel output in North America and the EU was above average during 2017, each increasing by approximately 4% from 2016 and it is forecasted that steel output in the EU and the United States will grow by 1.4% and 1.1%, respectively, in 2018. Of the market sectors which are the main consumers of ferroniobium, growth in the automobile sector is expected to continue to slow in 2018; however, demand for niobium should grow in-step with a recovery in the construction sector and the oil and gas markets.
6. Phosphate market in Brazil
Global phosphates demand was healthy in 2017 mainly driven by a combination of seasonal effects, higher Chinese/Asian demand in the first and fourth quarter of 2017, additional demand in Latin America in the first quarter, and supply-related issues, such as loading issues and lower operating costs in the main producer facilities located in Morocco and the United States, respectively. In terms of pricing, MAP prices reacted positively from the last week of September following the international sulphur prices spike, and were also as a result of closure of a 1.6M tonne phosphates capacity facility at a major player in the United States.
Benchmark MAP CFR Brazil is expected to remain strong at around US$400/tonne level in the first quarter of 2018, although the international markets may experience downward price pressure during the off-season with additional phosphate capacity/supply from Saudi Arabia and Morocco coming on-stream in the second quarter of 2018. Overall, for 2018, favorable barter ratio levels and lower credit constraints will likely foster strong fertilizer demands similar to that of 2017.
In terms of the 2018 market outlook in Brazil, favorable farmer profitability and lower credit constraints are expected to cultivate strong fertilizer demands comparable to that of 2017, despite impacts of a possible reduction of the planted area of safrinha (second corn crop) on the demand of fertilizers (due to the lower prices of corn in 2016/2017 and the delay in the planting of the soybean crop). In contrast, the good performance of other crops such as cotton, coffee and oranges should counterbalance such effects.
18 2017 Annual Report
BUSINESS REVIEW AND PROSPECTS
2017 BUSINESS REVIEW ON ALL METAL SECTORS
1. Molybdenum sector
For the year ended 31 December 2017, the Company realized a production volume of molybdenum of 16,717 tonnes, and the production cost in unit cash of RMB54,638/tonne.
2. Tungsten sector
For the year ended 31 December 2017, the Company realized a production volume of tungsten of 11,744 tonnes (excluding Yulu Mining), and the production cost in unit cash of RMB17,896/tonne.
3. Copper and cobalt sector
For the year ended 31 December 2017, where calculated based on 80% of equity interests, NPM realized a production volume of available-for-sale copper metal of 34,913 tonnes, and a C1 cash cost of US$0.92 per pound, and it realized a production volume of 28,198 ounces for gold available for sale.
For the year ended 31 December 2017, TFM Copper and Cobalt Mine realized a production volume of 213,843 tonnes of copper metal and a C1 cash cost of US$0.15 per pound, and it realized a production volume of 16,419 tonnes of cobalt.
4. Niobium and phosphate sector
For the year ended 31 December 2017, production of phosphate fertilizers in Brazil (high-analysis fertilizer + low-analysis fertilizer) reached 1,152,554 tonnes; where output of niobium metal was 8,674 tonnes.
2017 OPERATION REVIEW
As the world economy showed continuous recovery in 2017, prices of commodities, led by copper, climbed steadily. The cobalt price jumped because of the explosive growth of the new energy vehicle sector, and China’s supply-side reform stimulated the stable growth of stainless steel output, which led to increasing demands for molybdenum. Under such a backdrop, relevant business sectors of the Company maintained and sustained positive development.
1. Exclusive option to acquire minority interests in the copper and cobalt business in the DRC, entrenching the results of overseas mergers and acquisitions and enhancing control over the project
On 20 January 2017, the Company and BHR entered into the “Cooperation Framework Agreement between China Molybdenum Co., Ltd. and BHR Newwood Investment Management Limited on the Investment Cooperation Regarding Tenke Fungurume Mining Area”, pursuant to which BHR exclusively and irrevocably granted the Company the exclusive option to buy a 24% minority interest in TFM. BHR’s acquisition of the minority interest in TFM was completed on 20 April. Given that the Company completed the acquisition of and indirectly held a 56% interest in TFM, by obtaining the exclusive right to buy the further 24% minority interest in TFM through the Cooperation Framework Agreement, the Company actually holds 80% of interests in TFM, the DRC, which consolidated its position and control over the project, and further boosted its profitability and risk-resisting capability.
19China Molybdenum Co., Ltd.
BUSINESS REVIEW AND PROSPECTS
2. Completion of the non-public issuance of A shares which effectively optimised the capital structure and solidified the strength of the Company
Work related to the non-public issuance of A shares raising RMB18 billion was successfully completed on 24 July 2017, with 2.15 times over-subscription. Subscribers included large state-owned investment institutions, strategic investment corporations and large mutual funds. The success of non-public issuance of A shares refined the capital structure and equity structure of the Company and further solidified its strength, laying a solid foundation for its acquisition of quality international assets in the future. The A shares of the Company is a constituent index of the SSE 50 Index and the CSI 300 Index, and one of the first 222 A Shares included in the MSCI Index.
3. Part ic ipat ion in the establ ishment of resource investment fund and engagement in a global leading metal trader
In November 2017, CMOC Limited (a wholly-owned subsidiary of the Company in Hong Kong), as a general partner, participated in the establishment of the NCCL Natural Resources Investment Fund (the “Fund”) with a scale of US$1 billion. CMOC Limited made a capital contribution of no more than US$450 million and shall be liable to the extent of its capital contribution. The first installment of the Fund was US$500.10 million, among which, the Company subscribed for US$225.00 million. In December 2017, the Fund entered into The Sale and Purchase Agreement with Louis Dreyfus Company B.V. (“LDC”). It was agreed that the Fund shall acquire 100% of the equity interests of Louis Dreyfus Company Metals B.V., which is dedicated to the trading of base and precious metals raw materials.
4. Stable operation and improved management in international assets
Upon the successful completion of two major overseas mergers and acquisitions projects in 2016, the Company has been committed to creating a better and sound governance and control system, integrating management and fostering a strong pool of talent. At present, the management and control platform for overseas businesses is in place, and the management structure has been further improved. While acquired international businesses are transitioning and operating smoothly, the Company is also committed to operational improvements: improving operation efficiency in Brazil business, adopting measures to reduce costs, enhancing production and operation stability and re-negotiating supply chain contracts, streamlining procedures of support functions to reduce costs, and conducting research on leaching from low-grade resources and development of sulphide resources for copper and cobalt business in the DRC.
5. Tighter cost control and higher standards for production and technical indicators, resulting in remarkable achievement of the comprehensive resources recovery project and further reinforcing competitive advantage in cost structure
For the year ended 31 December 2017, in order to consolidate and enhance its competitive advantage in cost structure, the Company implemented a series of measures to refine the management. As a result, the recovery rate of molybdenum and tungsten ore processing was taken to a higher level, and the centralized procurement rate increased by 8.38 percentage points over that at the end of last year. The Company also realized a sharp decline in consumption of ore dressing agents, spare parts and energy as compared with the same period last year, by efficiently mobilizing energy and equipment management companies. In order to resolve the increasing costs caused by lower ore grade, NPM has completed research on new pits and a feasibility study on renovation plans.
For the year ended 31 December 2017, in terms of domestic business, 4,619 tonnes (with copper content of 20%) of copper concentrate by-product were recycled, increasing a revenue of RMB25.66 million; 208 kilograms of rhenium by-product were recovered, increasing a revenue of RMB0.78 million; 578 tonnes of ammonium molybdate were recovered from secondary treatment, increasing a revenue of RMB35.95 million. The recovery system for by-products of fluorspar is under construction, and iron recovery is in the trial stage for an enlarged recovery on industrial scale.

20 2017 Annual Report
BUSINESS REVIEW AND PROSPECTS
6. Strict requirements and implementation in full force to ensure safety and environmental protection
To achieve production safety with zero injury and environmental protection with zero accident, the Company never stopped in maintaining high standards of safety and environmental protection, creating a favorable environment for the production and operation. The Company continued to implement the “Ten Principal Standards for Safety” and “Danger Source Identification, Prevention and Control”, intensifying safety trainings and enhancing safety inspection and risk rectification. In terms of environmental protection, the Company acted proactively by ramping up investment in environmental protection and ensuring the normal operation of environmental protection equipment and facilities, to guarantee environmental compliance and clear obstacles to production and operation. The Company also introduced and improved the system of environmental accountability and facilitated the establishment of an environmental management system. During 2017, the domestic operations realized “zero death” and “zero pollution” in production safety and environmental protection, and the Company was the only non-coal company in Luoyang that was recognized as a “Model for Production Safety” by the People’s Government of Henan Province.
7. Enhanced Communist Party building and anti-corruption work that facilitated production and operation
To improve solidarity, cohesion and policy execution, the Company pressed ahead with the development of its corporate culture, and encouraged mutual exchange and learning among each unit, therefore facilitating production and operation. The Company promoted the publicity of Party rules and discipline, established an active monitoring mechanism, and maintained strict standards to combat corruption.
BUSINESS PROSPECTS FOR 2018
Based on future economic and market dynamics, we set the following budgeted targets:
1. Molybdenum sector
The budgeted production volume of molybdenum is 13,500 tonnes to 14,900 tonnes, and the production cost in unit cash will be RMB60,000/tonne to RMB66,300/tonne.
2. Tungsten sector
The budgeted production volume of tungsten is 11,000 tonnes to 12,000 tonnes (excluding Yulu Mining), and the production cost in unit cash will be RMB21,500/tonne to RMB23,700/tonne.
3. Copper and cobalt sector
Where calculated based on 80% of equity interests, the budgeted production volume of available-for-sale copper metal of NPM is 30,000 tonnes to 32,000 tonnes with a C1 cash cost at US$1.07 to US$1.19 per pound, and it expects a production volume of 26,400 ounces to 28,000 ounces of gold available for sale.
The budgeted production volume of copper from TFM Copper and Cobalt Mine is 190,000 tonnes to 205,000 tonnes with C1 cash cost at US$-0.44 to US$-0.4 per pound, and it will realize a production volume of 16,000 tonnes to 17,500 tonnes of cobalt metal.
4. Niobium and phosphate sector
The production volume and costs of niobium and phosphate remained stable.
The above production plans do not constitute substantive commitments to investors and investors should pay attention to investment risks.
21China Molybdenum Co., Ltd.
MANAGEMENT DISCUSSION AND ANALYSIS
OVERVIEW
For the year ended 31 December 2017, the net profit of the Group increased from RMB1,019.24 million for the year ended 31 December 2016 to RMB3,595.62 million, representing an increase of RMB2,576.38 million or 252.77%, in which the net profit attributable to the owners of the parent company of the Group for the year ended 31 December 2017 was RMB2,727.80 million, representing an increase of RMB1,729.76 million or 173.32% from RMB998.04 million for the year ended 31 December 2016. The increase in profit of the Group was mainly attributable to the inclusion of newly-added copper and cobalt business in the DRC and niobium and phosphates businesses in Brazil as compared with that of last year as a result of completion of overseas mergers and acquisitions by the Group in the fourth quarter of 2016, as well as the increase in sales prices of molybdenum, tungsten, copper and cobalt as compared with that of last year.
OPERATING RESULTS
The revenue and gross profit of the Group increased due to the completion of the mergers and acquisitions of copper and cobalt business in the DRC and niobium and phosphates businesses in Brazil during the fourth quarter of 2016, representing a year-on-year increase as compared to the consolidated reporting period, as well as the increase in sales prices of molybdenum, tungsten, copper and cobalt. In 2017, the principal business income of the Group amounted to RMB23,968.55 million, representing a year-on-year increase of RMB17,171.26 million. For the year ended 31 December 2017, the gross profit of the Group amounted to RMB8,905.47 million, representing a year-on-year increase of RMB6,612.47 million.
The table below sets out the principal business income, cost, gross profit and gross profit margin of our products in 2017 and 2016:
PRINCIPAL BUSINESSES BY INDUSTRY, PRODUCT AND REGION
Unit: RMB million
Principal businesses by industry
By industryOperating
revenueOperating
costGross profit
Margin
Increase ordecrease in
operatingrevenue as
compared tolast year
Increase ordecrease in
operatingcost as
compared tolast year
Increase ordecrease ingross profit
margin ascompared to
last year (%) (%) (%) (%)
Non-ferrous metal mining 23,968.55 15,063.08 37.15 252.62 234.42 Increased by3.42 percentage
points
Principal businesses by product
By productOperating
revenueOperating
costGross profit
Margin
Increase ordecrease in
operatingrevenue as
compared tolast year
Increase ordecrease in
operatingcost as
compared tolast year
Increase ordecrease ingross profit
margin ascompared to
last year(%) (%) (%) (%)
Molybdenum and tungsten-related products
3,772.29 1,819.36 51.77 33.98 20.36 Increased by5.45 percentage
pointsCopper and gold-related
products1,663.82 1,145.76 31.14 20.46 13.03 Increased by
4.53 percentagepoints
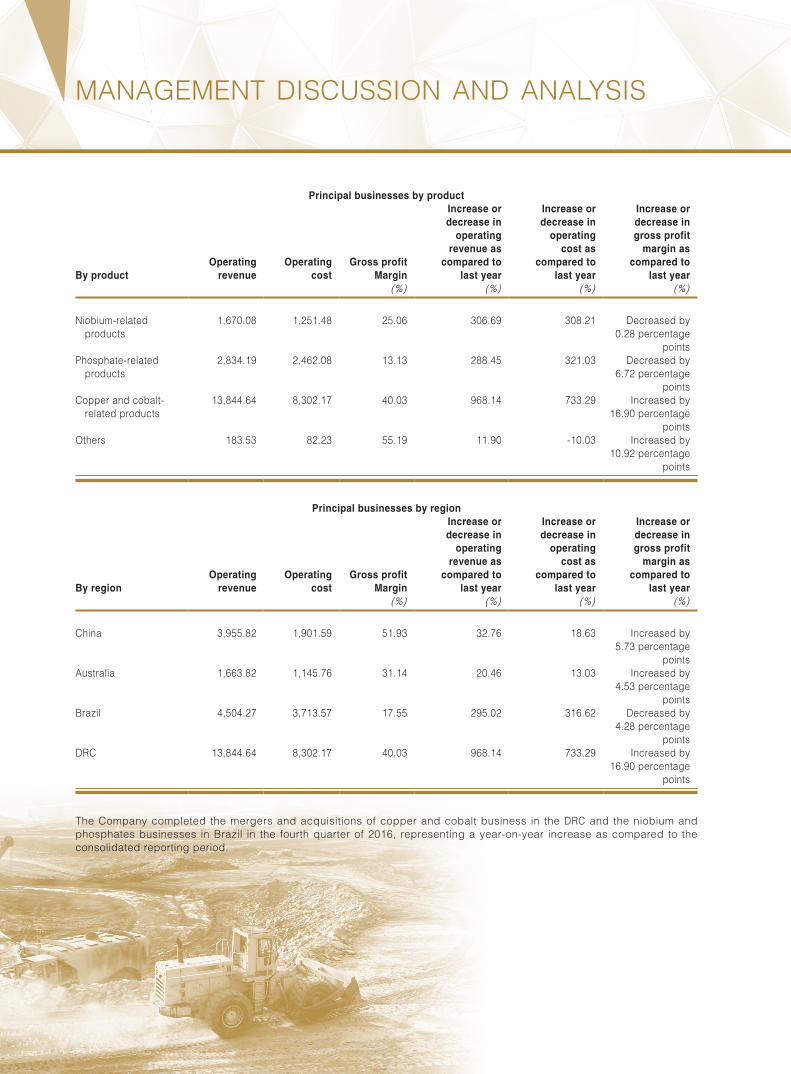
22 2017 Annual Report
MANAGEMENT DISCUSSION AND ANALYSIS
Principal businesses by product
By productOperating
revenueOperating
costGross profit
Margin
Increase ordecrease in
operatingrevenue as
compared tolast year
Increase ordecrease in
operatingcost as
compared tolast year
Increase ordecrease ingross profit
margin ascompared to
last year(%) (%) (%) (%)
Niobium-related products
1,670.08 1,251.48 25.06 306.69 308.21 Decreased by0.28 percentage
pointsPhosphate-related
products2,834.19 2,462.08 13.13 288.45 321.03 Decreased by
6.72 percentagepoints
Copper and cobalt-related products
13,844.64 8,302.17 40.03 968.14 733.29 Increased by16.90 percentage
pointsOthers 183.53 82.23 55.19 11.90 -10.03 Increased by
10.92 percentagepoints
Principal businesses by region
By regionOperating
revenueOperating
costGross profit
Margin
Increase ordecrease in
operatingrevenue as
compared tolast year
Increase ordecrease in
operatingcost as
compared tolast year
Increase ordecrease ingross profit
margin ascompared to
last year(%) (%) (%) (%)
China 3,955.82 1,901.59 51.93 32.76 18.63 Increased by5.73 percentage
pointsAustralia 1,663.82 1,145.76 31.14 20.46 13.03 Increased by
4.53 percentagepoints
Brazil 4,504.27 3,713.57 17.55 295.02 316.62 Decreased by4.28 percentage
pointsDRC 13,844.64 8,302.17 40.03 968.14 733.29 Increased by
16.90 percentagepoints
The Company completed the mergers and acquisitions of copper and cobalt business in the DRC and the niobium and phosphates businesses in Brazil in the fourth quarter of 2016, representing a year-on-year increase as compared to the consolidated reporting period.
23China Molybdenum Co., Ltd.
MANAGEMENT DISCUSSION AND ANALYSIS
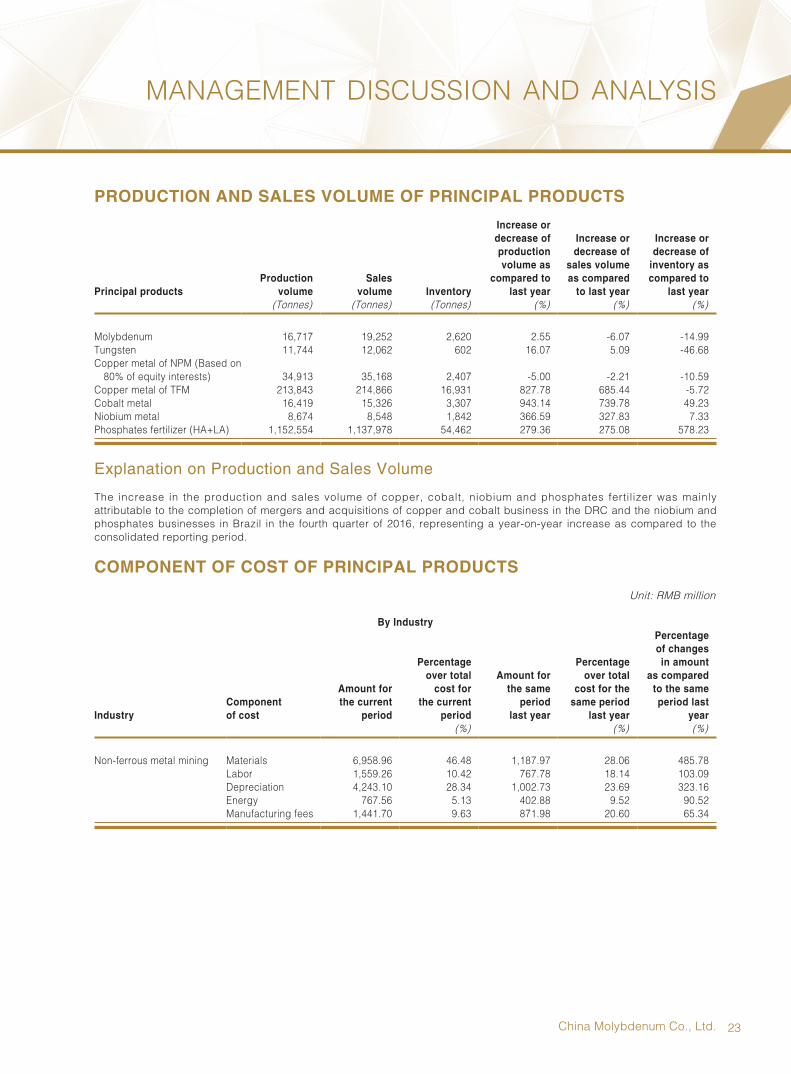
PRODUCTION AND SALES VOLUME OF PRINCIPAL PRODUCTS
Principal productsProduction
volume Sales
volume Inventory
Increase ordecrease ofproductionvolume as
compared tolast year
Increase ordecrease of
sales volumeas compared
to last year
Increase ordecrease of
inventory ascompared to
last year(Tonnes) (Tonnes) (Tonnes) (%) (%) (%)
Molybdenum 16,717 19,252 2,620 2.55 -6.07 -14.99Tungsten 11,744 12,062 602 16.07 5.09 -46.68Copper metal of NPM (Based on
80% of equity interests) 34,913 35,168 2,407 -5.00 -2.21 -10.59Copper metal of TFM 213,843 214,866 16,931 827.78 685.44 -5.72Cobalt metal 16,419 15,326 3,307 943.14 739.78 49.23Niobium metal 8,674 8,548 1,842 366.59 327.83 7.33Phosphates fertilizer (HA+LA) 1,152,554 1,137,978 54,462 279.36 275.08 578.23
Explanation on Production and Sales Volume
The increase in the production and sales volume of copper, cobalt, niobium and phosphates fertilizer was mainly attributable to the completion of mergers and acquisitions of copper and cobalt business in the DRC and the niobium and phosphates businesses in Brazil in the fourth quarter of 2016, representing a year-on-year increase as compared to the consolidated reporting period.
COMPONENT OF COST OF PRINCIPAL PRODUCTS
Unit: RMB million
By Industry
IndustryComponentof cost
Amount forthe current
period
Percentageover total
cost forthe current
period
Amount forthe same
periodlast year
Percentageover total
cost for thesame period
last year
Percentageof changesin amount
as comparedto the sameperiod last
year(%) (%) (%)
Non-ferrous metal mining Materials 6,958.96 46.48 1,187.97 28.06 485.78Labor 1,559.26 10.42 767.78 18.14 103.09Depreciation 4,243.10 28.34 1,002.73 23.69 323.16Energy 767.56 5.13 402.88 9.52 90.52Manufacturing fees 1,441.70 9.63 871.98 20.60 65.34

24 2017 Annual Report
MANAGEMENT DISCUSSION AND ANALYSIS
By Product
By productComponentof cost
Amount forthe current
period
Percentageover total
cost forthe current
period
Amount forthe same
periodlast year
Percentageover total
cost for thesame period
last year
Percentageof changesin amount
as comparedto the sameperiod last
year(%) (%) (%)
Molybdenum and tungsten-related products
Materials 614.38 36.17 403.32 29.70 52.33Labor 300.90 17.72 237.42 17.48 26.73Depreciation 159.34 9.38 152.91 11.26 4.21Energy 240.32 14.15 222.31 16.37 8.10Manufacturing fees 383.60 22.58 341.95 25.18 12.18
Copper and gold-related products
Materials 210.53 18.14 192.73 19.05 9.24Labor 177.82 15.32 193.11 19.09 -7.92Depreciation 516.40 44.50 489.82 48.42 5.43Energy 84.96 7.32 84.45 8.35 0.60Manufacturing fees 170.81 14.72 51.56 5.10 231.27
Niobium-related products Materials 623.44 47.92 57.18 19.80 990.28Labor 167.76 12.89 43.12 14.93 289.08Depreciation 294.64 22.65 73.11 25.31 303.04Energy 59.51 4.57 14.22 4.92 318.43Manufacturing fees 155.65 11.96 101.19 35.04 53.81
Phosphates-related products
Materials 1,596.90 61.78 277.55 50.94 475.35Labor 305.58 11.82 97.37 17.87 213.83Depreciation 342.14 13.24 33.80 6.20 912.31Energy 148.26 5.74 35.16 6.45 321.64Manufacturing fees 191.87 7.42 101.01 18.54 89.96
Copper and cobalt-related products
Materials 3,913.72 47.58 257.20 24.97 1,421.69Labor 607.21 7.38 196.76 19.10 208.61Depreciation 2,930.59 35.63 253.10 24.57 1,057.88Energy 234.52 2.85 46.74 4.54 401.78Manufacturing fees 539.77 6.56 276.27 26.82 95.38
Overseas mergers and acquisitions were completed in the fourth quarter of 2016, representing a year-on-year increase as compared with the consolidated reporting period. The figures for the same period of last year were not comparable.
SELLING EXPENSES
For the year ended 31 December 2017, the selling expenses of the Group amounted to RMB214.84 million, representing an increase of RMB124.22 million or 137.08% from RMB90.62 million for the same period in 2016. It was mainly due to the expansion of sales scale arising from the increase in the newly-added business of the Group, resulting in an increase in selling expenses.
25China Molybdenum Co., Ltd.
MANAGEMENT DISCUSSION AND ANALYSIS
ADMINISTRATIVE EXPENSES
For the year ended 31 December 2017, the administrative expenses of the Group amounted to RMB1,159.09 million, representing an increase of RMB444.36 million or 62.17% from RMB714.73 million for the same period in 2016. It was mainly due to the increase of administrative expenses as a result of the scale expansion of the Group’s overseas business.
FINANCE EXPENSES
For the year ended 31 December 2017, the finance expenses of the Group amounted to RMB1,416.97 million, representing an increase of RMB1,009.30 million or 247.58% from RMB407.67 million for the same period in 2016, mainly due to the increase in interest expenses and exchange gains and losses of the Group for the period.
INCOME TAX EXPENSES
For the year ended 31 December 2017, the income tax expenses of the Group amounted to RMB1,786.20 million, representing an increase of RMB1,615.30 million or 945.17% from RMB170.90 million for the same period of 2016. Such increase was mainly attributable to the increase of the total profit of the Group for the period.
NET PROFIT ATTRIBUTABLE TO OWNERS OF THE PARENT COMPANY
For the year ended 31 December 2017, the net profit of the Group attributable to owners of the parent company increased by RMB1,729.76 million or 173.32% from RMB998.04 million for the year ended 31 December 2016 to RMB2,727.80 million for the year ended 31 December 2017. Such increase was mainly attributable to the inclusion of newly-added copper and cobalt business in the DRC and niobium and phosphates businesses in Brazil as compared with that of last year as a result of completion of overseas mergers and acquisitions by the Group in the fourth quarter of 2016, as well as the increase in sales prices of molybdenum, tungsten, copper and cobalt as compared with that of last year.
FINANCIAL POSITION
As at 31 December 2017, the total assets of the Group amounted to RMB97,837.25 million, comprising non-current assets of RMB58,788.45 million and current assets of RMB39,048.80 million. Equity attributable to shareholders of the parent company as at 31 December 2017 increased by RMB19,419.12 million or 103.63% to RMB38,157.18 million from RMB18,738.06 million as at 31 December 2016. Such increase was mainly due to the increase in shareholders’ equity after the completion of private placement of A Shares in July 2017.
CURRENT ASSETS
As at 31 December 2017, the current assets of the Group increased by RMB19,245.84 million or 97.19% to RMB39,048.80 million from RMB19,802.96 million as at 31 December 2016. Such increase in the current assets was mainly attributable to the increase in the net cash flow from operating activities and increase in capital fund for the period.
NON-CURRENT ASSETS
As at 31 December 2017, the non-current assets of the Group decreased by RMB9,332.95 mill ion or 13.70% to RMB58,788.45 million from RMB68,121.40 million as at 31 December 2016. Such decrease in the non-current assets was mainly because the time-deposit, wealth management products and structured deposits with a term of more than one year expired in 2017.

26 2017 Annual Report
MANAGEMENT DISCUSSION AND ANALYSIS
SCOPE OF RESTRICTED ASSETS
As at 31 December 2017, among other bank and cash balance, the structured bank deposits amounted to RMB4,700.00 million (opening balance for the year: RMB400.00 million), the bank acceptance bond deposits amounted to RMB300.00 million (opening balance for the year: RMB450.00 million), the loan guarantee deposits amounted to RMB1,701.42 million (opening balance for the year: RMB630.00 million), the special security deposits for the mine environment restoration and rehabilitation amounted to RMB24.42 million (opening balance for the year: RMB20.02 million), and other deposits amounted to RMB1.50 million (opening balance for the year: RMB50.00 million). The above structured deposits cannot be withdrawn in advance during the deposit period.
Save for the above, the Group has no other asset collateral or pledge.
ENTRUSTED WEALTH MANAGEMENT
Unit: RMB million
Entrustee Types Amount Start date Expiry dateCapital sources
Capital investment
Paymentmethods ofremuneration
Annualized rate of return
Expected return
(if any)
Actual gain
or lossActual
recovery
statutory procedure or not
Entrusted wealth
management plan or not
in the future
Provision amount of
devaluation reserve (if any)
Shenwan Hongyuan Asset management plan
200.00 2014/6/5 2018/6/5 Funds in hand
Standardised credit assets
Floating revenue 6.50% 33.26 Yes 0
Ping An Huitong Asset management plan
350.00 2015/5/18 2018/5/18 Funds in hand
Standardised credit assets
Floating revenue 5.84% 53.82 Yes 0
Ping An Huitong Asset management plan
250.00 2015/7/29 2018/7/29 Funds in hand
Standardised credit assets
Floating revenue 5.24% 31.88 Yes 0
NEW CHINA CAPITAL MANAGEMENT
Asset management plan
1,763.47 2017/9/8 2019/9/7 Funds in hand
Portfolio investment
Payment in due course
– – Yes 0
Luoyang branch of China CITIC Bank
Principal guaranteed structured deposits
300.00 2015/4/10 2018/4/10 Funds in hand
Wealth management funds from banks
Floating revenue 5.15% 38.69 Yes 0
Luoyang branch of China Minsheng Bank
Principal guaranteed structured deposits
400.00 2017/3/22 2018/3/22 Funds in hand
Wealth management funds from banks
Floating revenue 3.60% – Yes 0
Tianshan sub-branch of China Merchants Bank
Principal guaranteed structured deposits
1,500.00 2017/7/27 2018/1/29 Funds in hand
Wealth management funds from banks
Floating revenue 3.90% – Yes 0
Business department of Henan branch of Bank of China
Principal guaranteed structured deposits
2,000.00 2017/7/28 2018/1/29 Funds in hand
Wealth management funds from banks
Floating revenue 3.81% – Yes 0
Luanchuan sub-branch of Bank of China
Principal guaranteed structured deposits
2,500.00 2017/7/28 2018/1/29 Funds in hand
Wealth management funds from banks
Floating revenue 3.81% – Yes 0
Shanghai branch of China Development Bank
Principal guaranteed structured deposits
300.00 2017/8/4 2018/2/5 Funds in hand
Wealth management funds from banks
Floating revenue 4.00% – Yes 0
Luoyang branch of China Minsheng Bank
Principal guaranteed structured deposits
500.00 2017/10/27 2018/1/26 Funds in hand
Wealth management funds from banks
Floating revenue 4.30% – Yes 0
Luoyang branch of China CITIC Bank
Principal guaranteed structured deposits
800.00 2017/10/27 2018/1/26 Funds in hand
Wealth management funds from banks
Floating revenue 4.55% – Yes 0

27China Molybdenum Co., Ltd.
MANAGEMENT DISCUSSION AND ANALYSIS
Entrustee Types Amount Start date Expiry dateCapital sources
Capital investment
Paymentmethods ofremuneration
Annualized rate of return
Expected return
(if any)
Actual gain
or lossActual
recovery
statutory procedure or not
Entrusted wealth
management plan or not
in the future
Provision amount of
devaluation reserve (if any)
Luoyang branch of Ping An Bank
Principal guaranteed structured deposits
2,000.00 2017/10/30 2018/5/2 Funds in hand
Wealth management funds from banks
Floating revenue 4.35% – Yes 0
Luoyang branch of Industrial Bank
Principal guaranteed structured deposits
100.00 2017/10/30 2018/2/1 Funds in hand
Wealth management funds from banks
Floating revenue 4.37% – Yes 0
Huangpu sub-branch of Ping An Bank
Principal guaranteed structured deposits
300.00 2017/11/1 2018/2/1 Funds in hand
Wealth management funds from banks
Floating revenue 4.20% – Yes 0
Luoyang branch of Zhongyuan Bank
Principal guaranteed structured deposits
100.00 2017/11/2 2018/2/1 Funds in hand
Wealth management funds from banks
Floating revenue 4.30% – Yes 0
Luoyang branch of China CITIC Bank
Principal guaranteed structured deposits
700.00 2017/11/1 2018/1/30 Funds in hand
Wealth management funds from banks
Floating revenue 4.55% – Yes 0
Luoyang branch of Industrial Bank
Principal guaranteed structured deposits
100.00 2017/12/18 2018/12/18 Funds in hand
Wealth management funds from banks
Floating revenue 4.79% – Yes 0
Zhengzhou branch of Hengfeng Bank
Principal guaranteed structured deposits
400.00 2017/12/13 2018/12/13 Funds in hand
Wealth management funds from banks
Floating revenue 4.73% – Yes 0
Xiamen International Bank Principal guaranteed structured deposits
200.00 2017/12/20 2018/12/20 Funds in hand
Wealth management funds from banks
Floating revenue 4.90% – Yes 0
Luoyang branch of Bank of Communications
Principal guaranteed structured deposits
100.00 2017/12/22 2018/12/21 Funds in hand
Wealth management funds from banks
Floating revenue 4.65% – Yes 0
Luoyang branch of Ping An Bank
Principal guaranteed structured deposits
1,500.00 2017/12/21 2018/6/21 Funds in hand
Wealth management funds from banks
Floating revenue 4.65% – Yes 0
Suzhou branch of CGB Principal guaranteed structured deposits
100.00 2017/12/22 2018/3/22 Funds in hand
Wealth management funds from banks
Floating revenue 4.60% – Yes 0
Xiamen International Bank Principal guaranteed structured deposits
150.00 2017/12/20 2018/3/20 Funds in hand
Wealth management funds from banks
Floating revenue 4.70% – Yes 0
Fengtai sub-branch of Industrial Bank
Principal guaranteed structured deposits
100.00 2017/12/29 2018/9/25 Funds in hand
Wealth management funds from banks
Floating revenue 5.00% – Yes 0
Total 16,713.47 157.65 0
Amount in aggregate of principal and income that have not been recovered overdue (RMB)
Not applicable
Description on entrusted wealth management Not applicable
28 2017 Annual Report
MANAGEMENT DISCUSSION AND ANALYSIS
CURRENT LIABILITIES
As at 31 December 2017, the current liabilities of the Group decreased by RMB2,478.56 million or 15.51% to RMB13,503.11 million from RMB15,981.67 million as at 31 December 2016. Such decrease in the current liabilities was mainly attributable to the repayment of partial short-term borrowings in 2017 and the repayment of super short-term financing bonds in due in 2017.
NON-CURRENT LIABILITIES
As at 31 December 2017, the non-current l iabil i t ies of the Group increased by RMB819.24 mil l ion or 2.18% to RMB38,425.00 million from RMB37,605.76 million as at 31 December 2016. Such increase in the non-current liabilities was mainly attributable to the confirmation of the payment obligations to BHR shareholders in 2017.
CONTINGENCY
As at 31 December 2017, the contingent liabilities of the Group are as follows:
(1) Outstanding lawsuits
The Group’s business in China
On 30 January 2013, the Group received relevant documents from Luoyang Intermediate People’s Court of Henan Province stating that Yangshuwa West Lead Mine (“Yangshuwa”), located at Luanchuan County, sued a tailings pond built by the Third Mineral Processing Company, a branch of a subsidiary of the Group. The tailing pond is located within the mining areas of the Yangshuwa. Due to the increase in the dam of the tailings pond, the tailings pond is invaded and the groundwater level is increased, causing the mining facility and equipment to be destroyed and the abandonment of the mining project, making the proven lead-zinc ore body incapable of mining, thus bringing economic losses to the accuser. Therefore, the Third Mineral Processing Company was required to stop infringement and compensate for direct economic losses of approximately RMB18 million and related loss of available profits. According to the result of the judicial appraisal, Yangshuwa's mining rights assessment value involved in this lawsuit was RMB1.724 million. The relevant litigation is currently pending. The Group considers that the fact of the infringement asserted by Yangshuwa cannot be confirmed based on the existing circumstances and the evidence submitted. It is therefore believed that the litigation matter will not have a material impact on the financial position of the Group currently. The related amount of compensation was not included in the financial statements as at 31 December 2017.

29China Molybdenum Co., Ltd.
MANAGEMENT DISCUSSION AND ANALYSIS
The Group’s copper and cobalt business in the DRC
At the end of 2015, TFM negotiated with Société Nationale d’ Electricité (“SNEL”) to resolve the effectiveness, power supply quality and quantity of the current power supply. According to the revised terms of the power agreement contained in the settlement plan, TFM agreed to pay an electricity price of US$0.0569 per kWh from the beginning of January 2016 (the previous electricity price was US$0.0350 per kWh) and paid US$10 million in settlement compensation to obtain more continuous power supply from SNEL. As at 31 December 2017, the two sides have not yet signed any formal agreement and the negotiation is still in progress. For this contingent liability, TFM has already made a provision of US$10 million in expenditure in previous years.
In addition, the Group’s copper and cobalt salesmen in the DRC may have some legal actions, claims and liabilities claims in their daily operations. The management believes that based on the currently available information, the results of these contingent events will not have a material adverse effect on the financial status, operating results or cash flow of the related business.
The Group’s cerium and phosphate business in Brazil
The Group’s cerium and phosphate business in Brazil may face various lawsuits in its daily business activities. The management judged the loss of relevant lawsuits and the possibility of outflow of economic benefits based on the information they possess and the professional opinions of external legal experts. For outflow of economic benefits which is less likely to happen, it shall be represented as a contingent event. The outcome of such contingent events will not have a material adverse effect on the financial position, operating results or cash flows of the related business.
(2) Guarantees
As at 31 December 2017, the Group’s Northparkes copper and gold mining business in Australia provided guarantees for its related business operations to the government agencies of New South Wales, with a guarantee amount of A$32.92 million (equivalent to RMB167.76 million). The joint venture of relevant business had agreed that any liability arising out of this business shall be enforced from this guarantee. As at 31 December 2017, no major guarantee responsibility occurred.
GEARING RATIO
The gearing ratio (total liabilities divided by total assets) of the Group decreased to 53.08% as at 31 December 2017 from 60.95% as at 31 December 2016. The decrease in the gearing ratio was mainly due to the increase in operating cash flow and the increase in capital fund in 2017.
CASH FLOW
As at 31 December 2017, cash and cash equivalents of the Group increased by RMB11,361.21 million or 134.93% to RMB19,781.42 million from RMB8,420.21 million as at 31 December 2016.
30 2017 Annual Report
MANAGEMENT DISCUSSION AND ANALYSIS
For the year ended 31 December 2017, net cash inflow generated from operating activities was RMB8,428.81 million; net cash outflow from investment activities was RMB4,109.23 million; and net cash inflow generated from financing activities was RMB7,372.04 million.
Unit: RMB million
Items 2017 2016Increase or
decrease (%)
Cash received from sales of goods and provision of services 24,594.25 7,644.88 221.71
Other cash receipts relating to operating activities 654.82 424.66 54.20Cash for purchasing goods, receiving labor services 11,736.23 3,270.94 258.80Cash paid to employees and paid for employees 1,770.19 807.88 119.12Taxes and fees paid 2,040.13 679.11 200.41Other cash payments relating to operating activities 1,273.70 396.78 221.01Cash receipts from recovery of investments 2,002.81 3,335.93 -39.96Cash received from investment income 93.33 270.86 -65.54Cash paid for acquisitions or disposals of subsidiaries
and other business units – 28,104.66 -100.00Cash paid for investment 4,834.29 1,416.19 241.36Cash receipts from borrowings 10,560.51 29,429.21 -64.12Other cash receipts relating to financing activities 1,485.20 3,027.28 -50.94Cash repayments of indebtedness 11,038.95 5,186.64 112.83Cash payments for distribution of dividends or profits and
settlement of interests 2,147.31 1,108.37 93.73Other cash payments relating to financing activities 9,346.04 2,170.79 330.54
(1) The increase in cash flow relating to operating activities was mainly due to the completion of the mergers and acquisitions of copper and cobalt business in the DRC and niobium and phosphates businesses in Brazil by the Company during the fourth quarter of 2016, representing a year-on-year increase as compared to the consolidated reporting period.
(2) The decrease in cash receipts from recovery of investments and cash received from investment income were mainly due to the year-on-year decrease in wealth management in due in 2017.
(3) The decrease in cash paid for acquisition or disposal of subsidiaries and other business units was mainly due to the merger and acquisition of overseas asset of the Company during the fourth quarter of 2016 in contrast to no investment expense in acquisition of subsidiaries in 2017.
(4) The increase in cash paid for investment was mainly due to the significant increase in purchase of structured deposits from bank and other wealth management products from other financial institutions in 2017.
(5) The decrease in cash receipts from borrowings was mainly due to the increase in loans for merger and acquisition as a result of the merger and acquisition of oversea asset by the Company during the fourth quarter of 2016, while no material financing activity in 2017.
(6) The decrease in other cash receipts relating to financing activities was mainly due to the significant year-on-year decrease in the gold leasing business matured in 2017.
(7) The increase in cash repayments of indebtedness was mainly due to the repayment of partial short-term borrowings in 2017 and the repayment of super short-term financing bonds in due in 2017.
(8) The increase in cash payments for distribution of dividends or profits and settlement of interests was mainly due to the increase in borrowing interests paid in 2017.
(9) The increase in other cash payments relating to financing activities was mainly due to the payment for acquisition of minority interests within the consolidated scope in 2017.
31China Molybdenum Co., Ltd.
RESOURCES AND RESERVES
(I) RESOURCES AND RESERVES
As at 31 December 2017, the ore resources and reserves of the Company were as follows:
Resources ReservesCategory Mining Area Total Grade Total Grade
(million tonnes) (%) (million tonnes) (%)
Molybdenum Sandaozhuang Molybdenum and Tungsten Mine 497.36 0.100 267.24 0.105
Shangfanggou Molybdenum Mine 463 0.139 41.22 0.181
Xinjiang Molybdenum Mine 441 0.106 141.58 0.139
Tungsten Sandaozhuang Molybdenum and Tungsten Mine 497.36 0.092 267.24 0.120
Copper TFM in the DRC 831.5 2.94 184.6 2.37NPM in Australia 471.81 0.56 125.74 0.57
Cobalt TFM in the DRC 831.5 0.28 184.6 0.32Gold NPM in Australia 471.81 0.19(g/t) 125.74 0.20(g/t)Niobium Brazil Mine area I 100.1 1.17 37.4 0.97
Brazil Mine area II 459.2 0.23 217.7 0.34
Phosphate Brazil Mine area II 459.2 11.29 217.7 12.21
Notes:
(1) The Shangfanggou molybdenum mine is owned by Luoyang Fuchuan Mining Co., Ltd., a joint venture of the Company. Its shareholding structure as at 31 December 2017 is as follows: a 10% equity interest of which is owned by Luanchuan Fukai Business and Trading Company Limited (欒川縣富凱商貿有限公司), a wholly-owned subsidiary of the Company and a 90% equity interest of which is owned by Xuzhou Huanyu Molybdenum Industry Co., Ltd. (徐州環宇鉬業有限公司) (“Xuzhou Huanyu”), a joint venture of the Company (the Company holds a 50% equity interest in Xuzhou Huanyu and Luoyang Guo’an Trade Co., Ltd. (洛陽國安商貿有限公司) holds a 50% equity interest in Xuzhou Huanyu).
(2) Resources and reserves of mines are measured under the standard of the Joint Ore Reserves Committee (聯合礦石儲量委員會), except for those of Xinjiang Molybdenum Mine that are measured under the PRC standard. The above reserves of ore resources have been confirmed by our internal expert.
(II) EXPLORATION, DEVELOPMENT AND MINING ACTIVITIES
(I) Exploration
NPM exploration activities:
Surface drilling programs were undertaken on EL5800, EL5801, EL5323, and ML1247, ML1367, ML1641 during 2017. A total of 20,300 meters of surface drilling was undertaken during the period, comprising 65 holes of diamond core (14,122 meters), reverse circulation (RC) (5,913 meters) and aircore drilling (265m).
Underground diamond core drilling was completed in the E26 Lift 1NU and the E26 SLC areas (ML1247), comprising 12 holes for 1,388 meters.
Drilling completed is a mix of regional drilling programs, near-mine exploration prospects and evaluation targets on the Northparkes Mining Leases.
32 2017 Annual Report
RESOURCES AND RESERVES
The other major activity undertaken this year has been the re-assay of historic aircore and RAB drill returns for a broad pathfinder element suite; 10,720 residual samples were submitted for re-assay using the ALS 48 element suite (ME-MS61) plus fire assay gold (Au-AA21).
Exploration activities in the Boa Vista Mine in Brazil:
To support long term planning and to convert mineral resources in the Chapadão Mine, 13 diamond drill holes totaling 2,969.80 meters were performed by using 2 drill rigs in the FFG-04 area, and 12 diamond drill holes totaling 3,001.00 meters in the north part of Boa Vista Mine using 1 drill rig.
In order to carry out geochemical and geophysical phosphate anomalies, 2 diamond drill holes were performed in the Botafogo target using 1 drilling.
In terms of geophysical studies, 4 diamond drill holes (CT1-CHP-LP70, CT1-CHP-LP77, CT1-CHP-LP81, CT1-CHP-LP82) total ing 680 meters and 9 blastholes total ing 36 meters were completed using gamma-gamma and nature gamma methods.
Exploration activities of TFM Mine:
Exploration drilling completed during 2017 comprised 92,688 meters of surface drilling in 654 core holes and was completed using 8 rigs.
Drilling was concentrated on the Dipeta Syncline, Shadirandzoro, Kapapidi and the Kwatebala regions. Minor condemnation drilling program includes: condemnation over the planned heap leach, geomechanical drilling on the Mambilima deposit and limestone exploration done in the Mofya quarry.
(II) Development
(1) Sandaozhuang Mine
For the year ended 31 December 2017, the Company did not have any significant development in Sandaozhuang Mine.
(2) Shangfanggou Mine
For the year ended 31 December 2017, the Company did not have any significant development in Shangfanggou Mine.
(3) Xinjiang Mine
For the year ended 31 December 2017, the Company did not have any significant development in Xinjiang Mine.
(4) NPM Copper and Gold Mine
Tailings storage facility construction was completed in 2017 on the TSF Infil l project; while construction activities continued on Escort stage 2 and TSF 1 closure.
Underground lateral development of 392 meters was completed on schedule for the ventilation upgrade project.
(5) Brazil Niobium and Phosphates Mine
Grade control to support the mining: 153 drill holes were carried out with reverse circulation (RC) in the Chapadão Mine totaling 4,455 meters in the Neverland, Cerradinho and Downstream areas. 1,151 drill holes were carried out in Boa Vista Mine with reverse circulation (RC), totaling 28,488.75 meters.

33China Molybdenum Co., Ltd.
RESOURCES AND RESERVES
Infrastructure in the Boa Vista Mine: 7 piezometers built, re-location of power energy, 1 water wheel, regional monitoring network, gas station infrastructure and radio system.
(6) TFM in the DRC
Clear and Grub activity, 140 hectares in total, occurred at Tenke, Kansalawile, Mambalima and Fungurume. 9km of haul roads were developed to Mofya Quarry, Kansalawile and Mambalima deposits. Dewatering activity focused on Mofya, Mwadinkomba and Fungurume.
(III) Mining
2017
Domestic mining activitiesProduction volume of Sandaozhuang Molybdenum and Tungsten Mine (kilotonnes) 19,015.6
Overseas mining activitiesProduction volume of NPM Copper Mine (kilotonnes) 6,465
Production volume of Brazil Niobium Mine (kilotonnes) 3,190
Production volume of Brazil Phosphates Mine (kilotonnes) 5,616
Production volume of TFM Copper and Cobalt Mine (kilotonnes) 8,666
Remarks:
1. The mining production volume above were calculated based on the statistics prepared by the Company and have been confirmed by our internal experts.
2. For the year ended 31 December 2017, no mining activities were conducted in Xinjiang Mine and Shangfanggou Mine.
(III) EXPLORATION, DEVELOPMENT AND MINING EXPENSES OF THE COMPANY
For the year ended 31 December 2017, the summary of the expenditures of exploration, development and mining activities of the Company are as follows:
1. Domestic mining expenses
(1) The mining expenses of Sandaozhuang Mine amounted to RMB474.95 million;
(Note: ore processing is not included, the same below).
2. Overseas mining expenses (in US$ Million)
Project Exploration Development Mining
Niobium Mine 0.49 2.4 24.75Phosphates Mine 0.65 0.36 16.92TFM Copper and Cobalt Mine 20.1 8.8 222.7NPM 4.6 7.0 42.7
Total 25.84 18.56 307.07
34 2017 Annual Report
MATERIAL EVENTS
A. MATERIAL EVENTS
1. Exclusive agreement with BHR to indirectly hold 24% interest in TFM
On 15 November 2016, BHR, Tenke Holdings LTD. (hereinafter referred to as “THL”) and Lundin Mining Corporation (hereinafter referred to as “Lundin”) entered into a stock purchase agreement for the acquisition of 100% equities held by THL in Lundin DRC Holdings Ltd (hereinafter referred to as “Lundin Shell Company”) from THL by BHR or its wholly-owned subsidiary. Upon the completion of the purchase, BHR will hold 24% interests in TFM indirectly.
On 20 January 2017, the Company and BHR entered into the “Cooperation Framework Agreement between China Molybdenum Co., Ltd. and BHR Newwood Investment Management Limited on the Investment Cooperation Regarding Tenke Fungurume Mining Area”, pursuant to which the Company intends to cooperate with BHR regarding the introduction of an ultimate investor in BHR, the indirect investment of BHR in a total of 24% of equities of TFM and the subsequent exit of such investment. BHR exclusively and irrevocably granted the Company the exclusive option to buy the 24% interest in TFM.
On 20 April 2017, the acquisition of 100% of equities originally held by THL in Lundin Shell Company from THL by BHR through its wholly-owned subsidiary was completed. BHR directly helds 100% of equities in Lundin Shell Company through its wholly-owned subsidiary, and indirectly helds a 24% interest in TFM.
For details of the above transactions, please refer to the announcements of the Company dated 22 January 2017 and 6 March 2017.
2. Completion of the non-public issuance of A Shares
On 18 January 2017, the Company passed the China Securities Regulatory Commission (“CSRC”) review for the non-public issuance of A shares, and on 23 June 2017 received the “Approval in Relation to the Non-Public Issuance of Shares by China Molybdenum Co., Ltd.” (Zheng Jian Xu Ke [2017] No. 918) from CSRC that the Company was approved to issue no more than 5,769,230,769 new A shares.
On 18 July 2017, the 8 target subscribers for the non-public issuance remitted all subscription payments in full to the account designated by the sponsor. Relevant payments were verified in the Capital Verification Report issued by Deloitte Touche Tohmatsu Certified Public Accountants LLP (Special General Partnership). In fact, the Company issued 4,712,041,884 A shares at RMB3.82 per share, and the total subscription payments made by the target subscribers for the non-public issuance amounted to RMB17,999,999,996.88.
On 20 July 2017, as verified by the “Capital Verification Report on the Increase in Registered Capital and Share Capital of China Molybdenum Co., Ltd. upon its Non-public Issuance of RMB Ordinary Shares (A Shares)” (De Shi Bao (Yan) Zi (17) No. 00317) issued by Deloi t te Touche Tohmatsu Certified Public Accountants LLP (Special General Partnership), net proceeds from the issuance were RMB17,858,632,663.30 after deducting issuance fees of RMB141,367,333.58 from the total proceeds.
On 24 July 2017, the Company completed the registration and custody procedures with the Shanghai Branch of China Securities Depository and Clearing Company Limited for the newly-increased A shares, and its share capital increased from 16,887,198,699 shares to 21,599,240,583 shares.
For details of the above non-public issuance of A shares, please refer to the announcements of the Company dated 18 January 2017, 23 June 2017 and 26 July 2017.
35China Molybdenum Co., Ltd.
MATERIAL EVENTS
Utilization of Proceeds Raised
As noted from the “Approval in Relation to the Non-Public Issuance of Shares by China Molybdenum Co., Ltd.” (Zheng Jian Xu Ke [2017] No. 918) issued by the CSRC, the Company was approved to issue non-publicly 4,712,041,884 ordinary A shares with issue price of RMB3.82 per share. The total proceeds raised from issuance of shares amounted to RMB18 billion. The actual net proceeds raised after deducting issuance fees of RMB141.37 million was RMB17,858.63 million. The Company has received the entire fund above by 19 July 2017.
The proceeds raised and the yields of the Company were used for replacement of the internal financed funds initially contributed at the asset acquisition projects of niobium and phosphates in Brazil and copper and cobalt in the DRC. As at 31 December 2017, the Company has utilized a total of RMB17,865.23 million (including yields generated from the proceeds raised of RMB6.60 million) of proceeds raised from the non-public issuance of RMB ordinary shares. The proceeds raised have been utilized in full.
3. Participation and establishment of investment fund by subsidiaries
On 17 November 2017, the 27th extraordinary meeting of the fourth session of the Board of the Company considered and approved the “The proposal for the Company’s wholly owned subsidiary to establish a natural resources investment fund in cooperation with New China Capital Legend Limited” (《關於公司全資子公司擬與 New China Capital Legend Limited 合作設立自然資源投資基金的議案》), CMOC Limited or its designated wholly-owned subsidiary would participate and establish the “NCCL Natural Resources Investment Fund” (the “Fund”) as a limited partner, in which New China Capital Legend Limited (“NCCL”) or its designated wholly-owned subsidiary would act as a general partner. The size of the fund is US$1 billion. CMOC Limited or its designated wholly-owned subsidiary, being a limited partner, contributes fund which did not exceed 45% of the total fund size (i.e. US$450 million), and assumes responsibility for such contribution limit.
On 15 December 2017, Natural Resource Elite Investment Limited (“NREIL”, a 100% owned company by CMOC Limited) entered into the Second Amended and Restated Exempted Limited Partnership Agreement (the “Partnership Agreement”) with NCCL and Next Goal Limited (“NGL”). According to the Partnership Agreement, NREIL and NGL, as limited partners, subscribed for the limited partnership shares of NCCL Natural Resources Investment Fund, in which NCCL was a general partner. The fund raised in the first phrase amounted to US$500.10 million, of which NREIL subscribed for US$225.00 million, NGL subscribed for US$275 million and NCCL subscribed for US$100,000.
On 22 December 2017, the Fund and Louis Dreyfus Company B.V. (“LDC”) entered into the Sales and Purchase Agreement, pursuant to which, the Fund acquired 100% equity interests in Louis Dreyfus Company Metals B.V., a company engaging in basic metals and precious metals trading platform. The transaction is expected to be completed in the first half of 2018.
For details of the establishment of the investment fund, please refer to the announcements of the Company dated 17 November 2017, 15 December 2017 and 26 December 2017.
B. HONOURS
(1) In August 2017, the “Key Technology and Realm Optimization of Integrated Mining of Minerals in Sandaozhuang Open-pit Mine” of the Company won the Luoyang Science and Technology Progress Award (First Prize).
(2) In November 2017, the “Scientific and Technological Research, Industrialization and High Cleanliness Metallurgical Demonstration Project of Comprehensive Recovery of Low-Grade Automatic Mines from Floating Molybdenum Tailings” of the Company won the First Prize for China’s Industrial Research & Innovation Achievements.
(3) In January 2018, “The Research and Development of Intelligent Production Equipment and Key Technologies about Sandaozhuang Open-pit Mine” of the Company won the First Prize for Science and Technology Advancement in China’s Non-Ferrous Metal Industry.
36 2017 Annual Report
MATERIAL EVENTS
C. DOMESTIC AND OVERSEAS INDUSTRY POLICIES
(1) Within the PRC
Indicators for control over the aggregate mining volume of tungsten mines
In order to protect and reasonably develop the advantageous mining resources, pursuant to the relevant requirements regarding mining activities of certain protective mines, the aggregate mining volume of rare earth mines and tungsten mines continued to be under control in 2017. For practical demands, indicators for control over the aggregate mining volume of rare earth mines and tungsten mines were issued in two batches in 2017. On 17 March 2017, the Ministry of Land and Resources issued the first batch of notice, “Notice on Indicators for Controlling the Aggregate Mining Volume of Rare Earth Mines and Tungsten Mines for the Year 2017 (First Batch) Issued by the Ministry of Land and Resources” (《國土資源部關於下達二零一七年度稀土礦鎢礦開採總量控制指標(第一批)的通知》), stating that the indicator for controlling the aggregate mining volume of the first batch of tungsten concentrates (containing 65% tungsten trioxide) was 45,650 tonnes, among which the main mining indicator was 36,650 tonnes and comprehensive utilization indicator was 9,000 tonnes. The notice for the whole year, “Notice on Indicators for Controlling the Aggregate Mining Volume of Rare Earth Mines and Tungsten Mines for the Year 2017 Issued by the Ministry of Land and Resources”, was issued on 3 July 2017, stating that the indicator for controlling the aggregate mining volume for the whole year of 2017 (including the volume in the first batch of notice) of tungsten concentrates (containing 65% tungsten trioxide) was 91,300 tonnes.
Environmental tax
On 25 December 2016, the NPC Standing Committee voted on and adopted the Environmental Protection Tax Law (《環境保護稅法》), which required that the existing pollutant discharge fees shall be changed to environmental protection tax in equal amounts. The environmental tax will be levied from 1 January 2018.
Tax items of environmental protection tax: four major categories of air pollutants, water pollutants, solid wastes and excessive noise.
Tax calculation and charging methods: The current Schedule of Pollutant Equivalent Values and current calculation methods are followed for air pollutants and water pollutants, meaning that the tax bases would be pollution equivalent amount converted from discharge volume. Local governments are encouraged to increase the taxes with regards to the actual local situations, and upper limits are set on the basis of the lower limit prevailing for pollutant discharge fees, which shall not be more than ten times of the lower limit.
Tax reduction and exemption levels for emission reductions of the enterprises are further divided through environmental protection tax. The prevailing measures for levying pollutant discharge fees stipulate that where the concentration value of the taxable atmospheric or water pollutants emitted by taxpayers is lower than the nationally and locally stipulated pollutant emission standard by 50%, only 50% of the environmental protection tax will be levied. Another level of tax reduction and exemption was added for environmental protection tax, namely where the concentration value of the taxable atmospheric or water pollutants emitted by taxpayers is lower than the nationally and locally stipulated pollutant emission standard by 30%, only 75% of the environmental protection tax will be levied.
37China Molybdenum Co., Ltd.
MATERIAL EVENTS
Income tax
Upon the expiration of the original certificate, the Company applied for re-accreditation of the High and New Technology Enterprise Certificate according to relevant regulations of the government. On 6 December 2017, the Company obtained the High and New Technology Enterprise Certificate jointly issued by the Henan Provincial Department of Science and Technology (河南省科學技術廳), Henan Provincial Finance Department (河南省財政廳), Henan Provincial Office of State Administration of Taxation (河南省國家稅務局) and Henan Local Taxation Bureau (河南省地方稅務局) (certificate number: GR201741000176). With the issue date on 29 August 2017, such qualification is valid for three years. The Company will be able to continuously enjoy the relevant tax preferential policies for three consecutive years (from 2017 to 2019) and be entitled to the enterprise income tax at the rate of 15% after being re-accredited as a high and new technology enterprise.
(2) Overseas
Niobium and phosphates in Brazil
In Brazil, the operations (mines and plants) are regulated by the National Mineral Production Department (“DNPM”) together with labor, environmental and heritage agencies. All regulations are under the responsibility of the municipal, state and federal governments and the public prosecutor’s office, together with the environmental agencies, mandate pollution control improvements across the industry to reduce and eliminate SO2, NH3, Fluoride, dust and other emissions that may affect the environment and surrounding communities. The existence of radioactivity elements in the ore mined at Phosphate and niobium mines involves a series of requirements to control the exposure of such materials to the public.
All relevant controls are in place, and the operations are fully compliant with the relevant limits and regulations.
In December 2017, the Brazilian government published two new mining laws: Federal Law n.13540 that changed the way of calculating CFEM and Federal Law n.13575 that created the new Regulatory Agency. Subsequently, the government issued Decree n.9252, which regulated the reference value, relevant to the determination of the royalty in the cases of consumption and export.
Copper & gold related products in Australia
Mining in the State of New South Wales (“NSW”) is mainly regulated by the Mining Act of 1992, and administered by the Department of Trade and Investment. The NSW Government owns mineral resources in NSW and all exploration and mining activity for minerals in NSW require a valid authorization and a mining lease. Under the Mining Act of 1992, royalties are payable to the State of NSW on all publicly and privately owned minerals recovered by the holder of a mining lease.
The NSW Work Health and Safety (Mines and Petroleum Sites) Act of 2013 and NSW Work Health and Safety (Mines and Petroleum Sites) Regulation of 2014 align specific mine safety laws with general work health and safety laws. They also provide a single legislative framework for the regulation of safety in mines.
Copper and cobalt related products in the Democratic Republic of the Congo (DRC)
In accordance with Environmental Social Impact Assessment, the Company continues to develop the project in a manner that promotes sustainable development for the project and surrounding communities. In the second half of 2017, the Tenke mining operation continued implementation of continuous improvement plans that aligned with the International Council on Mining and Minerals Sustainable Development principles, including investments in community potable water and other infrastructure, livelihood generation programs in agriculture, development of educational opportunities through vocational training.

38 2017 Annual Report
RISK WARNING
1. EXPOSURE TO RISKS RELATED TO PRICE FLUCTUATIONS OF PRINCIPAL PRODUCTS
The revenue of the Company primarily generates from the sale of metals and phosphate products, including ferromolybdenum, tungsten concentrates, copper concentrates, electrolytic copper, cobalt hydroxide, ferroniobium, phosphate fertilizer and other related products. Its operating results are largely subject to fluctuations in the market prices thereof. The NPM copper/gold mine of the Company also has sales of gold as a by-product. Accordingly, the price fluctuations in gold will also have an impact on the Company. Since the fluctuations in the costs of mining and smelting process are relatively insignificant, the Company’s profit and profit margin in the reporting period are closely related to the price trend of the commodities. Therefore, significant fluctuation in the prices of resource products and gold may cause instability of the operating results of the Company. Particularly, if the prices of resource products record sharp decreases, the operating results of the Company will fluctuate significantly.
Given the relatively significant fluctuations in the copper products and the existence of products in transit, rolling settlement and other factors, at the 2016 Annual General Meeting, the Board of Directors was authorised to determine and carry out the hedging of copper and gold products in line with market conditions, production plans and pursuant to the “Hedging Management System” of the Company, within the expected total annual output on the basis of equity interests. The Company will deepen market research and adopt appropriate hedging plans to guard against risks related to price fluctuations.
2. EXPOSURE TO RISKS RELATED TO RELIANCE ON MINERAL RESOURCES
As the primary operation of the Company is mineral resource exploitation, the Company is highly dependent on mineral resources. The retained reserves and grade of mineral resources directly affect the Company’s operation and development. The exploitation of mineral reserves with relatively low grade may be economically infeasible in case of cost of production rising due to fluctuations in the market price, drop in the recovery rate, inflation or other factors, or due to restrictions caused by technical problems and natural conditions such as weather and natural disasters in the mining process. Therefore, full utilization of the retained reserves of the Company cannot be guaranteed and the production capacity of the Company might be affected.
Technical staff of the Company will regularly review and update the reserves and grade according to the development of resources, and optimize mining schemes and plans, thereby verifying resources of the Company and implementing the best mining plans.
3. EXPOSURE TO RISKS RELATED TO PRODUCTION SAFETY OR NATURAL DISASTERS
The Company engages in the mining business and mineral resources processing. The Company invested substantial resources to form a relatively complete system of production safety management, risk prevention and supervision, established a well trained workforce and a management body for safe production and continuously push forward the safety standardization management. However, safety incidents cannot be totally avoided. As a mineral resource exploiter, large amounts of reduced rocks and tailings are produced in the production process. Inefficient management of slag discharge fields and tailing storage facilities may result in small scale disaster. The Company uses explosives in the mining process. If there are defects in the storage and use of such materials, there may be possible risk of casualties. In addition, tailing storage facilities and slag discharge fields may be damaged if serious natural disaster occurs such as rainstorms or debris flows.
The Company will continue to prevent and control safety risks related to production by formulating and improving safety systems, intensifying accountability and assessment in relation to safety and environmental protection, investing more in production safety and environmental protection and promoting standardized safety management. It will improve the prevention and control of natural disaster risk through “flood season” emergency plans and drills.

39China Molybdenum Co., Ltd.
RISK WARNING
4. EXPOSURE TO RISKS RELATED TO INTEREST RATES
The interest rate risk related to fair value comes from changes in bank loan rates. The risk of changes in cash flows of financial instruments arising from fluctuations in interest rates is mainly related to bank borrowings with floating rates.
The Company has adopted interest rate swaps to hedge against interest rate fluctuations on certain US$-denominated loans, therefore minimizing the impact of interest rate hikes resulting from higher United States interest rates. In the future, the Company will pay close attention to the changes of interest rate so as to deal with interest rate risks by measures including interest rate swaps.
5. EXPOSURE TO RISKS RELATED TO EXCHANGE RATE
The exchange rate risk exposure of the Company is primarily arising from assets and liabilities held in foreign currencies other than the function currency, and is mainly associated with US$, HK$, EUR, CAD, RMB, BRL, GBP, CDF and AUD. All principal business operations of domestic subsidiaries are denominated and settled in RMB; the principal business operations of subsidiaries of the Group in Australia are mainly denominated and settled in AUD or US$; the niobium and phosphates businesses of the Group in Brazil are mainly denominated and settled in US$ and BRL; and the copper and cobalt business of the Group in the DRC is mainly denominated and settled in US$ and CDF. Therefore, the exposure of the Group to changes in exchange rates is not significant, as its foreign currency transactions mainly comprise the financing activities of subsidiaries in mainland and Hong Kong which are denominated and settled in US$, the operational activities of subsidiaries (whose functional currency is US$) in Australia are settled in AUD, the operational activities of subsidiaries (whose functional currency is US$) in Brazil are settled in BRL (Brazil) and the operating activities of subsidiaries (whose functional currency is US$) in the DRC are settled in CDF.
The exchange rate risks arising from assets and liabilities with balances denominated in foreign currencies may affect the operating results of the Group. The Company has paid close attention to the effect of the changes in exchange rates, and made use of forward foreign exchange contracts to hedge foreign exchange rate risk in due course.
As at 31 December 2017, the Company has not entered into any hedging arrangement for the exchange rate risks.
6. EXPOSURE TO RISKS RELATED TO POLICIES
Tenke Fungurume Mining operated by the Company is located in the DRC, which is one of the underdeveloped countries in the world with social problems that cause public concern. If the political and security situation of the DRC deteriorates in the future, it will cause adverse effects on the production and operation of the Company. The foreign assets operational philosophy of the Company underlies positive relations with local government, communities and social organizations. As the political ties between China and the DRC stabilize and draw ever closer, the government of China has been encouraging outbound investments into the DRC. In order to further reduce potential economic losses of the Company incurred by relevant risks in operations, the Company is picking up pace in covering DRC projects by overseas investment insurance.
40 2017 Annual Report
RISK WARNING
7. EXPOSURE TO RISKS RELATED TO OPERATIONS OF OVERSEAS ASSETS
Through operating the NPM Copper and Gold Mine in Australia, the Company has accumulated certain experience in operation and management of overseas mineral resources, which serves as the reference for successful mining operations in Brazil and the DRC; however, significant differences of operational environments and business attributes in different countries are likely to pose material challenges to asset operation and management in Brazil and the DRC. In addition, as the Company quickens its pace of internationalization, the expansion of its scale also increases the difficulty in corporate management and operations, including higher requirements of organizational structure, competence of the management team and professionalism of the staff. As such, the Company may be affected to a certain degree by the shortage of talents.
For management and control of overseas operations, the Company has established an overseas asset operation and management center in Phoenix, United States, and built a professional management team comprising talents with extensive management experience and international vision. The Company will continue to implement the strategy of introducing international management talents, in order to optimize its internationalization and enhance the control on overseas assets.
41China Molybdenum Co., Ltd.
CORPORATE GOVERNANCE REPORT
The Board hereby presents this Corporate Governance Report in the Group’s report for the year ended 31 December 2017.
CORPORATE GOVERNANCE PRACTICES OF THE COMPANY
The Group has strived to uphold high standards of corporate governance to safeguard the interests of shareholders, to enhance corporate value and to implement accountability for the Group.
The Company has applied the principles and code provisions as set out in the Corporate Governance Code contained in Appendix 14 to the Rules Governing the Listing of Securities on the Stock Exchange (the “Hong Kong Listing Rules”).
In the opinion of the Board, the Company has adopted and complied with the code provisions as set out in the Corporate Governance Code throughout the period from 1 January 2017 to 31 December 2017, save as the deviation from the code provision E.1.2 of the Corporate Governance Code.
Pursuant to the code provision E.1.2, the chairman of the Board should invite the chairmen of its Board committees to attend the annual general meeting. In their absence, the chairman of the Board should invite another committee member (or failing this his duly appointed delegate) to attend. All members of the Audit Committee were unable to attend the annual general meeting of the Company held on 28 June 2017 due to other business commitments. The attendance of the chairmen of the Remuneration Committee, the Nomination Committee, the Strategic Committee and the Supervisory Committee and the chief financial officer at such annual general meeting was sufficient for (i) answering the questions raised by the shareholders who attended the annual general meeting and (ii) effectively communicating with shareholders who attended the annual general meeting. The Company will strive to optimize the planning and procedures of annual general meetings, give adequate time to all Directors to accommodate their work arrangement and provide all necessary support for their presence at and participation in the general meetings so that all Directors will be able to attend future annual general meetings of the Company.
The Company reviews its corporate governance practices regularly to ensure compliance with the Corporate Governance Code.
THE BOARD
For the year ended 31 December 2017, the Board held 14 Board meetings in total for reviewing and approving the financial affairs and usual course of business, considering and approving the annual budgets and the overall strategies and policies of the Company, and considering and approving relevant matters in relation to the acquisition of overseas businesses and non-public issuance of Shares by the Company.
RESPONSIBILITIES
The Board is responsible for the leadership and control of the Group, overseeing the Group’s businesses, strategic decisions and performances. The Group’s senior management is delegated the authority and responsibilities by the Board to manage the day-to-day management and operations of the Group. In addition, the Board has also established Board committees and has delegated to these Board committees various responsibilities (including corporate governance functions) set out in their terms of reference respectively.
Every Director carries out his duty in good faith and in compliance with the standards of applicable laws and regulations, and acts in the interests of the Company and its shareholders at all times.
The Company has arranged appropriate insurance which covers legal litigation arising from corporate activities against its Directors and senior management.
42 2017 Annual Report
CORPORATE GOVERNANCE REPORT
BOARD COMPOSITION
The Board currently comprises eight members, including two executive Directors, three non-executive Directors and three independent non-executive Directors.
The list of all Directors is set out under “Corporate Information” on page 81 and the independent non-executive Directors are expressly identified in all corporate communications pursuant to the Hong Kong Listing Rules.
As at 31 December 2017, the board of directors of the Company comprises the following Directors:
Executive Directors
Li Chaochun, ChairmanLi Faben, General Manager (also the chief executive within the meaning of the Corporate Governance Code)
Non-Executive Directors
Ma Hui, Vice ChairmanYuan HonglinCheng Yunlei
Independent Non-Executive Directors
Bai YanchunXu ShanCheng Gordon
The list of Directors (by category) is also disclosed in all corporate communications issued by the Company from time to time pursuant to the Hong Kong Listing Rules. There is no relationship among members of the Board (including financial, business, family or other material or relevant relationship).
For the year ended 31 December 2017, the Board, at all times, met the requirements of the Hong Kong Listing Rules relating to the appointment of at least three independent non-executive Directors, and at least one-third of the Board with at least one independent non-executive Director possessing appropriate professional qualifications, or accounting or related financial management expertise.
The Company has received an annual confirmation from each independent non-executive Director of his independence pursuant to the requirements of the Hong Kong Listing Rules. The Company considers all independent non-executive Directors to be independent in accordance with the independence guidelines set out in Rule 3.13 of the Hong Kong Listing Rules.
Non-executive Directors (including independent non-executive Directors) bring a wide range of business and financial expertise, experience and independent judgment to the Board. Through active participation in Board meetings or meetings of Board committees, supervising management issues involving potential conflict of interests and serving on Board committees, all non-executive Directors (including independent non-executive Directors) make various contributions towards the direction of the Company.

43China Molybdenum Co., Ltd.
CORPORATE GOVERNANCE REPORT
CHAIRMAN AND GENERAL MANAGER
The roles and duties of the Chairman and the General Manager are carried out by different individuals and their respective responsibilities have been clearly specified in writing.
The Chairman, Mr. Li Chaochun, provides leadership for the Board and is also responsible for chairing the meetings, leading the operations of the Board and ensuring that all major and appropriate issues are discussed by the Board in a timely and constructive manner.
The General Manager, Mr. Li Faben, is responsible for running the Company’s business operations and implementing the Group’s strategic plans and business goals.
APPOINTMENT AND RE-ELECTION OF DIRECTORS
In accordance with the Company’s articles of association (the “Articles of Association”), all Directors of the Company are subject to retirement by rotation at least once every three years and any new Director appointed by the Board to fill a casual vacancy or as an addition to the Board shall submit himself/herself for election by shareholders at the first general meeting after appointment.
Each Director of the Company is appointed for a term commencing from the date on which the resolution regarding his appointment/re-election is passed until the conclusion of the annual general meeting of the Company to be held in 2018, and will retire and be re-elected at such annual general meeting. According to the Detailed Working Rules for Independent Directors adopted on 9 October 2012, the term of office for independent non-executive Directors shall be the same as that of other Directors of the Company, and they may stand for re-election upon expiry of their term, but the re-appointment shall not exceed six years. Mr. Bai Yanchun, Mr. Xu Shan and Mr. Cheng Gordon, who were appointed as the independent non-executive Directors on 17 August 2012, will not offer themselves for re-election at the annual general meeting to be held in 2018. The Board proposed a special resolution at the 2015 annual general meeting regarding the amendment to the Articles of Association, fixing the number of the Board members at 7 to 11 so that the number and composition of the Board of Directors of the Company are in compliance with the requirements under the Company Law and the Hong Kong Listing Rules.
The Nomination Committee and the Board selected candidates of Directors with reference to major shareholders’ recommendations and certain criteria and procedures. The relevant criteria mainly include the candidate’s professional background, especially his or her experience in the industry where the Group operates, his or her financial and past track record with other similar companies and the recommendations from management and other knowledgeable individuals. The procedures and process of appointment, re-election and removal of Directors are laid down in the Articles of Association. The Nomination Committee of the Company is responsible for reviewing the Board composition, monitoring the appointment, nomination and succession plan of Directors and assessing the independence of independent non-executive Directors.
INDUCTION AND CONTINUING PROFESSIONAL DEVELOPMENT FOR DIRECTORS
Each newly appointed Director receives a comprehensive, formal and tailored induction on the first occasion of his/her appointment so as to ensure that he/she has an appropriate understanding of the business and operations of the Company and that he/she is fully aware of his/her responsibilities and obligations under the Hong Kong Listing Rules and relevant regulatory requirements.
The Directors are regularly updated with legal and regulatory developments as well as business and market changes to facilitate the discharge of their responsibilities. Briefings and continual professional development schemes for Directors will be arranged whenever necessary.
The Company encourages all Directors to participate in continuous professional development to develop and refresh their knowledge and skills in order to ensure that their contribution to the Board remains fully informed and relevant. For the year ended 31 December 2017, all Directors attended the training courses organized by the Company on corporate governance and regulatory development, and obtained and read relevant materials presented to them by the Office of the Board of the Company, including updates of laws and regulations.
44 2017 Annual Report
CORPORATE GOVERNANCE REPORT
BOARD MEETINGS
Practices and Conduct of Board Meetings
Meeting schedules and draft agendas for each meeting are normally made available to Directors in advance.
Notices of regular Board meetings are served to all Directors at least 14 days before the meetings. For other Board and committee meetings, notice is generally given pursuant to the Articles of Association and the respective Terms of Reference and Operation Rules of the committees.
The agenda of Board meeting and the accompanying Board papers are sent to all Directors at least three days before each Board meeting or committee meeting for their review and to keep the Directors apprised of the latest developments and financial position of the Company so as to enable them to make informed decisions. The Board and each Director also have separate and independent access to the senior management whenever necessary for inquiries or additional information.
The senior management will attend all regular Board meetings and when necessary, other Board and committee meetings to advise on business developments, operation, financial and accounting matters, statutory compliance, corporate governance and other major aspects of the Company.
The Articles of Association contains provisions requiring Directors to abstain from voting and not to be counted in the quorum at meetings for approving transactions where such Directors or any of their associates have a material interest.
DIRECTORS’ ATTENDANCE RECORDS
The attendance records of each Director at the meetings of the Board, Remuneration Committee, Audit Committee, Nomination Committee and Strategic Committee and general meetings for the year ended 31 December 2017 are set out below:
Number of Attendance in person/Number of Meetings
Name of DirectorsBoard
Meeting
Remuneration Committee
Meeting
Audit Committee
Meeting
Nomination Committee
Meeting
Strategic Committee
Meeting
Annual General
Meeting(1)
Extraordinary General
Meeting and Class
Meeting(2)
Mr. Li Chaochun 14/14 N/A N/A 1/1 1/1 1/1 3/3Mr. Li Faben 14/14 N/A N/A N/A 1/1 1/1 3/3Mr. Ma Hui 14/14 N/A N/A N/A N/A 1/1 3/3Mr. Yuan Honglin 14/14 1/1 5/5 N/A 1/1 0/1 0/3Mr. Cheng Yunlei 14/14 N/A N/A N/A N/A 1/1 3/3Mr. Bai Yanchun 14/14 1/1 N/A 1/1 1/1 1/1 2/3Mr. Xu Shan 14/14 N/A 5/5 1/1 N/A 0/1 0/3Mr. Cheng Gordon 14/14 1/1 5/5 1/1 N/A 0/1 0/3
Notes:
(1) The annual general meeting was held on 28 June 2017.
(2) For the year ended 31 December 2017, the Company convened the 2017 First Extraordinary General Meeting on 14 April 2017 and held the 2017 First Class Meeting of Holders of A Shares and H Shares on 28 June 2017.
45China Molybdenum Co., Ltd.
CORPORATE GOVERNANCE REPORT
COMPANY SECRETARY
To maintain sound corporate governance and to comply with the Hong Kong Listing Rules and requirements of applicable Hong Kong laws, the Company appointed Ms. Ho Siu Pik from Tricor Services Limited (an external service provider) as the company secretary in 2017. Her primary contact person in the Company was Mr. Yue Yuanbin, the secretary to the Board.
Ms. Ho has confirmed that she has undertaken no less than 15 hours of relevant professional training in 2017.
On 3 March 2017, the Company convened the nineteenth extraordinary meeting of the fourth session of the Board and approved to appoint Mr. Yue Yuanbin as the secretary to the Board with effect from the day on which such appointment was considered and approved by the Board until the end of the term of office of the current Board. Mr. Yue Yuanbin, the secretary of the Board, reports to Mr. Li Chaochun, the Chairman of the Company.
SECURITIES TRANSACTIONS MADE BY DIRECTORS, SUPERVISORS AND EMPLOYEES
The Company has adopted the Model Code for Securities Transactions by Directors of Listed Issuers (the “Model Code”) as set out in Appendix 10 of the Hong Kong Listing Rules in respect of dealings in the Company’s securities by the Directors. Specific enquiry has been made on all Directors and supervisors and they have confirmed that the required standards set out in the Model Code have been complied with throughout the year ended 31 December 2017. The Company has also formulated written guidelines equally stringent as the Model Code (the “Employees Written Guidelines”) for securities transactions by employees of the Company who are likely to be in possession of unpublished inside information of the Company. No incident of non-compliance against the Employees Written Guidelines by the employees has been noted by the Company after making reasonable enquiry.
DELEGATION BY THE BOARD
The Board reserves its decisions for all major matters of the Company, including: the approval and monitoring of all policy matters, overall strategies and budgets, internal control and risk management systems, material transactions (in particular those that may involve conflict of interests), financial information, appointment of Directors and other significant financial and operational matters.
All Directors have full and timely access to all relevant information as well as the advice and services of the company secretaries, with a view to ensuring that Board procedures and all applicable rules and regulations are complied with. In appropriate circumstances, Directors may seek independent professional advice relating to such queries at the Company’s expense upon making such request to the Board.
The day-to-day management, administration and operations of the Company are delegated to the General Manager and the senior management. The delegated functions and work tasks are reviewed periodically. Prior to any significant transactions to be entered into by the abovementioned officers, approvals have to be obtained from the Board.
The Board has established a number of committees, including the Remuneration Committee, Audit Committee, Nomination Committee and Strategic Committee for overseeing particular aspects of the Company’s affairs. All Board committees of the Company were established with defined written terms of reference. Board committees are provided with sufficient resources to perform their duties. Upon reasonable requests, Board committees may seek independent professional advice in appropriate circumstances at the expense of the Company.

46 2017 Annual Report
CORPORATE GOVERNANCE REPORT
R E M U N E R A T I O N O F D I R E C T O R S, S U P E R V I S O R S A N D S E N I O R MANAGEMENT
The Company has established a formal and transparent procedure for formulating policies regarding remuneration of Directors, supervisors and senior management of the Group. Details of the remuneration of the Directors and supervisors of the Company for the year ended 31 December 2017 are set out in note (X) 7 to the consolidated financial statements.
DISCLOSURES OF DIRECTORS AND SUPERVISORS PURSUANT TO RULE 13.51B(1) OF THE HONG KONG LISTING RULES
In 2017, after having made all reasonable enquiries, the Company is not aware of any information which is required to be disclosed pursuant to Rule 13.51B(1) of the Hong Kong Listing Rules.
REMUNERATION COMMITTEE
The Company has established the Remuneration Committee and set out its specific Terms of Reference. As at 31 December 2017, the Remuneration Committee comprises two independent non-executive Directors, namely Mr. Bai Yanchun and Mr. Cheng Gordon, and one non-executive Director, namely Mr. Yuan Honglin, with Mr. Bai Yanchun as the chairman. The majority of members of the Remuneration Committee are independent non-executive Directors.
The roles and functions of the Remuneration Committee are set out in its Terms of Reference and Operation Rules. Its primary functions include: to make recommendations to the Board on the remuneration policy and structure for all Directors and the senior management and to establish transparent procedures for developing such remuneration policy; to make recommendations to the Board on the remuneration packages of individual executive and non-executive Directors and the senior management; and to ensure that no Director or any of his/her associates will participate in deciding his/her own remuneration.
The primary goal of the Company’s remuneration policy on executive Directors’ packages is to enable the Company to retain and motivate executive Directors by linking their remuneration with performance and measured against corporate objectives. The remuneration policy of the Company for non-executive Directors is to ensure that they are sufficiently compensated for their efforts and time dedicated to the Company. In determining guidelines for each element of the remuneration package, the Company refers to the remuneration surveys conducted by independent external consultants on companies operating in similar businesses.
In order to motivate the senior management of the Company in an effective and reasonable way so that they can maximize the value for the shareholders and the Company, the Remuneration Committee has taken into account the market-oriented principles including the determination of remuneration based on the performance, responsibilities, faults and attitude, the enhancement of rewards and punishment, the comparison with similar overseas and domestic listed companies in the industry, and consideration of granting special awards regarding the special projects and contributions, as well as referring to the advice from the professional intermediaries.
The Remuneration Committee held one meeting for the year ended 31 December 2017, and the matters considered therein included proposed to adjust remuneration of the several Directors and proposed to determine remuneration of senior management. The attendance records are set out under “Directors’ Attendance Records” on page 44.
AUDIT COMMITTEE
The Terms of Reference and Operation Rules of the Audit Committee are based primarily on “A Guide for Effective Audit Committees” issued by the Hong Kong Institute of Certified Public Accountants. It is mainly responsible for assisting the Board in reviewing the financial information and reporting process, risk management and internal control systems, effectiveness of the internal audit function, scope of audit and appointment of external auditors, and arrangements to enable employees of the Company to raise concerns about possible improprieties in financial reporting, internal control or other matters of the Company.
The Audit Committee provides an important link between the Board and the Company’s auditors in matters falling within the Group’s scope of the audit.

47China Molybdenum Co., Ltd.
CORPORATE GOVERNANCE REPORT
The Audit Committee has reviewed the effectiveness of the external audit and internal controls, evaluated risks, and provided comments and advice to the Board. As at 31 December 2017, the Audit Committee comprises two independent non-executive Directors, namely Mr. Xu Shan and Mr. Cheng Gordon, and one non-executive Director, namely Mr. Yuan Honglin, with Mr. Xu Shan as the chairman of the Committee. The Audit Committee has reviewed with the management and external auditors, the audited consolidated results of the Group for the year ended 31 December 2017, according to the accounting principles and practices adopted by the Group, and discussed auditing, internal controls and financial reporting matters.
The main duties of the Audit Committee are set out in its Terms of Reference, including the following:
• To review the consolidated financial statements and reports and consider any significant or unusual items raised by the qualified accountant or external auditors submitted to the Board;
• To be acquainted with the work performed by the external auditor, their fees and terms of engagement, in order to review the relationship between the Company and the external auditor, and to make recommendations to the Board on the appointment, re-appointment and removal of external auditors;
• To review the adequacy and effectiveness of the Company’s financial reporting system, internal control system and risk management system and associated procedures;
• To review the drafts of annual report, including reports submitted by the general manager and the management;
• To supervise Directors to ensure that they perform annual review in respect of adequacy of resources, qualifications and experience of staff of the Company’s accounting and financial reporting function, the training programmes of the staff and the budget;
• To review the audit activities with external auditors and internal auditors, the internal auditors shall specify the important issues and results which the Committee shall know or pay attention to. To prepare such review, the internal auditor will provide internal audit reports or report summaries of the Group to members of the Committee through the secretary of the Committee when necessary. Report on the activities of the Committee in each financial year will also be submitted to the Board;
• To communicate with executive Directors, other executives or employees, external auditors and internal auditors without any restrictions. External auditors and internal auditors are entitled to consult the Committee without notifying the management. The Committee is also entitled to consult the external auditors and internal auditors without notifying the management or to consult the management without notifying the external auditors and internal auditors;
• To review arrangements for employees to raise concerns about possible improprieties in financial reporting; and
• To perform corporate governance functions set out in the code provision D.3.1 of the Corporate Governance Code.
The Audit Committee supervises the risk management and internal control systems of the Company, reports to the Board on any material issues and makes recommendations to the Board.
For the year ended 31 December 2017, the Audit Committee reviewed the annual results for the year ended 31 December 2016, the results for the first quarter ended 31 March 2017, the results for the interim period ended 30 June 2017 and the results for the third quarter ended 30 September 2017. The Audit Committee also considered the financial reporting and compliance procedures, the report from the management on the review and processes of Company’s internal control and risk management systems and the re-appointment of the external auditors. In addition, the Audit Committee actively performed corporate governance functions, and reviewed the content under the code provision D.3.1 of the Corporate Governance Code.
48 2017 Annual Report
CORPORATE GOVERNANCE REPORT
The Audit Committee held five meetings for the year ended 31 December 2017, and the attendance records are set out under “Directors’ Attendance Records” on page 44. For the year ended 31 December 2017, the Audit Committee also met the external auditors twice without the presence of the executive Directors.
NOMINATION COMMITTEE
The Company has established the Nomination Committee and set out its specific Terms of Reference. As at 31 December 2017, the Nomination Committee comprises four Directors, including three independent non-executive Directors, namely Mr. Bai Yanchun, Mr. Xu Shan and Mr. Cheng Gordon, and one executive Director, Mr. Li Chaochun. Mr. Bai Yanchun and Mr. Li Chaochun act as the chairman and the vice chairman of the Nomination Committee respectively, and the independent non-executive Directors account for more than a half of members of the Nomination Committee.
The roles and functions of the Nomination Committee are set out in its Terms of Reference and Operation Rules, and it is mainly responsible for advising the Board as to the scale, structure, and composition (including skills, knowledge, experience and terms of office) of the Board in light of the business activities, size of assets, shareholding structure and the policy on Board diversity of the Company, researching on the criteria and procedures for the selection or appointment of Directors, the general manager and other senior management members and making recommendations to the Board. It is also responsible for extensively seeking suitable candidates for Directors and general manager and making recommendations to the Board, advising the current session of the Board as to the candidates for the next session of the Board during elections of members for the next session of the Board, advising the Board as to the appointment of candidates electing for general manager upon expiry of the term of office of the general manager, evaluating the work progress of Directors, the general manager and other senior management members and providing advice or recommendations on the change of Directors, the general manager or other senior management members with reference to the results of evaluation as and when necessary, and assessing the independence of independent non-executive Directors.
For the year ended 31 December 2017, the Nomination Committee held one meeting to evaluate and review the composition and validity of the Board of the Company. The Nomination Committee found no material issues during the review period. The attendance records are set out under “Directors’ Attendance Records” on page 44.
The Company adopted a policy on board diversity. All appointments to the Board will be made on a merit basis.
The Nomination Committee reviews and evaluates the composition of the Board, makes recommendations to the Board in relation to the appointment of new directors of the Company, as well as monitors the conduct of annual review on the effectiveness of the Board. When reviewing and evaluating the composition of the Board, the Nomination Committee will follow the board diversity policy to consider from a number of aspects the benefit of diversity, including but not limited to gender, age, cultural and educational background, ethnicity, professional experience, skills, knowledge and length of service, in order for the Board to maintain appropriate and balanced talent, skill, experience and background. In recommending candidates for appointment to the Board, the Nomination Committee will consider candidates on merit against objective criteria and with due regard for the benefit of diversity in the Board. In monitoring the effectiveness of the annual review of the Board, the Nomination Committee will consider the balance of talents, skills, experience, independence and knowledge on the Board and its diversity representation.
The Nomination Committee will discuss and agree on annually all measurable objectives for implementing diversity on the Board and recommend them to the Board.
STRATEGIC COMMITTEE
The Strategic Committee is responsible for formulating the overall development plans and investment decision-making procedures of the Group. The current members of Strategic Committee comprise two executive Directors, namely Mr. Li Chaochun and Mr. Li Faben, and one independent non-executive Director, Mr. Bai Yanchun, and one non-executive Director, Mr. Yuan Honglin, with Mr. Li Chaochun as the chairman of the Committee. For the year ended 31 December 2017, the Strategic Committee held one meeting. The attendance records are set out under “Directors’ Attendance Records” on page 44.

49China Molybdenum Co., Ltd.
CORPORATE GOVERNANCE REPORT
CORPORATE GOVERNANCE FUNCTIONS
The Audit Committee is responsible for performing the functions of corporate governance.
As at 31 December 2017, the Audit Committee has reviewed the Company’s corporate governance policies and practices, training and continuous professional development of Directors and senior management, the Company’s policies and practices on compliance with legal and regulatory requirements, the compliance of the Model Code and Employees Written Guidelines, and the Company’s compliance with the Corporate Governance Code and disclosure in this Corporate Governance Report.
SUPERVISORY COMMITTEE
As at 31 December 2017, the Supervisory Committee of the Company comprises three members, namely Ms. Kou Youmin (chairperson), Mr. Zhang Zhenhao and Ms. Wang Zhengyan. The Supervisory Committee is responsible for exercising supervision over the Board and its members and the senior management; and preventing them from abusing their power and authorities and jeopardizing the legal interests of the shareholders, the Company and its employees. For the year ended 31 December 2017, the Supervisory Committee held six meetings to review the financial positions and the internal control of the Company and adhered to the principle of good faith and proactively carried out various work.
The terms of office of supervisors of the Company (including staff representative supervisor) commence from the date on which the resolutions in relation to appointment/re-election are passed until the conclusion of the annual general meeting of the Company to be convened in 2018 and are subject to re-election by rotation.
Pursuant to the Articles of Association, all supervisors of the Company shall retire from office by rotation at least once every three years. The shareholder representative shall be elected at general meetings, and the staff representative shall be elected democratically by the employees of the Company. On 19 January 2015, Mr. Deng Jiaoyun resigned as staff representative supervisor. On the same day, Ms. Wang Zhengyan was elected as the staff representative supervisor of the Company at the staff representatives’ meeting. The fourth session of the Supervisory Committee of the Company was jointly formed by Ms. Wang Zhengyan together with two shareholder representative supervisors, namely Ms. Kou Youmin and Mr. Zhang Zhenhao, elected at the annual general meeting of the Company in 2015.
ACCOUNTABILITY AND AUDIT
Directors’ Responsibi l i t ies for Financial Reporting in Respect of Financial Statements
The Directors acknowledged their responsibilities for preparing the consolidated financial statements of the Company for the year ended 31 December 2017.
The Board is responsible for presenting a balanced, clear and understandable assessment of annual and interim reports, inside information announcements and other disclosures required under the Hong Kong Listing Rules and other regulatory requirements.
The senior management provides explanations and information to the Board for approval so as to enable the Board to make an informed assessment and to consider and approve the financial information and position of the Company.
The statement of the independent auditors of the Company about their reporting responsibilities on the consolidated financial statements is set out in the Auditor’s Report on page 83 to page 86.

50 2017 Annual Report
CORPORATE GOVERNANCE REPORT
INTERNAL CONTROL AND RISK MANAGEMENT
The Board has overall responsibility for maintaining the soundness and effectiveness of the internal control system and risk management procedures of the Group, including setting up a management structure and its terms of reference to ensure efficient and effective use of the Group’s resources to assist the Group in achieving its operation objectives, safeguarding the Group’s assets against any unauthorized use or disposal and ensuring an appropriate maintenance of relevant records.
The Board acknowledges that it is responsible for the risk management and internal control systems and liable to review the effectiveness of such systems. Such systems are designed to manage rather than eliminate the risk of failure to achieve business objectives, and can only provide reasonable and not absolute assurance against material misstatement or loss.
The Board maintains on-going supervision over the risk management and internal control systems of the Company through the Audit Committee, and has reviewed the effectiveness of such systems during 2017. The said review covered all material controls, including financial, operational and compliance controls.
The Board is of the opinion that the Company has adequate resources, staff qualifications, experience and training programmes as well as the relevant budget in terms of accounting, internal audit and financial reporting.
In 2017, the Audit Committee has reviewed the following matters:
• the changes, since the last annual review, in the nature and extent of significant risks, and the Company’s ability to respond to changes in its business and the external environment;
• the scope and quality of management’s ongoing monitoring of risks and the internal control systems, and the work of its internal audit function and other assurance providers;
• significant control failings or weaknesses that have been identified during the period, and the extent to which they have resulted in unforeseen outcomes or contingencies that have had, could have had, or may in the future have, a material impact on the Company’s financial performance or condition; and
• the effectiveness of the Company’s processes for financial reporting and compliance of the Hong Kong Listing Rules.
Deloitte Touche Tohmatsu Certified Public Accountants LLP (Special General Partnership) has been appointed to review the effectiveness of internal control in relation to the financial report of the Company for the year ended 31 December 2017 in accordance with relevant requirements under the Corporate Internal Control Audit Guidelines and the China Code of Ethics for Certified Public Accountants. Its responsibilities are to express an audit opinion on the effectiveness of internal control over the financial report after conducting an audit, and to disclose the material defects that have come to its attention in the internal control over non-financial reports. Deloitte Touche Tohmatsu Certified Public Accountants LLP (Special General Partnership) is of the view that the Company has maintained effective internal control over the financial report in all material aspects in the year ended 31 December 2017 in accordance with the Basic Rules for Corporate Internal Control and relevant requirements.
The Board evaluates the effectiveness of internal control system once a year. In 2017, the Company completed internal control self-assessment report for 2017. The Board has evaluated and validated the risk management and internal control system of the Group and has not found any violation of laws, regulations and rules or any significant deficiency in compliance monitoring and risk management or any major mistake. The Board considers the risk management and internal control system of the Group is effective.

51China Molybdenum Co., Ltd.
CORPORATE GOVERNANCE REPORT
Details of the Audit Report on Internal Control issued by Deloitte Touche Tohmatsu Certified Public Accountants LLP (Special General Partnership) and the Internal Control Self-Assessment Report for 2017 of the Company had been published on the websites of the SSE, the Stock Exchange and the Company on 29 March 2018.
The internal control system of the Group is designed to facilitate effective and efficient operations, to ensure reliability of financial reporting and compliance with applicable laws and regulations, to identify and manage potential risks and to safeguard assets of the Group. The internal control system established by the Group for the purposes of risk management and control, together with internal audit and findings in the operation and management, and with reference to audit findings by external auditors, can be used to comprehensively recognize, evaluate and supervise material risks that the Group faces, including operation and decision-making risk, financial management and control risk and the risks resulted from the changes of operating environment. The internal auditors and senior management shall evaluate operational controls and risk management on a regular basis and report to the audit committee on any findings concerning internal control and risk management. The audit committee supervised the implementation of various rectification measures, and the rectification work was in line with expectations after subsequent tracking and checking.
DEAL WITH AND PUBLISH INSIDE INFORMATION
The Company has formulated a policy regarding dealing with and publishing inside information, which specifies the procedures of and internal control over dealing with and publishing inside information to deal with and publish inside information in due course, without leading to place any person in a privileged position in security transactions. The inside information policy also provides guidance to the employees of the Group to ensure appropriate measures were put in place and prevent from contravening the disclosure requirements as stipulated in laws and Hong Kong Listing Rules by the Company. The Company establishes appropriate internal control and reporting system to identify and evaluate potential inside information. Pursuant to the requirements of Hong Kong Listing Rules, the Company publishes the relevant information relating to inside information on the websites of SSE, the Stock Exchange and the Company.
AUDITORS’ REMUNERATION
For the year ended 31 December 2017, the remuneration paid to the auditors of the Company, Deloitte Touche Tohmatsu Certified Public Accountants LLP (Special General Partnership) are set out below:
Types of servicesRemuneration
paid/to be paidRMB Thousand
Annual audit service 5,000Internal control and audit 0
Note:
1. The signing accountants for the annual audit of the Company: Yang Haijiao and Zhao Bin. Yang Haijiao has provided auditing services to the Company since July 2017 and Zhao Bin has provided auditing services to the Company since July 2014.
2. The costs for financial audit and internal control audit of Deloitte Touche Tohmatsu Certified Public Accountants LLP (Special General Partnership) amounted to RMB5 million.
COMMUNICATIONS WITH SHAREHOLDERS AND INVESTOR RELATIONS
The general meetings of the Company provide a forum for communication between the shareholders and the Board. The Chairman as well as chairmen of the Audit Committee, Remuneration Committee, Nomination Committee and Strategic Committee shall attend the forthcoming annual general meeting to answer questions of the shareholders.
The Company will convene the annual general meeting (“AGM”) on 25 May 2018 and the notice of the forthcoming AGM was despatched to the shareholders of the Company on 9 April 2018 in accordance with the requirements of the Hong Kong Listing Rules and Articles of Association. A circular which sets out details of the business to be conducted at the AGM will be despatched to the shareholders of the Company soon.
The Company is committed to disseminating important information regarding the Group to the public. To facilitate effective communication, the Company set up the website www.chinamoly.com which sets out the information and updates relating to the Company’s business development and operation as well as financial information and other information available for public inspection.

52 2017 Annual Report
CORPORATE GOVERNANCE REPORT
SHAREHOLDERS’ RIGHTS
To safeguard the shareholders’ interests and rights, separate resolutions are proposed at shareholders’ meetings on each substantial issue (including the election of individual Directors).
All resolutions put forward at a general meeting will be taken by poll pursuant to the Hong Kong Listing Rules and the poll results will be posted on the websites of the Company, the Stock Exchange and the SSE after the general meeting.
C O N V E N I N G A N E X T R A O R D I N A R Y G E N E R A L M E E T I N G B Y SHAREHOLDERS
Shareholders either individually or collectively holding more than 10% of the shares of the Company may, through signing one or more copies of requisition(s) in the same form and content stating the topics to be discussed at the meeting, require the Board to convene an extraordinary general meeting or a class meeting. The Board shall, in accordance with the laws, administrative regulations and Articles of Association, furnish a written reply stating its agreement or disagreement to the convening of an extraordinary general meeting within ten days after receiving aforesaid written requisition(s).
In the event that the Board agrees to convene an extraordinary general meeting, the notice of the general meeting shall be issued within five days after the passing of the relevant resolution of the Board. Any change to the original proposal made in the notice requires prior approval of the shareholders concerned.
In the event that the Board does not agree to convene an extraordinary general meeting or does not furnish any reply within 10 days after receiving such requisition(s), shareholders individually or collectively holding 10% or more of the Company’s shares shall be entitled to propose to the supervisory committee to convene the extraordinary general meeting, provided that such proposal shall be made in writing.
In the event that the supervisory committee agrees to convene an extraordinary general meeting, the notice of the general meeting shall be issued within five days after receiving such proposal. Any changes to the original proposal made in the notice shall require prior approval of the shareholders concerned.
Failure of the supervisory committee to issue the notice of the general meeting within required time frame shall be deemed as failure of the supervisory committee to convene and preside over a general meeting, in which case, shareholders individually or collectively holding 10% or more of the Company’s shares for 90 consecutive days or more may convene and preside over the meeting on his/her/their own.
Where the supervisory committee or shareholders decide(s) to convene the general meeting by itself/themselves, it/they shall send out a written notice to the Board, and shall file with the dispatched office of the CSRC at the locality of the Company and the stock exchange. The shareholding of the convening shareholders shall not be lower than 10% prior to the announcement of the resolutions of the general meeting. The supervisory committee or the convening shareholders shall submit relevant evidence to the dispatched office of the CSRC at the locality of the Company and the stock exchange upon the issuance of the notice of general meeting and the announcement of the resolutions of the general meeting.

53China Molybdenum Co., Ltd.
CORPORATE GOVERNANCE REPORT
PUTTING FORWARD PROPOSALS AT GENERAL MEETINGS
When the Company convenes a general meeting, the Board, supervisory committee or the shareholders either individually or collectively holding 3% or more of the Company’s shares may put forward proposals to the Company.
Shareholders either individually or collectively holding 3% or more of the Company’s shares may submit their provisional motions to the convener 10 days before the date fixed for convening of the meeting. The convener shall issue a supplementary notice of the general meeting two days after the motions have been received and announce the name of the shareholder submitting the provisional motions, shareholding percentage and the contents of the motions.
The Company announced the Notice of Convening the 2017 First Extraordinary General Meeting of China Molybdenum Co., Ltd., Announcement of Postponement of the 2017 First Extraordinary General Meeting of China Molybdenum Co., Ltd. and Announcement of Additional Resolutions for the 2017 First Extraordinary General Meeting of China Molybdenum Co., Ltd. on 26 January, 25 February and 31 March 2017, respectively. On 30 March 2017, Cathay Fortune Corporation, a shareholder held a total of 31.58% share of the Company, proposed to submit the Resolution in relation to introducing new shareholders to BHR Newwood Investment Management Limited for the investment cooperation in the Tenke Fungurume mining area considered and approved at the 19th extraordinary meeting of the fourth session of the Board of the Company and the Resolution in relation to “Profit distribution plan for the year 2016” of the Company considered and approved at the 9th meeting of the fourth session of the Board of the Company as additional resolutions for consideration at the 2017 first extraordinary general meeting of the Company. The above resolutions have been considered and approved at the 2017 first extraordinary general meeting.
The Company announced the Notice of Convening the 2016 Annual General Meeting, the 2017 First A Share Class Meeting and the 2017 First H Share Class Meeting of CMOC and Announcement of Additional Resolutions for the 2016 Annual General Meeting of China Molybdenum Co., Ltd. on 12 May and 8 June 2017, respectively. On 6 June 2017, Cathay Fortune Corporation, a shareholder held a total of 31.58% share of the Company, proposed to submit the Proposal in Respect of the Company’s Compliance with the Conditions of the Public Issuance of Corporate Bonds, the Proposal in respect of the Plan for the Public Issuance of Corporate Bonds and the Proposal in respect of Seeking Full Authorization From The Shareholders’ Meeting Of The Company To The Board Of Directors To Deal With the Matters Relating to the Public Issuance of the Corporate Bonds considered and approved at the 24th extraordinary meeting of the fourth session of the Board of the Company as additional resolutions for consideration at the 2016 annual general meeting of the Company. The above resolutions have been considered and approved at the 2016 annual general meeting.
Save for the circumstances referred to in the preceding paragraph, after the convener has issued the notice on the general meeting, no change shall be made to the motions listed in the notice of the meeting nor new motions shall be added.
The general meeting shall not vote on or resolve motions not listed in the notice of the general meeting or motions which do not meet the following requirements:
Content of proposals at the shareholders’ general meeting shall be matters falling within the functions and powers of general meeting. It shall have definite topics to discuss and specific matters to resolve and comply with the laws, administrative regulations and the requirements in the Articles of Association.

54 2017 Annual Report
CORPORATE GOVERNANCE REPORT
SHAREHOLDERS’ ENQUIRIES
Enquiries about Shareholdings
Shareholders should direct their enquiries about their shareholdings to the Office of the Board at the Company’s principal place of business in the PRC (for holders of A shares) or at the H share registrar of the Company, Computershare Hong Kong Investor Services Limited (for holders of H shares).
The address and contact details of the Company’s principal place of business in the PRC are as follows:
North of YiheHuamei Shan RoadChengdong New DistrictLuanchuan CountyLuoyang CityHenan ProvinceThe People’s Republic of ChinaTelephone No.: (+86) 379 6865 8017Facsimile No.: (+86) 379 6865 8030
The address and contact details of the H share registrar of the Company, Computershare Hong Kong Investor Services Limited, are as follows:
17M FloorHopewell Centre183 Queen’s Road EastWanchaiHong KongTelephone No.: (+852) 2862 8555Facsimile No.: (+852) 2865 0990/(+852) 2529 6087
ENQUIRIES ABOUT CORPORATE GOVERNANCE OR OTHER MATTERS TO BE PUT TO THE BOARD AND THE COMPANY
The Company will not normally deal with verbal or anonymous enquiries. Shareholders may send written enquiries to the Company, for the attention of the office of the Board, by email: [email protected], fax: (+86) 379 6865 8030, or mail to North of Yihe, Huamei Shan Road, Chengdong New District, Luanchuan County, Luoyang City, Henan Province, the People’s Republic of China (Attention: Mr. Yue Yuanbin). Shareholders may call the Company at (+86) 379 6865 8017 for any assistance.
Note: Shareholders’ information may be disclosed as required by law.
CONSTITUTIONAL DOCUMENTS
The latest Articles of Association of the Company are available on the websites of the SSE, the Stock Exchange and the Company.
In view of the completion of the non-public issuance of A shares of the Company on 24 July 2017, in accordance with the requirements under the Company Law of the PRC, the Rules Governing the Listing of Shares on the Shanghai Stock Exchange and the Guidelines for Articles of Association of Listed Companies promulgated by the China Securities Regulatory Commission, and to reflect the current situations of the Company, The Board proposed to submit a special resolution regarding the amendments to the Articles of Association at the next general meeting of the Company. The special resolution is subject to Shareholders’ approval. For details of the proposed amendments to the Articles of Association, please refer to the announcement of the Company dated 26 August 2017. The Company will despatch a circular containing details of the proposed amendments to the Articles of Association to the shareholders of the Company in due course.
55China Molybdenum Co., Ltd.
REPORT OF THE BOARD OF DIRECTORS
Dear Shareholders,
The Directors of the Company are pleased to present their 2017 annual report and the audited consolidated financial statements of the Company for the year ended 31 December 2017.
ESTABLISHMENT OF THE COMPANY
The Company was incorporated in the PRC on 25 August 2006 as a joint stock limited company in preparation for the listing of the Company’s shares on the Stock Exchange. Details are set out in the H share prospectus of the Company dated 13 April 2007.
On 26 April 2007, the Company completed its initial public offering of H shares and the H shares of the Company were successfully listed on the Stock Exchange.
On 24 September 2012, the Company completed its initial public offering of A shares. On 9 October 2012, the A shares of the Company were successfully listed on the SSE.
PRINCIPAL ACTIVITIES
(I) Principal Businesses
The Company which is in the non-ferrous metal mining industry primarily engages in the mining and processing, smelting, deep processing and scientific research of copper, molybdenum, tungsten, cobalt, niobium, Phosphate and other base and precious metals, with a relatively complete and integrated industry chain. It represents one of the top five molybdenum producers and one of the largest tungsten producers in the world. It is also the second largest cobalt and niobium producer and the leading copper producer in the world as well as the second largest phosphate fertilizer producer in Brazil. While solidifying and improving the existing advantages in the industry, the Company is dedicated in investing in and integrating high-quality resources projects on a global scale as well as developing it into an internationalized resources company equipped with global vision and in-depth industrial consolidation capability by leveraging on its advanced management philosophy and team advantages.
(II) Business Model
The Company adopts a business model of centralized operation and division of management for the businesses that the Company is currently operating. Besides, the Company has been striving to seek for investment on the projects of periodically emerging resources in a global scale. The specific business models for its operations are as follow:
1. Procurement model
The Company adopts a tendering system for businesses in large quantities and size, and for those below the requirements for tendering, the Company adopts a system of centralized price competition and separate hearings, resulting in a system that allows centralized procurement, division of responsibilities and a multi-layered supply chain. In particular, the sodium cyanide used as mining blasting equipment and ore dressing agents is a special commodity under governmental regulation, the trading of which is subject to a licensing system. Within the scope permitted by the laws and regulations, the Company could carry out designated procurement of this class of materials.

56 2017 Annual Report
REPORT OF THE BOARD OF DIRECTORS
2. Production model
A large-scale, batch-based and continual production model is adopted. Moreover, the production plan is formulated and the best level of output is decided in line with the service life of the reserves of mines and on the basis of the market research.
3. Sales model
Principal products of the Company include molybdenum, tungsten, copper, niobium, phosphate and other related products, wherein:
(1) The direct sales model of “manufacturer – consumer” has been mainly adopted in molybdenum, tungsten and related products, with the indirect sales model of “manufacturer – third party dealer – consumer” as the auxiliary;
(2) The principal copper and cobalt products are electrolytic copper, copper concentrate and cobalt hydroxide. Electrolytic copper is generally sold to commodity traders including Trafigura Group and copper smelting plants, while cobalt hydroxide is mainly sold to the Freeport Cobalt in Finland and cobalt smelting plants in China;
(3) The niobium product is mainly sold to enterprise users who operate with a certain size. The Company has established an end user-oriented marketing strategy of direct selling aiming at different client bases from Europe, Asia and the North America; and
(4) The major clients of its phosphate products are fertilizer mixers who mix the Company’s phosphate fertilizer with other auxiliary materials according to different formulas to produce mixed fertilizers and sell them to the end customers.
(III) Industry Overview
1. Molybdenum industry
The Company is one of the top five molybdenum producers in the world and mainly targets the domestic market. The price trend of molybdenum products is generally subject to the following factors: economic developments, supply and demand relations, speculations and emergencies. Since molybdenum is mostly consumed by the iron and steel industry, the fluctuations in the price of molybdenum are closely tied to the steel market. Hit by the global financial crisis in 2008, the steel output that underpins molybdenum demand plunges, causing the already sluggish stainless steel market to further shrink. Moreover, due to the commencement of production of new domestic and overseas molybdenum mines, the supply in molybdenum industry kept ramping up and the overcapacity in the industry worsened. As a result, transactions in the molybdenum market were lukewarm, and the molybdenum price in the international market suffered continuous tumbles. Since 2009, the molybdenum price has been weak and in the down-going channel, waving and oscillating within a narrow band. In 2016, amid the supply-side reform introduced by China, domestic mining enterprises with high cost and low efficiency capacities were shut down or urged to cut production. Coupled with tightening and normalized environmental protection inspection, the overcapacity on the supply side was gradually phase out from the market. In 2017, affected by the supply-side reform in iron and steel industry and the normalization of environmental protection inspection, industrial restructuring and product upgrading was accelerated, improving the expectation for the supply and demand for downstream high-end steel. As a result, the Company’s operating environment has been improved and molybdenum demand has been increased gradually.

57China Molybdenum Co., Ltd.
REPORT OF THE BOARD OF DIRECTORS
2. Tungsten industry
The Company is the largest scheelite producer in the world. The Sandaozhuang Mine which is currently under mining is the largest uni-tungsten mine under operation in the PRC. China, as the largest producer of tungsten in the world, contributes to over 80% of the global supply. In recent years, the tungsten industry, in which the Company operates, has long been in the overcapacity with greater supply than demand and destocking, and the tungsten market remains a downturn under the pressure of weak demand and difficulties in stock clearance. As the market price dived below the cost line, some mining enterprises stopped or downsized output, leading to a decline in the total capacity supplying the market. Since 2017, tungsten mines have been out of production due to tightening environmental protection and security inspection, and downstream plants have been digesting stocks. So tungsten concentrate market will see another tight supply situation. Meanwhile, with the recovery of overseas economies and the steady growth of the domestic economy, the exports of tungsten products increased significantly year-on-year. Many industries including mining, mechanical processing, construction and chemicals have seen increased demand for cemented carbide and tungsten chemical products. Therefore, tungsten price is expected to have another upward trend.
3. Copper industry
The Company is a leading copper producer in the world. As one of the important raw materials of basic industries, copper with both industrial and financial traits is indispensable for industrial production and people’s daily lives. Among the non-ferrous materials, copper only lags behind aluminum in terms of consumption. From the view of major consumption areas, the United States, Japan and Western Europe are the three traditional consuming regions and maintain steady consumption levels. From 2011 to 2015, copper price kept declining and the industry had a severe loss, leading to a slowdown in the construction of copper mines in recent years. Currently, amid the protruding of aging trend in global mines, around half of copper mines’ ages have been over 50 years. Among the largest seven mines in the world, even four mines’ mining ages have been over 70 years. Due to the long mining period, mining grade has decreased gradually year by year. Copper consumption from downstream plants shows a stable pattern but sees a significant increase from new energy automobile industry, which will become a new growth point in the downstream consumption. With the global economy recovering, Trump’s Infrastructure Plan is expected to bring a substantial increase in copper demand in the United States. Meanwhile, new emerging economies led by India will enter into a consumption peak stage for copper. Copper price has kept increasing since the mid-2016. With economies stabilizing in China, the United States and Europe, the infrastructure investment in India and countries along the Belt and Road becoming new growth field for copper demand and the global economy recovering, copper saw a new round of price rise in July 2017. In the next several years, new capacity will put into production, but it will not have a big effect on the entire pattern of supply and demand due to its small scale. Besides, with a new round of consumption arising, the overcapacity will continue to be shrunk. The year of 2018 is still the labor bargaining year, so the mainstream copper price will climb up further.

58 2017 Annual Report
REPORT OF THE BOARD OF DIRECTORS
4. Cobalt industry
The Company is the second largest producer of cobalt. According to the 2017 statistics of the USGS, the global proven reserve of terrestrial cobalt resources was approximately 7.1 million tonnes in 2016, and was highly distributed in the DRC, Australia and Cuba. Among them, the DRC had a cobalt reserve of 3.4 million tonnes in 2016, accounting for 47.9% of the total cobalt reserve in the world, ranking the first in the world. For a long time, cobalt minerals or cobalt compounds were always used as glaze of ceramics, glass and enamel. Since the 20th century, cobalt and its alloys have been widely used in industrial sectors such as motors, machinery, chemicals and aerospace. In addition, it has become a strategic metal with the consumption increasing year by year. Cobalt is one of the most common metal materials for lithium battery anodes. Lithium cobaltate, which is made of lithium carbonate and cobalt oxide, is the most commonly used high energy battery cathode material. Currently, about 60% of total cobalt consumption is from battery materials. In the future, cobalt capacity expansion projects will mainly come from Glencore and Eurasian Natural Resources Corporation, including: the phase I project of Glencore’s Katanga Mine is expected to start production in 2018, while Eurasian Natural Resources Corporation is expected to release its new capacity from 2019. With the continuous promotion of ternary materials, cobalt consumption will continue to increase. Currently, most investment is put into the construction of smelters, so the shortage of cobalt products will cause a tight supply for cobalt ores. Benefiting from the rapid development of new energy vehicles and the demand for ternary batteries as well as the influence of cobalt storage policy in China, cobalt stocks in the market is gradually decreasing, with the price rising from RMB270,000/tonne at the end of 2016 to RMB534,000/tonne at the end of 2017, representing an increase of 97.8%. Stimulated by expected demand, cobalt price has increased significantly.
5. Niobium industry
The Company is the second largest niobium producer in the world. The price of niobium is mainly affected by the supply of raw material of niobium ore. The market of niobium is highly concentrated in the world. Brazil's CBMM, an industry leader, occupying 80% to 85% of the global output, has the absolute dominant position in the industry and has a strong influence on the price trend of niobium. Meanwhile, CBMM sets the pace of global output expansion for niobium products, so niobium price has kept relatively stable in history. Niobium is one of the indispensable raw materials for high-quality steel with few alternatives and its low proportion in the costs of iron and steel production given the small amount of niobium used therein contribute to the low price elasticity of ferroniobium supply and its relatively stable price. In 2017, with the continuous recovery of the steel industry, the demand for antimony continued to increase, and the price of antimony was strongly supported.
6. Phosphate industry in Brazil
The Company is the second largest fertilizer producer in Brazil, which is one of the major producers and exporters of agricultural products (including soy, corn, sugar cane, coffee, oranges, beef and chicken, etc.) in the world. Due to strong demand for fertilizers, the Brazil is the fourth largest fertilizer consumer in the world, and its annual consumption is far beyond its domestic output. MAP and SSP are major high- and low-concentrated phosphate fertilizer products respectively in the Brazilian market, though its phosphate ore reserves are not rich and such ores have relatively low contents of P2O5. Therefore, it needs to import a large amount of fertilizer products from Russia, the United States, China and other countries. To encourage the development of agriculture and related industries, the federal government and state governments of Brazil introduce favorable tax policies to fertilizer producers. Considering the rapid development of Brazil’s agriculture, there will be a steady growth in the demand for phosphate fertilizer in the next few years. The Company owns two phosphate plants located in the agricultural center of Brazil, with obvious geographical advantages, making the company one of the producers with lowest production costs in these important areas.

59China Molybdenum Co., Ltd.
REPORT OF THE BOARD OF DIRECTORS
BUSINESS REVIEW
According to the Schedule 5 of the Companies Ordinance of Hong Kong (Chapter 622 of The Laws of Hong Kong), discussion and analysis were made including the business review for the year ended 31 December 2017 and discussion on business development in the future which are described on the section headed “Business Review and Prospects” on page 18 to page 20 of this annual report. While description of principal risks and uncertainties facing by the Group can be found in different parts of this annual report, including the descriptions under the section headed “Risk Warning” on page 38 to page 40. Analysis using financial key performance indicators is described in the section headed “Management Discussion and Analysis” on page 21 to page 30 of this annual report. The above discussion form part of in the Report of the Board of Directors.
ENVIRONMENTAL PROTECTION POLICIES AND PERFORMANCE
Regarding the collective environmental protection policy and performance, the Company maintains its advanced production in the industry while adhering to the philosophy of “environmental protection goes first with green development”, in building itself into a resource-saving and eco-friendly company. It takes the harmonious development of energy business and environment as a critical responsibility of the Company and a priority in production and operation, and follows through the green mining concepts of resource saving, eco-friendliness and harmonious mining field in establishing its cultural system. It conscientiously implements the guidelines and policies of environmental protection, comprehensively builds up safe and eco-friendly environmental protection engineering and supporting facilities that are beneficial to water and soil conservation as well as recovery and management of mine ecosystem, tracks and supervises the construction of “simultaneous design, simultaneous construction and simultaneous commencement of usage” in environmental protection engineering, maintain strict control over construction, and ensures “not to commence operation without satisfactory acceptance”. Production and operation projects are comprehensively implemented with energy saving and emission reduction and pollution prevention measures to ensure long-term and stable operation in compliance with relevant standards. The Company insists on the development principle of “ecological development, scientific usage and cyclic economy”, actively adopts advanced technology, advanced process, advanced equipment, and endeavors to improve efficient use of resources and the level of discharge recycling and reuse. It promotes clean production, improves the system of energy saving and emission reduction, and practically steps up the reduction of pollutant emissions. It endeavors to promote its ability of environment management, and strives for the sustainable development of environmental protection.
The Company prepared the 2017 Environmental, Social and Governance Report of China Molybdenum Co., Ltd, i.e. the 2017 Social Responsibility Report (hereinafter referred to as the “Report”), pursuant to the Environmental, Social and Governance Reporting Guide issued by the Stock Exchange in December 2015, and the Environmental Information Disclosure Guide for Listed Companies issued by the SSE in May 2008, and disclosed it separately. The Report gives true information of the CMOC in terms of environmental, social and governance activities. All information in the Report are derived from the official documents and statistics reports of CMOC and the summary and statistics of its affiliated companies. The Report gives full disclosure of concerns of the major interested parties (including shareholders, customers, employees, suppliers and partners) of the Company:
• Environment
• Employees
• Community
• Products
Please refer to the 2017 Environmental, Social and Governance Report of China Molybdenum Co., Ltd., and the 2017 Social Responsibility Report disclosed by the Company on the websites of the SSE (www.sse.com.cn), Stock Exchange (www.hkexnews.hk) and the Company (www.chinamoly.com) on 29 March 2018 for details.

60 2017 Annual Report
REPORT OF THE BOARD OF DIRECTORS
COMPLIANCE WITH RELEVANT LAWS AND RULES
The Company devotes its efforts to strictly comply with regulated laws and rules in the jurisdictions where the Company is operating, and is also in compliance with applicable guidelines and rules issued by regulators. As far as the Directors know, the Company has complied with all laws and rules which have material effect on the Company in 2017. In addition, compliance with the relevant laws and regulations which have significant impacts on the Group has been disclosed in various parts of this annual report (especially in the Corporate Governance Report). Description of key relationships between employees of the Company, major customers and suppliers are set out on page 67 to page 69 of the Report of the Board of Directors in the annual report.
CORE COMPETITIVENESS
1. The Company possesses abundant reserves of quality resources. The Luanchuan Sandaozhuang molybdenum/tungsten mine currently operated by the Company is a native molybdenum/tungsten mine large in scale, belonging to part of Luanchuan molybdenum mining field, the largest native molybdenum mining field in the world, and the second largest scheelite bed in China. Luanchuan Shangfanggou molybdenum mine, which is owned by Luoyang Fuchuan Mining Co., Ltd., a joint venture of the Company, is in close proximity to the Shandaozhuang molybdenum mine and is another native molybdenum mine belonging to Luanchuan molybdenum mining field. A subsidiary of the Company possesses the mining rights of the molybdenum mine located in East Gobi, Hami, Xinjiang, which is a quality molybdenum mine large in scale discovered in recent years. The Company operates the NPM copper-gold mine in Australia, which is the fourth largest operating copper/gold mine in Australia. The Tenke copper/cobalt mine operated by the Company in the Congo (DRC) represents one of the largest reserve and highest grade copper-cobalt mines in the world. The Company’s niobium/phosphate mining area in Brazil has rich reserves and bright prospect for exploration, with the second largest niobium resources of the world and the highest grade P2O5 resources in today’s Brazil. All of the above projects owned by the Company have relatively favourable prospect of resource exploration.
2. The Company is able to boost its resistance to risks comprehensively with a portfolio of resources. Currently, the Company boasts a portfolio of copper, molybdenum, tungsten, cobalt, niobium, phosphate and gold by-products and silver, covering the basic, rare and precious metals, and enters into the market of agricultural applications with phosphate resources. Copper represents an important metal for consumption purpose, enjoying a broad prospect of application. Cobalt represents a highly scarce metal resource and a strategically significant resource, with small reserves on land. Lithium batteries and power lithium-ion batteries for consumption purpose take up a large proportion in the total demands for cobalt. In addition, with the boom of electric vehicles, cobalt used in lithium battery will further soar up. The price of niobium has smaller periodical fluctuations than other non-ferrous metals and is therefore relatively stable, so niobium is capable of effectively reducing the risks arising from volatilities in the industry for the Company. Phosphate is mainly applied in agriculture field. Brazil, where our business is operated, is bestowed with the vastest potential cultivable land in the world and represents the third largest consumer of phosphates worldwide. Even if it is short in resources of phosphates ores, Brazil has its own geographical advantages and its phosphates business develops steadily, which is conductive to the diversification and decentralization of the Company’s business. In terms of molybdenum and tungsten sectors, the Company enjoys prominent competitive edge in cost.
3. The Company has advanced production technology and strong cost competitiveness. All of the mines (except for NPM) operated by the Company have adopted modern and safe open-pit mining. The Company strengthens the efficiency of ore mining and transport through automation procedures to achieve lower mining costs. The Company’s mine processing operation adopted advanced technology and equipment, and implemented automated control over the entire procedures, resulting in lower cost of mine processing. In addition, the Company made use of by-products with value from comprehensively recycling associated and beneficial resources, strengthening the profitability of the mines operated and expanding the competitive edge in costs. The NPM copper/gold mine operated by the Company in Australia adopted advanced mining technology of segmenting block caving, and the automation level of its downhole mining has reached 100%. Besides, the cash costs of all business sectors engaged by the Company stand at an internationally leading position in the industry, and enjoy relatively strong competitive edge in the international market.

61China Molybdenum Co., Ltd.
REPORT OF THE BOARD OF DIRECTORS
4. The Company possesses a relatively complete and integrated industry chain. The Company has world-class integrated exploration and processing faci l i t ies and the supporting capacity of smelt ing and chemical engineering, which enables it to ensure the output and quality of such products as molybdenum concentrate, tungsten concentrate, ferromolybdenum, ammonium paratungstate, electrolytic copper, copper concentrate, cobalt hydroxide, ferroniobium, phosphate fertilizer for direct sales or as the raw materials for downstream deep processing. The Company possesses the largest production capacity of ferromolybdenum and molybdenum oxides in China. The phosphate business operated by the Company in Brazil covers the entire industry chain of production, and after years of operation and continuous perfection, a distinctive and efficient operation model thereof has taken shape, fully unleashing the synergies to reduce production costs to the largest extent while ensuring product quality. The integrated industry chain enables the Company to adapt its product mix to the demands of the market and customers swiftly and provide customers with products in stable quality.
5. The Company processes competitive edge and prospect of leading technology of comprehensive utilization of resources to implements the highly efficient resources recycling. Most mines exploited and operated by the Company are the mines with a portfolio of recyclable resources, so the Company proactively pushes forward the comprehensive utilization of resources. At home, the Sandaozhuang molybdenum/tungsten mine, a major mine exploited and operated by the Company, recycles the ancillary scheelite out of the processed molybdenum tailings from the first scratch, making the Company the largest tungsten producer in the country. The successful industrialized recycling of ancillary copper and rhenium has created a new profit growth point for the Company. The comprehensive recycling of ancillary fluorite is being steadily promoted, and upon industrialized production, the scale may reach the capacity of domestic medium to large fluorite mines. Abroad, the Tenke copper/cobalt mine operated by the Company in the Congo (DRC) recycles cobalt from copper tailings, with the second-largest output of cobalt in the world. Besides, part of the niobium output of the niobium business (with second-largest niobium output in the world) operated by the Company in Brazil are from the comprehensive recycling of the tailings of processed phosphate ore. In the future, the comprehensive recycling operations at home and abroad can learn from each other in production techniques and technical research and development, so as to broaden the prospects of development.
6. The Company possesses strong technical research and development capacity. The Company employs 1,565 technological research and development personnel, and established provincial technology centers, which were evaluated by China National Accreditation Service for Conformity Assessment (CNAS) as nationally recognized laboratories in 2008. The Company owns post-doctoral scientific research stations, and its research and development environment holds a leading position among its counterparts in China. The Company successfully implemented industrialization of its various scientific research results, becoming the engine of industrial technology improvement. The Company was recognized as high-tech enterprise in 2012, and is undergoing the re-examination of high-tech enterprises. The Company was also the first company in the national molybdenum industry to recycle all the sulfur dioxide, generated from the process of roasting, into producing sulfuric acid. The Company worked with Central South University, and collaboratively research and developed a technology of producing ammonium paratungstate from low-quality scheelite, significantly reducing the emission of wastewater and solving the difficult problem of “three wastes” in the smelting process of tungsten. In 2006, the Company was awarded the title of “Advanced Mining Enterprise Rationally Exploring and Utilizing the National Mining Resources” by the Ministry of Land and Resources. In September 2011, the Company was collectively assigned by the Ministry of Land and Resources and the Ministry of Finance as one of the demonstration sites of the first batch of mines comprehensively utilizing the mining resources. In 2016, the Company won the “1st Prize for Science and Technology Achievement in China’s Non-ferrous Metal Industry” granted by the Non-ferrous Metals Society of China and China Non-Ferrous Metals Industry Association, the “Nomination for China Grand Award for Industry” granted by the China Federation of Industrial Economics. In 2017, the Company was awarded the title of the “2017 Industrial Enterprise Quality Benchmark in Henan” by the Henan Provincial Industrial and Information Technology Committee. The Company’s “Key Technology and Realm Optimization of Integrated Mining of Multi-Minerals in Sandaozhuang Open-pit Mine” technology won the “1st Prize for Scientific and Technological Progress Award in 2017”.
7. The Company possesses an experienced management team with international experience in business operation and management. The senior management team of the Company has considerable working experience in various fields including exploration, floating, smelting and downstream business. The core management of the Company has managed H share and A share listed companies for many year and possess relatively deep knowledge and understanding of the domestic and foreign development trends and, thus, is capable to timely adjust the Company’s development strategies to take the advanced advantage in the intensified-competitive international market. The Company has accumulated rich experience in project acquisition and management. The non-public issuance of A shares of RMB18 billion was successfully completed in July 2017 and was 2.15 times over-subscribed.
62 2017 Annual Report
REPORT OF THE BOARD OF DIRECTORS
8. The Company possesses a sound structure of assets and liabilities, excellent and efficient management team and a unique and precise strategic vision. The Company develops a clear development strategy and has efficient execution and management team. Currently, the Company’s operating businesses all have strong profitability. The successful completion of the non-public issuance of A shares of RMB18 billion in July 2017 has improved the capital structure of the Company and kept its asset-liability ratio at a healthy level, which will effectively support the Company in building itself into an internationalized resources company with global vision and in-depth industrial consolidation capability.
DIVIDEND
1. Dividend policy
In accordance with relevant regulations such as the Notice Regarding Further Implementation of Cash Dividends Distribution of Listed Companies (Zheng Jian Fa [2012] No.37) and Listed Companies Regulatory Guidance No.3 – Cash Dividends Distribution of Listed Companies (CSRC Notice [2013] No. 43) issued by the CSRC and the Articles of Association, the Company formulated the Shareholders’ Return Plan in the Next Three Years (2016–2018) (hereinafter referred to as the “Plan”) after fully considering the Company’s actual operation conditions and the demands of future development.
(1) Dividends distribution method: In the next three years, the Company adopts a proactive dividend distribution policy in the form of cash or shares, and implements such policy in accordance with the laws, regulations and regulatory requirements. Priority in profits distribution should be in cash rather than in shares. The Company shall distribute profits in the form of cash should such conditions are met. The Company may distribute interim cash dividends as and when appropriate.
(2) In accordance with the laws, regulations and other regulatory requirements in the period, the Company distributes dividend in cash if it records earnings with positive distributable profits and the cash flow of the Company can accommodate the needs of both its daily operation and sustainable development. If the Company distributes cash dividends, the proportion for cash dividends should also comply with the following requirements simultaneously:
a. The profits distributed by the Company in the form of cash each year shall not be less than 30% of distributable profits recorded in the year, in accordance with laws, regulations and regulatory requirements in the period.
b. Where the Company is in a developed stage with no substantial capital expenditure arrangement, the dividend distributed in the form of cash shall not be less than 80% of the total profit distribution when distributing its profits; where the Company is in a developed stage with substantial capital expenditure arrangement, the dividend distributed in the form of cash shall not be less than 40% of the total profit distribution when distributing its profits; where the Company is in a developing stage with substantial capital expenditure arrangement, the dividend distributed in the form of cash shall not be less than 20% of the total profit distribution when distributing its profits.
The “substantial capital expenditure arrangement” mentioned above refers to matters that the total assets of transactions, including asset acquisitions and external investments, by the Company within a year account for more than 30% (inclusive) or more of the latest audited total assets of the Company. The Board of Directors of the Company shall propose a specific cash dividend distribution plan and submit it to the general meeting by differentiating the aforesaid circumstances after taking various factors into consideration, including its industry features, development stages, business model and profitability as well as whether it has any substantial capital expenditure arrangement.
(3) The specific conditions for the distribution of dividend in the form of shares: Where the Company records earnings with positive distributable profits for the year and the valuation on the shares of the Company is in a reasonable range, the Company may distribute dividend in the form of shares without prejudice to the scale of the share capital and the reasonable structure of shareholdings of the Company on the basis of considering rewarding and sharing corporate value with investors.
63China Molybdenum Co., Ltd.
REPORT OF THE BOARD OF DIRECTORS
2. Implementation of cash dividend distribution policy
On 14 April 2017, the proposal of profit distribution for 2016 was considered and approved at the 2017 first extraordinary general meeting of the Company. According to the proposal, the Company distributed a final cash dividend of RMB0.035 per share (tax inclusive), totaling RMB591,051,954.47 (tax inclusive) for the year 2016, accounting for 59.22% of the net profits attributable to shareholders of the parent company for the year. The dividend distribution was completed.
3. Implementation of dividend policy in 2017
Dividend distribution year
Bonus issue per 10 shares
Dividend per 10 shares
Increased amount per
10 shares The amount ofcash dividend
Net profit attributable to ordinary
shareholders of listed companies
in consolidated statement during
dividend year
Percentage of net profit
attributable to ordinary
shareholders of listed companies
in consolidated statement
(share)(RMB)
(tax inclusive) (share)(RMB0’000)
(tax inclusive) (RMB0’000) (%)
2017 0 0.76 0 164,154.23 272,779.62 60.182016 0 0.35 0 59,105.20 99,804.06 59.222015 0 0.25 20 42,218.00 76,116.01 55.472014 0 1.8 0 101,323.19 182,425.53 55.54
4. Proposal of dividend distribution
The Board of Directors recommended to distribute a final cash dividend of RMB0.076 (tax inclusive) per share for the year ended 31 December 2017 to all shareholders on the basis of a total number of shares of 21,599,240,583 shares as at 31 December 2017, totaling RMB1,641.54 million (tax inclusive), accounting for 60.18% of the net profit attributable to the listed shareholder for the year. The proposal has been considered and approved at the 13th meeting of the fourth session of the Board of Directors, and can take effect only after the approval by the directors of the Company at the forthcoming AGM.
The Company will send a circular covering (including) relevant suggestions on the distribution of final dividend and further information of the annual general meeting to shareholders as soon as practicable.
FINANCIAL INFORMATION SUMMARY
The published results and assets, liabilities and minority interests of the Group for the latest five financial years:
Unit: RMB million
Items 2017 2016 2015 2014 2013
Operating revenue 24,147.56 6,949.57 4,196.84 6,662.38 5,536.47Total profit 5,381.82 1,190.14 682.82 2,148.06 1,236.18Income tax expenses 1,786.20 170.90 -20.29 347.86 151.27Net profit 3,595.62 1,019.24 703.11 1,800.20 1,084.91Net profit attributable to owners
of the parent Company 2,727.80 998.04 761.16 1,824.26 1,174.20Profit or loss attributable to
minority shareholders 867.82 21.20 -58.05 -24.05 -89.29

64 2017 Annual Report
REPORT OF THE BOARD OF DIRECTORS
Items31 December
201731 December
201631 December
201531 December
201431 December
2013(Restated)
Total assets 97,837.25 87,924.36 30,880.53 28,054.88 21,899.14Total liabilities 51,928.11 53,587.43 13,063.84 12,910.34 9,006.49Total equity attributable to
shareholders of the parent company 38,157.18 18,738.06 17,353.48 14,633.57 12,178.28
Minority interests 7,751.95 15,598.87 463.21 510.96 714.38
PROPERTY, PLANT AND EQUIPMENT
Details of changes to the property, plant and equipment of the Company and the Group during the year are set out in note (V) 12 and note (XIV) 9 to the consolidated financial statements.
SHARE CAPITAL AND SHAREHOLDERS
1. Changes in shares
On 24 July 2017, the Company completed the non-public issuance of 4,712,041,884 A shares. After the completion of the non-public offering of A shares, the total number of shares of the Company increased from 16,887,198,699 to 21,599,240,583.
Changes in the share capital of the Company during the year are set out in note (V) 37 to the consolidated financial statements.
2. Shareholding structure of substantial shareholders
As at 31 December 2017, the shareholders of the Company amounted to 269,005, of which holders of H shares amounted to 9,574, and holders of A shares amounted to 259,431. By approximate percentage of shareholding in the registered capital, the shareholdings of the Company’s top ten shareholders were as follows:
Name of shareholders (Full name)Class of Share
Changes during the reporting
period
Closing number of
shares held Proportion(million shares) (million shares) (%)
Cathay Fortune Corporation (“CFC”) A share and H share 0 5,333.22 24.69
Luoyang Mining Group Co., Ltd. (“LMG”) A share 0 5,329.78 24.68HKSCC NOMINEES LIMITED (Note 2) H share 14.64 3,579.17 16.57CCB Principal Asset Management – ICBC – Shaanxi
International Trust – Shaanxi International Trust • Jinyu No.6 targeted investment trust plan of assembled funds
A share
777.49 777.49 3.60China State-owned Enterprise Structure Adjustment Fund
Co., Ltd. (中國國有企業結構調整基金股份有限公司)A share
739.71 739.71 3.42Beixin Ruifeng Fund-Bank of Nanjing-Changan
International Trust-Changan International Trust • Ruihua SAIC targeted investment trust plan of assembled funds
A share
480.63 480.63 2.23Minsheng Royal Fund-Bank of Ningbo-Jiaxing Minliu
Investment Partnership (limited partnership)A share
471.73 471.73 2.18Beixin Ruifeng Fund – CMBC – CR Trust –
CR Trust • Jingrui No.7 single fund trustA share
471.20 471.20 2.18

65China Molybdenum Co., Ltd.
REPORT OF THE BOARD OF DIRECTORS
Name of shareholders (Full name)Class of Share
Changes during the reporting
period
Closing number of
shares held Proportion(million shares) (million shares) (%)
Manulife Teda Fund – CMBC – Changan International Trust – Changan International Trust – Minsheng targeted investment No.1 single fund trust A share 471.20 471.20 2.18
National Social Security Fund Package No. 102 (全國社保基金一零二組合) A share 143.99 143.99 0.67
Notes:
1. Percentage calculation is based on the Company’s total share capital of 21,599,240,583 shares.
2. HKSCC NOMINEES LIMITED held 3,579.17 million H shares in the Company as a nominee, representing 16.57% of the Company’s shares in issue. HKSCC NOMINEES LIMITED is a member of the Central Clearing and Settlement System, which carries out securities registration and custodian business for customers.
3. As at 31 December 2017, the number of shares pledged by Cathay Group was 331.00 million shares.
3. Substantial Shareholders’ interests in shares
To the best knowledge of all Directors and supervisors, as at 31 December 2017, the persons or companies (other than Directors, the chief executives or supervisors of the Company) who had interests or short positions in the shares and underlying shares of the Company which would fall to be disclosed under Divisions 2 and 3 of Part XV of the Securities and Futures Ordinance (“SFO”) or who were deemed to be directly or indirectly interested in 5% or more of the nominal value of any class of share capital carrying rights to vote in all circumstances at general meetings of the Company were as follows:
NameNumber of
shares held CapacityClass of Share
Approximate percentage of shareholding
in relevant class of shares
(million shares)
LMG 5,329.78 Beneficial owner A share 30.17%Luoyang Guohong Investment
Group Co., Ltd.5,329.78 Interest in controlled
corporationA share 30.17%
CFC 5,030.22 Beneficial owner A share 28.47%303(L) Interest in controlled
corporationH share 7.7%
Cathay Fortune Investment Limited (“Cathay Hong Kong”)(2)
303(L) Beneficial owner H share 7.7%
Yu Yong(3),(4) 5,030.22 Interest in controlled corporation
A share 28.47%
303(L) Interest in controlled corporation
H share 7.7%
UBS Group AG(5) 101.67(L) Having a security interest in shares
H share 2.58%
116.72(L) Interest in controlled corporation
H share 2.97%
142.25(S) Interest in controlled corporation
H share 3.62%
BlackRock, Inc.(6) 211.47(L) Interest in controlled corporation
H share 5.38%
42.04(S) Interest in controlled corporation
H share 1.07%

66 2017 Annual Report
REPORT OF THE BOARD OF DIRECTORS
Notes:
(1) (L)–Long position; (S) –Short position.
(2) Cathay Hong Kong is a wholly-owned subsidiary of CFC in Hong Kong.
(3) Mr. Yu Yong holds 99% interest in CFC.
(4) Mr. Yu Yong holds such shares. Cathay Fortune Corporation, Cathay Fortune International Company Limited and Cathay Fortune Investment Limited, being the controlled corporations, directly or indirectly hold the shares of the Company.
(5) UBS Group AG holds such shares. UBS AG, UBS Asset Management (Australia) Ltd, UBS Asset Management (Deutschland) GmbH, UBS Asset Management Trust Company, UBS Asset Management (UK) Limited, UBS Fund Management (Luxembourg) S.A., UBS Fund Management (Switzerland) AG, UBS Third Party Management Company S.A., UBS Securities LLC and UBS Switzerland AG, being the controlled corporations, directly or indirectly hold the shares of the Company.
(6) BlackRock, Inc. holds such shares. Trident Merger, LLC, BlackRock Investment Management, LLC, BlackRock Holdco 2, Inc., BlackRock Financial Management, Inc., BlackRock Holdco 4, LLC, BlackRock Holdco 6, LLC, BlackRock Delaware Holdings Inc., BlackRock Institutional Trust Company, National Association, BlackRock Fund Advisors, BlackRock International Holdings, Inc., BR Jersey International Holdings L.P., BlackRock Cayco Limited, BlackRock Trident Holding Company Limited, BlackRock Japan Holdings GK, BlackRock Japan Co., Ltd., BlackRock Canada Holdings LP, BlackRock Canada Holdings ULC, BlackRock Asset Management Canada Limited, BlackRock Australia Holdco Pty. Ltd., BlackRock Investment Management (Australia) Limited, BlackRock (Singapore) Holdco Pte. Ltd., BlackRock HK Holdco Limited, BlackRock Asset Management North Asia Limited, BlackRock Group Limited, BlackRock (Netherlands) B.V., BlackRock Advisors (UK) Limited, BlackRock International Limited, BlackRock Luxembourg Holdco S.àr.l., BlackRock Investment Management Ireland Holdings Limited, BlackRock Asset Management Ireland Limited, BLACKROCK (Luxembourg) S.A., BlackRock Investment Management (UK) Limited, BlackRock Fund Managers Limited and BlackRock Life Limited, being the controlled corporations, directly or indirectly hold the shares of the Company.
Save as disclosed above, as at 31 December 2017, the Directors were not aware of any other persons (other than a Director, chief executive or supervisor of the Company) who had interests or short positions in the shares and underlying shares of the Company as recorded in the register required to be kept under Section 336 of the SFO.
PRE-EMPTIVE RIGHTS
There are no provisions for pre-emptive rights under the Articles of Association and the laws of the PRC which would oblige the Company to offer new shares on a pro rata basis to existing shareholders.
BORROWINGS
Details of the borrowings of the Company and the Group are set out in notes (V) 19 and (V) 31 and note (XIV) 14 to the consolidated financial statements.
PURCHASE, REDEMPTION AND SALE OF LISTED SECURITIES OF THE COMPANY
Neither the Company, nor any of its subsidiaries purchased, sold or redeemed any of the listed securities of the Company in 2017.
DISTRIBUTABLE RESERVE
The amount of the Company’s reserves available for distribution as at 31 December 2017, calculated in accordance with PRC rules and regulation, was RMB5,517.44 million.
CHARITABLE DONATIONS
Please refer to the relevant sections of the 2017 Environmental, Society and Governance Report of the Company published by the Company on 29 March 2018 for details of the charitable donations of the Group for the year.
67China Molybdenum Co., Ltd.
REPORT OF THE BOARD OF DIRECTORS
MAJOR CUSTOMERS AND SUPPLIERS
For the year ended 31 December 2017, the proportions of purchase and sales from the major suppliers and major customers of the Company to our total purchase and sales were as follows:
Purchases
The total purchases from our largest supplier was approximately 7.06% of our total purchase value.
The total purchases from our five largest suppliers was approximately 19.8% of our total purchase value.
Sales
The total sales to our largest customer was approximately 15.37% of our total sales value.
The total sales to our five largest customers was approximately 47.05% of our total sales value.
As at 31 December 2017, to the Directors’ knowledge, none of the Directors or supervisors or their respective close associates or any shareholders who hold more than 5% of our shares, had any material interest or rights in our five largest customers and our five largest suppliers.
DIRECTORS, SUPERVISORS AND SENIOR MANAGEMENT
The Directors, supervisors and senior management of the Company during 2017 and up to the date of this annual report are:
Executive Directors
Mr. Li ChaochunMr. Li Faben
Non-Executive Directors
Mr. Ma HuiMr. Yuan HonglinMr. Cheng Yunlei
Independent Non-Executive Directors
Mr. Bai YanchunMr. Xu ShanMr. Cheng Gordon
Supervisors
Ms. Kou YouminMr. Zhang ZhenhaoMs. Wang Zhengyan
Senior Management
Ms. Gu MeifengMr. Jing ShigunMr. Wang YonghongMr. Jiang ZhongqiangMr. Yue Yuanbin (appointed as secretary of the Board on 3 March 2017)Ms. Wu Yiming (appointed as vice general manager on 31 January 2018)

68 2017 Annual Report
REPORT OF THE BOARD OF DIRECTORS
Pursuant to the Articles of Association, the term of office of all Directors and supervisors is three years, and may stand for re-election upon expiry of the term. Among the above Directors and supervisors, Mr. Bai Yanchun, Mr. Xu Shan and Mr. Cheng Gordon shall not be reappointed at the annual general meeting to be held in 2018.
The Company has received an annual confirmation from each of Mr. Bai Yanchun, Mr. Xu Shan and Mr. Cheng Gordon, all being the independent non-executive Directors, in respect of their independence and is of the opinion that they remained independent as at 31 December 2017.
DIRECTORS’, SUPERVISORS’ AND SENIOR MANAGEMENT’S PROFILES
Profile details of the Directors and supervisors of the Company and the senior management of the Group are set out on pages 76 to 80 of the annual report.
D I R E C T O R S ’ , S U P E R V I S O R S ’ A N D S E N I O R M A N A G E M E N T ’ S REMUNERATION
The Directors’ and supervisors’ fees are subject to shareholders’ approval at general meetings. Other emoluments are determined by the board of directors of the Company with reference to Directors’ and supervisors’ duties, responsibilities and performance and the results of the Group. In compliance with the Corporate Governance Code, the Company has a remuneration committee to formulate remuneration policies. Details of the Directors’ and supervisors’ remuneration are disclosed in note (X) 7 to the consolidated financial statements. There is no arrangement under which any Director or Supervisor has waived or agreed to waive any remuneration for the year ended 31 December 2017.
The remuneration of the senior management for the year ended 31 December 2017 fell within the following bands (Note) :
Number of Individual(s)
Remuneration bands Year 2017
Within RMB1,500,000 4Above RMB1,500,000 0
Note: Directors and supervisors of the Company and Mr. Yue Yuanbin (appointed as a member of senior management in March 2017) were excluded; Ms. Ho Siu Pik, the company secretary, is an external service provider, as such, she is not part of the Company’s senior management.
EMPLOYEES AND PENSION PLAN
As at 31 December 2017, the Group had approximately 11,226 full-time employees, classified as follows by function and department:
Department Employees Proportion
Management & administration 1,616 14.40%Quality control, research and development 1,565 13.94%Production 7,006 62.41%Finance, sales and other support 1,039 9.26%
Total 11,226 100%
69China Molybdenum Co., Ltd.
REPORT OF THE BOARD OF DIRECTORS
The remuneration policy for the employees of the Company principally consists of a salary point and performance remuneration system, based on employees’ positions and responsibilities and their quantified assessment results. The employees’ remuneration is evaluated in line with the Company’s operating results and personal performance in order to provide a consistent, fair and equitable remuneration system for all employees. The companies of Group domiciled in China have participated in the social insurance contribution plans introduced by China’s local governments. In accordance with the laws and regulations regarding the national and local labor and social welfares in China, the Group is required to pay on behalf of its employees a monthly social insurance premium covering pension insurance, health insurance, unemployment insurance and housing provident fund. Pursuant to the current applicable local regulations in China, the percentages of certain insurances are as follows: the pension insurance, health insurance, unemployment insurance, maternity insurance, work injury insurance and the contribution to housing provident fund of our Chinese employees represent 19%, 7%, 0.7%, 0.5%, 0.4% to 1.9% and 5% to 12% of his or her total basic monthly salary respectively. In accordance with applicable PRC regulations, the Company currently participates in pension contribution plans organized by the governments. The overseas employees are enrolled in the requisite pension and/or healthcare plans under the requirement of the laws in the countries where they reside.
ANALYSIS ON MAJOR SUBSIDIARIES
Company name Principal productsRegistered
capitalTotal
assetsOperating
revenueNet
assets Net profit(RMB
million)(RMB
million)(RMB
million)(RMB
million)
CMOC Mining Pty Limited Copper and gold related products
US$346 million 5,926.78 1,686.56 2,649.05 219.40
CMOC DRC Limited Copper and cobalt related products
HK$1 45,118.85 13,844.64 16,674.73 3,189.53
Luxembourg SPV Niobium and phosphates related products
US$20,000 14,138.79 4,568.56 4,068.25 134.87
DIRECTORS’ AND SUPERVISORS’ SERVICE CONTRACTS
Ms. Wang Zhengyan was appointed as the staff representative supervisor on 19 January 2015 and entered into a service contract with the Company for a term of three years commencing from the date of appointment. Upon expiry, the Company has already signed a new service contract with Ms. Wang Zhengyan. Other Directors and supervisors of the Company have each entered into a service contract with our Company for a term of not more than three years until the annual general meeting of the Company to be held in 2018.
None of the Directors and supervisors has a service contract with the Company which is not terminable within one year without payment of compensation, other than statutory compensation.
DIRECTORS’ AND SUPERVISORS’ INTERESTS IN CONTRACTS
None of the Directors and supervisors had material interests, either directly or indirectly, in any contract of significance to the business of the Group subsisting or entered into by the Company, its holding company or any of its subsidiaries during or at the end of the year.
MATERIAL INVESTMENTS
The material investments held by the Group and the performance and prospects of such investments during the accounting year are set out in notes (V) 10 and 11, note (I) 2 and note (VII) 2 to the consolidated financial statements and the section headed “Material Events”.
MANAGEMENT CONTRACTS
No contracts concerning the management and/or administration of the whole or any substantial part of the business of the Company were entered into or existed in 2017.
70 2017 Annual Report
REPORT OF THE BOARD OF DIRECTORS
PERMITTED INDEMNITY
Except the liability insurance described below, the Company did not enter into any agreement with indemnity provisions with Directors or supervisors of the Company to provide indemnity to Directors or supervisors for legal liabilities caused to third parties or other types of legal liabilities.
The Company considered and passed the purchase of liability insurance for the risks of domestic and overseas litigations or regulatory investigations that the Directors, supervisors and senior management of the Group may be exposed to when carrying out their duties in executing the business decisions and information disclosure, at the first EGM in 2017. The insurance covers management liabilities of the Directors, supervisors and senior management, the Company’s equity securities claims and the Company’s inappropriate employment practices claims. The amount of insurance coverage is US$30,000,000 per annum; at the total costs of not more than US$50,000 per annum.
DIRECTORS’, CHIEF EXECUTIVES’ AND SUPERVISORS’ INTERESTS AND SHORT POSITIONS IN SECURITIES
As at 31 December 2017, the shareholding of A Shares by current Directors, supervisors and senior management of the Company was as follows:
NameNumber of
shares heldPercentage in
total share capital(Shares) (%)
Li Chaochun 1,587,692 0.007Li Faben 1,064,400 0.005Yuan Honglin 1,050,600 0.005Zhang Zhenhao 1,063,500 0.005Gu Meifeng 531,600 0.002Jiang Zhongqiang 532,500 0.002
Total 5,830,292 0.026
On 29 October 2017, the Company issued an announcement and disclosed the shareholding reduction scheme of some of the Directors, supervisors and senior management. Li Chaochun, the chairman and executive Director of the Company, Li Faben, the executive Director and general manager, Yuan Honglin, a non-executive Director, Zhang Zhenhao, a supervisor, Gu Meifeng, the chief financial officer, and Jiang Zhongqiang, the deputy general manager, planned to reduce shareholding of not more than 2,550,751 A Shares (accounting for 0.0118% of the total share capital of the Company) by way of centralized bidding or bulk transaction permitted by laws and regulations, on the premise of complying with the regulations relating to reduction of shareholding of directors, supervisors and senior management of listed companies, within six months after 15 trading days from the date of publishing the announcement (no reduction of shareholding shall be allowed during window period).
As of the disclosure date of this report, none of the person who proposed shareholding reduction has reduced his/her holdings in the Company’s shares.
Save as disclosed above, so far as was known to the Directors, in 2017, none of the Directors, chief executives, senior management and supervisors and their respective associates had interests or short positions in the shares, underlying shares and debentures of the Company or its associated corporations (within the meaning of Part XV of the SFO, which required the Company and Stock Exchange to be notified pursuant to Part XV of the SFO or which were required to be entered into the register required to be kept under Section 352 of the SFO or as otherwise notified to the Company and Stock Exchange pursuant to the Model Code.

71China Molybdenum Co., Ltd.
REPORT OF THE BOARD OF DIRECTORS
CONNECTED TRANSACTIONS
For the year ended 31 December 2017, certain related party transactions set out in notes (X) and (XIV) 29 to the consolidated financial statements did not constitute connected transactions for the Company under Chapter 14A of the Hong Kong Listing Rules. During the year, the Group completed a non-exempt connected transaction.
On 15 November 2016, BHR, THL and Lundin entered into a stock purchase agreement (hereinafter referred to as “Ludin Shell Company SPA”) on the acquisition of 100% equity held by THL in Lundin Shell Company from THL by BHR or its wholly-owned subsidiary. Upon completion of the equity purchase, BHR will hold 24% equities in TFM indirectly.
On 20 January 2017, the Company and BHR entered into a cooperation framework agreement. The Company intends to cooperate with BHR regarding the introduction of ultimate investor in BHR, the indirect investment of BHR in 34% equities of TFM and the subsequent exit of such investment. It is expected that investors will directly or indirectly make a payment with maximum RMB470 million to subscribe for the share capital of BHR. BHR exclusively and irrevocably grants the Company the exclusive option to buy the 24% interests in TFM.
On 20 April 2017, the acquisition of 100% equities held by THL in Lundin Shell Company from THL by BHR through its wholly-owned subsidiary was completed. BHR directly owns 100% equities in Lundin Shell Company through its wholly-owned subsidiary, and indirectly owns 24% interests in TFM. Such acquisition further consolidated the Group’s voice and control over the project, and further boost its profitability and risk-resisting capabilities.
Under the Ludin Shell Company SPA, BHR will acquire the entire issued share capital of Lundin Shell Company which holds 30% interests in TF Holdings Limited (hereinafter referred to as “TFHL”, a non-wholly indirectly owned subsidiary of the Company). As of 20 April 2017, BHR has completed the Ludin Shell Company SPA, in which BHR has indirectly held 30% shares in TFHL. Accordingly, BHR is a connected person of the Company. As such, the Company’s assistance to BHR in obtaining syndicated loans (including guarantees), granting put options to (i) BHR and (ii) investors, and accepting subscription rights from (i) BHR and (ii) investors all constitute the connected transactions of the Company under Chapter 14A of the Hong Kong Listing Rules.
The cooperation agreement and the transactions thereunder have been approved by the Board. Details of the connected transaction are set out in the announcements of the Company dated 22 January 2017 and 6 March 2017.
NON-COMPETITION AGREEMENTS
On 6 September 2006, non-compete agreements were entered into between the Company and each of CFC and LMG, respectively. CFC and LMG agreed not to compete with us in our businesses and granted us certain options and right of first refusal pursuant to the non-compete agreements. Details of the non-compete agreements had been disclosed in the prospectus of the Company dated 13 April 2007, under the section headed “Relationship with Controlling Shareholders – Non-Compete Agreements”. Each CFC and LMG had executed a Non-competition Undertaking Letter with the Company on 30 January 2011 and 18 May 2011 respectively, pursuant to which each of them had undertaken not to compete with the Company in the businesses it operated or businesses to be further expanded. Details of the Non-competition Undertaking letters had been disclosed in “Peer Competition and Connected Transactions (同業競爭與關聯交易)” set out in Section VII to the prospectus of A Shares dated 8 October 2012. CFC (together with its parties acting in concert, Cathay Hong Kong) and Luoyang Guohong Investment Group Co., Ltd. had executed the Acquisition Report of China Molybdenum Co., Ltd.* on 23 January 2014 and 29 November 2013 respectively, pursuant to which each of them undertook not to compete with the Company in the businesses we operated. Details of the Acquisition Reports were disclosed in the announcements of the Company dated 23 January 2014 and 27 January 2014.
On 18 April 2017, the Company received from LMG the Notice on Gratuitous Transfer of State-Owned Shares by Luoyang Non-ferrous Mining Group Co., Ltd. (洛陽礦業集團有限公司), to transfer the 100% equity in Luoyang Guo’an Trade Co., Ltd. (“Guo’an Trade”) held by Luoyang Non-ferrous Mining Group Co., Ltd. (洛陽礦業集團有限公司) to LMG free of charge, as from which, LMG will perform the duty as the shareholder. Upon LMG’s acceptance of the transfer, in accordance with the Non-Competition Undertakings and to avoid actual competition between LMG and the Company upon actual commencement of production operation activities by Luoyang Fuchuan Mining Co., Ltd., LMG made an undertaking to the Company on 18 April 2017, pursuant to which, LMG undertakes to the Company that, after LMG obtains the Luoyang Guo’an Interests (and indirectly holds the interests of Luoyang Fuchuan Mining Co., Ltd.) and before Luoyang Fuchuan

72 2017 Annual Report
REPORT OF THE BOARD OF DIRECTORS
Mining Co., Ltd. commences production operations, LMG will procure the sale of the Luoyang Guo’an Interests, and the Company shall have the pre-emptive right ("Pre-emptive right") to purchase Luoyang Guo’an Interests (the “Pre-Emptive Right”), or according to 《關於推動國有股東與所控股上市公司解決同業競爭規範關聯交易的指導意見》(the Guiding Opinions on Promoting the Resolution of Horizontal Competition and the Regulation of Affiliated Transactions by the State-owned Shareholders and the Listed Companies under Their Control*) jointly issued by 國務院國有資產監督管理委員會 (the State-owned Assets Supervision and Administration Commission of the State Council*) and the China Securities Regulatory Commission, which indicated the comprehensive use of asset restructuring, equity replacement, business adjustment and other similar methods to resolve the issue of competing business.
CONTROLLING SHAREHOLDERS’ INTERESTS IN CONTRACTS OF SIGNIFICANCE
No contracts of significance had been entered into between the Company or any of its subsidiaries and any controlling Shareholders or any of its subsidiaries in 2017.
DIRECTORS’ INTERESTS IN COMPETING BUSINESS
In 2017, none of the Directors had any interest in any business which competes or is likely to compete either directly or indirectly, with the business of the Group.
SUFFICIENCY OF PUBLIC FLOAT
Based on public information and to the knowledge of the Directors, at least 50.6% of the Company’s total issued share capital was held by the public for the year ended 31 December 2017. The Company has been maintaining the public float required by the Hong Kong Listing Rules. In particular, the public float of H shares accounted for 16.8%.
EQUITY-LINKED AGREEMENT
In 2017, the Company has not implemented any equity-linked agreement.
SHARE OPTION SCHEME
In 2017, the Company has not implemented any share option scheme.
AUDITOR
The consolidated financial statements of the Company for the year ended 31 December 2017 were audited by Deloitte Touche Tohmatsu Certified Public Accountants LLP (Special General Partnership). The financial report for the year 2017 prepared in accordance with the PRC Accounting Standards by the Company has been audited by Deloitte Touche Tohmatsu Certified Public Accountants LLP (Special General Partnership) and an auditor’s report with unqualified opinions has been issued.
The Company re-appointed Deloitte Touche Tohmatsu Certified Public Accountants LLP (Special General Partnership), as the auditor of the Company, with term of office until the conclusion of the next annual general meeting of the Company.
By order of the BoardLi Chaochun
Chairman
Luoyang City, Henan Province, the PRC29 March 2018
73China Molybdenum Co., Ltd.
REPORT OF THE SUPERVISORY COMMITTEE
Dear Shareholders,
In 2017, being in compliance with the relevant laws and regulations of the PRC and the Hong Kong Special Administrative Region, and the relevant provisions of the Articles of Association, the supervisory committee of the Company performed supervision function legally and independently, carried out various work prudently and actively, facilitated standardized operation of the Company and protected the legal rights and interests of the Company, shareholders and staff. The supervisory committee conducted supervision and inspection over the Company’s finance, implementation of resolutions passed at general meetings, the lawfulness and compliance of material decision-making procedures by the Board and the operational and management activities of the Company, and the performance of duties by the Board and the senior management, with a view to fostering sustainable and healthy development of the Company.
I. MEETINGS CONVENED IN 2017
In 2017, the supervisory committee held six meetings. Apart from holding supervisory committee meetings, the supervisory committee also sat in and attended the official meetings of the Company’s Board for four times and extraordinary meetings for ten times, general meetings for four times and listened to and adopted important proposals and resolutions from the Company. We understood the process of how the Company’s material decisions were formed, had a grasp on the operational results of the Company, and simultaneously performed the supervisory committee’s functions of knowing facts, monitoring and investigation.
II. MAJOR DUTIES OF THE SUPERVISORY COMMITTEE IN 2017
In 2017, the supervisory committee prudently reviewed the operational and development plans of the Company. The supervisory committee also raised reasonable recommendations and opinions to the Board. It also effectively supervised as to whether the major and specific decisions made by the management of the Company were in compliance with the laws and regulations of the State and the Articles of Association, and whether they were made to safeguard the benefits of the shareholders.
In 2017, the current session of the supervisory committee mainly carried out the efforts as follows:
1. Inspection of lawfulness of the Company’s operations
Pursuant to the relevant provisions of relevant laws and regulations of the State, Listing Rules in Mainland China and Hong Kong and Articles of Association, the supervisory committee conducted inspection and supervision over the procedures for convening general meetings and Board meetings of the Company, items to be resolved, implementation of resolutions passed at general meetings by the Board, the conduct codes of senior management of the Company and internal control system of the Company by attending the general meeting and the meeting of the Board of the Company. Upon inspection, the supervisory committee is of the view that the decision-making procedures on the general meetings and Board meetings of the Company are lawful, the general meeting and proposals of the Board can be effectively implemented and the internal control system of the Company is well established. The Directors and senior management are diligent and responsible. No violation of any laws, regulations, Listing Rules in Mainland China and Hong Kong and Articles of Association and no other circumstances which are harmful to interests of shareholders and the Company have been found in the performance of duties.
74 2017 Annual Report
REPORT OF THE SUPERVISORY COMMITTEE
2. Inspection of the Company’s financial status
In 2017, the supervisory committee conducted effective supervision and inspection over the performance of the Company’s financial system. Upon inspection, the supervisory committee is of the view that the financial operation of the Company was conducted in strict compliance with the financial management and the internal control system of the Company. Through the inspection over each auditing material (including the financial information) provided by the Company, the Company has built a sound financial internal control system, which could effectively guarantee the efficient operation of corporate funding and the safety and integrity of the Company’s properties. The Company has neither acted against the wishes of the shareholders nor violated the internal control system of the Company during the course of operation. The utilization of funds was in the interests of the shareholders and fit in the principle of maximizing the Company’s benefits. The financial position of the Company is solid with true financial information, and there is no false record, misrepresentations, or major omissions. There exists neither guarantee for violation of rules nor any guaranteed items which should be disclosed but have not been disclosed yet. Deloitte Touche Tohmatsu Certified Public Accountants LLP (Special General Partnership) audited the annual financial report and issued a standard and unqualified audit report.
3. Inspection of the Company’s fund-raising management and utilization
In 2017, the supervisory committee conducted supervision over the Company’s fund-raising utilization. The supervisory committee is of the view that the Company was in strict compliance with requirements of the Fund-raising Management System of China Molybdenum Co., Ltd. (《洛陽欒川鉬業集團股份有限公司募集資金管理制度》) to carry out fund-raising management and utilization. The actual fund-raising utilization was subject to the national laws and regulations and requirements of Articles of Association with no behavior harming interests of the Company and its shareholders.
4. Inspection of the implementation of the information disclosure systems
In 2017, the supervisory committee urged the Company’s relevant departments to cooperate with the regulatory authorities for conducting on-site investigation. Results of investigation proved that the Company was in strict compliance with the requirements of regulatory policies to perform its obligations of information disclosure, to seriously implement each information disclosure management system, to timely and fairly disclose information which is true, accurate and complete on the whole.
5. Review of the internal control evaluation report
After the careful review of the 2017 Internal Control Evaluation Report of the Company (《公司2017年度內部控制評價報告》), the supervisory committee is of the opinion that the compilation is in compliance with such requirements as the Basic Rules for Internal Control of Enterprise (《企業內部控制基本規範》) and the Internal Control Evaluation Guidelines of Enterprise (《企業內部控制評價指引》). By establishing efficient internal control system and management, the Company has improved its internal control system, which plays a better role in risk prevention and control during the Company’s production, operation and management to ensure an orderly development of various business activities of the Company and shareholders. The report objectively and accurately reflected the actual situation of the Company’s internal control, and no false records, misleading statements or major omissions have been found. The supervisory committee approved the 2017 Internal Control Evaluation Report of the Company.
6. Trainings
In order to consistently increase professional knowledge and enhance the business level, to execute the supervisory function of the supervisory committee in a perfect way and to strictly comply with laws, regulations and the Articles of Association, relevant supervisors participated in the training courses according to requirements in respect of corporate governance and regulatory development organized by the Listed Companies Association of Henan or held by the Company, and received and read the relevant materials including updates of laws and rules sent by the Board Office of the Company.
75China Molybdenum Co., Ltd.
REPORT OF THE SUPERVISORY COMMITTEE
III. BASIC EVALUATION OF THE PERFORMANCE OF THE BOARD AND MANAGEMENT IN 2017
The supervisory committee is of the view that the board of directors of the Company duly performed its operation in strict compliance with the requirements under the laws and regulations including the Companies Law, the Articles of Association and Hong Kong and Shanghai Stock Exchange Listing Rules. The Company kept the duly process of the production and operation, and ensured the stability of the production of the Company and the interests of the shareholders to the greatest extent.
In 2017, the major business decision-making procedures of the Company were legitimate and effective. The Directors and senior management of the Company duly performed its duties seriously, proactively and normatively conducted its work in accordance with the national laws, regulations, the Articles of Association and resolutions of the general meeting and the Board. The supervisory committee had not found any acts in breach of laws and regulations and the Articles of Association or against the interests of the shareholders and the Company by the Board and senior management of the Company during the course of performing their duties. The supervisory committee expressed its deep appreciation to the performance of the Board and management.
IV. WORKING PLAN
In 2018, the supervisory committee will continue to strictly comply with the laws and regulations of the State and such power and authority as granted by the Articles of Association, will make serious efforts to fulfill its supervision functions and will firmly adhere to the strategies of the Company, focus on the Company’s operating goals, take financial supervision as the core and diligently perform our responsibilities. Firstly, we shall organize and convene work meeting of the supervisory committee on a regular basis and conduct supervision and investigation over the Company’s financial situation according to laws; we shall track and analyze the Company’s operation, urge the Company to standardize its operation and enhance the level of corporate governance. Secondly, we shall continue to strengthen the supervision functions, sit in the Board meetings and general meetings according to laws, timely grasp the lawfulness of the items under major decision-making process and of the decision-making procedures of the Company, strengthen the supervision and inspection of material matters such as connected transactions and high-risk businesses, and promptly put forward reasonable suggestions or risk warning to the Board or the management in case of any problems or concerns. This will prevent the damage to the interests of shareholders and the assets loss of the Company. Thirdly, we shall continue to strengthen self-learning, enhance the level of business, and actively participate in the relevant training organized by the regulatory authorities and the Company. Meanwhile, we could enhance the level of professional knowledge and business level through self-study and to better bring out the monitoring functions of the supervisory committee.
By order of the Supervisory CommitteeKou YouminChairperson
Luoyang City, Henan province, the PRC29 March 2018

76 2017 Annual Report
PROFILES OF DIRECTORS, SUPERVISORS AND SENIOR MANAGEMENT
DIRECTORS
Executive Directors
Mr. Li Chaochun, aged 41, is an executive Director since January 2007 and chairman of the Board since January 2014. He is also the vice chairman of the nomination committee of the Company since 17 August 2012 and the chairman of our strategic committee since 14 January 2014. Mr. Li graduated from Shanghai Jiaotong University with a bachelor’s degree in law in July 1999. From July 1999 to December 1999, he was a staff accountant of the tax division of Arthur Andersen (Shanghai) Business Consulting Co., Ltd.. He was with Arthur Andersen Hua Qiang CPA from January 2000 to March 2002, where his last position was a senior consultant of the tax division. From April 2002 to February 2003, he was a deputy manager of planning and strategy implementation of the general representative office of The Hong Kong and Shanghai Banking Corporation Limited. From July 2003 to January 2007, Mr. Li was an executive director of the investment department of Cathay Fortune Corporation, one of the founders of the Company. Mr. Li has been a director of China Molybdenum (Hong Kong) Company Limited, Luoyang High Tech Molybdenum & Tungsten Materials Co., Ltd., CMOC Mining Pty Limited, CMOC Limited, CMOC Mining Services Pty Limited, Schmocker (Shanghai) International Trading Co., Ltd. and CMOC Mining USA Ltd. since 16 August 2007, 27 May 2010, 25 July 2013, 27 August 2013, 9 September 2013, 20 April 2014, and 29 May 2014, respectively. From January 2007 to 14 January 2014, Mr. Li was the vice chairman of the Board.
Mr. Li Faben, aged 54, professor-level senior engineer, has been the executive Director of the Company since August 2006. He is also the general manager and a member of the strategic committee of the Company since October 2012. Mr. Li graduated from the Central South Mining & Metallurgical College (subsequently renamed as the Central South University of Technology, now known as the Central South University) with a bachelor’s degree in engineering in 1983 (major in mining engineering) and the Xi’an University of Architecture and Technology with a master’s degree in engineering in 2004 (specialized in mining engineering) and a doctor’s degree in Management Science and Engineering in January 2014. From August 1988 to January 1999, Mr. Li held various positions at Luoyang Luanchuan Molybdenum Company, in which he served as the deputy head and head of the technical division, quarry supervisor, head of the open-pit mining construction department and deputy manager of Luoyang Luanchuan Molybdenum Company. Mr. Li served as deputy general manager of Luoyang Luanchuan Molybdenum Group Co., Ltd. between January 1999 and November 2002. From November 2002 to August 2006, Mr. Li was the deputy general manager and vice chairman of Luoyang Luanchuan Molybdenum Group Co., Ltd. as well as a director of Luoyang Mining Group Co., Ltd. from July 2006 to November 2009. Mr. Li was the standing deputy general manager of the Company from August 2006 to October 2012. Mr. Li was a director of China Molybdenum (Hong Kong) Company Limited from 16 August 2007 to May 2015.
Non-Executive Directors
Mr. Ma Hui, aged 46, is a senior accountant, certified accountant and certified asset valuer. Mr. Ma has been our non-executive Director since 26 June 2015 and vice chairman of the Board since 27 June 2015. Mr. Ma graduated from Central Institute of Finance and Economics and obtained a Bachelor’s degree in economics in 1994. From September 1994 to March 2008, he worked in Luoyang Zhong Hua Certified Public Accountants Company Limited (洛陽中華會計師事務所有限責任公司) (formerly known as Luoyang Certified Public Accounting Firm (洛陽會計師事務所)) engaging in work such as audit, evaluation and financial consultancy, and had served as the department manager of evaluation department, a director and an assistant to the president. He served as the chief financial officer of Luoyang Mining Group Co., Ltd. (洛陽礦業集團有限公司) since April 2008; and the deputy general manager of Luoyang Guohong Investment Group Co., Ltd. (洛陽國宏投資集團有限公司) since July 2013. He currently serves as the director of Luoyang Mining Co., Ltd., the director of Henan Guoxin Investment Guarantee Co., Ltd. (河南國鑫投資擔保有限公司), the director of Luoyang Hongke Innovation Venture Capital Co., Ltd. (洛陽宏科創新創業投資有限公司) and the supervisor of Luoyang Petrochemical Products Management Co., Ltd. (洛陽中石化油品經營有限責任公司).

77China Molybdenum Co., Ltd.
PROFILES OF DIRECTORS, SUPERVISORS AND SENIOR MANAGEMENT
Mr. Yuan Honglin, aged 50, has been our non-executive Director and a member of the audit committee, remuneration committee and strategic committee of the Company since November 2013. He has over 20 years of experience in the banking industry. Mr. Yuan graduated from Nanjing University in July 1990 with a bachelor’s degree in economics. In July 2004, Mr. Yuan obtained a MBA degree from Shanghai Jiaotong University. From August 1990 to May 2000, Mr. Yuan worked at Bank of China Limited, Nantong Branch where he held various positions including vice president of the Rudong sub-branch and manager of the credit management department of Nantong Branch. Between June 2000 and August 2007, Mr. Yuan worked at China Merchants Bank Limited, Shanghai Branch where he held various positions including president of Jiang Wan sub-branch and general manager of corporate banking department. From September 2007 to September 2012, Mr. Yuan worked at Ping An Bank Co., Ltd. where he held various positions including assistant to the president of the Shanghai Branch, vice president (responsible for the overall business operations) of the Shanghai Branch and general manager of the corporate banking department responsible for the northern region of China. From October 2012 to the present, Mr. Yuan has been the deputy general manager of Cathay Fortune Capital Limited, a wholly-owned subsidiary of Cathay Fortune Corporation, a controlling shareholder of the Company.
Mr. Cheng Yunlei, aged 35, is an accountant and certified accountant. Mr. Cheng has been our non-executive Director since 26 June 2015. Mr. Cheng graduated from Henan University of Science and Technology and obtained a Bachelor’s degree in management in 2006. From July 2006 to October 2007, he worked in the No. 2 Audit Department of Luoyang Zhong Hua Certified Public Accountants Company Limited engaging in audit and financial consultancy work. He has served as the chief accountant and the person in charge of the finance and audit department of Luoyang Mining Group Co., Ltd. since November 2007. He served as the person in charge of the finance department of Luoyang Non-ferrous Mining Group Co., Ltd. (洛陽有色礦業集團有限公司) from September 2011 to June 2014, during which, he concurrently served as a supervisor of Luoyang Non-ferrous Mining Group Co., Ltd., Luoyang Jinqiao Mining Co., Ltd. (洛陽錦橋礦業有限公司) and Luoning Jinlong Mining Co., Ltd. (洛寧金龍礦業有限公司). Since January 2015, Mr. Cheng has served as the general manager of the planning and finance department of Luoyang Guohong Investment Group Co., Ltd. and the general manager of finance department of Luoyang Mining Group Co., Ltd. He currently serves as the director of Luoyang Mining Group Co., Ltd. (洛陽礦業集團有限公司) and Luoyang Huaze Microcredit Co., Ltd. (洛陽華澤小額貸款有限公司), and the supervisor of Henan Guoxin Investment Guarantee Co., Ltd. (河南國鑫投資擔保有限公司) and Luoyang Yumengtong Industrial Co., Ltd. (洛陽豫孟通實業有限公司).
Independent Non-Executive Directors
Mr. Bai Yanchun, aged 51, has been an independent non-executive Director of the Company, chairman of both the nomination committee and remuneration committee and a member of the strategic committee since August 2012. He is currently a member of All China Lawyers Association holding a practising solicitor certificate in the PRC. Mr. Bai graduated from China University of Political Science and Law with a bachelor’s degree of laws in 1988. He studied the postgraduate courses at the Center for Chinese and American Studies of Johns Hopkins University in the United States in 1992 and obtained a master’s degree from the School of Law of Stanford University in the United States in 2003. From 1988 to 1992, he worked at the China Council for the Promotion of International Trade. In 1993, he participated in the founding of King & Wood Mallesons and has been engaging in professional legal services such as securities, mergers and acquisitions. Mr. Bai currently serves as an arbitrator of China International Economic and Trade Arbitration Commission. Mr. Bai was appointed as a member of the ninth session of Issuance Examination Committee of China Securities Regulatory Commission in 2008. Mr. Bai currently engages in legal services for Commerce & Finance Law Offices in Beijing.
Mr. Cheng Gordon, aged 42, has been an independent non-executive Director and a member of the audit committee, nomination committee and remuneration committee of the Company since August 2012. Mr. Cheng graduated from the University of Sydney (Australia) with bachelor degree in commerce (1996) and bachelor degree in law (1998). He is the founder and Partner of GD China Clean Energy Capital Partners. Before that, he served as the senior advisor of Deutsche Bank Global Climate Change Advisors and United Nations Industrial Development Organization (UNIDO) in China. From 2010 to 2011, Mr. Cheng had been the China Chief Representative of LaSalle Fund. Prior to 2010, he served as the Chief Financial Officer and Chief Investment Officer of Sunshine 100 Real Estate Development Group (“Sunshine 100”). Before joining Sunshine 100, he served as the Executive Vice President of Vimicro International Corporation (“Vimicro”), which was successfully listed on NASDAQ in the United States in 2005 under his leadership. Before joining Vimicro, he has worked at the investment banking department of internally renowned J.P. Morgan and Credit Suisse. Mr. Cheng has extensive experience in financing, investing as well as merger and acquisitions, both globally and in China.

78 2017 Annual Report
PROFILES OF DIRECTORS, SUPERVISORS AND SENIOR MANAGEMENT
Mr. Xu Shan, aged 49, has been an independent non-executive Director of the Company since August 2012. He is also the chairman of our audit committee and a member of the nomination committee. He is a PRC certified public accountant and a PRC registered tax agent. Mr. Xu graduated from the Department of Computing and Systematic Science of Xiamen University in 1991 and obtained a doctor’s degree in management (accounting) from Xiamen University in 2001. At present, he concurrently acts as the chairman of Xiamen Tianjian Consulting Firm (廈門天健諮詢公司) and an independent director of Sunshine Insurance Group Corporation Limited (陽光保險集團股份有限公司) and Xin Hee Co., Ltd. (欣賀股份有限公司), a part-time professor of the MPAcc Program of Xiamen University and a consultant of the Private Banking Center of Xiamen Branch of China Construction Bank. Mr. Xu served as the manager of Xiamen Nongxin Accounting Firm (廈門農信會計師事務所) from June 1994 to August 1996, the manager of the Accounting Firm of Xiamen University (廈門大學會計師事務所) from September 1996 to December 1998 as well as a director and partner of Tianjian Zhengxin Accounting Firm (天健正信會計師事務所) from December 1998 to December 2011. He concurrently served as a special member of the ninth session of Issuance Examination Committee of China Securities Regulatory Commission from 2007 to 2008. He was an independent Director of Beijing Kalends Science & Technology Company Limited (北京昆侖萬維科技股份有限公司) from July 2011 to July 2016.
SUPERVISORS
Ms. Kou Youmin, aged 52, is a senior accountant. Ms. Kou has been the chairperson of our supervisory committee since 27 June 2015. Ms. Kou graduated from Henan Institute of Finance and Economics majoring in accounting in 1999. She served as a technician at Luoyang Liming Plastic Plant (洛陽黎明塑料總廠) from August 1986 to January 1988; an accountant of Luoyang Changfeng Construction Material Store (洛陽長豐建材商店) from January 1988 to October 1992; an accountant of Luoyang Bearings Group Plastic Packing Manufacturing Plant (洛陽軸承集團塑料包裝製品廠) from October 1992 to September 1997; and the head of financial department of Luoyang Bearings Group Railway Bearings Co., Ltd. (洛陽軸承集團鐵路軸承有限公司) from September 1997 to March 2009. Ms. Kou has served as the head of financial department and the chief financial officer of Luoyang State-owned Assets Operation Company Limited (洛陽市國資國有資產經營有限公司) from March 2009 to March 2016. She also served as an executive supervisor of Luoyang Guochen Commerce and Trade Co., Ltd. (洛陽國辰商貿有限公司) from September 2012 to October 2016; a director of Luoyang Coal Power Group Company Limited (洛陽煤電集團有限公司) from August 2013 to October 2016; an executive supervisor of Luoyang Guorun Enterprise Services Co., Ltd. (洛陽市國潤企業服務有限公司) from March 2014 to September 2016; a deputy general manager of Luoyang Guohong Investment Group Co., Ltd. (洛陽國宏投資集團有限公司) since December 2015. She was an assistant to general manager and the general manager of supervisory and audit department of Luoyang Guohong Investment Group Co., Ltd.. She currently serves as a supervisor Luoyang Mining Group Co., Ltd (洛陽礦業集團有限公司) and the director of Henan Guoxin Investment Guarantee Co., Ltd. and Luoyang Huaze Microcredit Co., Ltd. (洛陽華澤小額貸款有限公司).
Mr. Zhang Zhenhao, aged 44, has been a supervisor of the Company since August 2009. Mr. Zhang concurrently acts as a director of Cathay Fortune Corporation, a director of Cathay Fortune Investment Limited 鴻商投資有限公司), a director of Cathay Fortune International Company Limited (鴻商產業國際有限公司), a director of Cathay Fortune Singapore Pte. Ltd. (鴻商產業新加坡(私人)有限公司), a director of Shanghai CFC Puyuan Investment Management Co., Ltd (上海鴻商普源投資管理有限公司), a director of Shanghai CFC Datong Industrial Co., Ltd. (上海鴻商大通實業有限公司), a director of Shanghai Shanglue Trading Co., Ltd (上海商略貿易有限公司), a director of Beijing Huiqiao Investment Co., Ltd (北京匯橋投資有限公司) and a director of Cathay Fortune Capital Equity Investment Co., Ltd.* (鴻商資本股權投資有限公司). Mr. Zhang graduated from Tianjin Polytechnic University with a bachelor’s degree in textile engineering. Mr. Zhang also obtained a master degree in finance from the Graduate School of The Chinese Academy of Social Sciences and the CFA qualification from the CFA Institute. From 1993 to 1999, Mr. Zhang held positions at Tianjin Yarn-dyed Company (天津色織公司), Tianjin Weaving Materials Exchange, Hainan Zhongshang Futures Exchange* (海南中商期貨交易所). From May 1999 to December 2001, Mr. Zhang was employed by Zhongfu Securities Dealer Co. Ltd. as member of the preparatory division, general manager of the business management department and supervisor of the company. From January 2002 to May 2007, Mr. Zhang was employed by Zhongfu Securities Co. Ltd. as member of the preparatory division, general manager of the sales department of Haikou Securities, executive director of the sales management department, secretary to the board of directors of the company and general manager of the chief executive office and the human resources department. Since June 2007, Mr. Zhang has been the general manager of the finance department of Cathay Fortune Corporation.
79China Molybdenum Co., Ltd.
PROFILES OF DIRECTORS, SUPERVISORS AND SENIOR MANAGEMENT
Ms. Wang Zhengyan, aged 46, has been a supervisor of the Company since 19 January 2015. Ms. Wang graduated from the Department of Finance of Henan Agricultural University, the People’s Republic of China. From 1990 to January 2008, she worked at China Luoyang Float Glass Group Co., Ltd.’s property management department, planning and development department and international engineering company. She joined the Company in January 2008, served as the deputy manager of China Molybdenum Metallic Material Company Ltd. from 2009 to 2011, and served as the deputy manager of Xinjiang Luomu Mining Co., Ltd. from 2011 to January 2013. Since January 2013, she served as the section chief of investment engineering section of the Company. From January 2015 to January 2016, she served as the chairperson of the Company’s labour union.
SECRETARY TO THE BOARD
Mr. Yue Yuanbin, aged 44, has been the secretary to the Board of the Company since 3 March 2017. He graduated with a bachelor’s degree in engineering from the department of materials engineering of the Shenyang Industrial College in July 1995. Mr. Yue then obtained a master's degree in technology economics from the School of Economics and Management of Tongji University in March 1998. Mr. Yue served as a managing director of the corporate finance department of Guotai Junan Securities Co. Ltd., a vice president in the investment banking division of China Fortune Securities Co. Ltd. and a vice president of NewMargin Ventures.
COMPANY SECRETARY
Ms. Ho Siu Pik, is currently a director of Corporate Services of Tricor Services Limited (“Tricor”), a global professional services provider specializing in integrated Business, Corporate and Investor Services. Ms. Ho has over 20 years of experience in the corporate secretarial field and has been providing professional corporate services to Hong Kong listed companies as well as multinational, private and offshore companies. Other than the Company, Ms. Ho currently serves as company secretary/joint company secretary at five companies which are listed on the Hong Kong Stock Exchange, including Asia Cement (China) Holdings Corporation (亞洲水泥(中國)控股公司) (stock code: 743), China Greenland Broad Greenstate Group Company Limited (中國綠地博大綠澤集團有限公司) (stock code: 1253), Goodbaby International Holdings Limited (好孩子國際控股有限公司) (stock code: 1086), Natural Beauty Bio-Technology Limited (自然美生物科技有限公司) (stock code: 157) and Summit Ascent Holdings Limited (凱升控股有限公司) (stock code: 102). Ms. Ho is a Chartered Secretary and a Fellow member of both The Hong Kong Institute of Chartered Secretaries (“HKICS”) and The Institute of Chartered Secretaries and Administrators in the United Kingdom. Ms. Ho is a holder of the Practitioner’s Endorsement from HKICS.
SENIOR MANAGEMENT
Our senior management also comprises the following persons:
Ms. Gu Meifeng, aged 53, has been the chief financial officer of the Company since August 2006. Ms. Gu graduated from Henan University in 1995 and obtained a master’s degree in accounting from The Chinese University of Hong Kong in December 2009. From 1986 to 1994, Ms. Gu worked on cost accounting with China YTO Group Corporation Equipment Reparation & Manufacturing Plant. From 1994 to June 2006, Ms. Gu was a deputy general manager of Luoyang Zhonghua Certified Public Accountants Co., Ltd. Between 2000 and 2006, Ms. Gu served as an independent supervisor of Luoyang Glass Company Limited, a company listed on both the Shanghai Stock Exchange (stock code: 600876) and the Hong Kong Stock Exchange (stock code: 01108). Ms. Gu was our executive Director from June 2013 to June 2015. In addition, Ms. Gu has been serving as a director of Xinjiang Luomu Mining Co., Ltd since July 2011 and as a supervisor of Luoyang High Tech Molybdenum & Tungsten Materials Co., Ltd. since May 2010. Ms. Gu is a certified public accountant, registered asset appraiser and senior accountant.
Mr. Jiang Zhongqiang, aged 51, has been our deputy general manager since January 2014. Mr. Jiang graduated from Harbin University of Science and Technology (哈爾濱科學技術大學) in July 1989 with a bachelor’s degree in engineering. Mr. Jiang previously served as the chief of the Shanghai office of the sales department of Beijing State-owned Factory No. 798 (北京國營第798廠); the business manager of Beijing Murata Electronics Co., Ltd. (北京村田電子有限公司); the deputy director of sales and deputy director of production at Beijing Leader & Harvest Electric Technologies Co., Ltd. (北京利德華福電子技術有限公司). Mr. Jiang joined the Company in December 2012 and assumed the positions of assistant general manager, manager of sales and head of marketing administration department.
80 2017 Annual Report
PROFILES OF DIRECTORS, SUPERVISORS AND SENIOR MANAGEMENT
Mr. Jing Shigun, aged 51, is a senior engineer at professor level and has been the deputy general manager of the Company since 26 January 2016. Mr. Jing graduated from Northwest Institute of Light Industry (西北輕工業學院) in July 1989 with a bachelor’s degree in engineering, and specialized in Electric Technology. Mr. Jing received his doctor’s degree in Management Science and Engineering from Xi’an University of Architecture and Technology in 2012. Mr. Jing has over 20 years of experience in the mining industry. During the period from July 1989 to 2013, he successively served as a technician of Lengshui ore processing of LLMC, deputy manager and manager of Mine Company of CMOC (洛陽鉬業礦山公司). During the period from 2014 to July 2015, he studied and worked in the Northparkes copper and gold mines in Australia. Upon his return, he served as the chairman and general manager of Luanchuan County Sanqiang Molybdenum & Tungsten Co., Ltd. (欒川縣三強鉬鎢有限公司).
Mr. Wang Yonghong, aged 50, is a senior engineer and has been the deputy general manager of the Company since 26 January 2016. Mr. Wang graduated from Xi’an Metallurgy and Architecture College (西安冶金建築學院) in July 1989 with a bachelor’s degree, and specialized in mining engineering. Mr. Wang has over 20 years of experience in the mining industry and had successively served as a technician and head of No. 2 Ore Processing Company of LLMC (洛陽欒川鉬業公司選礦二公司), chairman and general manager of Luanchuan County Dadongpo Tungsten & Molybdenum Co., Ltd. (欒川縣大東坡鎢鉬礦業有限公司) and manager of No. 2 Ore Processing Company of CMOC (洛陽鉬業選礦二公司).
Ms. Wu Yiming, aged 43, has served as vice general manager of the Company since 31 January 2018. Ms. Wu graduated from Fudan University (復旦大學) in 1997 and obtained a master’s degree of management in Stanford University (美國斯坦福大學) in July 2008. She has rich experience in such fields as legal affairs management, financial management, assets management and corporate governance. Before joining the Company, Ms. Wu entered Baosteel Group (寶鋼集團) in July 1997 and served as senior legal executive, deputy director and director of the asset management department of Shanghai Baosteel International Trade Co., Ltd. (上海寶鋼國際貿易有限公司). She worked as the secretary of the board and director of the asset financial department of Baosteel Resources Co., Ltd. (寶鋼資源有限公司) from July 2008 to July 2010, and served as general manager assistant, the secretary of the board and director of the asset financial department of Baosteel Resources Co., Ltd. from July 2010 to July 2012. From September 2010 to July 2012, she held a concurrent position of general manager assistant of Baosteel Resources (International) Co., Ltd. (寶鋼資源(國際)有限公司). From July 2012 to March 2017, she worked as vice general manager of Baosteel Resources Co., Ltd. and Baosteel Resources (International) Co., Ltd. From February 2017 to January 2018, Ms. Wu served as the secretary of the board of Baoshan Iron & Steel Co., Ltd.
81China Molybdenum Co., Ltd.
CORPORATE INFORMATION
DIRECTORS
Executive Directors
Li Chaochun (Chairman)Li Faben (General Manager)
Non-Executive Directors
Ma Hui (Vice Chairman)Yuan HonglinCheng Yunlei
Independent Non-Executive Directors
Bai YanchunCheng GordonXu Shan
SUPERVISORS
Kou Youmin (Chairperson of the Supervisory Committee)Zhang ZhenhaoWang Zhengyan
BOARD COMMITTEES
Remuneration Committee
Bai Yanchun (Chairman)Cheng GordonYuan Honglin
Audit Committee
Xu Shan (Chairman)Cheng GordonYuan Honglin
Strategic Committee
Li Chaochun (Chairman)Li FabenBai YanchunYuan Honglin
Nomination Committee
Bai Yanchun (Chairman)Li Chaochun (Vice Chairman)Xu ShanCheng Gordon
BOARD SECRETARY
Yue Yuanbin (appointed on 3 March 2017)
COMPANY SECRETARY
Ho Siu Pik (FCS and FCIS)
REGISTERED OFFICE IN THE PRC
North of Yihe, Huamei Shan RoadChengdong New District, Luanchuan CountyLuoyang City, Henan Province, the PRC
PRINCIPAL PLACE OF BUSINESS IN THE PRC
North of Yihe, Huamei Shan RoadChengdong New District, Luanchuan CountyLuoyang City, Henan Province, the PRC
PRINCIPAL PLACE OF BUSINESS IN HONG KONG
Level 54, Hopewell Centre, 183 Queen’s Road East, Hong Kong
LEGAL REPRESENTATIVE
Li Chaochun
AUTHORIZED REPRESENTATIVES
Li ChaochunHo Siu Pik
82 2017 Annual Report
CORPORATE INFORMATION
ENQUIRY DEPARTMENT OF THE COMPANY
Office of the Board of Directors
I N F O R M A T I O N E N Q U I R Y TELEPHONE NO. OF THE COMPANY
(+86) 379 6865 8017
SHANGHAI A SHARE REGISTRAR
China Securities Depository and Clearing Company Limited, Shanghai Branch 36/F, China Insurance BuildingNo. 166 Lujiazui Road EastPudong New AreaShanghai, the PRC
HONG KONG H SHARE REGISTRAR
Computershare Hong Kong Investor Services LimitedShops 1712–1716, 17th Floor, Hopewell Centre183 Queen’s Road East, Wanchai, Hong Kong
PLACES OF LISTING
Place of listing of A share – The Shanghai Stock Exchange
Place of listing of H share – The Stock Exchange of Hong Kong Limited
NAME OF THE STOCK
China Molybdenum Co., Ltd. (CMOC)
STOCK CODE
Stock code of A share: 603993 (Listed on 9 October 2012)Stock code of H share: 03993 (Listed on 26 April 2007)
PRINCIPAL BANKERS
1. Industrial and Commercial Bank of China Limited2. Agricultural Bank of China Limited3. China Construction Bank Corporation4. Bank of China Limited5. China Minsheng Banking Corp., Ltd.6. China CITIC Bank Corporation Limited7. China Development Bank Corporation8. Ping An Bank Co., Ltd.
AUDITOR
Deloitte Touche Tohmatsu Certified Public Accountants LLP (Special General Partnership)
LEGAL ADVISORS
As to Hong Kong law:
Freshfields Bruckhaus Deringer55/F, One Island East, Taikoo PlaceQuarry Bay, Hong Kong
As to PRC law:
Llinks Law Offices19/F, One Lujiazui68 Yin Cheng Road MiddleShanghai, the PRC
WEBSITE
www.chinamoly.com
83China Molybdenum Co., Ltd.
AUDITOR'S REPORT
De Shi Bao (Shen) Zi (18) No. P01698
To all shareholders of China Molybdenum Co., Ltd.,
I. OPINION
We have audited the accompanying financial statements of China Molybdenum Co., Ltd. (hereinafter referred to as "CMOC", or "the Company"), which comprise the consolidated and the Company's statements of financial position as at 31 December 2017, and the consolidated and the Company's statements of profit or loss and other comprehensive income, the consolidated and the Company's cash flow statements, and the consolidated and the Company's statements of changes in shareholders' equity for the year then ended, and the notes to the financial statements.
In our opinion, the accompanying financial statements of CMOC present fairly, in all material respects, the consolidated and the Company's financial position as of 31 December 2017, and the consolidated and the Company's results of operations and cash flows for the year then ended in accordance with Accounting Standards for Business Enterprises.
II. BASIS FOR OPINION
We conducted our audit in accordance with China Standards on Auditing. Our responsibilities under those standards are further described in the Auditor's Responsibilities for the Audit of the Consolidated Financial Statements section of our report. We are independent of CMOC in accordance with the Code of Ethics for Chinese Certified Public Accountants, and we have fulfilled our other ethical responsibilities in accordance with the Code. We believe that the audit evidences we have obtained are sufficient and appropriate to form our opinion.
III. KEY AUDIT MATTERS
The key audit matters are the most important matters that we consider to the audit of financial statements based on our professional judgment. The responses to these matters are based on the audit of the financial statements as a whole and the formation of an audit opinion. We do not express an opinion on these matters separately. We determine that the following are key audit matters that need to be communicated in the auditor's report.
(I) Impairment of Mining Rights and Goodwill
Description
We identified the impairment of mining rights and goodwill as a key audit matter, mainly due to the significant management estimates and judgments used to determine the recoverable amount of relevant cash-generating units. As at end of the reporting period, CMOC has several mineral related rights of molybdenum and tungsten, copper and gold, niobium and phosphorus, copper and cobalt, including intangible assets – mining rights, and goodwill related to the acquisition of phosphate business in Brazil in 2016.
In view of the significant carrying amounts of CMOC's mining rights and the significant fluctuation for commodity prices in both domestic and foreign market, the management evaluates if there exists any impairment indicators of these mining rights and related long-term assets at each balance sheet date. The management shall perform impairment test for the mining rights with impairment indicators at each balance sheet date.
The above mentioned impairment review is related to the management's significant estimates and judgments, including mineral reserves, discount rates, and cash flow forecasts based on future market supply and demand. Changes in the management's estimates and judgments may have significant financial impacts.
84 2017 Annual Report
AUDITOR'S REPORT
III. KEY AUDIT MATTERS (CONTINUED)
(I) Impairment of Mining Rights and Goodwill (Continued)
Audit Response
The audit procedures we performed for the impairment risk of mining rights and goodwill include:
1. Reviewing the the management's judgements and analyses for the impairment tests of mining rights based on the operations of the related cash generating units in the current period;
2. Evaluating the valuation models for goodwill and mining rights which have impairment indicators adopted by the management;
3. Based on our understanding of the business, analyzing and reviewing the rationality of significant assumptions and judgements the management used in the impairment test of the present value of future cash flow;
4. Analyzing and reviewing the discount rate the management used in the impairment test;
5. Checking the underlying data used in the calculation of the present value of the expected future cash flows with the historical data and other supporting evidence, and considering the rationality.
(II) Revenue Recognition
Description
We identify the revenue recognition as a key audit matter, mainly because, as an A+H listed company, CMOC's revenue is generally considered to be a key business indicator. The CMOC's business segments include molybdenum-tungsten-related products, copper-gold-related products, antimony-related products, phosphorus-related products, copper-cobalt-related products and others. Based on the complexity of the income process and related internal controls, we identify the revenue recognition as a key audit matter.
Audit Response
The key audit procedures we performed for revenue recognition include:
1. Understanding and evaluating the internal controls related to revenue recognition in the sales and collection cycle of CMOC, including the new business and corresponding controls in this year, and testing the effectiveness of its operation;
2. Reviewing the sales contract on a sample basis, identifying the contract terms and conditions related to the transfer of risks and rewards on the ownership of the commodity, and evaluating whether revenue recognition of CMOC complies with the Accounting Standards for Business Enterprises;
3. Performing analytical procedures according to the industry and the operation of CMOC and combining with the commodity prices in market to verify the rationality of revenue recognition in the current period;
4. Performing detail test on sales transactions to verify whether the sales revenue was recorded in the correct period and have any situation of being underestimated or underestimated.

85China Molybdenum Co., Ltd.
AUDITOR'S REPORT
IV. OTHER INFORMATIONThe management of CMOC is responsible for preparation of the other information. The other information comprises the information included in the annual report, but does not include the financial statements and our auditor's report thereon.
Our opinion on the financial statements does not cover other information and we do not express any form of assurance opinion thereon.
In connection with our audit of the financial statements, our responsibility is to read the other information and, in doing so, consider whether the other information is materially inconsistent with the financial statements or our knowledge obtained in the audit or otherwise appears to be materially misstated.
If, based on the work we have performed, we conclude that there is a material misstatement of this other information, we are required to report that fact. In this respect, we have no matter to report.
V. RESPONSIBILITIES OF MANAGEMENT AND THOSE CHARGED WITH GOVERNANCE FOR THE CONSOLIDATED FINANCIAL STATEMENTSThe management of CMOC is responsible for the preparation of the financial statements in accordance with Accounting Standards for Business Enterprises to achieve fair presentation of the financial statements, and for the design, implementation and maintenance of internal control which is necessary to enable the financial statements that are free from material misstatement, whether due to fraud or error.
In preparing the financial statements, the management is responsible for assessing CMOC's ability to continue as a going concern, disclosing, as applicable, matters related to going concern and using the going concern basis of accounting unless the management either intends to liquidate CMOC or to cease operations, or have no other realistic alternative but to do so.
Those charged with governance are responsible for overseeing CMOC's financial reporting process.
VI. AUDITOR'S RESPONSIBILITIES FOR THE AUDIT OF THE FINANCIAL STATEMENTSOur objectives are to obtain reasonable assurance about whether the financial statements as a whole are free from material misstatement, whether due to fraud or error, and to issue an auditor's report that includes our opinion. Reasonable assurance is a high level of assurance, but is not a guarantee that an audit conducted in accordance with audit standards will always detect a material misstatement when it exists. Misstatements can arise from fraud or error and are considered material if, individually or in the aggregate, they could reasonably be expected to influence the economic decisions of users taken on the basis of these financial statements.
As part of an audit in accordance with audit standards, we exercise professional judgment and maintain professional skepticism throughout the audit. We also:
(1) Identify and assess the risks of material misstatement of the financial statements, whether due to fraud or error, design and perform audit procedures responsive to those risks, and obtain audit evidence that is sufficient and appropriate to provide a basis for our opinion. The risk of not detecting a material misstatement resulting from fraud is higher than for one resulting from error, as fraud may involve collusion, forgery, intentional omissions, misrepresentations, or the override of internal control.
(2) Obtain an understanding of internal control relevant to the audit in order to design audit procedures that are appropriate in the circumstances.
(3) Evaluate the appropriateness of accounting policies used and the reasonableness of accounting estimates and related disclosures made by the management.
(4) Conclude on the appropriateness of the management's use of the going concern basis of accounting and, based on the audit evidence obtained, whether a material uncertainty exists related to events or conditions that may cast significant doubt on CMOC's ability to continue as a going concern. If we conclude that a material uncertainty exists, we are required to draw attention in our auditor's report to the related disclosures in the financial statements or, if such disclosures are inadequate, to modify our opinion. Our conclusions are based on the audit evidence obtained up to the date of our auditor's report. However, future events or conditions may cause CMOC to cease to continue as a going concern.
86 2017 Annual Report
AUDITOR'S REPORT
VI. AUDITOR'S RESPONSIBILITIES FOR THE AUDIT OF THE FINANCIAL STATEMENTS (CONTINUED)
(5) Evaluate the overall presentation, structure and content of the financial statements, including the disclosures, and whether the financial statements represent the transactions and events in a manner that achieves fair presentation.
(6) Obtain sufficient and appropriate audit evidence regarding the financial information of the entities or business activities within CMOC to express an opinion on the financial statements. We are responsible for the direction, supervision and performance of the group audit. We remain solely responsible for our audit opinion.
We communicate with those charged with governance regarding, among other matters, the planned scope and timing of the audit and significant audit findings, including any significant deficiencies in internal control that we identify during our audit.
We also provide a statement to those charged with governance on compliance with the ethical requirements related to independence and communicate with those charged with governance of all relationships and other matters that may reasonably be considered to affect our independence, as well as related precautions (if applicable)
Among the matters that are communicated with those charged with governance, we determine the matters that are most important to the current financial statement audit and thus constitute key audit matters. We describe these matters in the audit report unless the laws and regulations prohibit public disclosure of these matters or, in rare cases, if the negative consequences, upon reasonable expectation, of communicating the matters in the audit report exceed the public interest arising from them, we decide not to communicate these matters in the audit report.
Deloitte Touche Tohmatsu Certified Public Accountants LLP
Chinese Certified Public Accountant: Yang Haijiao(Engagement Partner)
Shanghai,China
Chinese Certified Public Accountant: Zhao Bin
29 March 2018
The auditor’ s report and the accompanying financial statements are English translations of the Chinese auditor’s report and statutory financial statements prepared under accounting principles and practices generally accepted in the People’s Republic of China. These financial statements are not intended to present the financial position and results of operations and cash flows in accordance with accounting principles and practices generally accepted in other countries and jurisdictions. In case the English version does not conform to the Chinese version, the Chinese version prevails.

87China Molybdenum Co., Ltd.
CONSOLIDATED STATEMENT OF FINANCIAL POSITIONFOR THE YEAR ENDED 31 DECEMBER 2017
Unit: RMB
Items Notes 2017 2016(Restated)
Current assets: Cash and bank balances (V)1 26,508,760,356.69 9,970,224,098.00Financial assets measured at fair value through profit or loss (V)2 – 55,599,027.64Note receivables (V)3 1,750,691,877.20 950,861,625.20Accounts receivable (V)4 2,144,630,758.99 1,461,807,199.82Prepayments (V)5 110,584,046.50 295,572,093.16Interests receivable (V)6 656,703,058.71 40,492,844.02Other receivables (V)7 789,924,287.57 1,147,039,318.23Inventories (V)8 5,705,499,726.29 5,082,767,464.99Other current assets (V)9 1,382,004,121.85 798,592,555.76
Total current assets 39,048,798,233.80 19,802,956,226.82
Non-current assets:Available-for-sale financial assets (V)10 3,246,899,715.97 3,000,602,505.46Long-term equity investments (V)11 1,136,372,852.24 1,191,499,274.81Fixed assets (V)12 24,234,932,199.51 27,272,921,262.94Construction in progress (V)13 950,111,239.78 695,359,036.41Long-term inventories (V) 8 4,352,009,676.51 4,269,617,873.56Intangible assets (V)14 21,536,181,739.98 24,501,313,984.47Goodwill (V)15 833,594,422.85 892,326,161.92Long-term deferred expenses (V)16 116,189,386.27 115,247,374.61Deferred tax assets (V)17 304,702,912.44 432,121,448.24Other non-current assets (V)18 2,077,453,773.03 5,750,395,963.14
Total non-current assets 58,788,447,918.58 68,121,404,885.56
Total assets 97,837,246,152.38 87,924,361,112.38
Current liabilities:Short-term borrowings (V)19 1,478,132,364.60 4,372,433,477.73Financial liabilities measured at fair value through profit or loss (V)20 3,592,187,464.60 2,821,441,764.40Note payable (V)21 23,955,000.00 660,000,000.00Accounts payable (V)22 976,480,556.74 741,508,273.30Receipts in advance (V)23 127,796,251.75 51,867,495.95Employee benefits payable (V)24 445,405,839.21 354,822,152.84Taxes payable (V)25 1,137,796,210.24 57,861,242.29Interests payable (V)26 219,805,549.94 183,684,249.15Dividends payable (V)27 27,885,796.67 27,885,796.67Other payables (V)28 604,773,720.50 1,416,775,815.12Non-current liabilities due within one year (V)29 4,797,816,307.62 2,584,497,370.05Other current liabilities (V)30 71,073,182.26 2,708,897,188.46
Total current liabilities 13,503,108,244.13 15,981,674,825.96

88 2017 Annual Report
CONSOLIDATED STATEMENT OF FINANCIAL POSITIONFOR THE YEAR ENDED 31 DECEMBER 2017
Unit: RMB
Items Notes 2017 2016(Restated)
Non-current liabilities:Long-term borrowings (V)31 22,033,888,519.27 23,376,879,939.49Bonds payable (V)32 2,000,000,000.00 2,000,000,000.00Long-term employee benefits payable (V)33 64,382,271.54 43,278,727.15Provisions (V)34 2,049,904,344.03 1,757,793,672.39Deferred income (V)35 72,890,478.36 80,305,706.76Deferred tax liabilities (V)17 8,603,594,339.00 9,832,650,420.12Other non-current liabilities (V)36 3,600,343,678.47 514,850,853.14
Total non-current liabilities 38,425,003,630.67 37,605,759,319.05
Total liabilities 51,928,111,874.80 53,587,434,145.01
Shareholders' equity:Share capital (V)37 4,319,848,116.60 3,377,439,739.80Capital reserve (V)38 27,582,794,983.23 10,720,306,602.38Other comprehensive income (V)39 (238,817,602.94) 282,854,287.93Special reserve (V)40 7,725,910.79 8,570,089.43Surplus reserve (V)41 968,190,696.10 840,098,875.14Retained profits (V)42 5,517,441,023.24 3,508,788,628.94Total equity attributable to the shareholders of the parent company 38,157,183,127.02 18,738,058,223.62Minority interests 7,751,951,150.56 15,598,868,743.75
Total shareholders’ equity 45,909,134,277.58 34,336,926,967.37
Total liabilities and shareholders’ equity 97,837,246,152.38 87,924,361,112.38
The notes are an integral part of these financial statements.
89China Molybdenum Co., Ltd.
STATEMENT OF FINANCIAL POSITION OF THE COMPANYFOR THE YEAR ENDED 31 DECEMBER 2017
RMB
Items Notes 2017 2016
Current assets: Cash and bank balances (XIV)1 17,487,231,031.72 5,835,877,855.42Financial assets measured at fair value through profit or loss – 55,599,027.64Note receivables (XIV)2 1,752,050,995.29 921,074,950.75Accounts receivable (XIV)3 300,925,339.67 743,022,199.15Prepayments (XIV)4 38,725,727.48 25,793,318.61Interests receivable 866,213,586.08 190,414,299.86Dividends receivable 44,006,084.08 44,006,084.08Other receivables (XIV)5 2,002,815,737.36 5,601,449,610.57Inventories (XIV)6 140,107,407.56 179,385,681.07Other current assets 853,374,414.83 384,060,263.45
Total current assets 23,485,450,324.07 13,980,683,290.60
Non-current assets:Available-for-sale financial assets (XIV)7 200,004,928.00 200,004,928.00Long-term equity investments (XIV)8 20,954,027,458.33 16,919,843,199.18Fixed assets (XIV)9 1,394,454,993.08 1,467,817,505.01Construction in progress 68,857,653.32 50,156,115.95Intangible assets (XIV)10 398,962,358.67 432,042,585.32Long-term deferred expenses 137,619,000.59 141,865,628.81Deferred tax assets (XIV)11 – –Other non-current assets (XIV)13 29,709,022.42 2,544,608,311.15
Total non-current assets 23,183,635,414.41 21,756,338,273.42
Total assets 46,669,085,738.48 35,737,021,564.02
Current liabilities:Short-term borrowings (XIV)14 560,000,000.00 3,956,213,477.73Financial liabilities measured at fair value through profit or loss (XIV)15 3,000,757,420.00 2,775,837,926.40Note payable – 260,000,000.00Accounts payable 149,731,043.78 107,501,663.22Receipts in advance 11,565,545.47 208,917.85Employee benefits payable 59,821,416.14 47,988,426.90Taxes payable (XIV)16 41,389,393.06 (34,774,661.25)Interests payable 105,983,609.81 139,246,310.44Other payables 1,012,766,375.74 708,168,512.60Non-current liabilities due within one year 946,794,501.74 2,129,587,638.71Other current liabilities (XIV)17 235,112,576.27 2,793,802,328.86
Total current liabilities 6,123,921,882.01 12,883,780,541.46
90 2017 Annual Report
STATEMENT OF FINANCIAL POSITION OF THE COMPANYFOR THE YEAR ENDED 31 DECEMBER 2017
RMB
Items Notes 2017 2016
Non-current liabilities:Long-term borrowings 2,136,500,000.00 3,078,312,000.00Bonds payable (V)32 2,000,000,000.00 2,000,000,000.00Deferred income 17,973,581.90 18,359,167.70Deferred tax liabilities (XIV)11 45,584,434.70 15,138,783.05Provisions (XIV)18 47,570,371.67 47,570,371.67Other non-current liabilities 381,956,274.62 325,939,249.09
Total non-current liabilities 4,629,584,662.89 5,485,319,571.51
Total liabilities 10,753,506,544.90 18,369,100,112.97Share capital (V)37 4,319,848,116.60 3,377,439,739.80Capital reserve (V)38 27,636,530,888.88 10,720,306,602.38Special reserve 7,008,359.58 7,849,535.47Retained profits (V)41 968,190,696.10 840,098,875.14Total equity attributable to the shareholders of the parent company 2,984,001,132.42 2,422,226,698.26
Total shareholders’ equity 35,915,579,193.58 17,367,921,451.05
Total liabilities and shareholders’ equity 46,669,085,738.48 35,737,021,564.02

91China Molybdenum Co., Ltd.
CONSOLIDATED INCOME STATEMENTFOR THE YEAR ENDED 31 DECEMBER 2017
RMB
Items Notes 2017 2016
I. Total operating income (V)43 24,147,557,764.10 6,949,571,006.97Including: Operating Revenue 24,147,557,764.10 6,949,571,006.97Less: Operating costs (V)43 15,211,941,056.16 4,623,818,131.37
Taxes and levies (V)44 344,327,822.83 230,309,410.01Selling expenses (V)45 214,841,000.82 90,619,385.55Administrative expenses (V)46 1,159,094,020.73 714,734,732.89Financial expenses (V)47 1,416,973,989.63 407,668,376.31Asset impairment losses (V)48 56,601,549.76 351,855,260.03
Add: Gains (losses) from changes in fair values (loss is filled in column with“-”) (V)49 (471,765,881.20) 46,420,313.67
Investment income (loss is filled in column with“-”) (V)50 108,699,021.53 174,182,583.74Including: Income from investments in associates and joint
ventures 30,173,577.43 7,210,716.74Income(loss) from disposal of assets (17,491,578.26) 5,770,618.09Other income (V)51 13,858,795.40 –
II. Operating profit (loss is filled in column with“-”) 5,377,078,681.64 756,939,226.31Add: Non-operating income (V)52 39,046,036.11 460,431,808.03Less: Non-operating expenses (V)53 34,308,061.30 27,229,744.84
III. Total profit (the total loss is filled in column with“-”) 5,381,816,656.45 1,190,141,289.50Less: Income tax expenses (V)54 1,786,201,228.63 170,902,855.30
IV. Net profit (the total loss is filled in column with“-”) 3,595,615,427.82 1,019,238,434.20(I) Categorized by the nature of continuing operation
1. Net profit from continuing operations 3,595,615,427.82 1,019,238,434.202. Net profit from discontinued operations – –
(II) Categorized by ownership:1. Profit or loss attributable to minority interests 867,819,258.09 21,197,853.452. Net profit attributable to owners of the parent company 2,727,796,169.73 998,040,580.75
V. Other comprehensive income, net of tax (V)39 (1,024,042,650.91) 1,060,633,211.86Other comprehensive income attributable to owners of the parent
company, net of tax (521,671,890.87) 915,347,005.69(1) Other comprehensive income not to be reclassified
subsequently to profit or loss – –(2) Other comprehensive income to be reclassified subsequently
to profit or loss (521,671,890.87) 915,347,005.691. Gains or losses from changes in the fair value of available-
for- sale financial assets 372,378,548.71 265,275,924.462. Exchange differences arising from translation of financial
from translation of financial foreign currencies (894,050,439.58) 650,071,081.23Other comprehensive income attributable to minority interests, net
of tax (502,370,760.04) 145,286,206.17
VI. Total comprehensive income 2,571,572,776.91 2,079,871,646.06Total comprehensive income attributable to owners of the parent
company 2,206,124,278.86 1,913,387,586.44Total comprehensive income attributable to minority interests 365,448,498.05 166,484,059.62
VII. Earnings per share: (V)55(1) Basic earnings per share 0.14 0.06(2) Diluted earnings per share N/A N/A

92 2017 Annual Report
INCOME STATEMENT OF THE COMPANYFOR THE YEAR ENDED 31 DECEMBER 2017
RMB
Item Notes 2017 2016
I. Operating income (XIV)19 3,198,004,246.93 2,267,260,159.13Less: Operating costs (XIV)19 1,251,939,522.99 1,073,143,744.68
Taxes and levies (XIV)20 270,396,482.17 177,732,464.28Selling expenses 818,486.90 1,196,470.09Administrative expenses (XIV)21 379,490,425.65 475,032,132.89Financial expenses (XIV)22 (75,709,548.84) 56,619,581.08Asset impairment losses (XIV)23 8,352,425.07 11,947,598.08
Add: Gains (losses) from changes in fair values (loss is filled in column with“-”) (47,462,821.24) 41,195,810.27
Investment income (loss is filled in column with“-”) (XIV)24 122,660,256.78 89,407,474.35Including: Income from investments in associates
and joint ventures 44,256,449.15 16,287,797.94 Income(loss) from disposal of assets 634,474.01 6,311,639.78Other income 6,335,528.80 –
II. Operating profit (loss is filled in column with“-”) 1,444,883,891.34 608,503,092.43Add: Non-operating income (XIV) 25 9,760,097.80 28,460,124.41Less: Non-operating expenses (XIV)26 27,033,929.35 22,996,342.18
III. Total profit (the total loss is filled in column with“-”) 1,427,610,059.79 613,966,874.66Less: Income tax expenses (XIV)27 146,691,850.20 73,478,942.66
IV. Net profit (the total loss is filled in column with“-”) 1,280,918,209.59 540,487,932.001. Net profit from continuing operations 1,280,918,209.59 540,487,932.002. Net profit from discontinued operations – –
V. Other comprehensive income, net of tax – –
VI. Total comprehensive income 1,280,918,209.59 540,487,932.00
93China Molybdenum Co., Ltd.
CONSOLIDATED CASH FLOW STATEMENTFOR THE YEAR ENDED 31 DECEMBER 2017
RMB
Item Notes 2017 2016
I. Cash flows from operating activities: Cash received from sales of goods and provision of services 24,594,249,547.53 7,644,877,598.25Other cash receipts relating to operating activities 56(1) 654,815,073.95 424,655,803.23
Sub-total of cash inflows from operating activities 25,249,064,621.48 8,069,533,401.48
Cash payments for goods purchased and services received 11,736,234,356.47 3,270,936,032.65Cash payments to and on behalf of employees 1,770,189,163.68 807,877,516.60Payments of various types of taxes 2,040,126,797.30 679,114,545.34Other cash payments relating to operating activities 56(2) 1,273,702,376.44 396,778,870.84
Sub-total of cash outflows from operating activities 16,820,252,693.89 5,154,706,965.43
Net cash flow from operating activities 8,428,811,927.59 2,914,826,436.05
II. Cash flows from investing activities:Cash receipts from disposals and recovery of investments 56(3) 2,002,812,919.34 3,335,928,536.55Cash receipts from investment income 93,330,802.88 270,861,902.66Net cash receipts from disposals of fixed assets, intangible assets
and other long-term assets 26,990,397.07 29,299,477.76Sub-total of cash inflows from investing activities 2,123,134,119.29 3,636,089,916.97Cash payments for acquisitions or disposals of subsidiaries and
other business units – 28,104,661,705.58Cash payments to acquire or construct fixed assets, intangible
assets and other long-term assets 1,066,476,069.70 854,261,494.40Cash payments to acquire investments 56(4) 4,834,287,613.77 1,416,192,938.05Other cash payments relating to investing activities 56(5) 331,596,665.00 908,964,508.15
Sub-total of cash outflows from investing activities 6,232,360,348.47 31,284,080,646.18
Net cash flow from investing activities (4,109,226,229.18) (27,647,990,729.21)

94 2017 Annual Report
CONSOLIDATED CASH FLOW STATEMENTFOR THE YEAR ENDED 31 DECEMBER 2017
RMB
Item Notes 2017 2016
III. Cash flows from financing activities:Cash receipts from capital contributions (Note V,37) 17,858,632,663.30 –Cash receipts from borrowings 10,560,506,152.83 29,429,208,701.12Other cash receipts relating to financing activities 56(6) 1,485,196,100.00 3,027,283,088.84
Sub-total of cash inflows from financing activities 29,904,334,916.13 32,456,491,789.96
Cash repayments of indebtedness 11,038,950,687.84 5,186,639,691.64Cash payments for distribution of dividends or profits and
settlement of interests 2,147,305,447.60 1,108,374,156.14Including: dividends payments from subsidiary to minority holders 347,520,438.97 161,570,118.00Other cash payments relating to financing activities 56(7) 9,346,042,795.06 2,170,787,930.78
Sub-total of cash outflows from financing activities 22,532,298,930.50 8,465,801,778.56
Net cash flow from financing activities 7,372,035,985.63 23,990,690,011.40
IV. Effect of foreign exchange rate changes on (330,411,473.47) 180,520,047.75
V. Net increase in cash and cash equivalents 11,361,210,210.57 (561,954,234.01)Add: Opening balance of cash and cash equivalents 57(2) 8,420,208,068.29 8,982,162,302.30
VI. Closing balance of cash and cash equivalents 57(2) 19,781,418,278.86 8,420,208,068.29
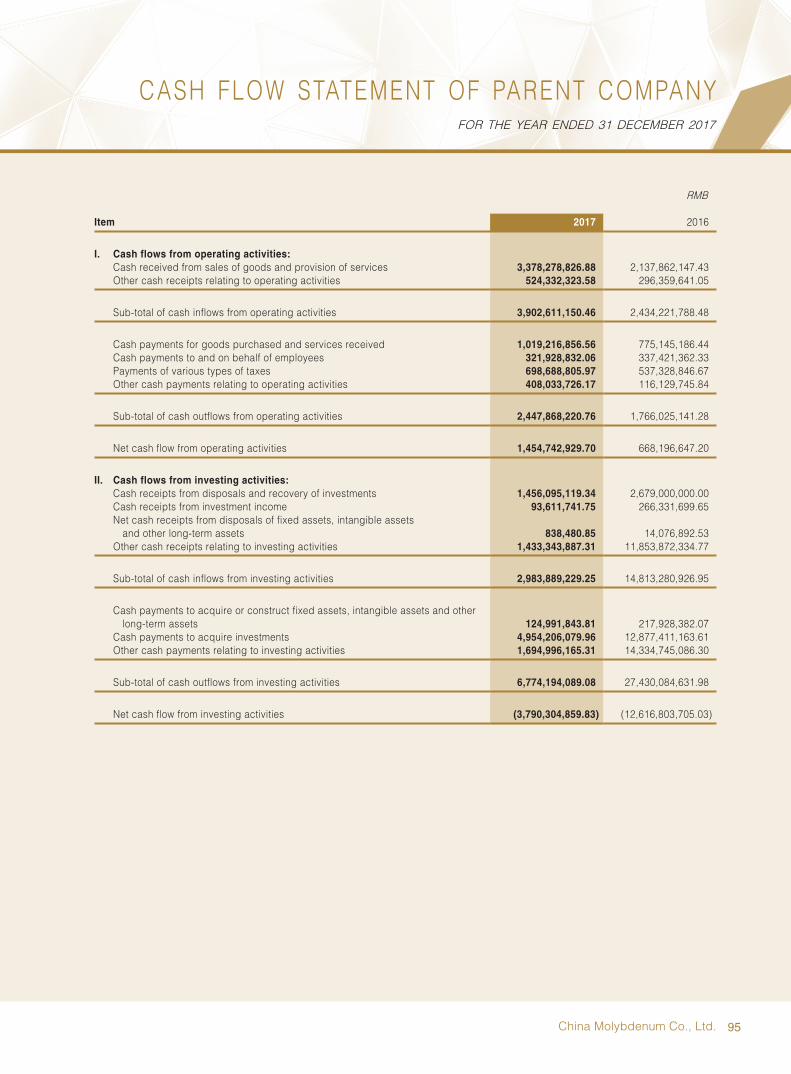
95China Molybdenum Co., Ltd.
CASH FLOW STATEMENT OF PARENT COMPANYFOR THE YEAR ENDED 31 DECEMBER 2017
RMB
Item 2017 2016
I. Cash flows from operating activities: Cash received from sales of goods and provision of services 3,378,278,826.88 2,137,862,147.43Other cash receipts relating to operating activities 524,332,323.58 296,359,641.05
Sub-total of cash inflows from operating activities 3,902,611,150.46 2,434,221,788.48
Cash payments for goods purchased and services received 1,019,216,856.56 775,145,186.44Cash payments to and on behalf of employees 321,928,832.06 337,421,362.33Payments of various types of taxes 698,688,805.97 537,328,846.67Other cash payments relating to operating activities 408,033,726.17 116,129,745.84
Sub-total of cash outflows from operating activities 2,447,868,220.76 1,766,025,141.28
Net cash flow from operating activities 1,454,742,929.70 668,196,647.20
II. Cash flows from investing activities:Cash receipts from disposals and recovery of investments 1,456,095,119.34 2,679,000,000.00Cash receipts from investment income 93,611,741.75 266,331,699.65Net cash receipts from disposals of fixed assets, intangible assets
and other long-term assets 838,480.85 14,076,892.53Other cash receipts relating to investing activities 1,433,343,887.31 11,853,872,334.77
Sub-total of cash inflows from investing activities 2,983,889,229.25 14,813,280,926.95
Cash payments to acquire or construct fixed assets, intangible assets and other long-term assets 124,991,843.81 217,928,382.07
Cash payments to acquire investments 4,954,206,079.96 12,877,411,163.61Other cash payments relating to investing activities 1,694,996,165.31 14,334,745,086.30
Sub-total of cash outflows from investing activities 6,774,194,089.08 27,430,084,631.98
Net cash flow from investing activities (3,790,304,859.83) (12,616,803,705.03)
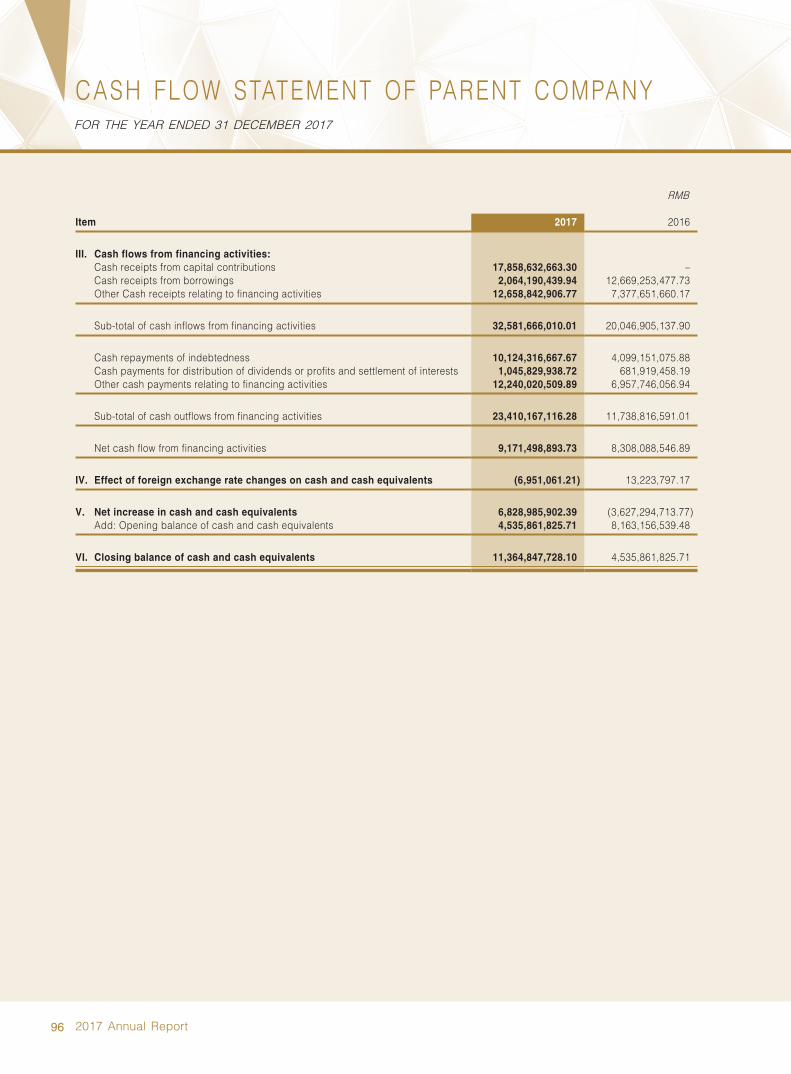
96 2017 Annual Report
CASH FLOW STATEMENT OF PARENT COMPANYFOR THE YEAR ENDED 31 DECEMBER 2017
RMB
Item 2017 2016
III. Cash flows from financing activities:Cash receipts from capital contributions 17,858,632,663.30 –Cash receipts from borrowings 2,064,190,439.94 12,669,253,477.73Other Cash receipts relating to financing activities 12,658,842,906.77 7,377,651,660.17
Sub-total of cash inflows from financing activities 32,581,666,010.01 20,046,905,137.90
Cash repayments of indebtedness 10,124,316,667.67 4,099,151,075.88Cash payments for distribution of dividends or profits and settlement of interests 1,045,829,938.72 681,919,458.19Other cash payments relating to financing activities 12,240,020,509.89 6,957,746,056.94
Sub-total of cash outflows from financing activities 23,410,167,116.28 11,738,816,591.01
Net cash flow from financing activities 9,171,498,893.73 8,308,088,546.89
IV. Effect of foreign exchange rate changes on cash and cash equivalents (6,951,061.21) 13,223,797.17
V. Net increase in cash and cash equivalents 6,828,985,902.39 (3,627,294,713.77)Add: Opening balance of cash and cash equivalents 4,535,861,825.71 8,163,156,539.48
VI. Closing balance of cash and cash equivalents 11,364,847,728.10 4,535,861,825.71
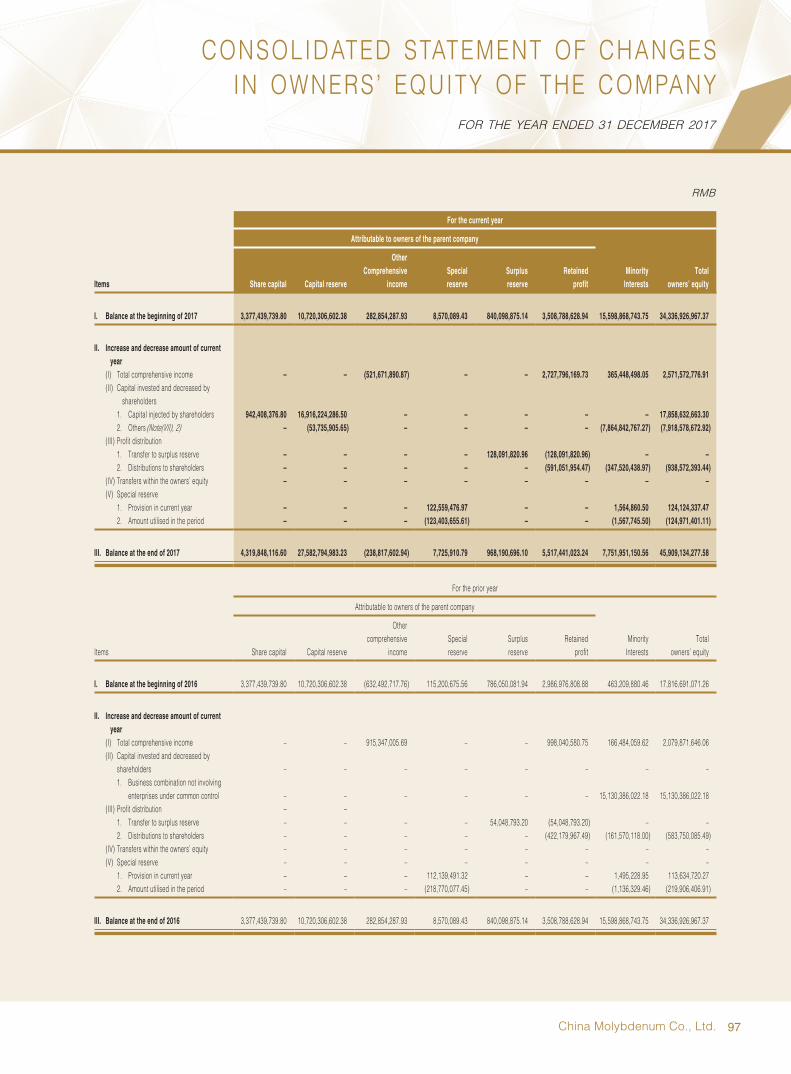
97China Molybdenum Co., Ltd.
CONSOLIDATED STATEMENT OF CHANGES IN OWNERS’ EQUITY OF THE COMPANY
FOR THE YEAR ENDED 31 DECEMBER 2017
RMB
For the current year Attributable to owners of the parent company
Minority Interests
Total owners’ equity
Items Share capital Capital reserve
Other Comprehensive
incomeSpecial reserve
Surplus reserve
Retained profit
I. Balance at the beginning of 2017 3,377,439,739.80 10,720,306,602.38 282,854,287.93 8,570,089.43 840,098,875.14 3,508,788,628.94 15,598,868,743.75 34,336,926,967.37
II. Increase and decrease amount of current year
(I) Total comprehensive income – – (521,671,890.87) – – 2,727,796,169.73 365,448,498.05 2,571,572,776.91(II) Capital invested and decreased by
shareholders 1. Capital injected by shareholders 942,408,376.80 16,916,224,286.50 – – – – – 17,858,632,663.302. Others (Note(VII), 2) – (53,735,905.65) – – – – (7,864,842,767.27) (7,918,578,672.92)
(III) Profit distribution 1. Transfer to surplus reserve – – – – 128,091,820.96 (128,091,820.96) – –2. Distributions to shareholders – – – – – (591,051,954.47) (347,520,438.97) (938,572,393.44)
(IV) Transfers within the owners’ equity – – – – – – – –(V) Special reserve
1. Provision in current year – – – 122,559,476.97 – – 1,564,860.50 124,124,337.472. Amount utilised in the period – – – (123,403,655.61) – – (1,567,745.50) (124,971,401.11)
III. Balance at the end of 2017 4,319,848,116.60 27,582,794,983.23 (238,817,602.94) 7,725,910.79 968,190,696.10 5,517,441,023.24 7,751,951,150.56 45,909,134,277.58
For the prior year Attributable to owners of the parent company
Minority Interests
Total owners’ equity
Items Share capital Capital reserve
Other comprehensive
incomeSpecial reserve
Surplus reserve
Retained profit
I. Balance at the beginning of 2016 3,377,439,739.80 10,720,306,602.38 (632,492,717.76) 115,200,675.56 786,050,081.94 2,986,976,808.88 463,209,880.46 17,816,691,071.26
II. Increase and decrease amount of current year
(I) Total comprehensive income – – 915,347,005.69 – – 998,040,580.75 166,484,059.62 2,079,871,646.06(II) Capital invested and decreased by
shareholders – – – – – – – –1. Business combination not involving
enterprises under common control – – – – – – 15,130,386,022.18 15,130,386,022.18(III) Profit distribution – –
1. Transfer to surplus reserve – – – – 54,048,793.20 (54,048,793.20) – –2. Distributions to shareholders – – – – – (422,179,967.49) (161,570,118.00) (583,750,085.49)
(IV) Transfers within the owners’ equity – – – – – – – –(V) Special reserve – – – – – – – –
1. Provision in current year – – – 112,139,491.32 – – 1,495,228.95 113,634,720.272. Amount utilised in the period – – – (218,770,077.45) – – (1,136,329.46) (219,906,406.91)
III. Balance at the end of 2016 3,377,439,739.80 10,720,306,602.38 282,854,287.93 8,570,089.43 840,098,875.14 3,508,788,628.94 15,598,868,743.75 34,336,926,967.37

98 2017 Annual Report
STATEMENT OF CHANGES IN SHAREHOLDERS EQUITY OF THE PARENT COMPANYFOR THE YEAR ENDED 31 DECEMBER 2017
RMB
For the current year Items Share capital Capital reserve Special reserve Surplus reserves Retained profit Total owners’ equity
I. Balance at the beginning of 2017 3,377,439,739.80 10,720,306,602.38 7,849,535.47 840,098,875.14 2,422,226,698.26 17,367,921,451.05
II. Increase and decrease amount of current year
(I) Total comprehensive income – – – – 1,280,918,209.59 1,280,918,209.59(II) Capital invested and decreased by
shareholders 1. Capital invested by shareholders 942,408,376.80 16,916,224,286.50 – – – 17,858,632,663.302. Others – – – – – –
(III) Distribution of profit 1. Transfer of surplus reserve – – – 128,091,820.96 (128,091,820.96) –2. Distributions to shareholders – – – – (591,051,954.47) (591,051,954.47)
(IV) Transfers within the owners’ equity 1. Transferred from capital surplus – – – – – –
(V) Special reserves 1. Provision in current year – – 109,030,943.18 – – 109,030,943.182. Amount utilized in current year – – (109,872,119.07) – – (109,872,119.07)
III. Balance at end of 2017 4,319,848,116.60 27,636,530,888.88 7,008,359.58 968,190,696.10 2,984,001,132.42 35,915,579,193.58
For the prior year Items Share capital Capital reserve Special reserve Surplus reserves Retained profit Total owners’ equity
I. Balance at the beginning of 2016 3,377,439,739.80 10,720,306,602.38 114,853,670.04 786,050,081.94 2,357,967,526.95 17,356,617,621.11
II. Increase and decrease amount of current year
(I) Total comprehensive income – – – – 540,487,932.00 540,487,932.00(II) Capital invested and decreased by
shareholders – – – – – –1. Capital invested by shareholders – – – – – –2. Others – – – – – –
(III) Distribution of profit – – – – – –1. Transfer of surplus reserve – – – 54,048,793.20 (54,048,793.20) –2. Distributions to shareholders – – – – (422,179,967.49) (422,179,967.49)
(IV) Transfers within the owners’ equity – – – – – –1. Transferred from capital surplus – – – – – –
(V) Special reserves – – – – – –1. Provision in current year – – 103,519,198.38 – – 103,519,198.382. Amount utilized in current year – – (210,523,332.95) – – (210,523,332.95)
III. Balance at end of 2016 3,377,439,739.80 10,720,306,602.38 7,849,535.47 840,098,875.14 2,422,226,698.26 17,367,921,451.05
99China Molybdenum Co., Ltd.
NOTES TO THE FINANCIAL STATEMENTSFOR THE YEAR ENDED 31 DECEMBER 2017
(I) GENERAL
1. Basic Information about the Company
China Molybdenum Co., Ltd. (the “Company”) was incorporated in the PRC on 25 August 2006 as a joint-stock limited company on the basis of China Molybdenum Co., Ltd. by Luoyang Mining Group Co., Ltd. (“LMG”) and Cathay Fortune Corporation (“CFC”).
On 3 December 2006, the Extraordinary General Meeting resolutions and the China Securities Regulatory Commission Zheng Jian Guo He Zi [2007] No. 7, approved to issue up to 1,246.1 million shares of overseas listed shares (including the over- allotment of 162.5 million shares), with a par value of Renminbi (“RMB”) 0.2 each ordinary share. On 25 April 2007 the company issued 1,083.6 million shares of overseas listed shares with a par value of RMB0.2 each ordinary share on 26 April 2007. After the listing on the Hong Kong Stock Exchange, the company’s share capital totalled 4,767.81 million shares.
On 4 May 2007, the Company issued 108.36 million shares of the over-allotment shares with a par value RMB0.2, after the over-allotment, the Company’s share capital totalled 4,876.17 million shares.
On 16 July 2012, according to Commission License [2012] No. 942 “The initial public offering (IPO) on the approval of China Molybdenum Co., Ltd.” issued by China Securities Regulatory Commission (the “CSRC”) the Company was approved to issue up to 542 million RMB ordinary shares (A share). Up to 26 September 2012, the Company had issued 200,000,000 shares of RMB ordinary shares (A share) with a nominal value of RMB0.20 per share. Those shares are listed on the Shanghai Stock Exchange from 9 October 2012. The Company’s share capital totalled 5,076.17 million shares after the issuance of A shares.
On 24 November 2014, China Securities Regulatory Commission approved a total public offering of RMB4,900,000,000.00 of convertible bonds by the Company with ZJXK[2014] No. 1246 Approval of Public Offering of Convertible Company Bonds by China Molybdenum Co., Ltd., and the Company completed issuance on 8 December 2014.
As the triggering conditions for the redemption option are satisfied, on 23 June 2016, the board of directors adopted the resolution that the Company exercises the redemption option after 9 July 2015 closing. As of 9 July 2015 closing, convertible bonds with nominal amount of RMB4,854,442,000 have been converted to equity, representing 99.07% of total convertible bond issued by the Company. After the conversion is completed, total equity of the company is increased to 5,629.07 million shares.
On 28 August 2015, the second session of the fourth board meeting decided to transfer capital reserve into ordinary shares, 20 shares for every existing 10 shares to all shareholders. The transfer was completed on 12 November 2015. After the transfer was completed, the total equity of the company was increased to 16,887,198,699 shares.
On 23 June 2017, the China Securities Regulatory Commission ("CSRC") approved the Company's non-public offering of not more than 5,769,230,769 shares of ordinary shares (A-share) through the “Approval of Non-public Offering of Shares by China Molybdenum Co., Ltd. Zhen Jian Xu Ke [2017] No. 918. On 24 July 2017, the Company privately placed 4,712,041,884 shares of RMB ordinary shares (A-share) to specific objects at a price of RMB3.82 per share with a par value of RMB0.20, and the total amount of funds raised was RMB17,999,999,996.88; after deducting the issuance expenses, the net of raised funds amounted to RMB17,858,632,663.30. After the issuance, the share capital of the Company increased from 16,887,198,699 shares to 21,599,240,583 shares. The shares subscribed by the investors of this offering are not allowed to be transferred within 12 months from the date of the completion of this issuance. See Note (V), 37 for the details of share capital.
The Company together with its subsidiaries (collectively as “the Group”) is principally engaged in mining, smelting and deep processing of molybdenum and tungsten products, mining and smelting of tungsten products; export of molybdenum tungsten niobium series products and chemical products; mining of copper products, mining of niobium products; mining and melting of phosphorus products; melting and mining of cobalt products; mining, processing and sale of gold and silver.
100 2017 Annual Report
NOTES TO THE FINANCIAL STATEMENTSFOR THE YEAR ENDED 31 DECEMBER 2017
(I) GENERAL (CONTINUED)
2. Acquisition of Niobium and Phosphate and Copper-Cobalt business
2.1 Acquisition of Niobium and Phosphate businesses in Brazil
On 27 April 2016, the wholly-owned subsidiary of the Company, CMOC Co., Limited ("CMOC Ltd") entered into an acquisition agreement with, Ambras Holdings S.A.R.L., ANGLO AMERICAN LUXEMBOURG SÁRL ("AA Luxembourg"), Anglo American Marketing Limited ("AAML"), ANGLO AMERICAN CAPITAL PLC ("Capital PLC"), ANGLO AMERICAN CAPITAL LUXEMBOURG SÁRL ("Capital Luxembourg") and Anglo American Service (UK) Limited ("AASL"), subsidiaries of Anglo American PLC ("Anglo American"), to acquire the following companies at a consideration of US $1.5 billion:
(1) 100% shareholders’ equity of American Fosfato Brasil Ltda. ("Copebras ", now renamed as Copebras Indústrial Ltda.) and Anglo American Niobio Brasil Ltda. ("Niobras ", now renamed as Niobras Mineração Ltda.);
(2) AAML’s Niobium sales division ("NMD");
(3) Creditor’s rights over Copebras held by Capital PLC and Creditor’s rights over Niobra held by Capital Luxembourg.
Under the acquisition agreement, the final acquisition consideration is subject to adjustment based on the book balance of cash and the net working capital at closing. The acquisition was approved by the Company's shareholders' meeting on 23 September 2016 and completed on 1 October 2016.
2.2 Acquisition of Copper-Cobalt business in DRC
On 9 May 2016, CMOC Ltd and the Company (as the guarantor of CMOC Ltd) entered into an acquisition agreement with Phelps Dodge Katanga Corporation ("PDK") and Freeport-McMoRan Inc. ("Freeport") (as the guarantor of PDK) to acquire 100% equity in Freeport-McMoRan DRC Holdings Ltd, ("FMDRC", now renamed as CMOC International DRC Holdings Limited) held by PDK at a consideration of US$2.65 billion. FMDRC holds 70% equity in TF Holdings Limited ("TFHL") established in Bermuda and TFHL holds 80% equity in Tenke Fungurume Mining S.A. ("TFM") established in the Democratic Republic of the Congo (DRC). Upon completion of the acquisition, the Company will indirectly hold 56% equity in TFM.
Under the acquisition agreement, in addition to the consideration price, the final consideration of acquisition also includes a contingent consideration and the cash balance adjustment at the closing. The acquisition was approved by the shareholders' meeting on 23 September 2016 and completed on 17 November 2016.
101China Molybdenum Co., Ltd.
NOTES TO THE FINANCIAL STATEMENTSFOR THE YEAR ENDED 31 DECEMBER 2017
(I) GENERAL (CONTINUED)
2. Acquisition of Niobium and Phosphate and Copper-Cobalt business (Continued)
2.3 Acquisition of minority interests of Congo (DRC) copper and cobalt business
On 20 January 2017, the Group entered into a framework agreement with BHR Newwood Investment Management Limited ("BHR") and its investors, pursuant to which, the Group obtained the control over BHR and its associated.
On 20 April 2017, BHR completed the acquisition of 30% of TFHL's equity, held by Lundin Mining Corporation, thereby BHR indirectly obtaining 24% of TFM's equity. Based on afore-said protocol control over BHR, the Group's indirect shareholding proportion in TFM increased from 56% to 80%. See note (VII), 2 for details.
(II) PREPARATION BASIS OF THE FINANCIAL STATEMENTS
Preparation basis
The Group implements the China Accounting Standards issued by the Ministry of Finance (including the new and amended Accounting Standards for Business Enterprises issued in 2014) and the relevant regulations. The Group also discloses related financial information in accordance with Preparation Rules for Information Disclosure by Companies Offering Securities to the Public No. 15 – General Provisions on Financial Reports (2014 Amendment). In addition, the financial statements also include the relevant disclosures required by the Hong Kong Companies Ordinance and the Listing Rules of the Hong Kong Stock Exchange.
Basis of accounting and principle of measurement
The Group has adopted the accrual basis of accounting. Except for certain financial instruments which are measured at fair value, the Group adopts the historical cost as the principle of measurement in the financial statements. Where assets are impaired, provisions for asset impairment are made in accordance with relevant requirements.
Where the historical cost is adopted as the measurement basis, assets are recorded at the amount of cash and cash equivalents paid or the fair value of the consideration given to acquire them at the time of their acquisition. Liabilities are recorded at the amount of proceeds or assets received or the contractual amounts for assuming the present obligation, or, at the amounts of cash and cash equivalents expected to be paid to settle the liabilities in the normal course of business.

102 2017 Annual Report
NOTES TO THE FINANCIAL STATEMENTSFOR THE YEAR ENDED 31 DECEMBER 2017
(II) P R E P A R A T I O N B A S I S O F T H E F I N A N C I A L S T A T E M E N T S (CONTINUED)
Basis of accounting and principle of measurement (Continued)
Fair value is the price that would be received to sell an asset or paid to transfer a liability in an orderly transaction between market participants at the measurements date, regardless of whether that price is directly observable or estimated using valuation technique. Fair value measurement and disclosure in the financial statements are determined according to the above basis.
Fair value measurements are categorized into Level 1, 2 or 3 based on degree to which the inputs to the fair value measurements are observable and the significance of the inputs to the fair value measurement in its entirety, which are described as follows:
• Inputs are quoted prices (unadjusted) in active markets for identical assets or liabilities that the entity can access at the measurement date.
• Level 2 inputs are inputs, other than inputs within Level 1, that are observable for the asset or liability.
• Level 3 inputs are unobservable inputs for the asset or liability.
Going concern
The Group performs evaluation on its ability to continue as a going concern for next 12 months from 31 December 2017, and no matters or conditions that may cast significant doubts on its ability to continue as a going concern are found. Therefore, the financial statements have been prepared on a going concern basis.

103China Molybdenum Co., Ltd.
NOTES TO THE FINANCIAL STATEMENTSFOR THE YEAR ENDED 31 DECEMBER 2017
(III) SIGNIFICANT ACCOUNTING POLICIES AND ACCOUNTING ESTIMATES
1. Declaration following Accounting Standards for Business Enterprises ("ASBE")
The financial statements of the Company have been prepared in accordance with ASBE, and present truly and completely, the Company’s and consolidated financial position as of 31 December 2017, and the Company’s and consolidated results of operations and cash flows for the year then end.
2. Accounting period
The Group has adopted the calendar year as its accounting year i.e. from 1 January to 31 December.
3. Operating cycle
The operating cycle refers to the period from purchase of assets used for processing to realization of cash or cash equivalents. The Company’s operating cycle is usually 12 months.
4. Functional currency
Renminbi (“RMB”) is the currency of the primary economic environment in which the Company and its domestic subsidiaries operate. Therefore, the Company and its domestic subsidiaries choose RMB as their functional currency. The Company’s foreign subsidiaries choose the currency of the main economic environment where the operating business is located as its functional currency. The Group adopts RMB to prepare the financial statements.
5. Accounting treatment of business combination under or not under the common control
Business combinations are classified into business combinations involving enterprises under common control and business combinations not involving enterprises under common control.
5.1 Business combinations involving enterprises under common control
A business combination involving enterprises under common control is a business combination in which all of the combining enterprises are ultimately controlled by the same party or parties both before and after the combination, and that control is not transitory.
Assets and liabilities obtained are measured at their respective carrying amounts as recorded by the combining entities at the date of the combination. The difference between the carrying amount of the net assets obtained and the carrying amount of the consideration paid for the combination is adjusted to the share premium in capital reserve. If the share premium is not sufficient to absorb the difference, any excess is adjusted against retained earnings.
Costs that are directly attributable to the combination are charged to profit or loss in the period in which they are incurred.

104 2017 Annual Report
NOTES TO THE FINANCIAL STATEMENTSFOR THE YEAR ENDED 31 DECEMBER 2017
(III) SIGNIFICANT ACCOUNTING POLICIES AND ACCOUNTING ESTIMATES (CONTINUED)
5. Accounting treatment of business combination under or not under the common control (Continued)
5.2 Business combinations involving enterprises not under common control
A business combination involving enterprises not under common control is a business combination in which all of the combining enterprises are not ultimately controlled by the same party or parties before and after the combination.
The cost of combination is the aggregate of the fair values, at the acquisition date, of the assets given, liabilities incurred or assumed, and equity securities issued by the acquirer in exchange for control of the acquiree. Where a business combination not involving enterprises under common control is achieved in stages that involve multiple transactions, the cost of combination is the sum of the consideration paid at the acquisition date and the fair value at the acquisition date of the acquirer’s previously held interest in the acquiree. The intermediary expenses incurred by the acquirer in respect of auditing, legal services, valuation and consultancy services, etc. and other associated administrative expenses attributable to the business combination are recognised in profit or loss when they are incurred.
The acquiree’s identifiable assets, liabilities and contingent liabilities, acquired by the acquirer in a business combination, that meet the recognition criteria are measured at fair value at the acquisition date.
When the business combination contract provides that, upon the occurrence of multiple future contingencies, the acquirer shall pay an additional consideration for the combination, such contingent consideration as set out in the contract shall be recognised as a liability by the Group as a part of the aggregate consideration transferred in the business combination, and be included in the cost of combination at the fair value at the acquisition date. Within twelve months after the acquisition, if the contingent consideration needs to be adjusted as new or further evidences are obtained in respect of circumstances existed as of the acquisition date, the amount preciously included in the non-operating income shall be adjusted. A change in or adjustment to the contingent consideration under other circumstances shall be accounted for in the following way. Contingent consideration in the nature of a liability shall be measured in accordance with Accounting Standard for Business Enterprises No. 22 – Financial Instruments: Recognition and Measurement and Accounting Standard for Business Enterprises No. 13 – Contingencies . Any change or adjustment is included in profit or loss for the current period.
Where the cost of combination exceeds the acquirer’s interest in the fair value of the acquiree’s identifiable net assets, the difference is treated as an asset and recognised as goodwill, which is measured at cost on initial recognition. Where the cost of combination is less than the acquirer’s interest in the fair value of the acquiree’s identifiable net assets, the acquirer firstly reassesses the measurement of the fair values of the acquiree’s identifiable assets, liabilities and contingent liabilities and measurement of the cost of combination. If after that reassessment, the cost of combination is still less than the acquirer’s interest in the fair value of the acquiree’s identifiable net assets, the acquirer recognises the remaining difference immediately in profit or loss for the current period.
105China Molybdenum Co., Ltd.
NOTES TO THE FINANCIAL STATEMENTSFOR THE YEAR ENDED 31 DECEMBER 2017
(III) SIGNIFICANT ACCOUNTING POLICIES AND ACCOUNTING ESTIMATES (CONTINUED)
5. Accounting treatment of business combination under or not under the common control (Continued)
5.2 Business combinat ions involving enterprises not under common control (Continued)
If either the fair values of identifiable assets, liabilities and contingent liabilities acquired in a combination or the cost of business combination can be determined only provisionally by the end of the period in which the business combination was effected, the acquirer recognises and measures the combination using those provisional values. Any adjustments to those provisional values within 12 months after the acquisition date are treated as if they had been recognised and measured on the acquisition date.
Goodwill arising on a business combination is measured at cost less accumulated impairment losses, and is presented separately in the consolidated financial statements.
6. Preparation of consolidated financial statement
6.1 Preparation of consolidated financial statement
The scope of consolidation in the consolidated financial statements is determined on the basis of control. Control exists when the investor has power over the investee; is exposed, or has rights, to variable returns from its involvement with the investee; and has the ability to use its power over the investee to affect its returns. The Group reassesses whether or not it controls an investee if facts and circumstances indicate that there are changes of the above elements of the definition of control.
Consolidation of a subsidiary begins when the Group obtains control over the subsidiary and ceases when the Group loses control of the subsidiary.
For a subsidiary disposed of by the Group, the operating results and cash flows before the date of disposal (the date when control is lost) are included in the consolidated income statement and consolidated statement of cash flows, as appropriate.
For a subsidiary acquired through a business combination involving enterprises not under common control, the operating results and cash flows from the acquisition date (the date when control is obtained) are included in the consolidated income statement and consolidated statement of cash flows, as appropriate.
No matter when the business combination occurs in the reporting period, subsidiaries acquired through a business combination involving enterprises under common control or the party being absorbed under merger by absorption are included in the Group’s scope of consolidation as if they had been included in the scope of consolidation from the date when they first came under the common control of the ultimate controlling party. Their operating results and cash flows from the beginning of the earliest reporting period or from the date when they first came under the common control of the ultimate controlling party are included in the consolidated income statement and consolidated statement of cash flows, as appropriate.

106 2017 Annual Report
NOTES TO THE FINANCIAL STATEMENTSFOR THE YEAR ENDED 31 DECEMBER 2017
(III) SIGNIFICANT ACCOUNTING POLICIES AND ACCOUNTING ESTIMATES (CONTINUED)
6. Preparation of consolidated financial statement (Continued)
6.1 Preparation of consolidated financial statement (Continued)
The significant accounting policies and accounting periods adopted by the subsidiaries are determined based on the uniform accounting policies and accounting periods set out by the Company.
The effects of all intra-group transactions are eliminated on consolidation.
The portion of subsidiaries’ equity that is not attributable to the Company is treated as minority interests and presented as “minority interests” in the consolidated balance sheet within shareholders’ equity. The portion of net profits or losses of subsidiaries for the period attributable to minority interests is presented as “minority interests” in the consolidated income statement below the “net profit” line item.
When the amount of loss for the period attributable to the minority shareholders of a subsidiary exceeds the minority shareholders’ portion of the opening balance of owners’ equity of the subsidiary, the excess amount are still allocated against minority interests.
Acquisition of minority interests or disposal of interest in a subsidiary that does not result in the loss of control over the subsidiary is accounted for as equity transactions. The carrying amounts of the Company’s interests and minority interests are adjusted to reflect the changes in their relative interests in the subsidiary. The difference between the amount by which the minority interests are adjusted and the fair value of the consideration paid or received is adjusted to capital reserve under owners’ equity. If the capital reserve is not sufficient to absorb the difference, the excess are adjusted against retained earnings.
Where equity interests in an acquiree are acquired in stages through multiple transactions ultimately constituting a business combination not involving entities under common control, the acquirer determines if these transactions are considered to be “a bundled transaction”. If yes, these transactions are accounted for as a single transaction where control is obtained. If no, these transactions are accounted for as multiple transactions where control is obtained at the acquisition date; In this case, the acquirer remeasures its previously-held equity interests in the acquiree at their fair value on the acquisition date and recognises any differences between such fair value and carrying amounts in profit or loss for the period. Where equity interests in an acquiree held before the acquisition date involve changes in other comprehensive income or changes in other owners’ equity under equity method, they are transferred to income for the period that the acquisition date belongs to.
When the Group loses control over a subsidiary due to disposal of certain equity interest or other reasons, any retained interest is re-measured at its fair value at the date when control is lost. The difference between (i) the aggregate of the consideration received on disposal and the fair value of any retained interest and (ii) the share of the former subsidiary’s net assets cumulatively calculated from the acquisition date according to the original proportion of ownership interest is recognised as investment income in the period in which control is lost, and at the same time adjusted against goodwill. Other comprehensive income associated with investment in the former subsidiary is reclassified to investment income in the period in which control is lost.
107China Molybdenum Co., Ltd.
NOTES TO THE FINANCIAL STATEMENTSFOR THE YEAR ENDED 31 DECEMBER 2017
(III) SIGNIFICANT ACCOUNTING POLICIES AND ACCOUNTING ESTIMATES (CONTINUED)
6. Preparation of consolidated financial statement (Continued)
6.1 Preparation of consolidated financial statement (Continued)
Multiple transactions involving disposal of equity investments in a subsidiary until loss of control are usually considered to be a bundled transaction when the conditions and economic impacts of these transactions satisfy with one or multiple following conditions: (1) these transactions are concluded simultaneously or concluded upon consideration of mutual influence; (2) these transactions, as a whole, can achieve a complete business results; (3) occurrence of a transaction depends the occurrence of at least one other transaction; (4) one transaction alone is not economical, but it is economical after consideration together with other transactions. Where multiple transactions involving disposal of equity investments in a subsidiary until loss of control are considered to be a bundled transaction, these multiple transactions are accounted for as a single transaction of disposing of the subsidiary and resulting in loss of control. The difference between the consideration received on each disposal and the corresponding proportion of the subsidiary’s net assets calculated on a continuous basis since the acquisition date prior to the loss of control is recognised as other comprehensive income and transferred to profit or loss for the period when the control is eventually lost. Where multiple transactions involving disposal of equity investments in a subsidiary until loss of control are not considered to be a bundled transaction, these transactions are accounted for as independent transactions.
7. Classification of joint arrangements and accounting treatment for joint ventures
There are two types of joint arrangements – joint operations and joint ventures. The type of joint arrangements is determined based on the rights and obligations of joint operator to the joint arrangements by considering the factors, such as the structure, the legal form of the arrangements, and the contractual terms, etc. A joint operation is a joint arrangement whereby the joint operators have rights to the assets, and obligations for the liabilities, relating to the arrangement. A joint venture is a joint arrangement whereby the joint ventures have rights to the net assets of the arrangement.
The Group adopts the equity method to account the investment in joint ventures. Please specifically refer to Note (III) “14.3.2. Long-term equity investment accounted for using the equity method”.
The Group as a joint operator recognises the following items in relation to its interest in a joint operation: (1) its solely- held assets, including its share of any assets held jointly; (2) its solely-assumed liabilities, including its share of any liabilities incurred jointly; (3) its revenue from the sale of its share of the output arising from the joint operation; (4) its share of the revenue from the sale of the output by the joint operation; and (5) its solely-incurred expenses, including its share of any expenses incurred jointly. The Group accounts for the recognised assets, liabilities, revenues and expenses relating to its interest in a joint operation in accordance with the requirements applicable to the particular assets, liabilities, revenues and expenses.
108 2017 Annual Report
NOTES TO THE FINANCIAL STATEMENTSFOR THE YEAR ENDED 31 DECEMBER 2017
(III) SIGNIFICANT ACCOUNTING POLICIES AND ACCOUNTING ESTIMATES (CONTINUED)
8. Standards for determining cash and cash equivalent
Cash comprises cash on hand and deposits that can be readily withdrawn on demand. Cash equivalents are the Group’s short-term, highly liquid investments that are readily convertible to known amounts of cash and which are subject to an insignificant risk of changes in value.
9. Translation of transactions and financial statements denominated in foreign currencies
9.1 Transactions denominated in foreign currencies
A foreign currency transaction is recorded, on initial recognition, by applying the spot exchange rate on the date of the transaction.
At the balance sheet date, foreign currency monetary items are translated into RMB using the spot exchange rates at the balance sheet date. Exchange differences arising from the differences between the spot exchange rates prevail ing at the balance sheet date and those on init ial recognition or at the previous balance sheet date are recognised in profit or loss for the period, except that (1) exchange differences related to a specific-purpose borrowing denominated in foreign currency that qualify for capitalisation are capitalised as part of the cost of the qualifying asset during the capitalisation period; (2) exchange differences related to hedging instruments for the purpose of hedging against foreign currency risks are accounted for using hedge accounting; (3) exchange differences arising from changes in the carrying amounts (other than the amortised cost) of available-for-sale monetary items are recognised as other comprehensive income.
When the consolidated financial statements include foreign operation(s), if there is foreign currency monetary item constituting a net investment in a foreign operation, exchange difference arising from changes in exchange rates are recognised as “exchange differences arising on translation of financial statements denominated in foreign currencies “in other comprehensive income, and in profit and loss for the period upon disposal of the foreign operation.
Foreign currency non-monetary items measured at historical cost are translated to the amounts in functional currency at the spot exchange rates on the dates of the transactions and the amounts in functional currency remain unchanged. Foreign currency non-monetary items measured at fair value are re-translated at the spot exchange rate on the date the fair value is determined. Difference between the re-translated functional currency amount and the original functional currency amount is treated as changes in fair value (including changes of exchange rate) and is recognised in profit and loss or as other comprehensive income.
109China Molybdenum Co., Ltd.
NOTES TO THE FINANCIAL STATEMENTSFOR THE YEAR ENDED 31 DECEMBER 2017
(III) SIGNIFICANT ACCOUNTING POLICIES AND ACCOUNTING ESTIMATES (CONTINUED)
9. Translation of transactions and financial statements denominated in foreign currencies (Continued)
9.2 Translation of financial statements denominated in foreign currencies
For the purpose of preparing the consolidated financial statements, financial statements of a foreign operation are translated from the foreign currency into RMB using the following method: assets and liabilities on the balance sheet are translated at the spot exchange rate prevailing at the balance sheet date; shareholders’ equity items are translated at the spot exchange rates at the dates on which such items arose; all items in the income statement as well as items reflecting the distribution of profits are translated at exchange rates that approximate the actual spot exchange rates on the dates of the transactions; The difference between the translated assets and the aggregate of liabilities and shareholders’ equity items is recognised as other comprehensive income and included in shareholders’ equity.
Cash flows arising from a transaction in foreign currency and the cash flows of a foreign subsidiary are translated at an exchange rate which approximates the spot exchange rate on the date of the cash flows. The effect of exchange rate changes on cash and cash equivalents is regarded as a reconciling item and presented separately in the cash flow statement as “effect of exchange rate changes on cash and cash equivalents”.
The opening balances and the comparative figures of previous year are presented at the translated amounts in the previous year’s financial statements.
On disposal of the Group’s entire interest in a foreign operation, or upon a loss of control over a foreign operation due to disposal of certain interest in it or other reasons, the Group transfers the accumulated exchange differences arising on translation of financial statements of this foreign operation attributable to the owners’ equity of the parent company and presented under shareholders’ equity, to profit or loss in the period in which the disposal occurs.
In case of a disposal or other reason that results in a reduction in the proportional interest held but does not result in the Group losing control over a foreign operation, the proportionate share of accumulated exchange differences arising on translation of financial statements are re-attributed to minority interests and are not recognised in profit and loss. For partial disposals of equity interests in foreign operations which are associates or joint ventures, the proportionate share of the accumulated exchange differences arising on translation of financial statements of foreign operations is reclassified to profit or loss.
110 2017 Annual Report
NOTES TO THE FINANCIAL STATEMENTSFOR THE YEAR ENDED 31 DECEMBER 2017
(III) SIGNIFICANT ACCOUNTING POLICIES AND ACCOUNTING ESTIMATES (CONTINUED)
10. Financial Instrument
Financial assets and financial liabilities are recognised when the Group becomes a party to the contractual provisions of the instrument. Financial assets and financial liabilities are initially measured at fair value. For financial assets and financial liabilities at fair value through profit or loss, transaction costs are immediately recognised in profit or loss. For other financial assets and financial liabilities, relevant transaction costs are included in their initial recognised amounts.
10.1 Effective interest method
The effective interest method is a method of calculating the amortised cost of a financial asset or a financial liability (or a group of financial assets or financial liabilities) and of allocating the interest income or interest expense over the relevant period, using the effective interest rate. The effective interest rate is the rate that exactly discounts estimated future cash flows through the expected life of the financial asset or financial liability or, where appropriate, a shorter period to the net carrying amount of the financial asset or financial liability.
When calculating the effective interest rate, the Group estimates future cash flows considering all contractual terms of the financial asset or financial liability (without considering future credit losses), and also considers all fees paid or received between the parties to the contract giving rise to the financial asset and financial liability that are an integral part of the effective interest rate, transaction costs, and premiums or discounts, etc.
10.2 Classification, recognition and measurement of financial assets
On initial recognition, the Group’s financial assets are classified into one of the four categories, including financial assets at fair value through profit or loss, held-to-maturity investments, loans and receivables, and available-for-sale financial assets. All regular way purchases or sales of financial assets are recognised and derecognised on a trade date basis.
10.2.1 Financial Assets at Fair Value through Profit or Loss (“FVTPL”)
Financial assets at FVTPL include financial assets held for trading and those designated as at fair value through profit or loss.
A financial asset is classified as held for trading if one of the following conditions is satisfied: (1) It has been acquired principally for the purpose of selling in the near term; or (2) On initial recognition it is part of a portfolio of identified financial instruments that the Group manages together and there is objective evidence that the Group has a recent actual pattern of short-term profit-taking; or (3) It is a derivative that is not designated and effective as a hedging instrument, or a financial guarantee contract, or a derivative that is linked to and must be settled by delivery of an unquoted equity instrument (without a quoted price in an active market) whose fair value cannot be reliably measured.

111China Molybdenum Co., Ltd.
NOTES TO THE FINANCIAL STATEMENTSFOR THE YEAR ENDED 31 DECEMBER 2017
(III) SIGNIFICANT ACCOUNTING POLICIES AND ACCOUNTING ESTIMATES (CONTINUED)
10. Financial Instrument (Continued)
10.2 Classification, recognition and measurement of financial assets (Continued)
10.2.1 Financial Assets at Fair Value through Profit or Loss (“FVTPL”) (Continued)
A financial asset may be designated as at FVTPL upon initial recognition only when one of the following conditions is satisfied: (1) Such designation eliminates or significantly reduces a measurement or recognition inconsistency that would otherwise result from measuring assets or recognising the gains or losses on them on different bases; (2) The financial asset forms part of a group of financial assets or a group of financial assets and financial liabilities, which is managed and its performance is evaluated on a fair value basis, in accordance with the Group’s documented risk management or investment strategy, and information about the grouping is reported to key management personnel on that basis; or (3) it is a qualifying hybrid instrument containing embedded derivatives.
Financial assets at FVTPL are subsequently measured at fair value. Any gains or losses arising from changes in the fair value and any dividend or interest income earned on the financial assets are recognised in profit or loss.
10.2.2 Held-to-maturity investments
Held-to-maturity investments are non-derivative financial assets with fixed or determinable payments and fixed maturity dates that the Group’s management has the positive intention and ability to hold to maturity.
Held-to-maturity investments are subsequently measured at amortised cost using the effective interest method. Gain or loss arising from derecognition, impairment or amortisation is recognised in profit or loss.
10.2.3 Loans and receivables
Loans and receivables are non-derivative financial assets with fixed or determinable payments that are not quoted in an active market. Financial assets classified as loans and receivables by the Group include notes receivable, accounts receivable, interest receivable, dividends receivable, other receivables other current assets and other non-current assets.
Loans and receivables are subsequently measured at amortised cost using the effective interest method. Gain or loss arising from derecognition, impairment or amortisation is recognised in profit or loss.

112 2017 Annual Report
NOTES TO THE FINANCIAL STATEMENTSFOR THE YEAR ENDED 31 DECEMBER 2017
(III) SIGNIFICANT ACCOUNTING POLICIES AND ACCOUNTING ESTIMATES (CONTINUED)
10. Financial Instrument (Continued)
10.2 Classification, recognition and measurement of financial assets (Continued)
10.2.4 Available-for-sale financial assets
Available-for-sale financial assets include non-derivative financial assets that are designated on initial recognition as available for sale, and financial assets that are not classified as financial assets at fair value through profit or loss, loans and receivables or held-to-maturity investments.
Available-for-sale financial assets are subsequently measured at fair value, and gains or losses arising from changes in the fair value are recognised as other comprehensive income, except that impairment losses and exchange differences related to amortised cost of monetary financial assets denominated in foreign currencies are recognised in profit or loss, until the financial assets are derecognised, at which time the gains or losses are released and recognised in profit or loss.
Interests obtained and the dividends declared by the investee during the period in which the available- for-sale financial assets are held, are recognised in investment gains.
For investments in equity instruments that do not have a quoted market price in an active market and whose fair value cannot be reliably measured, and derivative financial assets that are linked to and must be settled by delivery of such unquoted equity instruments, they are measured at cost.
10.3 Impairment of financial assets
The Group assesses at each balance sheet date the carrying amounts of financial assets other than those at fair value through profit or loss. If there is objective evidence that a financial asset is impaired, the Group determines the amount of any impairment loss. Objective evidence that a financial asset is impaired is evidence that, arising from one or more events that occurred after the initial recognition of the asset, the estimated future cash flows of the financial asset, which can be reliably measured, have been affected.
Objective evidence that a financial asset is impaired includes the following observable events:
(1) Significant financial difficulty of the issuer or obligor;
(2) A breach of contract by the borrower, such as a default or delinquency in interest or principal payments;
(3) The Group, for economic or legal reasons relating to the borrower’s financial difficulty, granting a concession to the borrower;
(4) I t becoming probable that the borrower wi l l enter bankruptcy or o ther f inancia l reorganisations;
113China Molybdenum Co., Ltd.
NOTES TO THE FINANCIAL STATEMENTSFOR THE YEAR ENDED 31 DECEMBER 2017
(III) SIGNIFICANT ACCOUNTING POLICIES AND ACCOUNTING ESTIMATES (CONTINUED)
10. Financial Instrument (Continued)
10.3 Impairment of financial assets (Continued)
(5) The disappearance of an active market for that financial asset because of financial difficulties of the issuer;
(6) Upon an overall assessment of a group of financial assets, observable data indicates that there is a measurable decrease in the estimated future cash flows from the group of financial assets since the initial recognition of those assets, although the decrease cannot yet be identified with the individual financial assets in the group. Such observable data includes:
– Adverse changes in the payment status of borrower in the group of assets;
– Economic conditions in the country or region of the borrower which may lead to a failure to pay the group of assets;
(7) Significant adverse changes in the technological, market, economic or legal environment in which the equity instrument issuer operates, indicating that the cost of the investment in the equity instrument may not be recovered by the investor;
(8) A significant or prolonged decline in the fair value of an investment in an equity instrument below its cost; In the balance sheet date, the fair value of an equity instrument is less than the initial investment cost of more than 50% (including 50%), or less than the initial investment cost for more than 12 months (including 12 months);
(9) Other objective evidence indicating there is an impairment of a financial asset.
– Impairment of financial assets measured at amortised cost
If financial assets carried at amortised cost are impaired, the carrying amounts of the financial assets are reduced to the present value of estimated future cash flows (excluding future credit losses that have not been incurred) discounted at the financial asset’s original effective interest rate. The amount of reduction is recognised as an impairment loss in profit or loss. If, subsequent to the recognition of an impairment loss on financial assets carried at amortised cost, there is objective evidence of a recovery in value of the financial assets which can be related objectively to an event occurring after the impairment is recognised, the previously recognised impairment loss is reversed. However, the reversal is made to the extent that the carrying amount of the financial asset at the date the impairment is reversed does not exceed what the amortised cost would have been had the impairment not been recognised.
For a financial asset that is individually significant, the Group assesses the asset individually for impairment. For a financial asset that is not individually significant, the Group assesses the asset individually for impairment or includes the asset in a group of financial assets with similar credit risk characteristics and collectively assesses them for impairment. If the Group determines that no objective evidence of impairment exists for an individually assessed financial asset (whether significant or not), it includes the asset in a group of financial assets with similar credit risk characteristics and collectively reassesses them for impairment. Assets for which an impairment loss is individually recognised are not included in a group of financial assets with similar credit risk characteristics for collective assessment of impairment.
114 2017 Annual Report
NOTES TO THE FINANCIAL STATEMENTSFOR THE YEAR ENDED 31 DECEMBER 2017
(III) SIGNIFICANT ACCOUNTING POLICIES AND ACCOUNTING ESTIMATES (CONTINUED)
10. Financial Instrument (Continued)
10.3 Impairment of financial assets (Continued)
– Impairment of available-for-sale financial assets
When an available-for-sale financial asset is impaired, the cumulative loss arising from decline in fair value previously recognised directly in capital reserve is reclassified from the capital reserve to profit or loss. The amount of the cumulative loss that is reclassified from capital reserve to profit or loss is the difference between the acquisition cost (net of any principal repayment and amortisation) and the current fair value, less any impairment loss on that financial asset previously recognised in profit or loss.
If, subsequent to the recognition of an impairment loss on available-for-sale financial assets, there is objective evidence of a recovery in value of the financial assets which can be related objectively to an event occurring after the impairment is recognised, the previously recognised impairment loss is reversed. The amount of reversal of impairment loss on available-for-sale equity instruments is recognised as other comprehensive income, while the amount of reversal of impairment loss on available-for-sale debt instruments is recognised in profit or loss.
– Impairment of financial assets measured at cost
If an impairment loss has been incurred on an investment in unquoted equity instrument (without a quoted price in an active market) whose fair value cannot be reliably measured, or on a derivative financial asset that is linked to and must be settled by delivery of such an unquoted equity instrument, the carrying amount of the financial asset is reduced to the present value of estimated future cash flows discounted at the current market rate of return for a similar financial asset. The amount of reduction is recognised as an impairment loss in profit or loss. The impairment loss on such financial asset is not reversed once it is recognised.
10.4 Transfer of financial assets
The Company derecognises a financial asset if one of the following conditions is satisfied: (1) the contractual rights to the cash flows from the financial asset expire; or (2) the financial asset has been transferred and substantially all the risks and rewards of ownership of the financial asset is transferred to the transferee; or (3) although the financial asset has been transferred, the Company neither transfers nor retains substantially all the risks and rewards of ownership of the financial asset but has not retained control of the financial asset.。
If the Company neither transfers nor retains substantially all the risks and rewards of ownership of a financial asset, and it retains control of the financial asset, it recognises the financial asset to the extent of its continuing involvement in the transferred financial asset and recognises an associated liability. The extent of the Company’s continuing involvement in the transferred asset is the extent to which it is exposed to changes in the value of the transferred asset.
For a transfer of a financial asset in its entirety that satisfies the derecognition criteria, the difference between (1) the carrying amount of the financial asset transferred; and (2) the sum of the consideration received from the transfer and any cumulative gain or loss that has been recognised in other comprehensive income, is recognised in profit or loss.
115China Molybdenum Co., Ltd.
NOTES TO THE FINANCIAL STATEMENTSFOR THE YEAR ENDED 31 DECEMBER 2017
(III) SIGNIFICANT ACCOUNTING POLICIES AND ACCOUNTING ESTIMATES (CONTINUED)
10. Financial Instrument (Continued)
10.4 Transfer of financial assets (Continued)
If a part of the transferred financial asset qualifies for derecognition, the carrying amount of the transferred financial asset is allocated between the part that continues to be recognised and the part that is derecognised, based on the respective fair values of those parts. The difference between (1) the carrying amount allocated to the part derecognised; and (2) the sum of the consideration received for the part derecognised and any cumulative gain or loss al located to the part derecognised which has been previously recognised in other comprehensive income, is recognised in profit or loss.
10.5 Classification, recognition and measurement of financial liabilities
Financial instruments issued by the Group are classified in accordance with the economic substance of the contractual arrangements instead of the legal form as well as the definitions of a financial liability and an equity instrument; on initial recognition, financial instruments or their component parts are classified as either financial liabilities or equity instruments.
On initial recognition, financial liabilities are classified into financial liabilities at fair value through profit or loss and other financial liabilities.
10.5.1 Financial liabilities at FVTPL
Financial l iabilit ies at FVTPL consist of financial l iabilit ies held for trading and those designated as at FVTPL on initial recognition.
A financial liability is classified as held for trading if one of the following conditions is satisfied: (1) It has been acquired principally for the purpose of repurchasing in the near term; or (2) On initial recognition it is part of a portfolio of identified financial instruments that the Group manages together and there is objective evidence that the Group has a recent actual pattern of short-term profit-taking; or (3) It is a derivative, except for a derivative that is a designated and effective hedging instrument, or a financial guarantee contract, or a derivative that is linked to and must be settled by delivery of an unquoted equity instrument (without a quoted price in an active market) whose fair value cannot be reliably measured.
A financial liability may be designated as at FVTPL upon initial recognition only when one of the following conditions is satisfied: (1) Such designation eliminates or significantly reduces a measurement or recognition inconsistency that would otherwise result from measuring liabilities or recognising the gains or losses on them on different bases; (2) The financial liability forms part of a group of financial liabilities or a group of financial assets and financial liabilities, which is managed and its performance is evaluated on a fair value basis, in accordance with the Group’s documented risk management or investment strategy, and information about the grouping is reported to key management personnel on that basis; or (3) it is a qualifying hybrid instrument containing embedded derivatives.
Financial liabilities at FVTPL are subsequently measured at fair value. Any gains or losses arising from changes in the fair value or any dividend or interest expenses related to the financial liabilities are recognised in profit or loss.
116 2017 Annual Report
NOTES TO THE FINANCIAL STATEMENTSFOR THE YEAR ENDED 31 DECEMBER 2017
(III) SIGNIFICANT ACCOUNTING POLICIES AND ACCOUNTING ESTIMATES (CONTINUED)
10. Financial Instrument (Continued)
10.5 Classification, recognition and measurement of financial liabilities (Continued)
10.5.2 Other financial liabilities
For a derivative liability that is linked to and must be settled by delivery of an unquoted equity instrument (without a quoted price in an active market) whose fair value cannot be reliably measured, it is subsequently measured at cost. Other financial liabilities other than financial guarantee contract obligations are subsequently measured at amortised cost using the effective interest method, with gain or loss arising from derecognition or amortisation recognised in profit or loss.
10.5.3 Financial guarantee contracts
A financial guarantee contract is a contract by which the guarantor and the lender agree that the guarantor would settle the debts or bear obligations in accordance with terms of the contract in case the borrower fails to settle the debts. Financial guarantee contracts that are not designated as financial liabilities at fair value through profit or loss, are initially measured at their fair values less the directly attributable transaction costs. Subsequent to initial recognition, they are measured at the higher of: (i) the amount determined in accordance with Accounting Standard for Business Enterprises No. 13 – Contingencies; and (ii) the amount initially recognised less cumulative amortisation recognised in accordance with the principles set out in Accounting Standard for Business Enterprises No. 14 – Revenue.
10.6 Derecognition of financial liabilities
The Group derecognises a financial liability (or part of it) only when the underlying present obligation (or part of it) is discharged. An agreement between the Group (an existing borrower) and an existing lender to replace the original financial liability with a new financial liability with substantially different terms is accounted for as an extinguishment of the original financial liability and the recognition of a new financial liability.
When the Group derecognises a financial liability or a part of it, it recognises the difference between the carrying amount of the financial liability (or part of the financial liability) derecognised and the consideration paid (including any non-cash assets transferred or new financial liabilities assumed) in profit or loss.
10.7 Derivatives and embedded derivatives
Derivative financial instruments include commodity futures contracts, commodity forward contracts currency swaps and interest rate swaps. Derivatives are initially measured at fair value at the date when the derivative contracts are entered into and are subsequently re-measured at fair value. The resulting gain or loss is recognised in profit or loss.
An embedded derivative is separated from the hybrid instrument, where the hybrid instrument is not designated as a financial asset or financial liability at fair value through profit or loss, and treated as a standalone derivative if 1) the economic characteristics and risks of the embedded derivative are not closely related to the economic characteristics and risks of the host contract; and 2) a separate instrument with the same terms as the embedded derivative would meet the definition of a derivative. If the Group is unable to measure the embedded derivative separately either at acquisition or at a subsequent balance sheet date, it designates the entire hybrid instrument as a financial asset or financial liability at fair value through profit or loss.
117China Molybdenum Co., Ltd.
NOTES TO THE FINANCIAL STATEMENTSFOR THE YEAR ENDED 31 DECEMBER 2017
(III) SIGNIFICANT ACCOUNTING POLICIES AND ACCOUNTING ESTIMATES (CONTINUED)
10. Financial Instrument (Continued)
10.7 Derivatives and embedded derivatives (Continued)
10.7.1 Revenue related embedded derivatives
The price of cathode Copper, main product of the Group's subsidiaries, is temporarily determined based on the market price at the time of delivery. Generally, the provisional price is finally determined on the basis of the monthly average spot price of Copper quoted by the London Metal Exchange after shipping one month. The underlying derivatives associated with the above revenue recognition model is measured at fair value (based on the spot price of Copper from the London Metal Exchange), and prior to the expected settlement date, the changes in the fair value of the derivatives are included in the operating income and the accounts receivable in the consolidated balance sheets. When the fair value is positive, the fair value of the embedded derivatives is accounted for accounts receivable as financial assets, and when the fair value is negative and the balance of accounts receivable is not sufficient to offset it, the fair value of the embedded derivatives is accounted for accounts payable as financial liabilities.
10.7.2 Convertible loan notes
Convertible loan notes issued by the Group that contain both the liability and conversion option components are classified separately into respective items on initial recognition. Conversion option that is settled by the exchange of a fixed amount of cash or another financial asset for a fixed number of the Company's own equity instruments is an equity instrument.
On initial recognition, the fair value of the liability component is determined using the prevailing market interest of similar non-convertible debts. The difference between the gross proceeds of the issue of the convertible loan notes and the fair value assigned to the liability component, representing the conversion option for the holder to convert the loan notes into equity instrument, is included in capital reserve (other capital reserve – share conversion option).
In subsequent periods, the liability component of the convertible loan notes is carried at amortised cost using the effective interest method. The conversion option classified as equity remains in equity. No gain or loss is recognised in profit or loss upon conversion or expiration of the option.
Transaction costs incurred for the issue of convertible loan notes are allocated to the liability component and equity component in proportion to their respective fair values. Transaction costs relating to the equity component are charged directly to equity. Transaction costs relating to the liability component are included in the carrying amount of the liability component and amortised over the period of the convertible loan notes using the effective interest method.
118 2017 Annual Report
NOTES TO THE FINANCIAL STATEMENTSFOR THE YEAR ENDED 31 DECEMBER 2017
(III) SIGNIFICANT ACCOUNTING POLICIES AND ACCOUNTING ESTIMATES (CONTINUED)
10. Financial Instrument (Continued)
10.8 Offsetting financial assets and financial liabilities
When the Group has a legal right that is currently enforceable to set off the recognised financial assets and financial liabilities, and intends either to settle on a net basis, or to realise the financial asset and settle the financial liability simultaneously, financial assets and financial liabilities are offset with the net amounts presented on the balance sheet. Otherwise, financial assets and financial liabilities are separately presented on the balance sheet without offsetting.
10.9 Equity instruments
An equity instrument is any contract that evidences a residual interest in the assets of the Group after deducting all of its liabilities. Equity instruments issued (including refinanced), repurchased, sold or cancelled by the Group are treated as changes in equity. Changes in the fair value of equity instruments are not recognised. Transaction costs related to equity transactions are deducted from equity.
The Group’s distribution to holders of equity instruments are treated as a distribution of profits, payment of stock dividends does not affect total shareholders’ equity.
11. Receivables
11.1 Determination basis and policies for bad debt provision of accounts receivables of resources-related subsidiaries of the Group situated in PRC and Australia
Recognition criteria and policies for bad debt provision of accounts receivables of individually significant amount
The criterion of individually significant amount
A receivable that exceeds RMB5,000,000 is deemed as an individually significant receivable by resources-related subsidiaries of the Group situated in PRC and Australia.
Policies for bad debt provision of accounts receivables of individually significant amount
For receivables that are individually significant, the resources-related subsidiaries of the Group situated in PRC and Aus t ra l i a assess the rece ivab les individually for impairment. For a financial asset that is not impaired individually, they include the asset in a group of financial assets with similar credit risk characteristics and collectively assesses them for impairment. Receivables for which an impairment loss is individually recognised are not included in a collective assessment of impairment

119China Molybdenum Co., Ltd.
NOTES TO THE FINANCIAL STATEMENTSFOR THE YEAR ENDED 31 DECEMBER 2017
(III) SIGNIFICANT ACCOUNTING POLICIES AND ACCOUNTING ESTIMATES (CONTINUED)
11. Receivables (Continued)
11.1 Determination basis and policies for bad debt provision of accounts receivables of resources-related subsidiaries of the Group situated in PRC and Australia (Continued)
Determination basis and policies for bad debt provision of accounts receivables that are not individually significant but with significant risks after being grouped according to credit risk characteristics
Basis for determining credit risk characteristic combination
The resources-re lated subsidiar ies of the Group situated in PRC and Australia classify the receivables that are not individually significant and those that are individually signif icant but are not impaired individually into groups of financial assets according to the s im i l a r i t y and re levance o f c red i t r i sk characteristics. These credit risks usually reflect the debtors' ability to pay the amounts due at maturity under contractual terms of related assets and are related to the estimation of future cash flows of the assets subject to assessment.
Policies determined by credit risk characteristic combination
When impairment test is conducted based on portfolio method, the bad debt provision will be determined based on receivable portfolio structure and similar credit risk characteristics and according to historical loss experience, current economic conditions and loss evaluation exist ing in estimated receivable portfolio bad debt provision based on aging analysis detailed in Table 12.3 as follows.
Percentage of bad debt provision using aging analysis
Aging
Percentage of provision for accounts
receivable
Percentage of provision
for other receivables
(%) (%)
Within 2 years – –More than 2 years 100% 100%
120 2017 Annual Report
NOTES TO THE FINANCIAL STATEMENTSFOR THE YEAR ENDED 31 DECEMBER 2017
(III) SIGNIFICANT ACCOUNTING POLICIES AND ACCOUNTING ESTIMATES (CONTINUED)
11. Receivables (Continued)
11.2 Determination basis and policies for bad debt provision of accounts receivables of resources-related subsidiaries of the Group situated in Brazil and DRC
Accounts receivables for which the bad debt provision is individually assessed
Accounts receivables for which the bad debt provision is individually assessed
The resources-related subsidiaries in Brazil and DRC use individual analysis method to make bad debt provision for accounts receivable.
Policies for accounts receivables for which the bad debt provision is individually assessed
To be impaired individually, and the difference between the present value of the est imated future cash flows and its carrying amount is used for bad debt provision and is recognised in profit or loss for the period.
12. Inventory
12.1 Classification of inventories
The Group’s inventories mainly include raw materials, work in progress, finished goods etc. Inventories are initially measured at cost. Cost of inventories comprises all costs of purchase, costs of conversion and other expenditures incurred in bringing the inventories to their present location and condition.
12.2 Valuation methods of the inventory delivered
When the inventories are delivered, the actual costs of the delivered inventories are determined using the method of weighted average.
12.3 The basis of the net realizable value of the inventories
On the balance sheet date, the inventories shall be calculated by the lower of cost and net realized value. When the net realizable value is less than the cost, inventory provision is required. The net realizable value represent the amount derived by deducting the potential cost, estimated sale cost and relative taxes to the completion date from the estimated selling price of the inventory in daily activities. The company determined net realizable value of inventories, made the obtained conclusive evidence as basis, and considered the purposes of holding inventories, events after the balance sheet date and other factors.
The provision for inventory shall be provided by the difference between the cost of the individual inventory and its net realized value.
In case the factors impacting the inventory provision is eliminated, making the net realizable value be higher than the book value, the write-down amount should be recovered from the previous write-down amount of inventory provision and the corresponding amount shall be reversed to current profit and loss.

121China Molybdenum Co., Ltd.
NOTES TO THE FINANCIAL STATEMENTSFOR THE YEAR ENDED 31 DECEMBER 2017
(III) SIGNIFICANT ACCOUNTING POLICIES AND ACCOUNTING ESTIMATES (CONTINUED)
12. Inventory (Continued)
12.4 The inventory system for inventory
The Group uses a perpetual inventory system.
12.5 Amortization method of low-value consumables and packaging materials
Packing materials and low-price easily-worn materials are amortized by the one-time writing-off method.
13. Assets classified as held-for-sale
Non-current assets and disposal groups are classified as held for sale category when the Group recovers the book value through a sale (including an exchange of non-monetary assets that has commercial substance) rather than continuing use.
Non-current assets or disposal groups classified as held for sale are required to satisfy the following conditions: (1) the asset or disposal group is available for immediate sale in its present condition subject only to terms that are usual and customary for sales of such asset or disposal group; (2) the sale is highly probable, i.e. the Group has made a resolution about selling plan and obtained a confirmed purchase commitment and the sale is expected to be completed within one year.
When there is loss of control over a subsidiary due to disposal of investments in the subsidiary, and the proposed disposal of investment in the subsidiary satisfies classification criteria of held-for-sale category, the investments in subsidiaries are classified as held-for-sale category as a whole in the company's separate financial statement, and all assets and liabilities of subsidiaries are classified as held-for-sale category in the consolidated financial statements regardless that part of the equity investments are remained after the sale.
The Group measures the no-current assets or disposal groups classified as held for sale at the lower of their carrying amount and fair value less costs to sell. Where the carrying amount is higher than the net amount of fair value less costs to sell, carrying amount should be reduced to the net amount of fair value less costs to sell, and such reduction is recognized in impairment loss of assets and included in profit or loss for the period. Meanwhile, provision for impairment of held-for-sale assets are made. When there is increase in the net amount of fair value of non-current assets held for sale less costs to sell at the balance sheet date, the original deduction should be reversed in impairment loss of assets recognized after the classification of held-for-sale category, and the reverse amount is include in profit or loss for the period.
122 2017 Annual Report
NOTES TO THE FINANCIAL STATEMENTSFOR THE YEAR ENDED 31 DECEMBER 2017
(III) SIGNIFICANT ACCOUNTING POLICIES AND ACCOUNTING ESTIMATES (CONTINUED)
13. Assets classified as held-for-sale (Continued)
Non-current assets classified as held-for-sale or disposal groups are not depreciated or amortized, interest and other costs of liabilities of disposal group classified as held for sale continue to be recognized.
All or part of equity investments in an associate or joint venture are classified as held-for-sale assets. For the part that is classified as held-for-sale, it is no longer accounted for using the equity method since the date of the classification.
14. Long-term equity investment
14.1 Basis for determining joint control and significant influence over the investee
Control exists when the investor has power over the investee; is exposed, or has rights, to variable returns from its involvement with the investee; and has the ability to use its power over the investee to affect its returns. Joint control is the contractually agreed sharing of control of an arrangement, which exists only when decisions about the relevant activities require the unanimous consent of the parties sharing control. Significant influence is the power to participate in the financial and operating policy decisions of the investee but is not control or joint control over those policies. When determining whether an investing enterprise is able to exercise control or significant influence over an investee, the effects of potential voting rights of the investee (for example, warrants and convertible debts) held by the investing enterprises or other parties that are currently exercisable or convertible have been considered.
14.2 Determination of investment cost
For a long-term equity investment acquired through a business combination involving enterprises under common control, the initial investment cost of the long-term equity investment is the attributable share of the carrying amount of the shareholders’ equity of the acquiree at the date of combination in the consolidated financial statements of the ultimate controlling party. The difference between the initial investment cost and the carrying amount of cash paid, non-cash assets transferred and liabilities assumed is adjusted to capital reserve. If the balance of capital reserve is not sufficient, any excess is adjusted to retained earnings. If the consideration of the combination is satisfied by the issue of equity securities, the initial investment cost of the long-term equity investment is the attributable share of the carrying amount of the shareholders’ equity of the acquiree in the consolidated financial statements of the ultimate controlling party. The aggregate face value of the shares issued is accounted for as share capital. The difference between the initial investment cost and the aggregate face value of the shares issued is adjusted to capital reserve. If the balance of capital reserve is not sufficient, any excess is adjusted to retained earnings.
For a long-term equity investment acquired through business combination not involving enterprises under common control, the initial investment cost of the long-term equity investment is the cost of acquisition at the date of combination
The intermediary fees incurred by the absorbing party or acquirer such as audit, legal, valuation and consulting fees, etc. and other related administrative expenses attributable to the business combination are recognised in profit or loss when they are incurred.
The long-term equity investment acquired otherwise than through a business combination is initially measured at its cost. When the entity is able to exercise significant influence or joint control (but not control) over an investee, the cost of long-term equity investments is the sum of the fair value of previously-held equity investments determined in accordance with Accounting Standard for Business Enterprises No. 22 – Financial Instruments: Recognition and Measurement (CAS 22) and the additional investment cost.
123China Molybdenum Co., Ltd.
NOTES TO THE FINANCIAL STATEMENTSFOR THE YEAR ENDED 31 DECEMBER 2017
(III) SIGNIFICANT ACCOUNTING POLICIES AND ACCOUNTING ESTIMATES (CONTINUED)
14. Long-term equity investment (Continued)
14.3 Subsequent measurement and recognition of profit or loss
14.3.1 Long-term equity investment accounted for using the cost method
Long-term equity investments in subsidiaries are accounted for using the cost method in the Company’s separate financial statements. A subsidiary is an investee that is controlled by the Group.
Under the cost method, a long-term equity investment is measured at initial investment cost. When additional investment is made or the investment is recouped, the cost of the long-term equity investment is adjusted accordingly. Investment income is recognised in the period in accordance with the attributable share of cash dividends or profit distributions declared by the investee.
14.3.2 Long-term equity investment accounted for using the equity method
The Group accounts for investment in associates and joint ventures using the equity method. An associate is an entity over which the Group has significant influence; a joint venture is a joint arrangement whereby the Group has rights to the net assets of the arrangement.
Under the equity method, where the initial investment cost of a long-term equity investment exceeds the Group’s share of the fair value of the investee’s identifiable net assets at the time of acquisition, no adjustment is made to the initial investment cost. Where the initial investment cost is less than the Group’s share of the fair value of the investee’s identifiable net assets at the time of acquisition, the difference is recognised in profit or loss for the period, and the cost of the long-term equity investment is adjusted accordingly.

124 2017 Annual Report
NOTES TO THE FINANCIAL STATEMENTSFOR THE YEAR ENDED 31 DECEMBER 2017
(III) SIGNIFICANT ACCOUNTING POLICIES AND ACCOUNTING ESTIMATES (CONTINUED)
14. Long-term equity investment (Continued)
14.3 Subsequent measurement and recognition of profit or loss (Continued)
14.3.2 Long-term equity investment accounted for using the equity method (Continued)
Under the equity method, the Group recognises its share of the net profit or loss and other comprehensive income made by the investee as investment income and other comprehensive income respectively, and adjust the carrying amount of the long-term equity investment accordingly; The carrying amount of the investment is reduced by the portion of any profit distributions or cash dividends declared by the investee that is distributed to the Group; the share of the changes in owners’ equity of the investee other than those arising from net profit or loss, other comprehensive income and profit distribution are recognized in the capital reserve and the carrying amount of the long- term equity investment is adjusted accordingly. The Group recognises its share of the investee’s net profit or loss after making appropriate adjustments based on the fair value of the investee’s individual separately identifiable assets, etc. at the acquisition date. Where the accounting policies and accounting period adopted by the investee are not consistent with those of the Group, the Group shall adjust the financial statements of the investee to conform to its own accounting policies and accounting period, and recognise investment income and other comprehensive income based on the adjusted financial statements. For the Group’s transactions with its associates and joint ventures where assets contributed or sold does not constitute a business, unrealised intra-group profits or losses are recognised as investment income or loss to the extent that those attributable to the Group’s proportionate share of interest are eliminated. However, unrealised losses resulting from the Group’s transactions with its associates and joint ventures which represent impairment losses on the transferred assets are not eliminated.
The Group discontinues recognising its share of net losses of the investee after the carrying amount of the long-term equity investment together with any long-term interests that in substance form part of its net investment in the investee is reduced to zero. If the Group has incurred obligations to assume additional losses of the investee, a provision is recognised according to the expected obligation, and recorded as investment loss for the period. Where net profits are subsequently made by the investee, the Group resumes recognising its share of those profits only after its share of the profits exceeds the share of losses previously not recognised.
14.4 Disposal of long-term equity investments
On disposal of a long term equity investment, the difference between the proceeds actually received and the carrying amount is recognised in profit or loss for the period.

125China Molybdenum Co., Ltd.
NOTES TO THE FINANCIAL STATEMENTSFOR THE YEAR ENDED 31 DECEMBER 2017
(III) SIGNIFICANT ACCOUNTING POLICIES AND ACCOUNTING ESTIMATES (CONTINUED)
15. Fixed Assets
15.1 The conditions of recognition
Fixed assets are tangible assets that are held for use in the production or supply of goods or services, for rental to others, or for administrative purposes, and have useful lives of more than one accounting year. A fixed asset is recognised only when it is probable that economic benefits associated with the asset will flow to the Group and the cost of the asset can be measured reliably. Fixed assets are initially measured at cost and the effect of any expected costs of abandoning the asset at the end of its use is considered.
Subsequent expenditures incurred for the fixed asset are included in the cost of the fixed asset if it is probable that economic benefits associated with the asset will flow to the Group and the subsequent expenditures can be measured reliably. Meanwhile the carrying amount of the replaced part is derecognised. Other subsequent expenditures except for above expenditures that included in the cost of the fixed asset are recognised in profit or loss in the period in which they are incurred.
15.2 Depreciation Method
A fixed asset is depreciated over its useful life using the straight-line method or the units of production method since the month subsequent to the one in which it is ready for intended use. The depreciation method useful life, estimated net residual value rate and annual depreciation rate of each category of fixed assets are as follows:
Resources-related subsidiaries of the Group situated in PRC
CategoryDepreciation method
Period of depreciation
Residual Value Rate
Yearly depreciation
(%) (%)
Land, building Straight-line method
8–45 0–5 2.1–11.9
Mining engineering Units of production method
Expected life of mines
0 Unit of production
Machine equipment Straight-line method
8–10 5 9.5–11.9
Electronic equipment, appliances and furniture
Straight-line method
5 5 19.0
Transportation equipment
Straight-line method
8 5 11.9
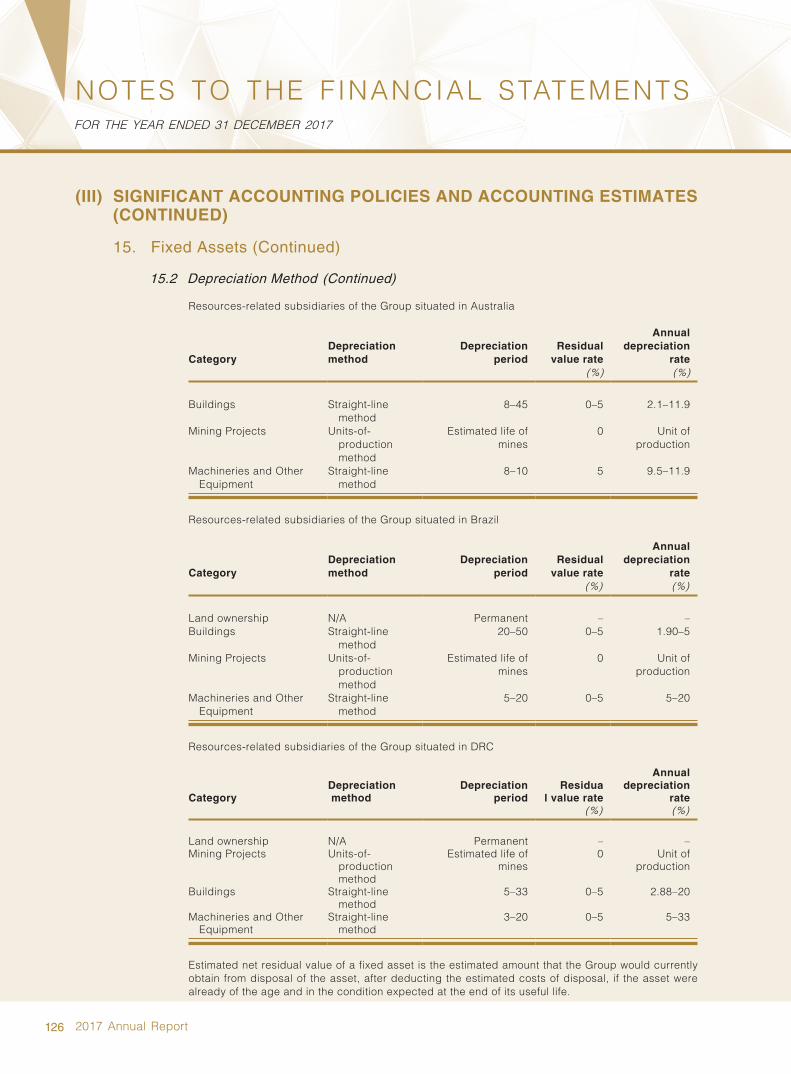
126 2017 Annual Report
NOTES TO THE FINANCIAL STATEMENTSFOR THE YEAR ENDED 31 DECEMBER 2017
(III) SIGNIFICANT ACCOUNTING POLICIES AND ACCOUNTING ESTIMATES (CONTINUED)
15. Fixed Assets (Continued)
15.2 Depreciation Method (Continued)
Resources-related subsidiaries of the Group situated in Australia
CategoryDepreciation method
Depreciation period
Residual value rate
Annual depreciation
rate (%) (%)
Buildings Straight-line method
8–45 0–5 2.1–11.9
Mining Projects Units-of-production method
Estimated life of mines
0 Unit of production
Machineries and Other Equipment
Straight-line method
8–10 5 9.5–11.9
Resources-related subsidiaries of the Group situated in Brazil
CategoryDepreciation method
Depreciation period
Residual value rate
Annual depreciation
rate (%) (%)
Land ownership N/A Permanent – –Buildings Straight-line
method20–50 0–5 1.90–5
Mining Projects Units-of-production method
Estimated life of mines
0 Unit of production
Machineries and Other Equipment
Straight-line method
5–20 0–5 5–20
Resources-related subsidiaries of the Group situated in DRC
CategoryDepreciation method
Depreciation period
Residual value rate
Annual depreciation
rate (%) (%)
Land ownership N/A Permanent – –Mining Projects Units-of-
production method
Estimated life of mines
0 Unit of production
Buildings Straight-line method
5–33 0–5 2.88–20
Machineries and Other Equipment
Straight-line method
3–20 0–5 5–33
Estimated net residual value of a fixed asset is the estimated amount that the Group would currently obtain from disposal of the asset, after deducting the estimated costs of disposal, if the asset were already of the age and in the condition expected at the end of its useful life.
127China Molybdenum Co., Ltd.
NOTES TO THE FINANCIAL STATEMENTSFOR THE YEAR ENDED 31 DECEMBER 2017
(III) SIGNIFICANT ACCOUNTING POLICIES AND ACCOUNTING ESTIMATES (CONTINUED)
15. Fixed Assets (Continued)
15.3 Others
If a fixed asset is upon disposal or no future economic benefits are expected to be generated from its use or disposal, the fixed asset is derecognised. When a fixed asset is sold, transferred, retired or damaged, the amount of any proceeds on disposal of the asset net of the carrying amount and related taxes is recognised in profit or loss for the period.
The Group reviews the useful l ife and estimated net residual value of a fixed asset and the depreciation method applied at least once at each financial year-end, and account for any change as a change in an accounting estimate.
16. Construction in progress
Construction in progress is measured at its actual costs. The actual costs include various construction expenditures during the construction period, borrowing costs capitalised before it is ready for intended use and other relevant costs. Construction in progress is not depreciated. Construction in progress is transferred to a fixed asset when it is ready for intended use.
17. Borrowing costs
Borrowing costs directly attributable to the acquisition, construction or production of qualifying asset are capitalised when expenditures for such asset and borrowing costs are incurred and activities relating to the acquisition, construction or production of the asset that are necessary to prepare the asset for its intended use or sale have commenced. Capitalisation of borrowing costs ceases when the qualifying asset being acquired, constructed or produced becomes ready for its intended use or sale.
Where funds are borrowed under a specific-purpose borrowing, the amount of interest to be capitalised is the actual interest expense incurred on that borrowing for the period less any bank interest earned from depositing the borrowed funds before being used on the asset or any investment income on the temporary investment of those funds. Where funds are borrowed under general-purpose borrowings, the Group determines the amount of interest to be capitalised on such borrowings by applying a capitalisation rate to the weighted average of the excess of cumulative expenditures on the asset over the amounts of specific-purpose borrowings. The capitalisation rate is the weighted average of the interest rates applicable to the general-purpose borrowings.

128 2017 Annual Report
NOTES TO THE FINANCIAL STATEMENTSFOR THE YEAR ENDED 31 DECEMBER 2017
(III) SIGNIFICANT ACCOUNTING POLICIES AND ACCOUNTING ESTIMATES (CONTINUED)
18. Biological assets
Biological assets of the Group are consumable biological assets.
18.1 Consumable biological assets
Consumable biological assets are biological assets held for sale or to be harvested as agricultural produce in the future, including, for example, crops, vegetables and timber in plantation forests being grown and livestock being raised or held for sale. The consumable biological assets the Group owns are timbers.
Upon harvest or disposal of consumable biological assets, the Group uses the individual valuation method to carry out the cost by book value.
If there is an active market for consumable biological asset and the Company can obtain market prices and other relevant information regarding the same or similar type of consumable biological asset from the market so as to reasonably estimate the fair value of the related biological asset, the Company subsequently measures the consumable biological asset at fair value with changes of the fair value are recognized in profit or loss for the current period.
19. Intangible Assets
19.1 Intangible Assets
Intangible assets include land use rights and mining rights etc.
An intangible asset is measured initially at cost. When an intangible asset with a finite useful life is available for use, its original cost is amortised over its estimated useful life using the straight-line method or the units of production method. An intangible asset with an indefinite useful life is not amortised.
CategoryAmortization method Useful life
Residual Value Rate
(years) (%)
Land use rights Straight-line method 50 years 0%Mining rights Units of production
methodExpected life
of mines0%
At the end of the year, the Group reviews the useful life and amortisation method of intangible assets, and makes adjustments when necessary.

129China Molybdenum Co., Ltd.
NOTES TO THE FINANCIAL STATEMENTSFOR THE YEAR ENDED 31 DECEMBER 2017
(III) SIGNIFICANT ACCOUNTING POLICIES AND ACCOUNTING ESTIMATES (CONTINUED)
19. Intangible Assets (Continued)
19.2 Research and development expenditure for Internal Study
Expenditure during the research phase is recognised as an expense in the period in which it is incurred.
Expenditure during the development phase that meets all of the following conditions at the same time is recognised as intangible asset. Expenditure during development phase that does not meet the following conditions is recognised in profit or loss for the period:
(1) it is technically feasible to complete the intangible asset so that it will be available for use or sale;
(2) the Group has the intention to complete the intangible asset and use or sell it;
(3) the Group can demonstrate the ways in which the intangible asset will generate economic benefits, including the evidence of the existence of a market for the output of the intangible asset or the intangible asset itself or, if it is to be used internally, the usefulness of the intangible asset;
(4) the availability of adequate technical, f inancial and other resources to complete the development and the ability to use or sell the intangible asset; and
(5) the expenditure attributable to the intangible asset during its development phase can be reliably measured.
If the expenditures cannot be distinguished between the research phase and development phase, the Group recognises all of them in profit or loss for the period.
20. Impairment of long-term Assets
The Group reviews the Long-term equity investments, fixed assets, construction in progress, and intangible assets with finite useful life at each balance sheet date to determine whether there is any indication that they have suffered an impairment loss. If an impairment indication exists, the recoverable amount is estimated. Intangible assets with indefinite useful life and intangible assets not yet available for use are tested for impairment annually, irrespective of whether there is any indication that the assets may be impaired.
130 2017 Annual Report
NOTES TO THE FINANCIAL STATEMENTSFOR THE YEAR ENDED 31 DECEMBER 2017
(III) SIGNIFICANT ACCOUNTING POLICIES AND ACCOUNTING ESTIMATES (CONTINUED)
20. Impairment of long-term Assets (Continued)
Recoverable amount is estimated on individual basis. If it is not practical to estimate the recoverable amount of an individual asset, the recoverable amount of the asset group to which the asset belongs will be estimated. The recoverable amount of an asset or asset group is the higher of its fair value less costs of disposal and the present value of the future cash flows expected to be derived from the asset or asset group.
If such recoverable amount is less than its carrying amount, a provision for impairment losses in respect of the deficit is recognised in profit or loss for the period.
Goodwill is tested for impairment at least at the end of each year. For the purpose of impairment testing, goodwill is considered together with the related assets groups, i.e., goodwill is reasonably allocated to the related assets group(s) or each of assets group(s) expected to benefit from the synergies of the combination. An impairment loss is recognised if the recoverable amount of the assets group or sets of assets groups (including goodwill) is less than its carrying amount. The impairment loss is firstly allocated to reduce the carrying amount of any goodwill allocated to such assets group or sets of assets groups, and then to the other assets of the group pro-rata on the basis of the carrying amount of each asset (other than goodwill) in the group.
Once an impairment loss is recognised for above mentioned assets, it will not be reversed in any subsequent period.
21. Long-term deferred expenses
Long-term prepaid expenses represent expenses incurred that should be borne and amortised over the current and subsequent periods (together of more than one year). Long-term prepaid expenses are amortised using the straight-line method over the expected periods in which benefits are derived.
22. Employee Benefits
22.1 Accounting treatment of short-term remuneration
Actually occurred short-term employee benefits are recognised as liabilities, with a corresponding charge to the profit or loss for the period or in the costs of relevant assets in the accounting period in which employees provide services to the Group. Staff welfare expenses incurred by the Group are recognised in profit or loss for the period or the costs of relevant assets based on the actually occurred amounts when it actually occurred. Non-monetary staff welfare expenses are measured at fair value.
Payment made by the Group of social security contributions for employees such as premiums or contributions on medical insurance, work injury insurance and maternity insurance, etc. and payments of housing funds, as well as union running costs and employee education costs provided in accordance with relevant requirements, are calculated according to prescribed bases and percentages in determining the amount of employee benefits and recognised as relevant liabilities, with a corresponding charge to the profit or loss for the period or the costs of relevant assets in the accounting period in which employees provide services.

131China Molybdenum Co., Ltd.
NOTES TO THE FINANCIAL STATEMENTSFOR THE YEAR ENDED 31 DECEMBER 2017
(III) SIGNIFICANT ACCOUNTING POLICIES AND ACCOUNTING ESTIMATES (CONTINUED)
22. Employee Benefits (Continued)
22.2 Accounting treatment of post-employment benefits
Post-employment benefits are classified into defined contribution plans and defined benefit plans.
During the accounting period of rendering service to employees of the Group, amount which should be paid according to defined contribution plans is recognized as liabilities, and recognized in profit or loss or related costs of assets.
For defined benefit plans, the Group assigns the welfare obligation generated from the defined benefit plans to the period of rendering services using the formula determined by the projected unit credit method, and includes it in the current profit or loss or related asset costs. Employee benefit costs generated from the defined benefit plans are categorized as follows:
• Service cost (including current service cost, past service cost, as well as gains and losses on curtailments and settlements.);
• Net interest of net liabilities or net assets of defined benefit plans (including interest income of planned assets, interest expenses of defined benefit plan liabilities and effect of asset ceiling); and
• Remeasurement of changes in net liabilities or net assets of defined benefit plans.
Service cost and net interest of net liabilities or net assets of defined benefit plans are included in the current profit or loss or related asset costs. Remeasurement of changes in net liabilities or net assets of defined benefit plans (including actuarial gains or losses, return on plan assets excluding the amount included in the net interest of net liabilities or net assets of defined benefit plans, and changes to the asset ceiling excluding the amount included in the net interest of net liabilities or net assets of defined benefit plans) is included in other comprehensive income.
Deficit or surplus generated from the present value of the obligation of defined benefit plan less the fair value of defined benefit plan asset is recognized as a net liability or a net asset of defined benefit plan. If there is a surplus in the defined benefit plan, the lower of the surplus of defined benefit plan and the asset ceiling is used to measure the net asset of the defined benefit plan.
22.3 Accounting treatment of termination benefits
When the Group provides termination benefits to employees, employee benefit liabilities are recognised for termination benefits, with a corresponding charge to the profit or loss for the period at the earlier of: (1) when the Group cannot unilaterally withdraw the offer of termination benefits because of the termination plan or a curtailment proposal; and (2) when the Group recognises costs or expenses related to restructuring that involves the payment of termination benefits.
22.4 Paid absence
Paid absence refers to the Group to pay wages or provide compensation for the absences of staffs, including annual leave, sick leave and so on. The Group recognizes the salaries related to paid absences when staffs provide services to increase their rights of future paid absence, and the salaries to be paid are measured at the accumulation of un-practiced rights.
132 2017 Annual Report
NOTES TO THE FINANCIAL STATEMENTSFOR THE YEAR ENDED 31 DECEMBER 2017
(III) SIGNIFICANT ACCOUNTING POLICIES AND ACCOUNTING ESTIMATES (CONTINUED)
23. Provision
Provisions are recognised when the Group has a present obligation related to a contingency, it is probable that an outflow of economic benefits will be required to settle the obligation, and the amount of the obligation can be measured reliably.
The amount recognised as a provision is the best estimate of the consideration required to settle the present obligation at the balance sheet date, taking into account factors pertaining to a contingency such as the risks, uncertainties and time value of money. Where the effect of the time value of money is material, the amount of the provision is determined by discounting the related future cash outflows.
24. Revenue
24.1 Revenue from sale of goods
If the group provides external hotel room service, it cannot recognize the income until the hotel room service has been provided and the rights of service charge have been obtained.
24.2 Revenue from rendering of services
If the group provides external hotel room service, it cannot recognize the income until the hotel room service has been provided and the rights of service charge have been obtained.

133China Molybdenum Co., Ltd.
NOTES TO THE FINANCIAL STATEMENTSFOR THE YEAR ENDED 31 DECEMBER 2017
(III) SIGNIFICANT ACCOUNTING POLICIES AND ACCOUNTING ESTIMATES (CONTINUED)
25. Government grants
Government grants are transfer of monetary assets and non-monetary assets from the government to the Group at no consideration. A government grant is recognised only when the Group can comply with the conditions attaching to the grant and the Group will receive the grant.。
If a government grant is in the form of a transfer of a monetary asset, it is measured at the amount received or receivable
25.1 Criterion and accounting treatment of government grant related to assets
The government grants of the Group mainly include refunds of land-transferring fees, etc.. Due to direct relationship with investment and construction of fixed assets, such government grants are defined as the government grants related to assets.
A government grant related to an asset is recognised as deferred income, and evenly amortised to profit or loss over the useful life of the related asset.
25.2 Criterion and accounting treatment of government grant related to income
The government grants of the Group mainly include grant for demonstration of mineral resources saving and comprehensive util ization, etc.. Due to direct relationship with the research and development expenditure, such government grants are defined as the government grants related to income.
For a government grant related to income, if the grant is a compensation for related cost expenses or losses to be incurred in subsequent periods, the grant is recognised as deferred income, and recognised in profit or loss/charging against costs over the periods in which the related costs or losses are recognised. If the grant is a compensation for related cost expenses or losses already incurred, the grant is recognised immediately in profit or loss/charging against costs for the period.
A government grant related to the Group's daily activities is recognized in other income/written off related cost and expense based on the nature of economic activities; a government grant is not related to the Group's daily activities is recognized in non-operating income and expenses.

134 2017 Annual Report
NOTES TO THE FINANCIAL STATEMENTSFOR THE YEAR ENDED 31 DECEMBER 2017
(III) SIGNIFICANT ACCOUNTING POLICIES AND ACCOUNTING ESTIMATES (CONTINUED)
26. Deferred Income Tax Assets/Deferred Income Tax Liabilities
The income tax expenses include current income tax and deferred income tax.
26.1 Current income taxes
At the balance sheet date, current income tax liabilities (or assets) for the current and prior periods are measured at the amount expected to be paid (or recovered) according to the requirements of tax laws.
26.2 Deferred tax assets and deferred tax liabilities
For temporary differences between the carrying amounts of certain assets or liabilities and their tax base, or between the nil carrying amount of those items that are not recognised as assets or liabilities and their tax base that can be determined according to tax laws, deferred tax assets and liabilities are recognised using the balance sheet liability method.
Deferred tax is generally recognised for all temporary differences. Deferred tax assets for deductible temporary differences are recognised to the extent that it is probable that taxable profits will be available against which the deductible temporary differences can be utilised. However, for temporary differences associated with the initial recognition of goodwill and the initial recognition of an asset or liability arising from a transaction (not a business combination) that affects neither the accounting profit nor taxable profits (or deductible losses) at the time of transaction, no deferred tax asset or liability is recognised.
For deductible losses and tax credits that can be carried forward, deferred tax assets are recognised to the extent that it is probable that future taxable profits will be available against which the deductible losses and tax credits can be utilised.
Deferred tax liabilities are recognised for taxable temporary differences associated with investments in subsidiaries and associates, and interests in joint ventures, except where the Group is able to control the timing of the reversal of the temporary difference and it is probable that the temporary difference will not reverse in the foreseeable future. Deferred tax assets arising from deductible temporary differences associated with such investments and interests are only recognised to the extent that it is probable that there will be taxable profits against which to utilise the benefits of the temporary differences and they are expected to reverse in the foreseeable future.
At the balance sheet date, deferred tax assets and liabilities are measured at the tax rates, according to tax laws, that are expected to apply in the period in which the asset is realised or the liability is settled.
Current and deferred tax expenses or income are recognised in profit or loss for the period, except when they arise from transactions or events that are directly recognised in other comprehensive income or in shareholders’ equity, in which case they are recognised in other comprehensive income or in shareholders’ equity; and when they arise from business combinations, in which case they adjust the carrying amount of goodwill.
At the balance sheet date, the carrying amount of deferred tax assets is reviewed and reduced if it is no longer probable that sufficient taxable profits will be available in the future to allow the benefit of deferred tax assets to be utilised. Such reduction in amount is reversed when it becomes probable that sufficient taxable profits will be available.
135China Molybdenum Co., Ltd.
NOTES TO THE FINANCIAL STATEMENTSFOR THE YEAR ENDED 31 DECEMBER 2017
(III) SIGNIFICANT ACCOUNTING POLICIES AND ACCOUNTING ESTIMATES (CONTINUED)
26. Deferred Income Tax Assets/Deferred Income Tax Liabilities (Continued)
26.3 Offsetting of income taxes
When the Group has a legal right to settle on a net basis and intends either to settle on a net basis or to realise the assets and settle the liabilities simultaneously, current tax assets and current tax liabilities are offset and presented on a net basis.
When the Group has a legal right to settle current tax assets and liabilities on a net basis, and deferred tax assets and deferred tax liabilities relate to income taxes levied by the same taxation authority on either the same taxable entity or different taxable entities which intend either to settle current tax assets and liabilities on a net basis or to realise the assets and liabilities simultaneously, in each future period in which significant amounts of deferred tax assets or liabilities are expected to be reversed, deferred tax assets and deferred tax liabilities are offset and presented on a net basis.
27. Stripping costs
During mining operations, the Group may find that mineral wastes and surface cover to be removed before mining, and the removal activities for such wastes is called stripping. The stripping costs are usually capitalized in the mining development phase (before production). The capital expenditure is divided into cash outflows of investment activities.
After mining development phase can be ended for getting into the production phase, the waste removal activity is referred to as production stripping.
If the stripping activity is related to the current mining, the associated stripping costs are included in the statement of profit or loss for the current period as operating costs. If production stripping is associated with inventory production and improves the mining environment for subsequent years, the expenditure on the removal of wastes should be reasonably allocated between the two activities, and the portion that is beneficial to the mining environment for subsequent years shall be capitalized into the stripping and development capital expenditures. In some cases, where a large amount of wastes is removed or only a small volume of inventory is produced, the costs incurred by the stripping of wastes will be fully capitalized.
On the basis of the proven reserves of ore, all capitalized waste stripping costs are depreciated in accordance with the output method.
The impact on the waste stripping costs or on the remaining ore reserves arising from changes in mine life expectancy or mining plans will be treated as changes in accounting estimates.
28. Exploration, assessment and development expenditures
The costs of exploration and assessment are directly recognized in costs when they are incurred. When a mine is determined to be of economic value, all subsequent assessment expenditures, including expenditures incurred in early development phase, shall be capitalized into the cost of the underlying asset. The above capitalization terminates after the mine has reached the commercial production phase. The exploration assets generated from acquisitions are presented on the balance sheet at the cost less the accumulated impairment loss.

136 2017 Annual Report
NOTES TO THE FINANCIAL STATEMENTSFOR THE YEAR ENDED 31 DECEMBER 2017
(III) SIGNIFICANT ACCOUNTING POLICIES AND ACCOUNTING ESTIMATES (CONTINUED)
29. Leasing
Leases are classified as finance leases whenever the terms of the lease transfer substantially all the risks and rewards of ownership to the lessee. All other leases are classified as operating leases.
29.1 Accounting treatment of operating leases
29.1.1 The Group as lessee under operating leases
Operating lease payments are recognised on a straight-line basis over the terms of the relevant lease, and are either included in the cost of related asset or charged to profit or loss for the period. Initial direct costs incurred are charged to profit or loss for the period. Contingent rents are charged to profit or loss in the period in which they are actually incurred.
29.1.2 The Group as lessor under operating leases
Rental income from operating leases is recognised in profit or loss on a straight-line basis over the terms of the relevant lease. Initial direct costs with more than an insignificant amount are capitalised when incurred, and are recognised in profit or loss on the same basis as rental income over the lease term. Other initial direct costs with an insignificant amount are charged to profit or loss in the period in which they are incurred. Contingent rents are charged to profit or loss in the period in which they actually arise.
30. Other Significant Accounting Policies and Accounting Estimations
30.1 Maintenance costs of simple reproduction
In accordance with current Chinese regulations, exploitation enterprises located within China shall extract maintenance costs of simple reproduction (hereinafter referred as to “simple maintenance cost”) based on the RMB15/ton in relation to original metal mine output.
The group shall extract the “simple maintenance cost” in accordance with the specified regulations; it shall debit “manufacturing expenses” and credit “special reserves”.
If the group uses such capital reserves to purchase and install properties such as equipment and facilities relevant to simple reproduction maintenance, they shall be included into relevant asset cost; debiting “construction in progress” and other projects and crediting “bank deposit” and other items shall not be recognized as the fixed asset until the maintenance project of simple reproduction is completed and complies with expected available situation; meanwhile, accumulated depreciation in same amount shall be recognized in accordance with special capital reserves for cost offset of the fixed assets. The depreciation of fixed assets such as debiting item of “special reserves” and crediting item of “accumulated depreciation” shall not be counted and withdrew in the future. But amount carried forward is within the limit of the balance of “special reserves” being offset to be zero.
137China Molybdenum Co., Ltd.
NOTES TO THE FINANCIAL STATEMENTSFOR THE YEAR ENDED 31 DECEMBER 2017
(III) SIGNIFICANT ACCOUNTING POLICIES AND ACCOUNTING ESTIMATES (CONTINUED)
30. Other Significant Accounting Policies and Accounting Estimations (Continued)
30.1 Maintenance costs of simple reproduction (Continued)
When the reserve is used to pay and maintain the expenses related to simple reproduction, it should directly write down special reserve, debit “special reserve” and credit “bank deposit”. The amount carried forward should be within the scope that the balance of “special reserve” is written down to zero.
According to the Ministry of Finance P.R China Zi [2015] No. 8 Notice on No More provision on the Standard of the Cost to Maintain Simple Reproduction of Metallurgic Mine issued by the Ministry of Finance on 27 April 2015, the Company since April 2015 no longer provided the simple maintenance cost. The surplus of such maintenance cost in previous years will be used continuously according to the original criterion till zero.
30.2 Safety Production Expenses
In accordance with CQ [2012] No. 16 notice of printing and distributing Management Methods for Provision and Using Safety Production Expenses, the safety expenses for domestic mining enterprises are provided as per RMB5/ton for raw ore of surface mine, RMB10/ton for raw ore of downhole mine and RMB1/ton as for tailing pond.
In accordance with CQ [2012] No. 16 notice of printing and distributing Management Methods for Provision and Using Safety Production Expenses, safety expenses of the metallurgy enterprises of the group located in China will be provided as per actual operating revenue in last year. The safety expenses will the provided month by month based on the following standards with excessive and accumulative withdrawal method:
(I) Provided 3% if the operating revenue does not exceed RMB10 million;
(II) Provided 1.5% if the operating revenue is RMB10 million to RMB0.1 billion;
(III) Provided 0.5% if the operating revenue is RMB0.1 billion to RMB1 billion;
(IV) Provided 0.2% if the operating revenue is RMB1 billion to RMB5 billion;
(V) Provided 0.1% if the operating revenue is RMB5 billion to RMB10 billion;
(VI) Provided 0.05% if the operating revenue exceeds RMB10 billion.

138 2017 Annual Report
NOTES TO THE FINANCIAL STATEMENTSFOR THE YEAR ENDED 31 DECEMBER 2017
(III) SIGNIFICANT ACCOUNTING POLICIES AND ACCOUNTING ESTIMATES (CONTINUED)
30. Other Significant Accounting Policies and Accounting Estimations (Continued)
30.2 Safety Production Expenses (Continued)
When safety expenses of the enterprises is provided as per the standards, debit “manufacturing expenses” and credit “special reserve.
When the safety protection equipment and facilities are purchased with safety production reserve within specified limit, it should debit “construction in progress” and credit “bank loans” based on the amount included into assets cost. The safe projects will be deemed as fixed assets upon completion and reaching the reserved serviceable condition; the special reserves will be written down as per the cost of fixed assets and the cumulative depreciation in the same amount will be confirmed; debit “special reserve” and credit “cumulative depreciation”. The fixed asset will not withdraw depreciation later. But amount carried forward is within the limit of the balance of “special reserves” being offset to be zero.
When the safety production reserve is used to pay the expenses in safety production inspection, evaluating expenditure, safety skills training and emergency rescue drill, it should directly write down special reserves, debit “special reserves” and credit “bank loans”. The amount carried forward should be within the scope that the balance of “special reserve” is written down to zero.
30.3 Discontinued operations
A discontinued operation is a component of an entity that either has been disposed of or is classified as held for sale:
– The component represents either a separate major line of business or a geographical area of operations.
– The component is part of a single co-ordinated plan to dispose of a separate major line of business or geographical area of operations.
– The component is a subsidiary acquired exclusively with a view to resale and the disposal involves loss of control.
31. Critical judgements in applying accounting policies and key assumptions and uncertainties in the accounting estimates
In the application of the Group’s accounting policies, which are described in Note III, the Group is required to make judgments, estimates and assumptions about the carrying amounts of items in the financial statements that cannot be measured accurately, due to the internal uncertainty of the operating activities. These judgments, estimates and assumptions are based on historical experiences of the Group’s management as well as other factors that are considered to be relevant. Actual results may differ from these estimates.
The aforementioned judgments, estimates and assumptions are reviewed regularly on a going concern basis. The effect of a change in accounting estimate is recognised in the period of the change, if the change affects that period only; or recognised in the period of the change and future periods, if the change affects both.

139China Molybdenum Co., Ltd.
NOTES TO THE FINANCIAL STATEMENTSFOR THE YEAR ENDED 31 DECEMBER 2017
(III) SIGNIFICANT ACCOUNTING POLICIES AND ACCOUNTING ESTIMATES (CONTINUED)
31. Critical judgements in applying accounting policies and key assumptions and uncertainties in the accounting estimates (Continued)
Key assumptions and uncertainties in accounting estimates
The following are the key assumptions and uncertainties in accounting estimates at the balance sheet date, that have a significant risk of causing a material adjustment to the carrying amounts of assets and liabilities in future periods:
Estimate of mineral reserve
The estimate of mineral reserve is determined based on the materials formulated by the industrial experts or other judicial authorities. Use the method to determine the mineral reserve and other minerals and calculate depreciation and amortization expenses, evaluate impairment indicators and useful life of mine, and forecast the payment time of rehabilitation cost for forecasting to be closed or rehabilitate mine.
When evaluating the useful life of mine for the purpose of accounting, calculate the mineral resources with mining value. The estimate of mineral reserve will involve multiple uncertainties. Estimate the currently effective assumptions and material changes in actual data. The changes in market prices, exchange rate, production cost or recovery may change the current economic situation of reserve and cause revaluation of the reserve in the end.
The useful life of fixed assets
The management should judge the estimated useful life of fixed assets and their depreciations. The estimate should base on the experience in actual useful life of fixed assets and assume the government will update upon expiration of mining rights. In the face of fierce industrial competition, the scientific innovation and competitors will produce significance on the estimate of useful life. Where the actual useful life is different from the estimated useful life, the management should adjust the depreciation amount.
Non-current assets impairment other than financial assets
The Group assesses whether there are any indicators of impairment for all non-current assets other than financial assets at the balance sheet date. Non-current assets other than financial assets are tested for impairment when there are indicators that the carrying amounts may not be recoverable. For intangible assets with indefinite useful life and intangible assets not yet available for use are tested for impairment annually, irrespective of whether there is any indication that the assets may be impaired. Impairment exists if the carrying amount of an asset or asset group is higher than recoverable amount, the higher of its fair value less costs of disposal and the present value of the future cash flows expected to be derived from the asset or asset group. The calculation of the fair value less costs of disposal is based on available data from the observable market prices less incremental costs for disposing of the asset. The management must estimate the future cash flows of the asset or a set of asset group and determine a suitable discount rate to calculate the estimation of the present value of estimated future cash flows.

140 2017 Annual Report
NOTES TO THE FINANCIAL STATEMENTSFOR THE YEAR ENDED 31 DECEMBER 2017
(III) SIGNIFICANT ACCOUNTING POLICIES AND ACCOUNTING ESTIMATES (CONTINUED)
31. Critical judgements in applying accounting policies and key assumptions and uncertainties in the accounting estimates (Continued)
Non-current assets impairment other than financial assets (Continued)
– Impairment of mining rights
At the impairment test of the Group’s mining rights, including the mining rights of the Northparkes Copper-gold mine in Australia, Tenke Copper-Cobalt mine in Congo, the Molybdenum mine in East Gobi of Hami of Xinjiang, and the Cubitão Phosphate mine and Catalão Niobium mine in Brazil, the management of the Group uses the long-term forecast data of Copper price and Molybdenum price from domestic and overseas authoritative research institutions as the sales price estimates of future Copper and Molybdenum products, and uses the latest estimates of the management’s mining plan and future capital expenditures as a basis. The current risk-free rate of return, the average social rate of return, and enterprise-specific risks are taken into full consideration for the discount rate. The estimated future recoverable amount of the mining assets is largely determined by the above estimates of future commodity prices, mining plans, future capital expenditure plans and discount rates. Future commodity price forecasts do not represent actual sales prices that can be realized in the future, and mining plans, future capital expenditure plans and discount rates will also change. As at 31 December 2017, the management of the Group considered that there was no impairment of the mining assets held by the Group. If the above forecast and estimates change in the subsequent period, the estimated recoverable amount of the Group's mining assets may change or be lower than the carrying amount of the above assets.
– Impairment of goodwill
The Group tests at least annually whether the goodwill is impaired. This requires an estimate of the present value of future cash flows of an asset group or portfolio of asset groups for which the goodwill is allocated. For the forecast of the present value of future cash flows, the Group needs to forecast the cash flows generated by future asset groups or portfolio of asset groups and select the appropriate discount rate to determine the present value of future cash flows.
Provision for decline in value of inventories
As described in Note (III). 12, inventories are measured at the lower of cost and net realizable value. Net realizable value is the estimated selling price in the ordinary course of business less the estimated costs of completion, the estimated costs necessary to make the sale and relevant taxes.
Operational procedures have been in place to monitor this risk as a significant proportion of the Company’s working capital is devoted to inventories. The management reviews the inventory aging list on a periodical basis for those aged inventories. This involves comparison of carrying amount of the aged inventory items with the respective net realizable value. The purpose is to ascertain whether allowance is required to be made in the financial statements for any obsolete and slow-moving items. In addition, physical counts on all inventories are carried out on a periodical basis in order to determine whether allowance need to be made in respect of any obsolete and defective inventories identified. In this regard, the management of the Company are satisfied that this risk is minimal and adequate provision for obsolete and slow-moving inventories has been made in the financial statements.

141China Molybdenum Co., Ltd.
NOTES TO THE FINANCIAL STATEMENTSFOR THE YEAR ENDED 31 DECEMBER 2017
(III) SIGNIFICANT ACCOUNTING POLICIES AND ACCOUNTING ESTIMATES (CONTINUED)
31. Critical judgements in applying accounting policies and key assumptions and uncertainties in the accounting estimates (Continued)
Impairment of accounts receivable
Impairment loss of trade and other receivables is made when there is objective evidence that the recoverability of trade and other receivables becomes doubtful. The impairment loss calculations contain uncertainties because the management is required to make assumptions and to apply judgment regarding historical settlement experience, debt aging, financial status of debtors and general economic conditions. There is no reason to believe that there will be a material change in the future estimates or assumptions which are used in the calculations of impairment loss of trade and other receivables. However, when the actual outcome or expectation in future is different from the original estimates, the carrying amount of trade and other receivables and impairment loss may change.
Provision for closure, restoration, rehabilitation and environmental costs
Provision for rehabilitation and environmental costs has been determined by the directors based on their best estimates. The directors estimated this liability for final reclamation and mine closure based upon detailed calculations of the amount and timing of future cash flows spending for a supplier to perform the required work, escalated for inflation, then discounted at a discount rate that reflects current market assessments of the time value of money and the risks specific to the liability, such that the provision reflects the present value of the expenditures expected to be required to settle the obligation. However, in so far as the effect on the land and the environment from current mining activities becomes apparent in future periods, the estimate of the associated costs may be subject to change in the future. The provision is reviewed regularly to verify that it properly reflects the present value of the obligation arising from the current and past mining activities.
Deferred tax assets
Deferred tax assets arise from the actual profits and temporary differences based on the actual tax rates utilized in the upcoming years. In cases where the actual future profits are less than the expected profits or the actual tax rates are lower than the expected tax rates, deferred tax assets recognized will be reversed and recognized in the consolidated profit and loss account for the period during which such reversals take place.
142 2017 Annual Report
NOTES TO THE FINANCIAL STATEMENTSFOR THE YEAR ENDED 31 DECEMBER 2017
(III) SIGNIFICANT ACCOUNTING POLICIES AND ACCOUNTING ESTIMATES (CONTINUED)
31. Critical judgements in applying accounting policies and key assumptions and uncertainties in the accounting estimates (Continued)
Deferred tax liabilities arising from acquisition of Brazil business
In the Group's acquisition of Brazil business not involving enterprises under common control in 2016, the identifiable net assets of the acquiree were measured at fair value on the acquisition date, and deferred tax liabilities were recognised according to the difference between the fair value of related assets at the date of acquisition and the tax base. According to the regulations of local tax law of Brazil, the taxable temporary differences can be reversed in the future if specific conditions are met, however as the conditions are met with significant uncertainty, the management of the Group recognize the amount of deferred tax liabilities of RMB1,463,144,598.20 (2016: RMB1,642,841,579.32). Once specific conditions are met in the future, the Group's deferred income tax liability might be reversed in the future to form one-off benifit.
Enterprise income tax
Since the operating environment for subsidiaries of the Group situated in the Brazil and Congo (DRC) is special, and the final tax decisions on certain transactions made by local tax authorities have uncertainties, relevant subsidiaries use significant accounting estimates in the provision for the enterprise income tax during the reporting period, and make provision for liabilities on estimated enterprise income tax matters based on whether or not more income tax should be paid. As a result of the uncertainties in the calculation of the final income tax expense imposed by certain transactions, the enterprise income tax expense accrued by the relevant subsidiaries during the reporting period is an objective estimate based on existing tax laws and other relevant tax policies.
Contingent liabilities
The Group will face a wide range of legal disputes in the course of continuing operations, and the results of the relevant disputes are highly uncertain.
When the economic benefits related to a particular legal dispute are considered to be extremely likely to flow out and measurable, the management of the Group will make corresponding provisions according to the professional legal advice. Except those contingent liabilities which are considered to be of extremely low possibility to result in outflow of economic benefits, the contingent liabilities of the Group are disclosed in Note V, 34 and Note XI. The management uses judgment to determine whether a provision shall be made for the relevant legal dispute or whether the dispute shall be disclosed as a contingent liability.
Fair value measurement
Part of the Group's book assets and liabilities is measured at fair value. In determining the fair value of the underlying assets and liabilities, the management of the Group will adopt the appropriate valuation method and the input value of the fair value measurement according to the nature of the underlying assets and liabilities. For the selection of input values, the Group will use observable market data wherever possible.

143China Molybdenum Co., Ltd.
NOTES TO THE FINANCIAL STATEMENTSFOR THE YEAR ENDED 31 DECEMBER 2017
(III) SIGNIFICANT ACCOUNTING POLICIES AND ACCOUNTING ESTIMATES (CONTINUED)
32. Changes in significant accounting policies and accounting estimates
The Group started adopting the Accounting Standard for Business Enterprise No.42 Held-for-sale Non-current Assets and Disposal Groups and Discontinued Operations issued by Ministry of Finance ("MoF") in 2017, and the Accounting Standard for Business Enterprise No.16 – Government Grants revised by MoF in 2017 respectively since 28 May 2017 and 12 June 2017 respectively. Besides, the financial statements have been prepared under the Notice of the Revised Format of Financial Statements for General Business Enterprise (Cai Kuai (2017) No. 30, hereinafter referred to as the "Cai Kuai No.30 Document") released by the MoF on 25 December 2017.
Held-for-sale Non-current Assets and Disposal Groups and Discontinued Operations
Accounting Standard for Business Enterprise No.42 Held-for-sale Non-current Assets and Disposal Groups and Discontinued Operations specifies regulations for classifications and measurement of held-for-sale non-current assets or disposal group, requiring separately present profit or loss arising from continued operations or discontinued operations in the income statement with detailed disclosures about information of the held-for-sale non-current assets or disposal group and discontinued operations. This standard requires retrospective approach for accounting treatment, which has no impact on the financial statements for the comparable years.
Government grants
Prior to the implementation of the Accounting Standard for Business Enterprise No.16 – Government Grants (revised), a government grant related to an assets of the Company is recognized as deferred income and evenly amortized to non-operating income over the useful life of the related assets. For a government grant related to income, if the grant is a compensation for related expenses or losses to be incurred in subsequent periods, the grant is recognised as deferred income, and included in non-operating income over the periods in which the related costs are recognised. If the grant is a compensation for related expenses or losses already incurred, the grant is recognised immediately in non-operating income for the period.
After the implementation of the Accounting Standard for Business Enterprise No.16 – Government Grants (revised), a government grant related to an asset is recognized as deferred income or charged against the carrying amount of related assets, and included in profit or loss over the useful life of the related asset evenly. For a government grant related to an income, if the grant is a compensation for related expenses or losses to be incurred in subsequent periods, the grant is recognized as deferred income, and included in profit or loss or charged against the related cost over the periods in which the related costs or losses are recognized; if the grant is a compensation for related expenses or losses already incurred, the grant is recognized immediately in profit or loss or charged against the related cost. A government grant related to the Group's daily activities is recognized in other income/charged against related cost and expense based on the nature of economic activities; a government grant is not related to the Group's daily activities is recognized in non-operating income and expenses.
The Company has accounted for the above change in accounting policy retrospectively. Such changes in accounting policy has no impact on the financial statements for the comparable years.
144 2017 Annual Report
NOTES TO THE FINANCIAL STATEMENTSFOR THE YEAR ENDED 31 DECEMBER 2017
(III) SIGNIFICANT ACCOUNTING POLICIES AND ACCOUNTING ESTIMATES (CONTINUED)
32. Changes in significant accounting policies and accounting estimates (Continued)
Presenting profit or loss from disposal of assets
Prior to the release of the Cai Kuai No. 30 Document, the gains or losses recognized from sales of held-for-sale non-current assets (excluding financial instruments, long-term equity investment or investment properties) or disposal group, and gains or losses arising from disposal of fixed assets. Construction in progress and intangible assets not classified as held-for-sale are presented under the item of "non-operating income" or "non-operating expenses". After the release of the Cai Kuai No.30 Document, gains or losses recognized from sales of held-for-sale non-current assets (excluding financial instruments, long-term equity investment or investment properties) or disposal groups, and gains or losses arising from disposal of fixed assets, construction in progress and intangible assets not classified as held-for-sale are presented under the item of "income from disposal of assets". The Group has accounted for the above change in presenting accounts retrospectively, and adjusted comparable data for prior year.
These accounting policies changes have been adopted on the 13th session of the fourth board of directors and the 20th session of the fourth board of supervisors on 29 March 2018.
(IV) TAXATION
1. Major categories of taxes and tax rates
Category of tax Basis of tax computation Tax rate
Chinese VAT (Note 1) The Company is an ordinary Value-Added Tax payer. Value-added Tax (“VAT”) on sales is paid after deducting input VAT on purchases.
Output VAT on sales is calculated at 17% on revenue according to the relevant requirement of tax laws. Gold related products are exempt from VAT.
Chinese city maintenance and construction tax
Actual turnover tax For city urban area tax rate is 7%; For county town, tax rate is 5%; For other, tax rate is 1%.
Chinese resource tax Raw ore production or sales volume of concentrate
6.5%, 11% collection on ad valorem basis (Note 2)
Chinese educational surtax and surcharge
Actual turnover tax 3%
Chinese regional educational surtax and surcharge
Actual turnover tax 2%
Australia goods and services tax (“GST”)
Amount of the income from rendering of goods and services in Australia less the deductible purchase cost. It is not required to pay goods and services tax for export goods and the refund policy of goods and services tax is also applicable.
10% of the sales price of goods or services

145China Molybdenum Co., Ltd.
NOTES TO THE FINANCIAL STATEMENTSFOR THE YEAR ENDED 31 DECEMBER 2017
(IV) TAXATION (CONTINUED)
1. Major categories of taxes and tax rates (Continued)
Category of tax Basis of tax computation Tax rate
Australia mining royalty Royalty of mineral resources can be levied by volume or by price. If levied by volume, the royalty will be levied per the unit of exploited minerals. If levied by price, it will be levied per 4% of the total value or the sales price of exploited minerals.
4% ex-mine value
Australia mining royalty Royalty of mineral resources can be levied by volume or by price. If levied by volume, the royalty will be levied per the unit of exploited minerals. If levied by price, it will be levied per 4% of the total value or the sales price of exploited minerals.
4% ex-mine value
Congo (DRC) VAT VAT of the Democratic Republic of the Congo (“DRC”) is applicable to TFM.
The output VAT is calculated at 16% of the sales amount calculated in accordance with the relevant tax provisions.
Enterprise income tax Taxable income: the amount of taxable income is computed on basis of adjusted pre-tax accounting profit of the period in accordance with the relevant provisions of the tax law multiplying by the statutory tax rate.
Note 3
Note 1: In accordance with the Cai Kuai [2016] No.22 Notice on the Accounting Provisions on Value Added Tax of the Ministry of Finance (hereinafter referred to as "Notice No. 22") issued by the Ministry of Finance on 3 December 2016, the account name "Business Taxes and Surcharges" is adjusted to be "Taxes and Surcharges" upon the full implementation of replacing business tax with value-added tax; this account is applied for the accounting of the consumption tax, city maintenance and construction tax, resource tax, education surcharge and property tax, land use tax, travel tax, stamp duty and other related taxes and fees incurred in operating activities of enterprises; "Business Taxes and Surcharges" in the income statement is adjusted to be " Taxes and Surcharges".
Note 2: Pursuant to the Notice on Implementation of the Reform of Resource Tax of Rare Earth, Tungsten and Molybdenum Featured by Price-based Tax Calculation and Collection (Cai Shui [2015] No. 52) issued by the Ministry of Finance and State Administration of Taxation, the implementation of calculation and collection of Molybdenum resources tax shall be changed from volume- based tax to price-based tax on and after 1 May 2015. The applicable rate of Tungsten resources tax is 6.5%. The applicable rate of Molybdenum resources tax is 11%.
146 2017 Annual Report
NOTES TO THE FINANCIAL STATEMENTSFOR THE YEAR ENDED 31 DECEMBER 2017
(IV) TAXATION (CONTINUED)
1. Major categories of taxes and tax rates (Continued)
Note 3: Applicable income tax rate:
The applicable enterprise income tax rate for the Company and its domestic subsidiaries was 25%.
China Molybdenum (Hong Kong) Company Limited and CMOC Co., Ltd was incorporated in Hong Kong, thus was subject to Income Tax levied at a rate of 16.5%.
CMOC Mining Pty Limited and CMOC Mining Services Pty. Limited was incorporated in Australia, was subject to Income Tax levied at a rate of 30%.
CMOC Sales & Marketing Limited was incorporated in the United Kingdom, thus was subject to the applicable income tax rate of 20%.
Copebras Indústria Ltda, Niobras Mineração Ltda and CMOC BRASIL SERVICOS ADMINISTRATIVOS E PARTICIPACOES LTDA. are incorporated in Brazil, thus was subject to the income tax rate of 34%.
There's no enterprise income tax for the subsidiaries of the Group established in Bermuda and the British Cayman Islands.
TFM was incorporated in Congo (DRC) and was subject to the enterprise income tax rate of 30%.
2. Tax incentive and approval
On 10 May 2015, the Decision of the State Council on Cancelling Non-Administrative Licensing Approval Items cancelled the recognition process of enterprise of comprehensive utilization of resources. However, the company sold powdered Tungsten (scheelite concentrates) is still within the scope of catalogue of income tax preferential program of enterprise of comprehensive utilization of resources. Therefore, the Company still recognized 90% of sales of powdered Tungsten (scheelite concentrates) to taxable income during 1 January 2017 to 31 December 2017.
On 6 December 2017, the Company received a "high-tech enterprise certificate", No. GR201741000176, which was jointly issued by the Henan Science and Technology Department, Henan Finance Department, the State Taxation Bureau of Henan Province and Local Taxation Bureau of Henan Province. The issuance of the high-tech enterprise certificate is a re-recognition after the expiration of the previous certificate, of which the validity is from 1 January 2017 to 31 December 2019, and the applicable enterprise income rate during above period is 15%.
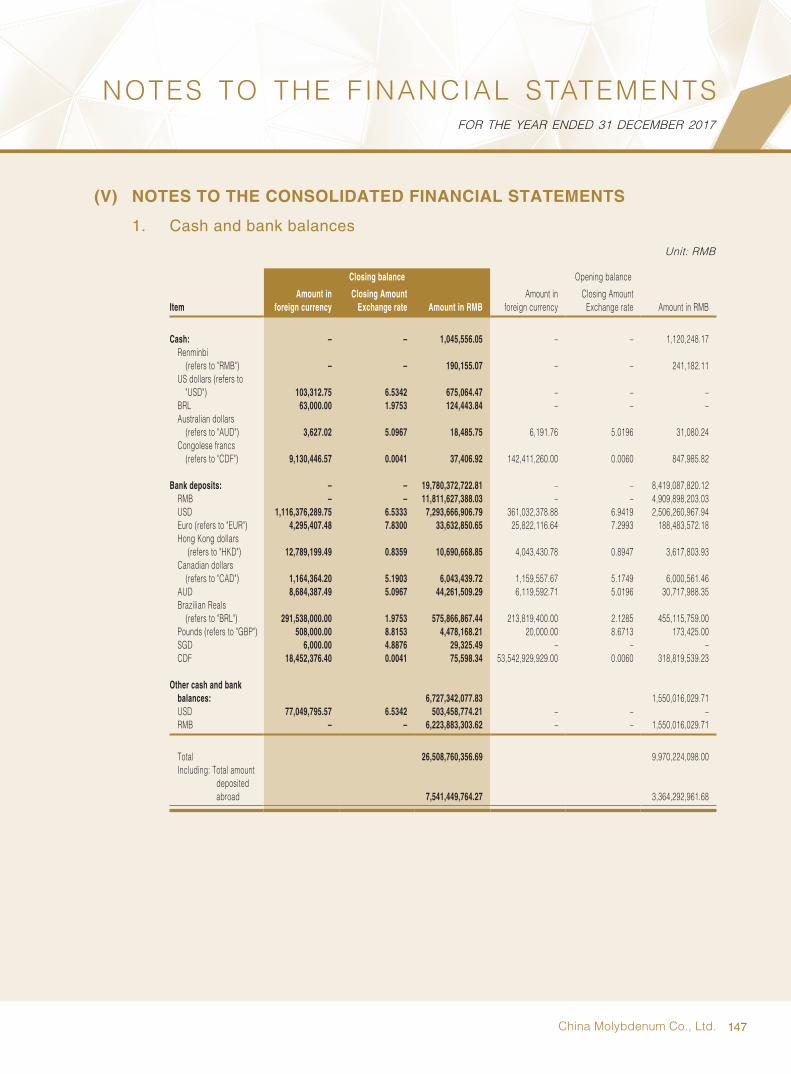
147China Molybdenum Co., Ltd.
NOTES TO THE FINANCIAL STATEMENTSFOR THE YEAR ENDED 31 DECEMBER 2017
(V) NOTES TO THE CONSOLIDATED FINANCIAL STATEMENTS
1. Cash and bank balances
Unit: RMB
Closing balance Opening balance
ItemAmount in
foreign currencyClosing Amount
Exchange rate Amount in RMBAmount in
foreign currencyClosing Amount Exchange rate Amount in RMB
Cash: – – 1,045,556.05 – – 1,120,248.17Renminbi
(refers to "RMB") – – 190,155.07 – – 241,182.11US dollars (refers to
"USD") 103,312.75 6.5342 675,064.47 – – –BRL 63,000.00 1.9753 124,443.84 – – –Australian dollars
(refers to "AUD") 3,627.02 5.0967 18,485.75 6,191.76 5.0196 31,080.24Congolese francs
(refers to "CDF") 9,130,446.57 0.0041 37,406.92 142,411,260.00 0.0060 847,985.82 Bank deposits: – – 19,780,372,722.81 – – 8,419,087,820.12
RMB – – 11,811,627,388.03 – – 4,909,898,203.03USD 1,116,376,289.75 6.5333 7,293,666,906.79 361,032,378.88 6.9419 2,506,260,967.94Euro (refers to "EUR") 4,295,407.48 7.8300 33,632,850.65 25,822,116.64 7.2993 188,483,572.18Hong Kong dollars
(refers to "HKD") 12,789,199.49 0.8359 10,690,668.85 4,043,430.78 0.8947 3,617,803.93Canadian dollars
(refers to "CAD") 1,164,364.20 5.1903 6,043,439.72 1,159,557.67 5.1749 6,000,561.46AUD 8,684,387.49 5.0967 44,261,509.29 6,119,592.71 5.0196 30,717,988.35Brazilian Reals
(refers to "BRL") 291,538,000.00 1.9753 575,866,867.44 213,819,400.00 2.1285 455,115,759.00Pounds (refers to "GBP") 508,000.00 8.8153 4,478,168.21 20,000.00 8.6713 173,425.00SGD 6,000.00 4.8876 29,325.49 – – –CDF 18,452,376.40 0.0041 75,598.34 53,542,929,929.00 0.0060 318,819,539.23
Other cash and bank balances: 6,727,342,077.83 1,550,016,029.71 USD 77,049,795.57 6.5342 503,458,774.21 – – –RMB – – 6,223,883,303.62 – – 1,550,016,029.71
Total 26,508,760,356.69 9,970,224,098.00 Including: T otal amount
deposited abroad 7,541,449,764.27 3,364,292,961.68

148 2017 Annual Report
NOTES TO THE FINANCIAL STATEMENTSFOR THE YEAR ENDED 31 DECEMBER 2017
(V) N O T E S T O T H E C O N S O L I D A T E D F I N A N C I A L S T A T E M E N T S (CONTINUED)
1. Cash and bank balances (Continued)
At the end of the year, the Group's other cash and bank balances above include structural bank deposit and guarantee deposit, in which the structural bank deposit is of RMB4,700,000,000.00 (Opening balance: RMB400,000,000.00) and the guarantee deposit of bank acceptances is of RMB300,000,000.00 (Opening balance: RMB450,000,000.00), the loan guarantee deposit is of RMB1,701,421,274.21 (Opening balance: RMB630,000,000.00), the special deposit for mine environmental restoration and management is of RMB24,420,803.62 (Opening balance: RMB20,016,029.71), and other guarantee deposit is of RMB1,500,000.00 (Opening balance: RMB50,000,000.00).
The structural bank deposits are all within one year period and interest rate with 3.60% to 5.15%. The above-mentioned structural deposits cannot be withdrawn in advance in the deposit term.
2. Financial assets measured at fair value through profit or loss
Unit: RMB
Item Closing Fair Value Opening Fair Value
Forward foreign exchange contract (note) – 55,599,027.64
Note: Gain or loss arising from changes in the fair value of the forward exchange contract not designated as hedging instrument are recognised in profit or loss immediately.
3. Notes receivable
(1) Categories of notes receivable
Unit: RMB
Category Closing balance Opening balance
Bank acceptances 1,579,021,877.20 818,237,625.20Commercial acceptances 171,670,000.00 132,624,000.00
Total 1,750,691,877.20 950,861,625.20

149China Molybdenum Co., Ltd.
NOTES TO THE FINANCIAL STATEMENTSFOR THE YEAR ENDED 31 DECEMBER 2017
(V) N O T E S T O T H E C O N S O L I D A T E D F I N A N C I A L S T A T E M E N T S (CONTINUED)
3. Notes receivable (Continued)
(2) At the end of the year, there's no notes receivable was used for pledge.
(3) Notes receivable endorsed or discounted by the Company but outstanding at the end of the period in the balance sheet
Unit: RMB
Category
Amount derecognized at
the end of the year
Amount derecognized at
the end of the prior year
Bank acceptance 208,924,514.69 814,706,228.07
Total 208,924,514.69 814,706,228.07
Note: Since major risks including the interest rate risks related to such bank acceptance as well as the remuneration have been substantially transferred to the bank or another party, the Group ceased to recognize discounted or endorsed bank acceptances. At the end of 2017, the group has no commercial acceptances discounted at year end which have not yet expired on the balance sheet date.
(4) As at the beginning and the end of the period, none of the Group’s notes was transferred to accounts receivable due to the drawers’ failure in performing the agreements.
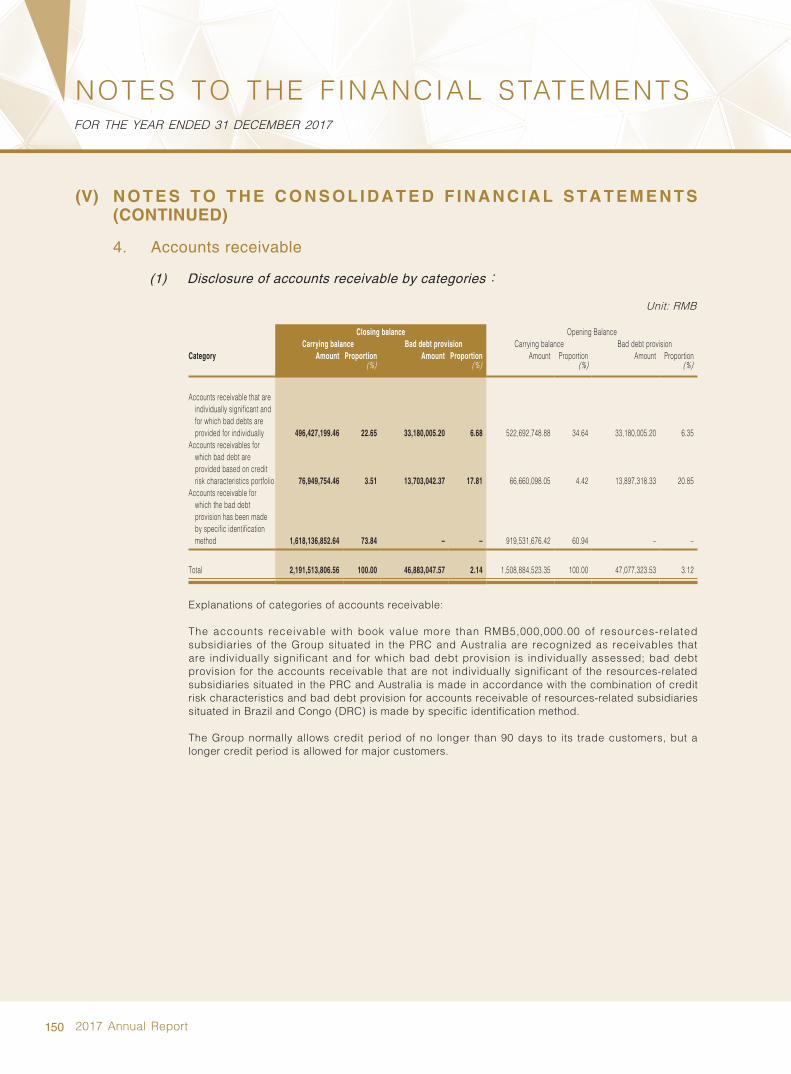
150 2017 Annual Report
NOTES TO THE FINANCIAL STATEMENTSFOR THE YEAR ENDED 31 DECEMBER 2017
(V) N O T E S T O T H E C O N S O L I D A T E D F I N A N C I A L S T A T E M E N T S (CONTINUED)
4. Accounts receivable
(1) Disclosure of accounts receivable by categories:
Unit: RMB
Closing balance Opening BalanceCarrying balance Bad debt provision Carrying balance Bad debt provision
Category Amount Proportion Amount Proportion Amount Proportion Amount Proportion (%) (%) (%) (%)
Accounts receivable that are individually significant and for which bad debts are provided for individually 496,427,199.46 22.65 33,180,005.20 6.68 522,692,748.88 34.64 33,180,005.20 6.35
Accounts receivables for which bad debt are provided based on credit risk characteristics portfolio 76,949,754.46 3.51 13,703,042.37 17.81 66,660,098.05 4.42 13,897,318.33 20.85
Accounts receivable for which the bad debt provision has been made by specific identification method 1,618,136,852.64 73.84 – – 919,531,676.42 60.94 – –
Total 2,191,513,806.56 100.00 46,883,047.57 2.14 1,508,884,523.35 100.00 47,077,323.53 3.12
Explanations of categories of accounts receivable:
The accounts receivable with book value more than RMB5,000,000.00 of resources-related subsidiaries of the Group situated in the PRC and Australia are recognized as receivables that are individually significant and for which bad debt provision is individually assessed; bad debt provision for the accounts receivable that are not individually significant of the resources-related subsidiaries situated in the PRC and Australia is made in accordance with the combination of credit risk characteristics and bad debt provision for accounts receivable of resources-related subsidiaries situated in Brazil and Congo (DRC) is made by specific identification method.
The Group normally allows credit period of no longer than 90 days to its trade customers, but a longer credit period is allowed for major customers.
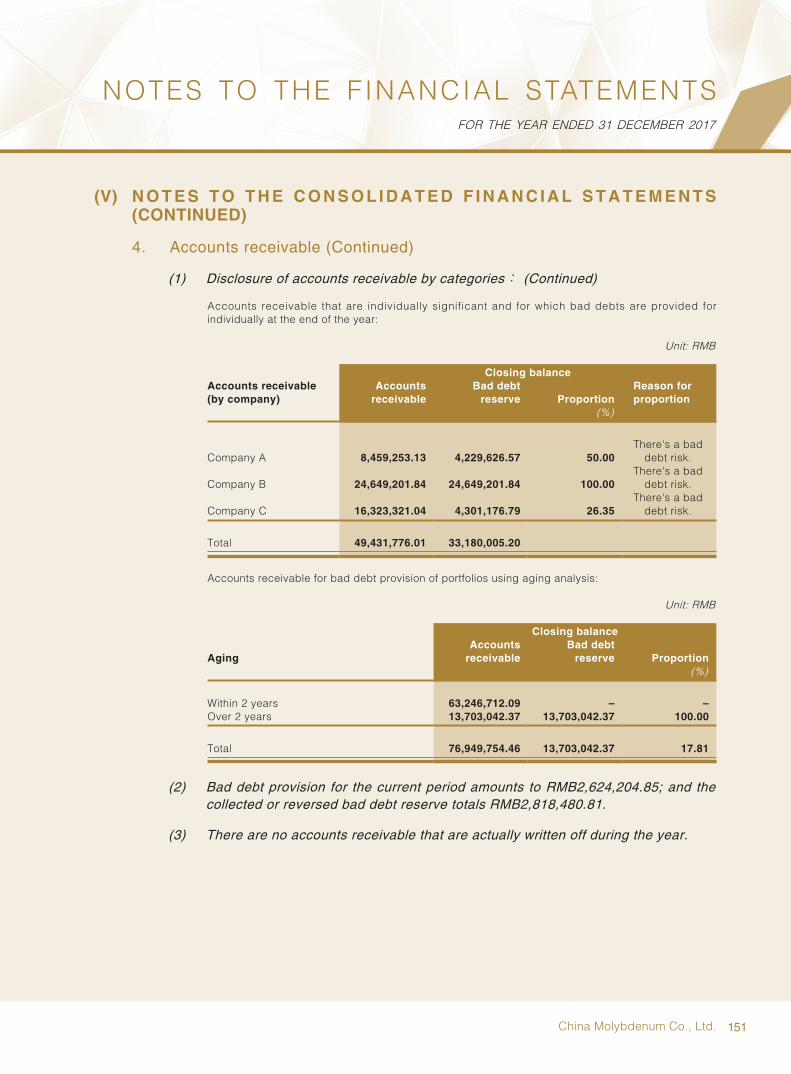
151China Molybdenum Co., Ltd.
NOTES TO THE FINANCIAL STATEMENTSFOR THE YEAR ENDED 31 DECEMBER 2017
(V) N O T E S T O T H E C O N S O L I D A T E D F I N A N C I A L S T A T E M E N T S (CONTINUED)
4. Accounts receivable (Continued)
(1) Disclosure of accounts receivable by categories: (Continued)
Accounts receivable that are individually significant and for which bad debts are provided for individually at the end of the year:
Unit: RMB
Closing balance Accounts receivable(by company)
Accounts receivable
Bad debt reserve Proportion
Reason for proportion
(%)
Company A 8,459,253.13 4,229,626.57 50.00There's a bad debt risk.
Company B 24,649,201.84 24,649,201.84 100.00There's a bad debt risk.
Company C 16,323,321.04 4,301,176.79 26.35There's a bad debt risk.
Total 49,431,776.01 33,180,005.20
Accounts receivable for bad debt provision of portfolios using aging analysis:
Unit: RMB
Closing balance
AgingAccounts
receivableBad debt
reserve Proportion(%)
Within 2 years 63,246,712.09 – –Over 2 years 13,703,042.37 13,703,042.37 100.00
Total 76,949,754.46 13,703,042.37 17.81
(2) Bad debt provision for the current period amounts to RMB2,624,204.85; and the collected or reversed bad debt reserve totals RMB2,818,480.81.
(3) There are no accounts receivable that are actually written off during the year.
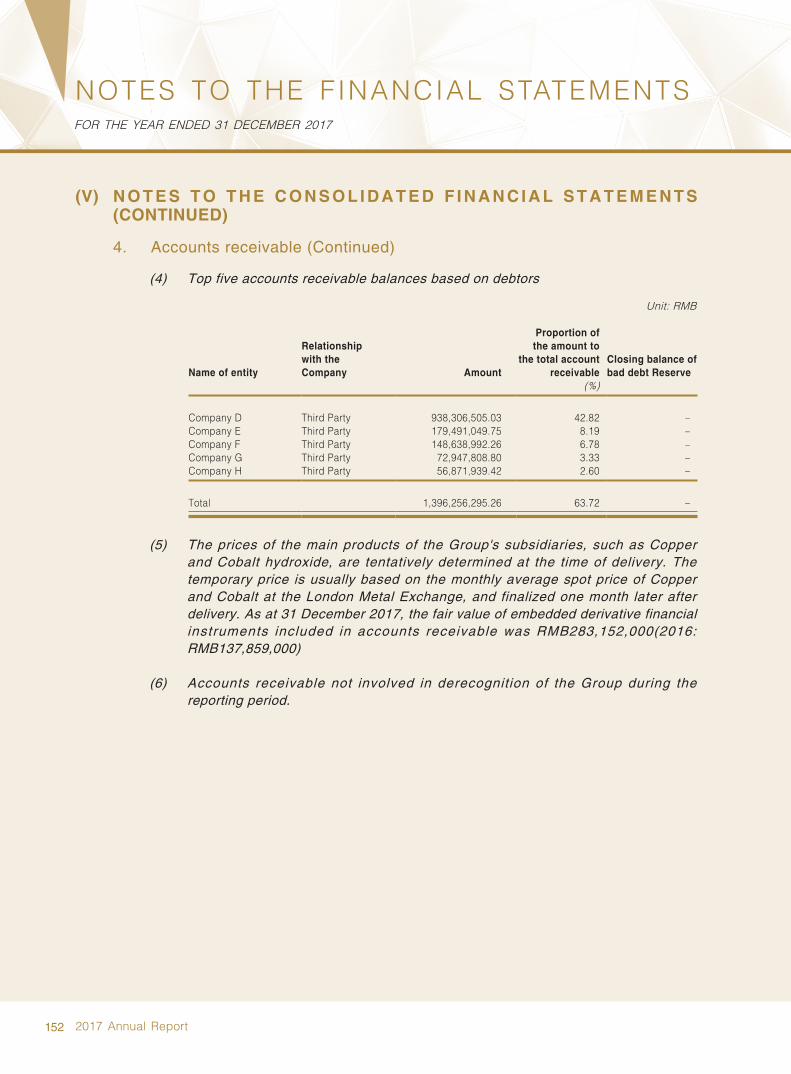
152 2017 Annual Report
NOTES TO THE FINANCIAL STATEMENTSFOR THE YEAR ENDED 31 DECEMBER 2017
(V) N O T E S T O T H E C O N S O L I D A T E D F I N A N C I A L S T A T E M E N T S (CONTINUED)
4. Accounts receivable (Continued)
(4) Top five accounts receivable balances based on debtors
Unit: RMB
Name of entity
Relationshipwith the Company Amount
Proportion of the amount to
the total account receivable
Closing balance of bad debt Reserve
(%)
Company D Third Party 938,306,505.03 42.82 –Company E Third Party 179,491,049.75 8.19 –Company F Third Party 148,638,992.26 6.78 –Company G Third Party 72,947,808.80 3.33 –Company H Third Party 56,871,939.42 2.60 –
Total 1,396,256,295.26 63.72 –
(5) The prices of the main products of the Group's subsidiaries, such as Copper and Cobalt hydroxide, are tentatively determined at the time of delivery. The temporary price is usually based on the monthly average spot price of Copper and Cobalt at the London Metal Exchange, and finalized one month later after delivery. As at 31 December 2017, the fair value of embedded derivative financial instruments included in accounts receivable was RMB283,152,000(2016: RMB137,859,000)
(6) Accounts receivable not involved in derecognition of the Group during the reporting period.
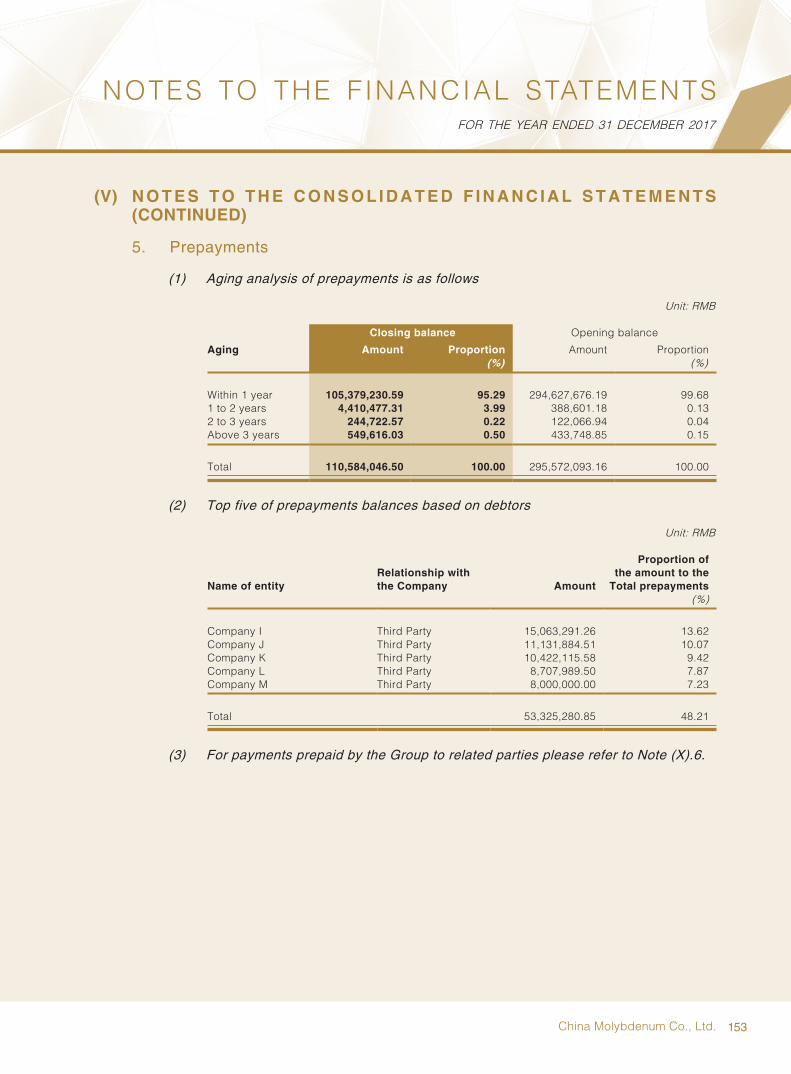
153China Molybdenum Co., Ltd.
NOTES TO THE FINANCIAL STATEMENTSFOR THE YEAR ENDED 31 DECEMBER 2017
(V) N O T E S T O T H E C O N S O L I D A T E D F I N A N C I A L S T A T E M E N T S (CONTINUED)
5. Prepayments
(1) Aging analysis of prepayments is as follows
Unit: RMB
Closing balance Opening balance
Aging Amount Proportion Amount Proportion (%) (%)
Within 1 year 105,379,230.59 95.29 294,627,676.19 99.681 to 2 years 4,410,477.31 3.99 388,601.18 0.132 to 3 years 244,722.57 0.22 122,066.94 0.04Above 3 years 549,616.03 0.50 433,748.85 0.15
Total 110,584,046.50 100.00 295,572,093.16 100.00
(2) Top five of prepayments balances based on debtors
Unit: RMB
Name of entityRelationship withthe Company Amount
Proportion of the amount to the
Total prepayments (%)
Company I Third Party 15,063,291.26 13.62Company J Third Party 11,131,884.51 10.07Company K Third Party 10,422,115.58 9.42Company L Third Party 8,707,989.50 7.87Company M Third Party 8,000,000.00 7.23
Total 53,325,280.85 48.21
(3) For payments prepaid by the Group to related parties please refer to Note (X).6.
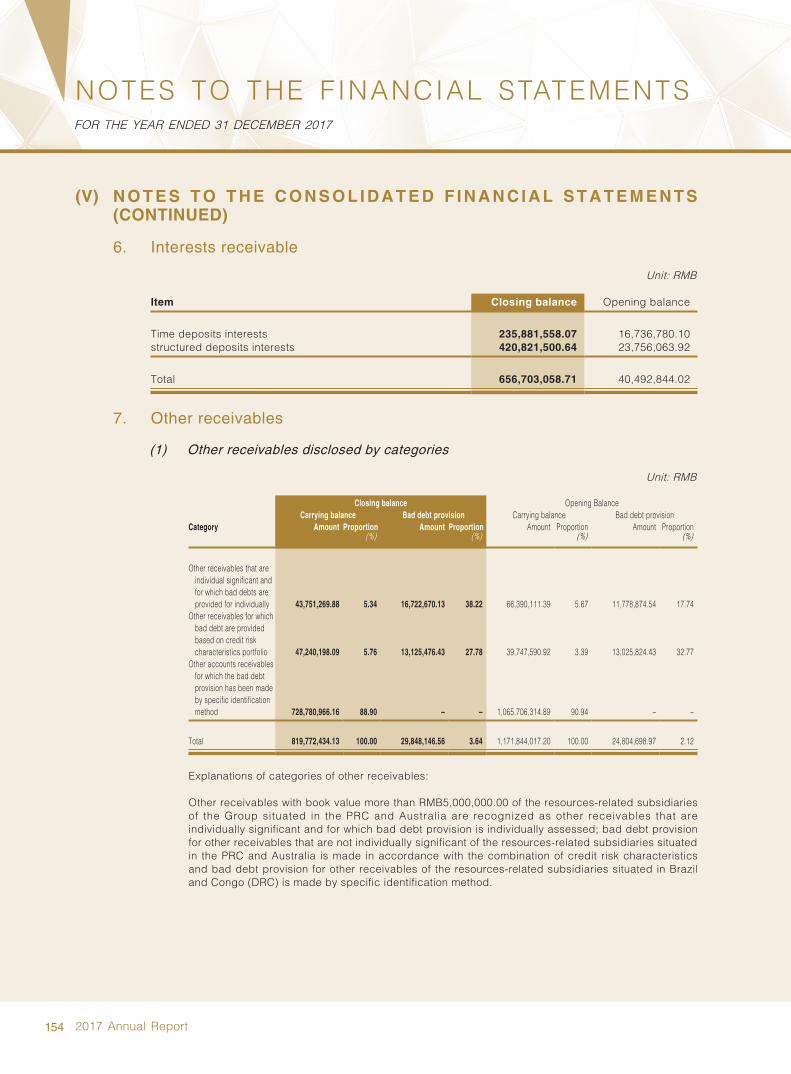
154 2017 Annual Report
NOTES TO THE FINANCIAL STATEMENTSFOR THE YEAR ENDED 31 DECEMBER 2017
(V) N O T E S T O T H E C O N S O L I D A T E D F I N A N C I A L S T A T E M E N T S (CONTINUED)
6. Interests receivable
Unit: RMB
Item Closing balance Opening balance
Time deposits interests 235,881,558.07 16,736,780.10structured deposits interests 420,821,500.64 23,756,063.92
Total 656,703,058.71 40,492,844.02
7. Other receivables
(1) Other receivables disclosed by categories
Unit: RMB
Closing balance Opening BalanceCarrying balance Bad debt provision Carrying balance Bad debt provision
Category Amount Proportion Amount Proportion Amount Proportion Amount Proportion(%) (%) (%) (%)
Other receivables that are individual significant and for which bad debts are provided for individually 43,751,269.88 5.34 16,722,670.13 38.22 66,390,111.39 5.67 11,778,874.54 17.74
Other receivables for which bad debt are provided based on credit risk characteristics portfolio 47,240,198.09 5.76 13,125,476.43 27.78 39,747,590.92 3.39 13,025,824.43 32.77
Other accounts receivables for which the bad debt provision has been made by specific identification method 728,780,966.16 88.90 – – 1,065,706,314.89 90.94 – –
Total 819,772,434.13 100.00 29,848,146.56 3.64 1,171,844,017.20 100.00 24,804,698.97 2.12
Explanations of categories of other receivables:
Other receivables with book value more than RMB5,000,000.00 of the resources-related subsidiaries of the Group situated in the PRC and Australia are recognized as other receivables that are individually significant and for which bad debt provision is individually assessed; bad debt provision for other receivables that are not individually significant of the resources-related subsidiaries situated in the PRC and Australia is made in accordance with the combination of credit risk characteristics and bad debt provision for other receivables of the resources-related subsidiaries situated in Brazil and Congo (DRC) is made by specific identification method.

155China Molybdenum Co., Ltd.
NOTES TO THE FINANCIAL STATEMENTSFOR THE YEAR ENDED 31 DECEMBER 2017
(V) N O T E S T O T H E C O N S O L I D A T E D F I N A N C I A L S T A T E M E N T S (CONTINUED)
7. Other receivables (Continued)
(1) Other receivables disclosed by categories (Continued)
Other receivables that are individually significant and for which bad debts are provided for individually at the end of the year:
Unit: RMB
Closing balance Other receivables(by companies)
Other receivables
Bad debt reserve Proportion
Reason for proportion
(%)
Company N 16,722,670.13 16,722,670.13 100.00 Bad debt risk
Other receivable for bad debt provision of portfolios using aging analysis:
Unit: RMB
Closing balance
AgingOther
receivablesBad debt
reserve Proportion(%)
Within 2 years 34,114,721.66 – –More than 2 years 13,125,476.43 13,125,476.43 100.00
Total 47,240,198.09 13,125,476.43
(2) Bad debt provision made in the year was RMB8,460,987.07; Bad debt provision recovered or reversed in the year was RMB8,910.00.
(3) Bad debt provision wri t ten off by the Group in the report ing period was RMB3,408,629.48.

156 2017 Annual Report
NOTES TO THE FINANCIAL STATEMENTSFOR THE YEAR ENDED 31 DECEMBER 2017
(V) N O T E S T O T H E C O N S O L I D A T E D F I N A N C I A L S T A T E M E N T S (CONTINUED)
7. Other receivables (Continued)
(4) Other receivables presented by nature
Unit: RMB
Nature of other receivablesClosing carrying
amountOpening carrying
amount
Deductible Brazil social contribution tax (Note 1) 172,586,071.02 105,879,431.00Congo (DRC) VAT refunds receivable (Note 2) 507,752,478.25 626,972,997.00Advanced compensation receivable – 229,788,125.00Acquisition consideration refunds receivable – 71,277,675.00Guarantee deposit 10,653,389.22 10,657,151.79Refund of land-transferring fee receivable 6,200,000.00 7,000,000.00Advanced transition bonus receivable (Note 3) 15,763,077.94 –Others 106,817,417.70 120,268,637.41
Total 819,772,434.13 1,171,844,017.20
Note 1: See Note V. 18 Note 5 for details.
Note 2: The VAT refundable amount is generated from the export business of subsidiaries situated in the DRC. The entity has applied for tax refund from the government and is expected to receive the tax refund within one year.
Note 3: It is the bonuses for the management personnel in the transition period, paid by the Company on behalf of Freeport according to the agreement in acquisition of Congo (DRC) copper-cobalt business, which is expected to be collected within 1 year.

157China Molybdenum Co., Ltd.
NOTES TO THE FINANCIAL STATEMENTSFOR THE YEAR ENDED 31 DECEMBER 2017
(V) N O T E S T O T H E C O N S O L I D A T E D F I N A N C I A L S T A T E M E N T S (CONTINUED)
7. Other receivables (Continued)
(5) Top five other receivables balances based on debtors
Unit: RMB
Name of entity
Relationshipwith the Company Amount Aging
Proportion of the amount to the total other
receivablesClosing balance of
bad debt provision(%)
Tax refund from DRC government
local tax authorities
507,752,478.25 Within 2 years 61.94 –
Federal government of Brazil
Third Party 172,586,071.02 Within 2 years 21.05 –
Company N Third Party 16,722,670.13 More than 2 years
2.04 16,722,670.13
Freeport Third Party 15,763,077.94 Within 2 years 1.92 –Individual O Third Party 10,175,210.53 More than
2 years1.24 –
Total 722,999,507.87 88.19 –
(6) There are no other receivables concerning government grants in current period during the reporting time.
(7) Details of other receivables due from related parties refer to Note (X).6.
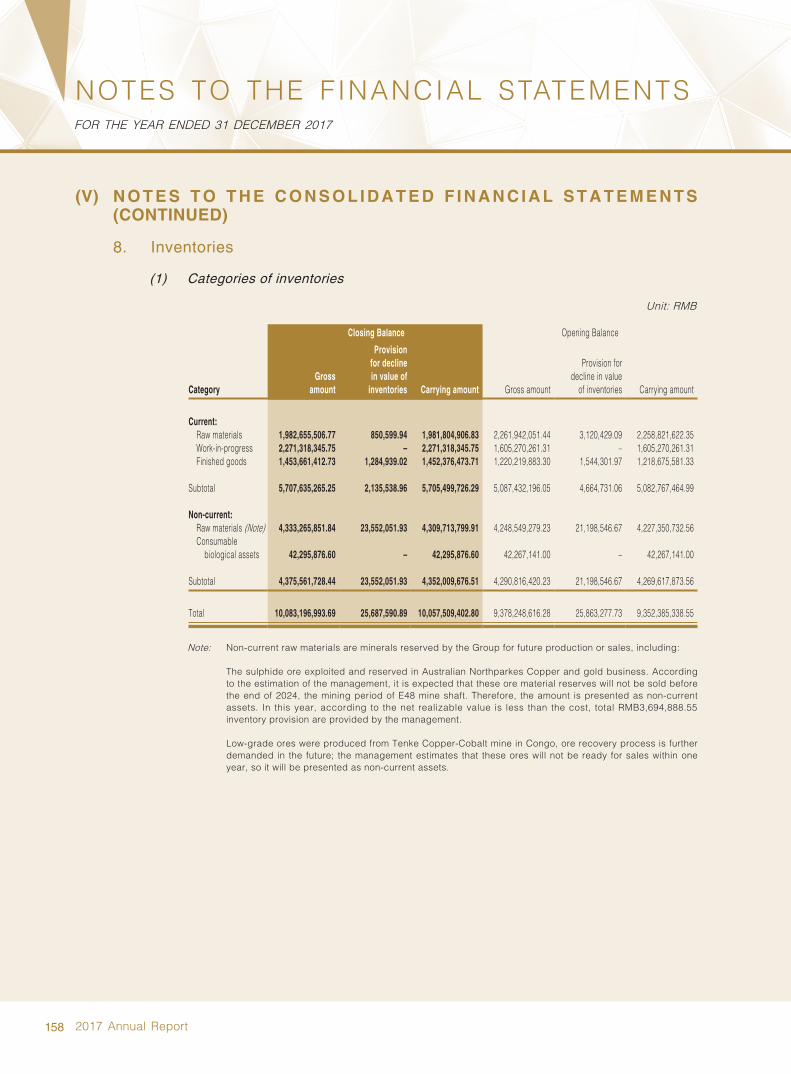
158 2017 Annual Report
NOTES TO THE FINANCIAL STATEMENTSFOR THE YEAR ENDED 31 DECEMBER 2017
(V) N O T E S T O T H E C O N S O L I D A T E D F I N A N C I A L S T A T E M E N T S (CONTINUED)
8. Inventories
(1) Categories of inventories
Unit: RMB
Closing Balance Opening Balance
CategoryGross
amount
Provision for decline in value of
inventories Carrying amount Gross amount
Provision for decline in value
of inventories Carrying amount
Current:Raw materials 1,982,655,506.77 850,599.94 1,981,804,906.83 2,261,942,051.44 3,120,429.09 2,258,821,622.35Work-in-progress 2,271,318,345.75 – 2,271,318,345.75 1,605,270,261.31 – 1,605,270,261.31Finished goods 1,453,661,412.73 1,284,939.02 1,452,376,473.71 1,220,219,883.30 1,544,301.97 1,218,675,581.33
Subtotal 5,707,635,265.25 2,135,538.96 5,705,499,726.29 5,087,432,196.05 4,664,731.06 5,082,767,464.99
Non-current:Raw materials (Note) 4,333,265,851.84 23,552,051.93 4,309,713,799.91 4,248,549,279.23 21,198,546.67 4,227,350,732.56Consumable
biological assets 42,295,876.60 – 42,295,876.60 42,267,141.00 – 42,267,141.00
Subtotal 4,375,561,728.44 23,552,051.93 4,352,009,676.51 4,290,816,420.23 21,198,546.67 4,269,617,873.56
Total 10,083,196,993.69 25,687,590.89 10,057,509,402.80 9,378,248,616.28 25,863,277.73 9,352,385,338.55
Note: Non-current raw materials are minerals reserved by the Group for future production or sales, including:
The sulphide ore exploited and reserved in Australian Northparkes Copper and gold business. According to the estimation of the management, it is expected that these ore material reserves will not be sold before the end of 2024, the mining period of E48 mine shaft. Therefore, the amount is presented as non-current assets. In this year, according to the net realizable value is less than the cost, total RMB3,694,888.55 inventory provision are provided by the management.
Low-grade ores were produced from Tenke Copper-Cobalt mine in Congo, ore recovery process is further demanded in the future; the management estimates that these ores will not be ready for sales within one year, so it will be presented as non-current assets.
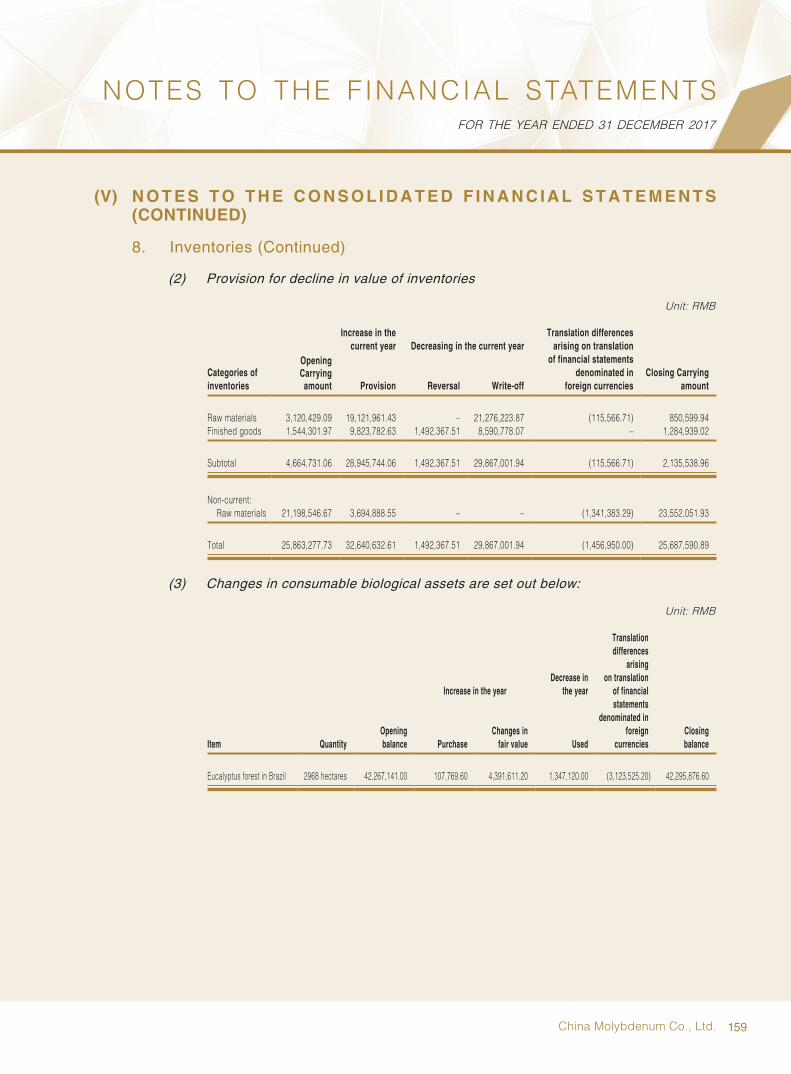
159China Molybdenum Co., Ltd.
NOTES TO THE FINANCIAL STATEMENTSFOR THE YEAR ENDED 31 DECEMBER 2017
(V) N O T E S T O T H E C O N S O L I D A T E D F I N A N C I A L S T A T E M E N T S (CONTINUED)
8. Inventories (Continued)
(2) Provision for decline in value of inventories
Unit: RMB
Increase in the current year Decreasing in the current year
Translation differences arising on translation
of financial statements denominated in
foreign currenciesCategories of inventories
Opening Carrying
amount Provision Reversal Write-offClosing Carrying
amount
Raw materials 3,120,429.09 19,121,961.43 – 21,276,223.87 (115,566.71) 850,599.94Finished goods 1,544,301.97 9,823,782.63 1,492,367.51 8,590,778.07 – 1,284,939.02
Subtotal 4,664,731.06 28,945,744.06 1,492,367.51 29,867,001.94 (115,566.71) 2,135,538.96
Non-current:Raw materials 21,198,546.67 3,694,888.55 – – (1,341,383.29) 23,552,051.93
Total 25,863,277.73 32,640,632.61 1,492,367.51 29,867,001.94 (1,456,950.00) 25,687,590.89
(3) Changes in consumable biological assets are set out below:
Unit: RMB
Item QuantityOpening balance
Increase in the yearDecrease in
the year
Translation differences
arising on translation
of financial statements
denominated in foreign
currenciesClosing balancePurchase
Changes in fair value Used
Eucalyptus forest in Brazil 2968 hectares 42,267,141.00 107,769.60 4,391,611.20 1,347,120.00 (3,123,525.20) 42,295,876.60

160 2017 Annual Report
NOTES TO THE FINANCIAL STATEMENTSFOR THE YEAR ENDED 31 DECEMBER 2017
(V) N O T E S T O T H E C O N S O L I D A T E D F I N A N C I A L S T A T E M E N T S (CONTINUED)
9. Other current assets
Unit: RMB
Item Closing balance Opening balance
Wealth management products of banks – 204,522,623.32Other wealth management products by non-banking financial
institutions (Note 1) 801,402,575.34 101,480,430.14Loan receivables from third party (Note 2) 199,165,000.00 190,000,000.00Prepayment of enterprise income tax 42,079,191.88 37,903,768.00Prepayment of VAT 96,563,472.34 99,657,756.82Amount receivable from Société Nationale d’Electricité
(Note 3) 97,382,258.05 110,215,056.00Accounts receivable from TFM minority shareholders (Note 4) 109,488,939.47 –Others 35,922,684.77 54,812,921.48
Total 1,382,004,121.85 798,592,555.76
Note 1: Wealth management plans products by non-banking financial institutions purchased by the Group with principle protected and due within one year, the yields are between 5.24% and 6.50%. The management of the group considers that the difference between the fair value of the Company’s interests in and risk exposures to these wealth management products as compared to their book value is not significant and account in accordance with available for sale debt instruments.
Note 2: It is the Group's pledged loan due from a third party. The loan period is 1 year and the agreed interest rate refers to loan interest rates for the same period issued by the People's Bank of China. The loan is pledged with the equity held by the third party in unlisted company.
Note 3: The amount receivable is due from Société Nationale d’Electricité (hereinafter referred to as "SNEL") which is provided by the subsidiary of the Group in DRC. According to the agreement, the amount will be settled by electricity bill when the company actually uses electricity. The current part is the portion expected to be settled in the next year. For the non-current part see Note (V) 18.
Note 4: It is Congo (DRC) subsidiary's accounts receivable from Gécamines. According to the agreement, the current portion is the Company's deductible consulting fees due to Gécamines within 1 year. Refer to Note (V), 18 for details of the non-current portion.

161China Molybdenum Co., Ltd.
NOTES TO THE FINANCIAL STATEMENTSFOR THE YEAR ENDED 31 DECEMBER 2017
(V) N O T E S T O T H E C O N S O L I D A T E D F I N A N C I A L S T A T E M E N T S (CONTINUED)
10. Available-for-sale financial assets
(1) Details of available-for-sale financial assets
Unit: RMB
Closing balance Opening balance
Item Gross balanceProvision for
impairment Carrying value Gross balanceProvision for
impairment Carrying value
Available-for-sale equity 3,246,899,715.97 – 3,246,899,715.97 3,000,602,505.46 – 3,000,602,505.46Measured at fair value 2,826,030,474.37 – 2,826,030,474.37 2,028,482,040.50 – 2,028,482,040.50Measured at cost 420,869,241.60 – 420,869,241.60 972,120,464.96 – 972,120,464.96
Total 3,246,899,715.97 – 3,246,899,715.97 3,000,602,505.46 – 3,000,602,505.46
(2) Available-for-sale financial assets measured at fair value
Unit: RMB
Available-for-sale Financial Assets
Target Asset Management Plans
P Fund shares
Q Fund shares
R Company Equity
S Partnership shares
T Partnership shares Total
(Note 1) (Note 2) (Note 2) (Note 3) (Note4) (Note4)
Cost of equity instruments 1,763,468,867.81 60,204,417.36 48,839,700.00 100,000,000.00 420,000,000.00 460,204,882.00 2,852,717,867.17Fair value 1,426,813,661.30 65,468,257.53 45,640,686.00 100,000,000.00 594,963,447.89 593,144,421.65 2,826,030,474.37Changes of fair value
included in other comprehensive income 52,716,841.42 8,046,992.31 – – 174,963,447.89 132,939,539.65 368,666,821.27
Exchange differences arising on translation of financial statements denominated in foreign currencies accumulated in other comprehensive income (98,222,251.71) (2,783,152.14) (3,199,014.00) – – – (104,204,417.85)
Amount of provision for impairment 291,149,796.22 – – – – – 291,149,796.22
Note 1: The target asset management plans are invested by the Group. At the end of the period, the assets management plan is measured based on fair value.
Note 2: Fund shares are held by the Group on a long-term basis. The Group has no control, joint control and significant impact on the relevant investment entities.
Note 3: Equity shares of listed companies is the shareholding in the publicly traded market measured subsequently at fair value by the Group.
Note 4: Partnership shares are the investments in partnerships of the Group measured subsequently at fair value by the Group.

162 2017 Annual Report
NOTES TO THE FINANCIAL STATEMENTSFOR THE YEAR ENDED 31 DECEMBER 2017
(V) N O T E S T O T H E C O N S O L I D A T E D F I N A N C I A L S T A T E M E N T S (CONTINUED)
10. Available-for-sale financial assets (Continued)
(3) Available-for-sale financial assets measured as a cost
Unit: RMB
Carrying amount Provision for impairment
Unit Under Investment
Beginning of
the current period
Increase in
the current period
Decrease in
the current period
Exchange
differences arising
on translation
of financial
statements
denominated in
foreign currenciesAt the end of
the current period
Beginning of the
current periodIncrease in the current period
Decrease in the current period
At the end of the current
period
Proportion ofshareholding in
the investeeCash dividends
of the period (%)
I I nvestments in unlisted companies (Note 1)
equity U 400,000,000.00 – – – 400,000,000.00 – – – – 5.30% –equity V 8,884,694.96 4,747,697.45 – (592,196.41) 13,040,196.00 – – – – 3.44% –equity W 4,186,260.00 3,920,520.00 – (282,662.40) 7,824,117.60 – – – – 2.31% –
Subtotal 413,070,954.96 8,668,217.45 – (874,858.81) 420,864,313.60 – – – – – –
II I nvestments in partnership companies (Note 2)
E quity investment of partnership entity X (Note 3) 50,000,000.00 – (50,000,000.00) – – – – – – N/A –
E quity investment of partnership entity T (Note 4) 460,204,882.00 – (460,204,882.00) – – – – – – N/A –
E quity investment of partnership
entity Q (Note 4) 48,839,700.00 – (48,839,700.00) – – – – – – N/A –
Total 559,044,582.00 – (559,044,582.00) – – – – – – –
Others 4,928.00 – – – 4,928.00 – – – – – –
Total 972,120,464.96 8,668,217.45 (559,044,582.00) (874,858.81) 420,869,241.60 – – – – – –
Note 1: Equity of unlisted companies invested by the Group; the Group does not control, hold under common control or have significant influence on relevant investees. For investments in equity instruments that do not have a quoted market price in an active market and whose fair value cannot be reliably measured, thus they shall be measured at cost.
Note 2: Equity of limited liability partnership companies invested by the Group, according to the agreements, the group participate the business as a limited partner. The Group does not control, hold under common control or have significant influence on relevant investees. At the end of the period, for investments in equity instruments that do not have a quoted market price in an active market and whose fair value cannot be reliably measured, thus they are measured at cost.
Note 3: It refers to the recovery of investment through disposal in the year.
Note 4: In 2017, due to the fair value of the relevant investment can be reliably measured, it was classified into the available-for-sale financial assets measured at fair value.

163China Molybdenum Co., Ltd.
NOTES TO THE FINANCIAL STATEMENTSFOR THE YEAR ENDED 31 DECEMBER 2017
(V) N O T E S T O T H E C O N S O L I D A T E D F I N A N C I A L S T A T E M E N T S (CONTINUED)
11. Long-term equity investments
Unit: RMB
Unit under investment balance Notes Opening balance
Changes increase/(decrease)
Additional investment
Decreased investment
Investmentincome
determinedunder
Equity method
Adjustment To other
comprehensiveincome
Other Changes in equities
Declared cash dividends Profits
Provision for impairment
losses Other Closing balance
Closing balance of provision for
impairment
I. Joint venturesLuoyang High Tech Molybdenum
& Tungsten Materials Co., Ltd. (“High-Tech”) Note 1 88,762,283.32 – – (11,666,790.31) – – – – – 77,095,493.01 –
Xuzhou Huanyu Molybdenum Co., Ltd. (“Huan Yu”) Note 2 1,031,793,428.90 – – (66,196,366.88) – – – – – 965,597,062.02 –
Subtotal 1,120,555,712.22 – – (77,863,157.19) – – – – – 1,042,692,555.03 –
II. AssociatesLuoyang Yulu Mining Co., Ltd.
(“Yulu Mining”) Note 3 69,629,450.40 – – 108,165,269.84 – – (85,300,000.00) – – 92,494,720.24 –Caly Nanomoly Development,
Inc. (“Nanomoly Development”) Note 4 – – – – – – – – – – –Luoyang Shenyu Molybdenum
Co., Ltd ("Luoyang Shenyu") Note 5 1,314,112.19 – – (128,535.22) – – – – – 1,185,576.97 –
Subtotal 70,943,562.59 – – 108,036,734.62 – – (85,300,000.00) – – 93,680,297.21 –
Total 1,191,499,274.81 – – 30,173,577.43 – – (85,300,000.00) – – 1,136,372,852.24 –
Note 1: The Company holds 50.25% equity in “High-Tech” and continues to control “High-Tech” with another shareholder according to the Articles of Association.
Note 2: Huan Yu, a joint venture of the Group, holds 90% of stake in Luoyang Fuchuan Mining Co., Ltd. (“Fuchuan”). Meanwhile, the Group holds indirectly by its subsidiary, Fu Kai, 10% of stake in Fuchuan. Therefore, the Group holds directly and indirectly by Huanyu 55% of stake in Fuchuan in total.
According to the agreement with local government, the local government is entitled to 8% of the dividend rights of Fuchuan. Thus, according to equity method, the Group actually holds 47% of the profit or loss of Fuchuan.
Note 3: According to the result of Yulu Mining’s 2007 annual general meeting, both investors would share the net profit at the ratio of 1:1 since year 2008. Therefore, the Group holds 40% equity interest in Yulu Mining but recognizes investment income of 50% out of its net profit.
Note 4: The Group holds 40% of Nanomoly Development’s equity and accounts investment therein based on equity method. In accordance with Articles of Association of Nanomoly Development, the Group do not assume any additional liabilities for additional loss. Up the end of the current period, the Group has decreased its investment in Nanomoly Development to zero.
Note 5: On 7 April 2016, the Company entered into a collaboration agreement with a third party, and the Company invested RMB1.5 million by way of intangible assets and the counterparty invested RMB8.5 million of cash to establish Luoyang Shenyu. Meanwhile, the Company appointed a director and a supervisor to Luoyang Shenyu.
There is no significant limits exist regarding cash transfer and investment income repatriation from these associates.
The entities invested by the Group are all unlisted entities.
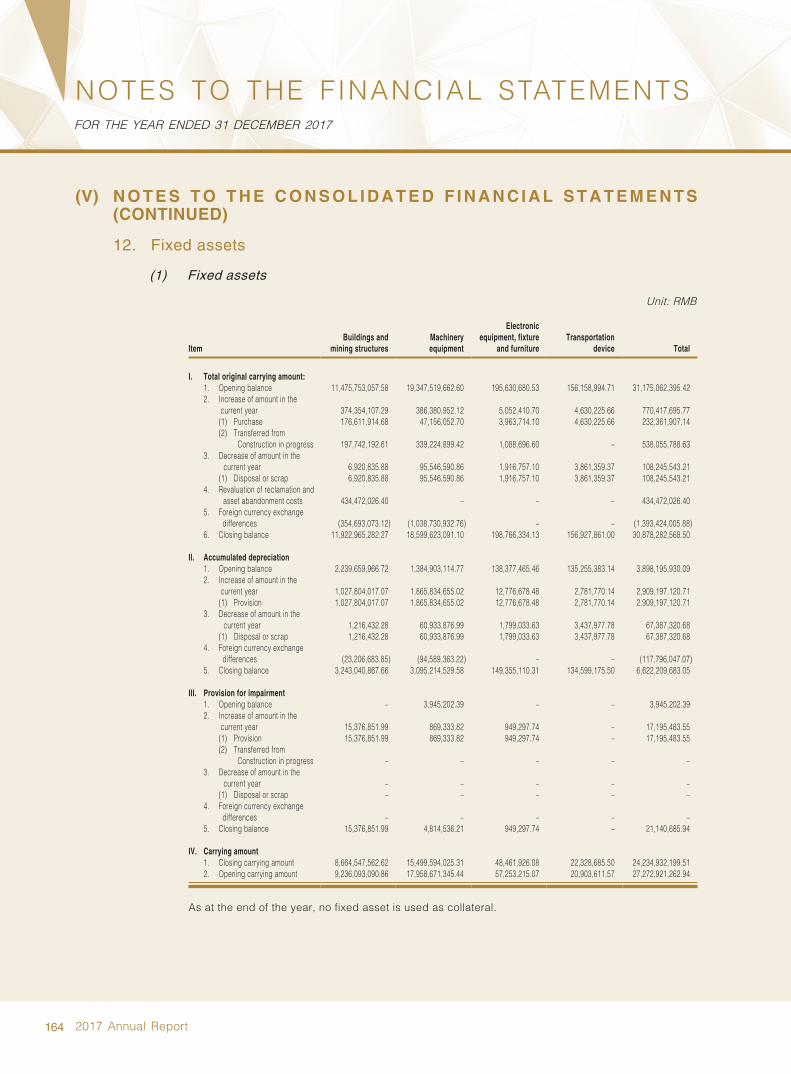
164 2017 Annual Report
NOTES TO THE FINANCIAL STATEMENTSFOR THE YEAR ENDED 31 DECEMBER 2017
(V) N O T E S T O T H E C O N S O L I D A T E D F I N A N C I A L S T A T E M E N T S (CONTINUED)
12. Fixed assets
(1) Fixed assets
Unit: RMB
ItemBuildings and
mining structuresMachinery equipment
Electronic equipment, fixture
and furnitureTransportation
device Total
I. Total original carrying amount:1. Opening balance 11,475,753,057.58 19,347,519,662.60 195,630,680.53 156,158,994.71 31,175,062,395.422. I ncrease of amount in the
current year 374,354,107.29 386,380,952.12 5,052,410.70 4,630,225.66 770,417,695.77(1) Purchase 176,611,914.68 47,156,052.70 3,963,714.10 4,630,225.66 232,361,907.14(2) T ransferred from
Construction in progress 197,742,192.61 339,224,899.42 1,088,696.60 – 538,055,788.633. D ecrease of amount in the
current year 6,920,835.88 95,546,590.86 1,916,757.10 3,861,359.37 108,245,543.21(1) Disposal or scrap 6,920,835.88 95,546,590.86 1,916,757.10 3,861,359.37 108,245,543.21
4. R evaluation of reclamation and asset abandonment costs 434,472,026.40 – – – 434,472,026.40
5. F oreign currency exchange differences (354,693,073.12) (1,038,730,932.76) – – (1,393,424,005.88)
6. Closing balance 11,922,965,282.27 18,599,623,091.10 198,766,334.13 156,927,861.00 30,878,282,568.50
II. Accumulated depreciation1. Opening balance 2,239,659,966.72 1,384,903,114.77 138,377,465.46 135,255,383.14 3,898,195,930.092. I ncrease of amount in the
current year 1,027,804,017.07 1,865,834,655.02 12,776,678.48 2,781,770.14 2,909,197,120.71(1) Provision 1,027,804,017.07 1,865,834,655.02 12,776,678.48 2,781,770.14 2,909,197,120.71
3. D ecrease of amount in the current year 1,216,432.28 60,933,876.99 1,799,033.63 3,437,977.78 67,387,320.68
(1) Disposal or scrap 1,216,432.28 60,933,876.99 1,799,033.63 3,437,977.78 67,387,320.684. F oreign currency exchange
differences (23,206,683.85) (94,589,363.22) – – (117,796,047.07)5. Closing balance 3,243,040,867.66 3,095,214,529.58 149,355,110.31 134,599,175.50 6,622,209,683.05
III. Provision for impairment1. Opening balance – 3,945,202.39 – – 3,945,202.392. I ncrease of amount in the
current year 15,376,851.99 869,333.82 949,297.74 – 17,195,483.55(1) Provision 15,376,851.99 869,333.82 949,297.74 – 17,195,483.55(2) T ransferred from
Construction in progress – – – – –3. D ecrease of amount in the
current year – – – – –(1) Disposal or scrap – – – – –
4. F oreign currency exchange differences – – – – –
5. Closing balance 15,376,851.99 4,814,536.21 949,297.74 – 21,140,685.94
IV. Carrying amount1. Closing carrying amount 8,664,547,562.62 15,499,594,025.31 48,461,926.08 22,328,685.50 24,234,932,199.512. Opening carrying amount 9,236,093,090.86 17,958,671,345.44 57,253,215.07 20,903,611.57 27,272,921,262.94
As at the end of the year, no fixed asset is used as collateral.
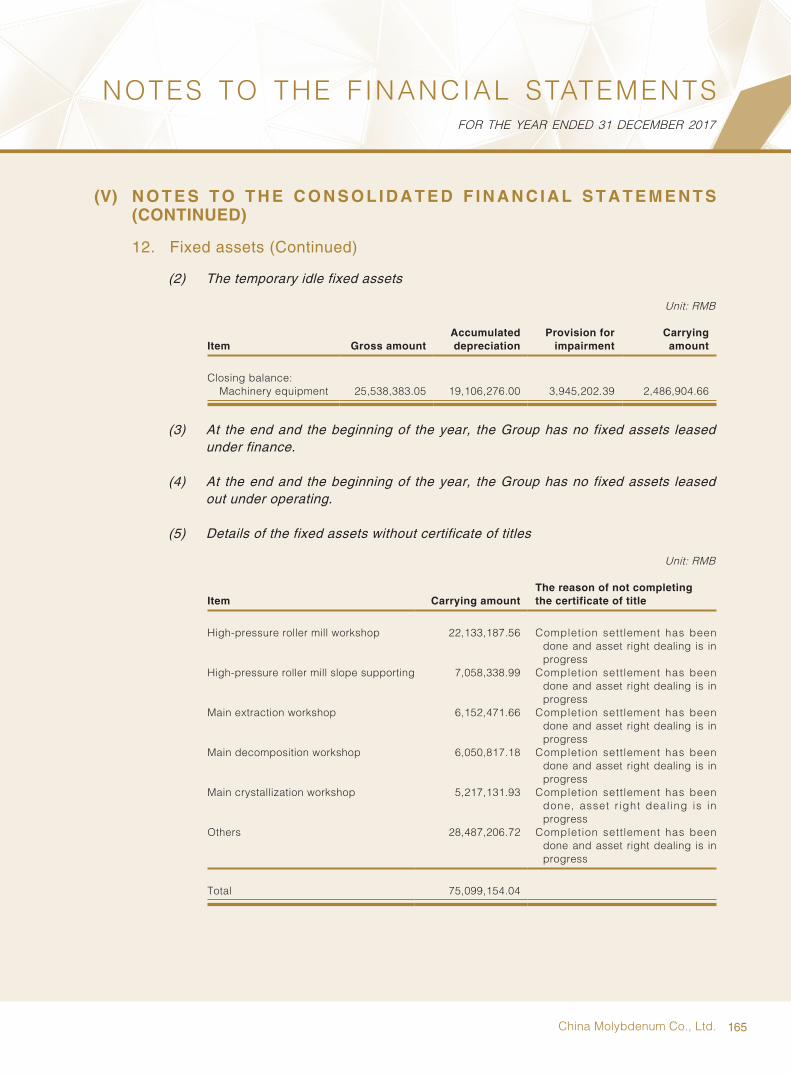
165China Molybdenum Co., Ltd.
NOTES TO THE FINANCIAL STATEMENTSFOR THE YEAR ENDED 31 DECEMBER 2017
(V) N O T E S T O T H E C O N S O L I D A T E D F I N A N C I A L S T A T E M E N T S (CONTINUED)
12. Fixed assets (Continued)
(2) The temporary idle fixed assets
Unit: RMB
Item Gross amountAccumulated depreciation
Provision for impairment
Carrying amount
Closing balance: Machinery equipment 25,538,383.05 19,106,276.00 3,945,202.39 2,486,904.66
(3) At the end and the beginning of the year, the Group has no fixed assets leased under finance.
(4) At the end and the beginning of the year, the Group has no fixed assets leased out under operating.
(5) Details of the fixed assets without certificate of titles
Unit: RMB
Item Carrying amountThe reason of not completingthe certificate of title
High-pressure roller mill workshop 22,133,187.56 Completion settlement has been done and asset right dealing is in progress
High-pressure roller mill slope supporting 7,058,338.99 Completion settlement has been done and asset right dealing is in progress
Main extraction workshop 6,152,471.66 Completion settlement has been done and asset right dealing is in progress
Main decomposition workshop 6,050,817.18 Completion settlement has been done and asset right dealing is in progress
Main crystallization workshop 5,217,131.93 Completion settlement has been done, asset r ight deal ing is in progress
Others 28,487,206.72 Completion settlement has been done and asset right dealing is in progress
Total 75,099,154.04

166 2017 Annual Report
NOTES TO THE FINANCIAL STATEMENTSFOR THE YEAR ENDED 31 DECEMBER 2017
(V) N O T E S T O T H E C O N S O L I D A T E D F I N A N C I A L S T A T E M E N T S (CONTINUED)
13. Construction in progress
(1) Construction in progress status:
Unit: RMB
Closing balance Opening balance
Item Gross amountProvision for
impairment Net carrying amount Gross amountProvision for impairment Net carrying amount
Plant Tailings dam project of No.2 Ore 14,510,310.14 – 14,510,310.14 6,903,929.90 – 6,903,929.90
Tailings dam project of No. 3 Ore Processing 2,106,044.54 – 2,106,044.54 275,257.82 – 275,257.82
Gutterway tailing pond replacement project – – – 14,250,735.63 – 14,250,735.63
Crushing system improvement project of No.3 dressing company – – – 886,178.00 – 886,178.00
Eolybdenum mine project in East Gobi of Hami of Xinjiang 75,271,439.43 – 75,271,439.43 75,033,439.43 – 75,033,439.43
Northparkes E48 mine northern extension project 12,626,736.56 – 12,626,736.56 6,715,822.15 – 6,715,822.15
Northparkes E26 underground mine development project 3,417,140.20 – 3,417,140.20 1,352,888.01 – 1,352,888.01
Niobras tailing dam heightening project 110,800,530.69 – 110,800,530.69 76,295,900.80 – 76,295,900.80
Copebras phosphorus production plant maintenance project 73,017,888.03 – 73,017,888.03 – – –
Copebras phosphorus production process improvement projects 22,274,018.02 – 22,274,018.02 – – –
Niobras niobium production plant maintenance project 18,370,832.93 – 18,370,832.93 – –
–TFM filtering equipment upgrading project 41,093,687.76 – 41,093,687.76 2,902,178.30 – 2,902,178.30
TFM dehydration equipment installation project 21,076,352.55 – 21,076,352.55 – – –
TFM mining equipment purchase project 66,068,776.85 – 66,068,776.85 – – –
TFM No. 2 cobalt dryer improvement project 52,256,271.43 – 52,256,271.43 – – –
TFM mining zone railway construction project 21,502,258.69 – 21,502,258.69 7,806,500.51 – 7,806,500.51
TFM mining zone transportation road construction projects 23,358,695.94 – 23,358,695.94 – – –
TFM production process modeling and evaluation project 29,905,873.38 – 29,905,873.38 – – –
TFM IT system change project 25,039,150.78 – 25,039,150.78 – – –Others 337,415,231.86 – 337,415,231.86 502,936,205.86 – 502,936,205.86
Total 950,111,239.78 – 950,111,239.78 695,359,036.41 – 695,359,036.41

167China Molybdenum Co., Ltd.
NOTES TO THE FINANCIAL STATEMENTSFOR THE YEAR ENDED 31 DECEMBER 2017
(V) N O T E S T O T H E C O N S O L I D A T E D F I N A N C I A L S T A T E M E N T S (CONTINUED)
13. Construction in progress (Continued)
(2) Significant change in construction in progress:
Unit: RMB
Name of project BudgetOpening balance
Increase in the current year
Transfer to fixed assets
Other decreases
Foreign currency exchange
differencesClosing balance
Amount incurred as a proportion of
budget amount
Accumulated capitalized
interest
Including:interest
capitalizationfor the year
Source of fund
(%)
Tailings dam project of No. 2 Ore Processing Plant 343,886,000.00 6,903,929.90 7,606,380.24 – – – 14,510,310.14 49 – –
Funds in hand
Tailings dam project of No. 3 Ore Processing Plant 50,000,000.00 275,257.82 1,830,786.72 – – – 2,106,044.54 84 – –
Funds in hand
Gutterway tailing pond replacement project 130,000,000.00 14,250,735.63 868,472.72 – 15,119,208.35 – – 100 – –
Funds in hand
Crushing system improvement project of No.3 dressing company 54,860,000.00 886,178.00 60,500,355.37 61,386,533.37 – – – 112 – –
Funds in hand
Eolybdenum mine project in East Gobi 2,849,000,000.00 75,033,439.43 238,000.00 – – – 75,271,439.43 3 – –
Funds in hand
Northparkes E48 mine northern extension project 174,399,159.01 6,715,822.15 19,744,636.47 13,578,665.29 – (255,056.77) 12,626,736.56 100 – –
Funds in hand
Northparkes E26 underground mine development project 173,153,515.39 1,352,888.01 4,996,687.86 2,854,131.22 – (78,304.45) 3,417,140.20 84 – –
Funds in hand
Niobras tailing dam heightening project 151,826,928.01 76,295,900.80 49,430,480.30 9,295,629.73 – (5,630,220.68) 110,800,530.69 79 – –
Funds in hand
Copebras phosphorus production plant maintenance project 78,229,844.18 – 77,007,683.79 34,625.16 – (3,955,170.60) 73,017,888.03 95 – –
Funds in hand
Copebras phosphorus production process improvement projects 22,443,031.70 – 23,542,128.21 – – (1,268,110.19) 22,274,018.02 102 – –
Funds in hand
Niobras niobium production plant maintenance project 20,197,046.43 – 19,079,164.04 – – (708,331.11) 18,370,832.93 92 – –
Funds in hand
TFM filtering equipment upgrading project 57,995,455.19 2,902,178.30 39,542,375.40 – – (1,350,865.94) 41,093,687.76 71 – –
Funds in hand
TFM dehydration equipment installation project 49,071,842.00 – 21,725,977.20 – – (649,624.65) 21,076,352.55 43 – –
Funds in hand
TFM mining equipment purchase project 70,692,777.97 – 68,105,177.89 – – (2,036,401.04) 66,068,776.85 93 – –
Funds in hand
TFM No. 2 cobalt dryer improvement project 457,394,000.00 – 53,866,937.32 – – (1,610,665.89) 52,256,271.43 11 – –
Funds in hand
TFM mining zone railway construction project 39,530,929.87 7,806,500.51 14,585,154.27 – – (889,396.09) 21,502,258.69 101 – –
Funds in hand
TFM mining zone transportation road construction projects 235,231,200.00 – 24,078,667.99 – – (719,972.05) 23,358,695.94 10 – –
Funds in hand
TFM production process optimization study 980,130,000.00 – 30,827,645.43 – – (921,772.05) 29,905,873.38 3 – –
Funds in hand
TFM IT system change project 32,671,000.00 – 25,810,918.55 – – (771,767.77) 25,039,150.78 77 – –
Funds in hand
Others N/A 502,936,205.86 308,378,961.64 450,906,203.86 1,027,521.51 (21,966,210.27) 337,415,231.86 N/A – –Funds in hand
Total 695,359,036.41 851,766,591.41 538,055,788.63 16,146,729.86 (42,811,869.55) 950,111,239.78 – –
No impairment losses have been provided for construction in progress as at 31 December 2017, as there is no indicator that construction in progress maybe impaired.

168 2017 Annual Report
NOTES TO THE FINANCIAL STATEMENTSFOR THE YEAR ENDED 31 DECEMBER 2017
(V) N O T E S T O T H E C O N S O L I D A T E D F I N A N C I A L S T A T E M E N T S (CONTINUED)
14. Intangible assets
Details of intangible assets
Unit: RMB
Item Land use rights Mining rights Others Total
I. Total original carrying amount:1. Opening balance 521,573,507.84 24,937,893,502.56 42,589,682.21 25,502,056,692.612. Increase for the current year 10,406,831.55 12,427,182.00 16,635,671.45 39,469,685.00
(1) Purchase 10,406,831.55 12,427,182.00 16,635,671.45 39,469,685.003. Decrease for the current year – 2,445,022.80 7,745,940.00 10,190,962.80
(1) Disposal – 2,445,022.80 7,745,940.00 10,190,962.804. F oreign currency exchange
differences – (1,364,057,635.31) (2,012,912.20) (1,366,070,547.51)5. Closing balance 531,980,339.39 23,583,818,026.45 49,466,501.46 24,165,264,867.30
II. Accumulated depreciation1. Opening balance 85,144,718.16 902,974,105.74 12,623,884.24 1,000,742,708.142. Increase for the current year 11,957,549.66 1,699,967,717.16 9,517,910.92 1,721,443,177.74
(1) Provision 11,957,549.66 1,699,967,717.16 9,517,910.92 1,721,443,177.743. Decrease for the current year – 828,478.80 5,738,731.20 6,567,210.00
(1) Disposal or scrap – 828,478.80 5,738,731.20 6,567,210.004. F oreign currency exchange
differences – (86,172,801.57) (362,746.99) (86,535,548.56)5. Closing balance 97,102,267.82 2,515,940,542.53 16,040,316.97 2,629,083,127.32
III. Provision for impairment1. Opening balance – – – –2. Increase for the current year – – – –3. Decrease for the current year – – – –4. F oreign currency exchange
differences – – – –5. Closing balance – – – –
IV. Carrying amount1. Closing carrying amount 434,878,071.57 21,067,877,483.92 33,426,184.49 21,536,181,739.982. Opening carrying amount 436,428,789.68 24,034,919,396.82 29,965,797.97 24,501,313,984.47
At the end of the year, there is no land use rights nor mining rights used as collateral.
The land use rights are under medium term lease and were acquired with the lease period of 50 years and were situated in the PRC.
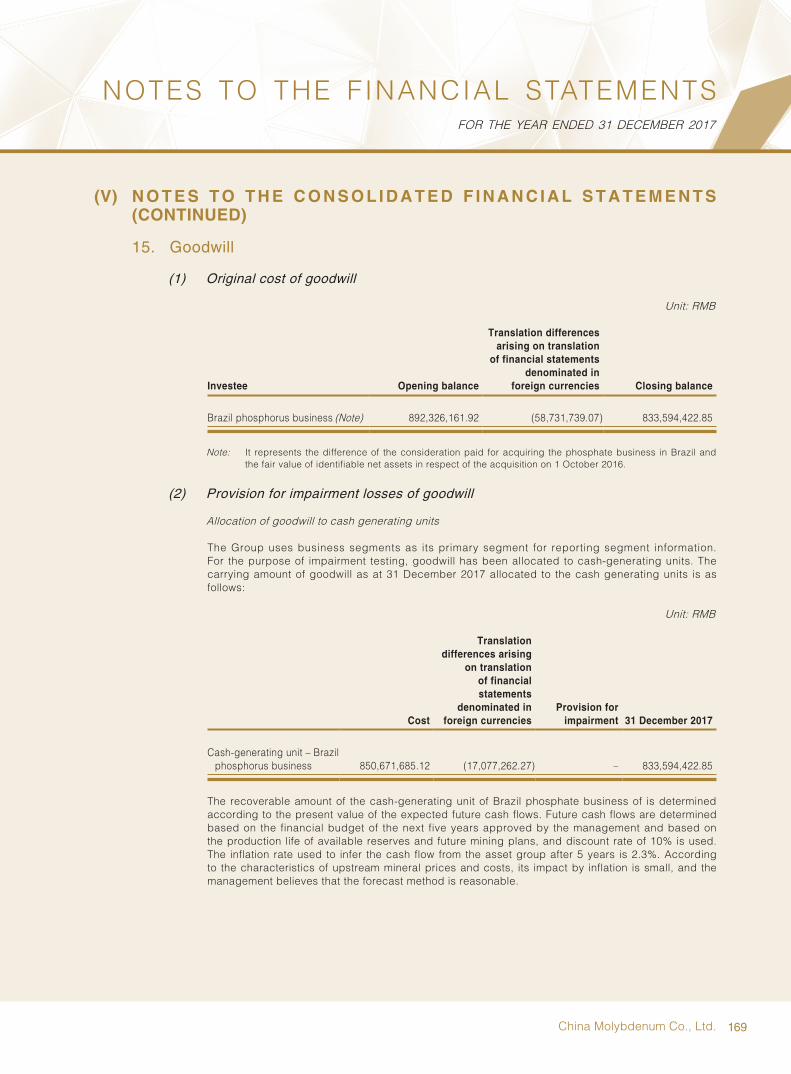
169China Molybdenum Co., Ltd.
NOTES TO THE FINANCIAL STATEMENTSFOR THE YEAR ENDED 31 DECEMBER 2017
(V) N O T E S T O T H E C O N S O L I D A T E D F I N A N C I A L S T A T E M E N T S (CONTINUED)
15. Goodwill
(1) Original cost of goodwill
Unit: RMB
Investee Opening balance
Translation differences arising on translation
of financial statements denominated in
foreign currencies Closing balance
Brazil phosphorus business (Note) 892,326,161.92 (58,731,739.07) 833,594,422.85
Note: It represents the difference of the consideration paid for acquiring the phosphate business in Brazil and the fair value of identifiable net assets in respect of the acquisition on 1 October 2016.
(2) Provision for impairment losses of goodwill
Allocation of goodwill to cash generating units
The Group uses business segments as its primary segment for reporting segment information. For the purpose of impairment testing, goodwill has been allocated to cash-generating units. The carrying amount of goodwill as at 31 December 2017 allocated to the cash generating units is as follows:
Unit: RMB
Cost
Translation differences arising
on translation of financial statements
denominated in foreign currencies
Provision for impairment 31 December 2017
Cash-generating unit – Brazil phosphorus business 850,671,685.12 (17,077,262.27) – 833,594,422.85
The recoverable amount of the cash-generating unit of Brazil phosphate business of is determined according to the present value of the expected future cash flows. Future cash flows are determined based on the financial budget of the next five years approved by the management and based on the production life of available reserves and future mining plans, and discount rate of 10% is used. The inflation rate used to infer the cash flow from the asset group after 5 years is 2.3%. According to the characteristics of upstream mineral prices and costs, its impact by inflation is small, and the management believes that the forecast method is reasonable.

170 2017 Annual Report
NOTES TO THE FINANCIAL STATEMENTSFOR THE YEAR ENDED 31 DECEMBER 2017
(V) N O T E S T O T H E C O N S O L I D A T E D F I N A N C I A L S T A T E M E N T S (CONTINUED)
15. Goodwill (Continued)
(2) Provision for impairment losses of goodwill (Continued)
Allocation of goodwill to cash generating units (Continued)
The key assumptions for calculating the present value of future cash flows for the above asset group as at 31 December 2017 are as follows:
Key assumptions Consideration of the management
Budget gross margin On the basis of realizing the average gross margin in the year before the budget year, appropriately modify the average gross margin according to the changes in the expected eff iciency and the fluctuation of metal market price.
Discount rate The discount rate used is the pre-tax discount rate that reflects the specific risk of related the cash-generating unit.
Inflation of raw material price
Consider the expected price index for the operating environment in the budget year.
The data of key assumptions of the sales price, discount rate, raw material price inflation used in the above cash generating units are consistent with the external information.
According to the above impairment test, the management believes that the relevant goodwill has not been impaired.
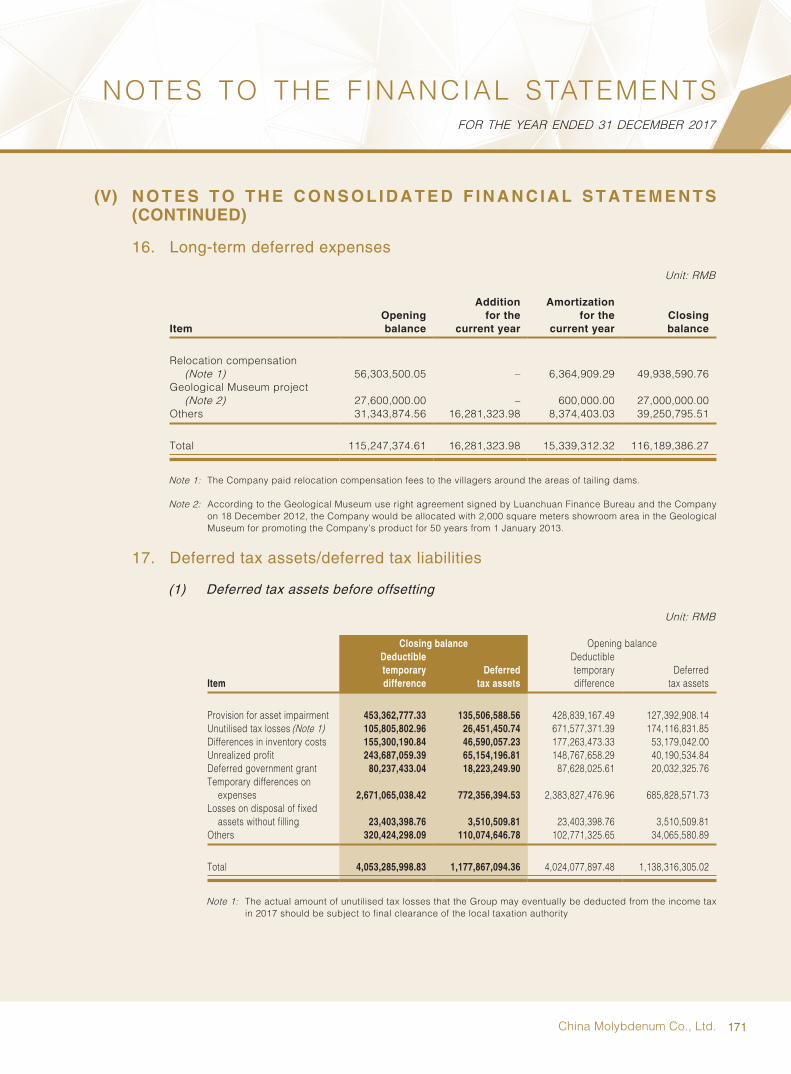
171China Molybdenum Co., Ltd.
NOTES TO THE FINANCIAL STATEMENTSFOR THE YEAR ENDED 31 DECEMBER 2017
(V) N O T E S T O T H E C O N S O L I D A T E D F I N A N C I A L S T A T E M E N T S (CONTINUED)
16. Long-term deferred expenses
Unit: RMB
ItemOpening balance
Addition for the
current year
Amortization for the
current yearClosing balance
Relocation compensation (Note 1) 56,303,500.05 – 6,364,909.29 49,938,590.76
Geological Museum project (Note 2) 27,600,000.00 – 600,000.00 27,000,000.00
Others 31,343,874.56 16,281,323.98 8,374,403.03 39,250,795.51
Total 115,247,374.61 16,281,323.98 15,339,312.32 116,189,386.27
Note 1: The Company paid relocation compensation fees to the villagers around the areas of tailing dams.
Note 2: According to the Geological Museum use right agreement signed by Luanchuan Finance Bureau and the Company on 18 December 2012, the Company would be allocated with 2,000 square meters showroom area in the Geological Museum for promoting the Company’s product for 50 years from 1 January 2013.
17. Deferred tax assets/deferred tax liabilities
(1) Deferred tax assets before offsetting
Unit: RMB
Item
Closing balance Opening balanceDeductible temporary difference
Deferred tax assets
Deductible temporary difference
Deferred tax assets
Provision for asset impairment 453,362,777.33 135,506,588.56 428,839,167.49 127,392,908.14Unutilised tax losses (Note 1) 105,805,802.96 26,451,450.74 671,577,371.39 174,116,831.85Differences in inventory costs 155,300,190.84 46,590,057.23 177,263,473.33 53,179,042.00Unrealized profit 243,687,059.39 65,154,196.81 148,767,658.29 40,190,534.84Deferred government grant 80,237,433.04 18,223,249.90 87,628,025.61 20,032,325.76Temporary differences on
expenses 2,671,065,038.42 772,356,394.53 2,383,827,476.96 685,828,571.73Losses on disposal of fixed
assets without filling 23,403,398.76 3,510,509.81 23,403,398.76 3,510,509.81Others 320,424,298.09 110,074,646.78 102,771,325.65 34,065,580.89
Total 4,053,285,998.83 1,177,867,094.36 4,024,077,897.48 1,138,316,305.02
Note 1: The actual amount of unutilised tax losses that the Group may eventually be deducted from the income tax in 2017 should be subject to final clearance of the local taxation authority

172 2017 Annual Report
NOTES TO THE FINANCIAL STATEMENTSFOR THE YEAR ENDED 31 DECEMBER 2017
(V) N O T E S T O T H E C O N S O L I D A T E D F I N A N C I A L S T A T E M E N T S (CONTINUED)
17. Deferred tax assets/deferred tax liabilities (Continued)
(2) Deferred tax liabilities before offsetting
Unit: RMB
Item
Closing balance Opening balanceTaxable
temporary differences
Deferred tax liabilities
Taxable temporary
differencesDeferred
tax liabilities
Accrued interest income 667,824,863.18 100,173,729.50 432,950,183.14 65,251,694.14Differences in fixed assets tax
basis 11,431,593,666.67 3,445,166,329.84 12,504,094,841.96 3,768,455,880.00Profit or loss arising from fair
value changes 18,545,597.06 6,305,503.00 51,821,233.59 11,572,212.69Adjustment to the fair value
of assets in business combination not involving enterprises under common control (Note 3) 18,746,013,810.72 5,795,938,801.83 22,265,894,393.20 6,653,594,496.07
Others 424,341,002.10 129,174,156.75 132,504,861.18 39,970,994.00
Total 31,288,318,939.73 9,476,758,520.92 35,387,265,513.07 10,538,845,276.90
Note 2: In the course of Brazil business combination not involving enterprises under common control in 2016, identifiable net assets of the acquiree was recorded at the fair value at the acquisition date, and deferred tax liability was recognised in accordance with the differences between the fair value and tax base of the related assets on the date of acquisition. According to the local tax law of Brazil, the above taxable temporary differences can be reversed after meeting certain conditions in the future. However, as the above conditions exist uncertainty, in accordance with the conservatism principle, the management has still recognised deferred tax liabilities amounting to RMB1,463,144,598.20 in 31 December 2017(2016: RMB1,642,841,579.32). If certain conditions are met in the future, the above deferred tax liabilities of the Group may be reversed in future to form one-time gain.
(3) Deferred tax assets or liabilities after offsetting
Unit: RMB
Item
Closing set-off amount of
deferred tax assets and
deferred tax liabilities
Closing balance of deferred
tax assets and deferred tax
liabilities after offset
Opening balance of deferred
tax assets and deferred tax
liabilities after offset
Opening balance of deferred
tax assets and deferred tax
liabilities after offset
Deferred tax assets 899,397,501.67 304,702,912.44 962,024,479.78 432,121,448.24Deferred tax liabilities 899,397,501.67 8,603,594,339.00 962,024,479.78 9,832,650,420.12
The movement of deferred income tax assets of the year decreased RMB71,267,640.09 due to the decrease in the translation of financial statements denominated in foreign currencies. The movement of deferred income tax liabilities of the year decreased RMB525,989,423.58 due to the decrease in the translation of financial statements denominated in foreign currencies.
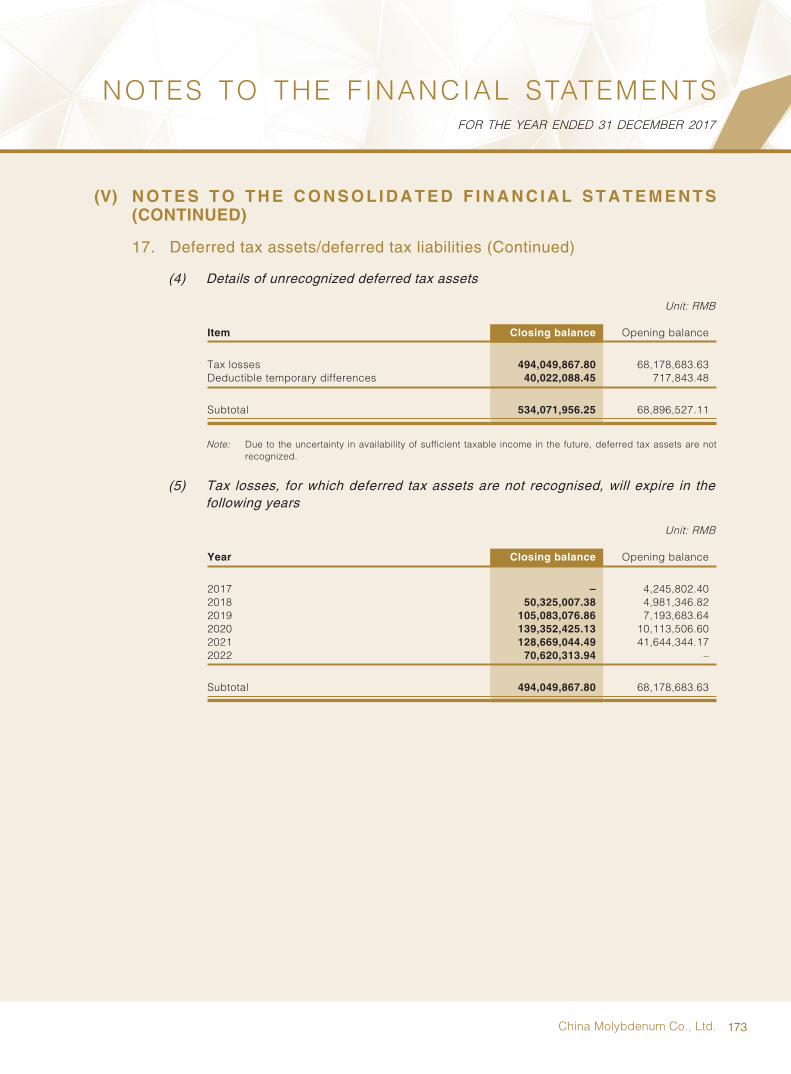
173China Molybdenum Co., Ltd.
NOTES TO THE FINANCIAL STATEMENTSFOR THE YEAR ENDED 31 DECEMBER 2017
(V) N O T E S T O T H E C O N S O L I D A T E D F I N A N C I A L S T A T E M E N T S (CONTINUED)
17. Deferred tax assets/deferred tax liabilities (Continued)
(4) Details of unrecognized deferred tax assets
Unit: RMB
Item Closing balance Opening balance
Tax losses 494,049,867.80 68,178,683.63Deductible temporary differences 40,022,088.45 717,843.48
Subtotal 534,071,956.25 68,896,527.11
Note: Due to the uncertainty in availability of sufficient taxable income in the future, deferred tax assets are not recognized.
(5) Tax losses, for which deferred tax assets are not recognised, will expire in the following years
Unit: RMB
Year Closing balance Opening balance
2017 – 4,245,802.402018 50,325,007.38 4,981,346.822019 105,083,076.86 7,193,683.642020 139,352,425.13 10,113,506.602021 128,669,044.49 41,644,344.172022 70,620,313.94 –
Subtotal 494,049,867.80 68,178,683.63
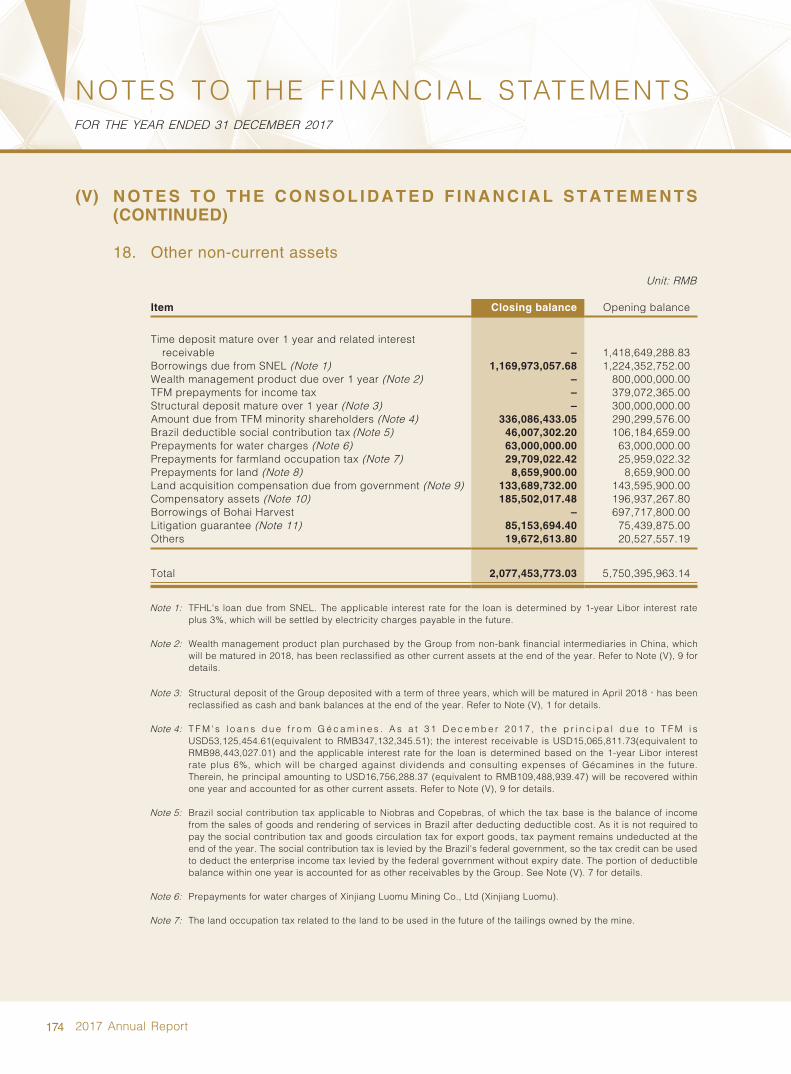
174 2017 Annual Report
NOTES TO THE FINANCIAL STATEMENTSFOR THE YEAR ENDED 31 DECEMBER 2017
(V) N O T E S T O T H E C O N S O L I D A T E D F I N A N C I A L S T A T E M E N T S (CONTINUED)
18. Other non-current assets
Unit: RMB
Item Closing balance Opening balance
Time deposit mature over 1 year and related interest receivable – 1,418,649,288.83
Borrowings due from SNEL (Note 1) 1,169,973,057.68 1,224,352,752.00Wealth management product due over 1 year (Note 2) – 800,000,000.00TFM prepayments for income tax – 379,072,365.00Structural deposit mature over 1 year (Note 3) – 300,000,000.00Amount due from TFM minority shareholders (Note 4) 336,086,433.05 290,299,576.00Brazil deductible social contribution tax (Note 5) 46,007,302.20 106,184,659.00Prepayments for water charges (Note 6) 63,000,000.00 63,000,000.00Prepayments for farmland occupation tax (Note 7) 29,709,022.42 25,959,022.32Prepayments for land (Note 8) 8,659,900.00 8,659,900.00Land acquisition compensation due from government (Note 9) 133,689,732.00 143,595,900.00Compensatory assets (Note 10) 185,502,017.48 196,937,267.80Borrowings of Bohai Harvest – 697,717,800.00Litigation guarantee (Note 11) 85,153,694.40 75,439,875.00Others 19,672,613.80 20,527,557.19
Total 2,077,453,773.03 5,750,395,963.14
Note 1: TFHL's loan due from SNEL. The applicable interest rate for the loan is determined by 1-year Libor interest rate plus 3%, which will be settled by electricity charges payable in the future.
Note 2: Wealth management product plan purchased by the Group from non-bank financial intermediaries in China, which will be matured in 2018, has been reclassified as other current assets at the end of the year. Refer to Note (V), 9 for details.
Note 3: Structural deposit of the Group deposited with a term of three years, which will be matured in April 2018,has been reclassified as cash and bank balances at the end of the year. Refer to Note (V), 1 for details.
Note 4: T F M ' s l o a n s d u e f r o m G é c a m i n e s . A s a t 3 1 D e c e m b e r 2 0 1 7 , t h e p r i n c i p a l d u e t o T F M i s USD53,125,454.61(equivalent to RMB347,132,345.51); the interest receivable is USD15,065,811.73(equivalent to RMB98,443,027.01) and the applicable interest rate for the loan is determined based on the 1-year Libor interest rate plus 6%, which will be charged against dividends and consulting expenses of Gécamines in the future. Therein, he principal amounting to USD16,756,288.37 (equivalent to RMB109,488,939.47) will be recovered within one year and accounted for as other current assets. Refer to Note (V), 9 for details.
Note 5: Brazil social contribution tax applicable to Niobras and Copebras, of which the tax base is the balance of income from the sales of goods and rendering of services in Brazil after deducting deductible cost. As it is not required to pay the social contribution tax and goods circulation tax for export goods, tax payment remains undeducted at the end of the year. The social contribution tax is levied by the Brazil's federal government, so the tax credit can be used to deduct the enterprise income tax levied by the federal government without expiry date. The portion of deductible balance within one year is accounted for as other receivables by the Group. See Note (V). 7 for details.
Note 6: Prepayments for water charges of Xinjiang Luomu Mining Co., Ltd (Xinjiang Luomu).
Note 7: The land occupation tax related to the land to be used in the future of the tailings owned by the mine.

175China Molybdenum Co., Ltd.
NOTES TO THE FINANCIAL STATEMENTSFOR THE YEAR ENDED 31 DECEMBER 2017
(V) N O T E S T O T H E C O N S O L I D A T E D F I N A N C I A L S T A T E M E N T S (CONTINUED)
18. Other non-current assets (Continued)
Note 8: The Group paid the land compensation and transfer payments in advance, and shall continue to handle the land transfer procedures after the relevant subsidiaries have resumed their production.
Note 9: Copebras holds the amount receivables from the state government of San Paulo, Brazil. Due to the local government suspended the payment of the remaining funds. Related issues are currently in the litigation stage, the management of the Group, based on the information and opinion of external lawyers, believe that the relevant funds can be recovered.
Note 10: Based on the agreement between the Group and Anglo American in the course of the acquisition of the Brazilian Niobium Phosphorus business, if Niobras and Copebras have incurred cash outflows in the course of the business due to tax-related contingencies, compensation will be provided by Anglo American. The Group recognized a liability for the Niobras and Copebras related contingencies at fair value (Note (V), 34), accordingly recognizes the right of relevant tax related compensation as an non – current assets.
Note 11: Niobras and Copebras have some disputes and litigation arising from some of the tax, labor and civil related legal proceedings in the course of business. Some of these proceedings require the submission of litigation collateral at the request of the court. The deposit is restricted for use and the interest is calculated at the Brazilian benchmark interest rate during this period. After the end of the litigation, according to the results, the company can call back the deposit or settle the litigation by the deposit.
19. Short-term borrowings
(1) Categories of short-term borrowings:
Unit: RMB
Item Closing balance Opening balance
Secured borrowings – 806,773,100.00Credit loan 1,478,132,364.60 3,565,660,377.73
Total 1,478,132,364.60 4,372,433,477.73
(2) At the end of this year, there were no outstanding short-term borrowings of the Group that were overdue
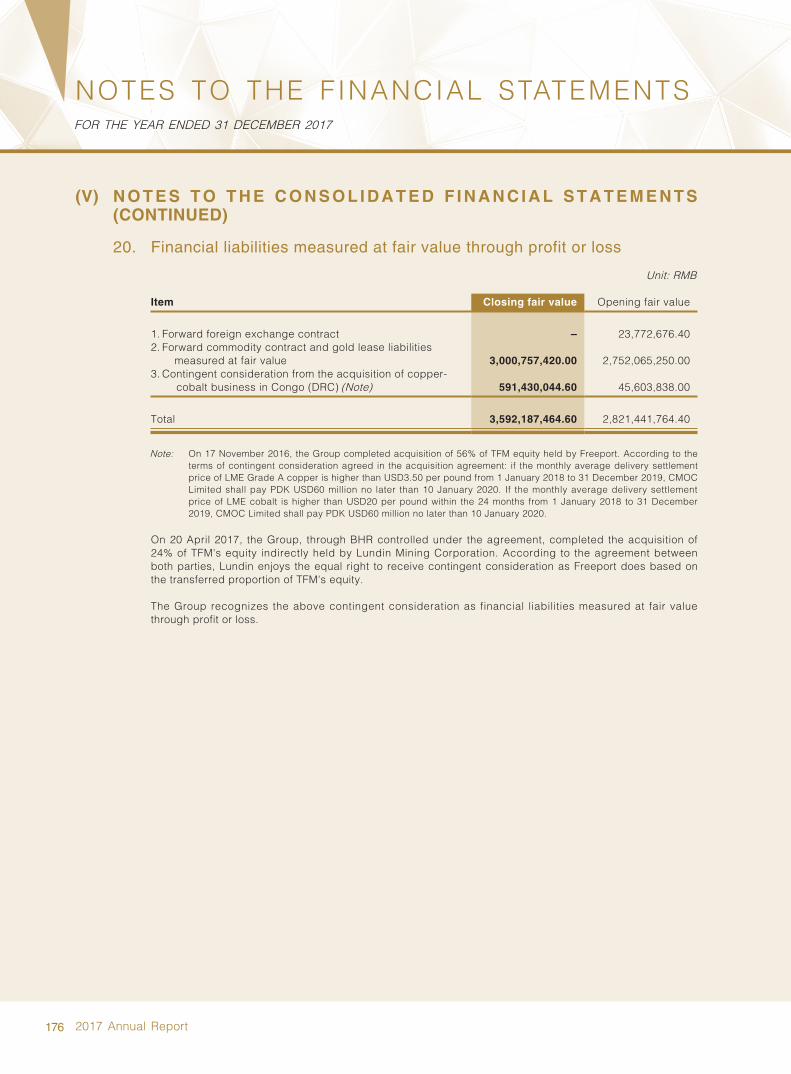
176 2017 Annual Report
NOTES TO THE FINANCIAL STATEMENTSFOR THE YEAR ENDED 31 DECEMBER 2017
(V) N O T E S T O T H E C O N S O L I D A T E D F I N A N C I A L S T A T E M E N T S (CONTINUED)
20. Financial liabilities measured at fair value through profit or loss
Unit: RMB
Item Closing fair value Opening fair value
1. Forward foreign exchange contract – 23,772,676.402. Fo rward commodity contract and gold lease liabilities
measured at fair value 3,000,757,420.00 2,752,065,250.003. Co ntingent consideration from the acquisition of copper-
cobalt business in Congo (DRC) (Note) 591,430,044.60 45,603,838.00
Total 3,592,187,464.60 2,821,441,764.40
Note: On 17 November 2016, the Group completed acquisition of 56% of TFM equity held by Freeport. According to the terms of contingent consideration agreed in the acquisition agreement: if the monthly average delivery settlement price of LME Grade A copper is higher than USD3.50 per pound from 1 January 2018 to 31 December 2019, CMOC Limited shall pay PDK USD60 million no later than 10 January 2020. If the monthly average delivery settlement price of LME cobalt is higher than USD20 per pound within the 24 months from 1 January 2018 to 31 December 2019, CMOC Limited shall pay PDK USD60 million no later than 10 January 2020.
On 20 April 2017, the Group, through BHR controlled under the agreement, completed the acquisition of 24% of TFM's equity indirectly held by Lundin Mining Corporation. According to the agreement between both parties, Lundin enjoys the equal right to receive contingent consideration as Freeport does based on the transferred proportion of TFM's equity.
The Group recognizes the above contingent consideration as financial liabilities measured at fair value through profit or loss.

177China Molybdenum Co., Ltd.
NOTES TO THE FINANCIAL STATEMENTSFOR THE YEAR ENDED 31 DECEMBER 2017
(V) N O T E S T O T H E C O N S O L I D A T E D F I N A N C I A L S T A T E M E N T S (CONTINUED)
21. Notes payable
Unit: RMB
Category Closing balance Opening balance
Bank acceptances 23,955,000.00 660,000,000.00
Total 23,955,000.00 660,000,000.00
22. Accounts payable
(1) Accounts payable
Unit: RMB
Item Closing balance Opening balance
Payables for purchase of goods 853,338,766.90 638,177,650.37Others 123,141,789.84 103,330,622.93
Total 976,480,556.74 741,508,273.30
(2) Aging analysis on accounts payable is set out as follows:
Unit: RMB
Item Closing balance Opening balance
Within 1 year 954,173,751.20 727,540,195.381 to 2 years 13,825,574.87 4,172,608.83Over 2 years 8,481,230.67 9,795,469.09
Total 976,480,556.74 741,508,273.30

178 2017 Annual Report
NOTES TO THE FINANCIAL STATEMENTSFOR THE YEAR ENDED 31 DECEMBER 2017
(V) N O T E S T O T H E C O N S O L I D A T E D F I N A N C I A L S T A T E M E N T S (CONTINUED)
23. Receipts in advance
(1) Details of receipts in advance are as follows
Unit: RMB
Item Closing balance Opening balance
Sales of goods 127,796,251.75 51,867,495.95
Total 127,796,251.75 51,867,495.95
(2) There is no material receipts in advance of which the aging is more than one year.
24. Employee benefits payable
(1) Details of employee benefits payable are as follows
Unit: RMB
ItemOpening balance
Increase in the current year
Decrease in the current year
Foreign currency exchange
differences Closing
1. Short-term compensation 283,023,181.26 1,631,896,199.17 1,497,044,184.26 (18,280,993.80) 399,594,202.372. R etirement benefits-defined
contribution plans 39,069,535.05 248,423,360.44 265,793,025.75 (8,200,978.85) 13,498,890.893. Others (Note) 32,729,436.53 11,322,961.42 7,351,953.67 (4,387,698.33) 32,312,745.95
Total 354,822,152.84 1,891,642,521.03 1,770,189,163.68 (30,869,670.98) 445,405,839.21
Note: It represents the liabilities related to annual leave and long service leave which are provided by Group's subsidiary in Australia to its employees and expected to be paid within 12 months.

179China Molybdenum Co., Ltd.
NOTES TO THE FINANCIAL STATEMENTSFOR THE YEAR ENDED 31 DECEMBER 2017
(V) N O T E S T O T H E C O N S O L I D A T E D F I N A N C I A L S T A T E M E N T S (CONTINUED)
24. Employee benefits payable (Continued)
(2) Details of short-term compensation are as follows
Unit: RMB
ItemOpening balance
Increase in the current year
Decrease in the current year
Foreign currency exchange
differences Closing
I. Wages or salaries, bonuses, allowances and subsidies 272,017,533.26 1,531,132,231.46 1,396,749,153.96 (18,252,921.06) 388,147,689.70
II. Staff welfare 290,310.85 38,406,764.08 38,406,764.08 – 290,310.85III. Social security contributions 59,973.62 27,587,266.35 26,709,762.46 (28,072.74) 909,404.77
Including: Medical insurance 34,256.69 22,439,980.18 21,550,796.43 (28,072.74) 895,367.70Maternity insurance 2,606.98 1,251,751.37 1,253,514.78 – 843.57Work injury insurance 23,109.95 3,895,534.80 3,905,451.25 – 13,193.50
IV. Housing funds 9,688.83 26,612,082.31 26,543,720.92 – 78,050.22V. Termination benefits – – – – –VI. L abour union and staff education
fund 10,645,674.70 8,157,854.97 8,634,782.84 – 10,168,746.83
Total 283,023,181.26 1,631,896,199.17 1,497,044,184.26 (18,280,993.80) 399,594,202.37
All the employee compensation payables are not overdue and not related to non-cash benefits, which will be expected to paid out in 2018.
(3) Retirement benefits – defined contribution plans
Unite: RMB
Item Opening balanceIncrease in
the current yearDecrease in
the current year
Foreign currency exchange
differences Closing
1. Basis pension insurance 39,062,655.68 246,740,034.54 264,103,497.00 (8,200,978.85) 13,498,214.372. Unemployment insurance 6,879.37 1,683,325.90 1,689,528.75 – 676.52
Total 39,069,535.05 248,423,360.44 265,793,025.75 (8,200,978.85) 13,498,890.89

180 2017 Annual Report
NOTES TO THE FINANCIAL STATEMENTSFOR THE YEAR ENDED 31 DECEMBER 2017
(V) N O T E S T O T H E C O N S O L I D A T E D F I N A N C I A L S T A T E M E N T S (CONTINUED)
24. Employee benefits payable (Continued)
(3) Retirement benefits – defined contribution plans (Continued)
According to the pension and unemployment insurance plan set up by the government institutions or assigned with financial institutions, the Group monthly pay to the plan for the staff of according to a certain proportion of employee basic salary. Apart from the above monthly payment, the Group bear no longer further payment obligation. Corresponding expenses are recorded in the profits and losses of current period or the cost of the related assets.
The Group shall pay RMB246,740,034.54 and RMB1,683,325.90 (2016: RMB123,438,865.07 and RMB2,729,305.37) respectively to the pension insurance and unemployment insurance schemes in the year. As at 31 December 2017, there were RMB13,498,214.37 and RMB676.52 (31 December 2016: RMB39,062,655.68 and RMB6,879.37) of pension insurance and unemployment insurance outstanding but not paid. The related amounts have been paid subsequent to the reporting period ends.
25. Taxes payable
Unit: RMB
Item Closing balance Opening balance
PRC enterprise income tax (17,684,695.54) (57,579,903.16)Australia enterprise income tax 10,647,360.64 5,888,644.75Brazil enterprise income tax 58,931,949.80 23,171,515.42Congo (DRC) enterprise income tax 950,808,805.26 –Urban maintenance and construction tax (1,948,445.56) (2,490,186.83)Value added tax 10,959,940.78 2,543,689.88Resource tax 52,221,418.95 24,747,749.21Price adjustment fund – 9,725.08Education surtax (1,779,452.79) (2,242,920.47)Individual income tax 49,539,041.58 53,667,489.34Others 26,100,287.12 10,145,439.07
Total 1,137,796,210.24 57,861,242.29

181China Molybdenum Co., Ltd.
NOTES TO THE FINANCIAL STATEMENTSFOR THE YEAR ENDED 31 DECEMBER 2017
(V) N O T E S T O T H E C O N S O L I D A T E D F I N A N C I A L S T A T E M E N T S (CONTINUED)
26. Interests Payable
Unit: RMB
Item Closing balance Opening balance
Interests on medium-term notes with periodic payments of interest and return of principal at maturity (Note) 66,132,602.75 107,006,027.41
Interests on bank borrowings 153,672,947.19 76,678,221.74
Total 219,805,549.94 183,684,249.15
Note: Details refer to Note (V).32.
27. Dividends payable
Unit: RMB
Name of entity Closing balance Opening balance
Luanchuan Taifeng Industry and Trading Co., Ltd. (Note) 6,623,109.24 6,623,109.24Luanchuan Hongji Mining Co., Ltd. (Note) 15,943,017.89 15,943,017.89Luanchuan Chengzhi Mining Co., Ltd. (Note) 5,319,669.54 5,319,669.54
Total 27,885,796.67 27,885,796.67
Note: Minority shareholders of subsidiaries of the Group.

182 2017 Annual Report
NOTES TO THE FINANCIAL STATEMENTSFOR THE YEAR ENDED 31 DECEMBER 2017
(V) N O T E S T O T H E C O N S O L I D A T E D F I N A N C I A L S T A T E M E N T S (CONTINUED)
28. Other payables
(1) Other payables shall be listed based on nature
Unit: RMB
Item Closing balance Opening balance
Government compensation – 695,087,400.00Project and equipment funds 171,713,123.21 192,190,462.62Loyalties due to Gécamines (Note 1) 42,090,109.74 122,288,933.50Service and transportation expenses 139,010,173.46 85,366,685.46Electricity charge compensation due to SNEL (Note 2) 65,342,000.00 69,370,000.00Production progress payment due to Gécamines
(Note 3) – 34,685,000.00Deposits and advances 35,204,707.85 31,734,226.04Service fees payable 54,775,236.40 28,062,001.22Resource expenses payable 23,084,747.89 27,796,559.00Land compensation 8,369,753.98 17,069,841.57Resource tax 1,123,882.40 11,724,935.78Others 64,059,985.57 101,399,769.93
Total 604,773,720.50 1,416,775,815.12
Note 1: Gécamines charge a monthly payment from TFM as loyalties for providing technical support and management consultant services. According to the mining rights agreement between TFM and the government of Congo (DRC), loyalties shall be calculated and paid at 2% of the adjusted sales income for the Group's business in Congo (DRC).
Note 2: TFM and SNEL had a dispute on the future fee of electricity, the management of TFM accrued the compensation based on the best estimation of the possible cash flow out in the future.
Note 3: According to the Mining Agreement entered into with Gécamines, Gécamines will charge TFM production progress fees. As at 31 December 2017, and there's no production progress fees that shall be paid within 1 year.
(2) Details of other payables due from related parties refer to Note (X).6.

183China Molybdenum Co., Ltd.
NOTES TO THE FINANCIAL STATEMENTSFOR THE YEAR ENDED 31 DECEMBER 2017
(V) N O T E S T O T H E C O N S O L I D A T E D F I N A N C I A L S T A T E M E N T S (CONTINUED)
29. Non-current liabilities due within one year
Unit: RMB
Item Closing balance Opening balance
Payables for exploration right in Hami, Xinjiang 10,000,000.00 10,000,000.00Deferred income to be released within one year (Note (V).35) 7,417,144.28 7,417,281.25Long-term borrowings due within one year (Note (V).31) 4,780,399,163.34 567,080,088.80Bonds payable due within one year (Note (V).32) – 2,000,000,000.00
Total 4,797,816,307.62 2,584,497,370.05
30. Other current liabilities
Unit: RMB
Item Closing balance Opening balance
Acquisition transaction cost (Note) – 114,893,082.82Accrued expenses 71,073,182.26 94,004,105.64Payable for Super short-term financing bonds – 2,500,000,000.00
Total 71,073,182.26 2,708,897,188.46
Note: The acquisition transaction cost is professional fees incurred in transactions during the acquisition of the Brazil Niobium-Phosphorus business and the Congo (DRC) Copper-Cobalt business in 2016,and in 2017 has all been settled.

184 2017 Annual Report
NOTES TO THE FINANCIAL STATEMENTSFOR THE YEAR ENDED 31 DECEMBER 2017
(V) N O T E S T O T H E C O N S O L I D A T E D F I N A N C I A L S T A T E M E N T S (CONTINUED)
30. Other current liabilities (Continued)
Increase or decrease of short bonds payable:
Unit: RMB
Name Par value Issue date Term Issue amountOpening balance
Issued In this period year
Accrued interest
for the yearInterests paid
during the year
Closing interestpayable
Amortization of premium
and discountPayment in
this period yearEnding
balance
16 Luanchuan Molybdenum CP001 500,000,000.00 26 February 2016 1 year 500,000,000.00 500,000,000.00 – 2,570,136.96 15,943,561.64 – – 500,000,000.00 –16 Luanchuan Molybdenum SCP001 1,000,000,000.00 19 October 2016 270 days 1,000,000,000.00 1,000,000,000.00 – 16,182,789.82 22,191,780.82 – – 1,000,000,000.00 –16 Luanchuan Molybdenum SCP002 1,000,000,000.00 1 November 2016 270 days 1,000,000,000.00 1,000,000,000.00 – 18,756,164.38 24,115,068.49 – – 1,000,000,000.00 –
Total 2,500,000,000.00 2,500,000,000.00 2,500,000,000.00 – 37,509,091.16 62,250,410.95 – – 2,500,000,000.00 –
31. Long-term borrowings
(1) Categories of long-term borrowings
Unit: RMB
Item Closing balance Opening balance
Secured borrowings (Note) 16,935,905,304.91 17,972,067,402.29Unsecured and non-guaranteed loans 9,878,382,377.70 5,971,892,626.00Less: long-term borrowings due within one year (Note (V).29) 4,780,399,163.34 567,080,088.80
Total 22,033,888,519.27 23,376,879,939.49
Note: Borrowings obtained by the Group are through pledge of fixed deposits and equity of subsidiaries, including:
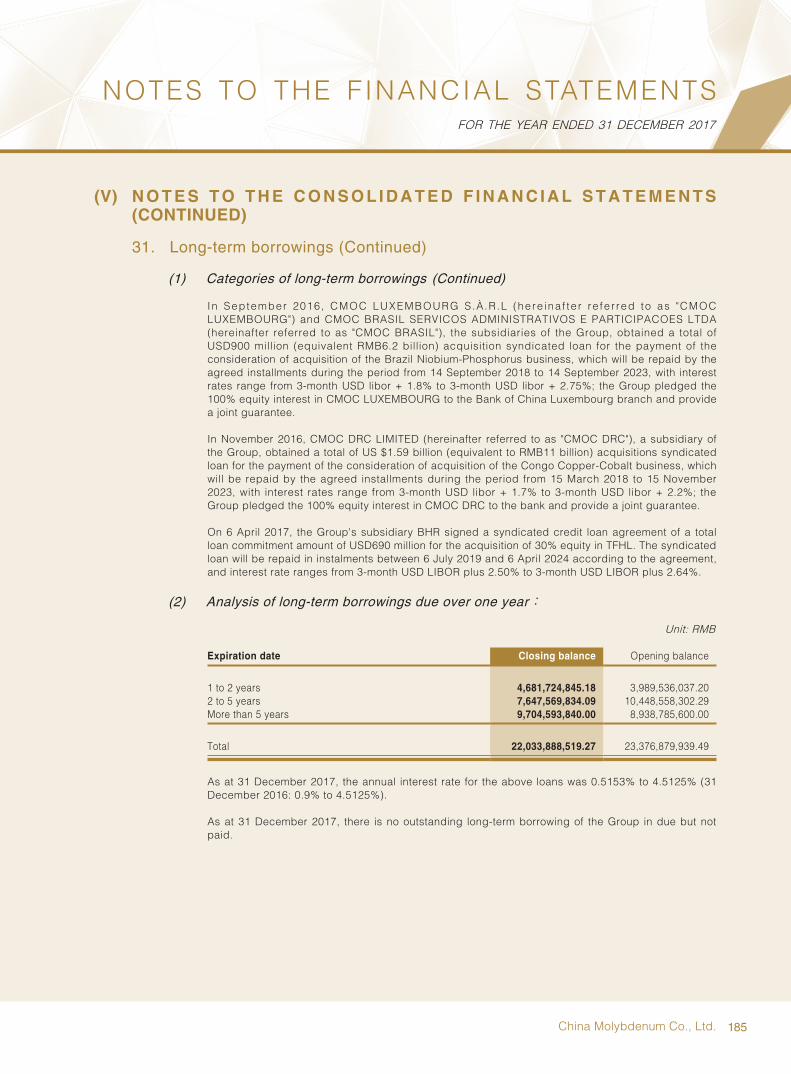
185China Molybdenum Co., Ltd.
NOTES TO THE FINANCIAL STATEMENTSFOR THE YEAR ENDED 31 DECEMBER 2017
(V) N O T E S T O T H E C O N S O L I D A T E D F I N A N C I A L S T A T E M E N T S (CONTINUED)
31. Long-term borrowings (Continued)
(1) Categories of long-term borrowings (Continued)
In September 2016, CMOC LUXEMBOURG S.À.R.L (here ina f te r re fe r red to as "CMOC LUXEMBOURG") and CMOC BRASIL SERVICOS ADMINISTRATIVOS E PARTICIPACOES LTDA (hereinafter referred to as "CMOC BRASIL"), the subsidiaries of the Group, obtained a total of USD900 million (equivalent RMB6.2 billion) acquisition syndicated loan for the payment of the consideration of acquisition of the Brazil Niobium-Phosphorus business, which will be repaid by the agreed installments during the period from 14 September 2018 to 14 September 2023, with interest rates range from 3-month USD libor + 1.8% to 3-month USD libor + 2.75%; the Group pledged the 100% equity interest in CMOC LUXEMBOURG to the Bank of China Luxembourg branch and provide a joint guarantee.
In November 2016, CMOC DRC LIMITED (hereinafter referred to as "CMOC DRC"), a subsidiary of the Group, obtained a total of US $1.59 billion (equivalent to RMB11 billion) acquisitions syndicated loan for the payment of the consideration of acquisition of the Congo Copper-Cobalt business, which will be repaid by the agreed installments during the period from 15 March 2018 to 15 November 2023, with interest rates range from 3-month USD libor + 1.7% to 3-month USD libor + 2.2%; the Group pledged the 100% equity interest in CMOC DRC to the bank and provide a joint guarantee.
On 6 April 2017, the Group's subsidiary BHR signed a syndicated credit loan agreement of a total loan commitment amount of USD690 million for the acquisition of 30% equity in TFHL. The syndicated loan will be repaid in instalments between 6 July 2019 and 6 April 2024 according to the agreement, and interest rate ranges from 3-month USD LIBOR plus 2.50% to 3-month USD LIBOR plus 2.64%.
(2) Analysis of long-term borrowings due over one year:
Unit: RMB
Expiration date Closing balance Opening balance
1 to 2 years 4,681,724,845.18 3,989,536,037.202 to 5 years 7,647,569,834.09 10,448,558,302.29More than 5 years 9,704,593,840.00 8,938,785,600.00
Total 22,033,888,519.27 23,376,879,939.49
As at 31 December 2017, the annual interest rate for the above loans was 0.5153% to 4.5125% (31 December 2016: 0.9% to 4.5125%).
As at 31 December 2017, there is no outstanding long-term borrowing of the Group in due but not paid.

186 2017 Annual Report
NOTES TO THE FINANCIAL STATEMENTSFOR THE YEAR ENDED 31 DECEMBER 2017
(V) N O T E S T O T H E C O N S O L I D A T E D F I N A N C I A L S T A T E M E N T S (CONTINUED)
32. Bonds payable
(1) Bonds payable
Unit: RMB
Item Closing balance Opening balance
Medium-term note 2,000,000,000.00 4,000,000,000.00Less: Middle-term note due within 1 year – 2,000,000,000.00
Total 2,000,000,000.00 2,000,000,000.00
(2) Changes in bonds payable
Unit: RMB
NamePar value
Issue date Issue date Term Issue amountOpening balance
Payment in this period year
Issued amount for the
yearAccrued interest
for the year
Interests paid during
the yearClosing
interest payable
Amortization of Premium
and for discount
Exercise of convertible
option during
the year
Amount due within
one yearClosing balance
12 CMOC MTN1 (Note1) 2,000,000,000.00 2 August 2012 5 years 2,000,000,000.00 2,000,000,000.00 2,000,000,000.00 – 57,926,575.36 98,800,000.00 – – – – –16 Luanchuan Molybdenum
MTN001 (Note 2) 2,000,000,000.00 17 March 2016 5 years 2,000,000,000.00 2,000,000,000.00 – – 84,566,666.64 84,400,000.00 66,132,602.74 – – – 2,000,000,000.00
Total 4,000,000,000.00 4,000,000,000.00 4,000,000,000.00 2,000,000,000.00 – 142,493,242.00 183,200,000.00 66,132,602.74 – – – 2,000,000,000.00
Note 1: On 2 August 2012, the Company issued medium-term notes with a par value of RMB2 billion (refers to 12 CMOC MTN1) and the relevant bonds is permitted to trade and circulate on the National Inter-bank Bond Market. The proceeds from the issuance of the medium-term financing notes were used to supply the Company and its subsidiaries’ working capital and repayment of bank borrowings. The annual interest rate of the medium-term notes is a fixed rate of 4.94% with a term of 5 years. The interest is paid once each year. The bonds has been paid on 3 August 2017.
Note 2: The Company issued medium-term notes with a total par value of RMB2 billion (refers to: 16 Luanchuan Molybdenum MTN001) on March 17, 2016; and the relevant bonds is permitted to trade and circulate on the National Inter-bank Bond Market. The proceeds from the issue of the medium-term financing bonds were used to supply the Company and its subsidiaries’ working capital and repayment of bank borrowings. The annual interest rate of the medium-term notes is a fixed rate of 4.22% with a term of 5 years and the interest is paid once a year in the duration. See Note (V), 26 for the details of interest payable.
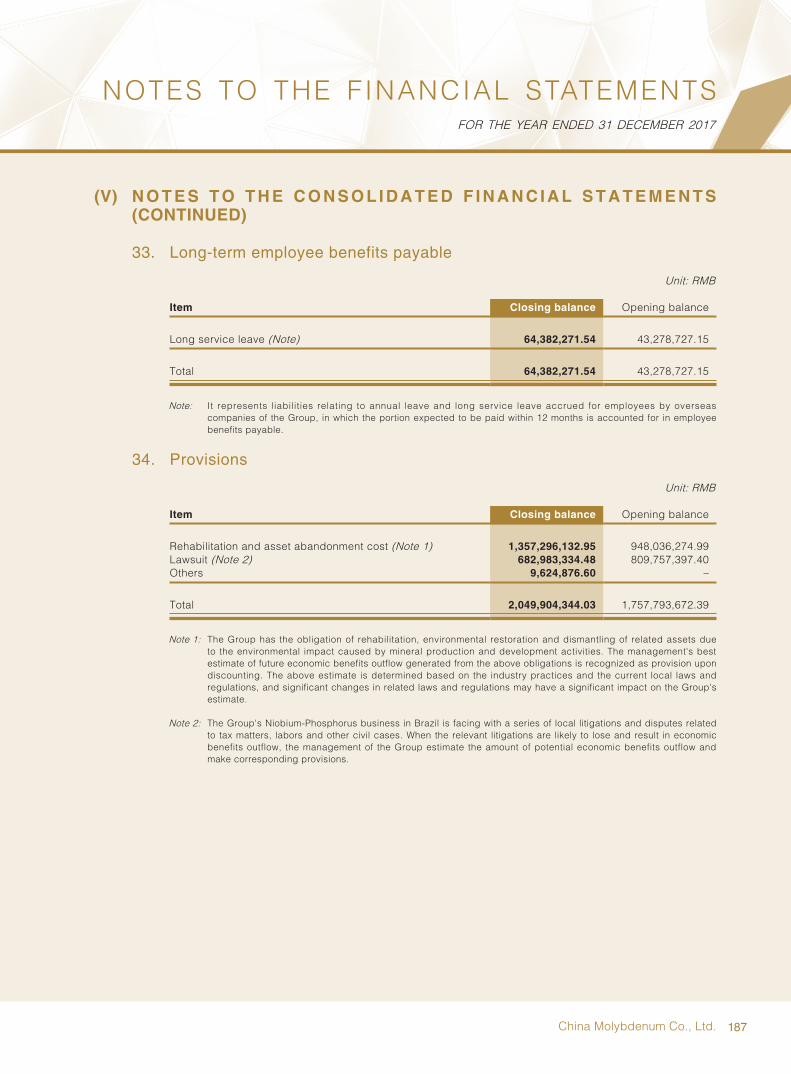
187China Molybdenum Co., Ltd.
NOTES TO THE FINANCIAL STATEMENTSFOR THE YEAR ENDED 31 DECEMBER 2017
(V) N O T E S T O T H E C O N S O L I D A T E D F I N A N C I A L S T A T E M E N T S (CONTINUED)
33. Long-term employee benefits payable
Unit: RMB
Item Closing balance Opening balance
Long service leave (Note) 64,382,271.54 43,278,727.15
Total 64,382,271.54 43,278,727.15
Note: It represents liabilities relating to annual leave and long service leave accrued for employees by overseas companies of the Group, in which the portion expected to be paid within 12 months is accounted for in employee benefits payable.
34. Provisions
Unit: RMB
Item Closing balance Opening balance
Rehabilitation and asset abandonment cost (Note 1) 1,357,296,132.95 948,036,274.99Lawsuit (Note 2) 682,983,334.48 809,757,397.40Others 9,624,876.60 –
Total 2,049,904,344.03 1,757,793,672.39
Note 1: The Group has the obligation of rehabilitation, environmental restoration and dismantling of related assets due to the environmental impact caused by mineral production and development activities. The management's best estimate of future economic benefits outflow generated from the above obligations is recognized as provision upon discounting. The above estimate is determined based on the industry practices and the current local laws and regulations, and significant changes in related laws and regulations may have a significant impact on the Group's estimate.
Note 2: The Group's Niobium-Phosphorus business in Brazil is facing with a series of local litigations and disputes related to tax matters, labors and other civil cases. When the relevant litigations are likely to lose and result in economic benefits outflow, the management of the Group estimate the amount of potential economic benefits outflow and make corresponding provisions.

188 2017 Annual Report
NOTES TO THE FINANCIAL STATEMENTSFOR THE YEAR ENDED 31 DECEMBER 2017
(V) N O T E S T O T H E C O N S O L I D A T E D F I N A N C I A L S T A T E M E N T S (CONTINUED)
35. Deferred income
Unit: RMB
Item Closing balance Opening balance
Refunds of land-transferring fees (Note 1) 15,359,167.70 15,744,753.50R & D subsidies (Note 2) 3,000,000.00 3,000,000.00Demonstration base project subsidies (Note 2) 61,878,265.34 68,883,272.11Others 70,189.60 94,962.40Less: Deferred income carried forward with 1 year 7,417,144.28 7,417,281.25
Total 72,890,478.36 80,305,706.76
Note 1: It represents the refunds of land-transferring fees received by the Group, which is included in deferred revenue, and amortized in the period of land use with the straight-line method.
Note 2: It represents the special funds for major science and technology of Henan Province, the special funds for mineral resources conservation and comprehensive utilization and the subsidies for the central mineral resources comprehensive utilization demonstration base received by the Group, which are to be used for the study of key technologies for molybdenum-tungsten dressing and deep processing, included in deferred income, and recognised as an other income in the future when related technology research costs are incurred.
Projects related to government grants:
Unit: RMB
ItemOpening balance
Increase in the year
Recorded in other income
Closing balance
Related to assets/income (Note)
Deferred income-subsidies for low-grade scheelite demonstration project 68,883,272.11 – 7,005,006.77 61,878,265.34 Related to assets
Subsidies of the return of Nannihu land premium 15,744,753.50 – 385,585.80 15,359,167.70 Related to assets
Special funds for comprehensive utilization of 3,000 tons/day Molybdenum selection tailings 3,000,000.00 – – 3,000,000.00 Related to assets
Subsidies for installation of heavy metal automatic monitoring facilities 94,962.40 – 24,772.80 70,189.60 Related to assets
Total 87,722,988.01 – 7,415,365.37 80,307,622.64
Note: For the government grants to be received by the Company, it will be divided to asses-related government grants and income-related government grants according to the definition and requirements by the government. For those not clearly defined by the government documents, the Company will make judgment according to whether it can form assets or not.

189China Molybdenum Co., Ltd.
NOTES TO THE FINANCIAL STATEMENTSFOR THE YEAR ENDED 31 DECEMBER 2017
(V) N O T E S T O T H E C O N S O L I D A T E D F I N A N C I A L S T A T E M E N T S (CONTINUED)
36. Other non-current liabilities
Unit: RMB
Item Closing balance Opening balance
Principal, interest and others payable to a third party (Note 1) 385,567,566.20 369,588,638.84Service fees payable to a third party 59,826,606.06 60,630,814.29Production progress fees payable to Gécamines (Note 2) 65,342,000.00 69,370,000.00Acquisition consideration payable to BHR shareholders
(Note (VII), 2) 3,071,074,000.00 –Others 18,533,506.21 15,261,400.01
Total 3,600,343,678.47 514,850,853.14
Note 1: The loan is from a third party with a term of ten years and an annual interest rate of 0.4% in 2016. And the Group measures the liability with actual interest rate. The amount of imputed interest discounts is recognized as deferred income.
Note 2: In accordance with the mining agreement entered into between the Group and Gécamines, Gécamines needs to charge TFM production progress fees. On 31 December 2017, the outstanding payment is USD10 million; according to TFM's production plan, the remaining amount is expected to be paid after 2020.

190 2017 Annual Report
NOTES TO THE FINANCIAL STATEMENTSFOR THE YEAR ENDED 31 DECEMBER 2017
(V) N O T E S T O T H E C O N S O L I D A T E D F I N A N C I A L S T A T E M E N T S (CONTINUED)
37. Share capital
As at 31 December 2017, the Company issued 21,599,240,583 shares, the par value of the Company’s share is RMB0.2 per share, and the total capital stock is RMB4,319,848,116.60. The structures and types of share are shown as follow:
Unit: shares
Opening balance
Changes for the year
Closing balanceIssuing
new shares Bonus
Capitalisation of surplus
reserve Others Subtotal
2017:I. Sh ares restricted for
trading1. Sh areholding of state-
own legal-person – – – – – – –2. Ot her domestic-owned
shares – 4,712,041,884 – – – 4,712,041,884 4,712,041,884Total amount of shares
restricted for trading – 4,712,041,884 – – – 4,712,041,884 4,712,041,884II. Trading shares – – – – – – –
1. Or dinary shares denominated in RMB 12,953,730,699 – – – – – 12,953,730,699
2. Fo reign-owned shares listed overseas 3,933,468,000 – – – – – 3,933,468,000
Total amount of unrestricted shares 16,887,198,699 – – – – – 16,887,198,699
III. Total amount of shares 16,887,198,699 4,712,041,884 – – – 4,712,041,884 21,599,240,583
2016:I. Sh ares restricted for
trading1. Sh areholding of state-
own legal-person – – – – – – –2. Ot her domestic-owned
shares – – – – – – –Total amount of shares
restricted for trading – – – – – – –II. Trading shares – – – – – – –
1. Or dinary shares denominated in RMB 12,953,730,699 – – – – – 12,953,730,699
2. Fo reign-owned shares listed overseas 3,933,468,000 – – – – – 3,933,468,000
Total amount of unrestricted shares 16,887,198,699 – – – – – 16,887,198,699
III. Total amount of shares 16,887,198,699 – – – – – 16,887,198,699
Note: On 24 July 2017, the Company privately placed 4,712,041,884 shares of RMB ordinary shares (A-share) to specific objects at a price of RMB3.82 per share with a par value of RMB0.20, and the total amount of funds raised was RMB17,999,999,996.88; after deducting the issuance expenses, the net of raised funds amounted to RMB17,858,632,663.30. After the issuance, the share capital of the Company increased from 16,887,198,699 shares to 21,599,240,583 shares. The restricted stock trade period for the new shares is 12 months.
191China Molybdenum Co., Ltd.
NOTES TO THE FINANCIAL STATEMENTSFOR THE YEAR ENDED 31 DECEMBER 2017
(V) N O T E S T O T H E C O N S O L I D A T E D F I N A N C I A L S T A T E M E N T S (CONTINUED)
38. Capital reserve
Unit: RMB
Item Opening balanceIncrease in
the year Decrease in
the year Closing balance(Note 1) (Note 2)
2017:Capital premium 10,720,306,602.38 16,916,224,286.50 53,735,905.65 27,582,794,983.23Including: Ca pital invested by
investors 10,718,184,562.38 16,916,224,286.50 53,735,905.65 27,580,672,943.23Other capital reserves 2,122,040.00 – – 2,122,040.00
Total 10,720,306,602.38 16,916,224,286.50 53,735,905.65 27,582,794,983.23
Item Opening balance Increase in the year Decrease in the year Closing balance
2016:Capital premium 10,720,306,602.38 – – 10,720,306,602.38Including: Ca pital invested by
investors 10,718,184,562.38 – – 10,718,184,562.38Other capital reserves 2,122,040.00 – – 2,122,040.00
Total 10,720,306,602.38 – – 10,720,306,602.38
Note 1: Details please refer to Note (V), 37.
Note 2: Details please refer to Note (VII), 2.
192 2017 Annual Report
NOTES TO THE FINANCIAL STATEMENTSFOR THE YEAR ENDED 31 DECEMBER 2017
(V) N O T E S T O T H E C O N S O L I D A T E D F I N A N C I A L S T A T E M E N T S (CONTINUED)
39. Other comprehensive income
Unit: RMB
Item balance Opening balance
Amount recognised in the current year
Ending balance
Actual amount before income tax in the year
Less: Amount Previously Included in
other comprehensive
income transferred into profit
or lossLess: income
tax expense
After-tax Amount
Attributable to Owners
of the parent company
After-tax amount
Attributable to minority
shareholder
I. Ot her comprehensive income cannot reclassified into the profit or loss subsequently – – – – – – –
Including: Changes in defined contribution plans – – – – – – –
II. Ot her comprehensive income to be reclassified into the profit or loss subsequently 282,854,287.93 (1,024,042,650.91) – – (521,671,890.87) (502,370,760.04) (238,817,602.94)
Including: Ga ins and losses from changes in fair value of available-for-sale financial assets (3,711,727.44) 372,378,548.71 – – 372,378,548.71 – 368,666,821.27
Ex change differences arising on translation of financial statements denominated in foreign currencies 286,566,015.37 (1,396,421,199.62) – – (894,050,439.58) (502,370,760.04) (607,484,424.21)
Total of other comprehensive incomes 282,854,287.93 (1,024,042,650.91) – – (521,671,890.87) (502,370,760.04) (238,817,602.94)
40. Special reserve
Unit: RMB
Item Opening balance Increase in the year Decrease in the year Closing balance
2017:Safety production expense 8,570,089.43 122,559,476.97 123,403,655.61 7,725,910.79
Total 8,570,089.43 122,559,476.97 123,403,655.61 7,725,910.79
Item Opening balance Increase in the year Decrease in the year Closing balance
2016:Safety production expense 13,214,328.53 112,139,491.32 116,783,730.42 8,570,089.43Maintenance fee (Note) 101,986,347.03 – 101,986,347.03 –
Total 115,200,675.56 112,139,491.32 218,770,077.45 8,570,089.43
Note: In accordance with the actual production and operation situation of the Company in 2015, and combining the Cai Zi [2015] No. 8 Notice on Cancellation of Cost Standards for Simple Reproduction Maintenance of Metallurgical Mines issued by the Ministry of Finance ("Maintenance fee"), the Company decided not to make provisions for maintenance fee, and all the remaining amount has been utilized in 2016.

193China Molybdenum Co., Ltd.
NOTES TO THE FINANCIAL STATEMENTSFOR THE YEAR ENDED 31 DECEMBER 2017
(V) N O T E S T O T H E C O N S O L I D A T E D F I N A N C I A L S T A T E M E N T S (CONTINUED)
41. Surplus reserve
Unit: RMB
Item Opening balanceIncrease
in the yearDecrease
in the year Closing balance
2017:Statutory surplus reserve (Note) 840,098,875.14 128,091,820.96 – 968,190,696.10
Item Opening balanceIncrease
in the yearDecrease
in the year Closing balance
2016:Statutory surplus reserve (Note) 786,050,081.94 54,048,793.20 – 840,098,875.14
Note: In accordance with The Company Law of the PRC, the Company appropriated the statutory surplus reserve at 10% of the net profit of 2017, which amounts to RMB128,091,820.96 (2016:RMB54,048,793.20).
42. Retained profits
Unit: RMB
Item Current year Prior year
Retained profit at beginning of year 3,508,788,628.94 2,986,976,808.88Add: Ne t profit attributable to shareholders of the parent
company for the period 2,727,796,169.73 998,040,580.75Less: Appropriation to statutory surplus reserve (Note 1) 128,091,820.96 54,048,793.20Ordinary shares payable (Note 2) 591,051,954.47 422,179,967.49
Retained profit at ending of year 5,517,441,023.24 3,508,788,628.94
Note 1: See Note (V).41 for details.
Note 2: Cash dividend has been approved in shareholders’ meeting of the year.
As resolved at the Company’s 2016 annual general meeting on 14 April 2017, the Company distributed to all shareholders cash dividends of RMB0.035 per share, RMB591,051,954.47 in total (2016:RMB422,179,967.49).
Note 3: Profit distribution declared after the balance sheet date.
According to a proposal of the board of directors, on the basis of 21,599,240,583 issued shares (with the par value of RMB0.2 per share), dividends in cash of RMB0.076 per share (2016:RMB0.035) will be distributed to all the shareholders.

194 2017 Annual Report
NOTES TO THE FINANCIAL STATEMENTSFOR THE YEAR ENDED 31 DECEMBER 2017
(V) N O T E S T O T H E C O N S O L I D A T E D F I N A N C I A L S T A T E M E N T S (CONTINUED)
43. Operating income and operating costs
(1) Operating income
Unit: RMB
ItemAmount recognised in the current year Amount recognised in the prior year
Revenue Costs Revenue Costs
Principal operating activities 23,968,549,678.63 15,063,081,582.84 6,797,289,351.39 4,504,295,025.22Other operating activities 179,008,085.47 148,859,473.32 152,281,655.58 119,523,106.15
Total 24,147,557,764.10 15,211,941,056.16 6,949,571,006.97 4,623,818,131.37
(2) Principal operating activities (classified by products)
Unit: RMB
Name of productAmount recognised in the current year Amount recognised in the prior year
Operating revenue Operating costs Operating revenue Operating costs
Molybdenum, tungsten and related products 3,772,287,274.74 1,819,355,167.19 2,815,657,614.65 1,511,570,037.60
Niobium related products 1,670,081,521.37 1,251,484,058.05 410,653,115.36 306,579,395.96Phosphorus related products 2,834,185,561.20 2,462,084,175.50 729,610,629.70 584,775,039.30Copper, cobalt and related
products 13,844,637,480.60 8,302,165,519.84 1,296,146,914.20 996,305,846.03Copper, gold and relate
products 1,663,825,511.70 1,145,760,601.76 1,381,203,392.40 1,013,663,409.49Others 183,532,329.02 82,232,060.50 164,017,685.08 91,401,296.84
Total 23,968,549,678.63 15,063,081,582.84 6,797,289,351.39 4,504,295,025.22
195China Molybdenum Co., Ltd.
NOTES TO THE FINANCIAL STATEMENTSFOR THE YEAR ENDED 31 DECEMBER 2017
(V) N O T E S T O T H E C O N S O L I D A T E D F I N A N C I A L S T A T E M E N T S (CONTINUED)
44. Taxes and levies
Unit: RMB
Item
Amount recognised in
the current year
Amount recognised in the prior year
Basis of calculation
Business tax – 1,320,695.98 Note (IV)Urban maintenance and construction tax 21,469,899.93 15,369,301.85 Note (IV)Education surcharge 12,999,465.39 9,281,340.06 Note (IV)Resource tax 216,027,160.28 146,823,169.39 Note (IV)Others 93,831,297.23 57,514,902.73
Total 344,327,822.83 230,309,410.01
45. Selling expenses
Unit: RMB
Item
Amount recognised in
the current year
Amount recognised in the prior year
Salary, bonus and allowances 26,489,852.09 10,163,357.96Transportation costs 116,618,459.38 54,533,730.56Entertainment expenditures 1,320,860.78 1,221,282.19Traveling expense 4,192,316.11 1,273,943.85Market consulting fee 46,264,907.59 5,222,578.73Tax – 1,091,363.93Others 19,954,604.87 17,113,128.33
Total 214,841,000.82 90,619,385.55

196 2017 Annual Report
NOTES TO THE FINANCIAL STATEMENTSFOR THE YEAR ENDED 31 DECEMBER 2017
(V) N O T E S T O T H E C O N S O L I D A T E D F I N A N C I A L S T A T E M E N T S (CONTINUED)
46. Administrative expenses
Unit: RMB
Item
Amount recognised in
the current year
Amount recognised in the prior year
Salary, bonus and allowances 399,920,355.66 117,907,256.69Depreciation and amortization 62,040,131.73 40,631,473.27Consulting and agency fees 399,781,032.74 313,935,612.92Entertainment expenditures 20,355,164.32 9,333,079.39Technology development fees 101,793,771.63 109,001,290.10Others 175,203,564.65 123,926,020.52
Total 1,159,094,020.73 714,734,732.89
47. Financial expenses
Unit: RMB
Item
Amount recognised in
the current year
Amount recognised in the prior year
Interest expenses on bonds 180,002,333.16 203,559,581.20Discount interest of notes receivables 13,287,536.12 30,381,678.47Bank loans interest expenses 1,082,931,091.41 430,798,066.67Total interest expenses: 1,276,220,960.69 664,739,326.34Less: Interest income 765,373,154.74 452,742,920.56Exchange differences 389,913,901.81 19,329,692.30Gold lease charges 121,559,742.96 70,611,993.45Returns paid to BHR shareholders
(refer to Note (VII), 2 for details) 158,391,378.72 –Others 236,261,160.19 105,730,284.78
Total 1,416,973,989.63 407,668,376.31
197China Molybdenum Co., Ltd.
NOTES TO THE FINANCIAL STATEMENTSFOR THE YEAR ENDED 31 DECEMBER 2017
(V) N O T E S T O T H E C O N S O L I D A T E D F I N A N C I A L S T A T E M E N T S (CONTINUED)
48. Asset impairment losses
Unit: RMB
Item
Amount recognised in
the current year
Amount recognised in the prior year
Bad debt loss 8,257,801.11 28,651,800.99Impairment loss of inventories 31,148,265.10 30,251,987.60Impairment loss on fixed assets 17,195,483.55 1,193,936.69Impairment loss on available-for-sale financial assets – 291,757,534.75
Total 56,601,549.76 351,855,260.03
49. Gains (losses) from changes in fair values
Unit: RMB
Source resulting in gains (losses) from changes in fair values
Amount recognised in
the current year
Amount recognised in the prior year
1. Ga ins (Loss) from the changes in the fair values of forward foreign exchange contract (31,826,351.24) 51,131,410.27
2. Ga ins (Loss) from gold lease measured in fair value and changes in fair value of forward contract (15,636,470.00) (9,935,600.00)
3. Ga ins from changes in fair value of consumable biological assets 4,391,611.20 5,224,503.40
4. Lo ss on changes in fair value of the contingent consideration for the acquisition of Congo (DRC) copper-cobalt business ((Note (V), 20) (428,694,671.16) –
Total (471,765,881.20) 46,420,313.67
198 2017 Annual Report
NOTES TO THE FINANCIAL STATEMENTSFOR THE YEAR ENDED 31 DECEMBER 2017
(V) N O T E S T O T H E C O N S O L I D A T E D F I N A N C I A L S T A T E M E N T S (CONTINUED)
50. Investment income
(1) Details of investment income
Unit: RMB
Item
Amount recognised in
the current year
Amount recognised in the prior year
Income from long-term equity investments under equity method 30,173,577.43 7,210,716.74
Investment income from banks’ wealth investment product 2,308,688.30 94,793,860.23
Investment income on disposal of available-for-sale financial assets 121,636.46 92,667,004.11
Investment income (loss) on disposal of financial instruments at fair value through profit or loss 76,095,119.34 (3,736,797.34)
Derivatives not designated as hedging instruments – (16,752,200.00)
Total 108,699,021.53 174,182,583.74
(2) Income (loss) from long-term equity investments under equity method:
Unit: RMB
Investee
Amount recognised in
the current year
Amount recognised in the prior year
Reasons for change between this year and last year
Yulu Mining 108,165,269.84 70,969,591.46 The changes in profits of the invested company
Luoyang Shenyu (128,535.22) (185,887.81) The changes in profits of the invested company
High-Tech (11,666,790.31) (13,655,705.25) The changes in profits of the invested company
Huan Yu (66,196,366.88) (49,917,281.66) The changes in profits of the invested company
Total 30,173,577.43 7,210,716.74The changes in profits of the
invested company
There are no significant restrictions on remittance of investment income.
Investment income for both current and prior years is generated from the unlisted entities.
199China Molybdenum Co., Ltd.
NOTES TO THE FINANCIAL STATEMENTSFOR THE YEAR ENDED 31 DECEMBER 2017
(V) N O T E S T O T H E C O N S O L I D A T E D F I N A N C I A L S T A T E M E N T S (CONTINUED)
51. Other incomes
Unit: RMB
Item 2017 2016 Related to assets/profit
Special funds for the development of manufacturing industry 3,360,000.00 – Related to profit
Subsidies for reclamation of the land in Longwangmian village 1,426,249.03 – Related to profit
Government subsidies for stabilizing job posts 1,657,181.00 – Related to profit
Nannihu land transfer compensation 385,585.80 – Related to assets
Deferred income-subsidies for low-grade scheelite demonstration project 7,005,006.77 – Related to assets
Others 24,772.80 – Related to assets
Total 13,858,795.40 –
52. Non-operating income
(1) Details of non-operating income are as follows:
Unit: RMB
Item
Amount recognised in
the current year
Amount recognised in the prior year
Government grants 9,937,040.00 25,748,779.11Negative goodwill arising from business combination
not under common control (Note (VI),1) – 430,908,350.60Others 29,108,996.11 3,774,678.32
Total 39,046,036.11 460,431,808.03

200 2017 Annual Report
NOTES TO THE FINANCIAL STATEMENTSFOR THE YEAR ENDED 31 DECEMBER 2017
(V) N O T E S T O T H E C O N S O L I D A T E D F I N A N C I A L S T A T E M E N T S (CONTINUED)
52. Non-operating income (Continued)
(2) Details of major government grants
Unit: RMB
Item
Amount recognised in
the current year
Amount recognised in the prior year
Related to assets/Related to profit
Special funds for foreign trade development 6,596,500.00 – Related to profit
2016 direct debt financing subsidies 1,554,000.00 – Related to profit
Special rewards received for financial industry development 890,000.00 – Related to profit
Rewards for high-tech enterprises 200,000.00 – Related to profitSpecial subsidies for the
development of import and export enterprises 200,000.00 – Related to profit
Deferred income-subsidies for low-grade scheelite demonstration project – 1,171,234.66 Related to assets
Subsidy of the return of Nannihu land premium – 385,585.80 Related to assets
Subsidy of the return of the DongLin premium – – Related to assets
Subsidies of foreign investment – 6,000,000.00 Related to profitFund support for enterprise
technology center R & D platform – 1,000,000.00 Related to profitFinancial subsidies for Luanchuan
County 2015 annual preferential industry and mining – 14,759,809.85 Related to profit
Special funds for mineral resources conservation and comprehensive utilization – – Related to profit
Others 496,540.00 2,432,148.80
Total 9,937,040.00 25,748,779.11
53. Non-operating expenses
Unit: RMB
Item
Amount recognised in
the current year
Amount recognised in the prior year
External donations 29,235,336.57 21,906,318.90The losses of debt restructuring 48,000.00 499,687.98Others 5,024,724.73 4,823,737.96
Total 34,308,061.30 27,229,744.84

201China Molybdenum Co., Ltd.
NOTES TO THE FINANCIAL STATEMENTSFOR THE YEAR ENDED 31 DECEMBER 2017
(V) N O T E S T O T H E C O N S O L I D A T E D F I N A N C I A L S T A T E M E N T S (CONTINUED)
54. Income tax expenses
Unit: RMB
Item
Amount recognised in
the current year
Amount recognised in the prior year
Current tax expense calculated according to tax laws and relevant requirements 2,302,934,954.05 214,865,562.05
Differences arising on settlement of income tax for the previous year (12,353,243.77) (35,000,951.71)
Adjustments to deferred income tax (504,380,481.65) (8,961,755.04)
Total 1,786,201,228.63 170,902,855.30
Reconciliation of income tax expenses to the accounting profit is as follows:
Unit: RMB
Amount recognised in
the current year
Amount recognised in the prior year
Accounting profit 5,381,816,656.45 1,190,141,289.50Income tax expenses calculated at 15% (2016:15%) 807,272,498.48 178,521,193.43Tax impact of non-deductible expense 270,047,096.10 63,186,128.30Tax impact of tax free income/extra deductible expense (156,822,442.75) (30,576,347.31)Tax impact of negative goodwill arising from business
combination not under common control (Note VI) – (63,203,099.46)Tax impact of unrecognised deductible loss and deductible
difference 78,189,443.33 6,112,982.94Capital interest deductible before tax (Note 1) (4,486,490.63) (8,431,651.68)Impact of different tax rate in subsidiaries in other jurisdictions 804,354,367.87 60,294,600.79Difference arising on settlement of income tax for the previous
years (12,353,243.77) (35,000,951.71)
Total 1,786,201,228.63 170,902,855.30
Note 1: According to the local tax law of Brazil, enterprises can pay capital interest to their shareholders on a yearly basis, which can be deductible before tax, and the amount of interest is calculated based on the local long-term deposit rate of Brazil. The tax preferential policy is applicable to the Group's subsidiaries in Brazil.

202 2017 Annual Report
NOTES TO THE FINANCIAL STATEMENTSFOR THE YEAR ENDED 31 DECEMBER 2017
(V) N O T E S T O T H E C O N S O L I D A T E D F I N A N C I A L S T A T E M E N T S (CONTINUED)
55. Calculation process of basic earnings per share and diluted earnings per share
For the purpose of calculating basic earnings per share, net profit for the current attributable to ordinary shareholders is as follows:
Unit: RMB
Amount recognised in
the current year
Amount recognised in the prior year
Net profit attributable to ordinary shareholders for the current year 2,727,796,169.73 998,040,580.75
In calculating the basic earnings per share, the denominator is the weighted average number of the issued and outstanding ordinary shares and its calculation process is as follows:
Unit: RMB
Amount recognised in
the current year
Amount recognised in the prior year
Number of ordinary shares issued at the beginning of year 16,887,198,699.00 16,887,198,699.00Add: We ighted average number of ordinary shares issued during the
year 2,159,685,863.50 –
Weighted average number of ordinary shares issued at the end of year 19,046,884,562.50 16,887,198,699.00
Earnings per share:
Unit: RMB
Amount recognised in
the current year
Amount recognised in the prior year
Calculated based on net profit attributable to shareholders of the Company:
Basic earnings per share 0.14 0.06
Diluted earnings per share N/A N/A
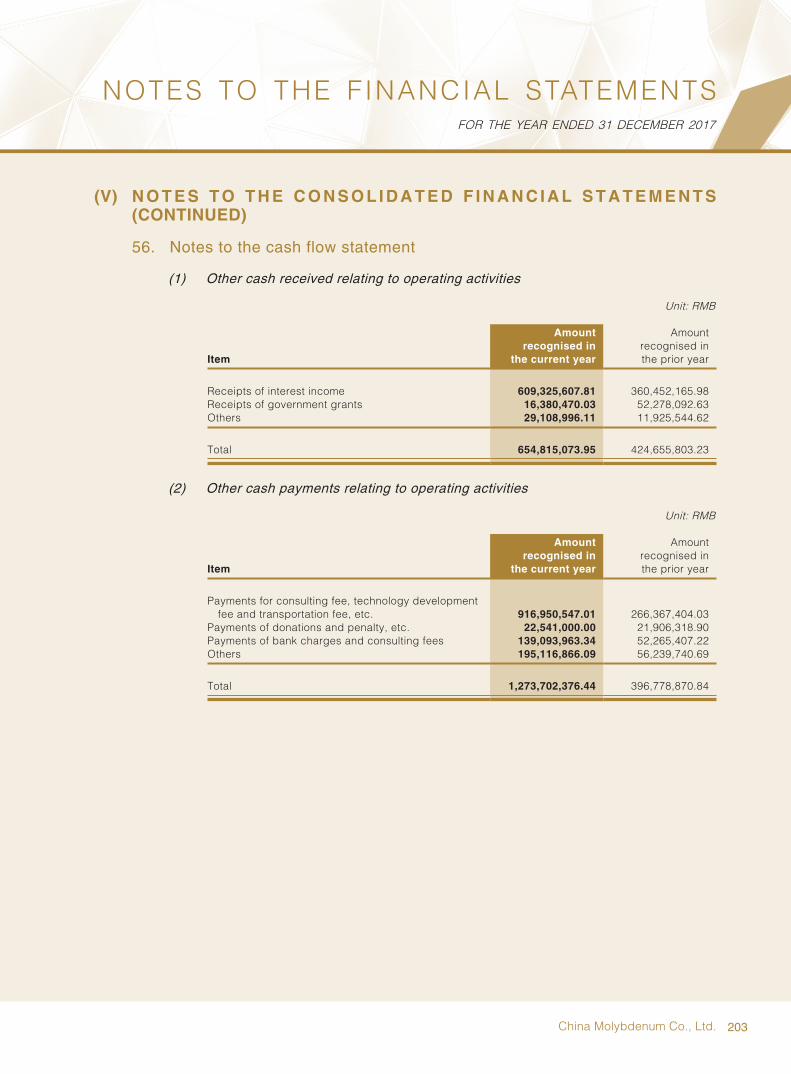
203China Molybdenum Co., Ltd.
NOTES TO THE FINANCIAL STATEMENTSFOR THE YEAR ENDED 31 DECEMBER 2017
(V) N O T E S T O T H E C O N S O L I D A T E D F I N A N C I A L S T A T E M E N T S (CONTINUED)
56. Notes to the cash flow statement
(1) Other cash received relating to operating activities
Unit: RMB
Item
Amount recognised in
the current year
Amount recognised in the prior year
Receipts of interest income 609,325,607.81 360,452,165.98Receipts of government grants 16,380,470.03 52,278,092.63Others 29,108,996.11 11,925,544.62
Total 654,815,073.95 424,655,803.23
(2) Other cash payments relating to operating activities
Unit: RMB
Item
Amount recognised in
the current year
Amount recognised in the prior year
Payments for consulting fee, technology development fee and transportation fee, etc. 916,950,547.01 266,367,404.03
Payments of donations and penalty, etc. 22,541,000.00 21,906,318.90Payments of bank charges and consulting fees 139,093,963.34 52,265,407.22Others 195,116,866.09 56,239,740.69
Total 1,273,702,376.44 396,778,870.84
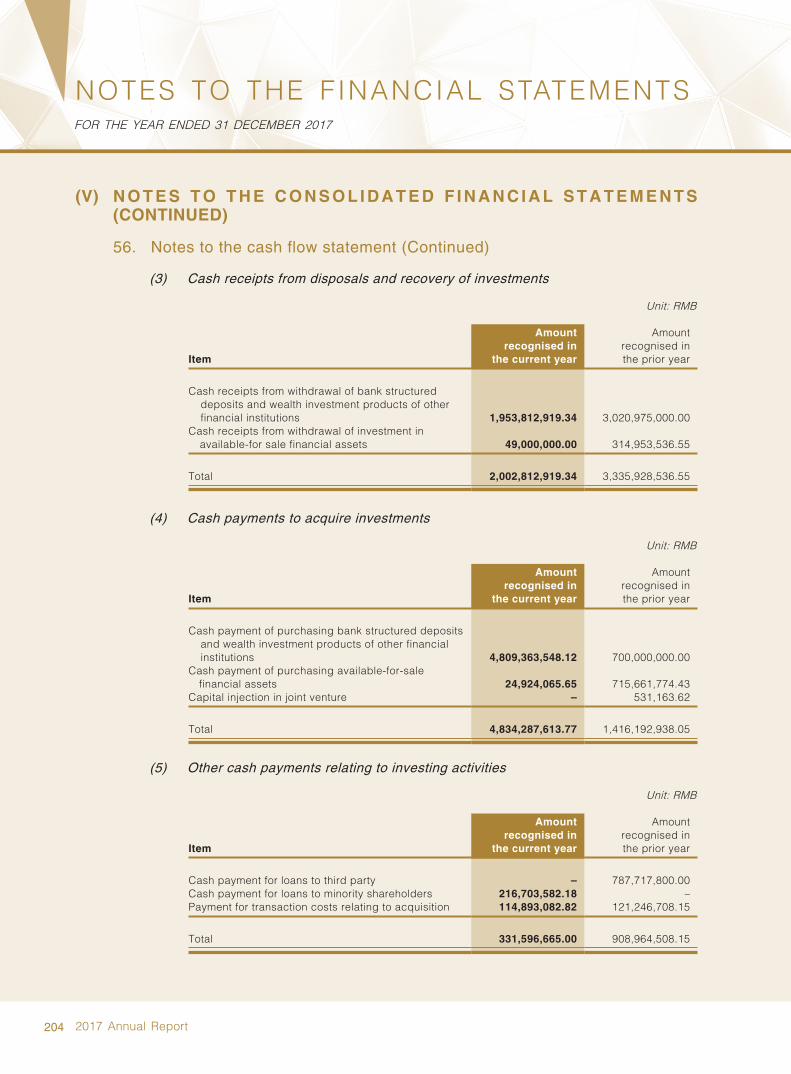
204 2017 Annual Report
NOTES TO THE FINANCIAL STATEMENTSFOR THE YEAR ENDED 31 DECEMBER 2017
(V) N O T E S T O T H E C O N S O L I D A T E D F I N A N C I A L S T A T E M E N T S (CONTINUED)
56. Notes to the cash flow statement (Continued)
(3) Cash receipts from disposals and recovery of investments
Unit: RMB
Item
Amount recognised in
the current year
Amount recognised in the prior year
Cash receipts from withdrawal of bank structured deposits and wealth investment products of other financial institutions 1,953,812,919.34 3,020,975,000.00
Cash receipts from withdrawal of investment in available-for sale financial assets 49,000,000.00 314,953,536.55
Total 2,002,812,919.34 3,335,928,536.55
(4) Cash payments to acquire investments
Unit: RMB
Item
Amount recognised in
the current year
Amount recognised in the prior year
Cash payment of purchasing bank structured deposits and wealth investment products of other financial institutions 4,809,363,548.12 700,000,000.00
Cash payment of purchasing available-for-sale financial assets 24,924,065.65 715,661,774.43
Capital injection in joint venture – 531,163.62
Total 4,834,287,613.77 1,416,192,938.05
(5) Other cash payments relating to investing activities
Unit: RMB
Item
Amount recognised in
the current year
Amount recognised in the prior year
Cash payment for loans to third party – 787,717,800.00Cash payment for loans to minority shareholders 216,703,582.18 –Payment for transaction costs relating to acquisition 114,893,082.82 121,246,708.15
Total 331,596,665.00 908,964,508.15

205China Molybdenum Co., Ltd.
NOTES TO THE FINANCIAL STATEMENTSFOR THE YEAR ENDED 31 DECEMBER 2017
(V) N O T E S T O T H E C O N S O L I D A T E D F I N A N C I A L S T A T E M E N T S (CONTINUED)
56. Notes to the cash flow statement (Continued)
(6) Other cash receipts relating to financing activities
Unit: RMB
Item
Amount recognised in
the current year
Amount recognised in the prior year
Cash receipts from gold lease business 1,485,196,100.00 2,657,694,450.00Cash receipts from borrowings of third party – 369,588,638.84
Total 1,485,196,100.00 3,027,283,088.84
(7) Other cash payments relating to financing activities
Unit: RMB
Item
Amount recognised in
the current year
Amount recognised in the prior year
Cash paid for gold leasing business 1,252,140,400.00 1,414,084,400.00Commission charge related to gold leasing business
and guarantee fees related to loans 115,773,372.12 52,859,234.92Borrowing guarantee deposit and arrangement fee 40,757,888.98 703,844,295.86Fixed remuneration paid to BHR shareholders 158,391,378.72 –Acquisition of minority interests in the scope of
consolidation (Note(VII), 2) 7,778,979,755.24 –
Total 9,346,042,795.06 2,170,787,930.78

206 2017 Annual Report
NOTES TO THE FINANCIAL STATEMENTSFOR THE YEAR ENDED 31 DECEMBER 2017
(V) N O T E S T O T H E C O N S O L I D A T E D F I N A N C I A L S T A T E M E N T S (CONTINUED)
57. Supplementary information to the cash flow statement
(1) Supplementary information to the cash flow statement
Unit: RMB
Supplementary informationAmount for
the current yearAmount for
the prior year
1. Re conciliation of net profit to cash flow from operating activities:
Net profit 3,595,615,427.82 1,019,238,434.20Add: Provision for impairment losses of assets 56,601,549.76 351,855,260.03
Depreciation of fixed assets 2,909,197,120.71 849,669,426.59Intangible asset amortization 1,721,443,177.74 310,442,825.66Amortisation of long-term deferred expenses 15,339,312.32 12,160,644.64Losses (gains) on disposal of fixed assets,
intangible assets and other long-term assets 17,491,578.26 (5,770,618.09)Losses (gains) on changes in fair values 471,765,881.20 (46,420,313.67)Financial expenses 1,647,814,579.44 809,518,440.05Gains arising from investments (108,699,021.53) (174,182,583.74)Increase in deferred tax assets (504,380,481.65) (8,961,755.04)Decrease in inventories (increase is filled in
column with “-”) (1,087,660,618.33) 75,367,539.54Decrease in receivables from operating activities
(increase is filled in column with “-”) (710,844,286.45) (552,911,412.77)Increase in payables from operating activities
(decrease is filled in column with “-”) 263,387,252.31 416,873,943.60Amortisation of deferred income (7,415,365.37) (25,748,779.11)Increase in special reserve (decrease is filled in
column with “-”) (844,178.64) (106,630,586.13)Decrease in restricted bank deposits (increase is
filled in column with “-”) 150,000,000.00 (9,674,029.71)Net cash flow from operating activities 8,428,811,927.59 2,914,826,436.05
2. Si gnificant investing and financing activities that do not involving cash:
3. Net changes in cash and cash equivalents:Closing balance of cash 19,781,418,278.86 8,420,208,068.29Less: Opening balance of cash 8,420,208,068.29 8,982,162,302.30Add: Closing balance of cash equivalents – –Less: Opening balance of cash equivalents – –Net increase (decrease) in cash and cash equivalents 11,361,210,210.57 (561,954,234.01)

207China Molybdenum Co., Ltd.
NOTES TO THE FINANCIAL STATEMENTSFOR THE YEAR ENDED 31 DECEMBER 2017
(V) N O T E S T O T H E C O N S O L I D A T E D F I N A N C I A L S T A T E M E N T S (CONTINUED)
57. Supplementary information to the cash flow statement (Continued)
(2) Constitution of cash and cash equivalents
Unit: RMB
Item Closing balance Opening balance
1. Cash 19,781,418,278.86 8,420,208,068.29Including: Cash on hand 1,045,556.05 1,120,248.17
Bank deposits always available for payment 19,780,372,722.81 8,419,087,820.12Other monetary funds always available for
payment – –2. Cash equivalents – –3. Closing balance of cash and cash equivalents 19,781,418,278.86 8,420,208,068.29
Cash and cash equivalents exclude restricted cash and cash equivalents of the Company and subsidiaries within the Group and cash and bank balances due over 3 months.
58. Foreign currency monetary items
(1) Foreign currency monetary items
Unit: RMB
Item
Closing balance denominated in
foreign currency Exchange rate
Closing balance of foreign currency
translated into RMB
Monetary assetsIncluding: RMB 1,810,197.11 1.0000 1,810,197.15
USD 23,442,347.54 6.5525 153,604,857.39EUR 4,295,407.48 7.8300 33,632,850.64HKD 4,353,119.70 0.8359 3,638,865.39CAD 1,164,364.20 5.1903 6,043,439.72AUD 8,688,014.51 5.0967 44,279,995.04BRL 58,885,312.80 1.9753 116,314,515.01GBP 508,000.00 8.8153 4,478,168.21CDF 18,452,376.40 0.0041 75,598.34
Non-current liabilities due within one yearIncluding: EUR 231,000,000.00 7.8247 1,807,517,243.34

208 2017 Annual Report
NOTES TO THE FINANCIAL STATEMENTSFOR THE YEAR ENDED 31 DECEMBER 2017
(V) N O T E S T O T H E C O N S O L I D A T E D F I N A N C I A L S T A T E M E N T S (CONTINUED)
58. Foreign currency monetary items (Continued)
(2) Functional currency for significant overseas operations
Name of subsidiaries
The main operating location abroad
Functional currency Basis of choice
Copebras Indústria Ltda. Brazil BRL According to the primary economic environment
Niobras Mineração Ltda. Brazil USD According to the primary economic environment
COMC Brazil Brazil USD According to the primary economic environment
COMC Luxembourg Luxembourg USD According to the primary economic environment
CMOC Mining Pty Limited Australia USD According to the primary economic environment
CMOC Mining Services Pty. Limited
Australia USD According to the primary economic environment
CMOC International DRC Holdings Limited
Bermuda USD According to the primary economic environment
TF Holdings Limited Bermuda USD According to the primary economic environment
Tenke Fungurume Mining S.A. DRC USD According to the primary economic environment
Purveyors South Africa Mine Services CMOC
Republic of South Africa
USD According to the primary economic environment
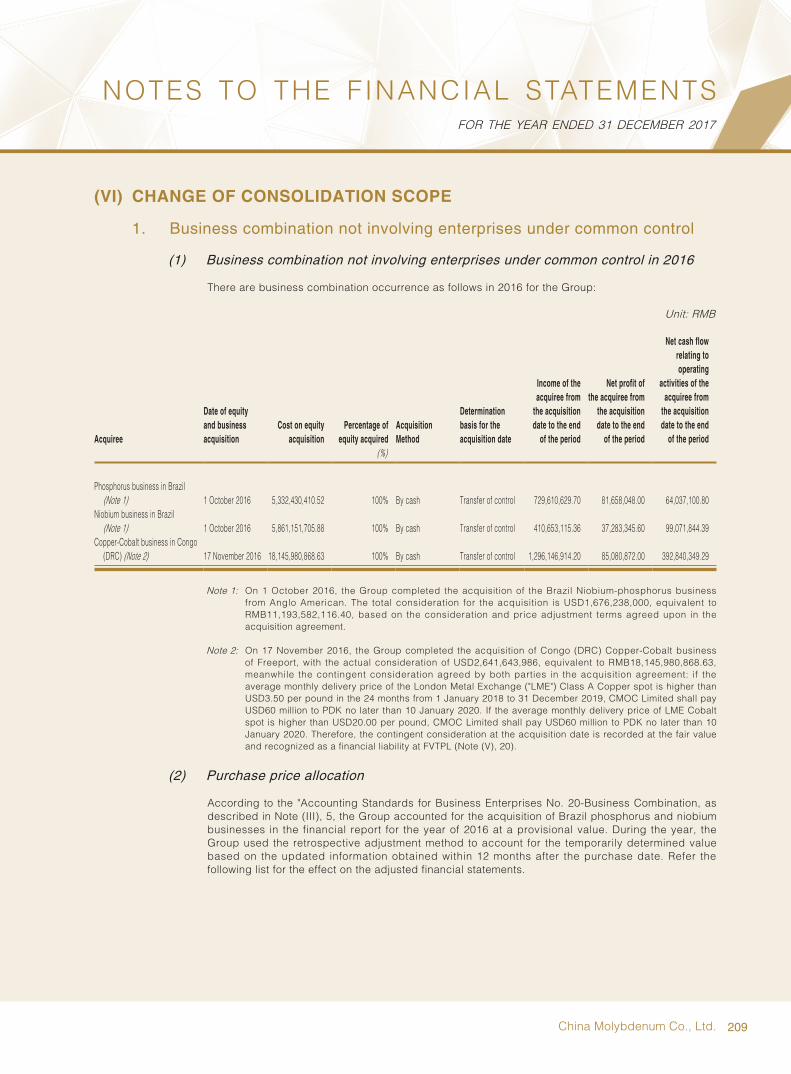
209China Molybdenum Co., Ltd.
NOTES TO THE FINANCIAL STATEMENTSFOR THE YEAR ENDED 31 DECEMBER 2017
(VI) CHANGE OF CONSOLIDATION SCOPE
1. Business combination not involving enterprises under common control
(1) Business combination not involving enterprises under common control in 2016
There are business combination occurrence as follows in 2016 for the Group:
Unit: RMB
Acquiree
Date of equity and business acquisition
Cost on equity acquisition
Percentage of equity acquired
Acquisition Method
Determination basis for the acquisition date
Income of the acquiree from
the acquisition date to the end
of the period
Net profit of the acquiree from
the acquisition date to the end
of the period
Net cash flow relating to operating
activities of the acquiree from
the acquisition date to the end
of the period(%)
Phosphorus business in Brazil (Note 1) 1 October 2016 5,332,430,410.52 100% By cash Transfer of control 729,610,629.70 81,658,048.00 64,037,100.80
Niobium business in Brazil (Note 1) 1 October 2016 5,861,151,705.88 100% By cash Transfer of control 410,653,115.36 37,283,345.60 99,071,844.39
Copper-Cobalt business in Congo (DRC) (Note 2) 17 November 2016 18,145,980,868.63 100% By cash Transfer of control 1,296,146,914.20 85,080,872.00 392,840,349.29
Note 1: On 1 October 2016, the Group completed the acquisition of the Brazil Niobium-phosphorus business from Anglo American. The total consideration for the acquisition is USD1,676,238,000, equivalent to RMB11,193,582,116.40, based on the consideration and price adjustment terms agreed upon in the acquisition agreement.
Note 2: On 17 November 2016, the Group completed the acquisition of Congo (DRC) Copper-Cobalt business of Freeport, with the actual consideration of USD2,641,643,986, equivalent to RMB18,145,980,868.63, meanwhile the contingent consideration agreed by both parties in the acquisition agreement: if the average monthly delivery price of the London Metal Exchange ("LME") Class A Copper spot is higher than USD3.50 per pound in the 24 months from 1 January 2018 to 31 December 2019, CMOC Limited shall pay USD60 million to PDK no later than 10 January 2020. If the average monthly delivery price of LME Cobalt spot is higher than USD20.00 per pound, CMOC Limited shall pay USD60 million to PDK no later than 10 January 2020. Therefore, the contingent consideration at the acquisition date is recorded at the fair value and recognized as a financial liability at FVTPL (Note (V), 20).
(2) Purchase price allocation
According to the "Accounting Standards for Business Enterprises No. 20-Business Combination, as described in Note (III), 5, the Group accounted for the acquisition of Brazil phosphorus and niobium businesses in the financial report for the year of 2016 at a provisional value. During the year, the Group used the retrospective adjustment method to account for the temporarily determined value based on the updated information obtained within 12 months after the purchase date. Refer the following list for the effect on the adjusted financial statements.

210 2017 Annual Report
NOTES TO THE FINANCIAL STATEMENTSFOR THE YEAR ENDED 31 DECEMBER 2017
(VI) CHANGE OF CONSOLIDATION SCOPE (CONTINUED)
1. Business combination not involving enterprises under common control (Continued)
(2) Purchase price allocation (Continued)
Phosphorus business in Brazil Niobium business in Brazil Copper-cobalt business in Congo (DRC)Acquisition date Acquisition date Acquisition date Acquisition date Acquisition date Acquisition date
Book value Fair value Book value fair value Book value fair value
Cash and bank balances 265,662,917.40 265,662,917.40 698,157,312.20 698,157,312.20 522,079,574.05 522,079,574.05Accounts receivable 461,349,168.60 461,349,168.60 143,899,912.20 143,899,912.20 386,358,154.00 386,358,154.00Other receivables 58,203,704.80 58,203,704.80 1,689,483.40 1,689,483.40 866,223,293.00 866,223,293.00Inventories 455,993,573.00 455,993,573.00 422,457,661.40 422,457,661.40 7,528,086,794.80 7,528,086,794.80Prepayments – – – – 100,990,772.32 100,990,772.32Other current assets – – 16,146,920.40 16,146,920.40 – –Fixed assets 1,047,506,419.20 2,067,153,056.80 3,307,360,750.60 3,160,602,740.00 15,425,668,544.52 16,803,551,564.24Construction in progress 154,998,415.80 154,998,415.80 288,554,415.80 288,554,415.80 484,182,431.20 484,182,431.20Intangible assets 12,247,085.20 3,315,814,845.40 919,720,038.40 1,511,021,084.03 346,832,777.20 15,508,215,034.00Deferred tax assets – – 65,375,662.00 115,272,183.60 113,960.03 113,960.03Other non-current assets 206,197,108.40 378,370,825.80 94,150,302.20 111,552,649.00 1,700,353,683.60 1,700,353,683.60
Subtotal of assets 2,662,158,392.40 7,157,546,507.60 5,957,512,458.60 6,469,354,362.03 27,360,889,984.72 43,900,155,261.24
Accounts payable 223,663,158.40 223,663,158.40 84,129,999.20 84,129,999.20 344,275,992.27 344,275,992.27Other payables 1,689,483.40 1,689,483.40 30,971,636.40 30,971,636.40 189,465,930.94 877,760,266.46Employee benefits
payable 97,726,000.00 97,726,000.00 33,706,459.60 33,706,459.60 105,188,059.60 105,188,059.60Taxes payable 71,432,426.60 71,432,426.60 – –Deferred tax liabilities 22,744,586.80 1,492,635,211.60 – 173,382,497.920 3,167,010,314.00 8,128,789,748.30Other non-current
liabilities 401,301,992.00 941,930,002.20 2,243,740,800.00 2,243,740,800.00 178,537,377.20 178,537,377.20Provisions 230,685,000.00 230,685,000.00 1,442,164,399.20 286,012,063.03 558,328,576.00 558,328,576.00
Subtotal of liabilities 1,049,242,647.20 3,05 9,761,282.20 3,834,713,294.40 2,851,943,456.15 4,542,806,250.01 10,192,880,019.83

211China Molybdenum Co., Ltd.
NOTES TO THE FINANCIAL STATEMENTSFOR THE YEAR ENDED 31 DECEMBER 2017
(VI) CHANGE OF CONSOLIDATION SCOPE (CONTINUED)
1. Business combination not involving enterprises under common control (Continued)
(2) Purchase price allocation (Continued)
Phosphorus business in Brazil Niobium business in Brazil Copper-cobalt business in Congo (DRC)Acquisition date Acquisition date Acquisition date Acquisition date Acquisition date Acquisition date
Book value Fair value Book value fair value Book value fair value
Net Assets 1,612,915,745.20 4,097,785,225.40 2,122,799,164.20 3,617,410,905.88 22,818,083,734.71 33,707,275,241.41Less: Minority interests – – – – 8,117,374,855.20 15,130,386,022.18Acquired net assets 1,612,915,745.20 4,097,785,225.40 2,122,799,164.20 3,617,410,905.88 14,700,708,879.51 18,576,889,219.23Creditor's rights acquired
in Brazil Phosphorus and Niobium businesses (Note 1) – 383,973,500.00 – 2,243,740,800.00 – –
Total assets acquired – 4,481,758,725.40 – 5,861,151,705.88 – 18,576,889,219.23
Total consideration – 5,332,430,410.52 – 5,861,151,705.88 – 18,145,980,868.63
Including: Cash consideration (Note 2) – 5,332,430,410.52 – 5,861,151,705.88 – 18,100,822,747.83
Contingent consideration – – – – – 45,158,120.80The amount that
the goodwill/combination cost is less than the acquired interest in the fair value of identifiable assets – 850,671,685.12 – – – (430,908,350.60)
Note 1: Pursuant to the acquisition agreement, the Group assumed creditor's rights of US $57,500,000.00 (equivalent to RMB383,973,500.00) and US $336,000,000.00 (equivalent to RMB2,243,740,800.00) in Brazil Phosphate and Niobium businesses from the Anglo American during the acquisition of the Phosphorus and Niobium businesses.
Note 2: The cash consideration has been deducted from the price adjustments based on the actual settlement and seller's compensation.
Note 3: The fair value of the identifiable assets and liabilities of the Niobium and Phosphorus Business in Brazil and the Copper and Cobalt Business in Congo DRC are measured by way of the replacement cost method and the multi-period excess return method determined by the valuation results of the independent valuer, Censere Holdings Limited. Among the fair value of the identifiable assets and liabilities at the date of purchase, except for the monetary assets are measured at the first level of fair value, the accounts receivable, other receivables, inventories, fixed assets, construction in progress, intangible assets, other non-current assets, accounts payable, other payables, other non-current liabilities and provision are measured at the second level of fair value.
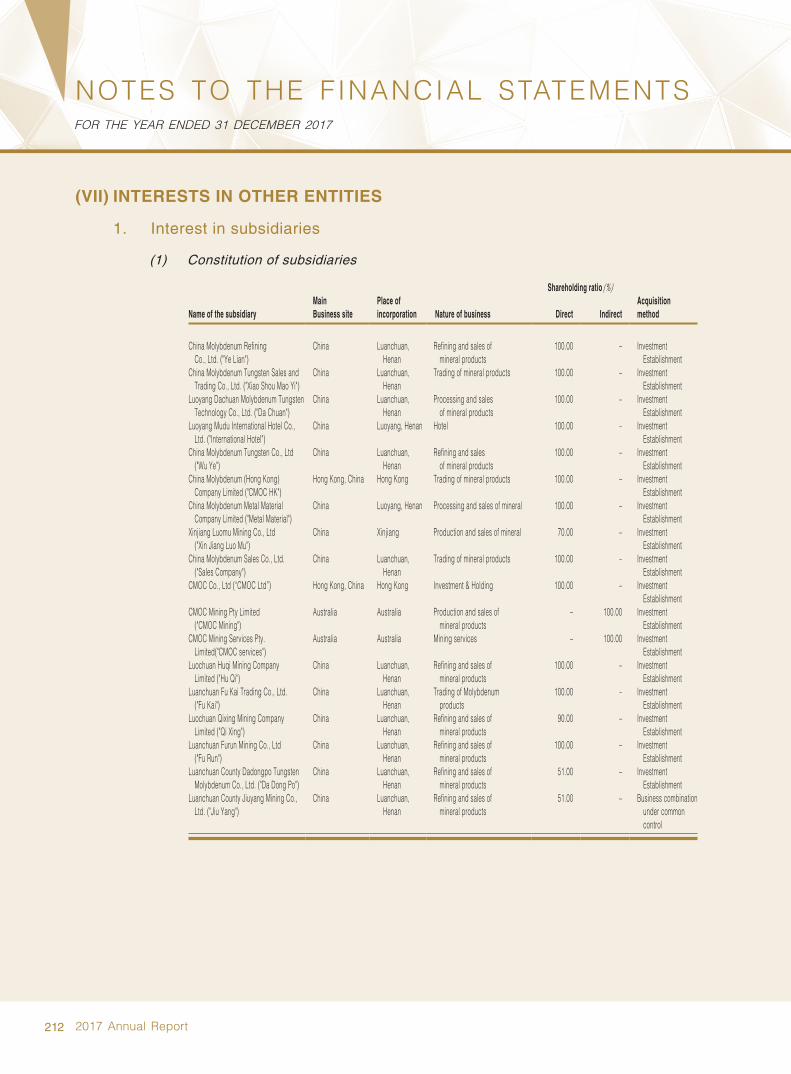
212 2017 Annual Report
NOTES TO THE FINANCIAL STATEMENTSFOR THE YEAR ENDED 31 DECEMBER 2017
(VII) INTERESTS IN OTHER ENTITIES
1. Interest in subsidiaries
(1) Constitution of subsidiaries
Shareholding ratio (%)
Name of the subsidiaryMain Business site
Place of incorporation Nature of business Direct Indirect
Acquisition method
China Molybdenum Refining Co., Ltd. ("Ye Lian")
China Luanchuan, Henan
Refining and sales of mineral products
100.00 – Investment Establishment
China Molybdenum Tungsten Sales and Trading Co., Ltd. ("Xiao Shou Mao Yi")
China Luanchuan, Henan
Trading of mineral products 100.00 – Investment Establishment
Luoyang Dachuan Molybdenum Tungsten Technology Co., Ltd. ("Da Chuan")
China Luanchuan, Henan
Processing and sales of mineral products
100.00 – Investment Establishment
Luoyang Mudu International Hotel Co., Ltd. ("International Hotel")
China Luoyang, Henan Hotel 100.00 – Investment Establishment
China Molybdenum Tungsten Co., Ltd ("Wu Ye")
China Luanchuan, Henan
Refining and sales of mineral products
100.00 – Investment Establishment
China Molybdenum (Hong Kong) Company Limited ("CMOC HK")
Hong Kong, China Hong Kong Trading of mineral products 100.00 – Investment Establishment
China Molybdenum Metal Material Company Limited ("Metal Material")
China Luoyang, Henan Processing and sales of mineral 100.00 – Investment Establishment
Xinjiang Luomu Mining Co., Ltd ("Xin Jiang Luo Mu")
China Xinjiang Production and sales of mineral 70.00 – Investment Establishment
China Molybdenum Sales Co., Ltd. ("Sales Company")
China Luanchuan, Henan
Trading of mineral products 100.00 – Investment Establishment
CMOC Co., Ltd (“CMOC Ltd”) Hong Kong, China Hong Kong Investment & Holding 100.00 – Investment Establishment
CMOC Mining Pty Limited ("CMOC Mining")
Australia Australia Production and sales of mineral products
– 100.00 Investment Establishment
CMOC Mining Services Pty. Limited("CMOC services")
Australia Australia Mining services – 100.00 Investment Establishment
Luochuan Huqi Mining Company Limited ("Hu Qi")
China Luanchuan, Henan
Refining and sales of mineral products
100.00 – Investment Establishment
Luanchuan Fu Kai Trading Co., Ltd. ("Fu Kai")
China Luanchuan, Henan
Trading of Molybdenum products
100.00 – Investment Establishment
Luochuan Qixing Mining Company Limited ("Qi Xing")
China Luanchuan, Henan
Refining and sales of mineral products
90.00 – Investment Establishment
Luanchuan Furun Mining Co., Ltd ("Fu Run")
China Luanchuan, Henan
Refining and sales of mineral products
100.00 – Investment Establishment
Luanchuan County Dadongpo Tungsten Molybdenum Co., Ltd. ("Da Dong Po")
China Luanchuan, Henan
Refining and sales of mineral products
51.00 – Investment Establishment
Luanchuan County Jiuyang Mining Co., Ltd. ("Jiu Yang")
China Luanchuan, Henan
Refining and sales of mineral products
51.00 – Business combination under common control
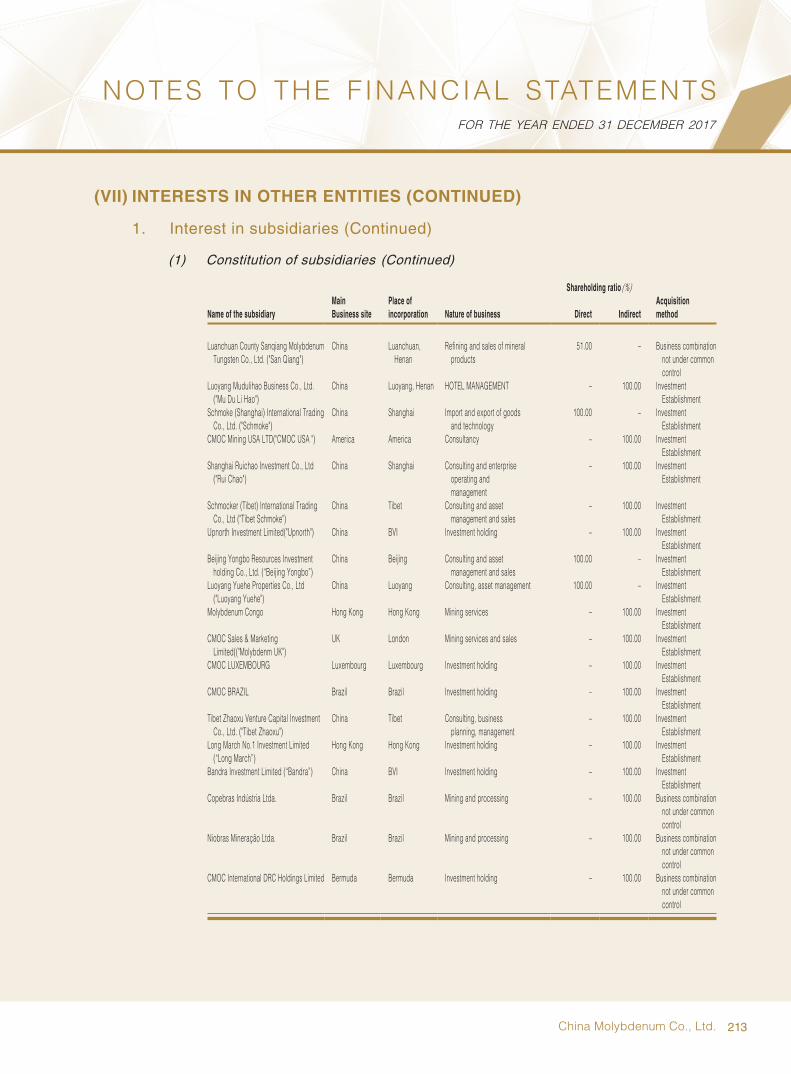
213China Molybdenum Co., Ltd.
NOTES TO THE FINANCIAL STATEMENTSFOR THE YEAR ENDED 31 DECEMBER 2017
(VII) INTERESTS IN OTHER ENTITIES (CONTINUED)
1. Interest in subsidiaries (Continued)
(1) Constitution of subsidiaries (Continued)
Shareholding ratio (%)
Name of the subsidiaryMain Business site
Place of incorporation Nature of business Direct Indirect
Acquisition method
Luanchuan County Sanqiang Molybdenum Tungsten Co., Ltd. ("San Qiang")
China Luanchuan, Henan
Refining and sales of mineral products
51.00 – Business combination not under common control
Luoyang Mudulihao Business Co., Ltd. ("Mu Du Li Hao")
China Luoyang, Henan HOTEL MANAGEMENT – 100.00 Investment Establishment
Schmoke (Shanghai) International Trading Co., Ltd. ("Schmoke")
China Shanghai Import and export of goods and technology
100.00 – Investment Establishment
CMOC Mining USA LTD("CMOC USA ") America America Consultancy – 100.00 Investment Establishment
Shanghai Ruichao Investment Co., Ltd ("Rui Chao")
China Shanghai Consulting and enterprise operating and management
– 100.00 Investment Establishment
Schmocker (Tibet) International Trading Co., Ltd ("Tibet Schmoke")
China Tibet Consulting and asset management and sales
– 100.00 Investment Establishment
Upnorth Investment Limited("Upnorth") China BVI Investment holding – 100.00 Investment Establishment
Beijing Yongbo Resources Investment holding Co., Ltd. (“Beijing Yongbo”)
China Beijing Consulting and asset management and sales
100.00 – Investment Establishment
Luoyang Yuehe Properties Co., Ltd ("Luoyang Yuehe")
China Luoyang Consulting, asset management 100.00 – Investment Establishment
Molybdenum Congo Hong Kong Hong Kong Mining services – 100.00 Investment Establishment
CMOC Sales & Marketing Limited(("Molybdenm UK")
UK London Mining services and sales – 100.00 Investment Establishment
CMOC LUXEMBOURG Luxembourg Luxembourg Investment holding – 100.00 Investment Establishment
CMOC BRAZIL Brazil Brazil Investment holding – 100.00 Investment Establishment
Tibet Zhaoxu Venture Capital Investment Co., Ltd. ("Tibet Zhaoxu")
China Tibet Consulting, business planning, management
– 100.00 Investment Establishment
Long March No.1 Investment Limited (“Long March”)
Hong Kong Hong Kong Investment holding – 100.00 Investment Establishment
Bandra Investment Limited (“Bandra”) China BVI Investment holding – 100.00 Investment Establishment
Copebras Indústria Ltda. Brazil Brazil Mining and processing – 100.00 Business combination not under common control
Niobras Mineração Ltda. Brazil Brazil Mining and processing – 100.00 Business combination not under common control
CMOC International DRC Holdings Limited Bermuda Bermuda Investment holding – 100.00 Business combination not under common control

214 2017 Annual Report
NOTES TO THE FINANCIAL STATEMENTSFOR THE YEAR ENDED 31 DECEMBER 2017
(VII) INTERESTS IN OTHER ENTITIES (CONTINUED)
1. Interest in subsidiaries (Continued)
(1) Constitution of subsidiaries (Continued)
Shareholding ratio (%)
Name of the subsidiaryMain Business site
Place of incorporation Nature of business Direct Indirect
Acquisition method
TFHL Bermuda Bermuda Investment holding – 100.00 Business combination not under common control
TFM Congo (DRC) Congo (DRC) Mining and processing – 80.00 Business combination not under common control
Purveyors South Africa Mine Services CMOC ("CMOC South Africa")
The Republic of South Africa
The Republic of South Africa
Transportation – 100.00 Business combination not under common control
Oriental Red Investments Limited Virgin Islands, British
Virgin Islands, British
Investment holding – 100.00 Investment Establishment
Natural Resource Elite Investment Limited (“NREIL”) (Note 1)
Hong Kong Hong Kong Investment holding – 100.00 Investment Establishment
BHR (Note (VII).2) Virgin Islands, British
Virgin Islands, British
Investment holding – 100.00 Control according to agreement
Note 1: These subsidiaries are newly established by the Group during the year.
(2) Significant non-wholly owned subsidiaries
Unit: RMB
Name of the subsidiary
Minority shareholder’s
shareholding ratio
Profit or loss attributable to minority interests in the current period
Dividends distributed to minority shareholder in the current period
Closing balance of minority interests
(%)
TFM 20% 633,734,890.10 – 4,624,552,200.77
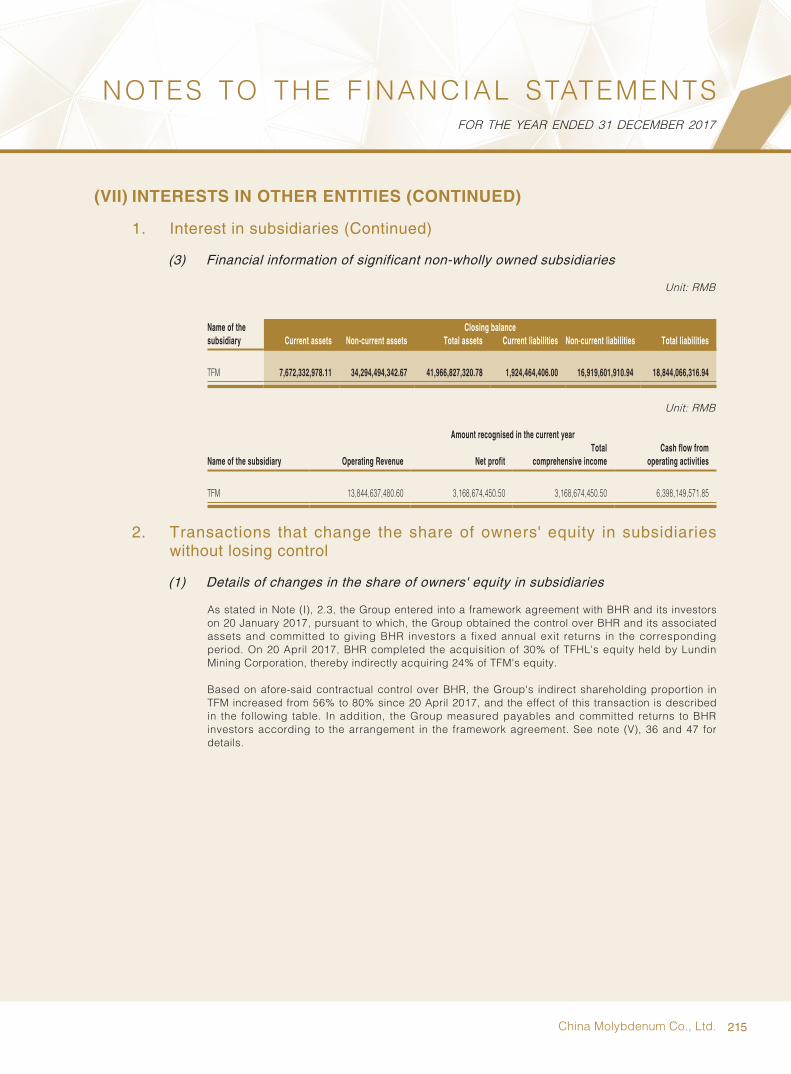
215China Molybdenum Co., Ltd.
NOTES TO THE FINANCIAL STATEMENTSFOR THE YEAR ENDED 31 DECEMBER 2017
(VII) INTERESTS IN OTHER ENTITIES (CONTINUED)
1. Interest in subsidiaries (Continued)
(3) Financial information of significant non-wholly owned subsidiaries
Unit: RMB
Name of the subsidiary
Closing balanceCurrent assets Non-current assets Total assets Current liabilities Non-current liabilities Total liabilities
TFM 7,672,332,978.11 34,294,494,342.67 41,966,827,320.78 1,924,464,406.00 16,919,601,910.94 18,844,066,316.94
Unit: RMB
Name of the subsidiary
Amount recognised in the current year
Operating Revenue Net profitTotal
comprehensive incomeCash flow from
operating activities
TFM 13,844,637,480.60 3,168,674,450.50 3,168,674,450.50 6,398,149,571.85
2. Transactions that change the share of owners' equity in subsidiaries without losing control
(1) Details of changes in the share of owners' equity in subsidiaries
As stated in Note (I), 2.3, the Group entered into a framework agreement with BHR and its investors on 20 January 2017, pursuant to which, the Group obtained the control over BHR and its associated assets and committed to giving BHR investors a fixed annual exit returns in the corresponding period. On 20 April 2017, BHR completed the acquisition of 30% of TFHL's equity held by Lundin Mining Corporation, thereby indirectly acquiring 24% of TFM's equity.
Based on afore-said contractual control over BHR, the Group's indirect shareholding proportion in TFM increased from 56% to 80% since 20 April 2017, and the effect of this transaction is described in the following table. In addition, the Group measured payables and committed returns to BHR investors according to the arrangement in the framework agreement. See note (V), 36 and 47 for details.
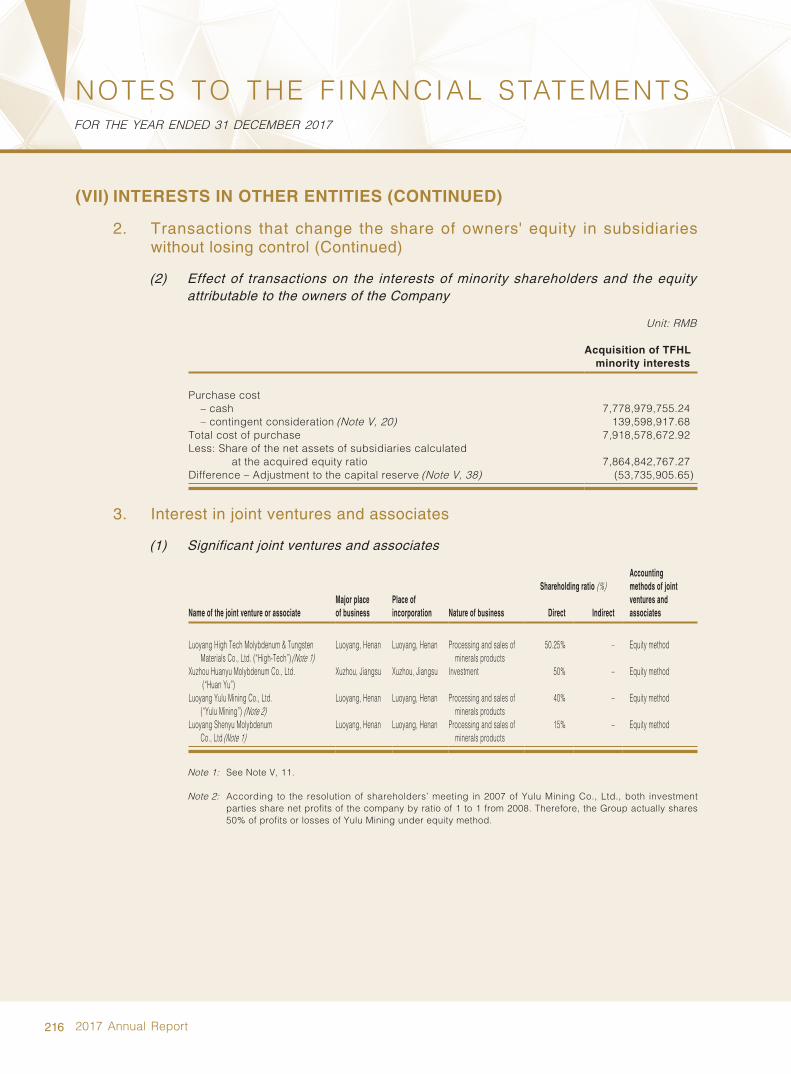
216 2017 Annual Report
NOTES TO THE FINANCIAL STATEMENTSFOR THE YEAR ENDED 31 DECEMBER 2017
(VII) INTERESTS IN OTHER ENTITIES (CONTINUED)
2. Transactions that change the share of owners' equity in subsidiaries without losing control (Continued)
(2) Effect of transactions on the interests of minority shareholders and the equity attributable to the owners of the Company
Unit: RMB
Acquisition of TFHL minority interests
Purchase cost– cash 7,778,979,755.24– contingent consideration (Note V, 20) 139,598,917.68
Total cost of purchase 7,918,578,672.92Less: Sh are of the net assets of subsidiaries calculated
at the acquired equity ratio 7,864,842,767.27Difference – Adjustment to the capital reserve (Note V, 38) (53,735,905.65)
3. Interest in joint ventures and associates
(1) Significant joint ventures and associates
Name of the joint venture or associateMajor place of business
Place of incorporation Nature of business
Shareholding ratio (%)Accounting methods of joint ventures and associatesDirect Indirect
Luoyang High Tech Molybdenum & Tungsten Materials Co., Ltd. (“High-Tech”) (Note 1)
Luoyang, Henan Luoyang, Henan Processing and sales of minerals products
50.25% – Equity method
Xuzhou Huanyu Molybdenum Co., Ltd. (“Huan Yu”)
Xuzhou, Jiangsu Xuzhou, Jiangsu Investment 50% – Equity method
Luoyang Yulu Mining Co., Ltd. (“Yulu Mining”) (Note 2)
Luoyang, Henan Luoyang, Henan Processing and sales of minerals products
40% – Equity method
Luoyang Shenyu Molybdenum Co., Ltd (Note 1)
Luoyang, Henan Luoyang, Henan Processing and sales of minerals products
15% – Equity method
Note 1: See Note V, 11.
Note 2: According to the resolution of shareholders’ meeting in 2007 of Yulu Mining Co., Ltd., both investment parties share net profits of the company by ratio of 1 to 1 from 2008. Therefore, the Group actually shares 50% of profits or losses of Yulu Mining under equity method.
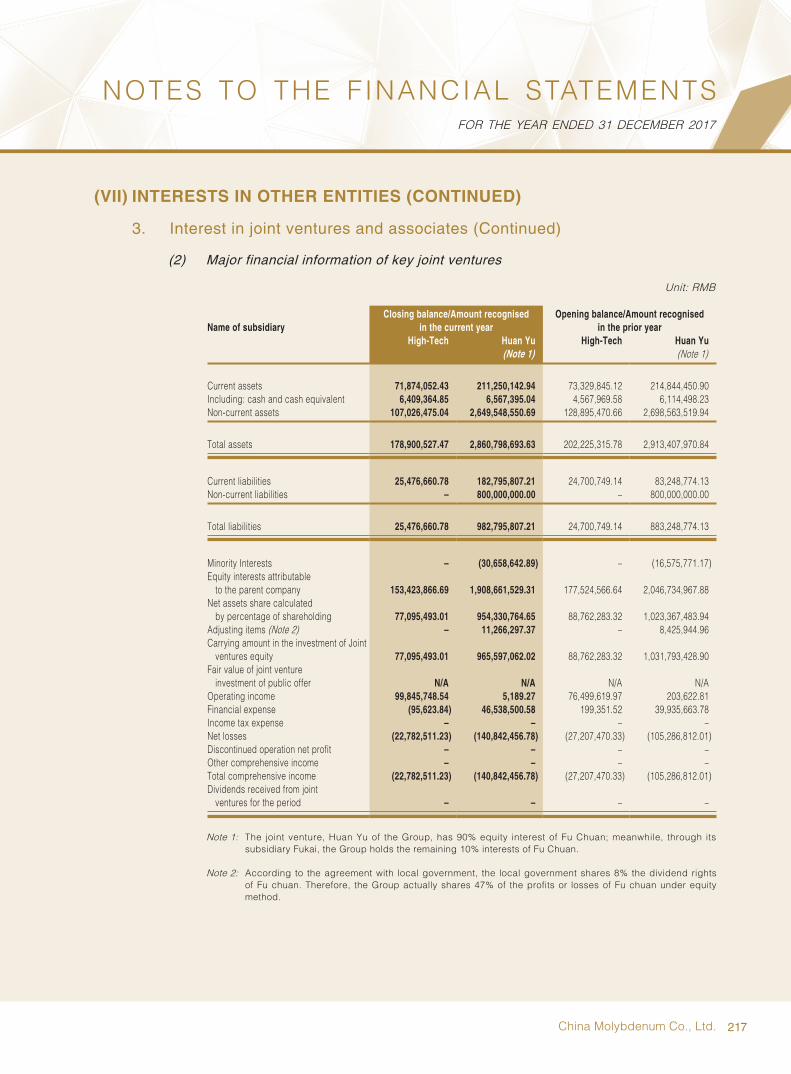
217China Molybdenum Co., Ltd.
NOTES TO THE FINANCIAL STATEMENTSFOR THE YEAR ENDED 31 DECEMBER 2017
(VII) INTERESTS IN OTHER ENTITIES (CONTINUED)
3. Interest in joint ventures and associates (Continued)
(2) Major financial information of key joint ventures
Unit: RMB
Name of subsidiaryClosing balance/Amount recognised
in the current yearOpening balance/Amount recognised
in the prior year High-Tech Huan Yu High-Tech Huan Yu
(Note 1) (Note 1)
Current assets 71,874,052.43 211,250,142.94 73,329,845.12 214,844,450.90Including: cash and cash equivalent 6,409,364.85 6,567,395.04 4,567,969.58 6,114,498.23Non-current assets 107,026,475.04 2,649,548,550.69 128,895,470.66 2,698,563,519.94
Total assets 178,900,527.47 2,860,798,693.63 202,225,315.78 2,913,407,970.84
Current liabilities 25,476,660.78 182,795,807.21 24,700,749.14 83,248,774.13Non-current liabilities – 800,000,000.00 – 800,000,000.00
Total liabilities 25,476,660.78 982,795,807.21 24,700,749.14 883,248,774.13
Minority Interests – (30,658,642.89) – (16,575,771.17)Equity interests attributable
to the parent company 153,423,866.69 1,908,661,529.31 177,524,566.64 2,046,734,967.88Net assets share calculated
by percentage of shareholding 77,095,493.01 954,330,764.65 88,762,283.32 1,023,367,483.94Adjusting items (Note 2) – 11,266,297.37 – 8,425,944.96Carrying amount in the investment of Joint
ventures equity 77,095,493.01 965,597,062.02 88,762,283.32 1,031,793,428.90Fair value of joint venture
investment of public offer N/A N/A N/A N/AOperating income 99,845,748.54 5,189.27 76,499,619.97 203,622.81Financial expense (95,623.84) 46,538,500.58 199,351.52 39,935,663.78Income tax expense – – – –Net losses (22,782,511.23) (140,842,456.78) (27,207,470.33) (105,286,812.01)Discontinued operation net profit – – – –Other comprehensive income – – – –Total comprehensive income (22,782,511.23) (140,842,456.78) (27,207,470.33) (105,286,812.01)Dividends received from joint
ventures for the period – – – –
Note 1: The joint venture, Huan Yu of the Group, has 90% equity interest of Fu Chuan; meanwhile, through its subsidiary Fukai, the Group holds the remaining 10% interests of Fu Chuan.
Note 2: According to the agreement with local government, the local government shares 8% the dividend rights of Fu chuan. Therefore, the Group actually shares 47% of the profits or losses of Fu chuan under equity method.
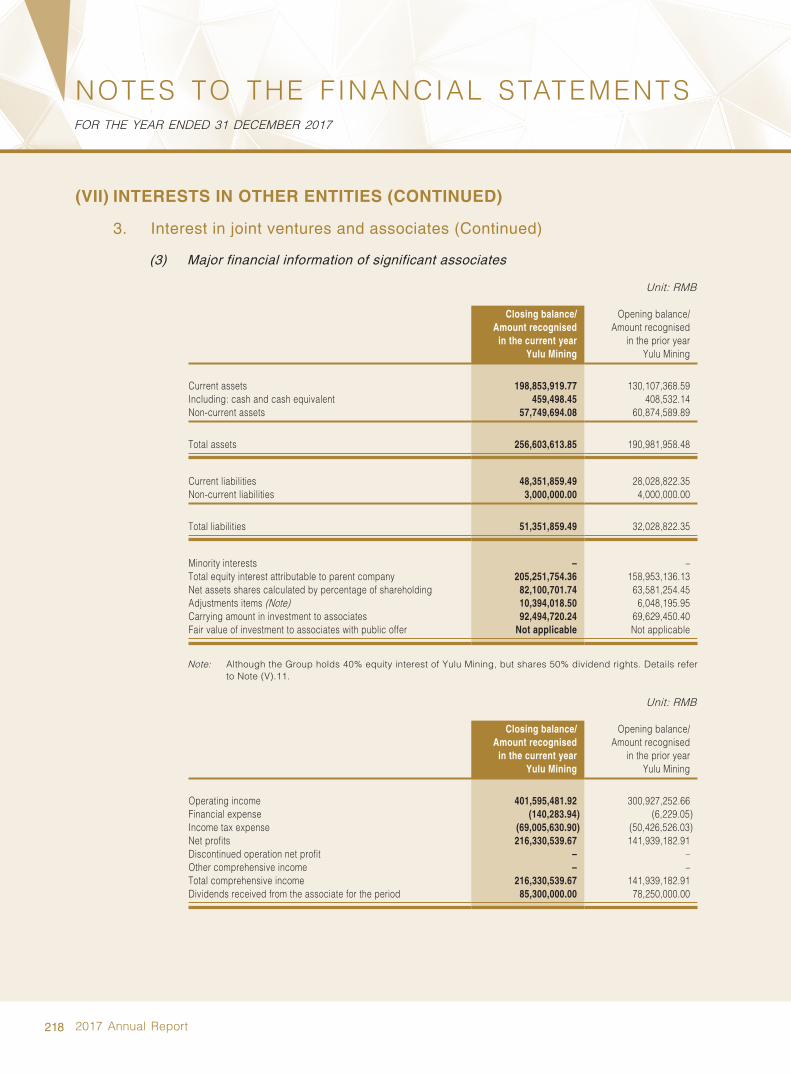
218 2017 Annual Report
NOTES TO THE FINANCIAL STATEMENTSFOR THE YEAR ENDED 31 DECEMBER 2017
(VII) INTERESTS IN OTHER ENTITIES (CONTINUED)
3. Interest in joint ventures and associates (Continued)
(3) Major financial information of significant associates
Unit: RMB
Closing balance/Amount recognised
in the current year
Opening balance/Amount recognised
in the prior yearYulu Mining Yulu Mining
Current assets 198,853,919.77 130,107,368.59Including: cash and cash equivalent 459,498.45 408,532.14Non-current assets 57,749,694.08 60,874,589.89
Total assets 256,603,613.85 190,981,958.48
Current liabilities 48,351,859.49 28,028,822.35Non-current liabilities 3,000,000.00 4,000,000.00
Total liabilities 51,351,859.49 32,028,822.35
Minority interests – –Total equity interest attributable to parent company 205,251,754.36 158,953,136.13Net assets shares calculated by percentage of shareholding 82,100,701.74 63,581,254.45Adjustments items (Note) 10,394,018.50 6,048,195.95Carrying amount in investment to associates 92,494,720.24 69,629,450.40Fair value of investment to associates with public offer Not applicable Not applicable
Note: Although the Group holds 40% equity interest of Yulu Mining, but shares 50% dividend rights. Details refer to Note (V).11.
Unit: RMB
Closing balance/Amount recognised
in the current year
Opening balance/Amount recognised
in the prior yearYulu Mining Yulu Mining
Operating income 401,595,481.92 300,927,252.66Financial expense (140,283.94) (6,229.05)Income tax expense (69,005,630.90) (50,426,526.03)Net profits 216,330,539.67 141,939,182.91Discontinued operation net profit – –Other comprehensive income – –Total comprehensive income 216,330,539.67 141,939,182.91Dividends received from the associate for the period 85,300,000.00 78,250,000.00
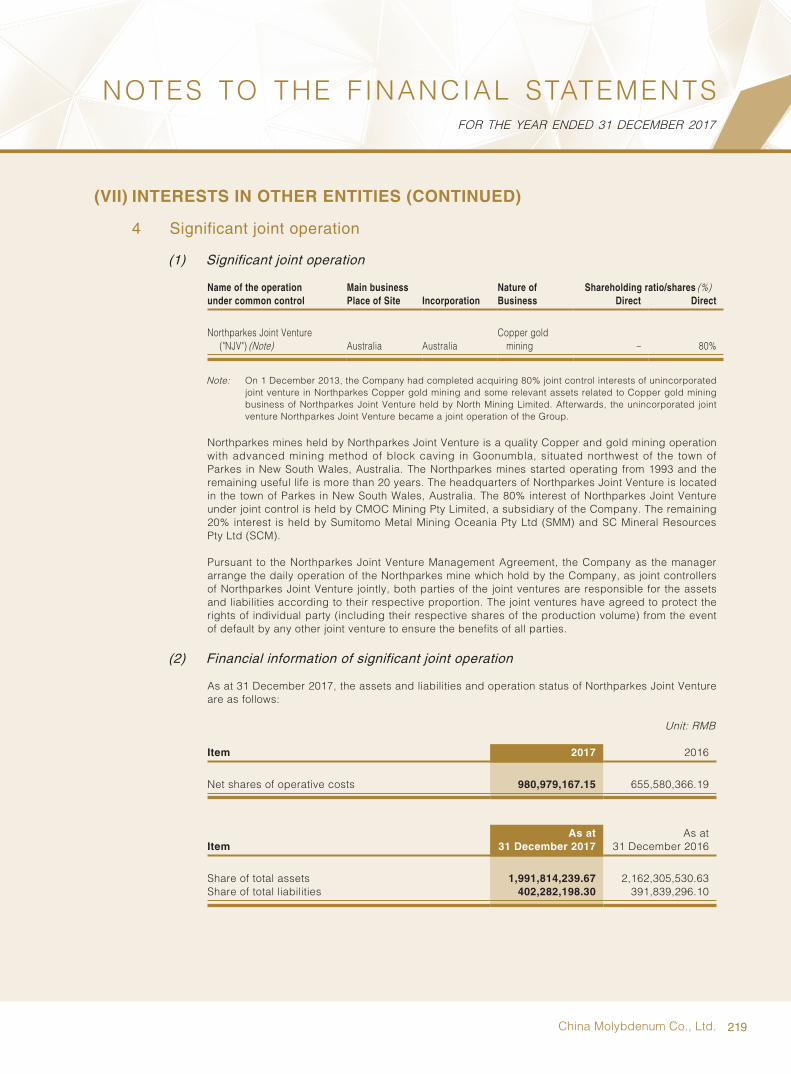
219China Molybdenum Co., Ltd.
NOTES TO THE FINANCIAL STATEMENTSFOR THE YEAR ENDED 31 DECEMBER 2017
(VII) INTERESTS IN OTHER ENTITIES (CONTINUED)
4 Significant joint operation
(1) Significant joint operation
Name of the operation under common control
Main business Place of Site Incorporation
Nature of Business
Shareholding ratio/shares (%)Direct Direct
Northparkes Joint Venture ("NJV") (Note) Australia Australia
Copper gold mining – 80%
Note: On 1 December 2013, the Company had completed acquiring 80% joint control interests of unincorporated joint venture in Northparkes Copper gold mining and some relevant assets related to Copper gold mining business of Northparkes Joint Venture held by North Mining Limited. Afterwards, the unincorporated joint venture Northparkes Joint Venture became a joint operation of the Group.
Northparkes mines held by Northparkes Joint Venture is a quality Copper and gold mining operation with advanced mining method of block caving in Goonumbla, situated northwest of the town of Parkes in New South Wales, Australia. The Northparkes mines started operating from 1993 and the remaining useful life is more than 20 years. The headquarters of Northparkes Joint Venture is located in the town of Parkes in New South Wales, Australia. The 80% interest of Northparkes Joint Venture under joint control is held by CMOC Mining Pty Limited, a subsidiary of the Company. The remaining 20% interest is held by Sumitomo Metal Mining Oceania Pty Ltd (SMM) and SC Mineral Resources Pty Ltd (SCM).
Pursuant to the Northparkes Joint Venture Management Agreement, the Company as the manager arrange the daily operation of the Northparkes mine which hold by the Company, as joint controllers of Northparkes Joint Venture jointly, both parties of the joint ventures are responsible for the assets and liabilities according to their respective proportion. The joint ventures have agreed to protect the rights of individual party (including their respective shares of the production volume) from the event of default by any other joint venture to ensure the benefits of all parties.
(2) Financial information of significant joint operation
As at 31 December 2017, the assets and liabilities and operation status of Northparkes Joint Venture are as follows:
Unit: RMB
Item 2017 2016
Net shares of operative costs 980,979,167.15 655,580,366.19
ItemAs at
31 December 2017As at
31 December 2016
Share of total assets 1,991,814,239.67 2,162,305,530.63Share of total liabilities 402,282,198.30 391,839,296.10
220 2017 Annual Report
NOTES TO THE FINANCIAL STATEMENTSFOR THE YEAR ENDED 31 DECEMBER 2017
(VIII) FINANCIAL INSTRUMENTS AND RISK MANAGEMENT
The Group’s major financial instruments include cash and bank balances, financial assets held-for-trading, accounts receivable, notes receivable, other receivables, interest receivable, other current assets, other non-current assets, available-for-sale financial assets, financial liabilities held-for-trading, accounts payable, bills payable, other payables, borrowings and bonds payable etc.. Details of these financial instruments are disclosed in Note (V). The risks associated with these financial instruments and the policies on how to mitigate these risks are set out below. Management manages and monitors these exposures to ensure the risks are monitored within a certain range.
1. Risk management objectives and policies
The Group’s business is mining. The Group only sells commodities which produced by themselves. In the long term, natural hedges operate in a number of ways can help to maintain stabilise earnings and cash flow, and there is no need to use the derivative financial instruments in this way or other forms of synthetic hedges. The Group does not acquire or issue derivative financial instruments for trading or speculative purposes; nor does it believe that it has exposure to such trading or speculative holdings through its investments in associates and jointly controlled entities
The Group’s risk management objectives are to achieve a proper balance between risks and benefits, and minimise the adverse impacts of risks on the Group’s operation performance, and maximise the benefits of the shareholders and other stakeholders. Based on these risk management objectives, the Group’s basic risk management strategy is to identify and analyse the Group’s exposure to various risks, establish an appropriate maximum tolerance to risk and practice risk management, and monitors these exposures regularly and effectively to ensure the risks are controlled within a certain range.
1.1 Market risk
1.1.1. Foreign exchange risk
Foreign exchange risk refers to the risk of loss due to exchange rate changes. The Group is subject to foreign exchange risk mainly related to USD, HKD, EUR, CAD, RMB, BRL, GBP, CDF and AUD. The Group's subsidiaries in the PRC use RMB for settlement of their principal business activities. The Group's subsidiaries in Australia mainly use AUD or USD for settlement, the Group's Niobium and Phosphorus businesses in Brazil are principally settled in USD and BRL and the Group's Copper-Cobalt business in Congo (DRC) is principally settled in USD and CDF. Foreign currency transactions are mainly financing activities of domestic and Hong Kong subsidiaries settled in USD, operating activities of subsidiaries in Australia of which the functional currency is USD settled in AUD, operating activities of subsidiaries in Brazil of which the functional currency is USD settled in BRL, and operating activities of subsidiaries in Congo (DRC) of which the functional currency is USD settled in CDF. The group pays close attention to the influence of exchange rate on the foreign exchange risk. The group currently has not taken any measures to avoid foreign exchange risk.
As at 31 December 2017, except for the financial assets and liabilities balance of each entity mentioned below use USD, HKD, AUD, EUR, CAD, RMB, BRL,GPB and CDF(converted in RMB) as functional currency, the Group's financial assets and financial liabilities are settled on the basis of the functional currency of each entity. The foreign exchange risk arising from the assets and liabilities of such foreign currency balances may have an impact on the Group's operating results.

221China Molybdenum Co., Ltd.
NOTES TO THE FINANCIAL STATEMENTSFOR THE YEAR ENDED 31 DECEMBER 2017
(VIII) FINANCIAL INSTRUMENTS AND RISK MANAGEMENT (CONTINUED)
1. Risk management objectives and policies (Continued)
1.1 Market risk (Continued)
1.1.1. Foreign exchange risk (Continued)
Unit: RMB’000
Item Closing balance Opening balance
USD – –Cash and bank balances 153,605 48,133Short-term borrowings – (884,468)Long-term borrowings – –
Subtotal 153,605 (836,335)
HKD – –Cash and bank balances 3,639 185Short-term borrowings – –
Subtotal 3,639 185
AUD – –Cash and bank balances 44,280 30,749
Subtotal 44,280 30,749
EUR – –Cash and bank balances 33,633 188,484Long-term borrowings – (1,686,200)Non-current liabilities due within one year (1,807,517) –
Subtotal (1,773,884) (1,497,716)
CAD – –Cash and bank balances 6,043 6,001
Subtotal 6,043 6,001
RMB – –Cash and bank balances 1,810 1,552
Subtotal 1,810 1,552

222 2017 Annual Report
NOTES TO THE FINANCIAL STATEMENTSFOR THE YEAR ENDED 31 DECEMBER 2017
(VIII) FINANCIAL INSTRUMENTS AND RISK MANAGEMENT (CONTINUED)
1. Risk management objectives and policies (Continued)
1.1 Market risk (Continued)
1.1.1. Foreign exchange risk (Continued)
Unit: RMB’000
Item Closing balance Opening balance
BRL – –Cash and bank balances 116,315 196,747
Subtotal 116,315 196,747
GBP – –Cash and bank balances 4,478 173
Subtotal 4,478 173
CDF – –Cash and bank balances 76 318,820
Subtotal 76 318,820
Total (1,443,638) (1,779,824)
The Group closely monitors the effects of changes in the foreign exchange rates on the Group’s currency risk exposures and purchase appropriate forward foreign exchange contracts to mitigate currency risk exposures.
The following table sets out in detail the sensitivity of the Group to the 10% rate of change in the exchange rate when exchanging the foreign currencies with the functional currency (including RMB, USD, HKD and BRL) of each entity. 10% ratio is used internally to report foreign exchange risk to the senior management, which represents the management's estimate of possible changes in the foreign exchange rate. Foreign exchange risk sensitivity analysis at the Group's reporting date is based on the changes on the settlement date and throughout the reporting period. A positive number indicates that an increase in profit before tax of a company with RMB as its functional currency is resulted from having USD, HKD and EUR borrowings and RMB increase against those foreign currencies. A negative number indicates that a decrease in profit before tax of a company with HKD as its functional currency is resulted from having USD and RMB cash and bank balances and HKD increase against those foreign currencies, and of companies with USD as their functional currency is resulted from having financial liabilities of AUD, HKD, EUR, CAD, RMB, BRL, GBP and CDF and USD increase against them. If the relevant functional currency decreases against these foreign currencies, it will have an opposite effect on the pre-tax profit. The Group does not consider the effect of current forward foreign exchange contract in the sensitivity analysis as below.
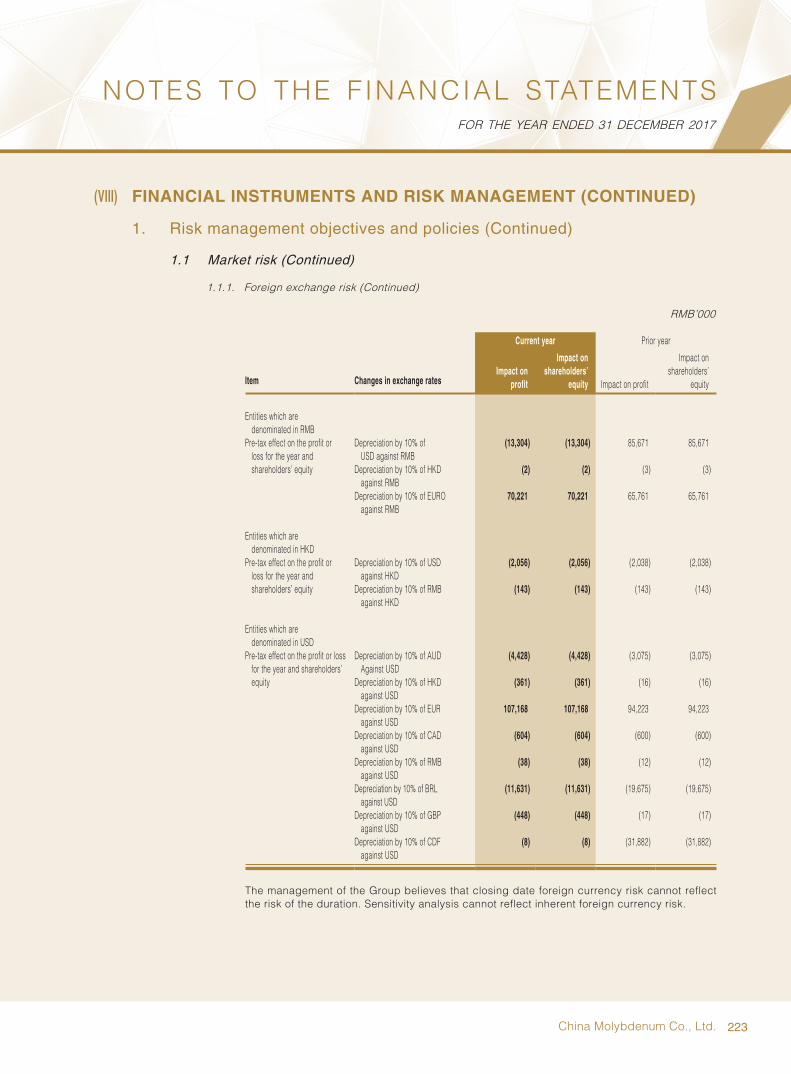
223China Molybdenum Co., Ltd.
NOTES TO THE FINANCIAL STATEMENTSFOR THE YEAR ENDED 31 DECEMBER 2017
(VIII) FINANCIAL INSTRUMENTS AND RISK MANAGEMENT (CONTINUED)
1. Risk management objectives and policies (Continued)
1.1 Market risk (Continued)
1.1.1. Foreign exchange risk (Continued)
RMB’000
Item Changes in exchange rates
Current year Prior year
Impact on profit
Impact on shareholders’
equity Impact on profit
Impact on shareholders’
equity
Entities which are denominated in RMB
Pre-tax effect on the profit or loss for the year and shareholders’ equity
Depreciation by 10% of USD against RMB
(13,304) (13,304) 85,671 85,671
Depreciation by 10% of HKD against RMB
(2) (2) (3) (3)
Depreciation by 10% of EURO against RMB
70,221 70,221 65,761 65,761
Entities which are denominated in HKD
Pre-tax effect on the profit or loss for the year and shareholders’ equity
Depreciation by 10% of USD against HKD
(2,056) (2,056) (2,038) (2,038)
Depreciation by 10% of RMB against HKD
(143) (143) (143) (143)
Entities which are denominated in USD
Pre-tax effect on the profit or loss for the year and shareholders’ equity
Depreciation by 10% of AUD Against USD
(4,428) (4,428) (3,075) (3,075)
Depreciation by 10% of HKD against USD
(361) (361) (16) (16)
Depreciation by 10% of EUR against USD
107,168 107,168 94,223 94,223
Depreciation by 10% of CAD against USD
(604) (604) (600) (600)
Depreciation by 10% of RMB against USD
(38) (38) (12) (12)
Depreciation by 10% of BRL against USD
(11,631) (11,631) (19,675) (19,675)
Depreciation by 10% of GBP against USD
(448) (448) (17) (17)
Depreciation by 10% of CDF against USD
(8) (8) (31,882) (31,882)
The management of the Group believes that closing date foreign currency risk cannot reflect the risk of the duration. Sensitivity analysis cannot reflect inherent foreign currency risk.
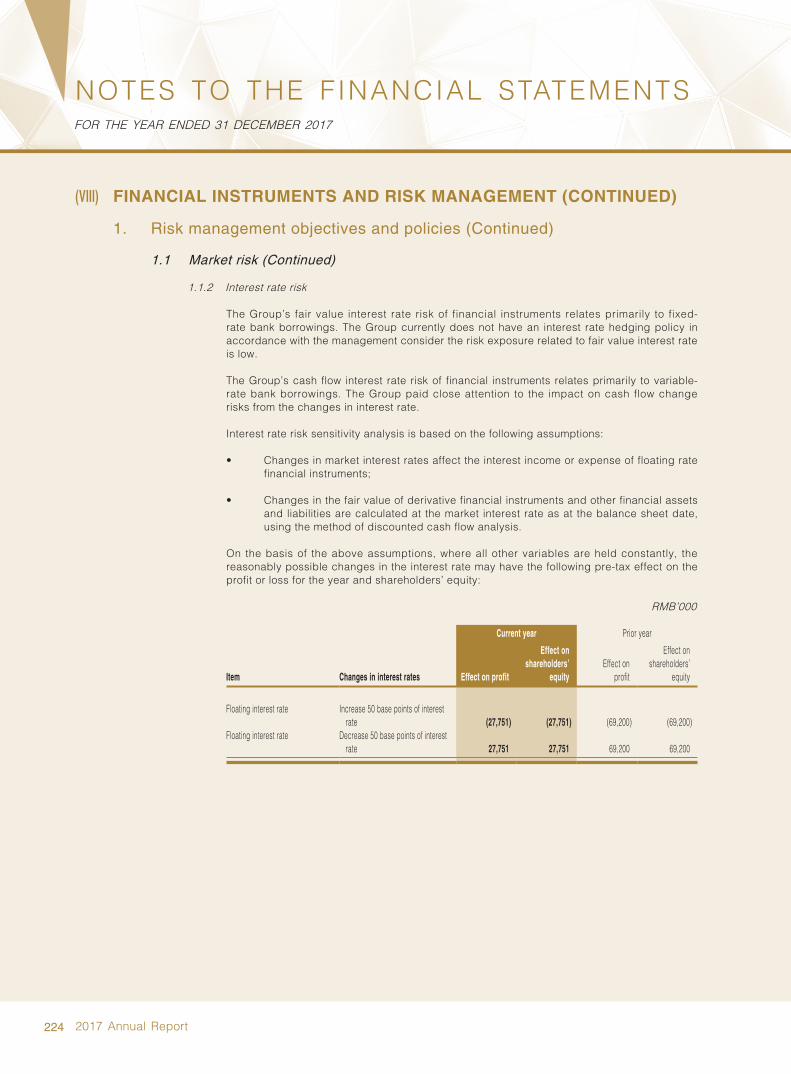
224 2017 Annual Report
NOTES TO THE FINANCIAL STATEMENTSFOR THE YEAR ENDED 31 DECEMBER 2017
(VIII) FINANCIAL INSTRUMENTS AND RISK MANAGEMENT (CONTINUED)
1. Risk management objectives and policies (Continued)
1.1 Market risk (Continued)
1.1.2 Interest rate risk
The Group’s fair value interest rate risk of financial instruments relates primarily to fixed-rate bank borrowings. The Group currently does not have an interest rate hedging policy in accordance with the management consider the risk exposure related to fair value interest rate is low.
The Group’s cash flow interest rate risk of financial instruments relates primarily to variable-rate bank borrowings. The Group paid close attention to the impact on cash flow change risks from the changes in interest rate.
Interest rate risk sensitivity analysis is based on the following assumptions:
• Changes in market interest rates affect the interest income or expense of floating rate financial instruments;
• Changes in the fair value of derivative financial instruments and other financial assets and liabilities are calculated at the market interest rate as at the balance sheet date, using the method of discounted cash flow analysis.
On the basis of the above assumptions, where all other variables are held constantly, the reasonably possible changes in the interest rate may have the following pre-tax effect on the profit or loss for the year and shareholders’ equity:
RMB’000
Current year Prior year
Item Changes in interest rates Effect on profit
Effect on shareholders’
equityEffect on
profit
Effect on shareholders’
equity
Floating interest rate Increase 50 base points of interest rate (27,751) (27,751) (69,200) (69,200)
Floating interest rate Decrease 50 base points of interest rate 27,751 27,751 69,200 69,200

225China Molybdenum Co., Ltd.
NOTES TO THE FINANCIAL STATEMENTSFOR THE YEAR ENDED 31 DECEMBER 2017
(VIII) FINANCIAL INSTRUMENTS AND RISK MANAGEMENT (CONTINUED)
1. Risk management objectives and policies (Continued)
1.1 Market risk (Continued)
1.1.3. Commodity price risk
International Copper prices and Cobalt prices have a significant impact on the Group's operating results. Copper and Cobalt prices fluctuated in the past and the factors causing fluctuation were uncontrollable by the Group. The Group does not hedge against the fluctuation risk of Copper and Cobalt prices.
The table below shows the sensitivity analysis of the price of Copper and Cobalt on the balance sheet date, which reflects pre-tax impact of unpricing accounts receivable at the end of the year on the total profit and shareholders' equity when the market price of Copper and Cobalt is changed reasonably and possibly under the assumption that other variables remain unchanged.
RMB’000
2017 2016
Item
Increase/(Decrease) percentage
Impact on profit
Impact on shareholders'
equityImpact
on profit
Impact on shareholders'
equity
Market price of copper 5% 19,884 19,884 29,435 29,435Market price of copper (5%) (19,884) (19,884) (29,435) (29,435)
Item
Increase/(Decrease) percentage
2017 2016
Impact on profit
Impact on shareholders'
equityImpact on
profit
Impact on shareholders'
equity
Market price of cobalt 5% 54,413 54,413 3,099 3,099Market price of cobalt (5%) (54,413) (54,413) (3,099) (3,099)
1.1.4 Other price risk
The equity instrument investments held by the Group, including financial assets classified as available- for-sale financial assets measured at fair value at each balance sheet date. As at the end of the reporting period, the equity instrument investments held by the Group mainly comprise listed securities and assets management plans, therefore, the Group is exposed to the risk of the fluctuation of securities market price. If equity price of the equity instrument investments held by the Group increase or decrease by 5% while other variables remain the same, the interests of shareholders of the Group will increase or decrease by RMB141,301,000 at the end of the year (excluding the impact of income tax).
226 2017 Annual Report
NOTES TO THE FINANCIAL STATEMENTSFOR THE YEAR ENDED 31 DECEMBER 2017
(VIII) FINANCIAL INSTRUMENTS AND RISK MANAGEMENT (CONTINUED)
1. Risk management objectives and policies (Continued)
1.2. Credit risk
As at 31 December 2017, the Group’s maximum exposure to credit risk which will cause a financial loss to the Group due to failure of other party to fulfill an obligation, including:
• The book value of the financial assets has been recognized in the consolidated balance sheet. For financial instruments measured at fair value, the book value reflects the exposure to risks but not the maximum exposure to risks. The maximum exposure of risks will change according to the future changes in fair value.
The Group only trades with recognised, creditworthy third parties. Total amount of top five entities with the largest balances of accounts receivable as at 31 December 2017 takes 63.72%of the amount of total accounts receivable (31 December 2016: 46.45%). Accounts receivable balances are monitored on an ongoing basis with the result that the Group’s exposure to credit risk is controlled. Products are sold only to companies whose credit information is in an acceptable range. Credit limits have been set for most of the customers and they are monitored systematically. For overseas sales, letters of credit are generally in use.
To credit risk arising from the other receivables, the Group’s exposure to credit risk arising from default of counterparties is limited as most of the counterparties are entities with good credit standing and the Group does not expect any significant loss for uncollected advances to these entities.
To the available-for-sale financial asset, the Group has established an investment committee that is responsible for analysis of major investment and for advisory of the board. And the Group has a mechanism to authorise, examine and approve along the hierarchy based on the maturity of single investment amount. The Group has devised a relatively sophisticated investment management system to control the credit risks from the Group’s invested financial assets.
The credit risk on liquid fund is low because they are deposited with banks with high credit ratings.
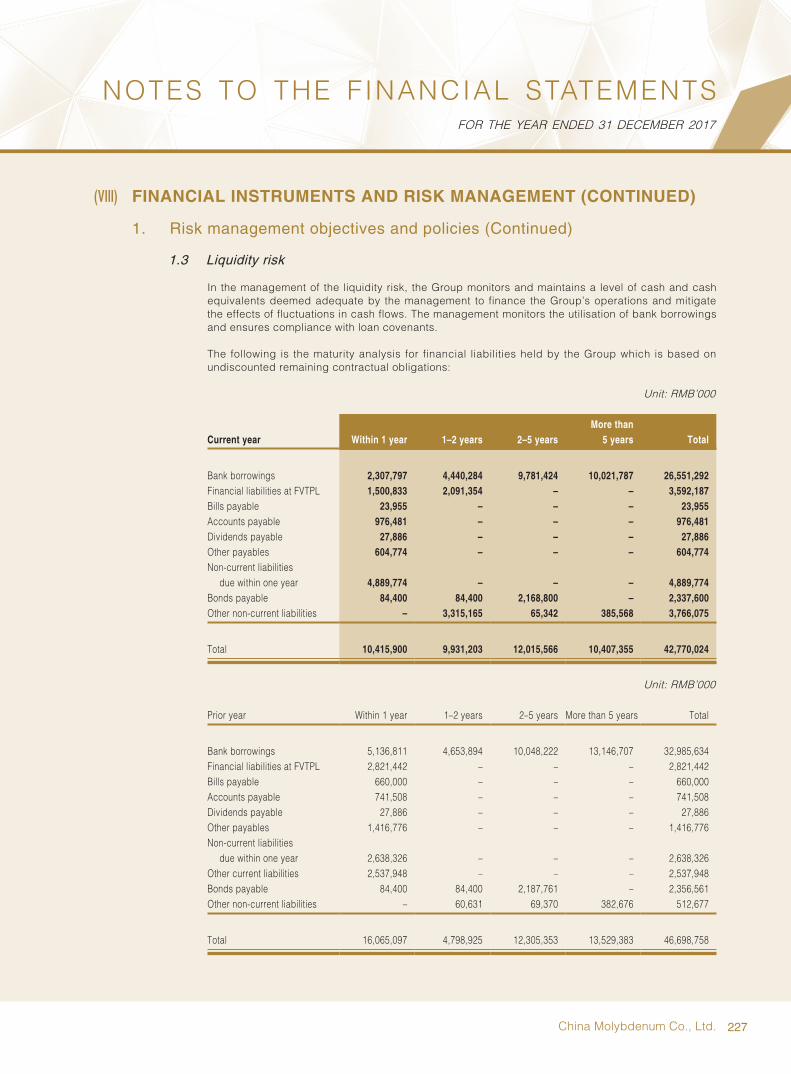
227China Molybdenum Co., Ltd.
NOTES TO THE FINANCIAL STATEMENTSFOR THE YEAR ENDED 31 DECEMBER 2017
(VIII) FINANCIAL INSTRUMENTS AND RISK MANAGEMENT (CONTINUED)
1. Risk management objectives and policies (Continued)
1.3 Liquidity risk
In the management of the liquidity risk, the Group monitors and maintains a level of cash and cash equivalents deemed adequate by the management to finance the Group’s operations and mitigate the effects of fluctuations in cash flows. The management monitors the utilisation of bank borrowings and ensures compliance with loan covenants.
The following is the maturity analysis for financial liabilities held by the Group which is based on undiscounted remaining contractual obligations:
Unit: RMB’000
Current year Within 1 year 1–2 years 2–5 yearsMore than
5 years Total
Bank borrowings 2,307,797 4,440,284 9,781,424 10,021,787 26,551,292Financial liabilities at FVTPL 1,500,833 2,091,354 – – 3,592,187Bills payable 23,955 – – – 23,955Accounts payable 976,481 – – – 976,481Dividends payable 27,886 – – – 27,886Other payables 604,774 – – – 604,774Non-current liabilities
due within one year 4,889,774 – – – 4,889,774Bonds payable 84,400 84,400 2,168,800 – 2,337,600Other non-current liabilities – 3,315,165 65,342 385,568 3,766,075
Total 10,415,900 9,931,203 12,015,566 10,407,355 42,770,024
Unit: RMB’000
Prior year Within 1 year 1–2 years 2–5 years More than 5 years Total
Bank borrowings 5,136,811 4,653,894 10,048,222 13,146,707 32,985,634Financial liabilities at FVTPL 2,821,442 – – – 2,821,442Bills payable 660,000 – – – 660,000Accounts payable 741,508 – – – 741,508Dividends payable 27,886 – – – 27,886Other payables 1,416,776 – – – 1,416,776Non-current liabilities
due within one year 2,638,326 – – – 2,638,326Other current liabilities 2,537,948 – – – 2,537,948Bonds payable 84,400 84,400 2,187,761 – 2,356,561Other non-current liabilities – 60,631 69,370 382,676 512,677
Total 16,065,097 4,798,925 12,305,353 13,529,383 46,698,758

228 2017 Annual Report
NOTES TO THE FINANCIAL STATEMENTSFOR THE YEAR ENDED 31 DECEMBER 2017
(IX) DISCLOSURE OF FAIR VALUE
1. The closing fair value of assets and liabilities measured at fair value
Unit: RMB’000
ItemClosing fair value
Level 1 Fair value Level 2 Fair value Level 3 Fair value Total
1. Persistent fair value measurement(1) Available-for-sale financial assets
– Equity instrument – – 2,826,030 2,826,030(2) Inventories:
– Consumable biological assets – – 42,296 42,296(3) Accounts receivable
– Accounts receivable – 283,152 – 283,152(4) Other current assets
– Other wealth management products by non-banking financial institutions – – 801,403 801,403
The total assets measured continuously at fair value – 283,152 3,669,729 3,952,881
Financial liabilities measured at fair value and change included in the profit and loss for the period
– Fo rward Commodity contract and Gold lease liabilities measured at fair value – 3,000,757 – 3,000,757
– Co ntingent consideration at fair value – – 591,430 591,430
The total liabilities measured continuously at fair value – 3,000,757 591,430 3,592,187
2. Determination basis of market price for items that are continuously measured at Level 2 fair value
Items that are continuously measured at the second level of fair value are the embedded derivatives and the debt instruments at fair value included in accounts receivable, and the related fair value is determined with reference to the closing price and long-term offer of similar products and the yield rate of similar debt instruments in open market.
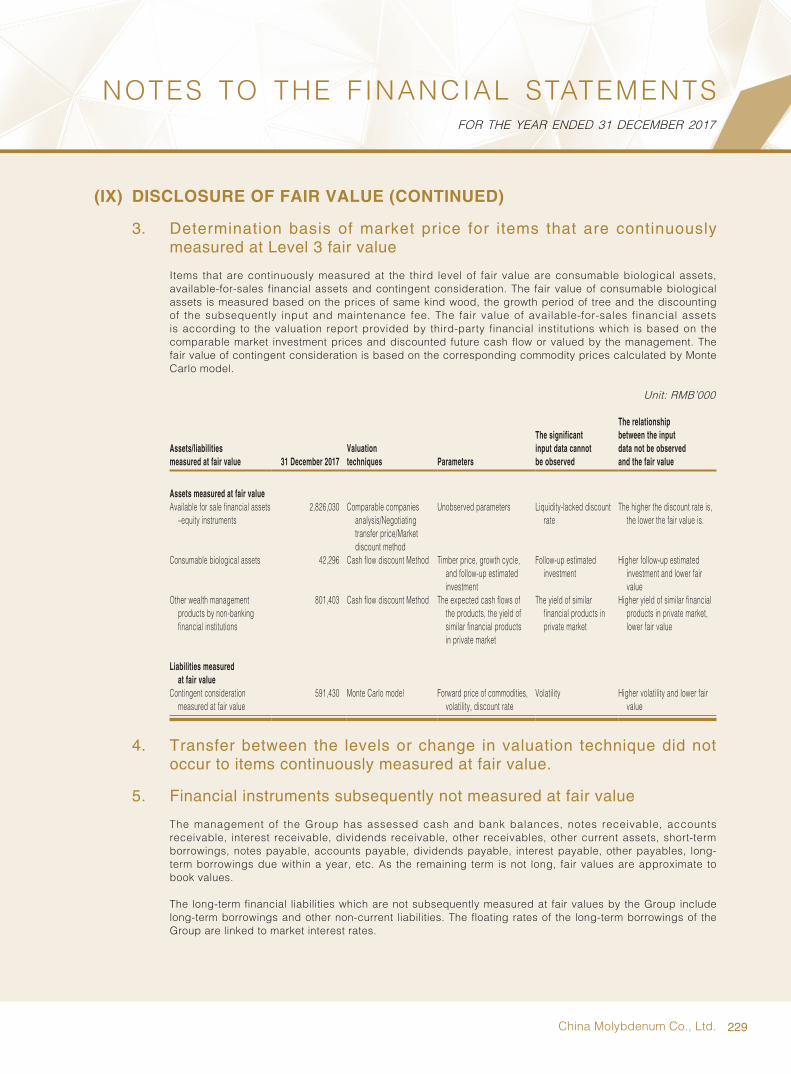
229China Molybdenum Co., Ltd.
NOTES TO THE FINANCIAL STATEMENTSFOR THE YEAR ENDED 31 DECEMBER 2017
(IX) DISCLOSURE OF FAIR VALUE (CONTINUED)
3. Determination basis of market price for items that are continuously measured at Level 3 fair value
Items that are continuously measured at the third level of fair value are consumable biological assets, available-for-sales financial assets and contingent consideration. The fair value of consumable biological assets is measured based on the prices of same kind wood, the growth period of tree and the discounting of the subsequently input and maintenance fee. The fair value of available-for-sales financial assets is according to the valuation report provided by third-party financial institutions which is based on the comparable market investment prices and discounted future cash flow or valued by the management. The fair value of contingent consideration is based on the corresponding commodity prices calculated by Monte Carlo model.
Unit: RMB’000
Assets/liabilities measured at fair value 31 December 2017
Valuation techniques Parameters
The significant input data cannot be observed
The relationship between the input data not be observed and the fair value
Assets measured at fair valueAvailable for sale financial assets
–equity instruments2,826,030 Comparable companies
analysis/Negotiating transfer price/Market discount method
Unobserved parameters Liquidity-lacked discount rate
The higher the discount rate is, the lower the fair value is.
Consumable biological assets 42,296 Cash flow discount Method Timber price, growth cycle, and follow-up estimated investment
Follow-up estimated investment
Higher follow-up estimated investment and lower fair value
Other wealth management products by non-banking financial institutions
801,403 Cash flow discount Method The expected cash flows of the products, the yield of similar financial products in private market
The yield of similar financial products in private market
Higher yield of similar financial products in private market, lower fair value
Liabilities measured at fair value
Contingent consideration measured at fair value
591,430 Monte Carlo model Forward price of commodities, volatility, discount rate
Volatility Higher volatility and lower fair value
4. Transfer between the levels or change in valuation technique did not occur to items continuously measured at fair value.
5. Financial instruments subsequently not measured at fair value
The management of the Group has assessed cash and bank balances, notes receivable, accounts receivable, interest receivable, dividends receivable, other receivables, other current assets, short-term borrowings, notes payable, accounts payable, dividends payable, interest payable, other payables, long-term borrowings due within a year, etc. As the remaining term is not long, fair values are approximate to book values.
The long-term financial liabilities which are not subsequently measured at fair values by the Group include long-term borrowings and other non-current liabilities. The floating rates of the long-term borrowings of the Group are linked to market interest rates.

230 2017 Annual Report
NOTES TO THE FINANCIAL STATEMENTSFOR THE YEAR ENDED 31 DECEMBER 2017
(X) RELATED PARTY RELATIONSHIPS AND TRANSACTIONS
1. Parent of the Company
Name of the parentPlace of registration
Nature of business Registered capital
Proportion of the Company's
ownership interest held
by the parent
Proportion of the Company's
voting power held by the
parent
Cathay Fortune Corporation Shanghai Investment management
RMB181,818,200 24.69% 24.69%
On 12 January 2014, the Company received the Notice of Change of Control Rights of Luoyang Luanchuan Molybdenum Group Co., Ltd. from the shareholders Cathay Fortune Corporation (“CFC”) and Luoyang Mining Group Co., Ltd. (“LMG”), notifying that CFC increased its shareholding H shares of the Company in the secondary market through its wholly-owned subsidiary, Cathy Fortune Investment, incorporated in Hong Kong. Upon completion, CFC and its persons acting in concert totally hold 1,827,706,322 shares of the Company (approximately 36.01% of the total share capital of the Company), surpassing 1,776,594,475 shares (approximately 35.01% of the total share capital of the Company) held by the original largest shareholder LMG, and become the Company's largest shareholder. CFC and LMG exchanged views on the change of control of the Company. LMG confirmed that it no longer had control over the Company and had no intention to increase its shareholding in the Company. Therefore, the controlling shareholder of the Company changed to CFC.
As at December 31, 2017, CFC actually holds 5,333,220,000.00 shares of the Company accounting for 24.69% of the total share capital of the Company. CFC is the actual controller of the Company.
2. Subsidiaries of the Company
For details of the subsidiaries of the Company, please refer to Note (VII), 1.
3. Associates and joint ventures of the Company
For details of associates and joint ventures of the Company, please refer to Note (VII), 3.
Other associates or joint ventures which have transactions with the Group in the current year or in previous years are as follows:
Associates or joint ventures Relationship with the Company
High-Tech Joint ventureFuchuan A subsidiary held by joint ventureYulu Mining AssociateLuoyang Shenyu Associate
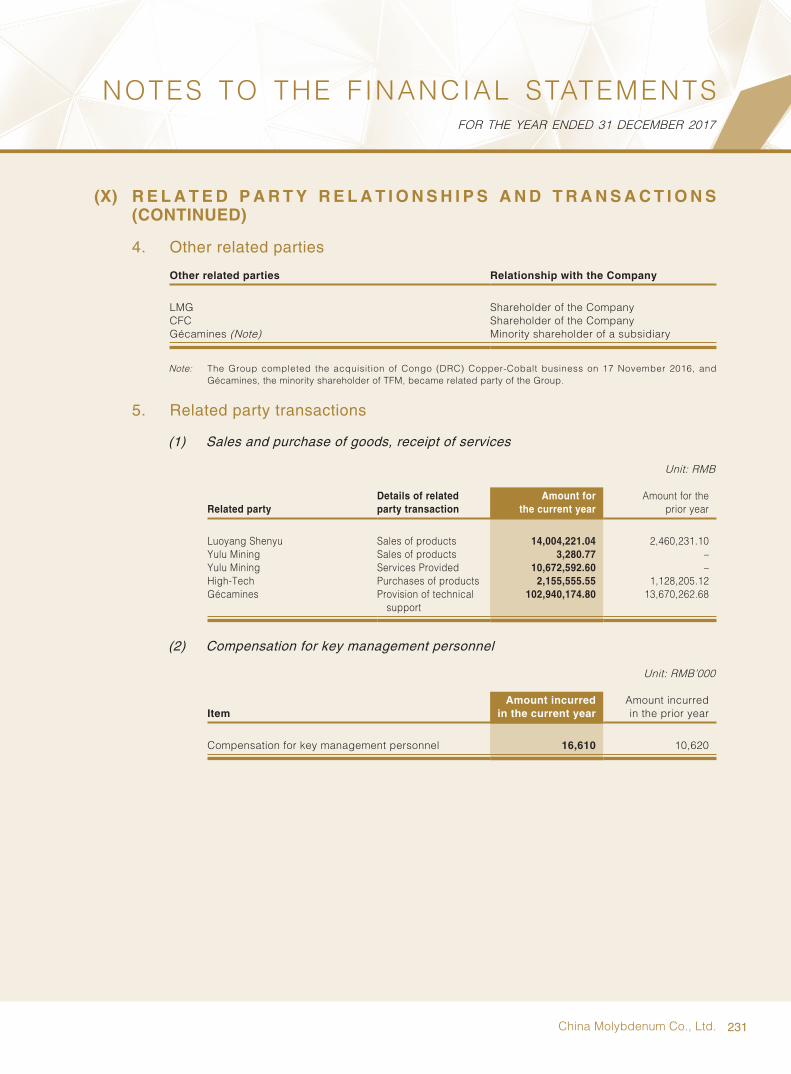
231China Molybdenum Co., Ltd.
NOTES TO THE FINANCIAL STATEMENTSFOR THE YEAR ENDED 31 DECEMBER 2017
(X) R E L A T E D P A R T Y R E L A T I O N S H I P S A N D T R A N S A C T I O N S (CONTINUED)
4. Other related parties
Other related parties Relationship with the Company
LMG Shareholder of the CompanyCFC Shareholder of the CompanyGécamines (Note) Minority shareholder of a subsidiary
Note: The Group completed the acquisition of Congo (DRC) Copper-Cobalt business on 17 November 2016, and Gécamines, the minority shareholder of TFM, became related party of the Group.
5. Related party transactions
(1) Sales and purchase of goods, receipt of services
Unit: RMB
Related partyDetails of related party transaction
Amount for the current year
Amount for the prior year
Luoyang Shenyu Sales of products 14,004,221.04 2,460,231.10Yulu Mining Sales of products 3,280.77 –Yulu Mining Services Provided 10,672,592.60 –High-Tech Purchases of products 2,155,555.55 1,128,205.12Gécamines Provision of technical
support102,940,174.80 13,670,262.68
(2) Compensation for key management personnel
Unit: RMB’000
ItemAmount incurred
in the current yearAmount incurred in the prior year
Compensation for key management personnel 16,610 10,620
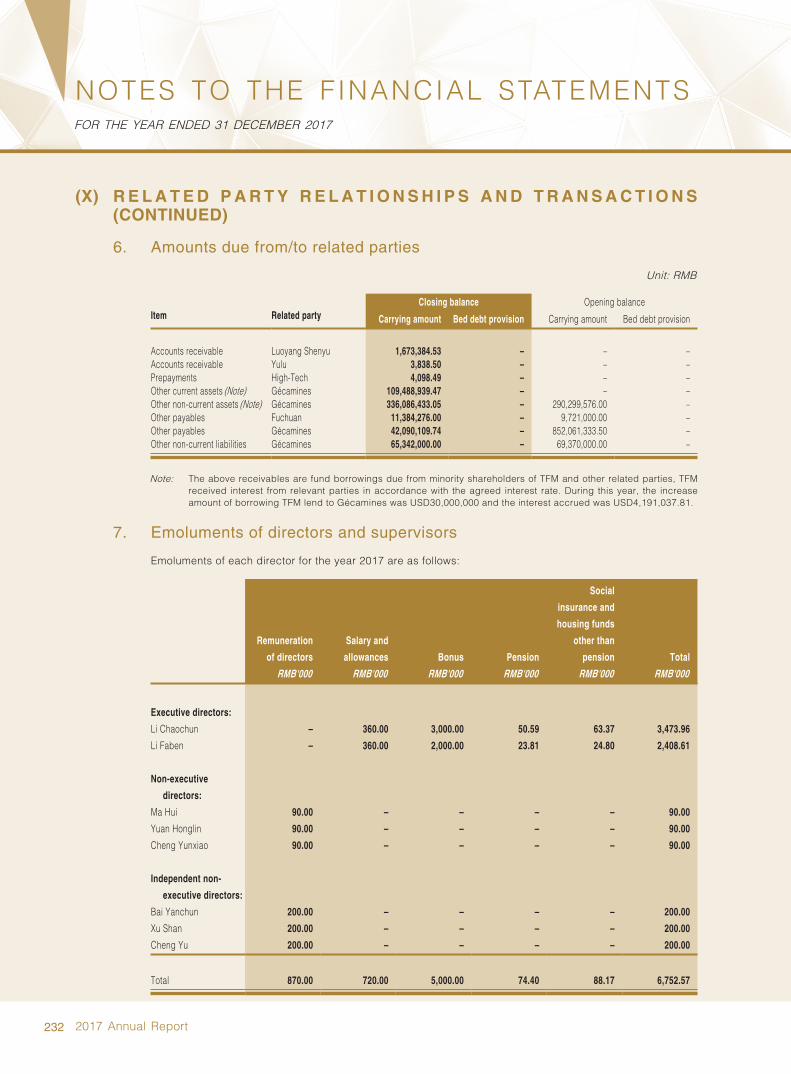
232 2017 Annual Report
NOTES TO THE FINANCIAL STATEMENTSFOR THE YEAR ENDED 31 DECEMBER 2017
(X) R E L A T E D P A R T Y R E L A T I O N S H I P S A N D T R A N S A C T I O N S (CONTINUED)
6. Amounts due from/to related parties
Unit: RMB
Item Related partyClosing balance Opening balance
Carrying amount Bed debt provision Carrying amount Bed debt provision
Accounts receivable Luoyang Shenyu 1,673,384.53 – – –Accounts receivable Yulu 3,838.50 – – –Prepayments High-Tech 4,098.49 – – –Other current assets (Note) Gécamines 109,488,939.47 – – –Other non-current assets (Note) Gécamines 336,086,433.05 – 290,299,576.00 –Other payables Fuchuan 11,384,276.00 – 9,721,000.00 –Other payables Gécamines 42,090,109.74 – 852,061,333.50 –Other non-current liabilities Gécamines 65,342,000.00 – 69,370,000.00 –
Note: The above receivables are fund borrowings due from minority shareholders of TFM and other related parties, TFM received interest from relevant parties in accordance with the agreed interest rate. During this year, the increase amount of borrowing TFM lend to Gécamines was USD30,000,000 and the interest accrued was USD4,191,037.81.
7. Emoluments of directors and supervisors
Emoluments of each director for the year 2017 are as follows:
Remuneration
of directors
Salary and
allowances Bonus Pension
Social
insurance and
housing funds
other than
pension Total
RMB'000 RMB'000 RMB'000 RMB'000 RMB'000 RMB'000
Executive directors:
Li Chaochun – 360.00 3,000.00 50.59 63.37 3,473.96
Li Faben – 360.00 2,000.00 23.81 24.80 2,408.61
Non-executive
directors:
Ma Hui 90.00 – – – – 90.00
Yuan Honglin 90.00 – – – – 90.00
Cheng Yunxiao 90.00 – – – – 90.00
Independent non-
executive directors:
Bai Yanchun 200.00 – – – – 200.00
Xu Shan 200.00 – – – – 200.00
Cheng Yu 200.00 – – – – 200.00
Total 870.00 720.00 5,000.00 74.40 88.17 6,752.57

233China Molybdenum Co., Ltd.
NOTES TO THE FINANCIAL STATEMENTSFOR THE YEAR ENDED 31 DECEMBER 2017
(X) R E L A T E D P A R T Y R E L A T I O N S H I P S A N D T R A N S A C T I O N S (CONTINUED)
7. Emoluments of directors and supervisors (Continued)
Emoluments of each director for the year 2016 are as follows:
Remuneration
of directors
Salary and
allowances Bonus Pension
Social
insurance and
housing funds
other than
pension Total
RMB'000 RMB'000 RMB'000 RMB'000 RMB'000 RMB'000
Executive
directors:
Li Chaochun – 360.00 1,959.34 19.41 21.25 2,360.00
Li Faben – 360.00 1,559.34 19.41 21.25 1,960.00
Non-executive
directors:
Ma Hui 90.00 – – – – 90.00
Yuan Honglin 90.00 – – – – 90.00
Cheng Yunxiao 90.00 – – – – 90.00
Independent
non-executive
directors:
Bai Yanchun 200.00 – – – – 200.00
Xu Shan 200.00 – – – – 200.00
Cheng Yu 200.00 – – – – 200.00
Total 870.00 720.00 3,518.68 38.82 42.50 5,190.00
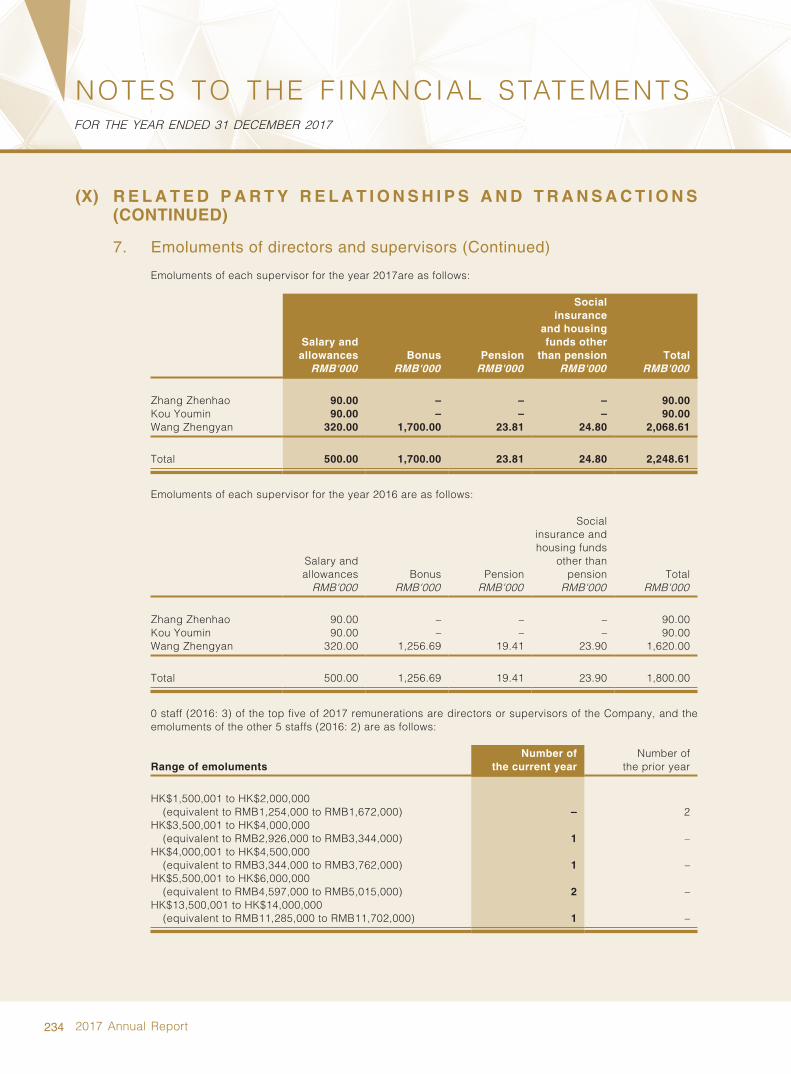
234 2017 Annual Report
NOTES TO THE FINANCIAL STATEMENTSFOR THE YEAR ENDED 31 DECEMBER 2017
(X) R E L A T E D P A R T Y R E L A T I O N S H I P S A N D T R A N S A C T I O N S (CONTINUED)
7. Emoluments of directors and supervisors (Continued)
Emoluments of each supervisor for the year 2017are as follows:
Salary and allowances Bonus Pension
Social insurance
and housing funds other
than pension TotalRMB'000 RMB'000 RMB'000 RMB'000 RMB'000
Zhang Zhenhao 90.00 – – – 90.00Kou Youmin 90.00 – – – 90.00Wang Zhengyan 320.00 1,700.00 23.81 24.80 2,068.61
Total 500.00 1,700.00 23.81 24.80 2,248.61
Emoluments of each supervisor for the year 2016 are as follows:
Salary and allowances Bonus Pension
Social insurance and housing funds
other than pension Total
RMB'000 RMB'000 RMB'000 RMB'000 RMB'000
Zhang Zhenhao 90.00 – – – 90.00Kou Youmin 90.00 – – – 90.00Wang Zhengyan 320.00 1,256.69 19.41 23.90 1,620.00
Total 500.00 1,256.69 19.41 23.90 1,800.00
0 staff (2016: 3) of the top five of 2017 remunerations are directors or supervisors of the Company, and the emoluments of the other 5 staffs (2016: 2) are as follows:
Range of emolumentsNumber of
the current yearNumber of
the prior year
HK$1,500,001 to HK$2,000,000 (equivalent to RMB1,254,000 to RMB1,672,000) – 2
HK$3,500,001 to HK$4,000,000 (equivalent to RMB2,926,000 to RMB3,344,000) 1 –
HK$4,000,001 to HK$4,500,000 (equivalent to RMB3,344,000 to RMB3,762,000) 1 –
HK$5,500,001 to HK$6,000,000 (equivalent to RMB4,597,000 to RMB5,015,000) 2 –
HK$13,500,001 to HK$14,000,000 (equivalent to RMB11,285,000 to RMB11,702,000) 1 –
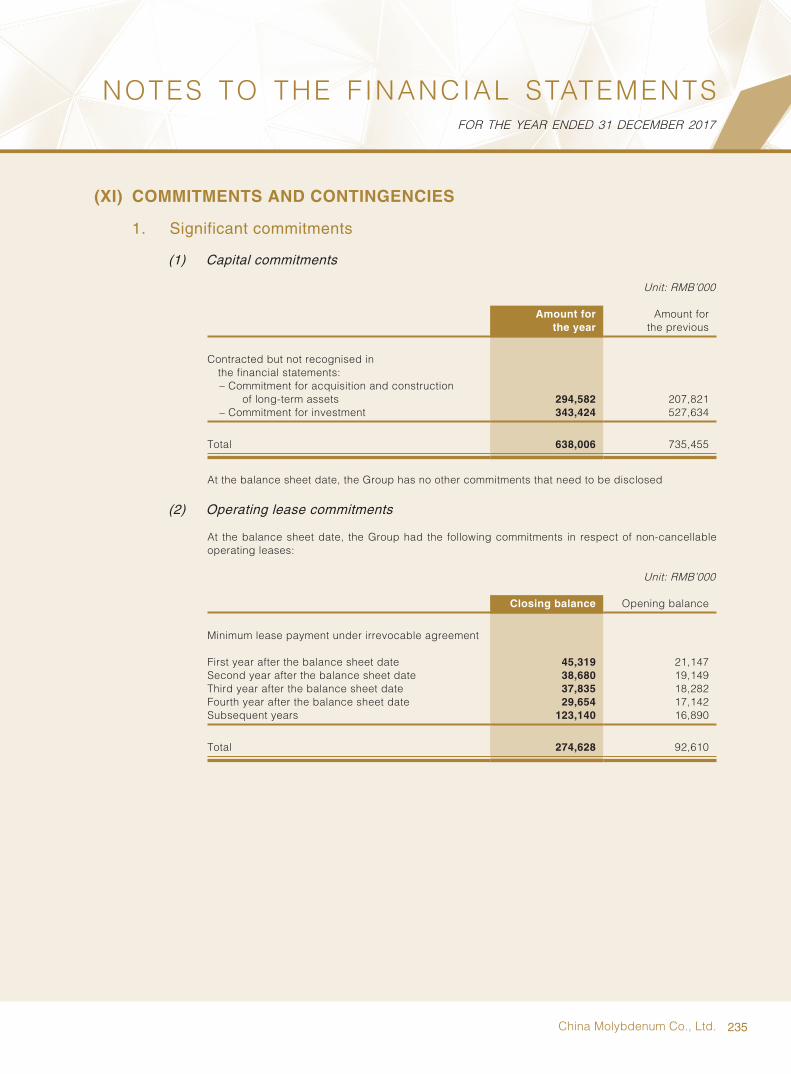
235China Molybdenum Co., Ltd.
NOTES TO THE FINANCIAL STATEMENTSFOR THE YEAR ENDED 31 DECEMBER 2017
(XI) COMMITMENTS AND CONTINGENCIES
1. Significant commitments
(1) Capital commitments
Unit: RMB’000
Amount for the year
Amount for the previous
Contracted but not recognised in the financial statements:– Commitment for acquisition and construction
of long-term assets 294,582 207,821– Commitment for investment 343,424 527,634
Total 638,006 735,455
At the balance sheet date, the Group has no other commitments that need to be disclosed
(2) Operating lease commitments
At the balance sheet date, the Group had the following commitments in respect of non-cancellable operating leases:
Unit: RMB’000
Closing balance Opening balance
Minimum lease payment under irrevocable agreement
First year after the balance sheet date 45,319 21,147Second year after the balance sheet date 38,680 19,149Third year after the balance sheet date 37,835 18,282Fourth year after the balance sheet date 29,654 17,142Subsequent years 123,140 16,890 Total 274,628 92,610

236 2017 Annual Report
NOTES TO THE FINANCIAL STATEMENTSFOR THE YEAR ENDED 31 DECEMBER 2017
(XI) COMMITMENTS AND CONTINGENCIES (CONTINUED)
2. Contingencies
(1) Pending litigation
Business of the Group in PRC
On 30 January 2013, the Group received relevant documents from the Intermediate People’s Court of Luoyang City, Henan Province, stating that West Lead Mine, Yangshuao, Luanchuan County (“Yangshuao”) filed a lawsuit accusing that the tailing storage built by the No. 3 Ore Processing Branch, a branch of subsidiary of the Group, was in its mining area. As the height of the dam of the tailing storage increased to occupy upwards and the level of the groundwater rose, the mining facilities and equipment of Yangshuao were damaged and its mining needed to be written off. The plaintiff was unable to exploit the defined lead- zinc ore and an economic loss was thus incurred. Therefore, the plaintiff made claims that No. 3 Ore Processing Branch shall cease the infringement and compensate the plaintiff for a direct economic loss of approximately RMB18 million. According to the results of judicial authentication, the appraised value of the mining right in the litigation in respect of Yangshuao amounted to RMB1.724 million. The litigation is still in process, the Group believes that the infringement claimed by Yangshuao cannot be confirmed truly existed based on the existing circumstances and the submitted evidences. The Group considers that the litigation does not currently have a significant impact on the financial position of the Group and has not accrued the relevant claim amount in the financial statements as at 31 December 2017.
Copper-Cobalt business of the Group in Congo (DRC)
At the end of 2015, TFM negotiated with SNEL to address the availability, supply quality and quantity of electricity. In accordance with the amended items of the power agreement included in the dispute settlement plan, TFM agrees to pay the electricity at the price of US$0.0569 per kilowatt-hour from January 2016 (the original electricity price was $0.0350 per kilowatt-hour) and to pay US$10 million settlement compensation to get more continuous supply of electricity from SNEL. As at the date of this report, the two parties have not yet signed any formal agreement, and the negotiations are still in progress. In response to this contingent liability, TFM has accrued $10 million in expenditure in prior years.
The Group's Copper-Cobalt business in Congo (DRC) may have some lawsuits, claims and liability claims in the daily business. The management considers that the results of such contingencies will not have a material adverse effect on the financial position, operating performance or cash flows of the business based on the information currently available.
The Group's Niobium-Phosphorus business in Brazil
The Group's Niobium-Phosphorus business in Brazil may face with various litigations and disputes in its daily business activities. The management determine the possibility of losing and consequent economic benefits outflow in accordance with the information available and the professional advice of external legal experts. If the possibility of economic benefits outflow were low, the management would determine as contingencies. The results of such contingencies will not have a material adverse effect on the financial position, operating performance or cash flows of the business based on the information currently available.
(2) Guarantee
As at 31 December 2017, the Group’s Australian Northparkes Copper and gold mine business provides guarantees to the relevant business operations of Southwest Welsh government agencies of Australia, whose guarantee amount of AUD 32,920,000 (equivalent to RMB167,760,000). The relevant business venture agrees to any liability of the business compulsory executed from this guarantee. As at 31 December 2017, no material guarantee responsibility was undertaken.
(XII) EVENTS AFTER THE BALANCE SHEET DATE
According to the proposal of the board of directors, the Company will distribute a cash dividend of RMB0.076 (2016: RMB0.035) per share to all shareholders based on the issued shares of 21,599,240,583 for the year of 2017.

237China Molybdenum Co., Ltd.
NOTES TO THE FINANCIAL STATEMENTSFOR THE YEAR ENDED 31 DECEMBER 2017
(XIII) OTHER SIGNIFICANT EVENTS
1. Segment reporting
(1) Reporting segment’s confirmation basis and accounting policies
The management divided the Group’s business into five operating segments, namely Molybdenum Tungsten related products, Copper and gold-related products, Niobium and Phosphorus related products,Copper and Cobalt related products and others on the basis of the Group’s internal organization structure, management requirements and internal reporting system. The Group’s management evaluates the operating results of these segments regularly, in order to determine the allocation of resources and assess their performance.
These reporting segments are determined on the basis of internal management and reporting system. Information of segment reporting are disclosed according to segment accounting policies and measurement standards, the measurement basis should be corresponding with that of financial statements.
(2) Reporting segment’s financial information
Unit: RMB’000
2017
Molybdenum & tungsten
related products
Copper & gold related
products
Niobium related
products
Phosphorus related
products
Copper & cobalt related
products OthersUnallocated
itemIntersegmenteliminations Total
Operating revenueExternal revenue 3,772,287 1,663,826 1,670,082 2,834,186 13,844,637 362,540 – – 24,147,558Inter-segment revenue – – – – – – – – –Total segment operating revenue 3,772,287 1,663,826 1,670,082 2,834,186 13,844,637 362,540 – – 24,147,558Total operating revenue in the
financial statements 3,772,287 1,663,826 1,670,082 2,834,186 13,844,637 362,540 – – 24,147,558Operating cost 1,819,355 1,145,761 1,251,484 2,462,084 8,302,166 231,091 – – 15,211,941Taxes and levies 286,583 55,259 922 1,564 – – – – 344,328Selling expenses 24,006 59,926 20,625 12,379 97,905 – – – 214,841Administrative expenses – 10,180 228,472 256,074 32,507 – 631,861 – 1,159,094Financial expenses – 73,585 13,088 (43,628) 1,185 – 1,372,744 – 1,416,974Impairment losses of assets – 3,695 4,178 2,342 12,601 – 33,785 – 56,601Add: Ga ins (losses) from
changes in fair values – – – 4,392 – – (476,158) – (471,766)Investment income – – – – – – 108,699 – 108,699
The disposal of assets income (loss) – (420) – (16,650) (2,460) – 2,038 – (17,492)Other income – – – – – – 13,859 – 13,859Segment operating profit 1,642,343 315,000 151,313 131,113 5,395,813 131,449 (2,389,952) – 5,377,079Operating profit 1,642,343 315,000 151,313 131,113 5,395,813 131,449 (2,389,952) – 5,377,079Add: Non-operating income – 11,431 – – – – 27,615 – 39,046Less: Non-operating expenses – 1,319 – – – – 32,989 – 34,308Total profit 1,642,343 325,112 151,313 131,113 5,395,813 131,449 (2,395,326) – 5,381,817Less: Income tax expense 273,674 128,442 2,110 91,315 1,426,984 – (136,323) – 1,786,202Net profit 1,368,669 196,670 149,203 39,798 3,968,829 131,449 (2,259,003) – 3,595,615
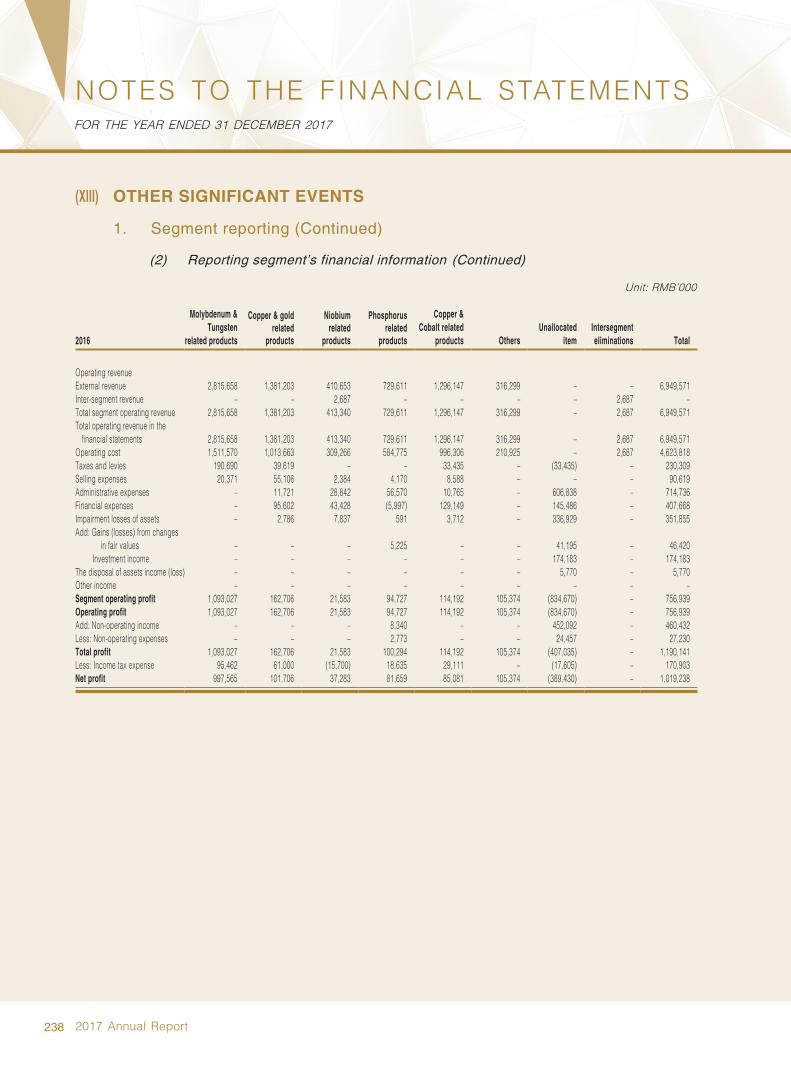
238 2017 Annual Report
NOTES TO THE FINANCIAL STATEMENTSFOR THE YEAR ENDED 31 DECEMBER 2017
(XIII) OTHER SIGNIFICANT EVENTS
1. Segment reporting (Continued)
(2) Reporting segment’s financial information (Continued)
Unit: RMB’000
2016
Molybdenum & Tungsten
related products
Copper & gold related
products
Niobium related
products
Phosphorus related
products
Copper & Cobalt related
products OthersUnallocated
itemIntersegment eliminations Total
Operating revenueExternal revenue 2,815,658 1,381,203 410,653 729,611 1,296,147 316,299 – – 6,949,571Inter-segment revenue – – 2,687 – – – – 2,687 –Total segment operating revenue 2,815,658 1,381,203 413,340 729,611 1,296,147 316,299 – 2,687 6,949,571Total operating revenue in the
financial statements 2,815,658 1,381,203 413,340 729,611 1,296,147 316,299 – 2,687 6,949,571Operating cost 1,511,570 1,013,663 309,266 584,775 996,306 210,925 – 2,687 4,623,818Taxes and levies 190,690 39,619 – – 33,435 – (33,435) – 230,309Selling expenses 20,371 55,106 2,384 4,170 8,588 – – – 90,619Administrative expenses – 11,721 28,842 56,570 10,765 – 606,838 – 714,736Financial expenses – 95,602 43,428 (5,997) 129,149 – 145,486 – 407,668Impairment losses of assets – 2,786 7,837 591 3,712 – 336,929 – 351,855Add: Ga ins (losses) from changes
in fair values – – – 5,225 – – 41,195 – 46,420Investment income – – – – – – 174,183 – 174,183
The disposal of assets income (loss) – – – – – – 5,770 – 5,770Other income – – – – – – – – –Segment operating profit 1,093,027 162,706 21,583 94,727 114,192 105,374 (834,670) – 756,939Operating profit 1,093,027 162,706 21,583 94,727 114,192 105,374 (834,670) – 756,939Add: Non-operating income – – – 8,340 – – 452,092 – 460,432Less: Non-operating expenses – – – 2,773 – – 24,457 – 27,230Total profit 1,093,027 162,706 21,583 100,294 114,192 105,374 (407,035) – 1,190,141Less: Income tax expense 95,462 61,000 (15,700) 18,635 29,111 – (17,605) – 170,903Net profit 997,565 101,706 37,283 81,659 85,081 105,374 (389,430) – 1,019,238

239China Molybdenum Co., Ltd.
NOTES TO THE FINANCIAL STATEMENTSFOR THE YEAR ENDED 31 DECEMBER 2017
(XIII) OTHER SIGNIFICANT EVENTS (CONTINUED)
1. Segment reporting (Continued)
(3) The Group mainly operates in China, Australia, Brazil and Congo (DRC), and sells to the customers in China and other countries. The geographic disclosure of revenue and results of segments are classified by the destination of the products to deliver.
Unit: RMB’000
Amount recognised in
the current year
Amount recognised in the prior year
RevenueChina 6,135,861 3,525,124Japan 965,173 837,917Brazil 2,838,114 730,678Switzerland 11,201 597,899Singapore – 378,065Finland 3,701,722 270,539Korea 462,103 204,094South Africa 5,709,141 –Zambia 3,098,449 –Belgium 308,158 –U.S.A 241,525 –Others 676,111 405,255 Total 24,147,558 6,949,571
(4) External revenue by location of resources and non-current assets by location
Unit: RMB’000
Items
Amount recognised in
the current year
Amount recognised in the prior year
External revenue from Chinese business 4,280,055 3,101,861External revenue from Australian business 1,686,559 1,410,775External revenue from Brazil business 4,336,306 1,140,788External revenue from Congo (DRC) business 13,844,638 1,296,147 Subtotal 24,147,558 6,949,571
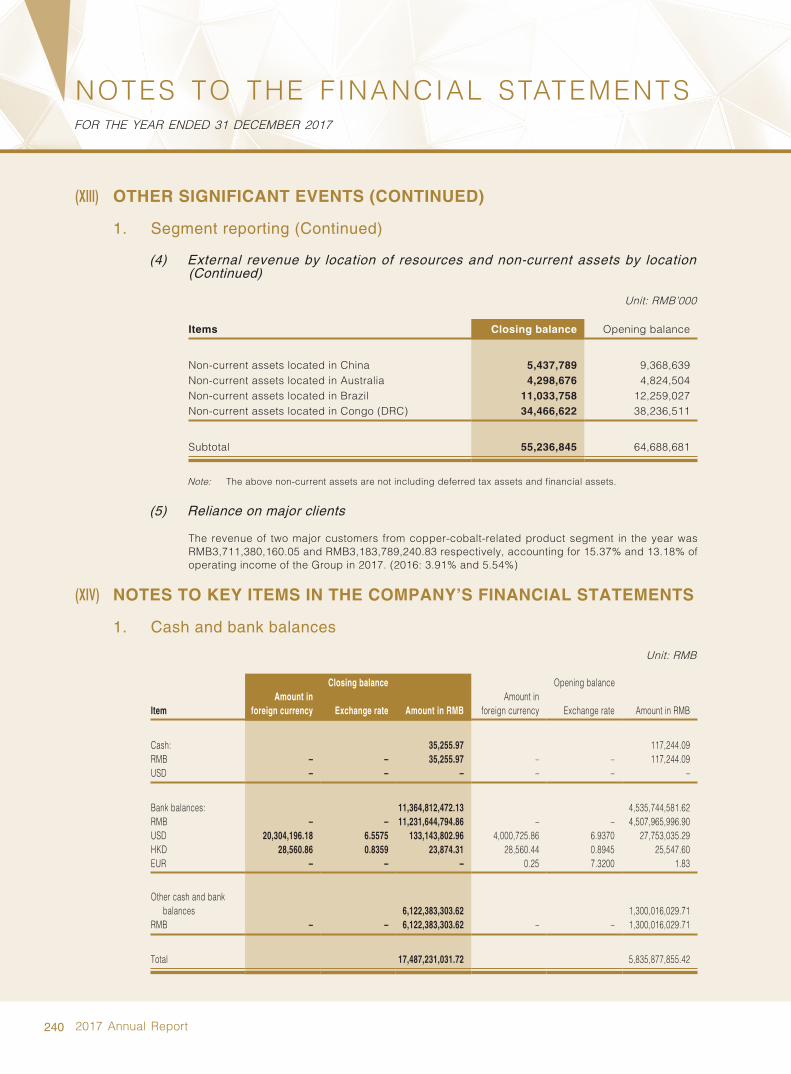
240 2017 Annual Report
NOTES TO THE FINANCIAL STATEMENTSFOR THE YEAR ENDED 31 DECEMBER 2017
(XIII) OTHER SIGNIFICANT EVENTS (CONTINUED)
1. Segment reporting (Continued)
(4) External revenue by location of resources and non-current assets by location (Continued)
Unit: RMB’000
Items Closing balance Opening balance
Non-current assets located in China 5,437,789 9,368,639Non-current assets located in Australia 4,298,676 4,824,504Non-current assets located in Brazil 11,033,758 12,259,027Non-current assets located in Congo (DRC) 34,466,622 38,236,511 Subtotal 55,236,845 64,688,681
Note: The above non-current assets are not including deferred tax assets and financial assets.
(5) Reliance on major clients
The revenue of two major customers from copper-cobalt-related product segment in the year was RMB3,711,380,160.05 and RMB3,183,789,240.83 respectively, accounting for 15.37% and 13.18% of operating income of the Group in 2017. (2016: 3.91% and 5.54%)
(XIV) NOTES TO KEY ITEMS IN THE COMPANY’S FINANCIAL STATEMENTS
1. Cash and bank balances
Unit: RMB
Closing balance Opening balance
ItemAmount in
foreign currency Exchange rate Amount in RMBAmount in
foreign currency Exchange rate Amount in RMB
Cash: 35,255.97 117,244.09 RMB – – 35,255.97 – – 117,244.09USD – – – – – –
Bank balances: 11,364,812,472.13 4,535,744,581.62 RMB – – 11,231,644,794.86 – – 4,507,965,996.90USD 20,304,196.18 6.5575 133,143,802.96 4,000,725.86 6.9370 27,753,035.29HKD 28,560.86 0.8359 23,874.31 28,560.44 0.8945 25,547.60EUR – – – 0.25 7.3200 1.83
Other cash and bank balances 6,122,383,303.62 1,300,016,029.71
RMB – – 6,122,383,303.62 – – 1,300,016,029.71
Total 17,487,231,031.72 5,835,877,855.42
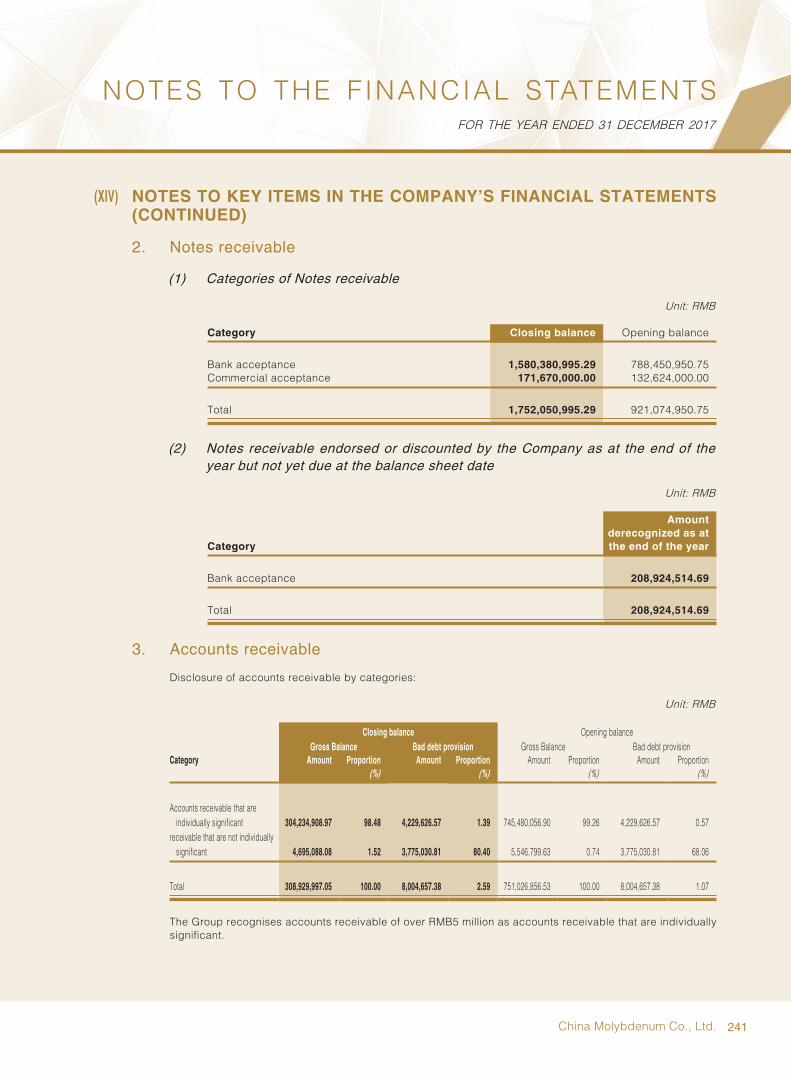
241China Molybdenum Co., Ltd.
NOTES TO THE FINANCIAL STATEMENTSFOR THE YEAR ENDED 31 DECEMBER 2017
(XIV) NOTES TO KEY ITEMS IN THE COMPANY’S FINANCIAL STATEMENTS (CONTINUED)
2. Notes receivable
(1) Categories of Notes receivable
Unit: RMB
Category Closing balance Opening balance
Bank acceptance 1,580,380,995.29 788,450,950.75Commercial acceptance 171,670,000.00 132,624,000.00 Total 1,752,050,995.29 921,074,950.75
(2) Notes receivable endorsed or discounted by the Company as at the end of the year but not yet due at the balance sheet date
Unit: RMB
Category
Amount derecognized as at the end of the year
Bank acceptance 208,924,514.69 Total 208,924,514.69
3. Accounts receivable
Disclosure of accounts receivable by categories:
Unit: RMB
Category
Closing balance Opening balanceGross Balance Bad debt provision Gross Balance Bad debt provision
Amount Proportion Amount Proportion Amount Proportion Amount Proportion (%) (%) (%) (%)
Accounts receivable that are individually significant 304,234,908.97 98.48 4,229,626.57 1.39 745,480,056.90 99.26 4,229,626.57 0.57
receivable that are not individually significant 4,695,088.08 1.52 3,775,030.81 80.40 5,546,799.63 0.74 3,775,030.81 68.06
Total 308,929,997.05 100.00 8,004,657.38 2.59 751,026,856.53 100.00 8,004,657.38 1.07
The Group recognises accounts receivable of over RMB5 million as accounts receivable that are individually significant.
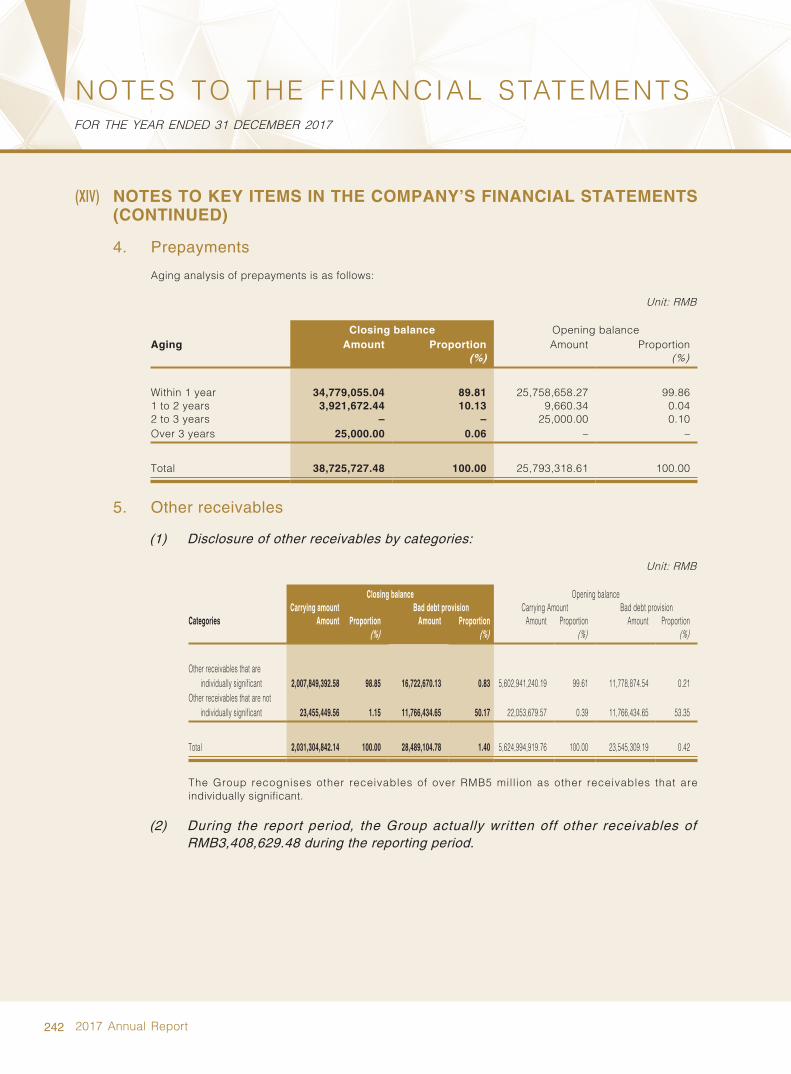
242 2017 Annual Report
NOTES TO THE FINANCIAL STATEMENTSFOR THE YEAR ENDED 31 DECEMBER 2017
(XIV) NOTES TO KEY ITEMS IN THE COMPANY’S FINANCIAL STATEMENTS (CONTINUED)
4. Prepayments
Aging analysis of prepayments is as follows:
Unit: RMB
Closing balance Opening balanceAging Amount Proportion Amount Proportion
(%) (%)
Within 1 year 34,779,055.04 89.81 25,758,658.27 99.861 to 2 years 3,921,672.44 10.13 9,660.34 0.042 to 3 years – – 25,000.00 0.10Over 3 years 25,000.00 0.06 – –
Total 38,725,727.48 100.00 25,793,318.61 100.00
5. Other receivables
(1) Disclosure of other receivables by categories:
Unit: RMB
Closing balance Opening balanceCarrying amount Bad debt provision Carrying Amount Bad debt provision
Categories Amount Proportion Amount Proportion Amount Proportion Amount Proportion(%) (%) (%) (%)
Other receivables that are individually significant 2,007,849,392.58 98.85 16,722,670.13 0.83 5,602,941,240.19 99.61 11,778,874.54 0.21
Other receivables that are not individually significant 23,455,449.56 1.15 11,766,434.65 50.17 22,053,679.57 0.39 11,766,434.65 53.35
Total 2,031,304,842.14 100.00 28,489,104.78 1.40 5,624,994,919.76 100.00 23,545,309.19 0.42
The Group recognises other receivables of over RMB5 million as other receivables that are individually significant.
(2) During the report period, the Group actually written off other receivables of RMB3,408,629.48 during the reporting period.
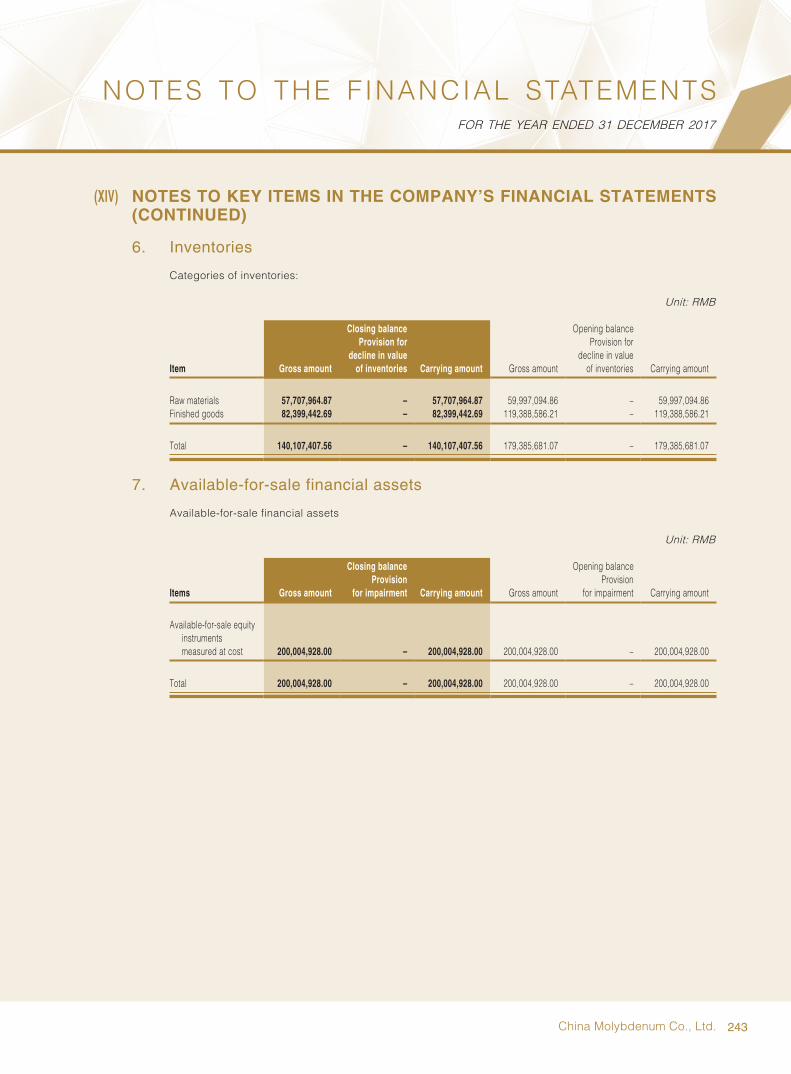
243China Molybdenum Co., Ltd.
NOTES TO THE FINANCIAL STATEMENTSFOR THE YEAR ENDED 31 DECEMBER 2017
(XIV) NOTES TO KEY ITEMS IN THE COMPANY’S FINANCIAL STATEMENTS (CONTINUED)
6. Inventories
Categories of inventories:
Unit: RMB
Closing balance Opening balance
Item Gross amount
Provision for decline in value
of inventories Carrying amount Gross amount
Provision for decline in value
of inventories Carrying amount
Raw materials 57,707,964.87 – 57,707,964.87 59,997,094.86 – 59,997,094.86Finished goods 82,399,442.69 – 82,399,442.69 119,388,586.21 – 119,388,586.21
Total 140,107,407.56 – 140,107,407.56 179,385,681.07 – 179,385,681.07
7. Available-for-sale financial assets
Available-for-sale financial assets
Unit: RMB
Closing balance Opening balance
Items Gross amountProvision
for impairment Carrying amount Gross amountProvision
for impairment Carrying amount
Available-for-sale equity instruments measured at cost 200,004,928.00 – 200,004,928.00 200,004,928.00 – 200,004,928.00
Total 200,004,928.00 – 200,004,928.00 200,004,928.00 – 200,004,928.00

244 2017 Annual Report
NOTES TO THE FINANCIAL STATEMENTSFOR THE YEAR ENDED 31 DECEMBER 2017
(XIV) NOTES TO KEY ITEMS IN THE COMPANY’S FINANCIAL STATEMENTS (CONTINUED)
8. Long-term equity investments
Details of long-term equity investment as follows:
Unit: RMB
Investee Initial investment cost Closing balance Opening balance
Equity Method Yulu Mining 20,000,000.00 92,494,720.24 69,629,450.40High-tech 135,000,000.00 77,095,493.01 88,762,283.32Huan Yu 973,335,000.00 723,111,792.29 775,225,287.45Luoyang Shenyu 1,500,000.00 1,185,576.97 1,314,112.19
Subtotal 1,129,835,000.00 893,887,582.51 934,931,133.36 Cost Method
Ye Lian 5,638,250.27 5,638,250.27 5,638,250.27Da Chuan 17,500,000.00 17,500,000.00 17,500,000.00Xiao Shou Mao Yi 2,000,000.00 2,000,000.00 2,000,000.00Da Dong Po 33,483,749.86 33,483,749.86 33,483,749.86Jiu Yang 17,028,900.00 17,028,900.00 17,028,900.00San Qiang 28,294,800.00 33,397,038.41 33,397,038.41International Hotel 210,000,000.00 210,000,000.00 210,000,000.00Wu Ye 100,000,000.00 100,000,000.00 100,000,000.00CMOC HK (Note 1) 1,869,455,300.96 1,869,455,300.96 0.96Metal Material 650,000,000.00 650,000,000.00 650,000,000.00Fu Run 8,803,190.84 8,803,190.84 8,803,190.84Xin Jiang Luo Mu 980,000,000.00 980,000,000.00 980,000,000.00Hu Qi 9,900,000.00 9,900,000.00 9,900,000.00Fu Kai 261,520,000.00 261,520,000.00 261,520,000.00Sales Company 50,000,000.00 50,000,000.00 50,000,000.00Qi Xing 46,963,636.00 46,963,636.00 46,963,636.00CMOC Ltd (Note 2) 575,797,299.48 15,096,649,809.48 13,018,677,299.48Schmocke 500,000,000.00 500,000,000.00 500,000,000.00Beijing YongBo 10,000,000.00 167,800,000.00 40,000,000.00
Subtotal 5,376,385,127.41 20,060,139,875.82 15,984,912,065.82 Total 20,954,027,458.33 16,919,843,199.18 Less: Provision for impairment losses – –Net amount of long-term equity
investments 20,954,027,458.33 16,919,843,199.18

245China Molybdenum Co., Ltd.
NOTES TO THE FINANCIAL STATEMENTSFOR THE YEAR ENDED 31 DECEMBER 2017
(XIV) NOTES TO KEY ITEMS IN THE COMPANY’S FINANCIAL STATEMENTS (CONTINUED)
8. Long-term equity investments (Continued)
Note 1: On 10 July 2017, upon the resolut ion of the Investment Committee, the Company increased capital of RMB1,869,455,300 to the wholly owned subsidiary of CMOC HK through debt capitalization.
Note 2: On 11 July 2017, upon the resolut ion of the Investment Committee, the Company increased capital of RMB1,872,972,510 to the wholly owned subsidiary, CMOC Ltd through debt capitalization. Meanwhile, the Company provided a guarantee for the USD loan of BHR (a subsidiary of CMOC Ltd) in the year, and recognized an investment cost according to the fair value of the guarantee.
9. Fixed assets
Unit: RMB
ItemsBuilding and
mining engineeringMachinery equipment
Electronic furniture and
fixturesTransportation
equipment Total
I. Total original carrying amount:1. Opening balance 2,591,964,117.75 786,992,157.45 155,199,825.20 126,618,155.80 3,660,774,256.202. Increased during current year 30,336,900.39 48,402,231.44 2,211,944.68 2,110,525.65 83,061,602.16
(1) Purchasing 826,441.94 3,055,023.19 1,236,086.29 2,110,525.65 7,228,077.07(2) Transferred from
construction-in-progress 29,510,458.45 45,347,208.25 975,858.39 – 75,833,525.093. Reduced during current year 121,445.83 – 895,726.50 3,208,782.37 4,225,954.70
(1) Disposal or retirement 121,445.83 – 895,726.50 3,208,782.37 4,225,954.704. Closing balance 2,622,179,572.31 835,394,388.89 156,516,043.38 125,519,899.08 3,739,609,903.66
II. Accumulated depreciation1. Opening balance 1,403,292,536.08 562,776,101.34 106,304,981.41 116,637,929.97 2,189,011,548.802. Increased during current year 99,152,624.48 45,655,810.96 9,632,047.94 1,779,623.87 156,220,107.25
(1) Provision 99,152,624.48 45,655,810.96 9,632,047.94 1,779,623.87 156,220,107.253. Reduced during current year 23,387.58 – 895,726.50 3,102,833.78 4,021,947.86
(1) Disposal or retirement 23,387.58 – 895,726.50 3,102,833.78 4,021,947.864. Closing balance 1,502,421,772.98 608,431,912.30 115,041,302.85 115,314,720.06 2,341,209,708.19
III. Impairment provision1. Opening balance – 3,945,202.39 – – 3,945,202.392. increased during current year – – – – –
(1) Provision – – – – –(2) Transferred from
construction-in-progress – – – – –3. Reduced during current year – – – – –
(1) Disposal or retirement – – – – –(2) Reduction because of
selling subsidiary – – – – –4. Closing balance – 3,945,202.39 – – 3,945,202.39
IV. Carrying amount1. Carrying amount at the
end of the year 1,119,757,799.33 223,017,274.20 41,474,740.53 10,205,179.02 1,394,454,993.082. Carrying amount at the
beginning of the year 1,188,671,581.67 220,270,853.72 48,894,843.79 9,980,225.83 1,467,817,505.01

246 2017 Annual Report
NOTES TO THE FINANCIAL STATEMENTSFOR THE YEAR ENDED 31 DECEMBER 2017
(XIV) NOTES TO KEY ITEMS IN THE COMPANY’S FINANCIAL STATEMENTS (CONTINUED)
10. Intangible assets
Unit: RMB
Item Land use right Mining right Trademark rightNon proprietary
technology Others Total
I. Total original carrying amount:1. Opening balance 317,342,691.27 408,985,700.00 1,286,750.00 83,831,281.87 10,236,946.99 821,683,370.132. Increased during
current year 10,406,831.55 – – 142,883.31 101,367.52 10,651,082.38(1) Purchasing 10,406,831.55 – – 142,883.31 101,367.52 10,651,082.38
3. Reduced during current year – – – – – –(1) Disposal – – – – – –
4. Closing balance 327,749,522.82 408,985,700.00 1,286,750.00 83,974,165.18 10,338,314.51 832,334,452.51
II. Accumulated amortization1. Opening balance 64,211,607.88 280,766,817.96 1,066,468.89 39,819,859.14 3,776,030.94 389,640,784.812. Increased during
current year 7,282,614.45 27,219,369.48 – 8,388,341.34 840,983.76 43,731,309.03(1) Provision 7,282,614.45 27,219,369.48 – 8,388,341.34 840,983.76 43,731,309.03
3. Reduced during current year – – – – – –(1) Disposal – – – – – –
4. Closing balance 71,494,222.33 307,986,187.44 1,066,468.89 48,208,200.48 4,617,014.70 433,372,093.84
III. Impairment provision1. Opening balance – – – – – –2. Increased during
current year – – – – – –(1) Provision – – – – – –
3. Reduced during current year – – – – – –(1) Disposal – – – – – –(2) Decrease
for sale of subsidiary – – – – – –
4. Closing balance – – – – – –
IV. Carrying amount1. Carrying amount at
the end of the year 256,255,300.49 100,999,512.56 220,281.11 35,765,964.70 5,721,299.81 398,962,358.672. Carrying amount at
the beginning of the year 253,131,083.39 128,218,882.04 220,281.11 44,011,422.73 6,460,916.05 432,042,585.32
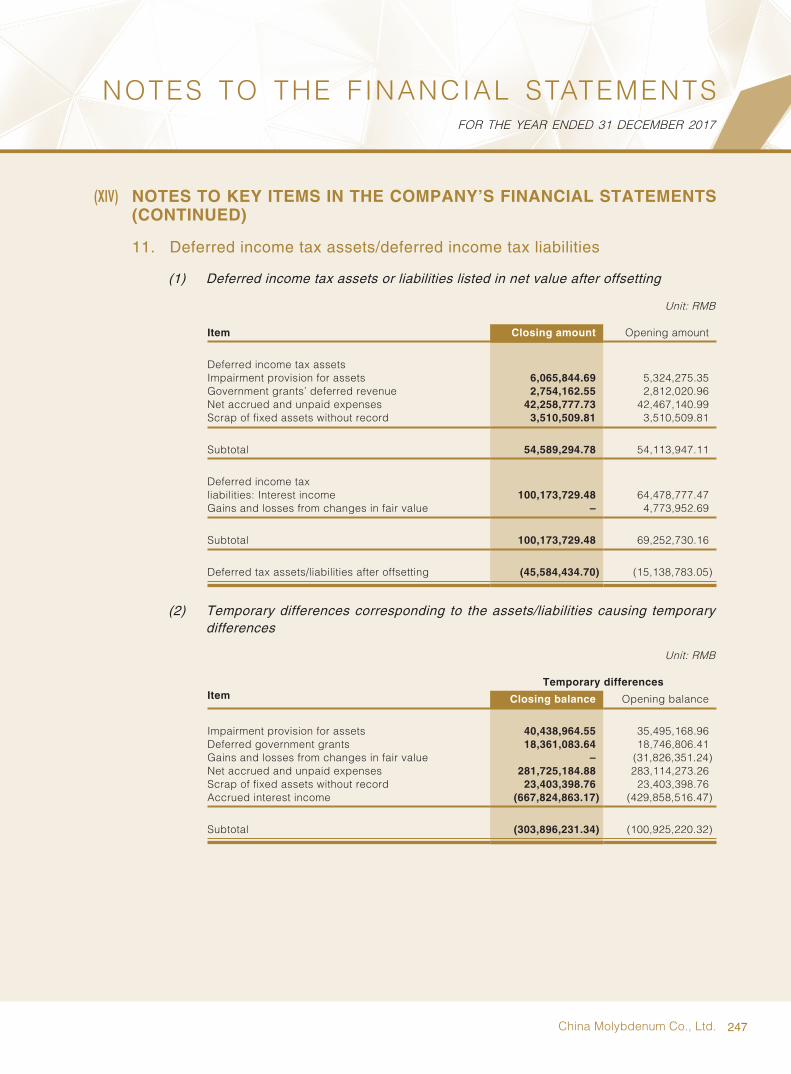
247China Molybdenum Co., Ltd.
NOTES TO THE FINANCIAL STATEMENTSFOR THE YEAR ENDED 31 DECEMBER 2017
(XIV) NOTES TO KEY ITEMS IN THE COMPANY’S FINANCIAL STATEMENTS (CONTINUED)
11. Deferred income tax assets/deferred income tax liabilities
(1) Deferred income tax assets or liabilities listed in net value after offsetting
Unit: RMB
Item Closing amount Opening amount
Deferred income tax assetsImpairment provision for assets 6,065,844.69 5,324,275.35Government grants’ deferred revenue 2,754,162.55 2,812,020.96Net accrued and unpaid expenses 42,258,777.73 42,467,140.99Scrap of fixed assets without record 3,510,509.81 3,510,509.81
Subtotal 54,589,294.78 54,113,947.11
Deferred income taxliabilities: Interest income 100,173,729.48 64,478,777.47Gains and losses from changes in fair value – 4,773,952.69
Subtotal 100,173,729.48 69,252,730.16
Deferred tax assets/liabilities after offsetting (45,584,434.70) (15,138,783.05)
(2) Temporary differences corresponding to the assets/liabilities causing temporary differences
Unit: RMB
ItemTemporary differences
Closing balance Opening balance
Impairment provision for assets 40,438,964.55 35,495,168.96Deferred government grants 18,361,083.64 18,746,806.41Gains and losses from changes in fair value – (31,826,351.24)Net accrued and unpaid expenses 281,725,184.88 283,114,273.26Scrap of fixed assets without record 23,403,398.76 23,403,398.76Accrued interest income (667,824,863.17) (429,858,516.47)
Subtotal (303,896,231.34) (100,925,220.32)
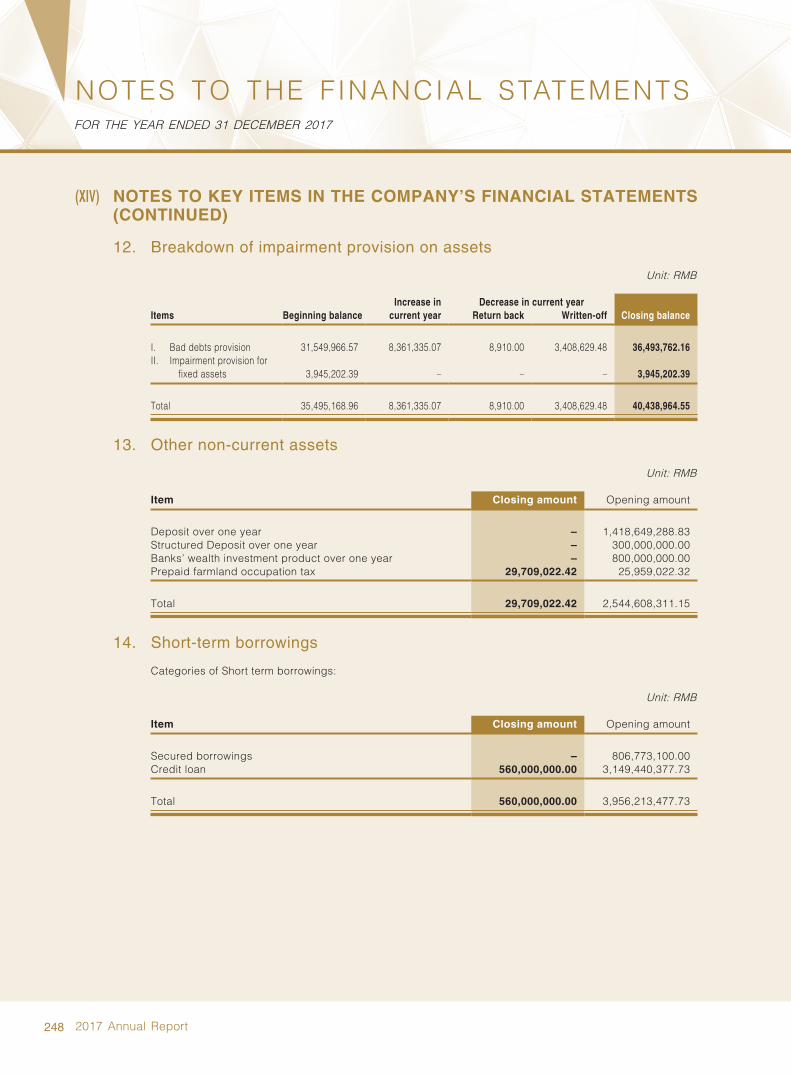
248 2017 Annual Report
NOTES TO THE FINANCIAL STATEMENTSFOR THE YEAR ENDED 31 DECEMBER 2017
(XIV) NOTES TO KEY ITEMS IN THE COMPANY’S FINANCIAL STATEMENTS (CONTINUED)
12. Breakdown of impairment provision on assets
Unit: RMB
Items Beginning balanceIncrease in
current yearDecrease in current year
Closing balanceReturn back Written-off
I. Bad debts provision 31,549,966.57 8,361,335.07 8,910.00 3,408,629.48 36,493,762.16II. Impairment provision for
fixed assets 3,945,202.39 – – – 3,945,202.39
Total 35,495,168.96 8,361,335.07 8,910.00 3,408,629.48 40,438,964.55
13. Other non-current assets
Unit: RMB
Item Closing amount Opening amount
Deposit over one year – 1,418,649,288.83Structured Deposit over one year – 300,000,000.00Banks’ wealth investment product over one year – 800,000,000.00Prepaid farmland occupation tax 29,709,022.42 25,959,022.32
Total 29,709,022.42 2,544,608,311.15
14. Short-term borrowings
Categories of Short term borrowings:
Unit: RMB
Item Closing amount Opening amount
Secured borrowings – 806,773,100.00Credit loan 560,000,000.00 3,149,440,377.73
Total 560,000,000.00 3,956,213,477.73
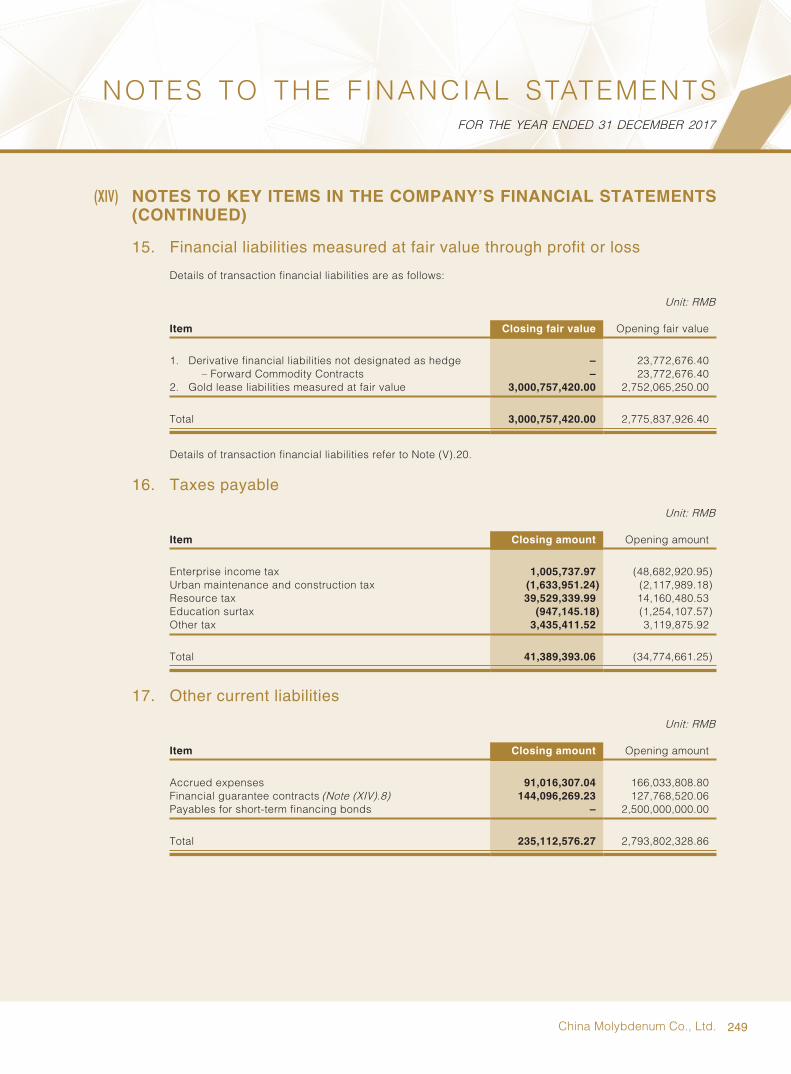
249China Molybdenum Co., Ltd.
NOTES TO THE FINANCIAL STATEMENTSFOR THE YEAR ENDED 31 DECEMBER 2017
(XIV) NOTES TO KEY ITEMS IN THE COMPANY’S FINANCIAL STATEMENTS (CONTINUED)
15. Financial liabilities measured at fair value through profit or loss
Details of transaction financial liabilities are as follows:
Unit: RMB
Item Closing fair value Opening fair value
1. Derivative financial liabilities not designated as hedge – 23,772,676.40– Forward Commodity Contracts – 23,772,676.40
2. Gold lease liabilities measured at fair value 3,000,757,420.00 2,752,065,250.00
Total 3,000,757,420.00 2,775,837,926.40
Details of transaction financial liabilities refer to Note (V).20.
16. Taxes payable
Unit: RMB
Item Closing amount Opening amount
Enterprise income tax 1,005,737.97 (48,682,920.95)Urban maintenance and construction tax (1,633,951.24) (2,117,989.18)Resource tax 39,529,339.99 14,160,480.53Education surtax (947,145.18) (1,254,107.57)Other tax 3,435,411.52 3,119,875.92
Total 41,389,393.06 (34,774,661.25)
17. Other current liabilities
Unit: RMB
Item Closing amount Opening amount
Accrued expenses 91,016,307.04 166,033,808.80Financial guarantee contracts (Note (XIV).8) 144,096,269.23 127,768,520.06Payables for short-term financing bonds – 2,500,000,000.00
Total 235,112,576.27 2,793,802,328.86
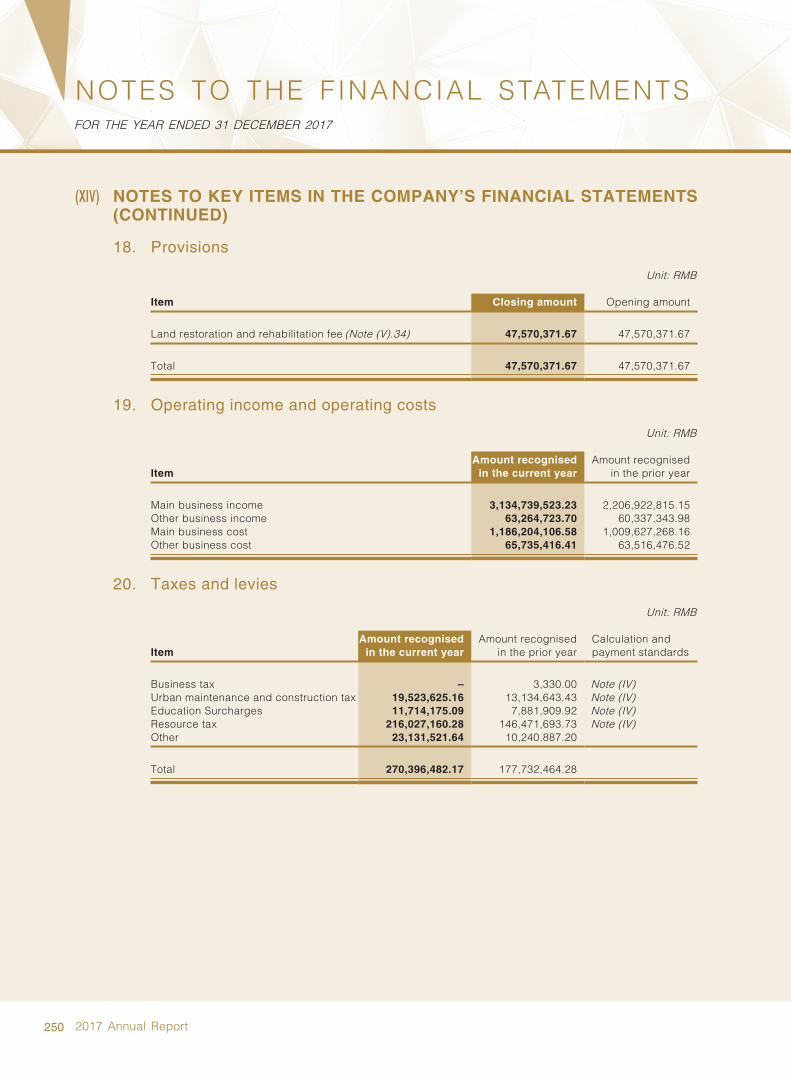
250 2017 Annual Report
NOTES TO THE FINANCIAL STATEMENTSFOR THE YEAR ENDED 31 DECEMBER 2017
(XIV) NOTES TO KEY ITEMS IN THE COMPANY’S FINANCIAL STATEMENTS (CONTINUED)
18. Provisions
Unit: RMB
Item Closing amount Opening amount
Land restoration and rehabilitation fee (Note (V).34) 47,570,371.67 47,570,371.67
Total 47,570,371.67 47,570,371.67
19. Operating income and operating costs
Unit: RMB
ItemAmount recognised
in the current yearAmount recognised
in the prior year
Main business income 3,134,739,523.23 2,206,922,815.15Other business income 63,264,723.70 60,337,343.98Main business cost 1,186,204,106.58 1,009,627,268.16Other business cost 65,735,416.41 63,516,476.52
20. Taxes and levies
Unit: RMB
ItemAmount recognised
in the current yearAmount recognised
in the prior yearCalculation and payment standards
Business tax – 3,330.00 Note (IV)Urban maintenance and construction tax 19,523,625.16 13,134,643.43 Note (IV)Education Surcharges 11,714,175.09 7,881,909.92 Note (IV)Resource tax 216,027,160.28 146,471,693.73 Note (IV)Other 23,131,521.64 10,240,887.20
Total 270,396,482.17 177,732,464.28
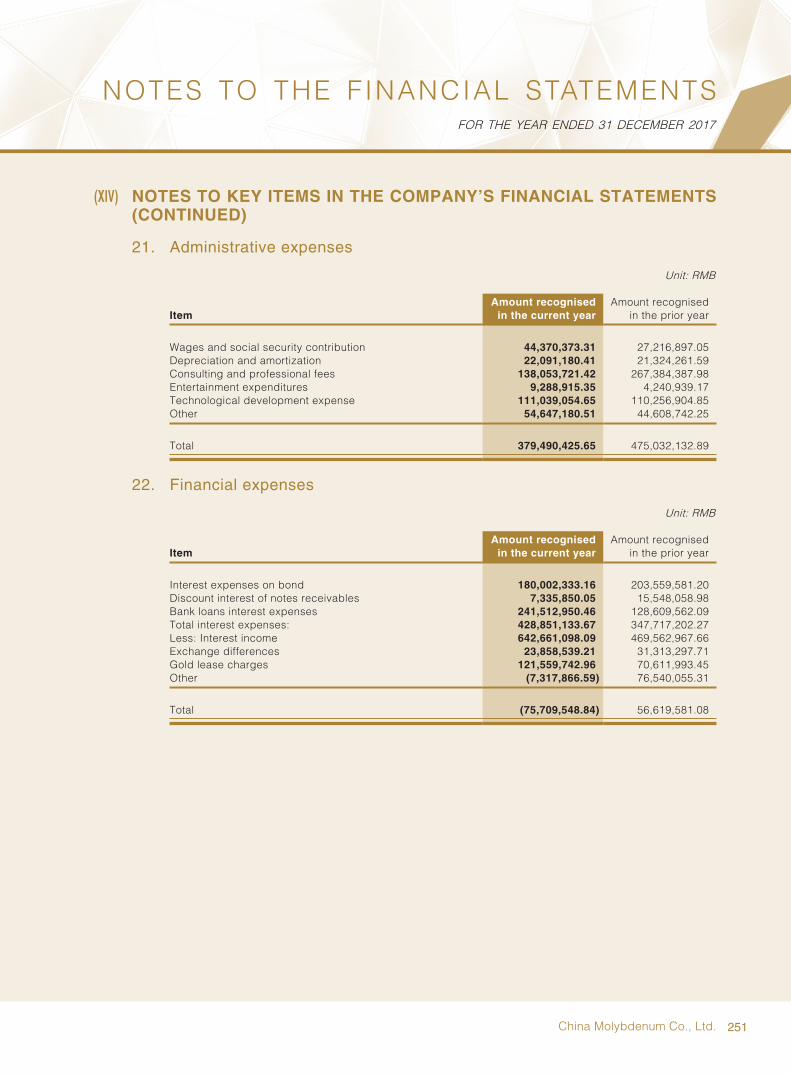
251China Molybdenum Co., Ltd.
NOTES TO THE FINANCIAL STATEMENTSFOR THE YEAR ENDED 31 DECEMBER 2017
(XIV) NOTES TO KEY ITEMS IN THE COMPANY’S FINANCIAL STATEMENTS (CONTINUED)
21. Administrative expenses
Unit: RMB
ItemAmount recognised
in the current yearAmount recognised
in the prior year
Wages and social security contribution 44,370,373.31 27,216,897.05Depreciation and amortization 22,091,180.41 21,324,261.59Consulting and professional fees 138,053,721.42 267,384,387.98Entertainment expenditures 9,288,915.35 4,240,939.17Technological development expense 111,039,054.65 110,256,904.85Other 54,647,180.51 44,608,742.25
Total 379,490,425.65 475,032,132.89
22. Financial expenses
Unit: RMB
ItemAmount recognised
in the current yearAmount recognised
in the prior year
Interest expenses on bond 180,002,333.16 203,559,581.20Discount interest of notes receivables 7,335,850.05 15,548,058.98Bank loans interest expenses 241,512,950.46 128,609,562.09Total interest expenses: 428,851,133.67 347,717,202.27Less: Interest income 642,661,098.09 469,562,967.66Exchange differences 23,858,539.21 31,313,297.71Gold lease charges 121,559,742.96 70,611,993.45Other (7,317,866.59) 76,540,055.31
Total (75,709,548.84) 56,619,581.08

252 2017 Annual Report
NOTES TO THE FINANCIAL STATEMENTSFOR THE YEAR ENDED 31 DECEMBER 2017
(XIV) NOTES TO KEY ITEMS IN THE COMPANY’S FINANCIAL STATEMENTS (CONTINUED)
23. Assets impairment losses
Unit: RMB
ItemAmount recognised
in the current yearAmount recognised
in the prior year
Bad debt losses 8,352,425.07 10,753,661.39Impairment loss of fixed assets – 1,193,936.69
Total 8,352,425.07 11,947,598.08
24. Investment income
Unit: RMB
ItemAmount recognised
in the current yearAmount recognised
in the prior year
Income (loss) from long-term equity investments under equity method 44,256,449.15 16,287,797.94
Investment income from bonds and banks’ wealth investment product 2,308,688.29 93,608,673.75
Loss from investment during the held-for-trading financial assets 76,095,119.34 (3,736,797.34)
Derivatives that are not specified as hedging relationship – (16,752,200.00)
Total 122,660,256.78 89,407,474.35
25. Non-operating income
Unit: RMB
ItemAmount recognised
in the current yearAmount recognised
in the prior year
Government grants 9,582,040.00 23,690,677.65Other 178,057.80 4,769,446.76
Total 9,760,097.80 28,460,124.41
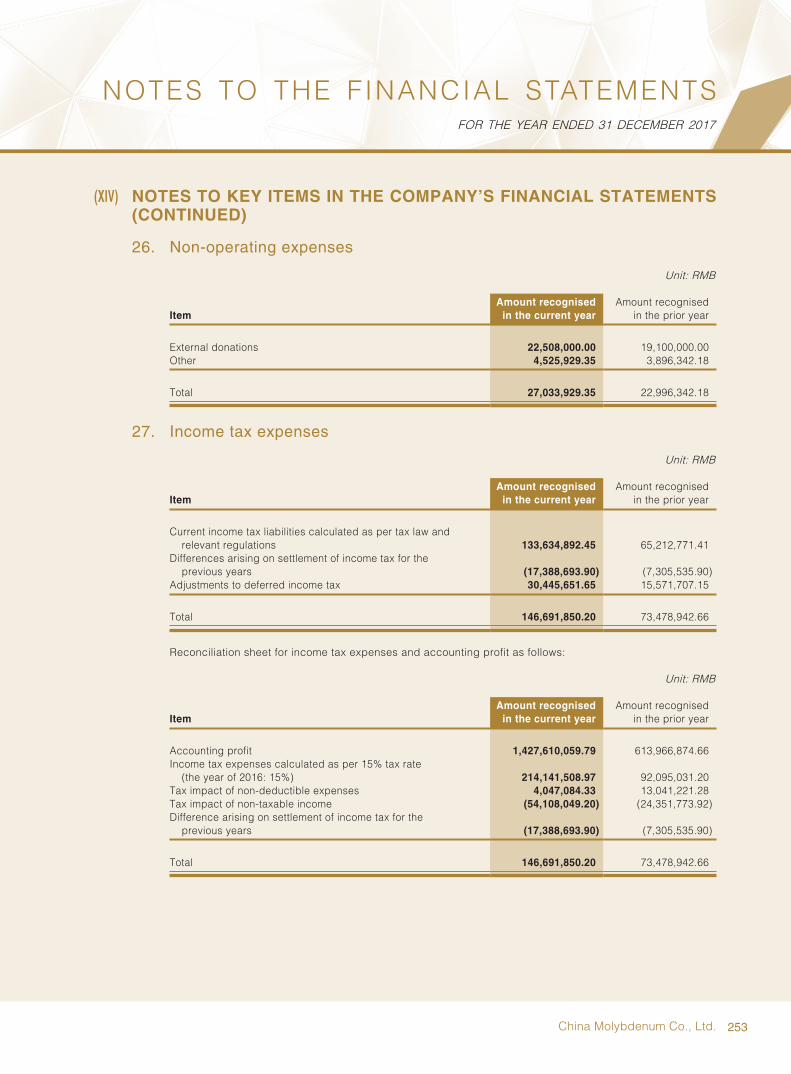
253China Molybdenum Co., Ltd.
NOTES TO THE FINANCIAL STATEMENTSFOR THE YEAR ENDED 31 DECEMBER 2017
(XIV) NOTES TO KEY ITEMS IN THE COMPANY’S FINANCIAL STATEMENTS (CONTINUED)
26. Non-operating expenses
Unit: RMB
ItemAmount recognised
in the current yearAmount recognised
in the prior year
External donations 22,508,000.00 19,100,000.00Other 4,525,929.35 3,896,342.18
Total 27,033,929.35 22,996,342.18
27. Income tax expenses
Unit: RMB
ItemAmount recognised
in the current yearAmount recognised
in the prior year
Current income tax liabilities calculated as per tax law and relevant regulations 133,634,892.45 65,212,771.41
Differences arising on settlement of income tax for the previous years (17,388,693.90) (7,305,535.90)
Adjustments to deferred income tax 30,445,651.65 15,571,707.15
Total 146,691,850.20 73,478,942.66
Reconciliation sheet for income tax expenses and accounting profit as follows:
Unit: RMB
ItemAmount recognised
in the current yearAmount recognised
in the prior year
Accounting profit 1,427,610,059.79 613,966,874.66Income tax expenses calculated as per 15% tax rate
(the year of 2016: 15%) 214,141,508.97 92,095,031.20Tax impact of non-deductible expenses 4,047,084.33 13,041,221.28Tax impact of non-taxable income (54,108,049.20) (24,351,773.92)Difference arising on settlement of income tax for the
previous years (17,388,693.90) (7,305,535.90)
Total 146,691,850.20 73,478,942.66
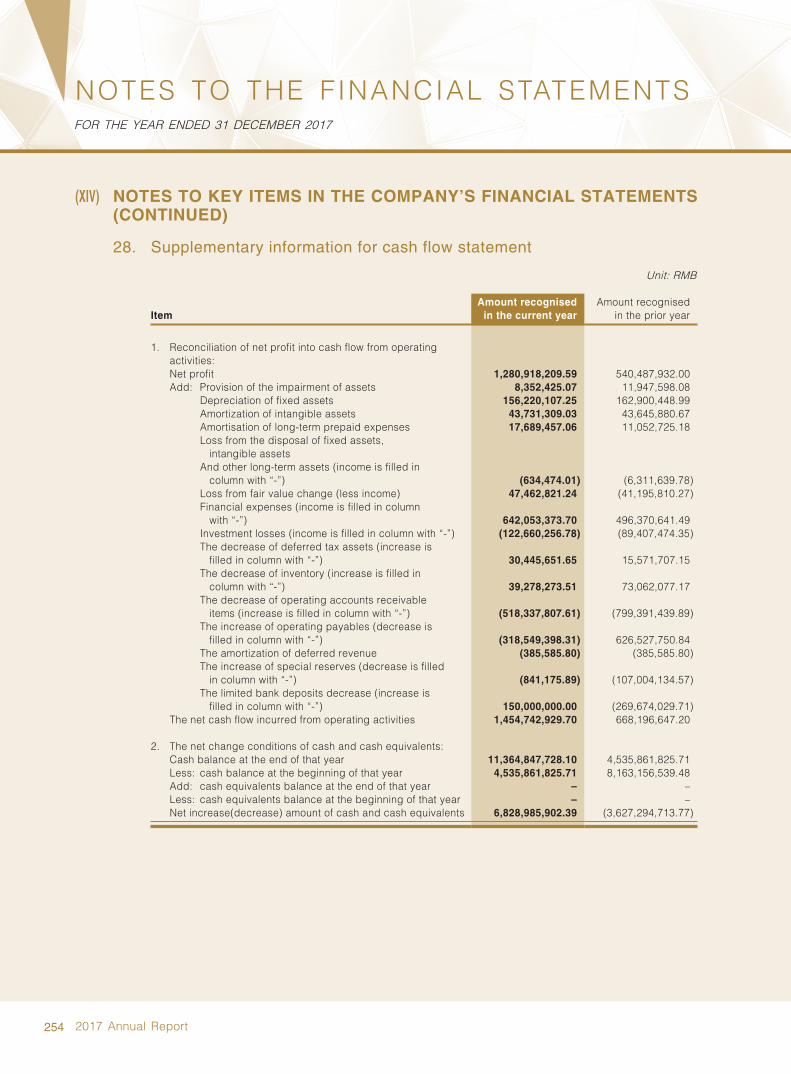
254 2017 Annual Report
NOTES TO THE FINANCIAL STATEMENTSFOR THE YEAR ENDED 31 DECEMBER 2017
(XIV) NOTES TO KEY ITEMS IN THE COMPANY’S FINANCIAL STATEMENTS (CONTINUED)
28. Supplementary information for cash flow statement
Unit: RMB
ItemAmount recognised
in the current yearAmount recognised
in the prior year
1. Reconciliation of net profit into cash flow from operating activities:Net profit 1,280,918,209.59 540,487,932.00Add: Provision of the impairment of assets 8,352,425.07 11,947,598.08
Depreciation of fixed assets 156,220,107.25 162,900,448.99Amortization of intangible assets 43,731,309.03 43,645,880.67Amortisation of long-term prepaid expenses 17,689,457.06 11,052,725.18Loss from the disposal of fixed assets,
intangible assetsAnd other long-term assets (income is filled in
column with “-”) (634,474.01) (6,311,639.78)Loss from fair value change (less income) 47,462,821.24 (41,195,810.27)Financial expenses (income is filled in column
with “-”) 642,053,373.70 496,370,641.49Investment losses (income is filled in column with “-”) (122,660,256.78) (89,407,474.35)The decrease of deferred tax assets (increase is
filled in column with “-”) 30,445,651.65 15,571,707.15The decrease of inventory (increase is filled in
column with “-”) 39,278,273.51 73,062,077.17The decrease of operating accounts receivable
items (increase is filled in column with “-”) (518,337,807.61) (799,391,439.89)The increase of operating payables (decrease is
filled in column with “-”) (318,549,398.31) 626,527,750.84The amortization of deferred revenue (385,585.80) (385,585.80)The increase of special reserves (decrease is filled
in column with “-”) (841,175.89) (107,004,134.57)The limited bank deposits decrease (increase is
filled in column with “-”) 150,000,000.00 (269,674,029.71)The net cash flow incurred from operating activities 1,454,742,929.70 668,196,647.20
2. The net change conditions of cash and cash equivalents:Cash balance at the end of that year 11,364,847,728.10 4,535,861,825.71Less: cash balance at the beginning of that year 4,535,861,825.71 8,163,156,539.48Add: cash equivalents balance at the end of that year – –Less: cash equivalents balance at the beginning of that year – –Net increase(decrease) amount of cash and cash equivalents 6,828,985,902.39 (3,627,294,713.77)

255China Molybdenum Co., Ltd.
NOTES TO THE FINANCIAL STATEMENTSFOR THE YEAR ENDED 31 DECEMBER 2017
(XIV) NOTES TO KEY ITEMS IN THE COMPANY’S FINANCIAL STATEMENTS (CONTINUED)
29. Related party relationships and transactions
Please refer to note (VII).1 for the subsidiaries of the enterprise and note (v), 11 for associates and joint ventures of the enterprise.
(1) Details on related party transactions
(1.1) Sales and purchase of goods, provision and receipt of services
Unit: RMB
The related party Related transaction type
Content of related party transactions
Related transaction pricing methods and decision-making process
Amount for the current year
Amount for the prior year
The Sales Company
Goods Sales Contract price 516,854,187.69 720,692,341.71
Ye Lian Goods Sales Contract price 717,715,522.47 265,625,967.71Xiao Shou Mao Yi Goods Sales Contract price 289,102,718.76 1,794.73Da Chuan Goods Sales Contract price – 3,538,360.14Da Dong Po Goods Sales Contract price 72,626,577.25 35,227,546.35Jiu Yang Goods Sales Contract price 51,486,333.36 40,853,508.76San Qiang Goods Sales Contract price 74,182,092.55 58,226,883.62Wu Ye Goods Sales Contract price 506,852,146.56 192,159,002.61Metal Material Goods Sales/provide the
charge for use of specific technology
Contract price 693,294,144.76 629,884,495.66
Total 2,922,113,723.40 1,946,209,901.29
San Qiang Service/Goods Accept services/purchase of goods and material
Contract price 295,549.16 –
Da Chuan Goods Purchase of goods and materials
Contract price – 2,644,444.44
Jiu Yang Service/Goods Accept services/purchase of goods and material
Contract price 2,120,659.33 2,242,796.09
Metal Material Goods Purchase of goods and materials
Contract price 31,869,242.53 7,145,519.59
Xiao Shou Mao Yi Service Accept services Contract price 15,933,452.70 7,201,519.01Ye Lian Service/Goods Accept services/
purchase of goods and material
Contract price 238,323.08 1,679.01
Schmocke Service Accept services Contract price 26,660,000.00 –Beijing Yongbo Service Accept services Contract price 20,530,000.00 –International Hotel Service Accept services Contract price 11,479,245.72 –Da Dong Po Goods Purchase of goods
and materialsContract price 231,486.86 –
Mudu Trading Goods Purchase of goods and materials
Contract price 2,794,371.29 –
Total 112,152,330.67 19,235,958.14

256 2017 Annual Report
NOTES TO THE FINANCIAL STATEMENTSFOR THE YEAR ENDED 31 DECEMBER 2017
(XIV) N O T E S T O K E Y I T E M S I N T H E C O M P A N Y ’ S F I N A N C I A L STATEMENTS (CONTINUED)
29. Related party relationships and transactions (Continued)
(1) Details on related party transactions (Continued)
(1.2) Loans and borrowings of the related party
Except the related party financing disclosures in note (X).6, the financing transactions between our company and other related parties are as follows:
Unit: RMB
Lent to during the current year
Received during the current year Closing balance
Lent to during the prior year
Received during the prior year Opening balance
Unit: RMB Unit: RMB Unit: RMB Unit: RMB Unit: RMB Unit: RMB
Lent toSales Company – – – 8,196,907,147.78 8,669,281,635.79 –Xiao Shou Mao Yi 106,143,525.86 – 106,143,525.86 – – –Ye lian – – – 1,717,266,905.90 1,838,307,028.91 –International Hotel 113,999,702.67 137,039,963.52 102,053,448.58 51,583,947.08 72,798,131.38 125,093,709.43Jiu Yang 417,169,956.49 369,371,351.24 86,567,553.77 28,592,317.48 76,390,922.73 38,768,948.52CMOC HK (Note1) 9,421,661.00 1,899,766,929.00 11,135,925.96 1,186,240,621.00 805,253,567.00 1,901,481,193.96CMOC Ltd (Note 2) 945,440,290.00 2,745,122,560.00 393,020,057.72 2,326,830,623.09 147,115,495.37 2,192,702,327.72Qi Xing 323,490.00 – 66,362,027.59 1,241,895.00 – 66,038,537.59Schmocke – – 1,066,000,000.00 741,000,000.00 50,000.00 1,066,000,000.00Fu Run 25,000.00 571,590.93 18,206,602.98 1,966,475.62 – 18,753,193.91Yuehe 892,000.00 – 59,437,579.99 58,545,579.99 – 58,545,579.99
Total 1,593,415,626.02 5,151,872,394.69 1,908,926,722.45 14,310,175,512.94 11,609,196,781.18 5,467,383,491.12
Note 1: Decrease of RMB1,869,455,300 in the amount for the year is resulted from the Company's capital increase to CMOC HK through debt capitalization.
Note 2: Decrease of RMB1,872,972,510.00 in the amount for the year is resulted from the Company's capital increase to CMOC Ltd through debt capitalization.

257China Molybdenum Co., Ltd.
NOTES TO THE FINANCIAL STATEMENTSFOR THE YEAR ENDED 31 DECEMBER 2017
(XIV) NOTES TO KEY ITEMS IN THE COMPANY’S FINANCIAL STATEMENTS (CONTINUED)
29. Related party relationships and transactions (Continued)
(1) Details on related party transactions (Continued)
(1.2) Loans and borrowings of the related party (Continued)
Unit: RMB
Lent to during the current year
Repaid during current year
Closing balance of current year
Lent to during the prior year
Repaid during prior year
Opening balance of current year
Unit: RMB Unit: RMB Unit: RMB Unit: RMB Unit: RMB Unit: RMB
Borrowed fromSales Company 4,318,845,310.15 4,398,296,402.08 165,224,461.66 244,675,553.59 – 244,675,553.59Xiao Shou Mao Yi 55,763,884.09 62,259,037.91 – 10,475,036.33 8,204,495.24 6,495,153.82Wu Ye 215,836,939.40 110,798,549.66 105,038,389.74 282,455,547.35 346,915,514.46 –Metal Material 3,456,039,244.80 3,366,083,267.83 92,582,287.53 3,392,952,402.51 3,729,580,427.01 2,626,310.56San Qiang 434,303,090.53 434,303,090.53 – 281,569,923.43 473,720,231.41 –Da Dong Po 134,139,750.84 134,797,492.01 326,627.00 237,687,308.10 237,184,769.67 984,368.17Da Chuan 48,583,275.67 55,470,498.12 8,882,427.20 67,557,368.13 58,801,417.37 15,769,649.65Xin Jiang Luo Mu 2,229,151.49 3,787,536.00 192,757,386.03 2,329,174.32 19,595,821.00 194,315,770.54Fu Kai – – 11,300,000.00 – – 11,300,000.00Hu Qi – – 9,900,000.00 – – 9,900,000.00Ye lian 2,507,906,159.80 2,301,300,246.07 206,605,913.73 – – –
Total 11,173,646,806.77 10,867,096,120.21 792,617,492.89 4,519,702,313.76 4,874,002,676.16 486,066,806.33
(1.3) Interest of related parties
The borrowings/loans with other related parties are as follows:
Current year Prior yearRMB RMB
Net interests paid to (charged from) related parties (85,855,412.10) (116,317,650.99)

258 2017 Annual Report
NOTES TO THE FINANCIAL STATEMENTSFOR THE YEAR ENDED 31 DECEMBER 2017
(XIV) NOTES TO KEY ITEMS IN THE COMPANY’S FINANCIAL STATEMENTS (CONTINUED)
29. Related party relationships and transactions (Continued)
(1) Details on related party transactions (Continued)
(1.4) Guarantees with related party
Guarantor Guaranteed party Guaranteed amountInception date of guarantee
Expiration date of guarantee
Whether execution of guarantee has been completed
China Molybdenum Co., Ltd. (Note 1), (Note 2)
CMOC Mining USD259,500,000 29 November 2013 29 November 2020 No
China Molybdenum Co., Ltd. (Note 1) CMOC Mining USD259,500,000 27 November 2013 27 November 2020 NoChina Molybdenum Co., Ltd. CMOC Mining AUD37,000,000 18 December 2013 18 December 2018 NoChina Molybdenum Co., Ltd. CMOC Mining USD40,000,000 5 June 2015 4 June 2017 NoChina Molybdenum Co., Ltd. CMOC Mining USD50,000,000 28 June 2015 30 June 2017 NoChina Molybdenum Co., Ltd. CMOC limited RMB1,000,000,000 15 August 2016 9 August 2018 NoChina Molybdenum Co., Ltd. CMOC limited USD80,000,000 16 August 2016 29 July 2018 NoChina Molybdenum Co., Ltd. CMOC Brazil
and CMOC LUXEMBOURG
USD907,000,000 29 September 2016 14 September 2023 No
China Molybdenum Co., Ltd. CMOC DRC USD1,593,000,000 15 November 2016 15 November 2023 NoChina Molybdenum Co., Ltd. (Note 3) BHR Newwood
Investment Management Limited
USD700,000,000 5 April 2017 5 April 2024 No
Note 1: The guarantee period of instalment debts is from the effective date of the contract to the two years after the discharge of last repayment.
Note 2: The guaranteed amount is USD259.5 million, which is used for bank borrowings for CMOC Mining, in the year end the outstanding bank borrowings are USD135.5 million.
Note 3: See note (XIV).8 for details.

259China Molybdenum Co., Ltd.
NOTES TO THE FINANCIAL STATEMENTSFOR THE YEAR ENDED 31 DECEMBER 2017
(XIV) NOTES TO KEY ITEMS IN THE COMPANY’S FINANCIAL STATEMENTS (CONTINUED)
29. Related party relationships and transactions (Continued)
(2) Amount due from and amount due to related parties
Unit: RMB
Item Related party Closing balance Opening balance
Accounts receivable Ye Lian 815,511.93 293,418,676.43Da Dong Po 7,701,638.76 518,212.34Jiu Yang 48,238.19 547,602.60San Qiang – 1,178,186.34The sales company 203,019,897.23 202,174,986.80Wu Ye 85,054,119.85 107,881,536.99
Dividends receivable San Qiang 10,118,892.09 10,118,892.09Da Dong Po 6,893,440.23 6,893,440.23Jiu Yang 26,993,751.76 26,993,751.76
Other receivables Yuehe Properties 59,437,579.99 58,545,579.99International Hotel 102,053,448.58 125,093,709.43Qi Xing 66,362,027.59 66,038,537.59Jiu Yang 86,567,553.77 38,768,948.52Da Chuan 71,000,000.00 85,000,000.00CMOC Co., Ltd 393,020,057.72 2,192,702,327.72Shimoke 1,066,000,000.00 1,066,000,000.00Fu Run 18,206,602.98 18,753,193.91CMOC HK 11,135,925.96 1,901,481,193.96Xiao Shou Mao Yi 106,143,525.86 –
Interest receivable CMOC HK 147,177,433.97 112,833,174.39Shimoke 7,613,680.30 3,586,628.96CMOC Co., Ltd 62,644,326.43 43,677,223.27
Interest payables Shimoke 180,635.03 180,635.03Other payables Sales Company 165,224,461.66 244,675,553.59
Metal Material 92,582,287.53 2,626,310.56Da Chuan 8,882,427.20 15,769,649.65Da Dong Po 326,627.00 984,368.17Fu Kai 11,300,000.00 11,300,000.00Hu Qi 9,900,000.00 9,900,000.00Xin Jiang Luo Mu 192,757,386.03 194,315,770.54Xiao Shou Mao Yi – 6,495,153.82Shimoke 28,259,600.00 –Beijing Yongbo 615,900.00 –Ye Lian 206,605,913.73 –Wu Ye 105,038,389.74 –
Accounts payables Xiao Shou Mao Yi 15,870.41 16,706.10Metal Material 60,061,068.55 23,791,035.92
Advances from customers
Xiao Shou Mao Yi 16,452.50 34,518.15Da Dong Po 129,177.64 –San Qiang 738,053.44 –
Other current liabilities Beijing Yongbo 20,530,000.00 –
(XV) APPROVAL OF THE FINANCIAL STATEMENTS
The Company’s financial statements and the consolidated financial statements were approved by the Board and authorised for issue on 29 March 2018.

260 2017 Annual Report
SUPPLEMENTARY INFORMATIONFOR THE YEAR ENDED 31 DECEMBER 2017
1. BREAKDOWN OF NON-RECURRING PROFIT OR LOSS
Unit: RMB
ItemAmount recognised
in the current yearAmount recognised
in the prior year
Net profit 3,595,615,427.82 1,019,238,434.20Add (less): Non-recurring profit or loss items – –
– Loss (Income) on disposal of non-current assets 17,491,578.26 (5,770,618.09)– Government grants (23,795,835.40) (25,748,779.11)– Income from bank’s wealth investment product (2,308,688.30) (94,793,860.23)– Income from the disposal of available-for-sale financial
assets (121,636.46) (92,667,004.11)– Loss (Income) from the disposal of held-for-trading
financial assets (76,095,119.34) 3,736,797.34– Derivatives not designated as hedging instruments – 16,752,200.00– Loss on impairment of available-for-sale financial assets – 291,757,534.75– Transaction expenses incurred in acquisition – 236,139,790.97– Loss on changes in fair value of the contingent
consideration for the acquisition of Congo (DRC) copper-cobalt business 428,694,671.16 –
– Other loss (income) on changes in the fair value 43,071,210.04 (46,420,313.67)– Loss on debt restructuring 48,000.00 499,687.98– Negative goodwill caused combinations not under
common control – (430,908,350.60)– Other net non-operating income or expenses other than
the above 5,151,065.19 24,149,315.23
Subtotal 392,135,245.15 (123,273,599.54)
Income tax effects from non-recurring profit or loss items 5,310,009.86 32,905,572.21Net profit after deducting non-recurring profit or loss items 3,993,060,682.83 928,870,406.87Including: Net profit attributable to shareholders of the parent
company 3,125,343,718.95 907,668,359.56Net profit attributable to minority interests 867,716,963.88 21,202,047.31
2. RETURN ON NET ASSETS AND EARNINGS PER SHARE (“EPS”)
The calculation of net assets and EPS prepared by China Molybdenum Co., Ltd. are in accordance with Information Disclosure and Presentation Rules for Entities with Public Offering of Securities No. 9 – Calculation and Disclosure of Return on Net Assets and Earnings per Share (Amended in 2010) issued by China Securities Regulatory Commission.
Unit: RMB
Profit for the reporting period
Weighted average return on net
assets
EPS
Basic EPS Diluted EPS(%)
Net profit attributable to ordinary shareholders of the Company 9.89 0.14 N/ANet profit after deduction of non-recurring profits or losses
attributable to ordinary shareholders of the Company 11.25 0.16 N/A

Stock Code: 3993
*
* For identification purposes only* For identification purposes only
*
2017ANNUAL REPORT
2017 AN
NU
AL R
EP
OR
T