malnutrition in children. principles of dehydration correction. sakharova inna ye., md, phd
TRANSCRIPT
MALNUTRITION IN MALNUTRITION IN CHILDRENCHILDREN..
PRINCIPLES OF PRINCIPLES OF DEHYDRATION DEHYDRATION CORRECTION.CORRECTION.
Sakharova Inna Ye., MD, Sakharova Inna Ye., MD, PhDPhD
22
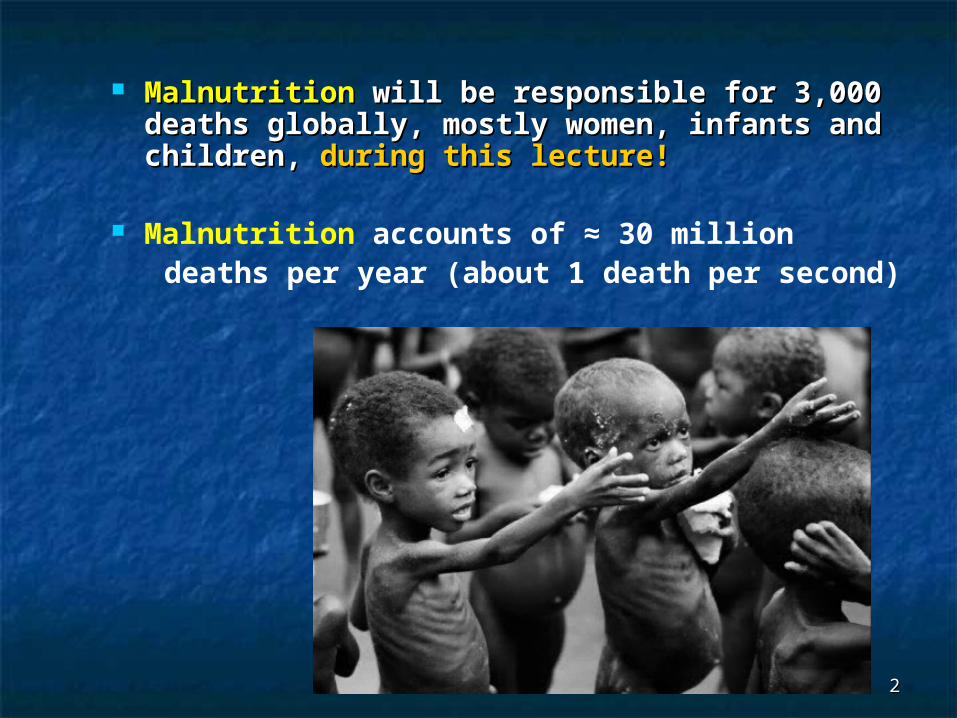
MalnutritionMalnutrition will be responsible for 3,000 will be responsible for 3,000 deaths globally, mostly women, infants deaths globally, mostly women, infants and children, and children, during this lecture!during this lecture!
Malnutrition accounts of ≈ 30 million deaths per year (about 1 death per second)
33
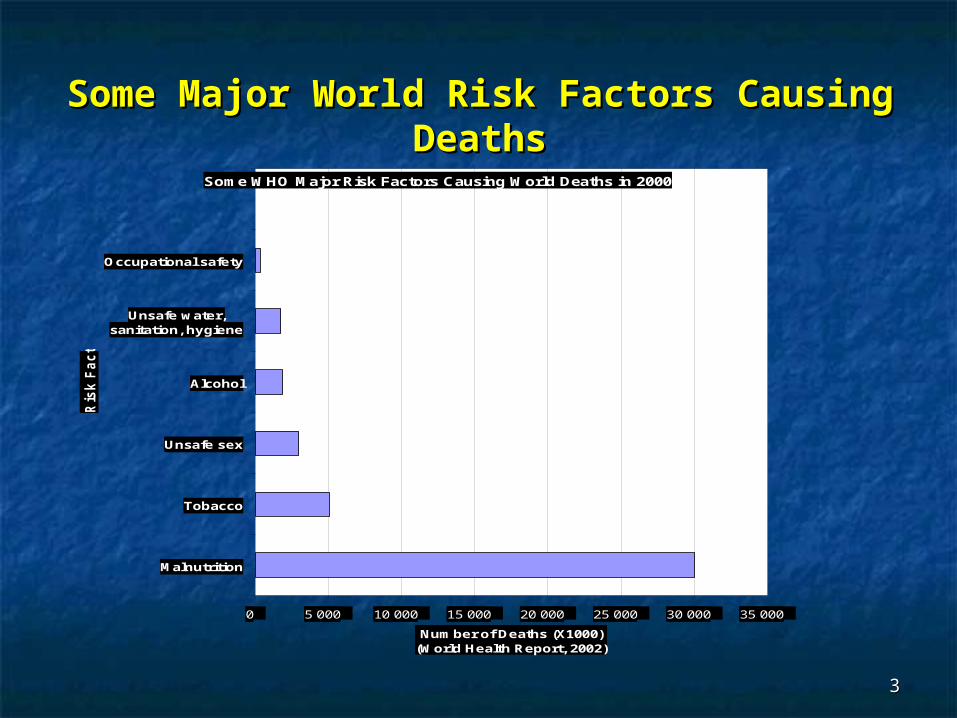
Some Major World Risk Factors Causing Some Major World Risk Factors Causing DeathsDeaths
Some WHO Major Risk Factors Causing World Deaths in 2000
0 5 000 10 000 15 000 20 000 25 000 30 000 35 000
Malnutrition
Tobacco
Unsafe sex
Alcohol
Unsafe water,sanitation, hygiene
Occupational safety
Ris
k F
ac
tor
Number of Deaths (X1000)(World Health Report, 2002)
44
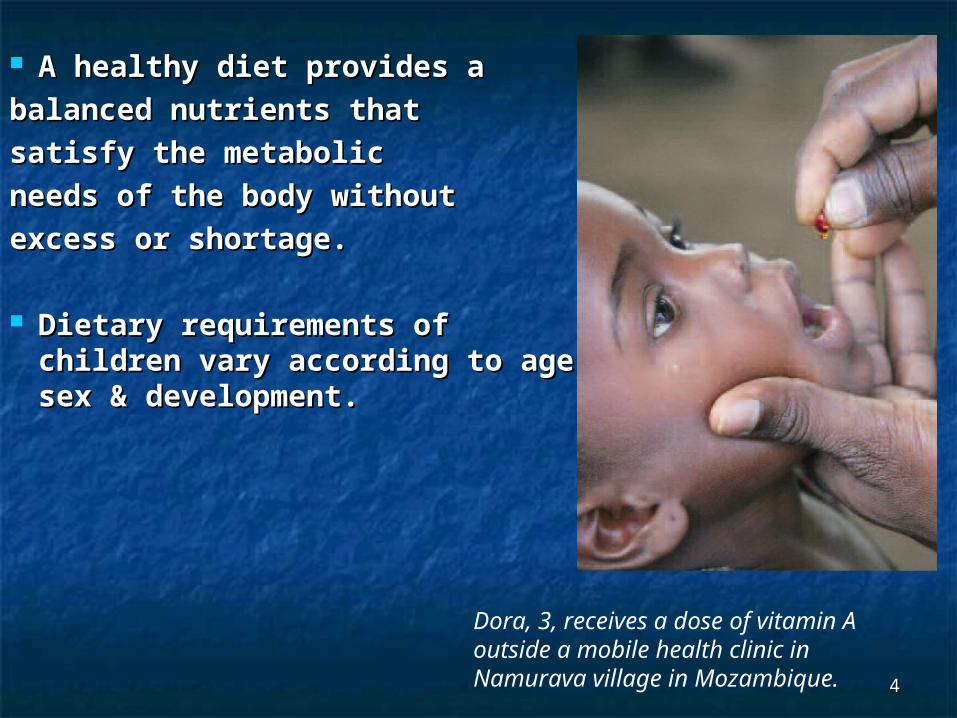
A healthy diet provides a A healthy diet provides a
balanced nutrients that balanced nutrients that
satisfy the metabolic satisfy the metabolic
needs of the body without needs of the body without
excess or shortage.excess or shortage.
Dietary requirements of Dietary requirements of children vary according to age, children vary according to age, sex & development.sex & development.
Dora, 3, receives a dose of vitamin Aoutside a mobile health clinic inNamurava village in Mozambique.
55
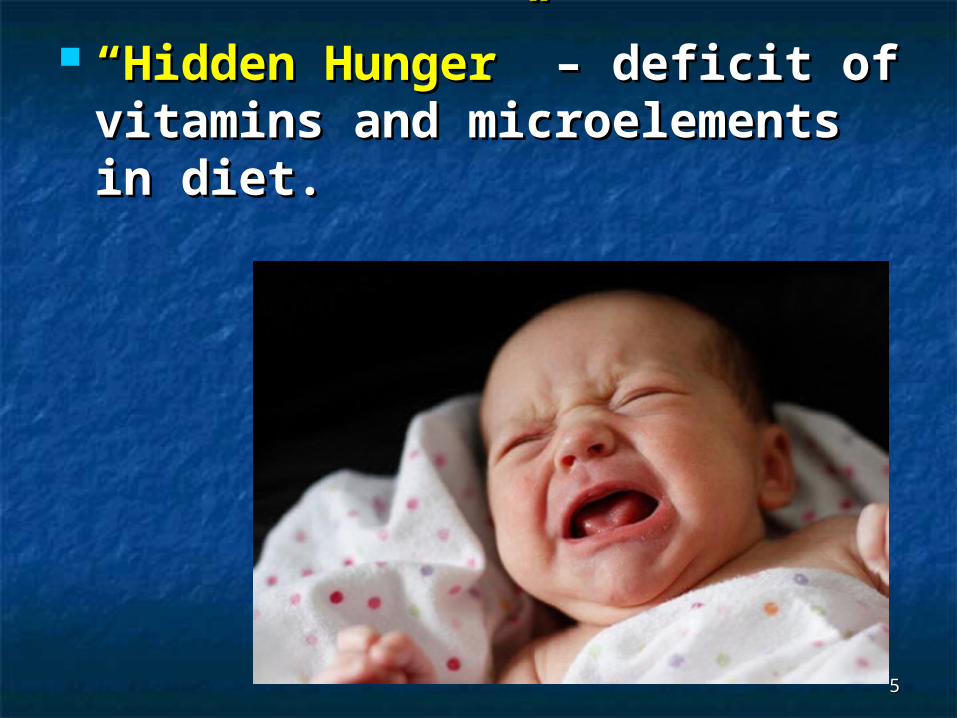
““Hidden Hunger”Hidden Hunger” – deficit of – deficit of vitamins and microelements vitamins and microelements in diet.in diet.
66
Around the world, billions of people live with vitamin and mineral deficiencies. For instance, approximately one third of the developing world’s children under the age of five are vitamin A-deficient, and therefore ill-equipped for survival. Iron deficiency anaemia during pregnancy is associated with 115,000 deaths each year, accounting for one fifth of total maternal deaths.
WHO Report, 2009
77
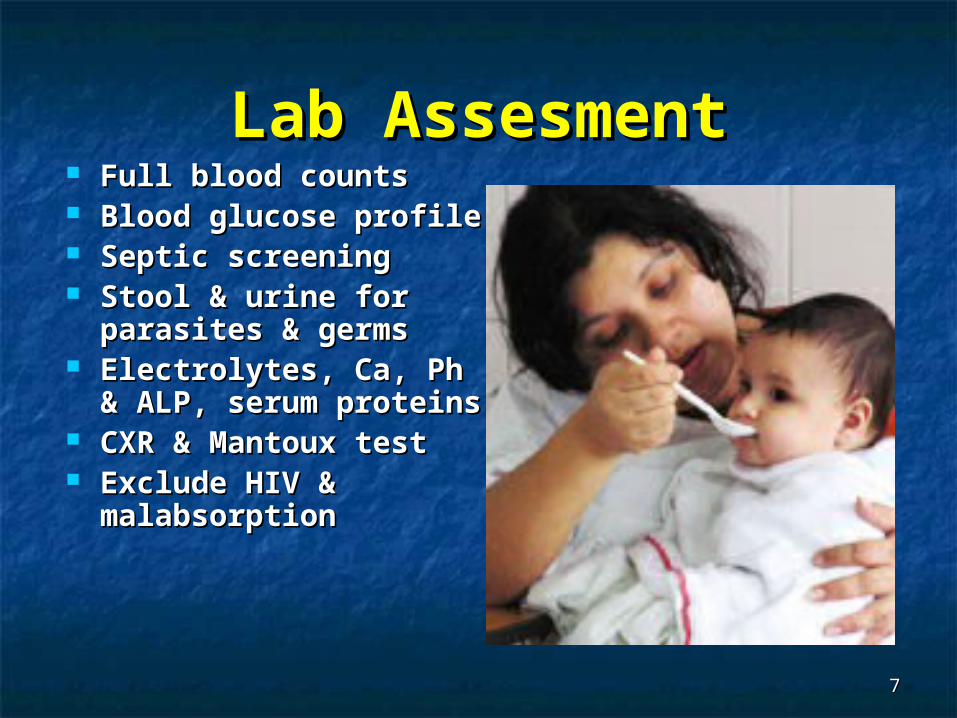
Lab AssesmentLab Assesment Full blood countsFull blood counts Blood glucose profileBlood glucose profile Septic screeningSeptic screening Stool & urine for Stool & urine for
parasites & germsparasites & germs Electrolytes, Ca, Ph & Electrolytes, Ca, Ph &
ALP, serum proteinsALP, serum proteins CXR & Mantoux testCXR & Mantoux test Exclude HIV & Exclude HIV &
malabsorptionmalabsorption

88
NON-ROUTINE TESTSNON-ROUTINE TESTS
Hair analysisHair analysis Skin biopsySkin biopsy Urinary creatinine over proline Urinary creatinine over proline
ratioratio Measurement of trace elements Measurement of trace elements
levels, iron, zinc & iodinelevels, iron, zinc & iodine
99
OVERVIEW OF PEM OVERVIEW OF PEM (Protein Energy (Protein Energy
Malnutrition)Malnutrition) The majority of world’s children The majority of world’s children
live in developing countrieslive in developing countries Lack of food & clean water, poor Lack of food & clean water, poor
sanitation, infection & social sanitation, infection & social unrest lead to LBW & PEMunrest lead to LBW & PEM
Malnutrition is implicated in Malnutrition is implicated in >50% of deaths of <5 children (5 >50% of deaths of <5 children (5 million/yr)million/yr)
1010
OVERVIEW OF PEM OVERVIEW OF PEM
In 2000 WHO estimated that 32% of In 2000 WHO estimated that 32% of <5 children in developing countries <5 children in developing countries are underweight (182 million).are underweight (182 million).
78% of these children live in South-78% of these children live in South-east Asia & 15% in Sub-Saharan east Asia & 15% in Sub-Saharan Africa.Africa.
The reciprocal interaction between The reciprocal interaction between PEM & infection is the major cause of PEM & infection is the major cause of death & morbidity in young children.death & morbidity in young children.

1111
1212
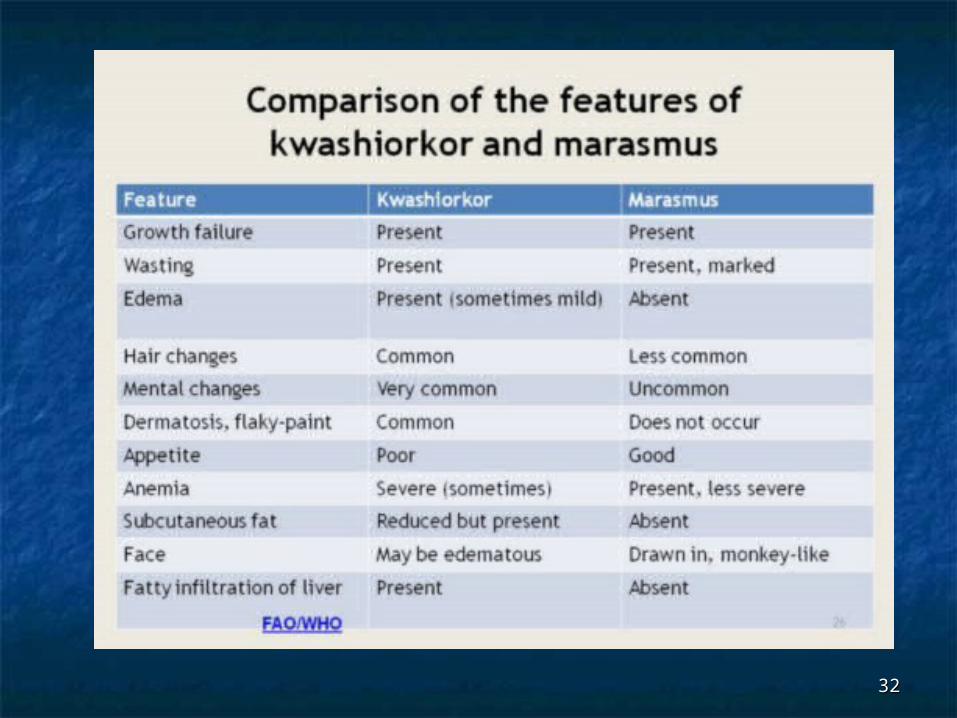
Definitions of MalnutritionDefinitions of Malnutrition
KwashiorkorKwashiorkor: protein deficiency: protein deficiency MarasmusMarasmus: energy deficiency: energy deficiency Marasmic/ KwashiorkorMarasmic/ Kwashiorkor: :
combination of chronic energy combination of chronic energy deficiency and chronic or acute deficiency and chronic or acute protein deficiencyprotein deficiency
Failure to thriveFailure to thrive: marasmus in U. : marasmus in U. S. children under 3.S. children under 3.
1313
Definitions of MalnutritionDefinitions of Malnutrition
PrimaryPrimary: inadequate food : inadequate food intakeintake
SecondarySecondary: result of disease: result of disease MixedMixed

1414
DiagnosisDiagnosis Normal: ± 1 SDNormal: ± 1 SD Mild: -1.1 to -2 SD Mild: -1.1 to -2 SD Moderate -2.1 to -3 SDModerate -2.1 to -3 SD Severe greater than -3Severe greater than -3 Less than 5Less than 5thth
percentilepercentile BMI in adolescents BMI in adolescents
Moderate <15 ages Moderate <15 ages 11-13, <16.5 ages 14-11-13, <16.5 ages 14-1717
Severe <13 ages 11-Severe <13 ages 11-13, <14.5 ages 14-1713, <14.5 ages 14-17

1515
CLASSIFICATION OF CLASSIFICATION OF
MALNUTRITION IN CHILDRENMALNUTRITION IN CHILDREN MILD MILD MALNUTRITIONMALNUTRITION
MODERATE MODERATE MALNUTRITIONMALNUTRITION
SEVERESEVERE
MALNUTRITIONMALNUTRITION
Percent Ideal Percent Ideal Body weightBody weight
80-90 %80-90 % 70-70 %70-70 % LESS THAN 70 LESS THAN 70 %%
Percent Usual Percent Usual Body weightBody weight
90-95 %90-95 % 80-85 %80-85 % LESS THAN 80 LESS THAN 80 %%
Albumin (g/dL)Albumin (g/dL) 2.8-3.42.8-3.4 2.1-2.72.1-2.7 LESS THAN 2.1LESS THAN 2.1
Transferrin Transferrin (mg/dl)(mg/dl)
150-200150-200 100-149100-149 LESS THAN 100LESS THAN 100
Total Total Lymphocyte Lymphocyte
Count (per µL)Count (per µL)
1200-20001200-2000 800-1199800-1199 LESS THAN 800LESS THAN 800
1616
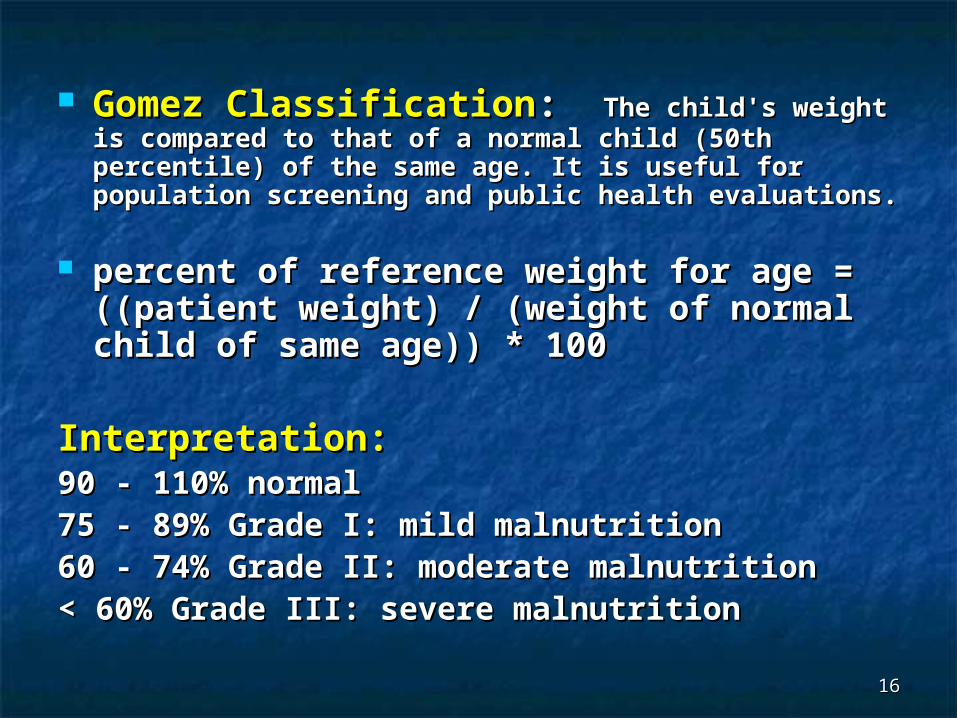
Gomez ClassificationGomez Classification: : The child's weight is The child's weight is compared to that of a normal child (50th percentile) compared to that of a normal child (50th percentile) of the same age. It is useful for population screening of the same age. It is useful for population screening and public health evaluations.and public health evaluations.
percent of reference weight for age = percent of reference weight for age = ((patient weight) / (weight of normal ((patient weight) / (weight of normal child of same age)) * 100child of same age)) * 100
Interpretation:Interpretation:90 - 110% normal90 - 110% normal75 - 89% Grade I: mild malnutrition75 - 89% Grade I: mild malnutrition60 - 74% Grade II: moderate malnutrition60 - 74% Grade II: moderate malnutrition< 60% Grade III: severe malnutrition< 60% Grade III: severe malnutrition
1717
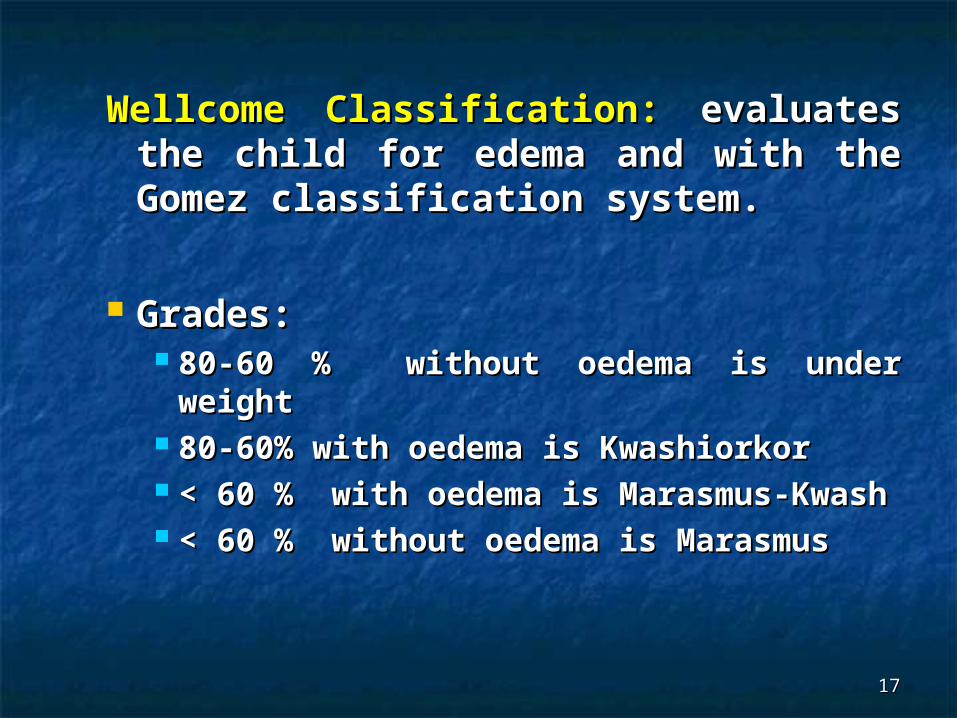
Wellcome Classification:Wellcome Classification: evaluates evaluates the child for edema and with the the child for edema and with the Gomez classification system.Gomez classification system.
Grades:Grades: 80-60 % without oedema is under 80-60 % without oedema is under
weigweightht 80-60% with oedema is Kwashiorkor80-60% with oedema is Kwashiorkor < 60 % with oedema is Marasmus-< 60 % with oedema is Marasmus-
KwashKwash < 60 % without oedema is Marasmus< 60 % without oedema is Marasmus
1818
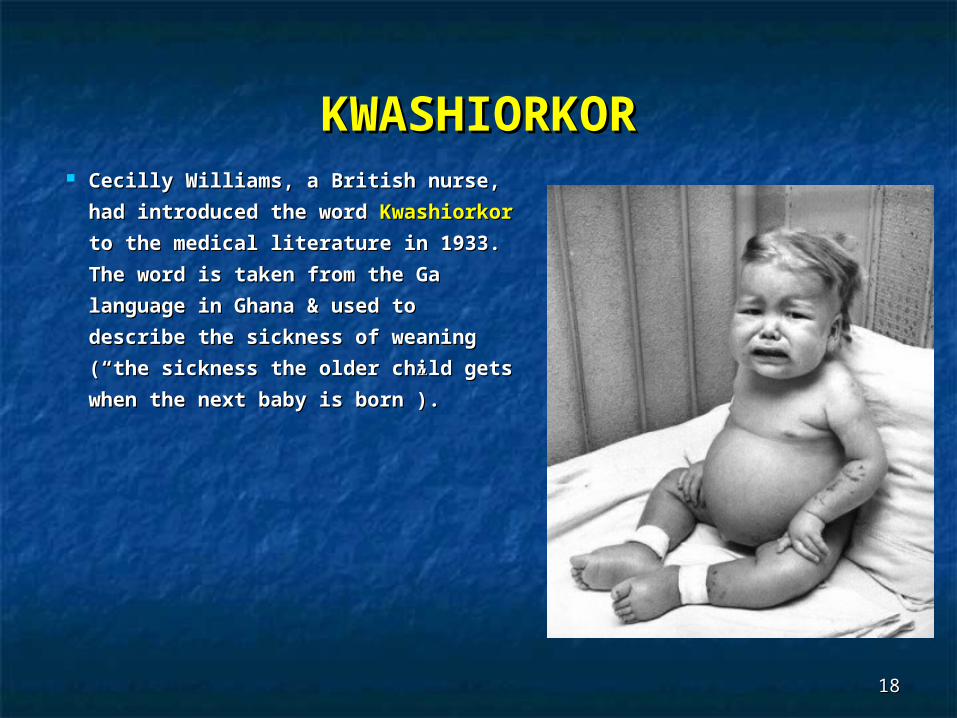
KWASHIORKORKWASHIORKOR Cecilly Williams, a British nurse, Cecilly Williams, a British nurse, had had
introduced the word introduced the word KwashiorkorKwashiorkor to to
the medical literaturethe medical literature in 1933 in 1933. The . The
word word is taken from the Ga language is taken from the Ga language
in Ghana & used to describe the in Ghana & used to describe the
sickness of weaning (“the sickness sickness of weaning (“the sickness
the older child gets when the next the older child gets when the next
baby is born”)baby is born”). .
1919
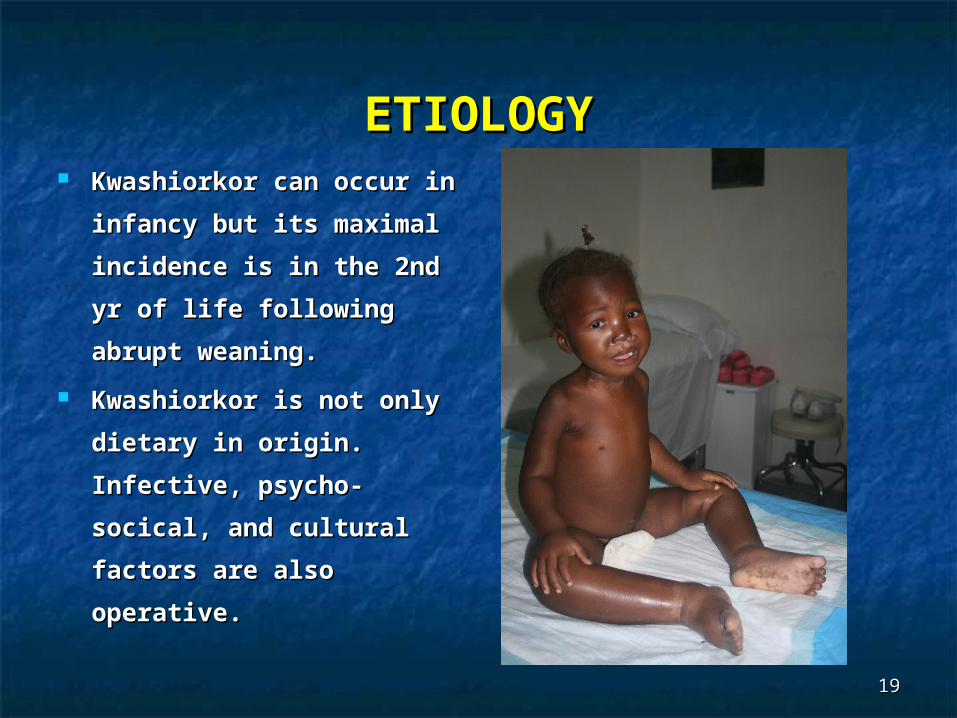
ETIOLOGYETIOLOGY Kwashiorkor can occur in Kwashiorkor can occur in
infancy but its maximal infancy but its maximal
incidence is in the 2nd yr incidence is in the 2nd yr
of life following abrupt of life following abrupt
weaning. weaning.
Kwashiorkor is not only Kwashiorkor is not only
dietary in origin. dietary in origin.
Infective, psycho-socical, Infective, psycho-socical,
and cultural factors are and cultural factors are
also operative.also operative.
2020
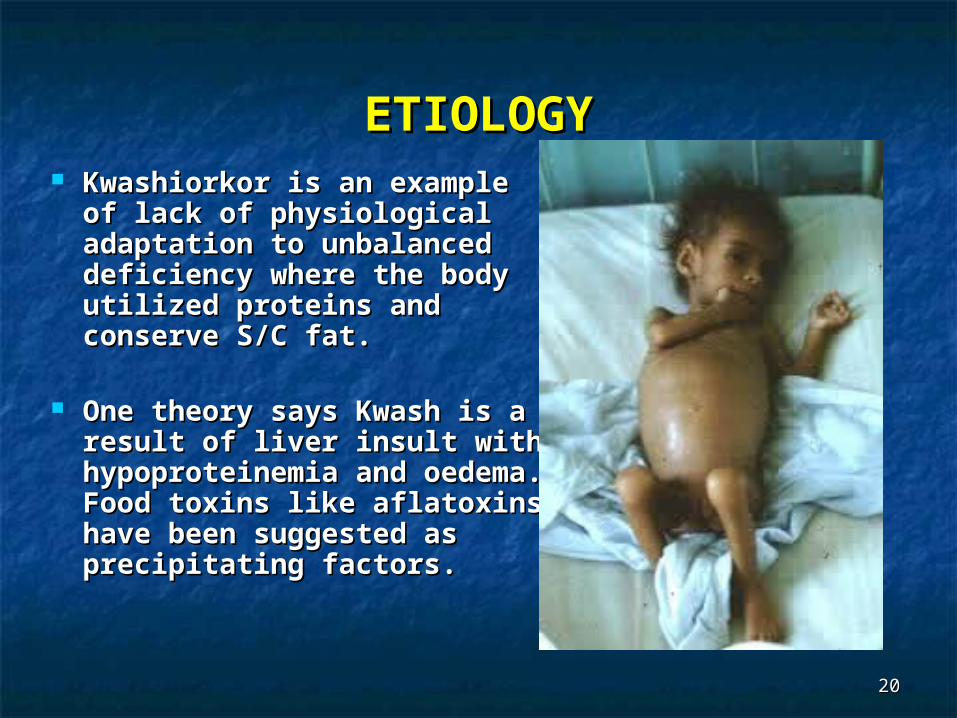
ETIOLOGYETIOLOGY Kwashiorkor is an example of Kwashiorkor is an example of
lack of physiological lack of physiological adaptation to unbalanced adaptation to unbalanced deficiency where the body deficiency where the body utilized proteins and utilized proteins and conserve S/C fat. conserve S/C fat.
One theory says Kwash is a One theory says Kwash is a result of liver insult with result of liver insult with hypoproteinemia and hypoproteinemia and oedema. Food toxins like oedema. Food toxins like aflatoxins have been aflatoxins have been suggested as precipitating suggested as precipitating factors.factors.
2121
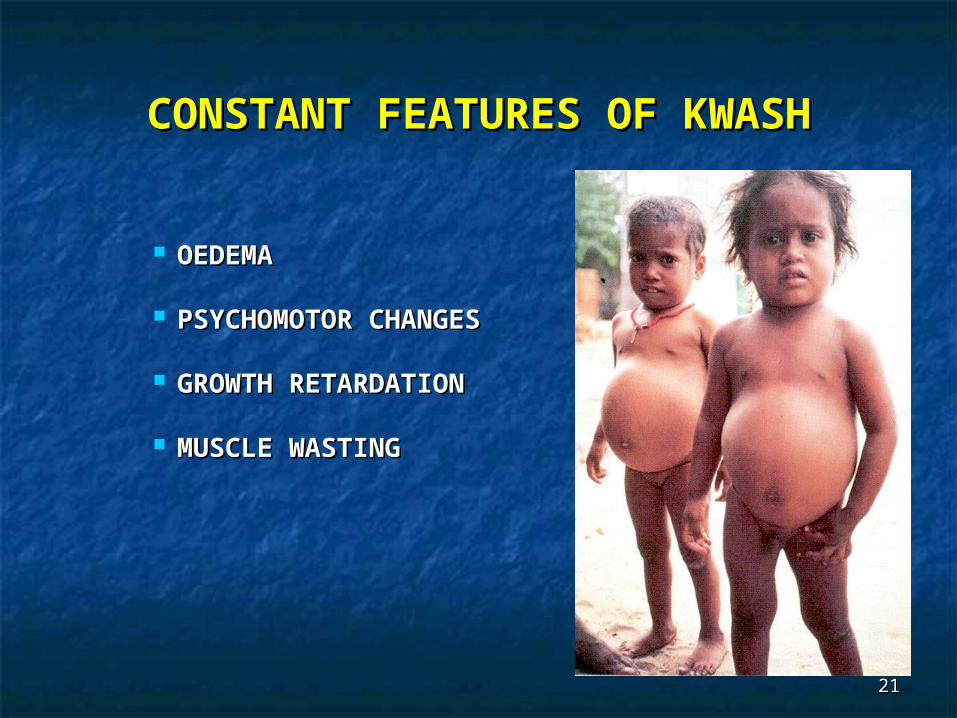
CONSTANT FEATURES OF KWASHCONSTANT FEATURES OF KWASH
OEDEMAOEDEMA
PSYCHOMOTOR PSYCHOMOTOR
CHANGESCHANGES
GROWTH GROWTH
RETARDATIONRETARDATION
MUSCLE WASTINGMUSCLE WASTING

2222
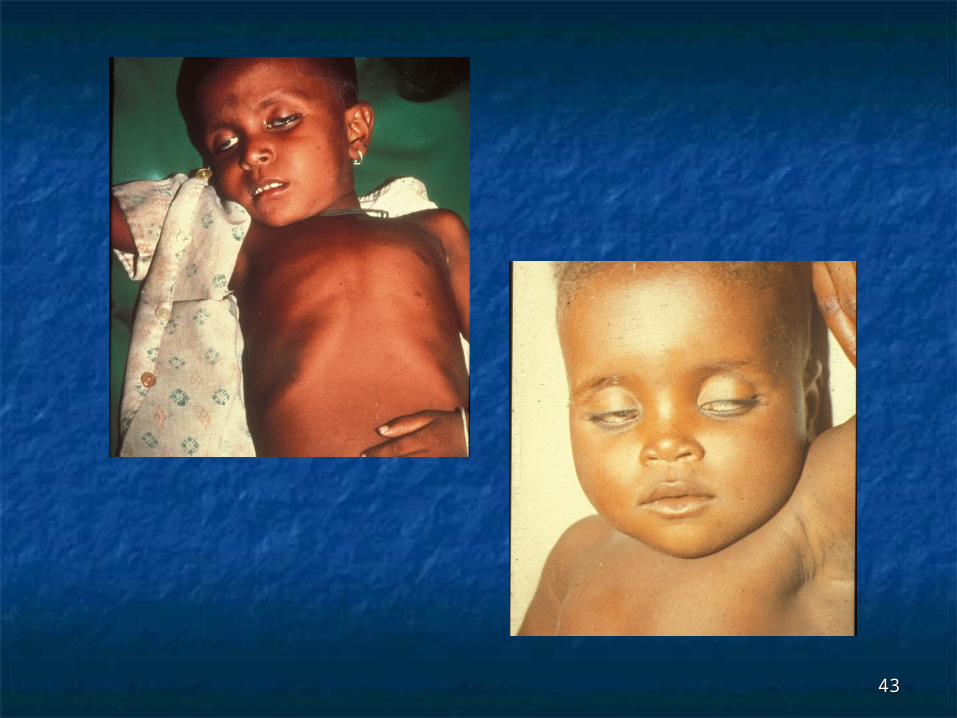
USUALLY PRESENT SIGNSUSUALLY PRESENT SIGNS
MOON FACEMOON FACE
HAIR CHANGESHAIR CHANGES
SKIN SKIN
DEPIGMENTATIONDEPIGMENTATION
ANAEMIAANAEMIA

2323
OCCASIONALLY PRESENT SOCCASIONALLY PRESENT SIGNSIGNS
HEPATOMEGALYHEPATOMEGALY
FLAKY PAINT DERMATFLAKY PAINT DERMATITIITISS
CARDIOMYOPATHY & CARDIOMYOPATHY & FAILUREFAILURE
DDEHYDRATION (Diarrh.EHYDRATION (Diarrh. & & Vomiting)Vomiting)
SIGNS SIGNS OF OF VITAMIN VITAMIN DEFICIENCIESDEFICIENCIES
SIGNS OF INFECTIONSSIGNS OF INFECTIONS

2424

2525

2626
DD of Kwash DermatitisDD of Kwash Dermatitis
AcrodermatitiAcrodermatitis s EntropathicaEntropathica
ScurvyScurvy PellagraPellagra Dermatitis Dermatitis
HerpitiformisHerpitiformis
2727
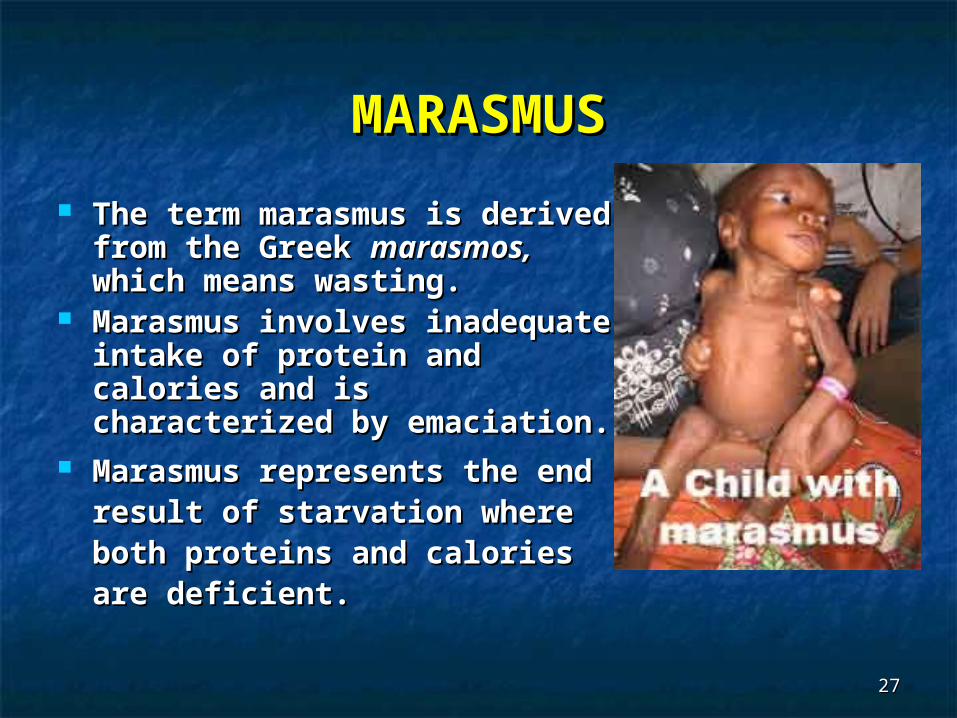
MARASMUSMARASMUS
The term marasmus is The term marasmus is derived from the Greek derived from the Greek marasmos,marasmos, which means which means wasting. wasting.
Marasmus involves Marasmus involves inadequate intake of protein inadequate intake of protein and calories and is and calories and is characterized by emaciation.characterized by emaciation.
Marasmus represents the Marasmus represents the end result of starvation end result of starvation where both proteins and where both proteins and calories are deficient.calories are deficient.

2828
MARASMUSMARASMUS
Marasmus represents Marasmus represents an an
adaptive response to adaptive response to starvation, whereas starvation, whereas kwashiorkor kwashiorkor represents a represents a maladaptive response maladaptive response to starvation to starvation
IIn Marasmus n Marasmus tthe body he body utilizes all fat stores utilizes all fat stores before using muscles.before using muscles.
2929
EPIDEMIOLOGY & ETIOLOGYEPIDEMIOLOGY & ETIOLOGY
Seen most commonly in the first Seen most commonly in the first year of life due to lack of breast year of life due to lack of breast feeding and the use of dilute feeding and the use of dilute animal milkanimal milk..
Poverty or famine and diarrhoea Poverty or famine and diarrhoea are the usual precipitating factorsare the usual precipitating factors
Ignorance & poor maternal Ignorance & poor maternal nutrition are also contributory nutrition are also contributory
3030
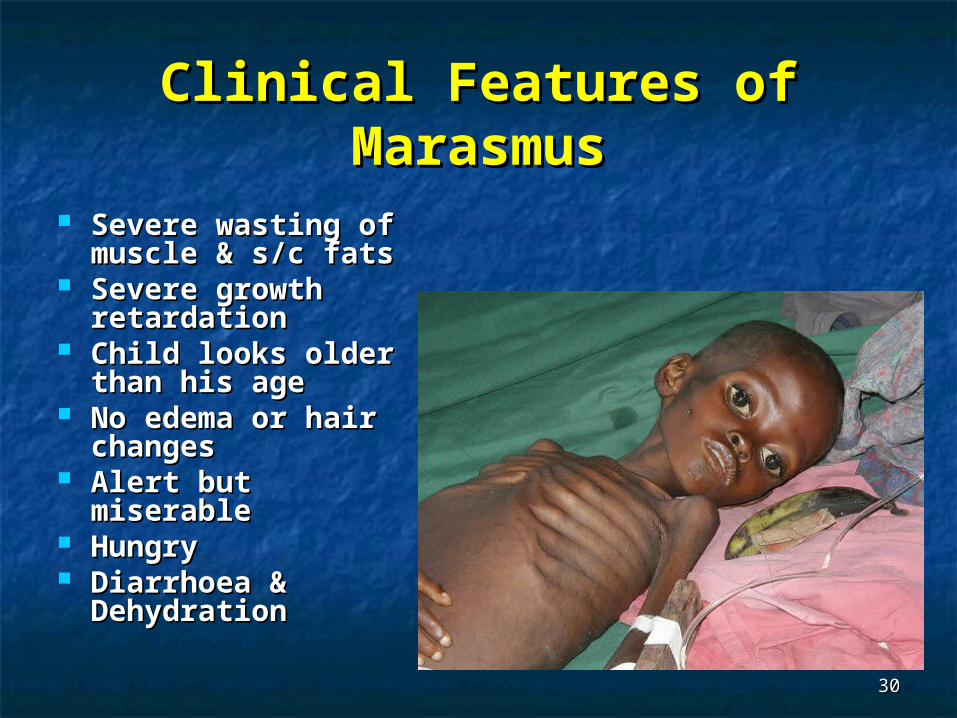
Clinical Features of Clinical Features of MarasmusMarasmus
Severe wasting of Severe wasting of muscle & s/c fatsmuscle & s/c fats
Severe growth Severe growth retardationretardation
Child looks older Child looks older than his agethan his age
No edema or hNo edema or hair air changeschanges
Alert but Alert but miserablemiserable
HungryHungry Diarrhoea & Diarrhoea &
DehydrationDehydration

3131
3232

3333
Complications of P.E.MComplications of P.E.M
HypoglycemiaHypoglycemia HypothermiaHypothermia HypokalemiaHypokalemia HyponatremiaHyponatremia Heart failureHeart failure Dehydration & shockDehydration & shock Infections (bacterial, viral & thrush)Infections (bacterial, viral & thrush)
3434
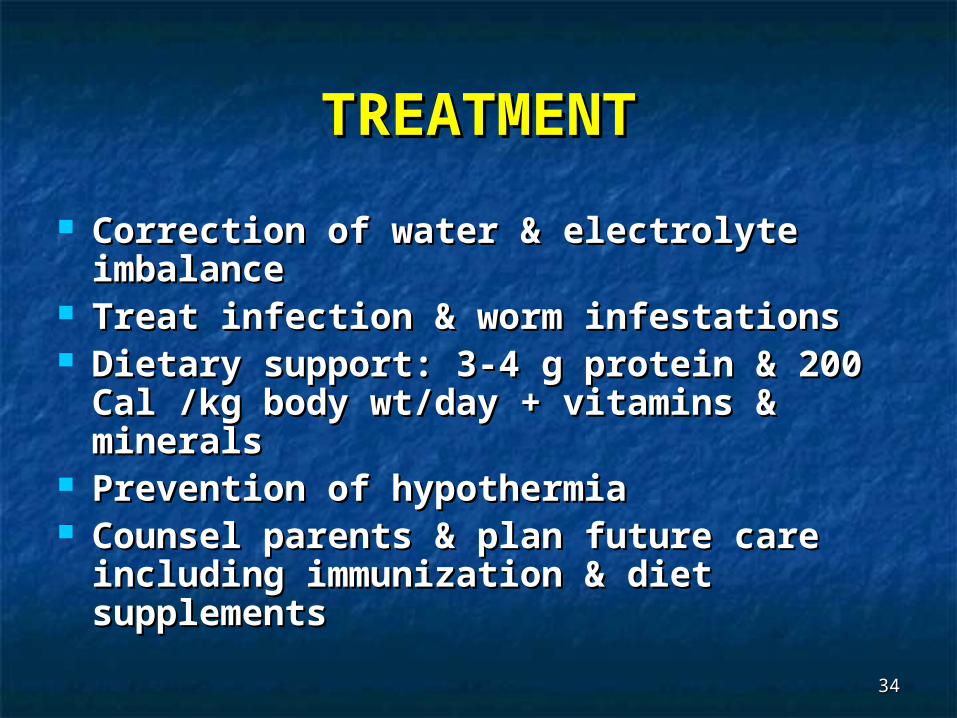
TREATMENTTREATMENT
Correction of water & electrolyte Correction of water & electrolyte imbalanceimbalance
Treat infection & worm infestationsTreat infection & worm infestations Dietary support: 3-4 g protein & 200 Dietary support: 3-4 g protein & 200
Cal /kg body wt/day + vitamins & Cal /kg body wt/day + vitamins & mineralsminerals
Prevention of hypothermiaPrevention of hypothermia Counsel parents & plan future care Counsel parents & plan future care
including immunization & diet including immunization & diet supplementssupplements

3535
KEY POINT FEEDINGKEY POINT FEEDING
Continue breast feeding Continue breast feeding Add frequent small feedsAdd frequent small feeds Use liquid dietUse liquid diet Give vitamin A & folic acid on Give vitamin A & folic acid on
admissionadmission With diarrhea use lactose-free or With diarrhea use lactose-free or
soya bean formulasoya bean formula
3636
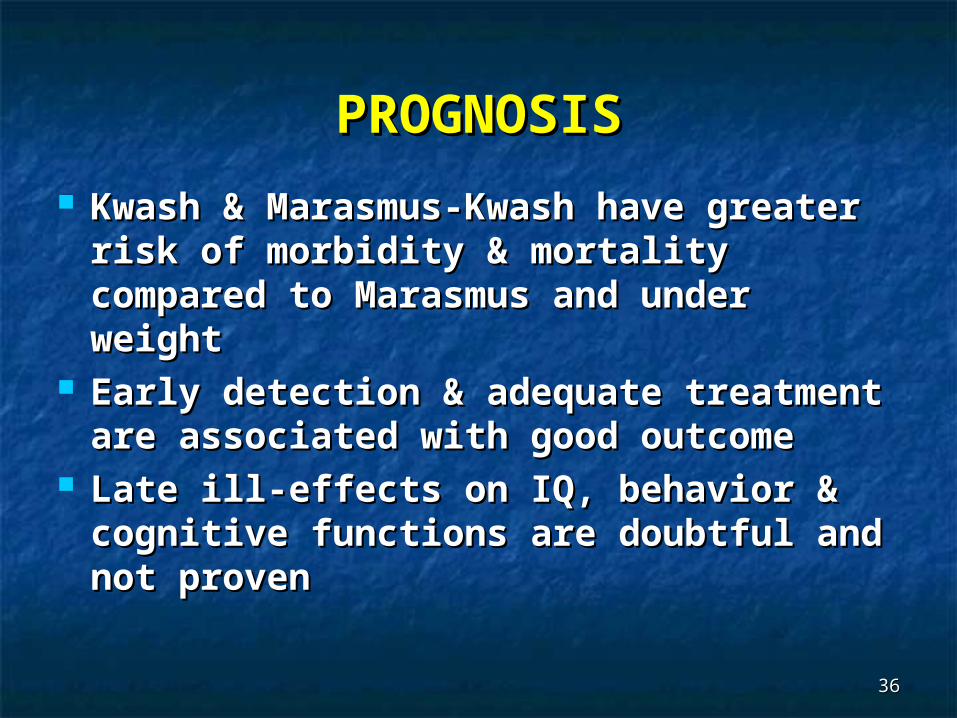
PROGNOSISPROGNOSIS
Kwash & Marasmus-Kwash have Kwash & Marasmus-Kwash have greater risk of morbidity & mortality greater risk of morbidity & mortality compared to Marasmus and under compared to Marasmus and under weightweight
Early detection & adequate treatment Early detection & adequate treatment are associated with good outcomeare associated with good outcome
Late ill-effects on IQ, behavior & Late ill-effects on IQ, behavior & cognitive functions are doubtful and cognitive functions are doubtful and not provennot proven

3737

3838
3939
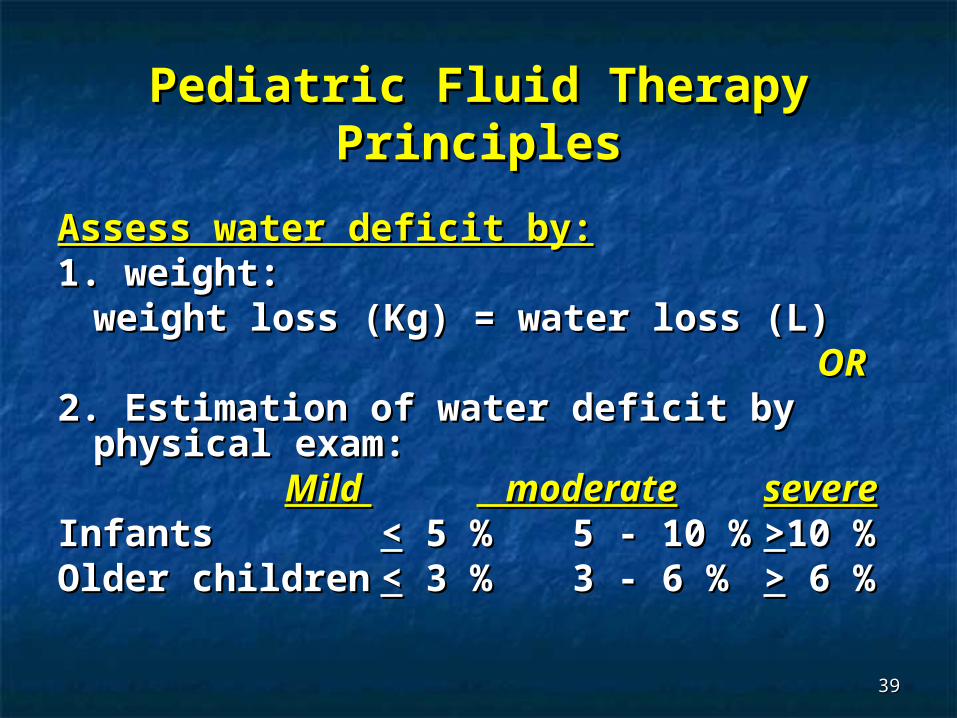
Pediatric Fluid TherapyPediatric Fluid TherapyPrinciplesPrinciples
Assess water deficit by:Assess water deficit by:1. weight:1. weight:
weight loss (Kg) = water loss (L)weight loss (Kg) = water loss (L) OROR2. Estimation of water deficit by 2. Estimation of water deficit by
physical exam:physical exam:Mild Mild moderate moderate
severesevereInfantsInfants << 5 % 5 % 5 - 10 %5 - 10 % >>10 %10 %Older childrenOlder children << 3 % 3 % 3 - 6 %3 - 6 % >> 6 % 6 %

4040
Signs & sympt. MILD Moderate Severe
General Thirsty, allert, restless
Thirsty, irritable, or drowsy
Drowsy – limp, skin cold / sweaty
Radial pulse Normal rate Rapid, weak Rapid, feeble
Respiration Normal Deep Deep & rapid Anterior font. Normal Sunken Very sunken Skin turgor Pinch retracts
immediately Retracts slowly Poor
Eyes Normal Sunken Grossly sunken
Tears Present Absent Absent Mucous memb. Moist Dry Very dry Urine flow Normal Dark &
decreased Oliguria / anuria

4141

4242
4343

4444
MANAGEMENT OF DEHYDRATIONMANAGEMENT OF DEHYDRATION--Replace Phase 1: Acute Resuscitation :Replace Phase 1: Acute Resuscitation :
Give Lactated Ringer OR Normal Saline at 10-20 Give Lactated Ringer OR Normal Saline at 10-20 ml/kg IV OR 5 % albumin over ml/kg IV OR 5 % albumin over 30-60 minutes.30-60 minutes.
May repeat bolus until circulation stable May repeat bolus until circulation stable -Calculate 24 hour maintenance requirements -Calculate 24 hour maintenance requirements
Formula: Formula: First 10 kg: (100 cc/kg/24 hours) First 10 kg: (100 cc/kg/24 hours) Second 10 kg: (50 cc/kg/24 hours) Second 10 kg: (50 cc/kg/24 hours) Remainder: (20 cc/kg/24 hours) Remainder: (20 cc/kg/24 hours)
Example: 35 Kilogram Child Example: 35 Kilogram Child Daily: 1000 cc + 500 cc + 300 cc = 1800 cc/day Daily: 1000 cc + 500 cc + 300 cc = 1800 cc/day
-Calculate Deficit:-Calculate Deficit: Mild Dehydration: (40 ml/kg) Mild Dehydration: (40 ml/kg) Moderate Dehydration: (80 ml/kg) Moderate Dehydration: (80 ml/kg) Severe Dehydration: (120 ml/kg) Severe Dehydration: (120 ml/kg)
4545
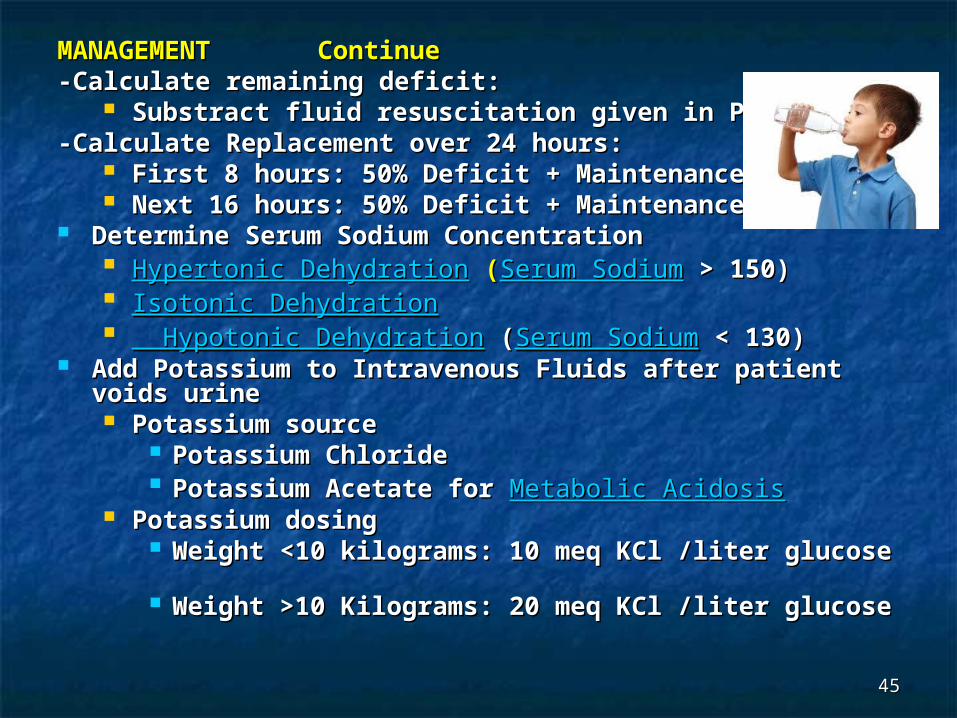
MANAGEMENT Continue MANAGEMENT Continue -Calculate remaining deficit:-Calculate remaining deficit:
Substract fluid resuscitation given in Phase 1 Substract fluid resuscitation given in Phase 1 -Calculate Replacement over 24 hours: -Calculate Replacement over 24 hours:
First 8 hours: 50% Deficit + Maintenance First 8 hours: 50% Deficit + Maintenance Next 16 hours: 50% Deficit + Maintenance Next 16 hours: 50% Deficit + Maintenance
Determine Serum Sodium Concentration Determine Serum Sodium Concentration Hypertonic DehydrationHypertonic Dehydration ( (Serum SodiumSerum Sodium > 150) > 150) Isotonic DehydrationIsotonic Dehydration Hypotonic Dehydration Hypotonic Dehydration ( (Serum SodiumSerum Sodium < 130) < 130)
Add Potassium to Intravenous Fluids after patient Add Potassium to Intravenous Fluids after patient voids urine voids urine Potassium source Potassium source
Potassium Chloride Potassium Chloride Potassium Acetate for Potassium Acetate for Metabolic AcidosisMetabolic Acidosis
Potassium dosing Potassium dosing Weight <10 kilograms: 10 meq KCl /liter Weight <10 kilograms: 10 meq KCl /liter
glucose glucose Weight >10 Kilograms: 20 meq KCl /liter Weight >10 Kilograms: 20 meq KCl /liter
glucoseglucose

4646
Hypertonic dehydrationHypertonic dehydration
Serum Na+ > 150 meq/L (up to 213)Serum Na+ > 150 meq/L (up to 213) Deficit replacement over 48 hours Deficit replacement over 48 hours
0.18% – 0.3%0.18% – 0.3% saline saline Regular daily maintenanceRegular daily maintenance Fluid evenly distributed over timeFluid evenly distributed over time Dialysis option in severe Dialysis option in severe
hypernatremiahypernatremia

4747
Hypotonic (hyponatriemic) Hypotonic (hyponatriemic) dehydrationdehydration
Total NaTotal Na++ Deficit = Deficit =
(Desired Na(Desired Na++) – (Actual Na) – (Actual Na++) ) ×× Body Wt Body Wt Kg Kg ×× 0.6 0.6
++
Calculate Fluid Deficit similar to Calculate Fluid Deficit similar to Isonatremic DehydrationIsonatremic Dehydration
4848
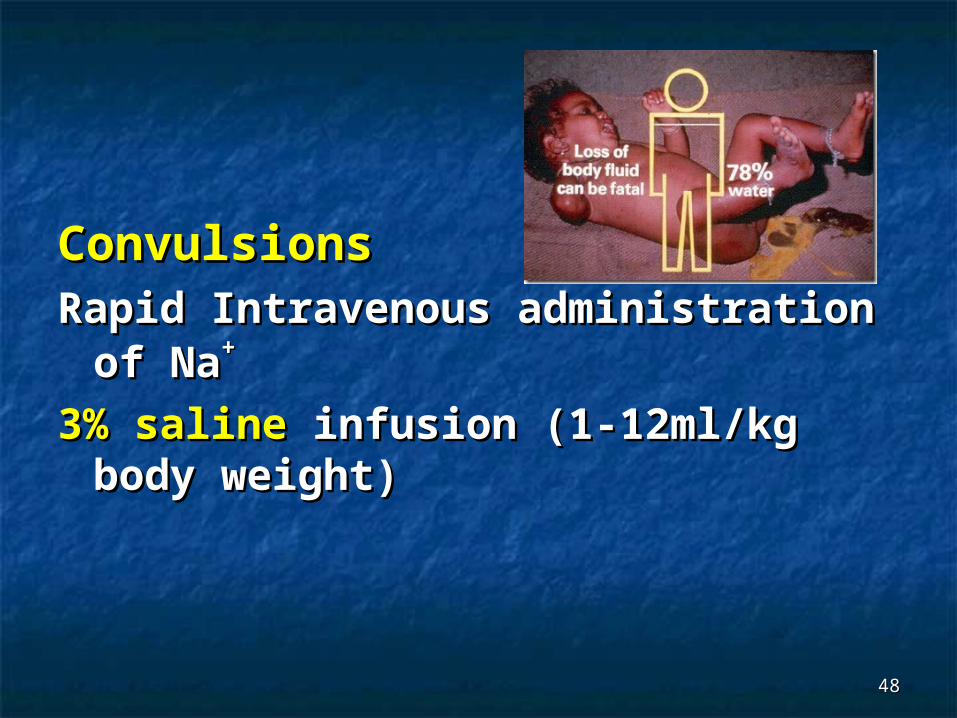
ConvulsionsConvulsionsRapid Intravenous administration Rapid Intravenous administration
of Naof Na++
3% saline3% saline infusion (1-12ml/kg infusion (1-12ml/kg body weight)body weight)
4949
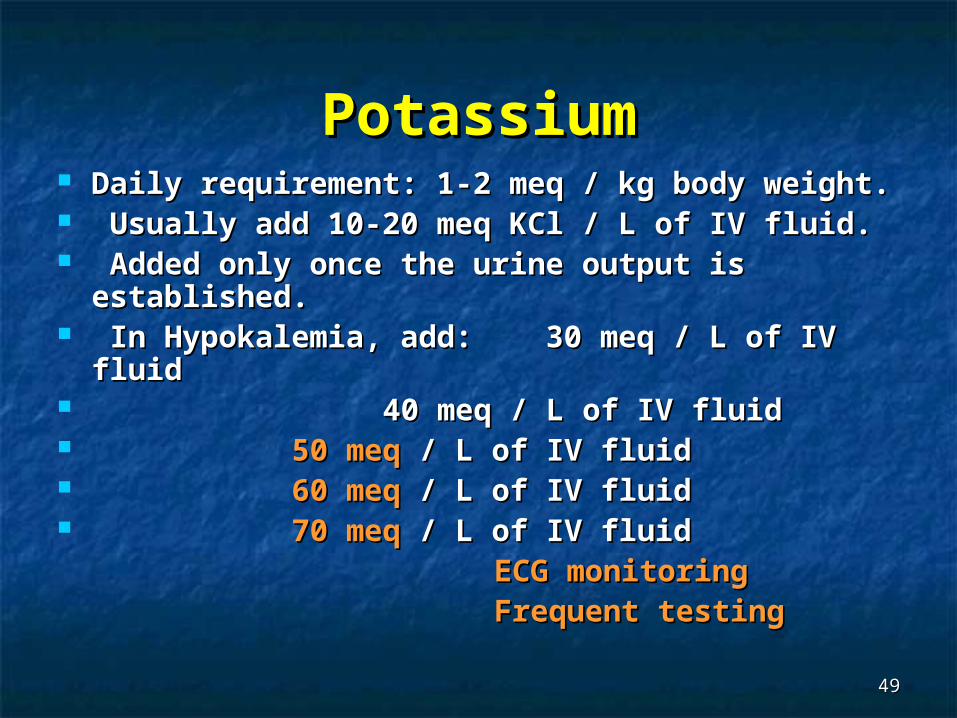
PotassiumPotassium Daily requirement: 1-2 meq / kg body weight.Daily requirement: 1-2 meq / kg body weight. Usually add 10-20 meq KCl / L of IV fluid.Usually add 10-20 meq KCl / L of IV fluid. Added only once the urine output is Added only once the urine output is
established.established. In Hypokalemia, add: 30 meq / L of IV fluidIn Hypokalemia, add: 30 meq / L of IV fluid 40 meq / L of IV fluid40 meq / L of IV fluid 50 meq50 meq / L of IV fluid / L of IV fluid 60 meq60 meq / L of IV fluid / L of IV fluid 70 meq70 meq / L of IV fluid / L of IV fluid ECG monitoringECG monitoring Frequent testingFrequent testing

5050
Hypokalemia Hypokalemia ManagementManagement
Maximum IV infusion rate:Maximum IV infusion rate:
1 mEq/kg/hr1 mEq/kg/hr Marked hypokalemia:Marked hypokalemia:
Monitor serum K closelyMonitor serum K closely
0.5-1 mEq/kg/dose given as an 0.5-1 mEq/kg/dose given as an infusion of 0.5 mEq/kg/hr for 1-2 infusion of 0.5 mEq/kg/hr for 1-2 hourhour
5151
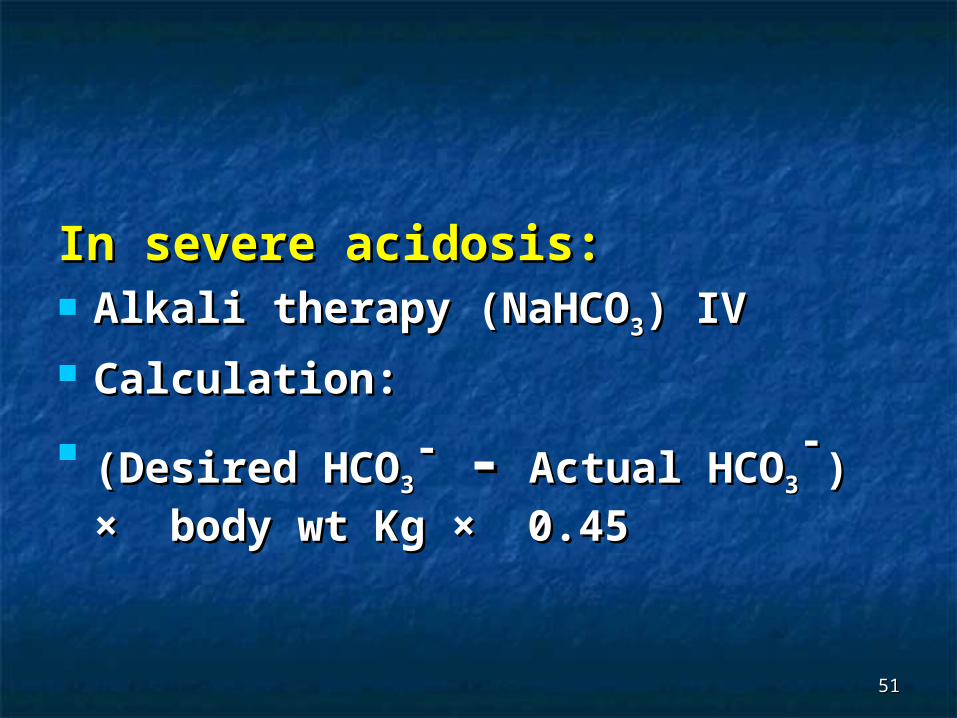
In severe acidosis:In severe acidosis: Alkali therapy (NaHCOAlkali therapy (NaHCO33) IV) IV Calculation: Calculation:
(Desired HCO(Desired HCO33-- -- Actual HCO Actual HCO33
--) ) ××
body wt Kg body wt Kg ×× 0.45 0.45

5252
5353

5454