malaria prevalence and average household size
TRANSCRIPT

Preprint of article in the Journal of the Royal Statistical Society Series A October 2013 DOI: 10.1111/rssa.12036
AVERAGE HOUSEHOLD SIZE AND THE
ERADICATION OF MALARIA
Lena Huldén Department of Forest Sciences,
P.O. Box 26, FIN-00014 Helsinki University,
Helsinki, Finland [email protected]
Ross McKitrick
Department of Economics, University of Guelph,
Guelph, Ontario N1G 2W1, Canada
Larry Huldén Finnish Museum of Natural History
P.O. Box 17, FIN-00014 Helsinki University
Helsinki, Finland [email protected]
ABSTRACT
Malaria has disappeared in some countries but not others, and an explanation
for the pattern remains elusive. We show that the probability of malaria
eradication jumps sharply when average household size drops below four persons.
Part of the effect commonly attributed to income growth is likely due to declining
household size. DDT usage plays only a weak role. Warmer temperatures are not
associated with increased malaria prevalence. We propose that household size
matters because malaria is transmitted indoors at night. We test this hypothesis by
contrasting malaria with dengue fever, another mosquito-borne illness spread
mainly by daytime outdoor contact.
Funding Bill and Melinda Gates Foundation.
Key words Malaria, DDT, Dengue fever, Household size, Poverty

Preprint of article in the Journal of the Royal Statistical Society Series A October 2013 DOI: 10.1111/rssa.12036
Page 2 of 38
AVERAGE HOUSEHOLD SIZE AND THE
ERADICATION OF MALARIA
1 INTRODUCTION
Malaria is a parasitic disease that is transmitted to humans by infected Anopheles
mosquitoes. The parasites (five different species of Plasmodium) infect red blood cells,
causing anemia, nausea, fever and sometimes death. There are about 225 million cases
of malaria infection annually and about 800 000 fatalities, of which 90 percent are in
Africa, and most of whom are children (Manguin et al. 2008). Malaria was endemic in
Europe and North America during the 20th century, but has largely disappeared and has
been unable to re-establish itself there in spite of frequent annual importation of cases.
An interesting aspect of this history is that the disease disappeared in many countries
that made no special efforts to eradicate it, while remaining prevalent in other countries
that tried. So far no satisfactory or consistent explanation has emerged for this pattern.
This paper seeks to explain the pattern of malaria eradication by focusing on the role
of declining average household size. The ongoing prevalence of malaria in poor
countries suggests a connection with socioeconomic conditions. Many early scientists
saw malaria as a social disease, which could be cured by social reforms and mass-
distribution of quinine (reviewed by Bruce-Chwatt and de Zulueta 1980, Snowden 1999,
Gachelin and Opinel 2011). But explanations have been lacking as to specific
mechanisms by which a vector-borne disease such as malaria is affected by poverty. One
early author, Sidney Price James (1930), argued that the spread of malaria depended on
the factors that brought the source, the carrier and the recipient into the necessary close
association with one another. He noted that the number of malaria cases was always
higher in cottages in which big families slept together in one room, which was especially
the case among the poor. This explanation received little attention subsequently (Chagas
1925, Ackerknecht 1945) and research efforts concentrated on other factors such as

Preprint of article in the Journal of the Royal Statistical Society Series A October 2013 DOI: 10.1111/rssa.12036
Page 3 of 38
mosquito control (Manguin et al. 2008, Gachelin and Opinel 2011). But a recent analysis
of the malaria trend in Finland over the interval 1750–2006 (Huldén and Huldén 2009)
found that while many standard theories of malaria disappearance had little explanatory
power, mean household size appeared to correlate very closely over a long interval with
the decline in malaria cases. Here we examine the effect at the global level, in the process
testing James’ early conjecture.
It is a common misconception that malaria is a tropical disease. Although that is
where it remains prevalent, it used to occur throughout the world, in all climate zones,
from the tropics to the coast of the Arctic Sea (up to 70° N latitude) (Lysenko and
Kondraschin 1999, Reiter 2008, Huldén and Huldén 2009). Eradication can be
accelerated, but not achieved, by efforts to exterminate the Anopheles population which
carries the Plasmodium infection. In fact potential mosquito vectors are still present in
almost all countries where malaria has disappeared (Huldén et al. 2012 Appendix 1
Table 1). Numerous explanations for eradication have been suggested, such as a change
in the feeding pattern of the vector, draining of wetlands, or intensive use of the
insecticide DDT (dichlorodiphenyltrichloroethane; Hansen 1886, Wesenberg-Lund
1943, Snowden 2006, Kager 2002, Bruce-Chwatt and de Zulueta 1980). Despite
superficial plausibility, such explanations begin to fail upon close examination. With
regard to DDT, for instance, while about 75% of the world used it, with an average
application interval of over 15 years, malaria only disappeared in 43% of the world’s
countries.
Our paper is organized as follows. Section 2 explains our data set and Section 3
explains the logit and tobit regression models we will employ. Section 4 presents the
results and a test of our explanatory model for malaria by contrasting it with the pattern
of dengue fever. Section 5 offers conclusions.
2 DATA
2.1 DESCRIPTION AND SOURCES

Preprint of article in the Journal of the Royal Statistical Society Series A October 2013 DOI: 10.1111/rssa.12036
Page 4 of 38
Since there are no international statistics on the number of people sharing a
bedroom, we use average household size. Data on malaria, insect vectors, demographic
factors, sociological factors, and environmental factors for 232 countries or
corresponding administrative units were compiled. Extensive details are in Appendix 1
of Huldén et al. (2012); here we provide a brief summary. Malaria data refer to the year
2000 or the closest year before or after that was available. Of the 220 countries we
collected data for, malaria was never endemic in 32, remains prevalent in 106 and has
been eradicated from 82 countries. Mongolia is the only country with an indigenous
vector species but no historical or recent malaria. Thus indigenous malaria vectors
(Anopheles species) are known from 188 countries, which is the sample for our analysis.
Explanatory variables include Gross Domestic Product (GDP) per capita, household
size, female literacy, urbanization and slums, latitude, mean temperature, forest
coverage, Muslim population, details of national DDT usage and population density
(persons/km2). Because malaria frequency was available only on the whole population
level, the slum percentage was recalculated to represent the fraction of the whole
population by multiplying the slum and urbanization percentages. Table 1a presents the
variables used and their summary statistics. Table 1b lists the sources. Observations
refer to the year 2000 or the closest preceding and/or succeeding year available, except
in the case of temperature, which is the annual mean over 1980-2008. The geographical
units are countries or corresponding administrative units as used by the international
standards according to Official Statistics of Finland (OSF 2006). Website sources for data
are listed in the Appendix. In addition to the sources list in Table 1b, information on
vector status was compiled from the Walter Reed systematic catalogue of Culicidae, the
Global Infectious Diseases and Epidemiology Network (Gideon), Impact malaria, Becker
et al. (2003) and Manguin et al. (2008).
We gathered data on 47 production commodities to permit us to examine the role of
outdoor working conditions, in case regional land management and farming practices
had explanatory power. Exploratory analyses showed this was not the case, though we
retained data on cassava production due to its possible connection with dengue fever.
Cassava differs from the other labour-intensive crops since its harvesting cannot be

Preprint of article in the Journal of the Royal Statistical Society Series A October 2013 DOI: 10.1111/rssa.12036
Page 5 of 38
mechanized, therefore regions with high cassava production levels must have large
numbers of persons working outdoors in the day time in close contact for long periods
of time. This suggests a potential connection to the spread of dengue fever, as will be
explained in Section 4.3.
We assembled data for each country on the year DDT was introduced for malaria
vector control, the year it was discontinued, and the number of years of actual use,
which did not always coincide with the number of years between introduction and
discontinuation (see Huldén et al. 2012 Appendix 3). However, simply adding a DDT-
related measure to our regression model would lead to endogeneity bias. The only
countries that use DDT for malaria vector control are those that have malaria, so the
presence of malaria strongly predicts the use of DDT. If we naively put a DDT usage
measure into a regression with malaria incidence as the dependent variable we would
get an apparently high significance attached to a coefficient whose magnitude suggests
that DDT causes malaria.
To remedy this we need an instrument that measures the exogenous component of
the effect of DDT usage, that is, the effect of DDT usage on malaria frequency and
eradication probability, independent of the decision to use it in response to the presence
of malaria. One aspect of the usage decision that was outside the control of most
countries was the move by the United States to ban the production and use of DDT in
1971, which marked the start of growing worldwide efforts to withdraw the product
from usage due to environmental concerns. Figure 1 shows the fraction of countries in
our sample with malaria, the fraction using DDT, and the ratio of the two, by year, from
1951 to 2005. In 1951, 81% of the countries in our sample experienced malaria and
63% used DDT, a usage ratio of 0.78. This declined relatively steadily until the 1990s. As
of 1971, 55% experienced malaria and 33% were using DDT, yielding a usage ratio of
0.60. In the 1990s the usage ratio began falling more rapidly, such that by 2005, 48%
still experience malaria but only 4% use DDT, a ratio of 0.08.
Hence, conditional on a country already having experienced malaria, an aggressive
malaria control stance would be indicated by a willingness to use DDT right up to the
Preprint of article in the Journal of the Royal Statistical Society Series A October 2013 DOI: 10.1111/rssa.12036
Page 6 of 38
year in which malaria was eradicated, despite the international pressure not to do so.
We therefore defined a new variable, ddt_x, which takes a value of 1 if the year in which
a country ceases using DDT is the same as the year malaria disappeared, or one or two
years after that, and zero otherwise. This describes 18% of our sample. Within the limits
of our data set this provides a measure of the exogenous explanatory component of DDT
usage on malaria, though we caution the reader that this instrument is far from perfect.
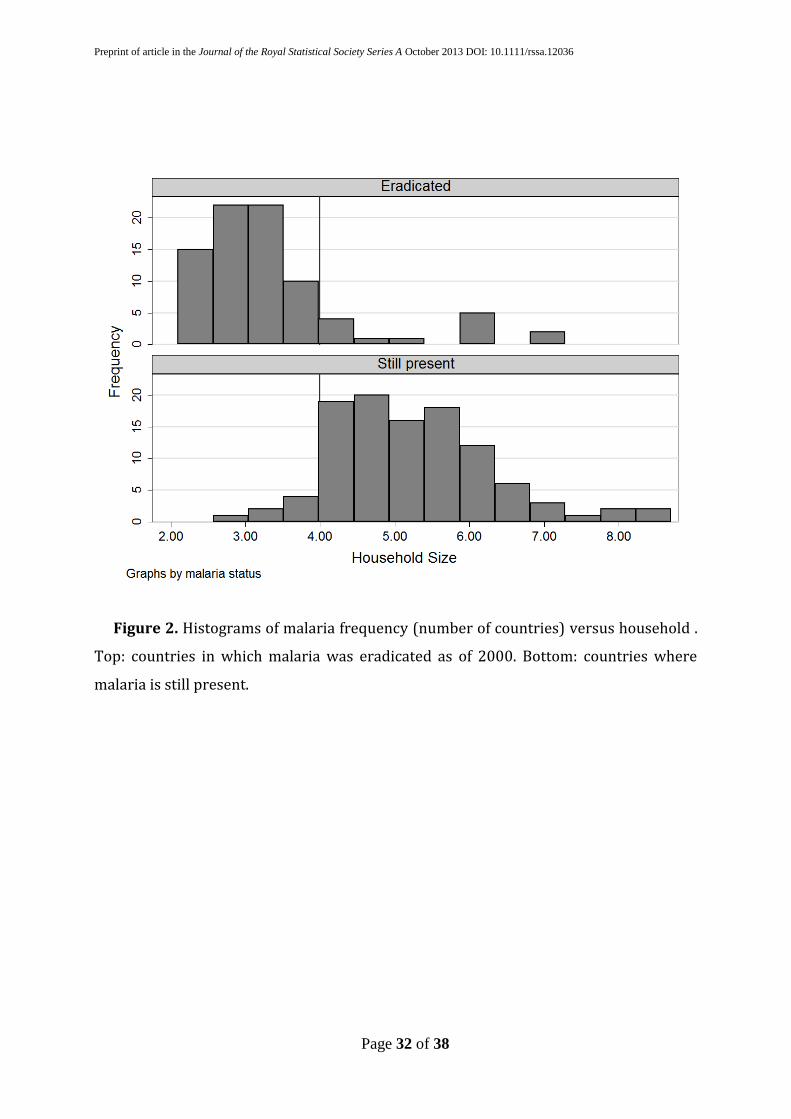
2.2 EXPLORATORY DATA ANALYSIS Figure 2 shows histograms of the number of countries in our sample in which malaria
has been eradicated (top) versus where it has not (bottom) grouped by household size .
The vast majority of countries in which malaria has been eradicated have relatively
small (< 4 persons) average household size. There are only seven countries (Argentina,
China, Brazil, South Africa, French Guiana, Thailand and South Korea) where malaria is
present yet average household size is less than 4 persons (bottom panel). However, even
for these countries our examination of the specific situations leads us to suspect that,
within them, malaria may only be prevalent in regions with an average household size of
more than four members, or in areas with corresponding housing conditions such as
military camps, refugee camps and camps for foreign workers or frontier settlements.
We were able to examine provincial data for Argentina, China, Brazil and South Africa.
In Argentina malaria is present in four provinces (Curto et al. 2003) all of which have
average household size higher than four (INDEC 2001). In Brazil malaria is present in
nine provinces, of which seven have an average household size higher than four (Huldén
et al. 2012 Appendix). Household size is lower than four in the malarious Mato Grosso
(3.78) and Rondonia (3.92). Agriculture has been expanding in Mato Grosso and since
the discovery of gold there has been immigration of panminers from other malarious
areas (Atanaka et al. 2007). Rondonia has experienced a similar development.
Provisional housing conditions and a highly mobile population has created conditions
for frontier malaria (Camargo et al. 1994). China has a low malaria prevalence, about 1.5
cases per 100 000 people. Most of them are in remote regions. There are indications that
malaria in China is associated with locally high household size. Unfortunately a detailed
analysis of the provinces could not be done due to a lack of adequate data (Huldén et al.

Preprint of article in the Journal of the Royal Statistical Society Series A October 2013 DOI: 10.1111/rssa.12036
Page 7 of 38
2012, Appendix). In South Africa malaria is present in all three regions which have a
household size higher than four (Gerritsen et al. 2008, Health System Trust 2000).
Malaria is also present in French Guiana, Thailand and South Korea, although the
countries had an average household size lower than four (Huldén et al. 2012 Appendix).
In French Guiana malaria is prevalent only among Amerindians who have an average
household size between 5 and 7 (Hustache et al. 2007, Legrand et al. 2008). Thailand
received almost 1.3 million immigrants from neighbouring, highly malarious countries
in 2004 (WHO 2005-9). Malaria in Thailand is consequently found in regions close to the
borders or in regions with foreign workers (Anderson et al. 2011, WHO 2005-9). Malaria
re-emerged in South Korea in the 1990’s. It spread first among military personnel in
military camps and then among civilians primarily in areas adjacent to the Demilitarized
Zone (Huldén and Huldén 2008, Park et al. 2009).
Figures 3a and 3b shows the same histogram pairs for, respectively, standardized
income, absolute latitude, female literacy, urbanization, mean temperature and duration
of DDT usage. While the observations cluster somewhat differently in each case, the
sample bifurcation at the four-person theshold is typically less strict than in Figure 2.
Our data set is cross-sectional, but we also obtained some time series data on
household size and date of malaria eradication for 23 countries, as shown in Figure 4.
The sample includes 11 countries in which malaria spontaneously disappeared and 12
where an eradication campaign was carried out. In the former, no country gets rid of
malaria unless household size is below four persons. In the latter, malaria disappeared
at household sizes above four persons in only four cases. One, Albania, is interesting in
this respect because it is a predominantly Muslim country. We will report on the
significance of the Muslim fraction in the next section. Our conjecture is that in some
regions, Muslim practice involves segregated sleeping quarters, thereby reducing the
effective household size.
3 METHODS

Preprint of article in the Journal of the Royal Statistical Society Series A October 2013 DOI: 10.1111/rssa.12036
Page 8 of 38
3.1 LOGIT REGRESSION The first question we investigate is the factors affecting whether malaria has been
eradicated or not from a country. Our dependent variable is a binary indicator called
mal_erad, which takes the value 0 for a country if malaria has not been eradicated and 1
if it has (conditional on it having been historically present). We fitted a multivariable
logit model (see, e.g., Davidson and MacKinnon 2004) of the form:
P(malaria eradicated) = F(Xb)+e (1)
where (the cumulative logistic curve ), X is a matrix of k
explanatory variables xij, i=1,…,k (including a constant) for j = 1,…, 188 countries, b is a
k-vector of coefficients; and e is a vector of independent error terms. Country subscripts
will be omitted in the subsequent discussion except where needed for clarity. Estimation
of (1) yields a model that predicts, in this case, the probability of malaria eradication
conditional on the values in X. In the logit model the marginal effect, , of a one unit
change in each explanatory variable on the probability of eradicating malaria P is:
(2)
where p is the proportion of countries in which malaria has been eradicated. Note that
the marginal effects in (2) are local and are not summable. Logit results are reported as
the linear coefficients (Equation 1) and, in one case of interest, as the marginal
probability terms (Equation 2).
As shown in Table 1, some of our data are binary variables, some are measured in
percentages and some are continuous variables. The latter were standardized prior to
use in regressions, so their coefficient estimates indicate the increase in log odds for a

Preprint of article in the Journal of the Royal Statistical Society Series A October 2013 DOI: 10.1111/rssa.12036
Page 9 of 38
one standard deviation changes in the explanatory value. Coefficients for binary
variables refer to the effect of a change from 0 to 1, and for the variables measured as
percentages they refer to the effect of a one percentage point change.
Household size was included in the regression as a continuous average (not
standardized but expressed in number of persons) and also as a dummy variable
indicating if national average household size is less than one of a sequence of thresholds
ranging from 3.5 to 6.0 persons in steps of 0.5.
3.2 TOBIT REGRESSION We are interested not only in ascertaining what caused malaria to disappear from a
country, but also what affects its prevalence, or frequency, in those countries where it is
still present. Our regression model needs to take into account the fact that this variable
is censored at zero. It might be the case that the optimal fit in the portion of the sample
with positive malaria frequency is provided by a model that, for the countries without
malaria, would predict a negative number of cases. The fact that the dependent variable
is truncated at zero implies that estimation of a simple linear model
Malaria frequency = Zg+v (3)
where Z is the matrix of explanatory variables, g is the coefficient vector and v is the
vector of error terms, would yield biased slope coefficients and variances. Estimating
equation (3) only on the portion of the data set with non-zero values of the dependent
variable would ignore the binary information in the rest of the sample, namely the fact
that for the excluded values of the independent variables, the dependent variable is
known to be zero. We therefore estimate a tobit model, which combines both a probit
and a linear regression (see Davidson and MacKinnon 2004). The dependent variable is
assumed to take the form (0, Zg), implying the conditional regression

Preprint of article in the Journal of the Royal Statistical Society Series A October 2013 DOI: 10.1111/rssa.12036
Page 10 of 38
{
(4)
The loglikelihood function combines standard normal densities for observations for
which malaria frequency is positive and cumulative normal probabilities for
observations for which malaria frequency is zero. This yields estimates of the slope
coefficients g that yield malaria prevalence estimates weighted by the probability that
malaria has not been eradicated.
In both the logit and tobit regressions the coefficient standard errors are estimated
using White’s heteroskedasticity consistent covariance matrix estimator (Davidson and
MacKinnon 2004 pp 196-200). This involves replacing the least squares estimator of the
coefficient variance-covariance matrix with ̂ where the i-
th diagonal element of ̂ is the squared residual from estimating equation (4) and the
off-diagonal elements are set to zero. All estimations were performed in Stata 12.
4 RESULTS
4.1 LOGIT ANALYSIS OF THE PROBABILITY OF MALARIA ERADICATION Model (1) was estimated using the explanatory variables listed in Table 1. Table 2
shows the results of three estimations: omitting household size altogether, including it
as a continuous average, and including it as a dummy variable for a threshold of 4.0
persons. For the latter case the results were also reported as marginal probabilities. The
regressions for other household size thresholds are available in the Supplementary
Information.
In Table 2 a positive coefficient implies an increased probability of malaria
eradication. Income (standardized) is positive and significant across all specifications.
The marginal probability effect of household size falling below the four-person
threshold is 0.94 (last column) and of a one standard deviation increase in national

Preprint of article in the Journal of the Royal Statistical Society Series A October 2013 DOI: 10.1111/rssa.12036
Page 11 of 38
average income is 0.78. These large tangencies of the logistic distribution function
indicate the strong influence these variables have on the eradication probabilities, but
cannot be used to extrapolate probability calculations because of the nonlinearity of the
curve. Probability effects can instead be estimated by evaluating the logistic function (1)
at specific points. At the sample means, the estimated coefficients imply an eradication
probability of 0.436, corresponding to the mean of the malaria eradication indicator
variable. Currently about 40% of the sample countries have average household size
below 4.0 persons. If 0% of the countries did, the model predicts the probability of
eradication would fall to 0.368, whereas if 100% of the countries did, the predicted
probability of eradication would rise to 0.541, an increase of 0.173. By comparison, if all
countries in the sample experienced a one standard deviation increase in average
income, the probability of malaria eradication would rise from 0.436 to 0.581, an
increase of 0.145. To obtain an increase of 0.173 around the sample mean would require
a 1.2 standard deviation increase in income. Using the data in Table 1, this works out to
$12,575 (US), almost double the current average. Hence crossing the four-person
household size threshold globally would exert a beneficial effect on the probability of
eradicating malaria nearly comparable to that from tripling global average income.
The coefficient on population density is also large, positive and significant, as are
those on urbanization, Muslim fraction and mean annual temperature. The latter
coefficient implies that a one degree increase in the annual mean temperature would
increase the probability of malaria eradication by just under 1%. This may seem
somewhat unexpected because of the conventional view that malaria is a tropical
disease. Here the data suggest that after controlling for other factors including income
and latitude, there is, if anything, a slightly higher probability of malaria eradication in
warmer climates. DDT has a positive and significant effect on the probability of malaria
eradication only when household size is not taken into account. The coefficient remains
relatively large in Model 3 but is no longer significant at the 5 or 10% level.
Comparing Models 2 and 3, when household size is included as a simple average the
coefficient is small, negative and insignificant, but when it is included as an indicator
variable at the 4-person threshold, the size of the income coefficient drops by a third and

Preprint of article in the Journal of the Royal Statistical Society Series A October 2013 DOI: 10.1111/rssa.12036
Page 12 of 38
the household size effect becomes not only positive but the most significant in the
model. The household size effect becomes even larger, but less significant, at the 4.5
person threshold. Figure 5 shows the marginal probability estimates for the household
size dummy variables, varying the threshold from 3.5 to 6 persons. It also shows, for
comparison, the marginal probability effect of a one standard deviation in income. The
household size effect is larger than the marginal income effect at either the 4.0 or 4.5
person threshold, though it is more significant only in the former case. When the
average household size drops below six persons or five persons, the probability of
malaria eradication does not change, but at about 4 persons the probability of
eradication jumps significantly, by an amount comparable to a one standard deviation
increase in income.
Figure 2 shows that as of 2000 malaria had been successfully eradicated from 13
countries with an average household size greater than four members. They are of special
interest because all except two (Saint Vincent & Grenadines 4.3, British Virgin Islands
4.4) are Muslim countries with an average household size of 5.75 persons in 2000 (see
Table 3). Although the Muslim share of the population is small in comparison to the
overall prevalence of malaria on a worldwide basis, this factor is still important
regionally. Households in Muslim countries are characterized by a gender-segregated
sleeping arrangements which, in varying degree, divides the household into smaller
units depending on how strictly the country applies the practise (Esposito 2009). Hence
these are countries that may have relatively large households on average, but effective
household sizes below four persons as regards sleeping arrangements. Table 2 shows
that when household size is modeled as a 4-person threshold, the Muslim fraction
coefficient becomes positive and significant as a predictor of the probability of malaria
eradication. It is also positive and significant at the 4.5-person threshold, but not in logit
regressions with other household size thresholds.
4.2 TOBIT ANALYSIS OF FACTORS AFFECTING MALARIA FREQUENCY

Preprint of article in the Journal of the Royal Statistical Society Series A October 2013 DOI: 10.1111/rssa.12036
Page 13 of 38
Table 4 shows the results from estimating equation (4) with household size either
omitted or included at the four-person threshold. Results with dengue fever instead of
malaria as the dependent variable are also shown and will be discussed below. The
dependent variable is the frequency of malaria standardized by subtracting the mean
and dividing by the standard deviation. A reduction of average household size to below
four persons implies a 0.92 standard deviation drop in the frequency of malaria. A one-
standard deviation increase in income implies a drop in malaria frequency of between
one and two standard deviations, but the size of the effect drops by about 30% when
household size is introduced in the model. Figure 6 shows the household size and
income effects across all household size thresholds (full results available in the online
Supplement). It is clear that when household size is modeled as a four-person threshold,
a large portion of the effect otherwise attributed to income growth is instead identified
with the reduction in average household size.
The Muslim fraction of the population is likewise significant when household size is
controlled. The DDT coefficient is relatively large but not significant. This may, however,
simply reflect the difficulty of identifying a suitable instrument. Annual mean
temperature is insignificant across all specifications, and the coefficient is always
negative, indicating higher temperature implies (if anything) fewer malaria cases. Hence
our model does not predict that increasing temperatures would increase malaria
prevalence.
4.3 COMPARISON TO DENGUE FEVER It is worthwhile at this point to consider how these results might be explained based
on the behavior of the mosquito vector. Anopheles mosquitoes pick up the malaria
parasite from humans. At the local level, practically all Anopheles species feed at night
(Becker et al. 2003). The female mosquito gets the infection from a human blood meal.
After egg laying it returns to the same approximate location for another blood meal
(Silver 2007). The parasite multiplies sexually in the mosquito. The process takes ~10–
16 days and is completed when the infective form of the parasite reaches the salivary
Preprint of article in the Journal of the Royal Statistical Society Series A October 2013 DOI: 10.1111/rssa.12036
Page 14 of 38
glands of the mosquito (Vaughan 2007), which allows it to be transferred to another
human through the bite. The process changes the behavior of the vector, making it bite
more frequently and probe longer (Koella 1996). Early experiments with Plasmodium
vivax showed that an infective mosquito will bite 30–40 times (James 1926). For a new
person to be infected, a mosquito carrying the mature parasite back to its feeding
location must find a victim who is not already infected. Therefore the more people who
are sleeping together in the same room, the higher the probability of spreading the
infection to a new person. Reinfection is a thus stochastic process, and below a certain
threshold number of persons sleeping together, Plasmodium infection success rates drop
below the replacement rate and it begins to disappear from the human population, even
without other control measures. Our data indicate that this threshold is likely crossed
when average household size drops below somewhere between 4.0 and 4.5 persons.
Here we test this hypothesis by re-doing our analysis using data on the incidence of
dengue fever, which, like malaria is mosquito-borne and has wide geographic
distribution (Guha-Sapir and Schimmer 2005) but is spread by different species, mainly
Aedes aegypti, that are active during the day in shaded places (de Castro et al. 2005,
Lambrechts et al. 2010, Becker et al. 2003) and only occasionally at night. Thus its
transmission mechanism is not expected to be sensitive to household size, but to factors
affecting outdoor exposure.
While we did not have data on dengue eradication we were able to obtain
observations on dengue frequency for 121 of our 188 countries. We re-estimated the
tobit model with dengue as the dependent variable and the results are in the last column
of Table 4. The household size effect disappears, as does the Muslim effect, and income
becomes much smaller and only marginally significant. The cassava production
measure becomes much larger in size but remains insignificant. Our measure of
aggressive DDT usage becomes marginally significant (p=0.073). Malaria campaigns
with indoor spraying of DDT also affected other mosquitoes. For instance, Aedes aegypti
was almost eliminated in Taiwan during the malaria eradication campaigns after WWII,
and Taiwan was spared the epidemic of dengue transmission over 1945–1981
(Lambrechts et al. 2010).

Preprint of article in the Journal of the Royal Statistical Society Series A October 2013 DOI: 10.1111/rssa.12036
Page 15 of 38
The main weakness of this test is that the sample size for dengue incidence is smaller
(121 countries) than for malaria (188 countries). We ran the malaria frequency tobit
regression on the 121-country subsample, and while the results are similar to those on
the full sample the effects are generally smaller. Income remains significant but
household size becomes insignificant. Also DDT use becomes significant. In other words,
the dengue subsample has some different characteristics compared to the entire malaria
sample, so it is not a well-controlled comparison. Developing a data set that will allow a
proper comparison is a direction for future research.
5 DISCUSSION
Our findings suggest that as average household sizes continue to decline around the
world, malaria will also gradually disappear. In studying the role of household size we
have not differentiated adult and children members. Although children are likely to be
more gametocytaemic than adults, there is evidence that the threshold is not affected by
the fraction of children, since the effect has been observed in populations of soldiers
where children are not present (Huldén & Huldén 2008). Our results also raise the
possibility that in regions with large households (or large populations sharing sleeping
quarters, such as lumber camps or military barracks) the eradication of malaria will
require segmenting sleeping quarters into smaller units, such as with mosquito nets. The
average number of bed nets per person in 35 African countries is 0.21 (WHO 2009). In
Aneityum in Vanuatu (household size 5.6) a high provision of individual bed nets (0.94
nets per person) has, in combination with effective drug distribution and surveillance,
been credited with the disappearance of malaria since 1996 (Kaneko et al. 2000, Kaneko
2010). Our conjecture is that the use of individual bed nets emulates a house with
several bedrooms, making it more difficult for an infective vector to transmit the
parasite to new household members. This is a direction for future research.
The first global strategy for the eradication of malaria was adopted in 1955. It
concentrated on effective use of DDT, which aimed to stop transmission by destroying
the vector. It was largely successful in controlling epidemics and lowering the number of
malaria cases (Harrison 1978). However, mosquito control alone will not lead to

Preprint of article in the Journal of the Royal Statistical Society Series A October 2013 DOI: 10.1111/rssa.12036
Page 16 of 38
eradication. Despite more than a hundred years of effort, vector eradication has only
been achieved twice, in the Maldives and in Palestine (Huldén et al. 2012 Appendix 1).
When average household size drops close to four members, malaria will decline and
finally disappear by itself, but without other counter measures it is a prolonged process.
This was shown by Lysenko et al. (1999) and Solokova and Snow (2002), who analysed
the decline of malaria in the USSR, where DDT was introduced in 1949 for vector
control. If vector control is implemented late in the process it may appear to be the main
cause of eliminating malaria, but our results lead us to conclude instead that the
population of Plasmodium simply cannot survive in a human community with small
households.
For instance, in the US and Australia, malaria made its last appearances in regions
with larger-than-average household sizes. DDT usage in these countries from the 1940s
through the 1960s sped up an eradication process already underway, a process
described by Humphreys (1996) as “kicking a dying dog”. Malaria and dengue vectors
are both still present in Australia (Jacups and Whelan 2005), yet while dengue has
returned, malaria has not. This is consistent with the dependence of malaria on a
minimum household size threshold.
A new global attempt to eradicate malaria started in 2007. There is an ongoing debate
about how best to achieve the goal (Feachem and Sabot 2008). Our results indicate that
average household size plays a key role, and that efforts to emulate nighttime
arrangements of small households, through segregation of sleeping quarters, could be a
feasible and effective component of eradication plans.
6 REFERENCES
Ackerknecht, Erwin. 1945. Malaria in the Upper Mississippi Valley, 1760–1900.
Public Health in America 1945, 1–142. Reprint: Bulletin of the history of medicine :
Supplements 1977. 4, 1–142.

Preprint of article in the Journal of the Royal Statistical Society Series A October 2013 DOI: 10.1111/rssa.12036
Page 17 of 38
Anderson, Jamie, Shannon Doocy, Christopher Haskew, Paul Spiegel and William J
Moss. 2011. * The burden of malaria in post-emergency refugee sites: A retrospective
study. Conflict and Health, 5:17 doi:10.1186/1752-1505-5-17
Atanaka-Santos Marina, Reinaldo Souza-Santo and Dina Czeresnia. 2007. “Spatial
analysis of priority malaria control areas, Mato Grosso State Brazil.” Cadernos de Saude
Publica 23: 1099–1112.
Becker, Norbert, Dušan Petrić, Marija Zgomba, Clive Boase, Christine Dahl, John Lane
and Achim Kaiser. 2003. Mosquitoes and their control. New York, Boston, Dordrecht,
London, Moscow: Kluwer Academic / Plenum Publishers.
Bruce-Chwatt, Leonard Jan and Julian de Zulueta. 1980: The rise and fall of malaria in
Europe. A historico-epidemiological study. Oxford: Oxford University Press.
Camargo, Luis Marcelo Aranha, Marcelo Urbano Ferreira, Henrique Krieger, Erney
Plessman De Camargo and Luiz Pereira Da Silva: 1994. “Unstable hypoendemic in
Rondonia (Western Amazon Region, Brazil): Epidemic outbreaks and work-associated
incidence in an agro-industrial rural settlement.” The American Journal of Tropical
Medicine and Hygiene 51: 16–25.
De Castro Gomes Almério, José M. P. de Souza, Denise Pimentel Bergamaschi, Jair L. F.
dos Santos, valmir Roberto Andrade, Odair F. Leite, Osias Rangel, Savina S. L. de Souza,
Nair S. N. Guimarães and Virgília L. C. de Lima. 2005. Anthropophilic activity of Aedes
aegypti and of Aedes albopictus in area under control and Surveillance. Revista de Saúde
Pública 39(2): 206-9. http://dx.doi.org/10.1590/S0034-89102005000200010
Chagas Carlos. 1925. “Quelques aspects de l’epidemiologie de la malaria. Nouvelles
indications prophylactiques.” Organisation des Nations. Organisation d’hygiene. Geneva
16. March 1925. C.H./Malaria/42.
Curto Susana I, Anibal E. Carbajo and Rolando Boffi. 2003. Apliccación de sistemas de
información geográphica en epidemiología. Caso de studio: Malaria en la Argentina

Preprint of article in the Journal of the Royal Statistical Society Series A October 2013 DOI: 10.1111/rssa.12036
Page 18 of 38
(1902–2000). Instituto de Investigaciónes Epidemiologicos. 1-10
http://www.epidemiologia.anm.edu.ar/publicaciones.asp
Davidson, R. and J.G. MacKinnon. 2004. Econometric Theory and Methods. New York:
Oxford University Press.
Esposito JL (ed.) 2009. The Oxford Encyclopedia of the Islamic World. Oxford, New
York: Oxford University Press.
FAOSTAT 2000. Statistics on crops, processed crops, live animals and lifestock
primary. Food and Agriculture Organization of the United Nations.
http://faostat.fao.org/site/603/default.aspx
Feachem Richard and Oliver Sabot 2008. A new global malaria eradication strategy.
Lancet, 371: 1633-1635.
Gachelin Gabriel and Annick Opinel. 2011. Malaria epidemics in Europe after the First
World War: the early stages of an international approach to the control of the disease.
História, ciências, saúde—Manguinhos 18(29): 431–70.
Gerritsen AA, Kruger P, van der Loeff MF, Grobusch MP. 2008. Malaria incidence in
Limpopo Province, South Africa, 1998–2007. Malaria Journal 25:7: 162.
Doi:10.1186/1475-2875-7-162
Gething, Peter W, David L. Smith, Anand P. Patil, Andrew J. Tatem, Robert W. Snow
and Simon Hay. 2010. Climate change and the global malaria recession. Nature 10, 465:
342-345.
Guha-Sapir, Debarati and Barbara Schimmer. 2005. Dengie fever: new paradigms for
a changing epidemiology. Emerging Themes in Epidemiology 2:1. Doi: 10.1186/1742-
7622-2-1.
Hansen Carl Adam. 1886. Epidemiologiske undersøgelser angaande koldfeberen in
Danmark. Copenhagen.

Preprint of article in the Journal of the Royal Statistical Society Series A October 2013 DOI: 10.1111/rssa.12036
Page 19 of 38
Harrison, Gordon A. 1978. Mosquitoes, Malaria, and Man: A History of the Hostilities
Since 1880. New York. EP Dutton.
HDR 2000. Human Development Reports 2000-2006. United Nations Development
Programme. http://hdr.undp.org/en/statistics/
Health System Trust 2000. Health statistics. Statistics South Africa.
http://www.healthlink.org.za/healthstats/6/data
Huldén, Lena and Larry Huldén. 2008. Dynamics of positional warfare malaria:
Finland and Korea compared. Malaria Journal 2008, 7:171. Doi:10.1186/1475-2875-7-
171
Huldén, Lena and Larry Huldén. 2009. The decline of malaria in Finland – the impact
of the vector and social variables. Malaria Journal 2009, 8:94. Doi:10.1186/1475-2875-
8-94
Huldén, Lena, Ross R. McKitrick and Larry Huldén. 2012. Average Household Size and
the Eradication of Malaria. University of Guelph Discussion Paper 2012-03, available at
http://www.uoguelph.ca/economics/research/discussion-papers.
Humphreys, Margaret. 1996 Kicking a Dying Dog: DDT and the Demise of Malaria in
the American South. 1942-1950," Isis 87: 1-17
Hustache, Sarah, Mathieu Nacher, Felix Djossou, and Bernard Carme 2007: Malaria
risk in children in French Guiana. American Journal of Tropical Medicine and Hygiene
76(4): 619-625.
INDEC. 2001. Population Census. Argentina.
http ://www.indec.mecon.ar/webcenso/index.asp
Jacups S and Whelan PI 2011. Mosquito-borne diseases in the NT: an historical
overview. Northern Territory Disease Control Bulletin 18:2:19-23

Preprint of article in the Journal of the Royal Statistical Society Series A October 2013 DOI: 10.1111/rssa.12036
Page 20 of 38
James, Sidney Price and Percy Georg Shute. 1926. “Report on the First Results of
laboratory Work on Malaria in England.” League of Nations. Health Organisation. Malaria
Commission; Geneva. C.H./Malaria/57.
James, Sidney Price. 1930. The Disappearance of Malaria from England. Proceedings of
the Royal Society of Medicine 33:71−87
Kager Piet A. 2002. Malaria Control: constrains and opportunities. Tropical medicine
& International Health 7: 1042−1046.
Kaneko A, Taleo G, Kalkoa M, Yamar S, Kobayakawa T, Björkman A. 2000. Malaria
eradication on islands. Lancet 2000, 356:1560-64.
Kaneko Akira. 2010. A community-directed strategy for sustainable malaria
elimination on islands: Short-term MDA integrated with ITNs and robust surveillance.
Acta Trop 2010, 114:177-183.
Kettani, Houssain. 2010 World Muslim Population. Proceedings of the 8th Hawaii
International Conference on Arts and Humanities, Honolulu; 2010.
[www.pupr.edu/hkettani/papers/HICAH2010.pdf]
Koella, Jacob C and Martin J. Packer. 1996. Malaria parasites enhance blood-feeding of
their naturally infected vector Anopheles punctulatus. Parasitology 113:105-9.
Kuhn, Katrin Gaardbo, Diarmid H. Campbell-Lendrum and Clive R Davies. 2002. A
continental risk map for malaria mosquito (Diptera: Culicidae) vectors in Europe.
Journal of Medical Entomology 39: 621−630.
Lambrechts Louis, Thomas W. Scott and Duane J. Gubler. 2010. Consequences of the
Expanding Global Distribution of Aedes albopictus för dengue Virus Transmission. PloS
Neglected Tropical Diseases 4(5): e646. Doi: 10.1371/journal.pntd.0000646
Legrand Eric, Béatrice Volney, Jean-Baptiste Meynard, Odile Mercereau-Puijalon and
Philippe Esterre. 2008 “In vitro monitoring of Plasmodium falciparum drug resistance in

Preprint of article in the Journal of the Royal Statistical Society Series A October 2013 DOI: 10.1111/rssa.12036
Page 21 of 38
French Guiana: a synopsis of continuous assessment from 1994–2005.” Antimicrobial
Agents and Chemotherapy, 52:288–298. Doi: 10.1128/AAC.00263-07
Lum J.K., A. Kaneko, G. Taleo, M. Amos and D.M. Reiff. 2007. Genetic diversity and
gene flow of humans, Plasmodium falciparum, and Anopheles farauti s.s. of Vanuatu:
inferred malaria dispersal and implications for malaria control. Acta Trop, 103:102-7.
Lysenko AJ and AV Kondraschin. 1999. ”Malariologia.” World Health Organization.
Geneve. [In Russian]. [http://whqlibdoc.who.int/hq/1999/WHO_MAL_99.1089.pdf ]
Manguin, Sylvie, Pierre Carnevale and Jean Moucet. 2008. Biodiversity of Malaria in
the World. Paris: John Libbey Eurotext
Miller, Tracy. 2009. Mapping the global Muslim population. A report on the size and
distribution of the world’s Muslim population, Washington: Pew Research Center.
http://pewforum.org/uploadedfiles/Orphan_Migrated_Content/Muslimpopulation.pdf
OSF. 2006. Official Statistics of Finland [e-publication]. Helsinki: Advisory Board of
OSF [Referred: 31.3.2006]. Access method: http://www.stat.fi/meta/svt/index_en.html.
Park, Jae-Won, Gyo Jun and Joon-Sup Yeom. 2009. Plasmodium vivax Malaria: Status
in the Republic of Korea Following Reemergence. Korean J Parasitol. Vol. 47,
Supplement: S39-S50 doi: 10.3347/kjp.2009.47.S.S39
Reiter, Paul. 2008. Global warming and malaria: knowing the horse before hitching
the cart. Malaria Journal 7(S1): 3. Doi: 10.1186/1475-2875-7-S1-S3
Silver John B. 2007. Mosquito Ecology: Field Sampling Methods. Dordrecht: Springer.
Snowden, Frank M. 1999. ”Fields of death”: malaria in Italy, 1861–1962. Modern Italy
4(1): 25–57.
Snowden, Frank M. 2006. The Conquest of Malaria – Italy, 1900–1962. New Haven,
London: Yale University Press.

Preprint of article in the Journal of the Royal Statistical Society Series A October 2013 DOI: 10.1111/rssa.12036
Page 22 of 38
Solokova Martina I. and Keith Snow. 2002. Malaria vectors in European Russia.
European Mosquito Bulletin 12:1-6.
TAT 2009: Terrestrial Air Temperature: 1900-2008, Gridded Monthly Time Series (V
2.01). – In the University of Delaware. File air_temp2009.tar.gz at
http://climate.geog.udel.edu/~climate/
Vaughan, Jefferson A. 2007. Population dynamics of Plasmodium sporogony. Trends in
Parasitology 23(2): 63–70. Doi:10.1016/j.pt.2006.12.009
Wesenberg-Lund, Carl. 1943. Biologie der Süsswasserinsekten. Copenhagen:
Gyldendalske Boghandel Nordisk Forlag Und Verlag J. Springer.
WHO 2008. Mekong malaria programme, malaria in the Greater Mekong Sub Region:
Regional and country profiles. World Health Organization.
[http://whothailand.org/EN/Section3/Section113.htm]
WHO 2009. World Malaria Report 2009. Geneva: World Health Organization.
World Bank 2011. Population growth (annual %).
http://data.worldbank.org/indicator/SP.POP.GROW

7 TABLES
Continuous Variables
Variable Name
Description Mean Std. Dev. Median IQR Minimum Maximum
mal_freq Malaria frequency (cases/100,000) 2723 6689.2 3.5 1040 0 48790 dengue Dengue frequency (cases/100,000) 75.9 191.4 10.6 76.5 0 1371 hhsize Mean household size 4.4 1.5 4.4 2.3 2.1 8.7 gdpcap Real income (US$ GDP per capita,
2000) 6635 10472.2 1790 6933 85 75583
popden Population density (persons/km2) 311 1384.4 77 152 2.3 16300 chgpop Avg annual % Population change 1997-
2001 1.4 1.2 1.4 1.8 -1.7 5.9
urban % living in urban area 54.4 24.3 55.5 38.3 8.6 100 muslim % Muslim 26.0 37.3 4.0 48.4 0 100 water_tot % with access to clean water 79.7 18.3 82.0 30.9 22.0 100 lat Absolute Latitude (degrees) 24.5 16.2 20.3 25.0 0.3 61.3 ann_temp Mean annual temperature, 1980-2008 18.1 6.8 20.2 12.5 -0.8 28.1 forest % of land covered with forest 29.9 21.6 28.4 34.6 0.0 94.7 slum % living in slums 11.7 14.0 3.1 20.8 0.0 53.0 female_lit Female literacy rate (percentage) 77.7 24.8 88.4 36.0 3.0 100.0 cassava Cassava production (1000 tonnes p.a.) 0.1 0.1 0.0 0.02 0 1.11 Binary Variables Proportion Number mal_erad Malaria eradicated (=1) or not (=0) 0.44 83 hh_under35 Mean household size under 3.5 persons 0.32 60 hh_under40 Mean household size under 4.0 persons 0.40 75 hh_under4.5 Mean household size under 4.5 persons 0.53 100

Preprint of article in the Journal of the Royal Statistical Society Series A October 2013 DOI: 10.1111/rssa.12036
Page 24 of 38
hh_under5.0 Mean household size under 5.0 persons 0.64 120 hh_under5.5 Mean household size under 5.5 persons 0.74 139 hh_under6.0 Mean household size under 6.0 persons 0.84 158 ddt DDT used (=1) after 1940 or not (=0) 0.78 147 ddt_x DDT used up to year malaria eradicated 0.18 30
Table 1a: Variable names and summary statistics. N = 188 in all categories except dengue for which N=126. The former sample includes those countries in which malaria is or was once present (188 countries) since that is the sample used for the malaria regressions. The dengue regression is based on the 126 countries in which dengue is or was once present, which was the sample for the dengue regression.
Description Source Malaria frequency (cases/100,000) World Health Organization, Bruce-Chwatt and de Zullueta (1980),
Manguin et al. (2008). Dengue frequency (cases/100,000) Huldén et al. (2012) Appendix 1 Mean household size Statistics Finland http://www.stat.fi Accessed March 2006 Real income (US$ GDP per capita, 2000) World Bank Population density (persons/km2) Statistics Finland http://www.stat.fi Accessed March 2006 Avg annual % Population change 1997-2001 Statistics Finland http://www.stat.fi Accessed March 2006 % living in urban area Statistics Finland http://www.stat.fi Accessed March 2006 % Muslim Kettani (2010), Miller (2009) % with access to clean water HDR (2000) Latitude (degrees) Authors’ Calculation Mean annual temperature, 1980-2008 Terrestrial Air Temperature (TAT) (2009) % of land covered with forest FAOSTAT (2003-2009) % living in slums UN-Habitat http://www.un-habitat.org (2006/2007) Female literacy rate UN Human Development Reports http://hdr.undp.org/en/reports/ Cassava production (1000 tonnes p.a.) FAOSTAT (2003-2009) Malaria eradicated (=1) or not (=0) World Health Organization

Preprint of article in the Journal of the Royal Statistical Society Series A October 2013 DOI: 10.1111/rssa.12036
Page 25 of 38
DDT used (=1) after 1940 or not (=0) Huldén et al. (2012) Appendix DDT used up to year malaria eradicated Huldén et al. (2012) Appendix Table 1b: Variables and Data Sources. Table 2. Results from logit regression. All models estimated with White’s correction for heteroskedasticity. * denotes significant at 10%, ** denotes significant at 5% and *** denotes significant at 1%. Binary dependent variable where 1 = malaria eradicated, 0 = malaria still present Explanatory variable
Model 1: household size not included
Model 2: household size enters model in continuous form (national average)
Model 3: household size enters model in binary form at 4-person threshold
Marginal probabilities from Model 3
coefficient t-statistic coefficient t-statistic coefficient t-statistic
Standardized income
4.754** (2.33) 4.445** (2.43) 3.154*** (2.70) 0.771
Average household size
-0.630 (-0.95)
Avg household size under 4 (1=yes, 0=no)
3.830*** (3.43) 0.936
Population density (standardized)
5.094* (1.71) 5.191* (1.77) 6.261** (2.08) 1.530
Average annual -0.711 (1.19) -0.800 (1.62) -0.883* (-1.74) -0.216
Preprint of article in the Journal of the Royal Statistical Society Series A October 2013 DOI: 10.1111/rssa.12036
Page 26 of 38
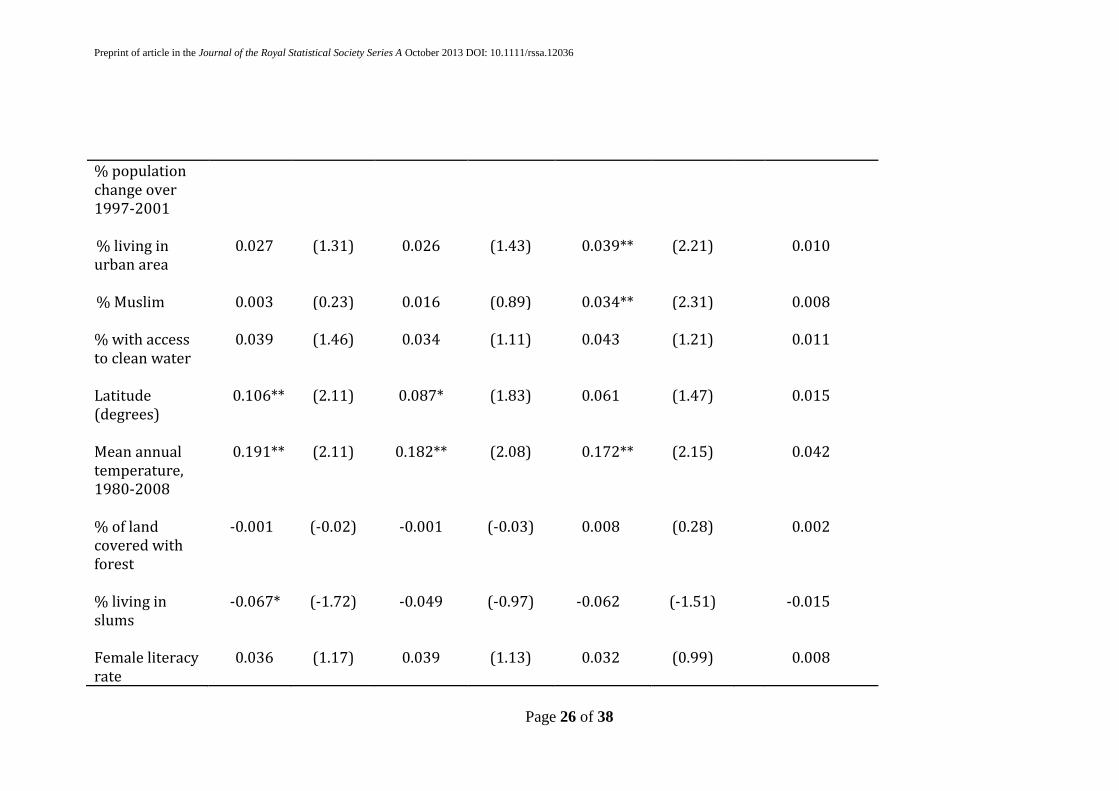
% population change over 1997-2001 % living in urban area
0.027 (1.31) 0.026 (1.43) 0.039** (2.21) 0.010
% Muslim 0.003 (0.23) 0.016 (0.89) 0.034** (2.31) 0.008 % with access to clean water
0.039 (1.46) 0.034 (1.11) 0.043 (1.21) 0.011
Latitude (degrees)
0.106** (2.11) 0.087* (1.83) 0.061 (1.47) 0.015
Mean annual temperature, 1980-2008
0.191** (2.11) 0.182** (2.08) 0.172** (2.15) 0.042
% of land covered with forest
-0.001 (-0.02) -0.001 (-0.03) 0.008 (0.28) 0.002
% living in slums
-0.067* (-1.72) -0.049 (-0.97) -0.062 (-1.51) -0.015
Female literacy rate
0.036 (1.17) 0.039 (1.13) 0.032 (0.99) 0.008

Preprint of article in the Journal of the Royal Statistical Society Series A October 2013 DOI: 10.1111/rssa.12036
Page 27 of 38
DDT used aggressively
1.404* (1.91) 1.249* (1.72) 1.326 (1.44) 0.324
Cassava production (standardized)
-0.226 (0.95) -0.272 (-0.94) -0.635 (-1.61) -0.155
Constant -11.491** (-2.16) -8.447 (-1.26) -13.789** (-2.58) -3.369 N 188 188 188 Pseudo-R2 0.728 0.733 0.783
Table 3: Countries with mean household size greater than 4, and malaria eradicated
Muslim %
Average Household size (persons)
Albania 79.9 4.2
Bahrain 81.0 5.9
Brunei 67.0 6.0
Jordan 95.0 5.3
Kosovo 90.0 6.0

Preprint of article in the Journal of the Royal Statistical Society Series A October 2013 DOI: 10.1111/rssa.12036
Page 28 of 38
Lebanon 60.0 4.3
Libya 97.0 6.3
Maldives 100 7.1
Palestine 97.5 7.2
Tunisia 98.0 4.7
United Arab Emirates 76.0 6.2
.

Preprint of article in the Journal of the Royal Statistical Society Series A October 2013 DOI: 10.1111/rssa.12036
Page 29 of 38
Table 4: Tobit regression results. All models estimated with White’s correction for heteroskedasticity. * denotes significant at 10%, ** denotes significant at 5% and *** denotes significant at 1%.
Dependent variable: Malaria incidence (Standard Deviation units)
Dependent variable: Dengue incidence (Standard
Deviation units) Explanatory Household size
omitted Household size: 4-person threshold
dummy
Household size: 4-person threshold dummy
Variable coefficient t-statistic
coefficient t-statistic
coefficient t-statistic
GDP/capita (standardized)
-1.758*** (-3.09) -1.227** (-2.29) -0.148* (-1.70)
Dummy for household size <4
-0.921** (-2.51) 0.081 (0.18)
Population density (standardized)
-1.224 (-1.27) -1.241 (-1.30) 0.011 (0.28)
Average annual % population change over 1997-2001
0.249* (1.90) 0.209 (1.61) -0.053 (-0.62)
% living in urban area
-0.006 (-0.78) -0.005 (-0.68) 0.010* (1.83)
% Muslim -0.005 (-1.48) -0.008** (-2.20) -0.001 (-0.38)

Preprint of article in the Journal of the Royal Statistical Society Series A October 2013 DOI: 10.1111/rssa.12036
Page 30 of 38
% with access to clean water
0.007 (0.93) 0.007 (0.91) 0.010* (1.75)
Latitude (degrees) -0.030** (-2.30) -0.023* (-1.75) -0.012 (-0.81) Mean annual temperature, 1980-2008
-0.010 (-0.40) -0.003 (-0.11) 0.020 (1.65)
% of land covered with forest
-0.006 (-1.03) -0.007 (-1.16) 0.013** (2.39)
% living in slums 0.005 (0.57) 0.002 (0.20) -0.033*** (-2.83) Female literacy rate -0.008 (-1.16) -0.010 (-1.42) -0.007 (-0.93) Cassava production (1000 tonnes p.a.)
0.008 (0.08) 0.041 (0.41) 0.214 (1.32)
DDT used aggresively -0.384 (-1.01) -0.222 (-0.55) -0.399* (1.81) Constant -0.096 (0.09) 0.354 (0.32) -1.112 (-1.19) Number of obs 188 188 126 Pseudo-R2 0.293 0.306 0.113 Log likelihood -173.302 -170.039 -157.009

8 FIGURES
Figure 1. By year: fraction of countries in our sample in which malaria is still present
(mal_still, dashed line), DDT is still used (ddt_still, solid line) and the ratio of the two
(dotted line). Vertical dash line: 1971, year US banned DDT.
Preprint of article in the Journal of the Royal Statistical Society Series A October 2013 DOI: 10.1111/rssa.12036
Page 32 of 38
Figure 2. Histograms of malaria frequency (number of countries) versus household .
Top: countries in which malaria was eradicated as of 2000. Bottom: countries where
malaria is still present.

Preprint of article in the Journal of the Royal Statistical Society Series A October 2013 DOI: 10.1111/rssa.12036
Page 33 of 38
Figure 3a. Histograms of number of countries in sample versus income, absolute
latitude, female literacy and urbanization. In each, the top group includes only those
countries where malaria is eradicated and the bottom group includes only those where
it is still present. Note the vertical axis is sample fraction; scale differs between columns
to aid readability.

Preprint of article in the Journal of the Royal Statistical Society Series A October 2013 DOI: 10.1111/rssa.12036
Page 34 of 38
Figure 3b. Histograms of number of countries in sample versus mean annual
temperature and DDT usage. In each, the top group includes only those countries where
malaria is eradicated and the bottom group includes only those where it is still present.

Preprint of article in the Journal of the Royal Statistical Society Series A October 2013 DOI: 10.1111/rssa.12036
Page 35 of 38
Figure 4. Trends of household size in 23 countries, showing end of malaria in 12
countries that had a malaria eradication program and 11 countries without eradication
program.

Preprint of article in the Journal of the Royal Statistical Society Series A October 2013 DOI: 10.1111/rssa.12036
Page 36 of 38
Figure 5. Household size and income coefficients from logit regression with malaria
eradication indicator as dependent variable. Filled circles show effect when household
size drops below indicated threshold, with 2 standard deviation range shown as
vertical bars. The coefficient value can be interpreted as the relative strength of the
effect. Numerical examples for interpreting the results at the 4.0-person threshold in
terms of changes in the probability of malaria eradication are given in the text. The solid
line shows the effect associated with a one standard deviation increase in average
income, and the dotted lines show the corresponding 2 standard deviation ranges.

Preprint of article in the Journal of the Royal Statistical Society Series A October 2013 DOI: 10.1111/rssa.12036
Page 37 of 38
Figure 6. Left panel: circles show partial effects of one standard deviation increase in
average income on malaria frequency (measured in standard deviation units) with
household size represented as a dummy variable at the indicated thresholds. Right
panel: circles show effect on malaria frequency (in standard deviation units) of
household size falling below the indicated threshold. In both panels the 2 standard
deviation range is shown
Preprint of article in the Journal of the Royal Statistical Society Series A October 2013 DOI: 10.1111/rssa.12036
Page 38 of 38
APPENDIX: INTERNET DATA SOURCES
Gross Domestic Product (GDP) per capita: http://data.worldbank.org/indicator/NY.GDP.MKTP.CD/countries/1w?display=graph. Walter Reed systematic catalogue of Culicidae: http://www.mosquitocatalog.org the Global Infectious Diseases and Epidemiology Network (Gideon): http://www.gideononline.com Impact malaria: http://en.impact-malaria.com