making rainfall features fun: scientific activities for ... · making rainfall features fun:...
TRANSCRIPT
Hydrol. Earth Syst. Sci., 20, 1751–1763, 2016
www.hydrol-earth-syst-sci.net/20/1751/2016/
doi:10.5194/hess-20-1751-2016
© Author(s) 2016. CC Attribution 3.0 License.
Making rainfall features fun: scientific activities for teaching
children aged 5–12 years
Auguste Gires1, Catherine L. Muller2,4, Marie-Agathe le Gueut3, and Daniel Schertzer1
1HMCo, École des Ponts, UPE, Champs-sur-Marne, France2Royal Meteorological Society, Oxford Road, Reading, RG1 7LL, UK3Editions le Pommier, Paris, France4School of Geography, Earth and Environmental Sciences, University of Birmingham, Edgbaston, Birmingham, B15 2TT, UK
Correspondence to: A. Gires ([email protected])
Received: 16 November 2015 – Published in Hydrol. Earth Syst. Sci. Discuss.: 15 January 2016
Revised: 15 April 2016 – Accepted: 20 April 2016 – Published: 9 May 2016
Abstract. Research projects now rely on an array of different
channels to increase impact, including high-level scientific
output, tools, and equipment, but also communication, out-
reach, and educational activities. This paper focuses on ed-
ucation for children aged 5–12 years and presents activities
that aim to help them (and their teachers) grasp some of the
complex underlying issues in environmental science. More
generally, it helps children to become familiarized with sci-
ence and scientists, with the aim to enhance scientific culture
and promote careers in this field. The activities developed
are focused on rainfall: (a) designing and using a disdrome-
ter to observe the variety of drop sizes; (b) careful recording
of successive dry and rainy days and reproducing patterns
using a simple model based on fractal random multiplicative
cascades; and (c) collaboratively writing a children’s book
about rainfall. These activities are discussed in the context of
current state-of-the-art pedagogical practices and goals set by
project funders, especially in a European Union framework.
1 Introduction
Research projects now rely on an array of different channels
to increase impact. This obviously includes high-level sci-
entific output, tools, and instrumentation, but also commu-
nication, outreach, and educational activities. This paper fo-
cuses on education for young children (5–12 years old) and
presents a number of activities and a science book with the
aim of assisting them (and their teachers and parents) to grasp
some of the complex underlying issues in the field of envi-
ronmental science, with a focus on rainfall. More generally,
it helps children to become familiarized with science and the
role of scientists, with the aim of enhancing scientific cul-
ture and promoting careers in this field. The classroom ac-
tivities presented form part of the dissemination effort of the
NEW Interreg IV RainGain project (www.raingain.eu) and
the Ecole des Ponts ParisTech Chair “Hydrology for resilient
cities” endowed by Véolia (www.veolia.com). The three ac-
tivities are specifically dedicated to transmitting knowledge
on rainfall features:
– design and implementation of a drop measurement de-
vice;
– recording and modeling of the succession of dry and
rainy days;
– collaborative writing of a scientific book about rainfall.
The activities will be discussed in the context of current ped-
agogical practice and goals set by project funders, especially
in a European Union framework.
A pedagogic perspective
Good science education is essential in early childhood, not
only for social and cognitive development but also for engag-
ing young (3–5 years old) learners with science (Sackes et al.,
2009). However, science is often perceived as unappealing to
young learners (Koren and Bar, 2009; Sjøberg and Schreiner,
2005; Stefansson, 2006; Muller et al., 2013). Many studies
have highlighted the need to engage and enthuse learners at a
Published by Copernicus Publications on behalf of the European Geosciences Union.

1752 A. Gires et al.: Making rainfall features fun: scientific activities for teaching children
young age: Tai et al. (2006) found that American students re-
porting an interest in science careers at the age of 13–14 were
more likely to obtain a university degree in a science field
than those with no interest; the Royal Society (2004) found
that 63 % of their UK study participants had first considered
a career in a science and engineering field by the age of 14;
Maltese and Tai (2010) found 30 % of participants having an
interest in middle school or high school.
A positive attitude towards science in school will often
lead to a positive commitment and lifelong interest in the
subject (Simpson et al., 1994). Bennett and Hogarth (2009)
showed that positive attitudes to school science declined sig-
nificantly between the ages of 11 and 14, whilst Lyons (2006)
found that students are often not engaged by the “autocratic”
way science is represented in their classes, finding that it is
often disconnected from the natural world they experience
on a day-to-day basis. Maltese and Tai (2010) found that
early interest in science was provoked by specific memo-
rable activities (specifically school-based experiences related
to demonstrations) or an exceptional teacher.
Previous work has also found that the key to students’ un-
derstanding of science is activities which actively involve the
student. As such, numerous studies (e.g., Muller et al., 2013;
Alrutz, 2004; Buncick et al., 2001; Cleaves, 2005; Dorion,
2007, 2009; Ellington et al., 1981; Harvard-Project-Zero,
2001; Lyons, 2006; Maltese and Tai, 2010; Odegaard, 2003;
Royal Society, 2004; Osborne et al., 2003; SATIS, 1986; Slo-
man and Thompson, 2010; Tai et al., 2006; Tobias and Hake,
1988; Wagner, 1998) have found that including a variety of
activities and methods to engage students with different in-
terests and experiences, providing an engaging classroom en-
vironment and allowing students to feel comfortable asking
questions are important factors that can invoke interest in sci-
ence and foster retention.
Using hands-on activities is clearly a popular and suc-
cessful method to engage students. However, many teachers
find science challenging to teach and, as such, turn to pic-
ture books and children’s science literature for assistance.
Sackes et al. (2009) explored the benefits and limitations
of using children’s literature to introduce science concepts.
The authors found that although some books are poorly writ-
ten and can spread misconception, those written under the
guidance of science consultants were great learning tools,
offering unique opportunities for introducing science con-
cepts in the early years, fostering interest, curiosity, and pos-
itive attitudes, as well as integrating literacy and science
(Broemmel and Rearden, 2006; Castle and Needham, 2007;
Coskie, 2006; Monhardt and Monhardt, 2006). Pringle and
Lamme (2005) found that picture books in particular were
very useful for communicating concepts in a welcome and
familiar format, and demonstrating logical connections that
exist between classroom learning and the natural worlds out-
side the classroom. Thus children’s books – when produced
and used accurately and effectively (Ford, 2006) – are a key
part of supporting children’s development of scientific con-
cepts (Zeece, 1999).
The following chapters outline a number of hands-on ac-
tivities and a scientific book that have been developed to sup-
port the teaching and learning of complex topics at a young
age. The presentation of each activity is preceded by a histor-
ical and scientific background section and followed by a “go-
ing further” section. The purpose of these sections is to pro-
vide teachers and educators with sufficient material so that
they feel comfortable when implementing the activity. Ac-
cording to the age of the children, they may or may not use
this additional information. The activities were initially im-
plemented in a classroom with children aged 5–6 years. This
was a practical choice driven by the fact that the son of the
first author was in that class, which facilitated the first contact
with the teacher! Since then other implementations have been
carried out. The target audience of the collection to which the
book belongs is 8–12 years. Hence, the collaborative shaping
of the book was achieved with a classroom of children aged
8–9, i.e., the youngest of the age range targeted. This was
to make sure to make sure that it is understandable for the
whole age range targeted.
2 Drops are not all the same: the flour or oil
disdrometer experiment
This activity consists of designing and testing disdrometers
made from paper plates containing a few millimeters of flour
or oil to observe rain drops individually.
The aim of the activity is 2-fold:
1. learning how to design and test two instruments, as well
as compare their pros and cons in “laboratory” and “ac-
tual” conditions;
2. unveiling the unknown diversity of rain drop sizes and
providing some basic explanations.
The activity was implemented in October 2013 in a class-
room with children aged 5–6, in Sceaux (south of Paris,
France).
2.1 Historical and scientific background
The idea of this activity is to reproduce in a more “artisanal”
way a famous experiment by Marshall and Palmer (1948)
who used dyed filter paper to get an estimate of the drop size
distribution (DSD). In the same paper, they used these ob-
servations to calibrate the famous relation Z = aRb (with
a= 200 and b= 1.6) between the reflectivity Z measured
by weather radar (basically the power of the wave backscat-
tered by drops in the atmosphere) and the rain rate R, the
variable hydrometeorologists are interested in. This relation-
ship is still commonly used, and its establishment was a
milestone in weather radar applications. A similar experi-
ment was carried out by Lovejoy and Schertzer (1990) who
Hydrol. Earth Syst. Sci., 20, 1751–1763, 2016 www.hydrol-earth-syst-sci.net/20/1751/2016/

A. Gires et al.: Making rainfall features fun: scientific activities for teaching children 1753
Figure 1. Illustration of the fact that water and oil are not miscible. (a) Adding colored water drops with a pipette in a glass of oil. (b) Outcome
of the experiment with milk (left) or oil (right). (c) Child drawing observations.
used 128 cm× 128 cm of chemically blotted paper. They
showed that drop centers are not homogeneously distributed
but rather exhibit some clustering with an underlying scale-
invariant fractal distribution. Interestingly, rain drop fossils
have also recently been used to characterize ancient DSDs
and thus provide information about air density 2.7 billion
years ago, when the imprints were formed (Som et al., 2012).
2.2 Presentation of the experiment and discussion
2.2.1 Design and lab test of the devices
The disdrometer is made of few millimeters of flour or oil
in a plate (or any similar sort of medium). To understand
the functioning of the oil disdrometer, children first need to
notice that oil and water are not miscible. This is demon-
strated using glasses containing either milk or oil, to which
a drop of water is added using a pipette (Fig. 1a). Follow-
ing a suggestion of the teacher, the water within the pipette
is colored to increase the visibility of the output. The be-
havior within the two glasses is very different (Fig. 1b);
in the milk, everything gets mixed, whereas in the oil, the
drops remain independent of the oil and sink. In order to
help children interpret and analyze the experiment, they are
asked to illustrate their observations (Fig. 1c). This use of
personal drawings is one of the basic ideas underlying the
pedagogy promoted by the “La main à la Patte” foundation
(http://www.fondation-lamap.org/en/international), and was
suggested by the teacher.
The disdrometers are constructed by placing a few mil-
limeters of flour or oil onto a plate. Artificial drops of colored
water are dropped onto the disdrometer using a pipette. Half
of the children test the flour device, while the other half test
the oil disdrometer (Fig. 2). The children were all able to cre-
ate their own device without wasting or spilling oil or flour,
and only three of them needed significant help in the process.
The use of a deep container as suggested by the teacher also
helped! The basic premise of the session is for it to be inter-
active, allowing the children, the scientist, and the teacher to
discuss, understand, and compare the functionality of the de-
vices. Children started by comparing their device with their
neighbor’s one since he/she had made the other type of de-
vice. The teacher was helpful in starting the discussion, be-
cause the scientist was not used to this at the beginning.
The main learning concepts are
– Once a droplet falls onto the flour disdrometer, it creates
a small wet crater that remains visible.
– Once a droplet falls on the oil disdrometer, it does not
mix with oil and remains visible where it landed.
– The flour device can be easily transported while the oil
one cannot. Indeed, as soon as the device is not com-
pletely horizontal, droplets begin to move and merge
when they reach the lowest part of the plate/container.
This does not occur with the flour device which tolerates
being slightly tilted.
– The oil disdrometer retains a better imprint of drop size.
Indeed with the flour device, the water slightly spreads
around the small crater. Hence, the actual size is lost,
and only the relative sizes are accurate. With the oil
device, the shape of droplets are lost as they become
spherical, however the volume remains accurate since
the water of the drop and oil do not mix.
Being very visual, the first three items were easily grasped
by children, whereas the fourth one was a bit trickier and
required more detailed explanations and illustrations for few
of them. The size differences between imprints in flour and
in oil while drops were created using the same pipette was
initially noted only by a few children.
2.2.2 Outside implementation and drop analysis
The second part of the activity consists of testing the dis-
drometers under actual rainfall. For this a volunteer needs to
go outside with the disdrometer, uncover it for a few sec-
onds, and return inside for analysis (Fig. 3a). Typical results
are displayed on Fig. 3b. We were lucky that it was actually
raining the day of the experiment. In case it had not been,
some pictures were ready in order to continue the discussion
anyway and the teacher would have done the actual test once
some rain appeared.
At this stage it should be noted that the oil disdrometer is
unsatisfactory under real conditions because when a droplet
impacts – or more precisely, crashes into – the oil surface,
it breaks up into several droplets, thus biasing the results.
www.hydrol-earth-syst-sci.net/20/1751/2016/ Hydrol. Earth Syst. Sci., 20, 1751–1763, 2016

1754 A. Gires et al.: Making rainfall features fun: scientific activities for teaching children
Figure 2. Designing and testing disdrometers (either with oil or flour) in a classroom with artificial drops of tinted water.
Figure 3. Use of the flour disdrometer in rainy conditions. (a) Experimenter bringing the device under rain and uncovering it for a few
seconds. (b) Example of the outcome where the various sizes of drops are visible. (c) Drawings by the children of their observations.
However, the fact that a device which seemed effective dur-
ing inside lab testing failed under “real” conditions is an in-
teresting lesson for children. In order to help children notice
the various sizes of drops and their inhomogeneous distribu-
tion, they are also asked to draw their observations (Fig. 3c).
The variety of drop sizes was visible on about 2/3 of the chil-
dren’s drawings. Let us mention here that the children were
not asked to measure the drops’ sizes because they were too
young to achieve this, which is why we used the drawing.
With older children it is possible to include measurement in
the activity, as done recently by Mazon and Viñas (2013) who
implemented a similar low-cost “flour” disdrometer experi-
ment with high school students. Before going on, it should be
mentioned that the actual skill involved in doing a measure-
ment is a learning goal as well. Indeed, it is an empowering
notion that one can know something by measuring it oneself,
instead of trusting the knowledge passed on to one by others.
Once they have observed the variety of drop sizes, the chil-
dren are given some insights into the formation and develop-
ment of rainfall. The main elements for such a young audi-
ence are
i. Water vapor evaporates from the Earth’s surface and
moves up through the atmosphere until it reaches a
colder height, where it starts to condense around a small
particle (known as a “condensation nuclei”, e.g., dust,
soot, pollutants).
ii. Droplets grow by further condensation or merging with
other droplets after a random collision. An area with nu-
merous droplets forms a cloud.
Hydrol. Earth Syst. Sci., 20, 1751–1763, 2016 www.hydrol-earth-syst-sci.net/20/1751/2016/

A. Gires et al.: Making rainfall features fun: scientific activities for teaching children 1755
Figure 4. Representation of drop by drop data collected by a 2-D video disdrometer during an event that occurred on 24 September 2012
in Ardèche, France. Each plot corresponds to 1 s and the corresponding time is indicated above it. The size of the sampling area is
11 cm× 11 cm. Raw data provided by Laboratoire de Télédétection en Environnement of Ecole Polytechnique Fédérale de Lausanne.
iii. Once a droplet becomes too heavy to be held in the at-
mosphere, it begins to fall.
iv. As the droplets fall, there are further collisions and
breakups leading to a range of droplet sizes (equivo-
lumic diameter) typically between 0.2 and 5–6 mm at
ground level, the more numerous ones being of size 1–
2 mm.
For this part of the activity, no dedicated tools were used and
it was only based on a discussion. To illustrate the first point,
the standard example of the condensation around a bottle
taken out of a refrigerator was used and some children rec-
ognized this effect. Some specific activities should be devel-
oped to address these issues in future works.
2.3 Going further
Similar images can be obtained using a 2-D video disdrom-
eter which estimates the features (size, fall velocity, and po-
sition) of the drops falling within a sampling area of approx-
imately 11 cm× 11 cm (see Kruger and Krajewski, 2002 for
a detailed description of the device). This device enables ob-
servations – such as those obtained with the flour disdrom-
eter – to be recorded automatically. Figure 4 displays the
droplets recorded over 1 s (for each plot) during an event that
occurred on 24 September 2012 in Ardèche, France. Such
figures can be used to further illustrate the diversity of drop
sizes and the variability observed over time, and can be com-
pared to the children’s drawings. An example of the use of
such data can be found in Gires et al. (2015), who computed
the time needed for a given number of drops to fall through
the sampling area, and showed that the distribution exhibited
a power-law falloff confirming the inhomogeneous nature of
drop distribution.
3 Rain or no rain: a fractal perspective
This activity consists of recording a daily time series of rain-
fall occurrences over 2 months, in order for children to un-
derstand the complexity of succession of dry and wet days,
and of implementing a stochastic cascade model to reproduce
patterns similar to the observed ones. The activity was tested
in the same classroom as for the disdrometer experiment,
with children aged 5–6 years in January 2014 in Sceaux.
The aim of the activity is 2-fold:
1. assisting children to understand the difficulty of care-
fully recording data over a long period of time;
2. introducing the notion of a “model”, as well as “ran-
domness”, with which they are not familiar. The idea
is for the learners to become involved in the concepts
rather than to formalize the complexities of them, which
would be difficult for them to grasp.
3.1 Historical and scientific background
Rainfall occurrence patterns are tricky to characterize,
model, and simulate at all scales and they still remain an
open issue. See, for example, Gires et al. (2013) or Schleiss et
www.hydrol-earth-syst-sci.net/20/1751/2016/ Hydrol. Earth Syst. Sci., 20, 1751–1763, 2016

1756 A. Gires et al.: Making rainfall features fun: scientific activities for teaching children
Figure 5. (a) Illustration of the pedagogical case of discrete multiplicative cascades. (b) Illustration of activity designed to mimic the specific
case of the β-model cascade.
al. (2014) for recent papers on cascade-based or geostatistics-
based approaches. However, it is a relevant concept, given the
importance of the rain/no rain intermittence. An illustration
of this is the number of zeros recorded in rainfall time se-
ries. For instance Hoang et al. (2012) reported typically about
96–98 % of zeros for a long (many years), high-resolution
(5 min) rain gauge time series over France. For practical rea-
sons, and due to the necessary implementation of the exper-
iment in classrooms, the activity was conducted at daily res-
olution, similar to Hubert and Carbonnel (1988) who ana-
lyzed a 45-year daily rainfall time series of Dédougou, Burk-
ina Faso.
A possible solution to model observed rainfall occurrences
patterns is to rely on a scale-invariant multiplicative cas-
cade framework (Lovejoy and Mandelbrot, 1985; Lovejoy
and Schertzer, 1990; Hubert, 1988; Schertzer and Lovejoy,
1985). Cascade models were initially developed to tackle at-
mospheric wind turbulence and explain how energy is trans-
ferred from scale to scale down to the dissipation scale. It was
later used for rainfall, assuming that the unknown equations
governing rainfall inherit the scale-invariant properties of the
Navier–Stokes equations (Hubert, 2001). They remain the
same after scale contraction, suggesting that similar struc-
ture will be visible at all scales. The cascade concept, for-
malized by Kolomogorov in 1941 and refined in 1962 (Kolo-
mogorov, 1941, 1962) was first hinted at by the so-called fa-
ther of weather prediction Richardson (1922) in a foot note:
Big whorls have little whorls that feed on their ve-
locity, and little whorls have smaller whorls and so
on to viscosity – in the molecular sense.
To illustrate these cascade models, let us introduce the
pedagogical discrete case, where scales are discretized (see
Fig. 5a for an illustration in 1-D). At the beginning we have
a structure with a given uniform level of intensity (typically
a rain rate). The goal is to distribute this intensity over the
domain (in time here). At each step of the cascade process,
a structure is divided into two substructures and the inten-
sity given to a substructure is the one of the parent structure
multiplied by a random multiplicative increment. Repeating
this process yields the desired variable field. A mathematical
presentation can be found in Appendix A.
3.2 Description of the experiment and discussion
3.2.1 Careful recording of rainy and dry days over a
period of 2 months
The first step of the experiment consists of recording rainy
days over a long period of time and plotting the data. Over
a 2-month period, the recording of rainy and dry days was
undertaken at the start of the day, during the teacher’s intro-
duction to the day’s schedule. If rainfall was noticed between
09:00 LT (local time) on the previous day and 09:00 LT that
morning, then it is considered as a rainy day. To determine
whether it had rained during the night the children checked
whether the ground was wet while coming to school. At the
time of the experiment, the children did not attend school
on Wednesdays, Saturdays, and Sundays, thus they alterna-
tively volunteered to be responsible for recording this infor-
mation on each of these days. If the teacher resides near to
the school, they can also record the observations during hol-
iday period (during which children obviously do not attend
school), otherwise it is simply considered as “missing data”.
A bar time series was used to graphically represent the data,
with each bar representing a day. The time series obtained
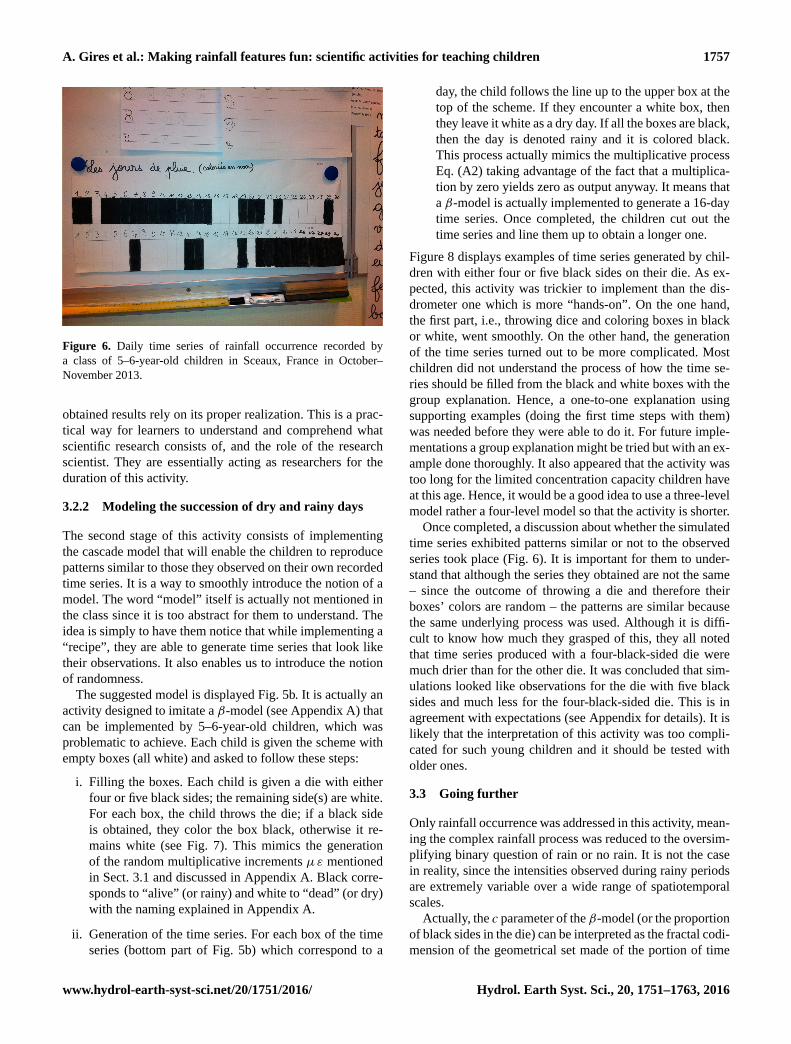
that year is displayed Fig. 6. Black bars correspond to rainy
days and white ones to dry days.
It is important to use this time to raise the children’s aware-
ness of the time and effort needed to collect and properly
record data over a long period. This is often difficult and not
really gratifying (or at least recognized) work. Yet it is essen-
tial to scientific research and the quality and robustness of the
Hydrol. Earth Syst. Sci., 20, 1751–1763, 2016 www.hydrol-earth-syst-sci.net/20/1751/2016/
A. Gires et al.: Making rainfall features fun: scientific activities for teaching children 1757
Figure 6. Daily time series of rainfall occurrence recorded by
a class of 5–6-year-old children in Sceaux, France in October–
November 2013.
obtained results rely on its proper realization. This is a prac-
tical way for learners to understand and comprehend what
scientific research consists of, and the role of the research
scientist. They are essentially acting as researchers for the
duration of this activity.
3.2.2 Modeling the succession of dry and rainy days
The second stage of this activity consists of implementing
the cascade model that will enable the children to reproduce
patterns similar to those they observed on their own recorded
time series. It is a way to smoothly introduce the notion of a
model. The word “model” itself is actually not mentioned in
the class since it is too abstract for them to understand. The
idea is simply to have them notice that while implementing a
“recipe”, they are able to generate time series that look like
their observations. It also enables us to introduce the notion
of randomness.
The suggested model is displayed Fig. 5b. It is actually an
activity designed to imitate a β-model (see Appendix A) that
can be implemented by 5–6-year-old children, which was
problematic to achieve. Each child is given the scheme with
empty boxes (all white) and asked to follow these steps:
i. Filling the boxes. Each child is given a die with either
four or five black sides; the remaining side(s) are white.
For each box, the child throws the die; if a black side
is obtained, they color the box black, otherwise it re-
mains white (see Fig. 7). This mimics the generation
of the random multiplicative increments µε mentioned
in Sect. 3.1 and discussed in Appendix A. Black corre-
sponds to “alive” (or rainy) and white to “dead” (or dry)
with the naming explained in Appendix A.
ii. Generation of the time series. For each box of the time
series (bottom part of Fig. 5b) which correspond to a
day, the child follows the line up to the upper box at the
top of the scheme. If they encounter a white box, then
they leave it white as a dry day. If all the boxes are black,
then the day is denoted rainy and it is colored black.
This process actually mimics the multiplicative process
Eq. (A2) taking advantage of the fact that a multiplica-
tion by zero yields zero as output anyway. It means that
a β-model is actually implemented to generate a 16-day
time series. Once completed, the children cut out the
time series and line them up to obtain a longer one.
Figure 8 displays examples of time series generated by chil-
dren with either four or five black sides on their die. As ex-
pected, this activity was trickier to implement than the dis-
drometer one which is more “hands-on”. On the one hand,
the first part, i.e., throwing dice and coloring boxes in black
or white, went smoothly. On the other hand, the generation
of the time series turned out to be more complicated. Most
children did not understand the process of how the time se-
ries should be filled from the black and white boxes with the
group explanation. Hence, a one-to-one explanation using
supporting examples (doing the first time steps with them)
was needed before they were able to do it. For future imple-
mentations a group explanation might be tried but with an ex-
ample done thoroughly. It also appeared that the activity was
too long for the limited concentration capacity children have
at this age. Hence, it would be a good idea to use a three-level
model rather a four-level model so that the activity is shorter.
Once completed, a discussion about whether the simulated
time series exhibited patterns similar or not to the observed
series took place (Fig. 6). It is important for them to under-
stand that although the series they obtained are not the same
– since the outcome of throwing a die and therefore their
boxes’ colors are random – the patterns are similar because
the same underlying process was used. Although it is diffi-
cult to know how much they grasped of this, they all noted
that time series produced with a four-black-sided die were
much drier than for the other die. It was concluded that sim-
ulations looked like observations for the die with five black
sides and much less for the four-black-sided die. This is in
agreement with expectations (see Appendix for details). It is
likely that the interpretation of this activity was too compli-
cated for such young children and it should be tested with
older ones.
3.3 Going further
Only rainfall occurrence was addressed in this activity, mean-
ing the complex rainfall process was reduced to the oversim-
plifying binary question of rain or no rain. It is not the case
in reality, since the intensities observed during rainy periods
are extremely variable over a wide range of spatiotemporal
scales.
Actually, the c parameter of the β-model (or the proportion
of black sides in the die) can be interpreted as the fractal codi-
mension of the geometrical set made of the portion of time
www.hydrol-earth-syst-sci.net/20/1751/2016/ Hydrol. Earth Syst. Sci., 20, 1751–1763, 2016

1758 A. Gires et al.: Making rainfall features fun: scientific activities for teaching children
Figure 7. Implementation of the activity mimicking the β-model in a class of 5–6-year-old children in Sceaux (January 2014).
Figure 8. Examples of daily time series generated by the children
with the β-model scheme.
where some rain was recorded. This notion characterizes in
a scale-invariant way the space occupied by a geometrical
set. It appears that this fractal codimension depends on the
threshold used for defining the occurrence or lack of rain-
fall. Indeed when increasing the threshold, the support gets
smaller and the fractal codimension increases (Lovejoy et al.,
1987; Hubert et al., 1995). It means that in order to character-
ize and model an actual rainfall time series, an infinity (one
per threshold) of fractal codimensions is needed. This is an
intuitive (not mathematically rigorous) way of understanding
multifractal fields, which is a framework enabling the anal-
ysis, modeling, and simulation of fields that are extremely
variable over a wide range of scales, such as rainfall.
These notions were not addressed with 5–6-year-old chil-
dren, who were too young to grasp them. However, if a
time series with amount is recorded with older children (us-
ing simple rain gauges), it is possible to introduce this. One
should plot the rainfall occurrence pattern in a bar time series
as done here, and repeat the exercise only with the day when
rainfall exceeded a given threshold. If the threshold is care-
fully chosen, the series generated with the die with five black
sides will be similar to the initial observations, whereas the
ones obtained with a die with four black sides will be similar
to the thresholded one.
4 Writing a scientific book on rainfall with and for
children aged 8–12 years
This activity involves writing a scientific book for children
aged 8–12 years, based on questions they raised themselves.
It was tested in a class with children aged 8–9 years in Sceaux
in October and November 2014. The book was published in
February 2015 (Gires, 2015).
The process leading to this book was designed by the ed-
itor of the “Minipomme” (Ed. Le Pommier) collection in
which it was published. It is split into three main successive
steps:
Hydrol. Earth Syst. Sci., 20, 1751–1763, 2016 www.hydrol-earth-syst-sci.net/20/1751/2016/

A. Gires et al.: Making rainfall features fun: scientific activities for teaching children 1759
i. A 1.5 h interactive session with the scientist and a class
of 8–9-year-old children. They were given the general
topic (in this case, rainfall) of the book a few hours
prior to the session and asked for any questions they
had about the topic. The topic of a book in this collec-
tion should be related to some aspects of the children’s
curriculum, meaning that they are not completely un-
aware of the topic. In the case of this book about rainfall,
they had recently studied the water cycle, and were al-
ready aware that water can exist in its three states (solid,
liquid, and gas) on Earth. This facilitated the discus-
sion. The session was designed as an interactive session,
meaning that it was more than a simple questions-and-
answers session. Indeed, the scientist did not directly
give the answers, but tried to encourage the children to
think about the process and suggest some answers them-
selves before providing a more precise explanation. To
illustrate this point, they were for example asked what
happens when a lot of droplets are in a cloud and move
randomly, and concluded themselves that if the droplets
are too numerous they start to collide and merge, which
slowly gives rise to drops that will ultimately fall. In
the explanation, the scientist also used a lot of images
to connect the new knowledge to existing knowledge or
common experiences. What happens when you empty
a bottle of water on impervious ground when it is hot
and sunny? The water evaporates. The example of the
cold bottle around which water condenses was again
used, and here all the children had already noticed that,
which was not the case for younger ones. To illustrate
how small droplets are maintained in the atmosphere be-
cause of the small-scale turbulent wind, the dust visible
in the air when a sun ray is entering through a window
was used. All children had already seen that effect.
Naturally some of the questions raised were surprising
and unexpected, in which case the scientist went on to
research the question in more detail before providing an
answer during the second session. The two most striking
examples in this specific case were “What is the taste
of rain?” and “Should I walk or run under the rain to
get less wet?”. The latter was especially fun, and after
a little research it turns out that almost ten papers based
on numerical or actual experiments can be found on this
topic in the scientific literature (see Bocci, 2012 for a
recent study with many references within). It appears
that, in general, one should run as fast as possible when
it is raining, but in some windy conditions or for certain
body shapes, there exists an optimal velocity.
ii. The book is then written by the scientist, with the aim
of answering (at least partially) all the questions raised
by children. It is made of two parts:
– First, a lively story, involving discussions between
a few characters, which contains most of the sci-
entific elements. The story should be more than a
simple dialogue; a genuine fiction should take place
so that children do not even notice they are learn-
ing and grasping new concepts. As pointed out by
Dahlstrom (2014) and Hut et al. (2016), using nar-
rative and storytelling can enhance the efficiency
of geoscience communication. The story developed
was based on the random and fortunate meeting
of two young children with a “rain explorer” who
takes them onboard her “drop’s vessel” for a jour-
ney into the clouds. The story is structured around
four main questions: (a) How do you measure rain-
fall?, (b) Does it rain the same everywhere and
all the time?, (c) How are droplets formed?, and
(d) What happens when drops fall? In addition there
are a few sidebars for additional details on difficult
topics or definitions of complex words.
– Second, a section that includes some components
for children as well as their parents (here, three top-
ics are addressed: rainfall radar measurement, light-
ning and thunderstorms, three states for water), and
some suggestions of experiments so that children
can put in practice the newly acquired knowledge
either at home or in classrooms. The experiments
consist of the design and testing of a flour disdrom-
eter (see Sect. 2), and the building of a simple rain
gauge out of a plastic bottle.
iii. A 1.5 h interactive feedback session: the draft of the
book was given to children for reading a few days before
a feedback session with the scientist was held. The main
point was to ask them if they had understood everything,
and whether they had some suggestions regarding to the
characters. They were happy with the characters and had
only minor suggestions for the content. For example the
explanation of a rainbow effect was rewritten. Actually,
they had more questions on the process of book cre-
ation (How many people worked on it? How long does
it take? How is it printed?), which the editor answered.
After this session, the scientist made some minor adjust-
ments to improve the book.
iv. Finally, the book was illustrated by a professional de-
signer, with a scientist providing precise schemes for
drawings involving scientific content.
The book is then made available to the public (bookshop,
internet). Typically 2000–3000 copies are sold in this collec-
tion over the life of the book. It has not yet been translated
to other languages. The authors did not receive very precise
feedback from the teacher apart from the fact that they were
satisfied with the experience. The two interactive sessions
were dynamic, which shows the interest of the children in
the activity.
www.hydrol-earth-syst-sci.net/20/1751/2016/ Hydrol. Earth Syst. Sci., 20, 1751–1763, 2016

1760 A. Gires et al.: Making rainfall features fun: scientific activities for teaching children
5 Conclusions
In this paper, we have presented various hands-on activities
for young children, designed to help them become familiar-
ized with some complex notions associated with rainfall in
a playful way. They designed a device whose main purpose
was to record drop size, implemented it, and observed the
variety of drop sizes. They also carefully recorded the suc-
cession of dry and rainy days over a period of 2 months be-
fore reproducing observed patterns with the help of a random
fractal cascade model. Finally, they helped to shape the con-
tent of a scientific book about rainfall. The goal of these ac-
tivities was not only for them to acquire knowledge on the
specific topic of rainfall but also to become familiarized with
science and the scientific approach; to become curious about
their surroundings, to develop a willingness to observe more
precisely their environment, to notice details, and ultimately
to begin asking questions.
The development of these activities highlighted the im-
portance of a genuine collaboration between scientists and
school teachers, which turns out to be necessary for a suc-
cessful implementation. The scientist brings the initial ideas
and the expert knowledge for accurate science, and makes
sure that simple explanations are not simplistic and biased
ones. The school teacher helps in adapting the language for
young children, and also in shaping the activity so that it fits
into the classroom habits so the children are comfortable with
it.
Finally, it should be mentioned that the activities done
with children aged 5–6 years were reported on the class blog
maintained by the teacher. This is a non-public blog acces-
sible only to the parents because it contains pictures of their
children while they are at school. Since the activities were
implemented in the class of the first author’s son, the pub-
lication triggered some unusual and pleasant discussions on
drop size distribution at the end of the schoolday. Indeed par-
ents were not aware of the variety of drop sizes and wanted to
learn more on this issue. Some of them actually tested the ex-
periment at home with their child. The first author used these
short discussions to make parents aware of the extreme vari-
ability of rainfall as well as the difficulty of properly measur-
ing it. This reflects nicely how an activity designed for young
children actually ends up with parents learning new things as
well.
Future work will involve the development of more activ-
ities on rainfall to ultimately create a whole activity kit on
this topic. It will also be necessary to set up an appropri-
ate protocol that enables a quantitative evaluation of the ac-
tivities, both in terms of knowledge on the specific topic of
rainfall and children’s engagement with science. This will re-
quire collaboration with pedagogical experts as well.
Hydrol. Earth Syst. Sci., 20, 1751–1763, 2016 www.hydrol-earth-syst-sci.net/20/1751/2016/

A. Gires et al.: Making rainfall features fun: scientific activities for teaching children 1761
Appendix A: The β cascade model
The purpose of this appendix is to provide the interested
reader with some mathematical details about cascade pro-
cesses and describe the simple β model. The process is illus-
trated in Fig. 5a. At the beginning the activity (ε0= 1) it is
uniform over a structure (a d-dimensional cube, d = 1 for the
time series studied here) of characteristic length L (λ= 1).
One step of the cascade process consists in breaking each
structure into smaller ones with a scale ratio λ1 (larger than
1 and usually equal to 2 although it is not mandatory). As
a consequence after n steps, there are λdn1 substructures of
characteristic length ln=Lλn1
. The resolution of the process,
which is the ratio between the outer scale (L) and the obser-
vation scale (ln), is then equal to λ= Lln= λn1 . The activity εn
(i.e., εn,i , with i= 1, . . . , λd ) given to a daughter structure
is equal to its parent’s one multiplied by a random variable
(µε): εn=µε εn−1. Building a cascade process basically re-
quires determining (i) how to divide each structure into sub-
structures and (ii) the probability distribution of the random
multiplicative increment. The key assumption is that these
two properties are the same at all scales. The probability dis-
tribution of the random increments should be chosen so that
〈µε〉= 1 to ensure ensemble conservation through scales.
Numerous models have been suggested in the literature
and only the simplest one will be discussed here since it
will be implemented within a classroom environment. It is
often called the β model (Frisch et al., 1978; Mandelbrot,
1974; Novikov and Stewart, 1964) and assumes that struc-
tures are either dead (inactive) or alive (active). In this model,
the multiplicative random increments µε only have two pos-
sible states, whose probabilities of occurrence are defined by
Pr(µε = λc1
)= λ−c1 (alive) (A1a)
Pr(µε = 0)= 1− λ−c1 (dead) (A1b)
where c is a parameter of the model. The words “dead” and
“alive” are the ones historically used in the literature for this
model, and they are kept here although more appropriate
ones would be “dry” and “rainy” in the context of this paper.
The value affected to the boost µε= λc1 ensures conservation
of the average activity ε (i.e., < µε >= 1⇔< εn >=<
ε0 > where <> denotes ensemble average). At each step of
the process the fraction of alive structures decreases by a fac-
tor β = λ−c1 , and their activity is increased by the factor 1/β
to ensure (average) conservation. After n steps of the process,
i.e., at a resolution λn= λn1 , the substructure activity (equal
to the product of the successive random increments)
εn = ε0
n∏i=1
(µε)i (A2)
exhibits two possible states, dead or alive, with the probabil-
ity of occurrence
Pr(εn = λ
cn
)= λ−cn (alive) (A3a)
Pr (εn = 0)= 1− λ−cn (dead). (A3b)
Such a model was, for instance, employed by Over and
Gupta (1996) or Schmitt et al. (1998) in a continuous ver-
sion to represent rainfall occurrence patterns.
For practical implementation in the children’s activity, we
typically have c ≈ 0.3 over the Paris area on scales ranging
from 1 to 16 days, which yields to a probability of an “alive”
random increment equal to λ−c1 ≈ 0.81. This value is actually
very similar to 5/6≈ 0.83 found with the five-black-sided die
used in the activity.
www.hydrol-earth-syst-sci.net/20/1751/2016/ Hydrol. Earth Syst. Sci., 20, 1751–1763, 2016

1762 A. Gires et al.: Making rainfall features fun: scientific activities for teaching children
Acknowledgements. A. Gires would like to thank his two sons,
Nathanaël and Nikita, for always volunteering to test new scientific
experiments and helping to improve them! The authors would like
to thank V. Rouelle and D. Bourdin for opening their class at the
Ecole des Clos Saint-Marcel in Sceaux, France to scientific experi-
ments and fruitful discussions that helped improve the activities.
The authors from Ecole des Ponts ParisTech greatly acknowledge
partial financial support form the Chair “Hydrology for Resilient
Cities” (endowed by Veolia) of Ecole des Ponts ParisTech and
EU NEW-INTERREG IV RainGain Project (www.raingain.eu).
The authors would like to thank Tim Raupach for his help in
proofreading the final version of the paper.
Edited by: S. Illingworth
References
Alrutz, M.: Granting science a dramatic licence: exploring a
4th grade science classroom and the possibilities for integrating
drama, Teach. Artist J., 2, 31–39, 2004.
Bennett, J. and Hogarth, S.: Would you want to talk to a scientist at
a party? High school students’ attitudes to school science and to
science, Int. J. Sci. Educ., 31, 1975–1998, 2009.
Bocci, F.: Whether or not to run in the rain, Eur. J. Phys., 33, 1321–
1332, 2012.
Broemmel, A. D. and Rearden, K. T.: Should teachers use the teach-
ers’ choice books in science classes?, Reading Teach., 60, 254–
265, doi:10.1598/RT.60.3.5, 2006.
Buncick, M. C., Betts, P. G., and Horgan, D. D.: Using demonstra-
tions as a contextual road map: enhancing course continuity and
promoting active engagement in introductory college physics,
Int. J. Sci. Educ., 23, 1237–1255, 2001.
Castle, K. and Needham, J.; First graders’ understanding of mea-
surement, Early Childhood Educ. J., 35, 215–221, 2007.
Cleaves, A.: The formation of science choices in secondary school,
Int. J. Sci. Educ., 27, 471–86, 2005.
Coskie, T. L.: The synergy of science and reading, Sci. Child., 44,
62–63, 2006.
Dahlstrom, M. F.: Using narratives and storytelling to communicate
science with nonexpert audiences, P. Natl. Acad. Sci. USA, 111,
13614–13620, doi:10.1073/pnas.1320645111, 2014.
Dorion, C.: Science through drama: a multiple case exploration
of the characteristics of drama activities in secondary science
lessons, Med Thesis University of Cambridge, Cambridge, 2007.
Dorion, K. R.: Science through drama: a multiple case exploration
of the characteristics of drama activities used in secondary sci-
ence lessons, Int. J. Sci. Educ., 31, 2247–2270, 2009.
Ellington, H. I., Addinall, E., and Percival, F.: Games and Simula-
tions in Science Education, Kogan Page, London, UK, 1981.
Ford, D. J.: Representations of science within children’s trade
books, J. Res. Sci. Teach., 43, 214–235, 2006.
Frisch, U., Sulem, P. L., and Nelkin, M.: Simple dynamical model
of intermittent fully developed turbulence, J. Fluid Mech., 87,
719–736, 1978.
Gires, A. and Bonté, T. (Illustration): La pluie, Collection
“Minipommes”, Edition le Pommier, Paris, France, p. 64, 2015.
Gires, A., Tchiguirinskaia, I., Schertzer, D., and Lovejoy, S.: De-
velopment and analysis of a simple model to represent the zero
rainfall in a universal multifractal framework, Nonlin. Processes
Geophys., 20, 343–356, doi:10.5194/npg-20-343-2013, 2013.
Gires, A., Tchiguirinskaia, I., Schertzer, D., and Berne, A.: 2DVD
data revisited: multifractal insights into cuts of the spatio-
temporal rainfall process, J. Hydrometeorol., 16, 548–562,
doi:10.1175/JHM-D-14-0127.1, 2015.
Harvard-Project-Zero: The arts and academic improvement: what
the evidence shows, Translat. Theory Pract., 10, 1–3, 2001.
Hoang, C. T., Tchiguirinskaia, I., Schertzer, D., Arnaud, P., Lavabre,
J., and Lovejoy, S.: Assessing the high frequency quality of long
rainfall series, J. Hydrol., 438–439, 39–51, 2012.
Hubert, P.: Multifractals as a tool to overcome scale problems in
hydrology, Hydrolog. Sci. J., 46, 897–905, 2001.
Hubert, P. and Carbonnel, J. P.: Caractérisation fractale de la vari-
abilité et de l’anisotropie des précipitations tropicales, C. R.
Acad. Sci. Paris, 2, 909–914, 1988.
Hubert, P., Friggit F., and Carbonnel, J. P.: Multifractal structure of
rainfall occurrence in west Africa, in: New Uncertainty Concepts
in Hydrology and Water Resources, edited by: Kundzewicz, Z.
W., Cambridge University Press, Cambridge, 109–113, 1995.
Hut, R. W., Land-Zandstra, A. M., Smeets, I., and Stoof, C.: Geo-
science on television: a review of science communication litera-
ture in the context of geosciences, Hydrol. Earth Syst. Sci. Dis-
cuss., doi:10.5194/hess-2015-518, in review, 2016.
Kolmogorov, A. N.: The local structure of turbulence in incom-
pressible viscous fluid for very large Reynolds numbers, Pro-
ceedings of the USSR Academy of Sciences, 30, 299–303, 1941
(in Russian).
Kolmogorov, A. N.: A refinement of previous hypotheses con-
cerning the local structure of turbulence in viscous incompress-
ible fluid at high Reynolds number, J. Fluid. Mech., 13, 82–85,
doi:10.1017/S0022112062000518, 1962.
Koren, P. and Bar, V.: Multi-cultural study on how female pre-
service student teachers perceive science and scientists, Theory
Pract. Curric. Plan., 19, 259–299, 2009.
Kruger, A. and Krajewski, W. F.: Two-Dimensional Video Disdrom-
eter: A Description, J. Atmos. Ocean. Tech., 19, 602–617, 2002.
Lovejoy, S. and Mandelbrot, B.: Fractal properties of rain and a
fractal model, Tellus A, 37, 209–232, 1985.
Lovejoy, S. and Schertzer, D.: Fractals, raindrops and resolution de-
pendence of rain measurements, J. Appl. Meteorol., 29, 1167–
1170, 1990.
Lovejoy, S., Schertzer, D., and Tsonis, A. A.: Function box-
counting and multiple elliptical dimension in rain, Science, 235,
1036–1038, 1987.
Lyons, T.: Different countries, same science classes: students’ ex-
periences of school science in their own words, Int. J. Sci. Educ.,
28, 591–613, 2006.
Maltese, A. V. and Tai, R. H.: Eyeballs in the fridge: sources of early
interest in science, Int. J. Sci. Educ., 32, 669–685, 2010.
Mandelbrot, B.: Intermittent turbulence in self-similar cascades: di-
vergence of high moments and dimension of the carrier, J. Fluid
Mech., 62, 331–358, 1974.
Marshall, J. S. and Palmer, W. M.: The distribution of raindrops
with size, J. Meteorol., 5, 165–166, 1948.
Mazon, J. and Viñas, M.: A low-cost experiment for de-
termining raindrop size distribution, Weather, 68, 49–52,
doi:10.1002/wea.2064, 2013.
Hydrol. Earth Syst. Sci., 20, 1751–1763, 2016 www.hydrol-earth-syst-sci.net/20/1751/2016/

A. Gires et al.: Making rainfall features fun: scientific activities for teaching children 1763
Monhardt, L. and Monhardt, R.: Creating a context for the learning
of science process skills through picture books, Early Childhood
Educ. J., 34, 67–71, 2006.
Muller, C. L., Roberts, S., Wilson, R. C., Remedios, J. J.,
Illingsworth, S., Graves, R., Trent, T., Henderson, J., Wilkin-
son, J., Wilkinson, M., and Desai, A.: The Blue Marble: a model
for primary school STEM outreach, Phys. Educ., 48, 176–183,
doi:10.1088/0031-9120/48/2/176, 2013.
Novikov, E. A. and Stewart, R.: Intermittency of turbulence ans
spectrum of fluctuations in energy dissipation, Izv. Akad. Nauk.
SSSR Ser. Geofiz, 3, 408–412, 1964.
Odegaard, M.: Dramatic science: a critical review of drama in sci-
ence education, Stud. Sci. Educ., 39, 75–102, 2003.
Osborne, J., Simon, S., and Collins, S.: Attitudes towards science: a
review of the literature and its implications, Int. J. Sci. Educ., 25,
1049–1079, 2003.
Over, T. M. and Gupta, V. K.: A space-time theory of mesoscale
rainfall using random cascades, J. Geophys. Res.-Atmos., 101,
26319–26331, 1996.
Pringle, R. M. and Lamme, L. L.: Using picture storybooks to sup-
port young children’s science learning, Reading Horizons, 46, 2,
2005.
Richardson, L. F.: Weather Prediction by Numerical Process, Cam-
bridge University Press, Cambridge, UK, 1992.
Royal Society: Taking a Leading Role: A Good Practice Guide,
Royal Society, London, https://royalsociety.org/~/media/Royal_
Society_Content/Education/2011-06-07-Taking_a_leading_
role_guide.pdf (last access: 13 January 2014), 2004.
Sackes, M., Trundle, K. B., and Flevares, L. M.: Using children’s
literature to teach standard-based science concepts in early years,
Early Childhood Educ. J., 36, 415–422, 2009.
SATIS: The Limestone Inquiry, Association for Science Education,
Hatfield, 1986.
Schertzer, D. and Lovejoy, S.: Generalized scale-invariance in tur-
bulent phenomena, Physicochem. Hydrodynam., 6, 623–635,
1985.
Schleiss, M., Chamoun, S., and Berne, A.: Stochastic simulation of
intermittent rainfall using the concept of “dry drift”, Water Re-
sour. Res., 50, 2329–2349, doi:10.1002/2013WR014641, 2014.
Schmitt, F., Vannitsem, S., and Barbosa, A.: Modeling of rainfall
time series using two-state renewal processes and multifractals,
J. Geophys. Res.-Atmos., 103, 23181–23193, 1998.
Simpson, R., Koballa Jr., T., Oliver, J., and Crawley, F.: Research
on the affective dimension of science learning Handbook of Re-
search on Science Teaching and Learning, edited by: Gabel, D.,
Macmillan, New York, 211–234, 1994.
Sjøberg, S. and Schreiner, C.: Update on the ROSE project: students
perceptions of science and technology, IOSTE Newsletter, 8, 7–
10, 2005.
Sloman, K. and Thompson, R.: An example of large-group drama
and cross-year peer assessment for teaching science in higher ed-
ucation, Int. J. Sci. Educ., 32, 1877–1893, 2010.
Som, S., Catling, D., Harnmeijer, J., Polivka, P., and Buick, R.: Air
density 2.7 billion years ago limited to less than twice mod-
ern levels by fossil raindrop imprints, Nature, 484, 359–362,
doi:10.1038/nature10890, 2012.
Stefansson, K. K.: ’I just don’t think it’s me’: a study on the will-
ingness of Icelandic learners to engage in science related issues,
Master’s Thesis Faculty of Education, Department of Teacher
Education and School Development, University of Oslo, Oslo,
Norway, 2006.
Tai, R. T., Liu, C. Q., Maltese, A. V., and Fan, X. T.: Plan-
ning early for careers in science, Science, 312, 1143–1144,
doi:10.1126/science.1128690, 2006.
Tobias, S. and Hake, R. R.: Professors as physics students: What
can they teach us?, Am. J. Phys., 56, 786–94, 1988.
Wagner, B. J.: Educational Drama and Language Arts: What Re-
search Shows, Heinemann, Chicago, USA, 1998.
Zeece, P. D.: Things of nature the nature of the things: Natu-
ral science-based literature for young children, Early Childhood
Educ. J., 26, 161–166, doi:10.1023/A:1022929401934, 1999.
www.hydrol-earth-syst-sci.net/20/1751/2016/ Hydrol. Earth Syst. Sci., 20, 1751–1763, 2016