making economic corridors work for the agricultural · pdf filemaking economic corridors work...
TRANSCRIPT

ISSN 2304-5191
Agribusinessand Food Industries
Series
Making economic corridors workfor the agricultural sector
4

4
FOOD AND AGRICULTURE ORGANIZATION OF THE UNITED NATIONSRome, 2014
Agribusiness and Food Industries Series
byEva Gálvez Nogales
Making economic corridors work for the agricultural sector

Recommended citationGálvez Nogales, E. 2014. Making economic corridors work for the agricultural sector. Agribusiness and Food Industries Series No. 4. FAO, Rome.
Cover photograph©FAO/Vasily Maksimov
The designations employed and the presentation of material in this information product do not imply the expression of any opinion whatsoever on the part of the Food and Agriculture Organization of the United Nations (FAO) concerning the legal or development status of any country, territory, city or area or of its authorities, or concerning the delimitation of its frontiers or boundaries. The mention of specific companies or products of manufacturers, whether or not these have been patented, does not imply that these have been endorsed or recommended by FAO in preference to others of a similar nature that are not mentioned.
The views expressed in this information product are those of the author(s) and do not necessarily reflect the views or policies of FAO.
ISBN 978-92-5-108636-0
© FAO, 2014
FAO encourages the use, reproduction and dissemination of material in this information product. Except where otherwise indicated, material may be copied, downloaded and printed for private study, research and teaching purposes, or for use in non-commercial products or services, provided that appropriate acknowledgement of FAO as the source and copyright holder is given and that FAO’s endorsement of users’ views, products or services is not implied in any way.
All requests for translation and adaptation rights, and for resale and other commercial use rights should be made via www.fao.org/contact-us/licence-request or addressed to [email protected].
FAO information products are available on the FAO website (www.fao.org/publications) and can be purchased through [email protected].
I4204E disclaimer.indd 1 12/11/14 15:06

iii
Contents
PREFACE viii
ACkNOwLEDGEMENTS x
ExECUTIVE SUMMARy xi
AbSTRACT xiii
AbOUT THE AUTHOR xiv
ACRONyMS xv
CHAPTER 1 Introduction 1
1.1 background and scope 11.2 Objective of the study 21.3 Methodology 21.4 Structure of the study 3
CHAPTER 2 Framing the discussion: concepts, theoretical foundations and application to agriculture 5
2.1 Spatial development initiatives 52.2 Definition of economic corridors and related concepts 82.3 Types of economic corridors 112.4 Theoretical foundations of economic corridors 132.5 Corridors and other territorial-based approaches for accelerating
agribusiness growth and attracting investment in developing country agriculture 18
CHAPTER 3 Overview of the corridor profiles 25
3.1 Introduction to the mapping and selection exercise of economic corridor initiatives in developing countries 25
3.2 African corridors and their policy background 263.3 Latin american corridors and their policy background 293.4 Asian corridors and their policy background 333.5 Summary of economic corridors selected 353.6 Framework proposed for the analysis of economic corridors 37

iv
CHAPTER 4 Introduction to the corridor cases 39
4.1 Corridor cases at a glance 394.2 Timeline of the corridors studied 48
CHAPTER 5 Effective direction 55
5.1 Corridor leadership and alignment of stakeholders’ visions and goals 55
5.2 Corridor strategy and targeting modalities 565.3 Processes and tools for planning and launching
corridor programmes 68
CHAPTER 6 Delivery at scale: budget and modalities of interventions 75
6.1 budget and sources of funding 756.2 Modalities of interventions 806.3 Laying the corridor basis: infrastructure development 836.4 Components geared towards widening national corridors 956.5 Corridor components dealing with regional integration:
from national to regional corridors 1106.6 Specialization in value chains and market orientation 116
CHAPTER 7 Delivery at scale: corridor governance 125
7.1 Corridor leadership and alignment of stakeholders’ visions and goals 125
7.2 Engagement models 1317.3 Institutional arrangements and delivery mechanisms 134
CHAPTER 8 Gains and pitfalls of agrocorridor initiatives 145
8.1 Potential gains of agrocorridors for economic growth, trade and connectivity 145
8.2 Pitfalls to avoid 153
CHAPTER 9 Guidance for making economic corridors workfor the agricultural sector 161
9.1 best practices in economic corridor design and implementation 1619.2 Checklist to guide the design and implementation
of an (agro-)economic corridor 167
CHAPTER 10 Conclusions 177
10.1 General conclusions 17710.2 Looking forward: implications and suggestions for future studies 180

v
ANNEx 1 Glossary 181
ANNEx 2 Economic corridors identified 187
Bibliography 191
bOxES1. Spatial planning and spatial development initiatives 62. Definition of corridors 83. Attributes of spatial development 144. Definition of economies of scale and scope, and agglomeration forces 165. Metatrends shaping the agricultural sector 206. Evolution of the PRA corridors: a moving target 507. Vision alignment among corridor stakeholders in the bAGC
and SAGCOT 578. The development of a corridor strategy: the case of the PRA Project 619. Rationale behind the design of the corridor programme pillars 66
10. The GMS Strategic Framework 2012–2022 6911. How bAGCI and SAGCOT approach infrastructure development 8512. The infrastructure component of the PRA Project 9113. Examples of last-mile infrastructure development
in economic corridors 9614. Corridor centres 9915. Corridor financial facilities 10016. Clustering in SAGCOT 10417. Engaging the private sector in regional corridor programmes:
the case of GMS 11218. Corridor specialization in agricultural value chains 11719. Coordination problems between central and decentralized
public authorities 12920. Institutional arrangements and delivery mechanisms
of the GMS corridor programme 13521. Institutional arrangements and delivery mechanisms
of the PRA Project 13922. bAGCI’s institutional arrangements and delivery mechanisms 141
FIGURES1. Potential development path for corridors 92. IIRSA integration corridors or hubs 323. A framework for economic corridors 374. The three GMS corridors 425. Corridors of the CAREC programme 43

vi
6. Economic corridors currently supported by the PRA Project 457. The beira Agricultural Growth Corridor 468. SAGCOT map 479. Indonesia economic corridors 48
10. Timeline of the selected corridor programmes 4911. Phases of the CAREC programme 4912. PRA project timeline 5213. Timelines of bAGCI and SAGCOT 5314. Timeline of the Greater Mekong Subregion programme 5415. First- and second-tier system of the CAREC programme 6416. Pillars of the CAREC programme 6617. Components of the beira Corridor programme 6718. Making economic corridors broader and regionally integrated 8219. Example of a narrow, regional corridor (Zone III) 8320. Insertion of SEZs in Indonesian corridors 8921. Degrees of IFI/donor support for developing corridor infrastructure 9022. Soft interventions to promote agricultural growth along
an economic corridor 9823. Tools to support brown and greenfield agribusiness
developments in bAGC 9924. Support to entrepreneurs provided by the beira Catalytic Fund 10025. Ihemi: example of an agricultural cluster in the SAGCOT corridor 10526. Examples of corridor soft-side interventions aiming
to promote regional integration 11627. Nucleus farm hub, outgrower model and smallholder block farming 13328. GMS programme institutional structure 13529. bAGCI institutional framework 14130. Employment opportunities generated by SAGCOT 148
TAbLES1. Main features of the most prominent types of SDI 72. Types of economic corridors 113. Estimated world inward FDI stock by sector and region
in million US$, annual 214. Corridors identified in Africa 265. Policy and institutional framework informing the development
of African corridors 276. Corridors identified in Latin America and the Caribbean 307. Policy and institutional framework informing the development
of LAC corridors 318. Economic corridors identified in Asia 339. Policy and institutional framework informing
the development of Asian corridors 3410. Summary of corridor profiles 36
vii
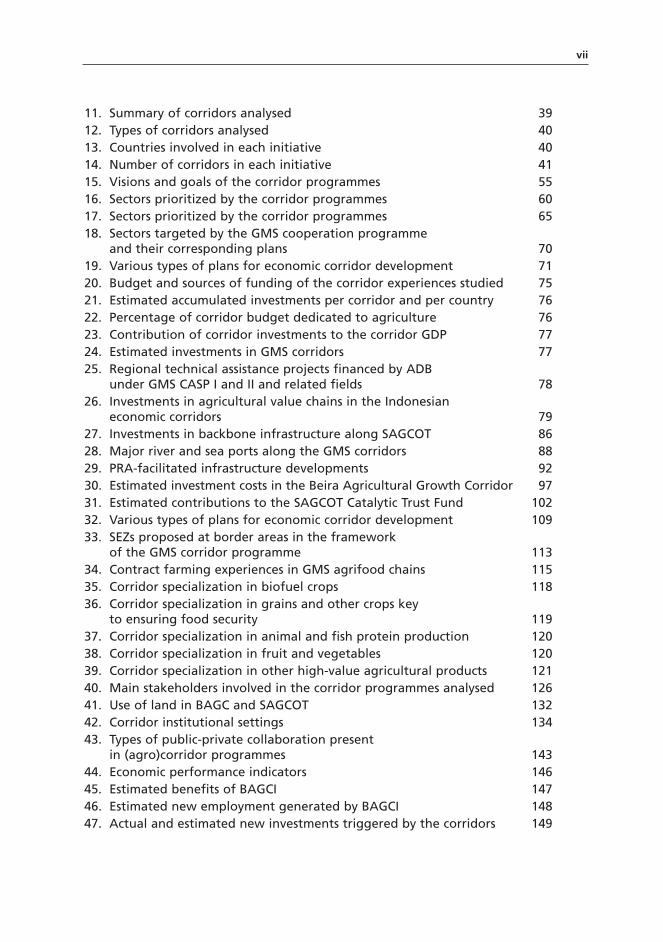
11. Summary of corridors analysed 3912. Types of corridors analysed 4013. Countries involved in each initiative 4014. Number of corridors in each initiative 4115. Visions and goals of the corridor programmes 5516. Sectors prioritized by the corridor programmes 6017. Sectors prioritized by the corridor programmes 6518. Sectors targeted by the GMS cooperation programme
and their corresponding plans 7019. Various types of plans for economic corridor development 7120. budget and sources of funding of the corridor experiences studied 7521. Estimated accumulated investments per corridor and per country 7622. Percentage of corridor budget dedicated to agriculture 7623. Contribution of corridor investments to the corridor GDP 7724. Estimated investments in GMS corridors 7725. Regional technical assistance projects financed by ADb
under GMS CASP I and II and related fields 7826. Investments in agricultural value chains in the Indonesian
economic corridors 7927. Investments in backbone infrastructure along SAGCOT 8628. Major river and sea ports along the GMS corridors 8829. PRA-facilitated infrastructure developments 9230. Estimated investment costs in the beira Agricultural Growth Corridor 9731. Estimated contributions to the SAGCOT Catalytic Trust Fund 10232. Various types of plans for economic corridor development 10933. SEZs proposed at border areas in the framework
of the GMS corridor programme 11334. Contract farming experiences in GMS agrifood chains 11535. Corridor specialization in biofuel crops 11836. Corridor specialization in grains and other crops key
to ensuring food security 11937. Corridor specialization in animal and fish protein production 12038. Corridor specialization in fruit and vegetables 12039. Corridor specialization in other high-value agricultural products 12140. Main stakeholders involved in the corridor programmes analysed 12641. Use of land in bAGC and SAGCOT 13242. Corridor institutional settings 13443. Types of public-private collaboration present
in (agro)corridor programmes 14344. Economic performance indicators 14645. Estimated benefits of bAGCI 14746. Estimated new employment generated by bAGCI 14847. Actual and estimated new investments triggered by the corridors 149
viii
Preface
Several years ago, I had the privilege of working in a groundbreaking economic corridor project in Peru. The innovativeness and high performance of this initiative enabled me to discover how spatial planning and agribusiness development policies and programmes could come together for the benefit of farmers, agribusinesses and communities.
In recent years, the number of national, regional and international discussions, events and initiatives exploring this approach has risen notably. In particular, this concept has gained traction as a tool to promote inclusive agribusiness development in low- and middle-income countries. However, documented information and reli-able data on agricultural growth corridors or economic corridors that prioritize agribusiness development are hard to come by. Even when available, relatively little analytical effort has been devoted to unpacking the various dimensions of agrocor-ridor programmes, both the good practices as well as the common mishaps and mistakes to avoid. I hope that the present report will contribute to addressing this situation by providing developing country policy-makers and practitioners with a series of evidence-based, practical tools for the design and successful implementa-tion of agrocorridors.
The report presents the basic concepts and theoretical foundations behind cor-ridors. It defines an economic corridor as a conceptual and programmatic model to structure socio-economic responses to develop a territory, building on a linear agglomeration of population and economic activities along existing transportation infrastructure. Precisely, the defining feature of economic corridors is that they integrate investments in infrastructure, policy and regulatory frameworks, and institutional strengthening and capacity building. By focusing the provision of pub-lic goods on high-density economic nodes with a dynamic business environment (corridors) and on priority sectors (e.g. agribusiness), corridor developers seek to maximize economic growth.
The study focuses on six cases of economic corridors mapped out in the develop-ing world, selected according to several criteria, such as the existence of an agricul-tural component, a minimum budget allocation, and diversity of approaches, lead conveners and stakeholders. The chosen corridor initiatives take place in Central Asia, the Greater Mekong subregion, Indonesia, Mozambique, Peru and the United Republic of Tanzania. These corridor experiences have been benchmarked using a tailored analytical framework that appraises the comparative advantage of each corridor, level of connectivity and infrastructure development, characteristics of agribusiness and farmers involved, as well as policy and institutional development interventions deployed to develop opportunities for selected agribusiness actors and agrifood chains. Furthermore, specific processes and tools used for planning and implementing agrocorridor programmes, governance and sustainability issues, and impacts on local, national and regional development have been examined.

ix
The report shows how corridors help improve physical connectivity and func-tioning of markets, while generating economies of scale in agriculture and other priority sectors. Based on the findings of the study, I have compiled two guidance tools: the first is a checklist for designing and implementing agrocorridor policies and programmes, while the second sheds light on good practices and common pit-falls in agrocorridor development. I sincerely hope that policy-makers, practitioners and territorial planners will find these tools useful to foster agribusiness competi-tiveness in their respective localities, countries and regional groups.
Eva Gálvez Nogales

x
Acknowledgements
This book benefited greatly from the contributions of many individuals, and particularly my former colleagues from the PRA Project in Peru from whom I learned many valuable lessons on the potential of economic corridors for agri-business development. I would like to express my deepest gratitude to Dr Javier García-Verdugo Sales (UNED) for his excellent guidance and practical suggestions. Thanks are extended to FAO colleagues who reviewed earlier drafts or contributed insights and definitions. Finally, I wish to thank Larissa D’Aquilio for coordinating the publication production process, Roberta Mitchell for the copy editing, Monica Umena for the layout, Simone Morini and Lynette Chalk for quality control and proof-reading.

xi
Executive summary
In times of economic crisis, development models that help create jobs, generate wealth, mobilize public and private resources and stimulate key economic sectors sustainably are more important than ever. While there are no universal solutions, a development tool that seems to be gaining ground is the so-called “economic cor-ridor”. This could be defined as a conceptual and programmatic model to structure socio-economic responses to develop a territory, building on a linear agglomeration of population and economic activities along existing transportation infrastructure (adapted from Healey, 2004).
Many high-income countries and regions have placed corridors at the centre of their economic and territorial development strategies. Similarly, over a decade ago many of the most dynamic emerging and developing countries started using this approach. Various international financial institutions are also employing corridors as the core strategy for supporting regional integration processes in the Southern Hemisphere. Likewise, private firms (either local or multinational) are increasingly participating in corridors, together with their public sector counterparts.
Five factors may be behind the expansion of the corridor phenomenon. First, a corridor is a “smart” tool for integrated territorial planning that combines inter-ventions in infrastructure (and related services) with specific actions to boost key sectors. Second, economic corridor programmes encompass a set of coordinated actions that ensure a critical mass of investments with the ability to transform the territory. Third, corridors are intrinsically conducive to generating multistakeholder strategic alliances for development, with the participation of local and central public authorities, private actors and donors, among others. The fourth factor is the symbi-otic relationship between corridors and regional trading blocs, which often go hand in hand. According to Ernst and Young (2011a), combining corridors and regional trading blocs helps to deepen conventional country-based macro-analysis, in a way that enriches strategic thinking about how to spur inclusive and sustainable growth in the developing world. The last factor is that through years of trial and error, best design and implementation practices have been identified, contributing to improv-ing the performance of new and ongoing corridor interventions.
This study tries to shed some light on economic corridors in developing and emerging countries. In their part of the world, the agricultural and agro-industrial sectors are among the main employment generators and contributors to gross domestic product (GDP). Naturally, many corridor initiatives in developing coun-tries target the agricultural sector, which is why the study focuses on the potential role of economic corridors as an engine of agricultural growth.
The report appraises economic corridor experiences with a strong agricultural component in Central Asia, the Greater Mekong Subregion, Indonesia, Mozam-bique, Peru and the United Republic of Tanzania. It also documents the evolution of corridor interventions from purely transport sector-based initiatives, to logis-

xii
tics and trade corridors, and finally to economic corridors with a multisectoral approach. It corroborates that agriculture has become a key part of economic cor-ridor programmes, especially in the Southern Hemisphere.
The comparative analysis undertaken here seeks to establish a corridor typol-ogy, and to identify the main drivers and components. It also describes corridor budgets and sources of funding, stakeholders, and management and governance1 mechanisms. A large part of this cross-comparison focuses on the agricultural com-ponent of corridor interventions, identifying the most recurrent activities under this component, the financial resources involved, the most often selected subsectors or value chains2 and target markets (domestic and international), the interface between infrastructure and agro-industrial development and the positive or negative impacts of corridor interventions on the agricultural sector.
Finally, the author proposes a checklist of necessary measures or elements that those interested in developing agrocorridors can use as a reference for deciding what activities to pursue, what organizational models are most suitable and clarify the steps that need to be taken.
1 See Glossary.2 See Glossary.

xiii
Abstract
Developing countries are increasingly using agrocorridors to develop their agricultural sectors. These corridors promote inclusive agribusiness growth, building on a linear agglomeration of people and activities along existing transportation infrastructure.
Based on initiatives in Central Asia, the Greater Mekong Subregion, Indonesia, Mozambique, Peru and the United Republic of Tanzania, this report shows how agrocorridors help improve physical connectivity and functioning of markets, while generating economies of scale in agriculture. Agrocorridors do this because they integrate public and private investments in “hardware” (transport and agribusi-ness infrastructure), “software” (policy and regulatory framework) and “orgware” (institutional strengthening and capacity building).
The goal of the book is to provide policy-makers and practitioners with a series of evidence-based, practical instruments (a checklist and a good practices tool) to guide the design and implementation of agrocorridors.

xiv
About the author
Ms Gálvez Nogales holds two bachelor degrees in Economics and Business Admin-istration from the University of Deusto, Bilbao, and a Ph.D. in Applied Economics.
Following several work assignments in Spain and Peru, she joined the Food and Agriculture Organization of the United Nations (FAO) in 2003, where she serves as a Marketing and Agribusiness Economist.

xv
Acronyms
ABAD Azerbaijan Business Assistance and Development
ACMECS Ayeyawady-Chao Phraya-Mekong Economic Cooperation Strategy
ADB Asian Development Bank
AEC ASEAN Economic Community
AfDB African Development Bank
AFTA ASEAN Free Trade Area
AGRA Alliance for a Green Revolution in Africa
AITF Afghanistan Infrastructure Trust Fund
ASEAN Association of Southeast Asian Nations
AU African Union
AUC African Union Commission
BAGC Beira Agricultural Growth Corridor
BAGCI BAGC Initiative
BCF Beira Catalytic Fund
BDS Business development services
CAADP Comprehensive Africa Agriculture Development Programme
CAAP Central American Agricultural Policy
CAC Central American Agricultural Council
CAIS Central American Integration System
CAN Andean Community
CAREC Central Asia Regional Economic Cooperation
CARICOM Caribbean Community and Caribbean Common Market
CASP Core Agriculture Support Programme (GMS)
CBTA Cross-Border Transport Agreement (GMS)
CEPAGRI Centro de Promoção da Agricultura, Ministry of Agriculture of Mozambique
CEP-BCI Core Environment Programme and Biodiversity Conservation Corridors Initiative (GMS)
CES COMESA-EAC-SADC Tripartite Agreement
CF Catalytic Fund

xvi
CGIAR Consultative Group on International Agricultural Research
CGSGI Clinton Giustra Sustainable Growth Initiative
CIRAD Centre de Coopération Internationale en Recherche Agronomique pour le Développement, International Cooperation of Agricultural Research for Development
CO2 Carbon dioxide
COMESA Common Market for Eastern and Southern Africa
CONFIEP National Confederation of Private Business Institutions, Peru
CSR Corporate social responsibility
CTF Catalytic Trust Fund
DANIDA Danish International Development Agency
DBSA Development Bank of Southern Africa
DFID Department for International Development, United Kingdom
DRC Democratic Republic of the Congo
EAC East African Community
EAIC East Asia Industrial Corridor
EBRD European Bank for Reconstruction and Development
ECF GMS Economic Corridors Forum
EIB European Investment Bank
ESC Economic Service Centre
EU European Union
EurAsEC Eurasian Economic Community
EWEC East-West Economic Corridor
FBT Fernando Belaúnde Terry (highway), Peru
FDI Foreign direct investment
FRETA GMS Freight Transport Association
FSC Forest Stewardship Council
FTA Free Trade Agreement
GDA Global Development Alliance (USAID)
GDP Gross domestic product
GHG Greenhouse gas (emission)
GILA Greater Ibadan Lagos Accra (Corridor)
GMS Greater Mekong Subregion
GoI Government of Indonesia
GoM Government of Mozambique
GoP Government of Peru

xvii
GoT Government of the United Republic of Tanzania
GPS Global positioning system
Ha Hectare
IaDB Inter-American Development Bank
IDB Islamic Development Bank
IFAD International Fund for Agricultural Development
IFC International Finance Corporation
IFI International financial institution
IIRSA Initiative for the Integration of Regional Infrastructure in South America
IMF International Monetary Fund
IOM International Organization for Migration
IPA Investment promotion agency
ISC Infrastructure service company
ISPM Instituto Superior Politécnico de Manica
JICA Japan International Cooperation Agency
LAC Latin America and the Caribbean
Lao PDR Lao People’s Democratic Republic
LED Local economic development
M&E Monitoring and evaluation (system)
MCC Millennium Challenge Corporation
MEDI Micro Enterprise Development Initiative
MERCOSUR Southern Common Market/Mercado Común del Sur
MOU Memorandum of Understanding
MP3EI Masterplan for Acceleration and Expansion of Indonesia’s Economic Development
NDF Nordic Development Fund
NEPAD New Partnership for Africa’s Development (Programme of the AU)
NGO Non-governmental Organization
NSEC North-South Economic Corridor
OECD Organisation for Economic Co-operation and Development
OFID Organization of the Petroleum Exporting Countries (OPEC) Fund for International Development
PEDSA Plano Estratégico para o Desenvolvimento do Sector Agrário
PERSUAP Pesticide Evaluation Report and Safe Use Action Plan
xviii
PIDA Programme for Infrastructure Development in Africa
PMO Prime Minister’s Office (United Republic of Tanzania)
PPP Public-private partnership
PRA Poverty Reduction and Alleviation (Project), Peru
PRAI Principles for Responsible Agricultural Investment
R&D Research and development
REDD Reducing Emissions from Deforestation and Forest Degradation (programme)
RETA Regional technical assistance
SAARC South Asian Association for Regional Cooperation
SAC Southern Agricultural Council
SADC Southern African Development Community
SAGCOT Southern Agricultural Growth Corridor of the United Republic of Tanzania
SDI Spatial Development Initiative
SEARCA Southeast Asian Regional Center for Graduate Study and Research in Agriculture
SEC Southern Economic Corridor
SEZ Special economic zone
SF Strategic framework
SFA-TFI Strategic Framework for Action on Trade Facilitation and Investment
SIDA Swedish International Development Agency
SIEX Sierra Exportadora (programme), Peru
SME Small and medium enterprise
SPS Sanitary and phytosanitary standard
TA Technical assistance
TAP Tanzania Agriculture Partnership
TARIPA Tanzania Rice Partnership
TAZARA Tanzania-Zambia Railway Authority
T-FTA Tripartite Free Trade Area
TIC Tanzania Investment Centre
TTFS Transport and Trade Facilitation Strategy (CAREC)
TTF-TAF Trade and Transport Facilitation Task Force (GMS)
UK United Kingdom
UN United Nations
xix
UNASUR Union of South American Nations
UNCTAD United Nations Conference on Trade and Development
UNDP United Nations Development Programme
UNED Universidad Nacional de Educación a Distancia – Spain
UN ESCAP United Nations Economic and Social Commission for Asia and the Pacific
US$ United States dollar
USAID United States Agency for International Development
WEF World Economic Forum
WGA Working Group on Agriculture (GMS)

1
Chapter 1
Introduction
1.1 BACKGROUND AND SCOPEInvestment strategies for agribusiness and agro-industry3 development imply the use of a wide array of approaches, partnerships and tools. One such approach is spa-tial (or territorial) development.4 This concept has gained momentum in developing and emerging economies, as innovative attempts to apply spatial planning principles in these countries have begun to yield good results. Several types of spatial develop-ment initiatives (SDIs) have proliferated including, inter alia, economic corridors, clusters, industrial parks, special economic zones (SEZs) and technopoles.5
The use of “economic corridors” emerges as increasingly important to boost agricultural and other economic activities in a specific spatial area. An economic corridor can be defined as a conceptual and programmatic model for structuring physical and socio-economic responses to develop an area building upon a linear agglomeration of economic activities and people along the physical backbone of transport infrastructure (Healey, 2004). This linear agglomeration serves as the basis for planning concerted actions seeking to promote specific economic activities, such as agriculture and agro-industry, in a territory.
High-income countries and regions, such as the European Union (EU), Canada and the United States of America, have extensive experience in implementing such initiatives. However, their use is still a recent phenomenon in the Southern Hemi-sphere and, hence, relatively understudied. The study of economic corridors and their impact on agro-industrial development in low- and middle-income countries will be the central subject of this report.
The scope of research is threefold. First, it presents the concept of economic corridors and summarizes the current thinking on the matter. Second, the study examines the preconditions, approaches and institutional arrangements needed to streamline, mobilize and facilitate investments in agribusiness along economic corridors, looking into the roles and capabilities of the public and private actors involved. Third, it assesses the potential impacts – both positive and negative – of agricultural development along economic corridors in terms of growth, social development and environmental sustainability.
3 See Glossary. 4 Spatial/territorial development/planning are considered synonyms. 5 A definition of these concepts is provided in 2.1.

Making economic corridors work for the agricultural sector2
1.2 OBJECTIVE OF THE STUDYThe purpose of the report is to determine whether the concept of corridors can be effectively applied to unlock the unrealized agricultural potential of defined terri-tories and what the best approaches would be to do so in the context of developing and emerging economies.
In broader terms, the study seeks to contribute to the body of knowledge on effective ways to bring transformative investments6 into agricultural and agro-industrial systems in developing and emerging economies. The distinguishing feature of the study is that it applies territorial development approaches and, more specifically, corridors, to the agribusiness and agro-industry sectors. Given that the related literature has concentrated mostly on transport, energy and industrial manu-facturing corridors, and that the agribusiness sector has unique and well-recognized characteristics (partially stemming from the seasonality, variability and perishability of the raw materials) that make interventions different from those in other areas, the study aims to fill a gap in the policy literature.
More specifically, the document proceeds to identify the preconditions, good design and implementation practices to embed agribusiness development success-fully into economic corridor initiatives and, by extension, in other relevant spatial planning and economic growth programmes.
1.3 METHODOLOGYThe methodology includes a literature review on the subject of economic cor-ridors and related concepts, comprising the economic theories underpinning this approach. The literature review also serves the purpose of mapping out economic corridor initiatives in low- and middle-income countries. Additionally, key docu-ments are examined, describing territorial development and regional integration strategies in which economic corridors are listed as a core approach to agricultural growth and development.
Upon completion of the mapping exercise of economic corridor programmes, a number of initiatives have been selected by applying a predetermined set of criteria. These include the existence of an agricultural component, a minimum budget allocation, and diversity of approaches, lead conveners and stakeholders. The selected economic corridor cases include experiences from Central Asia, the Greater Mekong Subregion (GMS), Indonesia, Mozambique, Peru and the United Republic of Tanzania. Some of the chosen corridors are at country level while others involve multiple countries.
The analytical core of the study consists of a comparative analysis of the selected experiences concerning economic corridors with an agricultural or agribusiness component in developing and emerging economies. This analysis is performed using a comprehensive framework for characterizing and appraising the case studies, thus exposing the main traits of the corridors, their strengths, weaknesses, preconditions for their effectiveness, as well as performance.
6 See Glossary.

Chapter 1 – Introduction 3
The intended final outcome of the research is to produce a checklist that may guide analysts and policy-makers in the design and evaluation of effective agricul-tural components in the framework of an economic corridor programme.
1.4 STRUCTURE OF THE STUDYThe study is structured in seven chapters. The first is this brief introduction that presents the background, objective and methodology of the report.
The second chapter frames the discussion on the territorial development debate (including corridor approaches) and then focuses on the notion and types of economic corridors, starting with the definition and brief description of their key features. It then summarizes the body of knowledge on the application of this approach to various economic sectors, primarily transport, energy, manufacturing and health. The evolution from transport and logistics corridors to economic and development corridors is closely examined. Subsequently, the conceptual founda-tions and economic theories behind economic corridors are described, summariz-ing the current thinking. Some elements for discussion are drawn from economic geography, industrial localization, trade and management theories, spatial/territorial development and other disciplines. The elements of convergence among the various fields explored to do with economic corridors are discussed. The chapter also takes a glimpse at the promising role that the economic corridor model can play in the development of the agricultural sector. Furthermore, it delves into the potential of economic corridors as a tool for mobilizing and facilitating investments into the agricultural sector of developing countries.
The third chapter presents the results of the mapping exercise carried out to iden-tify economic corridors with an agricultural component in developing and emerging economies. A set of eligibility criteria is then applied to select a maximum of three experiences per region: Africa, Asia and Latin America.
Chapters 4 to 7 are dedicated to describing the selected case studies, elaborating on the main corridor initiatives identified and describing relevant features of the cor-ridor models, such as the actors that are driving the corridors and their motivations, the components of the programmes analysed, with a focus on the initiatives related to the agricultural sector, the budget and institutional arrangements, as well as moni-toring parameters and impact evaluation. These chapters undertake a comparative analysis of the cases, which constitutes the main contribution of the research.
The last chapters present the general findings, highlighting the best practices identified during the analysis and the potential difficulties that may be encountered when promoting agricultural corridors. Much attention is devoted to assessing the gains and pitfalls encountered by the corridor experiences studied. On the basis of this analysis, a checklist is proposed to guide policy-makers and practitioners in the design and successful implementation of this type of initiative. The report ends with a presentation of the conclusions and the underscoring of some areas that would benefit from further investigation.
A glossary with key concepts used throughout the study is presented at the end of the document.

5
Chapter 2
Framing the discussion: concepts, theoretical foundations and application to agriculture
This chapter delineates the concept of SDI and the different programmatic tools that are encompassed under this umbrella term: economic corridors, clusters, industrial parks, SEZs and technopoles. Although these SDIs are applied on the global scale, in this study the accent is placed on developing and emerging economies. The dis-cussion then centres on the definition and typology of economic corridor, with its different nuances in approaches (e.g. economic, development and trade corridors). The theoretical foundations behind corridors are briefly explained. Finally the dis-cussion shifts towards the application of corridor schemes to the agricultural sector as a means to attract investments.
2.1 SPATIAL DEVELOPMENT INITIATIVESSpatial or territorial development refers to the evolution of territories in their economic, social, environmental and physical dimensions (CEMAT, 2007). Spatial planning is concurrently a scientific discipline, an administrative technique and a policy developed as an interdisciplinary and comprehensive approach to achieve growth, competitiveness and regional development, as shown in Box 1.
The term SDI encompasses the concepts of economic corridors, clusters, industrial parks, SEZs and technopoles, among other related initiatives. Table 1 summarizes the main features of each kind of SDI.
What these initiatives have in common is that they all represent an agglomeration of economic activity in a specific location where businesses gain advantages through co-location. By supporting SDIs, governments try to reinforce this co-location process through the provision of infrastructure and facilities, capacity building, research and innovation and a range of services and incentives.
These initiatives display differences in terms of their territorial and sectoral/industry scope. With regard to their geographic scope, corridors cover large areas within a subnational region, a country or neighbouring nations, with some of them spanning across several thousand km. For example, the Central Asia Regional Economic Cooperation (CAREC)7 corridors cross ten countries and extend over 4 000 km. Clusters are more geographically concentrated than corridors, as they are usually circumscribed to provinces, municipalities and smaller administrative
7 Described in Chapters 4 to 7.
Making economic corridors work for the agricultural sector6
BOX 1
Spatial planning and spatial development initiatives
Spatial planning seeks to organize physically a geographic zone according to an overall strat-egy. In keeping with the proposed strategy, the government seeks to influence the distribu-tion of people and activities at various scales of space, as well as the location of infrastructure and residential, business and natural areas. When doing so, it pays particular attention to ensuring the coherence of sectoral policies that affect the territory.
The underlying objectives of spatial development tend to form a triangle linking three goals: enhancing competitiveness (by promoting trade and investment, optimizing the use of infrastructure and encouraging value-addition, among others); ensuring social cohesion; and promoting the conservation of natural resources and cultural heritage (EC, 1999). This triple goal of economic development, balance and protection (i.e. avoiding the production of negative externalities) must be reconciled when planning the desired spatial transformation of a country or region.
SDIs are the ultimate expression of spatial planning. According to CEMAT (2007), SDIs are projects generated or driven by the public sector that contribute positively to territorial development on different scales. SDIs are characterized for: � being designed and implemented based on specific geographic linkages (USAID, 2000); � constituting a cluster of mutually reinforcing development projects established to help a
geographic area thrive, as opposed to stand-alone initiatives (Du Pisanie, 2002); � being embedded in an institutional framework to facilitate their design, implementation
and monitoring (ibid.); � linking infrastructure and large-scale economic sectoral investments in defined geographic
areas (Thomas, 2009).
Governments launch SDIs in an effort to develop dynamic zones of sub/supraregional or global economic integration throughout defined geographic areas. These zones offer attrac-tive business and investment environments in specific optimized areas that have a competi-tive edge. This edge can be gained through, inter alia, good infrastructure connectivity and access to a wide range of global services8 (Bialasiewicz, 2011). However, this is possible only if the targeted territory has an untapped potential that can be unlocked by carefully select-ing investments, leading to employment generation, wealth creation and reduced disparities between core and periphery. To unlock the potential, Luiz (2003) proposes several interven-tions, including: � removing bottlenecks to investment, almost always infrastructural in nature; � stimulating strategic investment opportunities across key sectors and their promotion
among domestic and international corporate actors; � harmonizing regulatory and policy frameworks to maximize the spatial implications of
industrial, trade and other sectoral policies that come together to develop the compara-tive advantage of specific economically viable areas.
Examples of these interventions are highlighted in the analysis of the corridor experiences.
8 See Glossary.

Chapter 2 – Framing the discussion: concepts, theoretical foundations [...] 7
units. For instance, in the Chilean province of Bío Bío there is a blueberry cluster that covers 3 400 ha (FAO, 2010). Technopoles, industrial parks, SEZs and business incubators have a more restricted geographic scope, as they generally take up only a few ha usually located on the outskirts of a city. For example, Moroccan and Tunisian food technopoles span over 100 ha on average (FAO, 2011).
There is much diversity in terms of sectoral or industry scope: some SDIs attach themselves to a particular sector, while others are multisectoral. For example, clus-ters are “geographic concentrations of inter-connected companies and institutions in a particular field” or industry (Porter, 1998; p. 78). Technopoles and SEZs, on the other hand, can either target single sector or multisectoral development. Corridors are among the most complex schemes; not only are they multisectoral, but they have other interrelated dimensions besides economic sector development, such as infrastructure, urbanization and environmental sustainability (CEMAT, 2007).
Additionally, each type of SDI places emphasis on different matters. The core element of technopoles is to bring together in one location (or in multiple nearby interrelated locations) the necessary elements (shared facilities and services) for making innovation happen (FAO, 2011). For SEZs, the underscored feature is the provision of economic and regulatory frameworks (e.g. low tax and incentive regimes, including exemptions on sales/value added and/or income taxes),9 which
9 For example, the transfer of assets in cases of shifting any industry from an urban area to a SEZ can be exempted from tax on capital gains or an income tax deduction might be offered for a period of time.
TaBle 1Main features of the most prominent types of SDI
Type of SDI
Prominent features
Overall purpose Geographic scope Sectoral/ industry scope Emphasized feature
economic corridor
Integrated planning
Supranational (might encompass smaller SDIs); linear agglomeration spanning across hundreds or thousands of km
Multi-dimensional
Coupling infrastructure investments with trade and regulatory policy reforms and sectoral development plans
agrobased cluster
Network linkages
Regional or provincial agglomeration (revolving around production area); from hundreds to thousands of ha
Single sector Benefits of agglomeration economies and promotion of collective action
agro-industrial park
Value addition by processing
Urban (accessible distance from production area); a few ha
Single sector/ multisectoral
Common infrastructure and logistics facilities
Technopole Innovation Park + academic and research institutions
Special economic zone (SeZ)
export and promotion of foreign direct investment (FDI)
Urban (possibly near to port area if it is an export promotion zone); a few ha
Single sector/ multisectoral
advantageous economic and regulatory frameworks
Source: author’s elaboration.
Making economic corridors work for the agricultural sector8
are relatively more liberal than in standard locations. Industrial parks allow the pro-vision of common infrastructure facilities, while also helping the industries present there to gain from other benefits of clustering (FAO, 2006). Finally, corridors foster economic activities along a transport and trade route by adding, to large-scale trans-port and trade infrastructure development, policy and programmatic interventions, with a holistic and multisectoral approach, as explained under the next heading.
A trend consistently observed across developing countries is the combination of several types of initiatives in a geographic area. Particular corridors can contain several industrial zones, SEZs and other SDIs. For instance, the Delhi-Mumbai industrial corridor incorporates nine mega industrial zones (FAO, unpublished research), and the GMS corridors include several cross-border SEZs and industrial parks, as will be seen in Chapters 4 to 7.
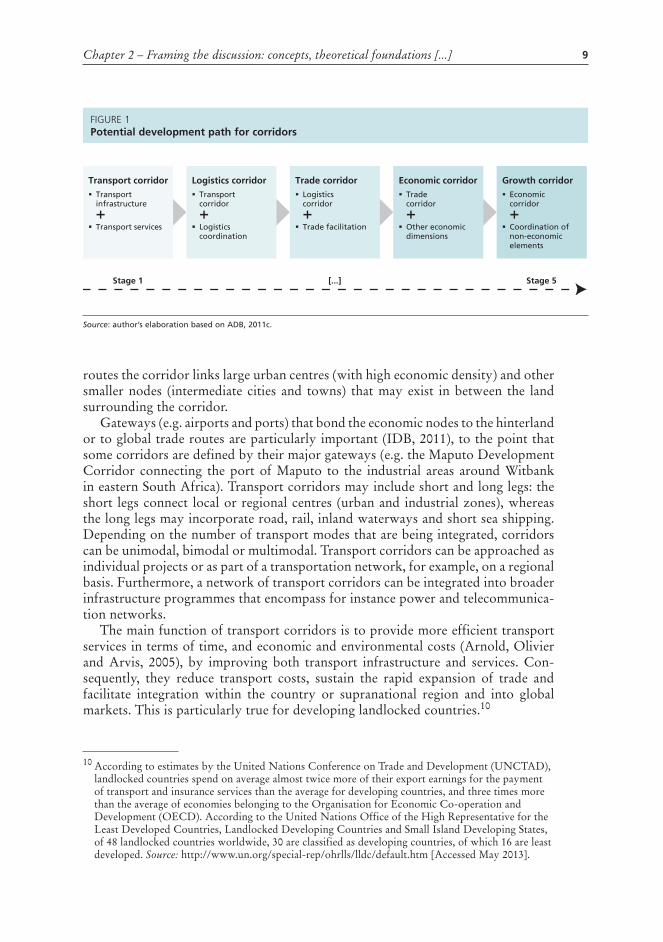
2.2 DEFINITION OF ECONOMIC CORRIDORS AND RELATED CONCEPTSThe classification presented in Figure 1 is helpful to visualize the potential develop-ment path for corridors, although the differences between the various stages are not clear-cut and some overlap is common.
Transport corridors can be defined from different perspectives, notably their physical and functional dimensions. From a physical standpoint, a corridor is a category of space of linear nature connecting large agglomerations (economic nodes) across a geographic area through a number of transport routes. Along these
BOX 2
Definition of corridors
The defining feature of corridors is the linear agglomeration of economic activities and people along the physical backbone of transport infrastructure (Healey, 2004). Nonetheless, the corridor approach can expand from that linear configuration “[...] into tree networks, meshes and finally into hub-and-spoke network systems” (UNESCAP, 2007; p. 37). Physically, corridors encompass both rural and urban areas that are linked in a contiguous geographic region (USAID, 2000).
From a business management point of view corridors can also be described as “islands of competence” (areas that stand out on the basis of their sustainable competitive advantage, grounded in economic performance) linked by connective infrastructure (roads, railroads and air connections). By improving the connective infrastructure, it is possible to help realize the full economic potential vested in each island of competence (Durchslag, Rao and Puri, 1994).
The notion of corridor encompasses different but related conceptual models for structuring physical and socio-economic responses in order to develop an area. These interrelated models can be seen as a gradual evolution of corridors through five stages, from transport corridor (stage 1), to logistics corridor (stage 2), transport and trade facilitation corridor (stage 3), economic or growth corridor (stage 4), and development corridor (stage 5) (adapted from ADB, 2011c).
Chapter 2 – Framing the discussion: concepts, theoretical foundations [...] 9
routes the corridor links large urban centres (with high economic density) and other smaller nodes (intermediate cities and towns) that may exist in between the land surrounding the corridor.
Gateways (e.g. airports and ports) that bond the economic nodes to the hinterland or to global trade routes are particularly important (IDB, 2011), to the point that some corridors are defined by their major gateways (e.g. the Maputo Development Corridor connecting the port of Maputo to the industrial areas around Witbank in eastern South Africa). Transport corridors may include short and long legs: the short legs connect local or regional centres (urban and industrial zones), whereas the long legs may incorporate road, rail, inland waterways and short sea shipping. Depending on the number of transport modes that are being integrated, corridors can be unimodal, bimodal or multimodal. Transport corridors can be approached as individual projects or as part of a transportation network, for example, on a regional basis. Furthermore, a network of transport corridors can be integrated into broader infrastructure programmes that encompass for instance power and telecommunica-tion networks.
The main function of transport corridors is to provide more efficient transport services in terms of time, and economic and environmental costs (Arnold, Olivier and Arvis, 2005), by improving both transport infrastructure and services. Con-sequently, they reduce transport costs, sustain the rapid expansion of trade and facilitate integration within the country or supranational region and into global markets. This is particularly true for developing landlocked countries.10
10 According to estimates by the United Nations Conference on Trade and Development (UNCTAD), landlocked countries spend on average almost twice more of their export earnings for the payment of transport and insurance services than the average for developing countries, and three times more than the average of economies belonging to the Organisation for Economic Co-operation and Development (OECD). According to the United Nations Office of the High Representative for the Least Developed Countries, Landlocked Developing Countries and Small Island Developing States, of 48 landlocked countries worldwide, 30 are classified as developing countries, of which 16 are least developed. Source: http://www.un.org/special-rep/ohrlls/lldc/default.htm [Accessed May 2013].
FIGURE 1Potential development path for corridors
Transport corridor Transport infrastructure
+ Transport services
Logistics corridor Transport corridor
+ Logistics coordination
Stage 1 [...] Stage 5
Trade corridor Logistics corridor
+ Trade facilitation
Economic corridor Trade corridor
+ Other economic dimensions
Growth corridor Economic corridor
+ Coordination of non-economic elements
Source: author’s elaboration based on aDB, 2011c.
Making economic corridors work for the agricultural sector10
Logistics corridors are corridors that not only physically link an area or a region but also harmonize the institutional framework pertaining to logistics and all technological, organizational and legal conditions for such transportation. Their objective is to facilitate the efficient movement and storage of freight, people and related information (Banomyong, 2008).
The concept of trade corridors lacks a precise widely agreed upon definition. In simple terms it can be understood as a transport (or logistics) corridor where additional trade facilitation efforts11 are being deployed. In physical terms, trade corridors seek to improve trade flows (and more generally the movements of goods, services and people) by connecting one or more adjoining countries, or by provid-ing access to the sea for landlocked countries. From a functional standpoint, trade corridors emphasize the need to eliminate barriers hindering the seamless movement of passengers and goods by streamlining and simplifying trade/customs procedures and trade policy. Examples of such barriers in transnational corridors are: incompat-ible customs information technologies; the absence or inadequacy of transnational legislation; operational obstacles stemming from heterogeneous transport, freight and custom regulations; and incomplete networks of cross-border links.
Economic corridors encompass analytical and policy dimensions. The analytical dimension defines the corridor on the basis of spatial-functional forms and patterns (reinforcing the idea that corridors are linear clusters of land uses that interact with each other such that the whole is greater than the sum of its parts (Albrechts and Tasan-Kok, 2009). The policy dimension interprets corridors as policy and spatial planning instruments (ibid.). One of the key features defining economic corridors is their ability to attract investment and generate economic activities along an area or region. Yet to achieve this, physical connectivity and logistics facilitation must be in place (Banomyong, 2008).
Economic, development and growth corridors are frequently employed in an interchangeable manner referring to the elevation of an area to a certain level of development (Campbell, Maritz, and Hauptfleisch, 2009). However, development or growth corridors could also be interpreted as those where non-economic ele-ments (e.g. health systems, environment protection [green corridors], and cultural dimensions) have been added to economic initiatives. For the sake of simplification, in the present document all these terms are considered synonyms.
While it is important to distinguish between transport, trade and economic corridors, they are all inherently designed for fostering spatial economic growth, through the improvement of primarily transport and logistics services available to cities and countries along the corridor. Moreover, there is a natural, evolutionary relationship between trade and economic corridors. This relationship pushes cor-ridor stakeholders increasingly to incorporate new economic promotion elements in the original strategy of transport (and trade) corridors, as in the cases of the GMS corridor programme and the East and southern Africa corridors (Arnold, 2006), analysed in Chapters 3 to 7. Furthermore, whether they are labelled one way or another, corridors must make economic sense in order to be viable. This implies
11 See Glossary.

Chapter 2 – Framing the discussion: concepts, theoretical foundations [...] 11
the existence of nodes with substantive economic density and additional growth potential, and the possibility of amplifying the potential for economic growth of areas in between core economic nodes. As ADB (2011c; p. 3) puts it, a corridor from “nowhere to nowhere through nowhere” would never be meaningful.
The transition across the various sequenced stages may take place in different ways and at a different pace. This depends on the stakeholders (whether public or private investments are leading the way); market orientation (which will largely depend on the predominance of foreign direct investment (FDI) or more domestic-bound investors); policy focus (policies friendly to small and medium enterprises [SMEs] vis-à-vis policies favouring large industrial enterprises and logistics compa-nies) and sectoral priorities (ADB, 2011c).
2.3 TYPES OF ECONOMIC CORRIDORSThere are several types of economic corridors according to their geographic and sectoral scopes and key drivers, as summarized in Table 2.
From a geographic standpoint, economic corridors can be undertaken at dif-ferent administrative or governmental levels within a country (local, subnational regions and national). Some corridors may extend to cross-border, transnational and regional contexts,12 as in the case of regional (supranational) corridors in the Greater Mekong Subregion (see Chapters 3 and ff.). Subnational level corridors span across a region, state or province within a country. They may also include cross-border variants, i.e. regions composed of parts of two or more countries. A transnational corridor spans between two or more adjoining countries; it constitutes an area characterized by its rapid and large-scale spatial dynamics within a world
12 For the purpose of this report, “cross-border” is between two or more countries sharing borders, “transnational or multinational” refers to several countries (not necessarily neighbour nations), and “regional” encompasses all the countries in a region.
TaBle 2Types of economic corridors
Geographic scope � Urban corridor vs urban-rural corridor
� Subnational-level corridor
� Transnational or regional (supranational) corridor
Sectoral scope � Monosectoral corridor (e.g. agriculture and transport)
� Multisectoral corridor
Driver � Public-led corridor
� Donor- or international financial institution (IFI)-led corridor
� Private-led corridor
� Multistakeholder partnership corridor or public-private partnership (PPP) corridor
Source: author’s elaboration.

Making economic corridors work for the agricultural sector12
of thinning national borders. Some corridors are relatively short in length, e.g. the Maputo Corridor that links Mozambique and South Africa, while others are defined by the transnational region they serve, such as the GMS corridor (Arnold, 2006). In supraregional or cross-border regional corridors, the emphasis is on regional cooperation (e.g. transport and trade facilitation, and policy harmonization) across the countries involved (ADB, 2011c). This leads to important differences in stake-holders, policy space and institutional options for coordinating actions compared with subnational regional planning (Marrian, 2001).
Also regarding their geographic scope, most economic corridors comprise both urban and rural areas. However, some economic corridors develop predominantly in an urban context. These are known as urban corridors (UN-HABITAT, 2010a; 2010b; 2012), in which several urban spaces of various sizes, including megaci-ties, are linearly connected through transport networks that improve connections between cities and open up the hinterlands (UN-HABITAT, 2010a; 2012). Many urban corridors are experiencing the fastest growth rates and the most rapid met-ropolitan transformation. In these corridors, urban planning (metropolitan areas and major cities and towns) goes hand in hand with the development of strategic transport infrastructure (and other regional infrastructure networks including, in particular, the water and sewage infrastructure) required to support urban growth, and a long-term strategy for the integrated development of agricultural, industrial and mixed-use areas (Rodrigue, Comtois and Slack, 2009; GAA, 2012).
As regards the sectoral scope, most economic corridors are multisectoral as they target several industries and sectors simultaneously. However, on some occasions, corridor initiatives are monosectoral, i.e. they focus on one major sector alongside transport/infrastructure development. In this case, they are usually labelled upon the selected sector: energy corridor, health corridor, agricultural corridor, and min-ing, multimedia hi-tech, industrial manufacturing and tourism corridors, and so on. Some examples include several energy corridors (oil, gas, electricity and hydrogen corridors) serving the European Union (EU)13 (Marín-Quemada, García-Verdugo and Escribano, 2012); the Caspian Region Energy Corridor (Mavrakis, Thomaidis and Ntroukas, 2006); the Sarawak Corridor of Renewable Energy in Malaysia (Sovacool and Bulan, 2012); the Multimedia Super Corridor in Malaysia (Bunnell and Coe, 2005); the Lao Tourism Corridor (Travers, 2008); the Mauritanian Mining Corridor (World Bank, 2008b); and oil corridors in many African countries.
Agribusiness is one of the most commonly prioritized sectors that are supported by and expected to act as an engine for growth in developing country corridors. At times, the whole economic corridor programme revolves around agricultural and agribusiness development concentrated around a major infrastructure investment or set of interrelated infrastructure projects. In this case, the corridor can be described as an agricultural corridor or agrocorridor. In reality, these agricultural corridors are a bisectoral solution, in the sense that they try to create synergies by simultane-ously developing both the agricultural and the infrastructure sectors (e.g. transport,
13 Reaccess project (7th Framework Programme of the European Commission), information available at: http://reaccess.epu.ntua.gr/VirtualLibrary/EnergyCorridors.aspx [last accessed August 2013].

Chapter 2 – Framing the discussion: concepts, theoretical foundations [...] 13
energy, telecommunications and agricultural-supporting infrastructure). Most frequently, however, agribusiness is just one of several prioritized sectors within the corridor, together for example with tourism or mining. In the following chapters, corridor experiences that fall under both categories will be described.
A third typology emerges to highlight who champions the initiative. Most economic corridors are of a top-down nature and involve mainly public authorities (public-led corridors). Further corridors are supported by the international community (donors, IFIs and technical agencies), working closely with national governments. Other cor-ridors evolve mostly as the result of private interests: these are private-led corridors. There are a growing number of corridor initiatives largely based on a bottom-up approach, involving civil society as well as private interests, mostly through PPPs14. These can be called PPP corridors or multistakeholder partnership corridors.
The rationale for typifying the corridor programmes is primarily that each category has intrinsic implications in terms of the components proposed and stake-holders involved and, therefore, the type of organizational structure adopted. For example, in multisectoral corridors there would probably be specific activities and institutional mechanisms to ensure coordination and cross-pollinization among the different sectors. Likewise, regional corridors will include actions to align national and regional policy frameworks, activities and institutional mechanisms. Finally, there is an obvious relationship between who leads the corridor and the type of activities proposed. For instance, a corridor programme primarily supported by an IFI, such as the regional corridor initiatives in Central Asia and the Mekong led by the Asian Development Bank (ADB), will tend to put the emphasis on the develop-ment of large connecting infrastructures through loans and grants. Conversely, a corridor programme funded (grants) by a bilateral donor (e.g. the Poverty Reduc-tion and Alleviation [PRA] Project in Peru) will likely focus on lighter investments in soft components, such as business development services (BDS) and SME support.
2.4 THEORETICAL FOUNDATIONS OF ECONOMIC CORRIDORS Economic development is uneven across space, creating disparities in economic density, incomes and living standards. Such unevenness takes place on all geographic scales, local, regional and global (World Bank, 2009a). Location remains important at all stages of development for people, but especially for firms, because the “what” and “how” of economic production are inextricably linked to location decisions (i.e. “where” to produce).
A territory with a generous endowment of agricultural resources, such as fertile agricultural land and water, might be far from being an agricultural growth pole. On the contrary, it has been argued that being equipped with remarkable natural resources is more of a curse (Sachs and Warner, 1995; 2001) or, in any case, a mixed blessing (Wright and Czelusca, 2004). So, if having a vast natural resource base and large agricultural potential are not enough, what other factors determine agricultural growth in a country or region? Or, more broadly speaking, why do some economic activities flourish in a specific space and not in others?
14 See Glossary for a definition of PPPs.

Making economic corridors work for the agricultural sector14
In an effort to answer this question, much of the debate on territorial devel-opment has revolved around the attributes of spatial development (unevenness, circular causation and the neighbourhood effect; see explanation in Box 3) as well as the market forces shaping territorial transformation: agglomeration, migration, and trade and specialization (World Bank, 2009a).
Territorial transformation is shaped by the interplay of three market forces: agglomeration economies, trade and specialization, and migration (World Bank, 2009a). Agglomeration can be explained as the force that induces firms to gravitate towards each other to form clusters or agglomerations. When locating near each other, firms obtain agglomeration economies, i.e. external economies deriving from collocation that offer to participating firms both static, cost-based advantages and dynamic, innovation-related benefits. They are the outcome of the interaction of increasing returns, trade costs and factor price differences.
SDIs try to develop fully the economic potential of existing firm agglomerations, while at the same time improving their connectivity with other internal and outer
BOX 3
Attributes of spatial development
Unevenness. The processes of economic growth and integration develop unevenly across the space economy and are locally and regionally differentiated (Dicken, Peck and Tickell, 1997; World Bank, 2009a; Yeung, 1998). The tendency of economic activ-ity to be highly concentrated holds true whether considering the world, countries, regions or cities (Easterly and Levine, 2001). Thus, a mosaic-like patterning of uneven development is generated, eventually creating a divide between successful and lag-ging countries and regions, winners and losers.
Self-reinforcement. Economic growth is self-reinforcing due to a process of “circular and cumulative causation” because all factors of production flow to the richest areas revealing important externalities (Easterly and Levine, 2001). Such a notion, developed by Myrdal (1957), stresses how economic growth is initially spatially polarized and only later spreads or trickles down to the surrounding areas (see Berger, 2009, for a detailed explanation of the circular and cumulative causation principle).
Neighbourhood effect. Economic growth is affected by the neighbourhood effect, by which adjacent territories share economic destinies. The seminal work was carried out by Lewis (1969), Wilson (1987) and Borjas (1992; 1995), who linked neighbour-hood externalities and poverty clusters within cities. The same principle is equally applicable across countries: the level of development of adjacent countries has a significant impact on the economic growth of a given nation or region (Easterly and Levine, 1998; Collier and O’Connell, 2007; Roberts and Deichmann, 2011). Accord-ingly, lagging areas have in common that they are economically distant from places doing well (World Bank, 2009a).

Chapter 2 – Framing the discussion: concepts, theoretical foundations [...] 15
economic nodes in a large spatial area, so that transport costs and agglomeration benefits for the total area increase as a whole. An explanation of agglomeration economies and other related concepts is offered in Box 4.
People, regions and countries specialize in producing certain goods and services for which they have an advantage. Greater specialization allows them to take full advantage of economies of scale. Scale economies generate an uneven pattern of specialization and trade (of both intermediate and final outputs), and market dominance, ultimately creating an irregular mosaic of economic development across regions and countries.
If trade is largely shaped by economies of scale, then those economic regions with most production will be more profitable and will therefore attract even more production. This is known as the “home market effect”, i.e. the “gravitational force” that attracts imperfectly competition towards large markets, creating geographic agglomerations of economic activities (Ottaviano and Thisse, 2004). This implies that instead of spreading out evenly around the world, production will tend to concentrate in a few locations, which will become densely populated (by firms and people) and will also enjoy higher levels of income.
The home market effect is enlarged by some amplifiers that give rise to circular causation in locational decisions, according to the core-periphery model. Such amplification effect ends up creating the uneven development of two regions: a “core” region where the majority of the population concentrate, which specializes in a competitive economic sector, leaving a small minority in the “periphery” to live off a less competitive activity (Krugman, 1991). The core-periphery model also explains north-south uneven development. For over a century and a half global economic activity has concentrated in the Northern Hemisphere, creating an uneven display of economic tissue, far denser in the north (core) than in southern peripheral regions.
Economic integration,15 i.e. the abolition of the various restraints of trade between nations, has remained central in the territorial debate, whether it refers to integrating cross-border regions or lagging and leading countries.
Migration and factor mobility in general, happen on three geographic scales: the urban-rural scale, between lagging and leading regions within a country, or between countries. Human capital moves to where it is abundant, not scant (World Bank, 2009a). The reality is that skilled migrants naturally seek places where workers with similar high-level specialized skills abound. Recognizing scale economies and their interaction with the mobility of people and products implies changing conventional ideas about what is needed for economic growth. According to the World Bank (2009a), countries should facilitate labour mobility if they wish to prosper. The willingness and ability of workers to move seems to be an adequate gauge of their economic potential and desire for advancement. The implication for policy-makers is that the market force which pulls skilled people together should not be interfered with, nor underestimated. Smoothing the flow of educated migrants, upgrading their capacities, while minimizing the potential adverse effects of such migration, are important elements of SDIs.
15 See Glossary.

Making economic corridors work for the agricultural sector16
BOX 4
Definition of economies of scale and scope, and agglomeration forces
Economies of scale are concerned with the reductions in cost per unit resulting from increased production. They can be internal to the firm (when the cost per unit depends on the size of the firm), or external when the lowering of costs is due to external factors (e.g. proximity to workers, customers and people with new ideas).
External economies of scale will increase the productivity of an entire industry, geographic area or economy. The external factors are outside the control of a particular company, and encompass positive externalities that reduce the firm’s costs. Such positive externalities can be localized producing agglomeration economies called localization econo-mies, which can be defined as “cost reductions because economic activities are located in one place” (McDonald and McMillen, 2007). Such economies of scale are shared by firms in the same industry and location. The decision of firms regarding their location might be altered by infrastructure investments capable of modifying the equation of transportation costs, or as Carciofi (2012; p. 67) notes: “the development of infrastructure rebalances the centripetal and centrifugal forces behind locational decisions”.
There are more generally available external economies of scale that thrive on economic density or urbanization economies (World Bank, 2009a). In spite of the clear correlation between the size of the settlement and the type of economies of scale that they are likely to provide, “the size of settlements matters less than their function” (ibid.). For example, with reasonable transport costs, towns can be large enough to facilitate internal scale economies but not to generate external ones, whereas medium-size cities are often large enough for localization economies due to their relatively thick input markets,16 but not for urbanization economies – especially those involving knowledge spillovers − generated mainly by large cities. The main implication for policy-makers is to focus on the functions of cities as nodes of high economic density and make the most of their dynamic business environment.
The causes or microfoundations of agglomeration include the following centripetal forc-es: labour market pooling, input sharing and knowledge spillovers (Marshall, 1890), as well as economies derived from concentration of demand and natural advantages. These forces are external factors to the firms, but internal to the industry, generating shifts in their cost curves and enhancing the economic performance of the agglomerated firms. Some of the various aspects of economic performance from clustering are enhanced innovation; higher input (labour/capital) demand or price (wage/asset value); greater productivity; reduced costs; and location decisions or firm “births” (Cohen and Morrison Paul, 2007).
The term economy of scope was coined by Panzar and Willig (1981) to describe a rather intuitive property of production consisting of the cost advantages derived from the scope (rather than the scale) of the firm. It can be defined as the reduction of an enterprise’s costs deriving from enlargement of scope, either as a result of increasing the number of different goods produced or of producing in more than one location (Teece, 1980). The existence of economies of scope in production is the necessary condition for outsourcing to occur because, without it, vertical disintegration along the global value chain has no advantage in reducing the production costs of the intermediate products.
16 See Glossary.
Chapter 2 – Framing the discussion: concepts, theoretical foundations [...] 17
A new paradigm of territorial development. The dominant approach for foster-ing economic integration has evolved over the years, shifting from growth poles, industrial complexes/districts and clusters, to more rural-urban development approaches and subsequently to a new wave of SDIs, among which stand out the concepts of clusters and economic corridors. These approaches diverge as to the type of agglomeration economy highlighted (urbanization economies deriving from between-industry interactions or localization economies arising from within-industry economic interactions) and the preferred tool (e.g. growth centre/pole, cluster or economic corridor) (Karlsson, 2008).
New theoretical developments in the 1990s and 2000s have brought attention back to the importance of location in the face of escalating globalization pres-sures, and have come up with new pro-strategic trade arguments that run counter to conventional economic wisdom and practice. Such developments back up the adequacy of strategic trade interventions such as SDIs, when specialization in industries and sectors responds to the existence of competitive advantages, good design and implementation practices are followed and safeguard mechanisms are properly introduced. Consequently, SDIs by Southern Hemisphere countries to attract investments to regions with growth potential are, by and large, seen as suitable, as long as interventions focus on reducing transport and trade costs and helping achieve economies of scale; equal attention is paid to hardware and software components;17 and multistakeholder governance is ensured as a means to avoid selecting areas, sectors and industries for the wrong reasons (on political grounds and on the activities of lobby and pressure groups, among others) (Ambrosio-Albalá and Bastiaensen, 2010).
Over the years, the dominant approach to explain and eventually foster eco-nomic agglomeration and growth in specific areas has been moving along a learning curve, in a way that each new model has learned from the mistakes of the preceding ones. Furthermore, all along this evolutionary process, emerging economic (globali-zation), political (centralization) and social (demand for better governance) forces have been factored into the equation, modifying long-held views. Nowadays, the body of knowledge about agglomerations and dispersion forces is quite mature and helpful to understand much better why and how firms concentrate in a spatial area. The question is whether and how spatial planners and policy-makers can attract firms to SDIs. The theory seems to say that this is possible when there is already economic density and potential that can be maximized. Therefore, blind support to backward regions with little potential for economic growth, through spatial development programmes, is plainly objectionable.
SDIs should focus on areas with viable, but untapped growth potential and work to remove bottlenecks to growth, both in terms of lacking connective infrastructure (especially for landlocked regions) and the business environment, so that software and hardware improvements are aligned for maximizing the returns on investments. The subsequent sectoral targeting should be carried out through multilevel and multistakeholder governance systems with proper check-and-balances that take into
17 See Glossary.
Making economic corridors work for the agricultural sector18
account both private and public sector interests, in an effort to avoid an arbitrary selection (not on economic grounds) of prioritized sectors and industries, which has been a recurrent feature of traditional development interventions.
The theory also seems to highlight the advantages of spatial development approaches for enhancing regional integration. Falling transport costs increase trade more with neighbouring, not distant, countries. With a decline in transport costs, countries should trade more with countries that are further away. But trade has become more localized than globalized. Countries trade more with nations that are similar, because more than ever the basis of trade is the exploitation of economies of scale, rather than differences in natural endowments. The main rationale behind this is that falling transport costs make specialization possible. The resulting policy implica-tion is that falling costs change the composition of international trade and increase the sensitivity to such costs. Therefore, for late developers, policies to decrease trade and transport costs should be a substantial element of their growth strategies (World Bank, 2009a). This explains why economic integration is increasingly important.
The debate is still open in terms of identifying the best practices for incorporating agricultural development strategies into spatial development programmes, because of the specificities of the agricultural sector (e.g. dependence on natural resources endowment and highly influenced by climate change).
2.5 CORRIDORS AND OTHER TERRITORIAL-BASED APPROACHES FOR ACCELERATING AGRIBUSINESS GROWTH AND ATTRACTING INVESTMENT IN DEVELOPING COUNTRY AGRICULTURE
The conceptual issues explained in the previous sections are also applicable to the extended agricultural sector. The interactions among increasing returns at the firm and industry levels, agricultural transport costs and labour force mobility cause spa-tial economic structure to emerge and evolve. As a result, food “hotspots” emerge in some regions and countries.
Adherents of the strategic trade theory argue that it is possible to create the conditions for creating or further developing existing food hotspots in specific territories by adopting agrobased SDIs. Therefore, they advocate the provision of an enabling environment and (hopefully) smart incentives that encourage a critical mass of agribusiness firms to locate in a specific area. Once the critical threshold is breached, the agglomeration of companies and service providers will attract new players and a sort of snowball effect takes place.
There are two ways to go about this. An SDI can be put in place with the sole purpose of accelerating agribusiness development or an agricultural component can be added to an already existing SDI. In fact, ongoing SDIs with roots firmly entrenched in the transport or industrial sectors (transport corridors and industrial parks, respec-tively) can accumulate over time progressive layers of spatially bounded multisectoral interventions. One of the sectors most frequently contemplated in SDIs is agriculture or agribusiness. By becoming multisectoral, these SDIs can multiply the positive impacts of the initial investments in transport or industrial infrastructure.
Agrobased SDIs have the triple purpose of helping agribusiness players to adapt to the metatrends making the agriculture sector evolve at an unprecedented pace; create value networks among agribusiness actors in the target territory; and contrib-ute to attracting transformative investments in the sector.

Chapter 2 – Framing the discussion: concepts, theoretical foundations [...] 19
The concept of corridors has its roots firmly entrenched in the transport sector but, over time, it has accumulated progressive layers of spatially bounded interven-tions targeting multiple economic sectors.
One of the keys to designing agrobased corridors successfully is to understand the main features of the extended agricultural sector and the metatrends18 reshaping it, as seen in Box 5. Agriculture is evolving from its traditional form – a labour-intensive and lesser capital-intensive sector dominated by unskilled workers, and characterized by long and fragmented supply chains – to become a modern economic activity that uses skilled labour. It is also highly standardized, input intensive, concentrated and capital and technology intensive (e.g. some tractors now deploy global positioning systems [GPS] to apply fertilizers to cropland more pre-cisely). This transformation is being spurred on by several factors, such as income and population growth; urbanization and female employment; political economy change; and modern technology (FAO and UNIDO, 2009).
Countries and regions where agribusinesses are not agglomerating spontane-ously, or not at the desired pace, might wish to catalyse this agglomeration process by implementing SDIs targeting the sector. Furthermore, the overwhelming pres-sure exerted by these compounded trends on developing country agribusiness forces them to become more global while remaining competitive and sustainable. Paradoxically, the more globalization forces expose the agricultural sector to far-reaching changes, the more local solutions emerge to foster local competitiveness, and the more attention is being paid towards agro spatially bound initiatives.
The last few years have seen a surge of interest in developing country agriculture by both countries and multinational firms; the former in support of their food secu-rity strategy and the latter motivated by potentially high returns on investment. On the other hand, some developing nations are making strenuous efforts to mobilize and facilitate foreign and domestic investment in their agricultural sectors. For them, FDI is a potentially important contributor to filling the investment gap, which has been identified as an underlying cause of the recent food crisis and the difficulties develop-ing economies encountered in dealing with it (FAO, 2009a). Economic corridors can be instrumental in rallying investments in targeted sectors, including agriculture.
Investment in agriculture is positively correlated with production levels, food security and poverty reduction (FAO, 2012b). Regrettably, over the past decades, the level of agricultural investment in developing economies has declined, mostly due to the downturn in public and international donor spending.19 Yet, to feed the world’s growing population, investment in primary agriculture and downstream services (including storage, processing and market facilities) needs to be augmented by 50 percent in 2050, i.e. US$83 billion per year of additional investments (FAO, 2009b; 2012a; 2012b). The gap in required investment levels is even larger when considering public goods that are essential for agribusiness development such as roads, electrification and large-scale irrigation projects that were not included in the above estimate.
18 See Glossary.19 The share of official development assistance directed to agriculture has fallen from around 10 to
5 percent (Hallam, 2011).

Making economic corridors work for the agricultural sector20
BOX 5
Metatrends shaping the agricultural sector
According to Reardon and Barrett (2000), five major trends are fuelling this evolution. 1. Increase in scale and concentration at the firm, spatial and sectoral levels. Agricultural
supply chains are progressively operating at a global scale thanks to a policy environ-ment that encourages free trade, as well as to the availability of new production, pro-cessing and logistics technologies (FAO and UNIDO, 2009). On the one hand, globali-zation forces are generating the spatial agglomeration of agroprocessing firms and, on the other, a faster pace of concentration and vertical integration in agricultural chains. These processes result in a diminishing number of economic players (a few multinational agribusiness companies) exerting their power over global buyer-driven supply chains, at least for many commodities (Reardon and Barrett, 2000; Reardon, Pingali and Stamoulis, 2006; Ruben, Slingerland and Nijhoff, 2006).
2. Changes in commodity and subsector composition on two fronts. First, broad com-modity shifts associated with rising incomes20 and with new or expanding existing uses (fuel21 and feed, respectively) are taking place. The second front is the so-called “supermarket revolution”, occurring in both developing and industrialized markets (Reardon, Timmer and Minten, 2010). This term alludes to the consecutive waves22 of diffusion of supermarkets (referring to all sorts of modern retail activities) in the developing regions of Africa, Asia and Latin America. The revolution or rise of super-markets has manifested itself in sales growing at a spectacular rate, far faster than GDP growth rates. It has had profound impacts on agrifood systems, some positive (lower food prices for consumers and market opportunities for farmers and proces-sors producing quality-differentiated food products), and some negative (exclusion of small-scale actors ill-equipped to meet supermarkets’ stringent procurement requirements) (Reardon et al., 2003; Reardon, Timmer and Minten, 2010). The rise of modern retailing has come at the expense of the traditional wholesale channel.
3. Amplified multinationalization and export orientation of agricultural supply chains. 4. Mass adoption of coordination and control mechanisms (e.g. grades and standards)
reshaping the governance of agricultural chains.23 5. The use of production factors has been intensified at all stages of the value chain
(production, processing and retailing) in terms of professionalization of the labour force and higher capital intensity.
20 When consumers move up into higher-income brackets they tend to substitute starchy food staples with higher-value, more processed and convenient food products, such as fruit and vegetables, oils and processed grains, meat and dairy products (FAO and UNIDO, 2009).
21 Several food crops (e.g. corn, soybeans, sugar cane and wheat) are increasingly being grown for producing biofuel.
22 The first wave swept much of South America, East Asia (outside China) and South Africa; the second wave, Mexico, Central America and much of Southeast Asia; the third wave, China, India and Viet Nam; and the last is currently taking place in Bangladesh, Cambodia and West Africa (Reardon, Timmer and Minten, 2010).
23 See Glossary for a definition of governance and value chains.

Chapter 2 – Framing the discussion: concepts, theoretical foundations [...] 21
BOX 5 (Continued)
A sixth trend could be added, pertaining to the renewed emphasis on sustainability, expressed in the search for greener, socially responsible and economically viable agricultural chains (Pannell and Schilizzi, 1999; Meadowcroft, 2007; Morgan, 2008).
To make up for the fall in public spending and overseas development aid, many developing economies are committed to promoting investment in their agricultural sectors.24 Seemingly, these efforts have paid off: inward FDI stock in developing country agriculture increased 6.4-fold between 1990 and 2009 (UNCTAD, 2011) and has risen even more since (FAO, 2012a). In the same period, inward FDI stock in food and beverages increased 6.1-fold in developing countries and 6.4-fold in developed countries (UNCTAD, 2011). See Table 3 for further information.
The rise of FDI inflows into developing country agriculture is particularly remarkable, given the current worldwide downturn in FDI, induced by the global economic crisis (UNCTAD, 2012). This success is compounded by the supe-rior performance of developing and transition economies – investments to these economies surged, increasing their share in global FDI flows to 45 percent in 2011 (UNCTAD, 2012). FDI activity in primary and extended agriculture in recent years has been exceptional, particularly in a context where FDI flows into most industries substantially declined (UNCTAD, 2009a; 2011; 2012). In spite of this recent spike, the share of total FDI that is directed to agriculture remains low with respect to other sectors.25 A survey performed by FAO (2012a) revealed that FDI flows into
24 Traditionally, investment promotion has been associated with attracting and facilitating FDI to a particular country, but has evolved over time to become applicable to lower levels of the economy, such as channelling investment into specific cities or regions within a country or a particular economic sector. Furthermore, the concept has since been applicable to domestic private investment as well.
25 The absence of available updated FDI data by sector/industry for developing countries precludes a deeper analysis of sectoral differences.
TaBle 3Estimated world inward FDI stock by sector and region in million US$, annual
Agriculture, hunting, forestry and fishing
Food, beverages and tobacco All sectors
1990 2009 1990 2009 1990 2009
Developed economies 3 733 16 328 76 100 487 649 1 562 296 12 296 706
Developing economies 4 850 31 053 11 036 67 670 517 200 5 120 182
Transition economies – 2 995 – 13 172 1 652 624 121
Source: UNCTaD (2011; annex Table 24); and UNCTaD-STaD, FDI series. Inward and outward foreign direct investment flows and stocks. annual, 1980–2011.
Note: US$ at current prices and current exchange rates in millions.

Making economic corridors work for the agricultural sector22
agriculture were below 5 percent of total FDI inflows, and in the majority of cases even under 2 percent.
The reasons behind this FDI surge are manifold and complex. They include both cyclical factors (e.g. the steep rise in agricultural commodity prices in 2007–2008, speculation on land and other natural resources, and search for alternative energy sources) and structural drivers (e.g. growing population, rising consumption rates and market demand for food and biofuels) (FAO, 2012a; 2012b). The bulk of agricultural FDI flows has been directed to the food manufacturing sector, while primary agricultural production accounted for less than 10 percent between 2006 and 2008 (FAO, 2012a). Nonetheless, this statement might need some qualification, as FDI in the primary agricultural sector is difficult to track back (ibid.).
The recognition that private sector investment is needed to leverage addi-tional funds, expertise and other resources for agricultural growth has pushed public policy to provide an enabling environment for private investments in agribusiness. Over the years, developing countries have adopted a wide range of economic prescriptions for creating enabling environments and “getting markets right” (FAO and UNIDO, 2009; p. 136). These prescriptions include a variety of agricultural and macroeconomic policies that have a direct impact on the agricultural sector. Cases in point are the deregulation of the economy, the opening up of domestic markets to world markets, the privatization of state-owned enterprises, increased investments in research and development, the provision of rural credit, and minimum guaranteed producer prices (FAO and UNIDO, 2009; FAO, 2012a). The resulting improved business climate is expected to attract capital to invest in specific firm strategies and general market-based solutions that contribute to both development and economic growth goals (FAO and UNIDO, 2009).
More recently, developing country governments have become keen on fostering collaborative and inclusive business models, by which investors seek to promote the involvement of smallholders and local investors. This practice is seen as a means to “pre-empt local conflict and international criticism through building up local participation from the start” (FAO, 2012a; p. 80). Consequently, host countries are striving to put in place appropriate policy and regulatory frameworks to ensure that the developmental benefits of agriculture FDI are maximized, by inter alia, employment generation, transfer of expertise and technology, and infrastructure development. They also try to minimize risks, such as the potential exclusion of small farmers and firms, land tenure conflicts and negative environmental impacts (UNCTAD, 2009a; FAO, 2012a).
These efforts to enhance the business climate have translated into improved institutional frameworks for agribusiness investment promotion, i.e. setting up or strengthening institutions responsible for disseminating information, or attempting to create an image of the investment site. These institutions also provide investment services for prospective investors in the agriculture and agribusiness sectors (Wells and Wint, 2000).
The increased attention given by governments to investment promotion can be illustrated by the more than fourfold increase in the number of investment promo-tion agencies (IPAs) set up from 1980 to 2004 in developing countries. Current estimates place the number of regional and city-level IPAs at 8 000 worldwide (VCC and WAIPA, 2010). Another institutional option for investment promotion found in
Chapter 2 – Framing the discussion: concepts, theoretical foundations [...] 23
developing countries is to create an Agribusiness Unit within the Ministry of Agri-culture with a mandate to, among other things, mobilize and facilitate investments in the agribusiness sector. A third option is to set up a PPP Unit with the role of lev-eraging private investments in various sectors of the economy (FAO, forthcoming).
Depending on the financial resources and technical capacity of the investment agency and/or institutions involved, a country can design clever ways to package agribusiness investment promotion activities according to their targeted audience and priorities. For instance, investors can be encouraged to invest in specific agriculture value chains, clusters or subsectors that enjoy a particular competitive advantage. Alternatively, investment promotion can also be used to attract and facilitate agribusiness investments in specific geographic areas, using SDI tools such as economic or growth corridors, agrifood parks and SEZs. The ideal way for a host country and the private sector to build a successful agriculture sector investment programme might be a blend of all of these functions and approaches as suited to the country’s particular investment and economic context.
Corridors, SEZs and other spatial development tools are particularly used to attract FDI in countries where infrastructure is a challenge (FAO, 2012a). For exam-ple, evidence from the United Republic of Tanzania suggests that SDIs – through cost-sharing with the private sector, infrastructure development and implementa-tion of the regulatory environment combined with efficient administration – could provide the best possible business environment for agricultural growth within a limited geographic area (ibid.).

25
Chapter 3
Overview of the corridor profiles
Chapters 3 to 7 describe a series of economic corridor initiatives in developing Africa, Asia and Latin America. First, a mapping exercise is carried out to identify economic corridor initiatives in developing regions. The mapping is presented in this chapter, accompanied by a snapshot of the regional economic and policy background against which these corridors emerge and evolve. Three policy aspects are highlighted: those regarding regional trade, transport integration and regional agricultural policies and institutions. These elements will be further developed in subsequent chapters.
The corridor cases identified are then filtered through a set of criteria listed in section 3.1. Finally, an introduction to the selected corridor experiences is provided before the following chapter, which discusses the cases in detail.
3.1 INTRODUCTION TO THE MAPPING AND SELECTION EXERCISE OF ECONOMIC CORRIDOR INITIATIVES IN DEVELOPING COUNTRIES
Over 30 corridors have been mapped out, as summarized in sections 3.2 to 3.4. The detailed list can be consulted in Annex 1.
Regional differences have been found among these corridor interventions in terms of geographic scope, lead conveners and stakeholders involved, as well as of the tools used (following the corridor typology presented in section 3.3), as will be explained later. Furthermore, even though all corridors observed have similar gen-eral objectives (contributing towards enhancing competitiveness, poverty reduction and job creation), they do not necessarily seek the same specific goals: for example, some corridors pursue primarily trade integration, whereas others privilege food security. To improve the understanding of the possible rationale behind these dif-ferences, the mapping of initiatives is presented together with an assessment of the economic and policy environment in which they take place.
This mapping exercise is followed by the selection of a number of corridor experiences through the application of the following eligibility criteria. � The existence of an agricultural component is a sine qua non condition. � The timeline of the initiatives is also taken into account: the longer the corridors
have been in operation the better. � A preference is also expressed for a diversity of approaches, geographic scope,
drivers and stakeholders. � A maximum of three corridors per region will be selected in order to avoid
diluting analytical efforts by examining a large number of initiatives only in a superficial manner.

Making economic corridors work for the agricultural sector26
3.2 AFRICAN CORRIDORS AND THEIR POLICY BACKGROUNDMapping of African corridors. Several African countries have crafted credible plans to transform the existing transport corridors into economic corridors. A summary of the economic corridors mapped out in the region is presented in Table 4. These interventions have been designed to fulfil five purposes: (i) enhancing physical connectivity; (ii) ensuring food security; (iii) supporting regional trade integration; (iv) nurturing agricultural growth; and (v) absorbing the expansion of large urban areas and cleverly connecting various spots of urban growth, including their hinterlands.
Out of a total of 14 corridors identified, two have been selected for in-depth analysis because they meet the criteria more fully. These two economic-corridor initiatives have been launched to foster agricultural growth specifically: the Beira Agricultural Growth Corridor (BAGC) linking the homonymous port, in Mozam-bique, with three central provinces of the countries with high agricultural potential; and the Southern Agricultural Growth Corridor of the United Republic of Tanzania (SAGCOT), which connects southern Tanzania to the port of Dar es Salaam.
Policy and institutional framework. Corridors repeatedly appear in the main Afri-can policies and programmes. Table 5 captures how the main institutions operating
TABLE 4 Corridors identified in Africa
Corridor name Countries involved Cases selected
Abidjan-Ouagadougou Corridor Côte d’Ivoire and Burkina Faso No
BAGC Mozambique Yes
Central Corridor United Republic of Tanzania, Burundi, Democratic Republic of the Congo (DRC), Rwanda and Uganda
No
Coast-to-Coast Corridor Mozambique, Swaziland, South Africa, Botswana and Namibia
No
Dakar-Touba Corridor Senegal No
Gauteng City Region Corridor South Africa No
Greater Ibadan Lagos Accra (GILA) Corridor
Benin, Ghana, Nigeria and Togo No
Lamu Growth Corridor Ethiopia, Kenya and South Sudan No
Maputo Development Corridor Mozambique and South Africa No
Nacala Corridor Mozambique, Malawi and Zambia No
Northern Corridor Kenya, Uganda, Burundi, Rwanda and the DRC No
North-South Corridor South Africa, Zimbabwe and Zambia No
SAGCOT Tanzania (plus Zambia and Malawi) Yes
The Greater Cairo Region corridors: (1) Cairo-Suez; (2) Cairo-Alexandria; (3) Cairo-Ismaïlia
Egypt No
Source: author’s elaboration.

Chapter 3 – Overview of the corridor profiles 27
in the region at three levels (continental scale, regional trade blocs and in the context of global and regional partnership platforms)26 imagine the role of economic and transport corridors in the continent.
26 A partnership or multistakeholder platform engages multiple partners across government, companies, farmers, civil society and others.
TABLE 5 Policy and institutional framework informing the development of African corridors
Institutions Regional policies and programmes
Level Institutions
Continental African Union (AU) � This is a pan-African organization
founded in 2002, whose goal is to support political and economic integration among its 54 Member Nations
� AU’s strategic framework for socio-economic development is the New Partnership for Africa’s Development (NEPAD). This manages a number of programmes in six thematic areas, including agriculture/food security, regional integration and infrastructure
� Agriculture: the Comprehensive Africa Agriculture Development Programme (CAADP) is one of NEPAD’s programmes
� Transport: the Programme for Infrastructure Development in Africa (PIDA) is led by the African Union Commission (AUC) and the NEPAD Secretariat and executed by the African Development Bank (AfDB).
� Industrial development: the NEPAD Secretariat and the AfDB put corridors at the core of their “Plan of Action for Acceleration of Industrialization”
Regional trade blocs
COMESA-EAC-SADC (CES) Tripartite � Common Market for Eastern and
Southern Africa (COMESA)
� East African Community (EAC)
� Southern African Development Community (SADC)
� The CES Tripartite has devised a regional strategy based on infrastructure and trade improvements along corridors
� The SADC Regional Agricultural Policy identifies corridors as key to achieve its specific objectives (EDCPM, 2013)
Regional and multinational partnership platforms
Grow Africa � This is a regional partnership platform
that seeks to accelerate investments in African agriculture in support of CAADP and national priorities
� It is co-convened by AUC, NEPAD and the World Economic Forum (WEF)
� Grow Africa is taking a coordinating role in all of the new corridors (e.g. agricultural growth corridors in Tanzania and Mozambique) to see that they support the goals of CAADP
WEF’s New Vision for AgricultureMultinational partnership platform
� WEF aligns with the African-led CAADP and supports the above corridors as part of its global programme
G8’s New Alliance for Food Security and NutritionMultinational partnership platform
� The New Alliance also aligns with CAADP and uses Grow Africa’s approach, which is based on WEF’s New Vision for Agriculture framework
Source: www.au.int; www.comesa-eac-sadc-tripartite.org; www.growafrica.com; EDCPM, 2013; www.weforum.org/issues/agriculture-and-food-security [last accessed August 2013].
Making economic corridors work for the agricultural sector28
Against this backdrop, African governments have recognized through the African Union (AU),27 an organization that promotes pan-African cooperation, the need for cohesive strategies for infrastructure development. As seen in Table 5, the AU acknowledges in its Programme for Infrastructure Development in Africa (PIDA) that corridor initiatives represent a promising means to improve infrastruc-ture provision, develop transport routes and, through them, catalyse multisectoral growth (African Union, 2007; Farooki, 2012). Along these lines, AU’s planning and coordinating technical body – the New Partnership for Africa’s Development (NEPAD) Secretariat – and the African Development Bank (AfDB) proposed using economic corridors as a strategy for regional integration in their Action Plan for the Acceleration of Industrialization (African Union, 2007). Launched in 2007, the plan underscored the promotion of economic or development corridors and other SDIs in Africa, highlighting two of their defining traits: (i) the focus on resource-based anchor investments that require large infrastructure interventions; and (ii) the emphasis on developing linkages to the local economy through feeder infrastructure and business linkages to SMEs (World Bank, 2010).
The AU is also making efforts to ensure that corridor initiatives in the continent are in line with the priorities highlighted in NEPAD’s agricultural programme, the Comprehensive Africa Agriculture Development Programme (CAADP). While CAADP itself makes no explicit mention of economic corridors, it recognizes the importance of collaborating with the private sector and of using regional approaches to addressing food security, which are the cornerstones of the corridor strategy. To accelerate investments in African agriculture in support of CAADP, the Grow Africa partnership platform was initiated in 2011. Grow Africa has the corridor approach as a core area of work in the United Republic of Tanzania, Mozambique and Kenya.
Another partnership platform, the World Economic Forum (WEF)28 launched in 2009 a global initiative called the New Vision for Agriculture. Several agribusi-ness multinational companies that are Industry Partners of the Forum lead this initiative,29 which aims to address three imperatives: ensuring food security; spurring agricultural production in an environmentally sustainable manner; and engendering inclusive economic growth (WEF, 2010). The initiative draws attention to innovative models for collaboration (business-led and market-based solutions explicitly linked to national and sectoral development priorities), which can spark the necessary step change needed in developing country agriculture (WEF, 2010; 2012). One of the models identified is that of agricultural corridors. Thus far, the
27 For further information about the AU, see: www.au.int [last accessed July 2013].28 WEF is “an independent international organization committed to improving the state of the world
by engaging business, political, academic and other leaders of society to shape global, regional and industry agendas”. www.weforum.org [last accessed August 2013].
29 The 28 global companies that champion the initiative at the global level are AGCO Corporation, A.P. Møller-Maersk, BASF, Bayer CropScience, Bunge, Cargill, CF Industries Holdings, The Coca-Cola Company, Diageo, DuPont, General Mills, Heineken, METRO Group, Mondelez International, Monsanto Company, The Mosaic Company, Nestlé, Novozymes, PepsiCo, Rabobank International, Royal DSM, SABMiller, Sinar Mas Agribusiness and Food, Swiss Reinsurance Company, Syngenta International, Unilever, Wal-Mart and Yara International (WEF, 2013).

Chapter 3 – Overview of the corridor profiles 29
initiative has engaged business leaders, governments, academia, civil society, and the donor and investor community to implement two country-level agricultural cor-ridor partnerships: SAGCOT in the United Republic of Tanzania and the BAGC Initiative (BAGCI) in Mozambique (WEF, 2012; Jenkins, 2012). Other agricultural development models identified by New Vision include a breadbasket30 project in Ghana; a horticultural value chain intervention in Honduras; and a transforma-tion plan for the agricultural sector in Morocco (ibid.). Currently, WEF supports multistakeholder partnerships in 11 countries across Africa, Asia and Latin America (WEF, 2013).
Another multilateral partnership aligned with CAADP and developed in col-laboration with WEF and Grow Africa is G8’s New Alliance for Food Security and Nutrition. This alliance is formed by African and G8 governments that commit public sector funding and action to enable agriculture investments, and by multi-national and African private companies that have committed to invest over US$3 billion to boost African food security. The United Republic of Tanzania was one of the original countries participating in the alliance, and Mozambique followed suit.
A similar approach is shared by the Tripartite, an umbrella institution that gathers together three sub-Saharan African trading blocs: the Common Market for Eastern and Southern Africa (COMESA), the East African Com-munity (EAC) and the Southern African Development Community (SADC). The Tripartite has devised a regional growth strategy also based on the design and implementation of infrastructure and trade interventions along corridors in eastern and southern Africa.31
3.3 LATIN AMERICAN CORRIDORS AND THEIR POLICY BACKGROUND Mapping of Latin American corridors. In Latin America and the Caribbean (LAC) there are some incipient corridor initiatives that foster integration sectoral processes. Individual country corridors are much more commonplace. Two types of corridor initiatives can be distinguished at the country level. The first is a donor-supported corridor programme that relies on the provision of business and technical advisory services to firms (mostly SMEs), producers and other actors from various sectors, comprising agriculture. The second type of corridor is spearheaded by the private sector, and emerges to extract strategic commodities (e.g. biofuel and edible oils) to international gateways.
Table 6 synthesizes the information on LAC corridors presented in this section. Among these corridors, the Peruvian case emerged as one of the most innovative and with most impact on growth and agricultural development.
Policy and institutional framework. Regional trade blocs in LAC (see Table 7) are becoming involved in the application of the corridor approach. A case in point is the Union of South American Nations (UNASUR),32 which is responsible for the
30 See Glossary.31 www.comesa-eac-sadc-tripartite.org [last accessed May 2013].32 UNASUR, established in 2008, encompasses all 12 South American countries. For further
information see: www.unasursg.org

Making economic corridors work for the agricultural sector30
implementation of the Initiative for the Integration of Regional Infrastructure in South America (IIRSA). What started as a purely transport corridor effort is now moving into a more comprehensive and multisectoral intervention that falls into the realm of economic corridors. UNASUR is responsible for smoothing and facilitat-ing that transition.
In the near future, the Inter-American Development Bank (IaDB) is expected to play an important role in advancing regional corridors, seeing that its new strategy to support competitive global and regional integration is entirely based on the concept of economic corridors (IaDB, 2011).
In recent years, regional corridor initiatives have been launched to foster inte-gration in South America, Central America and latterly in the Caribbean. These corridor programmes operate through intergovernmental collaboration for the development of software-hardware complementarities along key subregional cor-ridors (Giordano, 2012).
TABLE 6 Corridors identified in Latin America and the Caribbean
Corridor name Countries involved Cases selected
Integration of Regional Infrastructure in South America (IIRSA) corridors
1. Andean Corridor
2. South Andean Corridor
3. Capricorn Corridor
4. Paraguay-Parana Waterway Corridor
5. Amazon Corridor
6. Guyanese Shield Corridor
7. Southern Corridor
8. Central Interoceanic Corridor
9. Mercosur-Chile Corridor
10. Peru-Brazil-Bolivia Corridor
Argentina, Plurinational State of Bolivia, Brazil, Chile, Colombia, Ecuador, Guyana, Paraguay, Peru, Suriname, Uruguay and the Bolivarian Republic of Venezuela
No
Mesoamerican or Pacific Integration Corridor Belize, Costa Rica, El Salvador, Guatemala, Honduras, Nicaragua, Panama, Colombia, Mexico and the Dominican Republic
No
Caribbean Integration Corridor Caribbean countries No
PRA Corridors in Peru Peru Yes
Subnational Corridors Bolivia No
Subnational Corridors Guatemala No
Subnational Corridors Honduras No
Subnational Corridors Paraguay No
Soybean export Corridors Argentina No
Sugar-cane ethanol export Corridors Brazil No
Source: author’s elaboration.
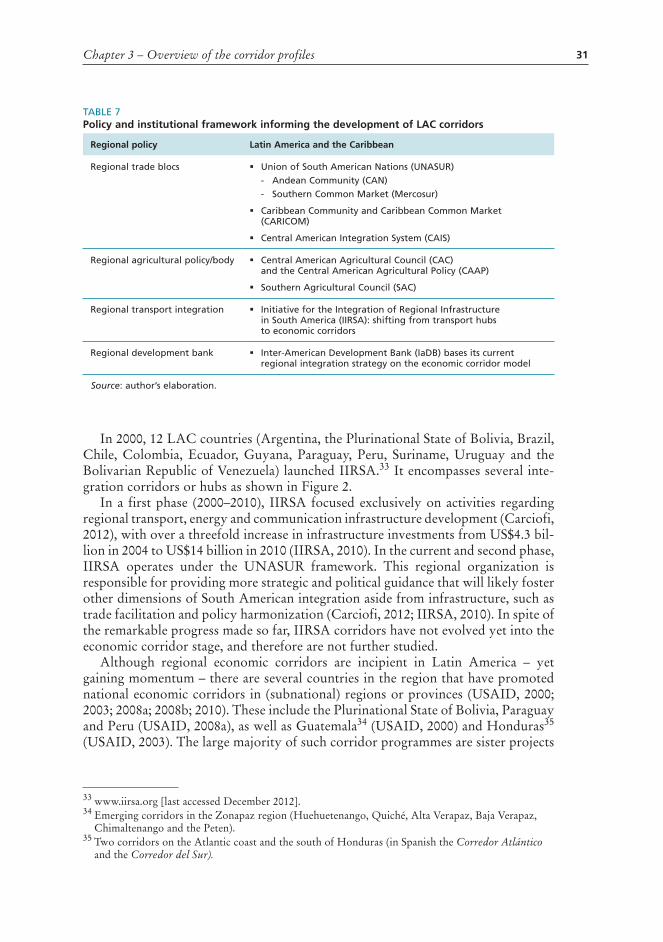
Chapter 3 – Overview of the corridor profiles 31
In 2000, 12 LAC countries (Argentina, the Plurinational State of Bolivia, Brazil, Chile, Colombia, Ecuador, Guyana, Paraguay, Peru, Suriname, Uruguay and the Bolivarian Republic of Venezuela) launched IIRSA.33 It encompasses several inte-gration corridors or hubs as shown in Figure 2.
In a first phase (2000–2010), IIRSA focused exclusively on activities regarding regional transport, energy and communication infrastructure development (Carciofi, 2012), with over a threefold increase in infrastructure investments from US$4.3 bil-lion in 2004 to US$14 billion in 2010 (IIRSA, 2010). In the current and second phase, IIRSA operates under the UNASUR framework. This regional organization is responsible for providing more strategic and political guidance that will likely foster other dimensions of South American integration aside from infrastructure, such as trade facilitation and policy harmonization (Carciofi, 2012; IIRSA, 2010). In spite of the remarkable progress made so far, IIRSA corridors have not evolved yet into the economic corridor stage, and therefore are not further studied.
Although regional economic corridors are incipient in Latin America – yet gaining momentum – there are several countries in the region that have promoted national economic corridors in (subnational) regions or provinces (USAID, 2000; 2003; 2008a; 2008b; 2010). These include the Plurinational State of Bolivia, Paraguay and Peru (USAID, 2008a), as well as Guatemala34 (USAID, 2000) and Honduras35 (USAID, 2003). The large majority of such corridor programmes are sister projects
33 www.iirsa.org [last accessed December 2012].34 Emerging corridors in the Zonapaz region (Huehuetenango, Quiché, Alta Verapaz, Baja Verapaz,
Chimaltenango and the Peten).35 Two corridors on the Atlantic coast and the south of Honduras (in Spanish the Corredor Atlántico
and the Corredor del Sur).
TABLE 7Policy and institutional framework informing the development of LAC corridors
Regional policy Latin America and the Caribbean
Regional trade blocs � Union of South American Nations (UNASUR) - Andean Community (CAN) - Southern Common Market (Mercosur)
� Caribbean Community and Caribbean Common Market (CARICOM)
� Central American Integration System (CAIS)
Regional agricultural policy/body � Central American Agricultural Council (CAC) and the Central American Agricultural Policy (CAAP)
� Southern Agricultural Council (SAC)
Regional transport integration � Initiative for the Integration of Regional Infrastructure in South America (IIRSA): shifting from transport hubs to economic corridors
Regional development bank � Inter-American Development Bank (IaDB) bases its current regional integration strategy on the economic corridor model
Source: author’s elaboration.
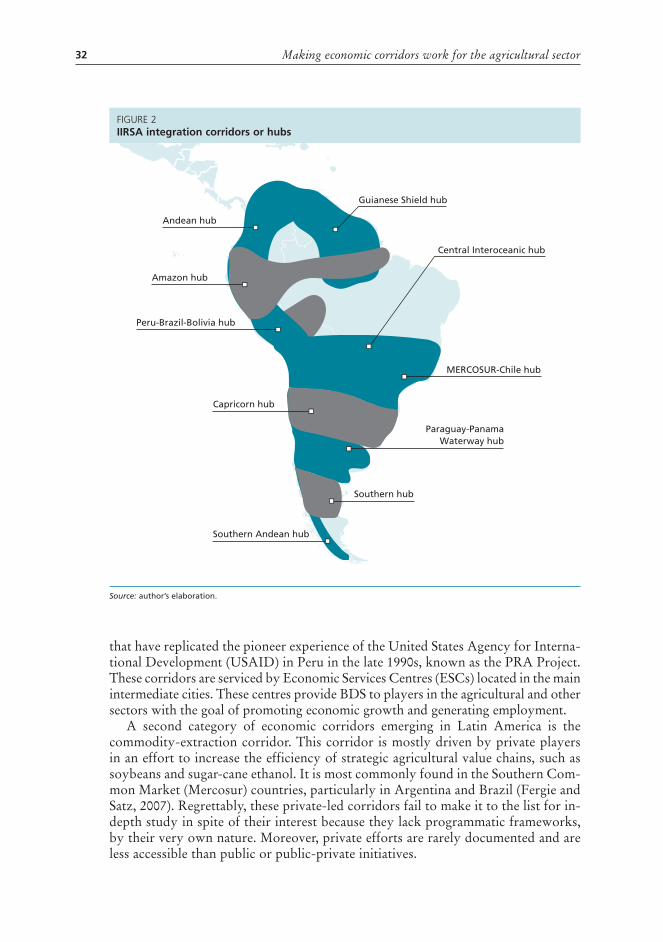
Making economic corridors work for the agricultural sector32
that have replicated the pioneer experience of the United States Agency for Interna-tional Development (USAID) in Peru in the late 1990s, known as the PRA Project. These corridors are serviced by Economic Services Centres (ESCs) located in the main intermediate cities. These centres provide BDS to players in the agricultural and other sectors with the goal of promoting economic growth and generating employment.
A second category of economic corridors emerging in Latin America is the commodity-extraction corridor. This corridor is mostly driven by private players in an effort to increase the efficiency of strategic agricultural value chains, such as soybeans and sugar-cane ethanol. It is most commonly found in the Southern Com-mon Market (Mercosur) countries, particularly in Argentina and Brazil (Fergie and Satz, 2007). Regrettably, these private-led corridors fail to make it to the list for in-depth study in spite of their interest because they lack programmatic frameworks, by their very own nature. Moreover, private efforts are rarely documented and are less accessible than public or public-private initiatives.
figure 2IIRSA integration corridors or hubs
Andean hub
Guianese Shield hub
Central Interoceanic hub
Amazon hub
Southern Andean hub
Southern hub
MERCOSUR-Chile hub
Paraguay-PanamaWaterway hub
Peru-Brazil-Bolivia hub
Capricorn hub
Source: author’s elaboration.

Chapter 3 – Overview of the corridor profiles 33
3.4 ASIAN CORRIDORS AND THEIR POLICY BACKGROUNDMapping of Asian corridors. Developing Asia has multiple and interesting experiences in both regional and national economic corridors. Within the latter category, there are urban corridors, economic corridors that try to develop the agricultural and other sectors by improving the provision of BDS, and corridors that envisage the establish-ment of complementary SDIs, for example industrial parks and SEZs. Table 8 provides at-a-glance information about the Asian economic corridors identified.
Out of these corridors, only three have been selected. Two of them are regional corridors: the ADB-supported GMS and the CAREC Corridor programmes. They have been selected for being the earliest, most comprehensive and most advanced corridor experiences in the region. Both programmes were designed to move progressively from being transport corridors (physically linking the region) to mul-timodal corridors (with the same features, but using various modes of transport);
TABLE 8Economic corridors identified in Asia
Corridor name Countries involved Cases selected
Greater Mekong Subregion (GMS) programme
1. North-South Economic Corridor
2. East-West Economic Corridor
3. Southern Economic Corridor
Cambodia, China, Myanmar, Lao People’s Democratic Republic (Lao PDR), Thailand and Viet Nam
Yes
Central Asia Regional Economic Cooperation (CAREC) Corridors
Afghanistan, Azerbaijan, China (Xinjiang province), Kazakhstan, the Kyrgyz Republic, Mongolia, Pakistan, Tajikistan, Turkmenistan and Uzbekistan
Yes
Mekong-India Economic Corridor India, Thailand, Cambodia, Myanmar and Viet Nam
No
Indonesian Economic Corridors
1. Sumatra Corridor
2. Java Corridor
3. Kalimantan Corridor
4. Sulawesi Corridor
5. Bali-Nusa Tenggara Corridor
6. Papua-Kepulauan Maluku Corridor
Indonesia Yes
East Coast Economic Region Corridor Malaysia No
Micro Enterprise Development Initiative Corridors Armenia No
Azerbaijan Business Assistance and Development Corridors
1. Guba Economic Corridor
2. Lenkoran Economic Corridor
3. Agstafa Economic Corridor
4. Zagatala Economic Corridor
Azerbaijan No
Source: author’s elaboration.

Making economic corridors work for the agricultural sector34
thenceforth to logistics corridors, i.e. corridors that, besides providing physical linkages, also harmonize the institutional framework of participating countries to facilitate the efficient movement and storage of freight, people and related informa-tion; and finally to economic corridors that are able to accelerate investments and generate economic activities along the region, including the less developed areas (Banomyong, 2008).
The third case is a national corridor initiative that took place in Indonesia. This case has been chosen for being one of the most ambitious, for having a large agricul-tural component and for embedding the promotion of industrial clusters and special economic zones in larger-scale corridor spatial planning (CMEA, 2011).
Policy and institutional framework. In developing Asia, economic corridors are primarily seen as key initiatives to promote regional integration, although some corridor schemes have a national scope, i.e. they seek to develop specific areas within a country.
ADB has been the pioneer and main supporter of subregional corridor initiatives, such as the CAREC and GMS programmes that foster integration in Central Asia, mainland Southeast Asia and southern China, respectively. Institutions associated with the corridor programmes have developed regional transport and trade facilitation strategies. In the case of the GMS corridor, there is also a regional agricultural programme, as outlined in Table 9. These subregional initiatives promoted by multilateral financing institutions and subregional organizations are embedded in the overall framework of regional intergovernmental agreements, such as those fostered by the United Nations Economic and Social Commission for Asia and the Pacific (UN ESCAP) concerning the trans-Asian networks of highways, railways and regional power trade (De, 2013; Reilly, 2013).
TABLE 9Policy and institutional framework informing the development of Asian corridors
Regional policy Asia
Regional development bank
� The Asian Development Bank (ADB) has pushed the economic corridor model as the basis for the region’s integration strategy
Regional trade blocs � Association of Southeast Asian Nations (ASEAN): AFTA and AEC
� Eurasian Economic Community (EurAsEC)
� South Asian Association for Regional Cooperation (SAARC)
Regional agricultural policy
� GMS subregion: Core Agriculture Support Programme (CASP, Phase II: 2011–2015)
Regional transport integration
� Regional cooperative agreements: Intergovernmental Agreements on the Asian highway and railway networks facilitated by UN ESCAP
� The Central Asia Regional Economic Cooperation (CAREC) Transport and Trade Facilitation Strategy (TTFS)
� GMS transport strategy
Source: author’s elaboration.

Chapter 3 – Overview of the corridor profiles 35
The regional trade blocs, and in particular the Association of Southeast Asian Nations (ASEAN),36 with its ASEAN Free Trade Area (AFTA) are increasingly recognizing the importance of economic corridors. Such corridors are seen as a stepping-stone towards establishing the ASEAN Economic Community (AEC) by 2015 (Shrestha and Chongvilaivan, 2013). Moreover, the Economic Ministers of ASEAN+637 endorsed the idea of an East Asia Industrial Corridor (EAIC) connect-ing the Mekong Region to India, as the model project for the integration of East Asia (ERIA, 2008).
Another important integration initiative in the GMS is the Ayeyawady-Chao Phraya-Mekong Economic Cooperation Strategy (ACMECS) among the GMS five. This political, economic, and cultural organization was set up by Thailand in 2003 to increase agricultural and manufacturing development, competitiveness and employment creation in the subregion (Cochrane, 2012).
3.5 SUMMARY OF ECONOMIC CORRIDORS SELECTEDFrom the regional analysis performed, four models of economic corridors emerge. Different drivers or institutions have spearheaded these models. They have deployed a range of strategies, implemented various components, proposed different govern-ance mechanisms and favoured one particular operational tool over another, creating over time their own model. The lead conveners that have shaped various approaches or models for supporting economic corridor development are the following: � ADB has supported corridors in Asia characterized by having the facilitation of
regional transport, trade and agricultural development at the core of their strategy. The most prominent examples of ADB-led corridor are GMS and CAREC.
� The PRA model supported the development of corridors in Peru, and was later replicated in a multiciplity of developing and emerging countries. The PRA model puts at its centre the establishment of centres that provide BDS.
� The agricultural corridors in Mozambique and the United Republic of Tanzania are affiliated to WEF’s New Vision for Agriculture. They use a model based on multistakeholder partnerships to foster economic development.
� Finally, other corridors are led by national governments that see in the corridor approach an opportunity to spark growth in agriculture and other key economic sectors in specific areas of their country. The important feature of this model is that the national government is the leading agent promoting corridors, and not a donor agency or international financing institution, among other possibilities.
Using this typology, Table 10 provides a bird’s eye view of the economic corridor initiatives that have been selected for in-depth analysis in the coming chapters.
Finally, it is desirable to provide a reminder of why some corridors have been eliminated in the course of this selection process. The corridors excluded belong to one of the following categories.
36 ASEAN member countries are Brunei Darussalam, Cambodia, Indonesia, Lao PDR, Malaysia, Myanmar, the Philippines, Singapore, Thailand and Viet Nam.
37 ASEAN countries plus six countries, namely China, India, Japan, the Republic of Korea, Australia and New Zealand.

Making economic corridors work for the agricultural sector36
TABLE 10Summary of corridor profiles
Type Region Name Countries involved
Key driver Year of start
Estimated budget
The
AD
B m
od
el
Asia GMS Corridor programme
Cambodia, Lao PDR, Myanmar, Thailand, Viet Nam and China (Yunan and Guangxi)
ADB, in collaboration with the European Investment Bank (EIB), IFAD (International Fund for Agricultural Development), the Nordic Development Fund38 (NDF, climate change investments), OPEC Fund for International Development (OFID39) and the World Bank
1992 US$17.8 billion (1992–2014) + US$321 million in technical assistance (TA)
Asia CAREC Corridor programme
Afghanistan, Azerbaijan, China (Xinjiang), Kazakhstan, the Kyrgyz Republic, Mongolia, Pakistan, Tajikistan, Turkmenistan and Uzbekistan
ADB, the European Bank for Reconstruction and Development (EBRD), International Monetary Fund (IMF), Islamic Development Bank (IDB), the United Nations Development Programme (UNDP) and the World Bank
(1996) 2001
US$46 billion + US$1 270 million in TA
The
PRA
m
od
el LAC PRA Project Peru USAID, in collaboration with two public and nine private partners
1998 Phase I (1998–2008) US$38 million and Phase II (2009–2014) US$23.9 million
The
corr
ido
r m
od
el o
f W
EF’s
N
ew V
isio
n f
or
Ag
ricu
ltu
re Africa BAGCI Mozambique WEF’s New Vision for Agriculture
January 2010
US$0.4 billion, of which US$20 million in a Catalytic Fund40
Africa SAGCOT United Republic of Tanzania
WEF’s New Vision for Agriculture
May 2010
US$1.3 billion, of which US$650 million (backbone infrastructure) + US$570 million (last-mile infrastructure41) + US$50 million (Catalytic Fund)
Nat
ion
ally
le
d c
orr
ido
r Asia Indonesian Corridors
Indonesia Government of Indonesia (GoI)
2011 US$398 billion, of which 10% funded by the public sector +18% by state enterprises
Source: www.gmsec.org; www.carecprogram.org; www.proyectopra.com; www.sagcot.com; www.beiracorridor.com; and www.kp3ei.go.id [last accessed August 2013].
38 The NDF is the joint multilateral development finance institution of Denmark, Finland, Iceland, Norway and Sweden. It has specialized in the provision of finance to climate change related investments since 2009.
39 OFID is the development finance institution established by the Member States of the Organization of the Petroleum Exporting Countries (OPEC) in 1976 as a collective channel of aid to developing countries.
40 The Catalytic Fund provides start-up finance for agriculture businesses incorporating smallholder farmers. The loans awarded by the Fund are either low-cost or interest-free, and repayable as soon as the investee firm attracts private finance (SAGCOT, 2010).
41 See Glossary.

Chapter 3 – Overview of the corridor profiles 37
1. Transport or logistic corridors that have still not evolved into economic corridors. 2. Urban corridors have not been selected because of the relative irrelevance of
the agricultural sector in the corridor action plan. 3. Private sector-led corridors have been excluded owing to the absence of a
programmatic framework.
3.6 FRAMEWORK PROPOSED FOR THE ANALYSIS OF ECONOMIC CORRIDORS
The corridor experiences shortlisted for further analysis will be examined using the framework depicted in Figure 3. This framework contains two clusters of actions: one leading to giving an effective strategic direction, and a second leading to an effective implementation that can be easily scaled up.
The first cluster is formed by three building blocks needed to provide an effective direction to the corridor initiative: � Leadership and alignment of the goals and visions of concerned stakeholders. This
element refers to the identification of the driver or drivers shaping the corridor, and the description of the process to develop the corridor vision and engage stakeholders around shared priorities.
figure 3A framework for economic corridors
Delivery & implementation
mechanisms
Finance& risk
management
Strategy& targeted
sectors
Leadership& aligment
Corridordevelopment
matrix
Soft interventions in the agricultural sector
Cross-sectoral soft interventions
Hard interventions
Hard & softinterventions
Effective direction
Delivery at scale
Source: WEF, 2013 (adapted with permission).
Making economic corridors work for the agricultural sector38
� Strategy deployed and targeting of sectors, industries and firms. The final goal is to have a corridor roadmap agreed upon by all the key stakeholders.
� Corridor development matrix. The roadmap is materialized in a matrix that lists the corridor projects, classifying them according to their priority, the funding source and their nature, e.g. investments and TA projects.
The second cluster groups three building blocks for delivering the corridor pro-gramme to scale. These are the following: � Finance and risk management. The lead convener(s) should mobilize resources to
be able to implement the corridor programme. Resource mobilization obviously comes before implementation, but for the sake of clarity the detailed budget and sources of funding will be described after the scope of the soft and hard interventions has been defined.
� Although soft and hard corridor interventions are clustered together in Figure 3, in the next chapters they will be split into two sections. The first section will deal with soft interventions in the agricultural sector and in cross-sectoral links. Within this section, special attention will be given to the specialization of the corridor in terms of agricultural value chains and market orientation. The second part deals with infrastructure interventions and their interface with agricultural commodities.
� Delivery and implementation mechanisms, with a focus on the institutional arrangements established among the corridor’s stakeholders.
To simplify, the framework in Figure 3 seems to follow a linear process. In reality, the process is full of loops and feedback mechanisms, especially in terms of consult-ing and bringing on board a broad range of stakeholders. Equally, the configuration of the corridor matrix is not a one-time-only activity, but a cyclical process that involves careful thought about the type of interventions that are needed in the corridor. Likewise, the initial finance and risk management arrangements of the agrocorridor need to be revised to incorporate new financiers and address any area of poor performance and respond to new contingencies as they occur. And so forth.
Every step of the way will require adjustments and will inform the previous and successive stages. Moreover, in each and every one of these stages, efforts should be made to make an explicit articulation with the agricultural sector so that the overall outcome of the economic corridor programme works for agriculture and the environment.

39
Chapter 4
Introduction to the corridor cases
This chapter presents six corridor experiences that take place in developing regions: one in Latin America, two in Africa and three in Asia. They are promoted by four players that have left an indelible mark on the way the corridor programmes are structured. These players are a regional bank (ADB), a bilateral government agency (USAID), an international multistakeholder partnership (WEF’s New Vision for Agriculture) and the Government of Indonesia (GoI). Each brings its own agenda, background and distinctive modus operandi to the corridor programme it leads.
4.1 CORRIDOR CASES AT A GLANCEBasic corridor facts and typology. These corridor initiatives are very diverse, in terms of their timeline, catchment area and population (Table 11). Some pro-grammes are multicountry, multicorridor and multisectoral, while others circum-scribe themselves to one country, one corridor and one sector. They also have very dissimilar budgets and targets for induced investments attributable to corridor interventions, considered both in nominal and relative terms (with respect to the corridor GDP).
These programmes are relatively homogeneous in terms of the components, planning and implementation tools utilized; changes in governance mechanisms; and greater involvement of other financiers from the international community and
TABLE 11Summary of corridors analysed
Year of gestation
No. of corridors
No. of countries
Population (million)
Surface (million
km2)
GDP (US$
billion)
Investments (US$ million)
Targeted sectors
BAGCI 2010 1 1 25 0.2 14.59 1 742 1
CAREC 1996 6 10 143 8.6 284.7 46 036 4
GMS 1992 3 6 326 2.6 863 8 163 9
MP3EI 2011 6 1 247 1.9 878 398 000 8
PRA 1998 15 1 197 0.5 29.99 681 –
SAGCOT 2010 1 1 48 0.3 25.2 3 370 1
Sources: www.adb.org; www.proyectopra.com; population of China’s provinces (year 2010): http://www.stats.gov.cn/english/statisticaldata/censusdata/rkpc2010/indexch.htm [last accessed in August 2013]. Other population data (year 2010): UN Department of Economic and Social Affairs, Population Division (2013) World Population Prospects. The 2012 Revision; AgDevCo and InfraCo, 2010; SAGCOT, 2011; CMEA, 2011; CAREC’s surface: ADB database, key indicators for Asia and the Pacific; World Bank data.

Making economic corridors work for the agricultural sector40
the private sector. These commonalities and differences will be brought out and explored during the course of this and following chapters.
A typology of economic corridors was presented towards the end of Chapter 3 (Figure 3), where corridors can be classified into different categories in relation to the geopolitical unit involved, the nature of the corridor champion and the sectoral focus adopted. In Table 12 this typology has been applied to the six corridor experi-ences considered.
A brief glance at Table 12 reveals that most corridor programmes appraised have a national focus, whereas two – those promoted by ADB – incorporate a regional dimension. The specific countries participating in both mono and multicountry corridors analysed are listed in Table 13.
Each programme supports a variable number of corridors that range from one to ten, as shown in Table 14.
Two programmes are monosectoral, meaning that they tie together infrastructure (transport, energy and telecommunications) and agricultural development. Accord-ingly, they receive the name of “agricultural growth corridors”. The other four
TABLE 13Countries involved in each initiative
Corridor initiative Countries involved
BAGCI Mozambique
CAREC Afghanistan, Azerbaijan, China (Xinjiang), Kazakhstan, the Kyrgyz Republic, Mongolia, Pakistan, Tajikistan, Turkmenistan and Uzbekistan
GMS Cambodia, Lao PDR, Myanmar, Thailand, Viet Nam and China (Yunan and Guangxi Zhuang provinces)
MP3EI Indonesia
PRA Peru
SAGCOT United Republic of Tanzania
Sources: www.adb.org; www.proyectopra.com; AgDevCo and InfraCo, 2010; SAGCOT, 2011; CMEA, 2011.
TABLE 12Types of corridors analysed
Geopolitical focus Sectoral focus Promoter
National Regional Bisectoral Multisectoral Donor/IFI Govern. PPP
BAGCI ¾ ¾ ¾
CAREC ¾ ¾ ¾
GMS ¾ ¾ ¾
MP3EI ¾ ¾ ¾
PRA ¾ ¾ ¾
SAGCOT ¾ ¾ ¾
Source: author’s elaboration.
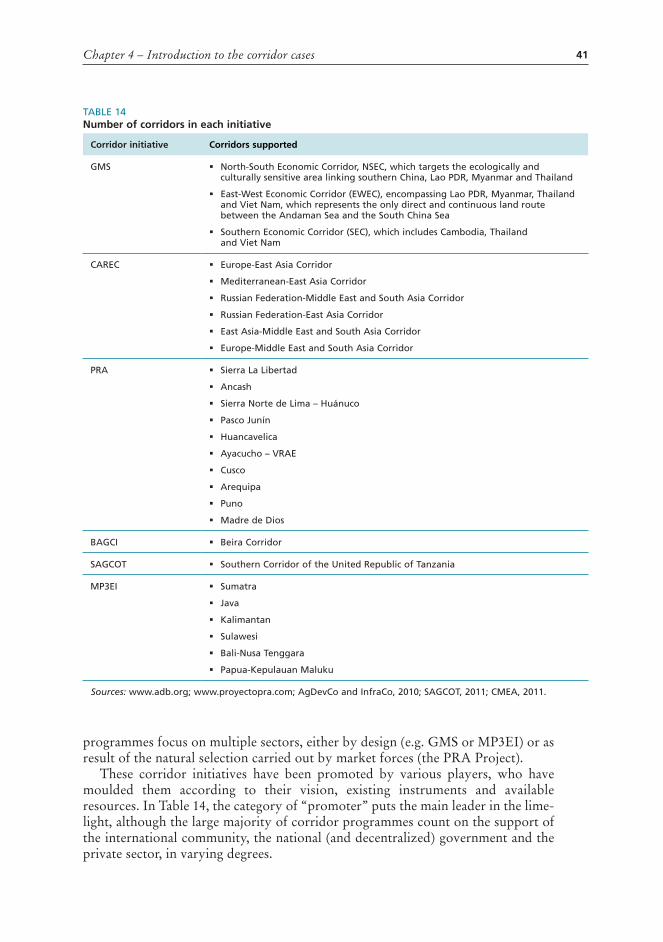
Chapter 4 – Introduction to the corridor cases 41
programmes focus on multiple sectors, either by design (e.g. GMS or MP3EI) or as result of the natural selection carried out by market forces (the PRA Project).
These corridor initiatives have been promoted by various players, who have moulded them according to their vision, existing instruments and available resources. In Table 14, the category of “promoter” puts the main leader in the lime-light, although the large majority of corridor programmes count on the support of the international community, the national (and decentralized) government and the private sector, in varying degrees.
TABLE 14Number of corridors in each initiative
Corridor initiative Corridors supported
GMS � North-South Economic Corridor, NSEC, which targets the ecologically and culturally sensitive area linking southern China, Lao PDR, Myanmar and Thailand
� East-West Economic Corridor (EWEC), encompassing Lao PDR, Myanmar, Thailand and Viet Nam, which represents the only direct and continuous land route between the Andaman Sea and the South China Sea
� Southern Economic Corridor (SEC), which includes Cambodia, Thailand and Viet Nam
CAREC � Europe-East Asia Corridor
� Mediterranean-East Asia Corridor
� Russian Federation-Middle East and South Asia Corridor
� Russian Federation-East Asia Corridor
� East Asia-Middle East and South Asia Corridor
� Europe-Middle East and South Asia Corridor
PRA � Sierra La Libertad
� Ancash
� Sierra Norte de Lima – Huánuco
� Pasco Junín
� Huancavelica
� Ayacucho – VRAE
� Cusco
� Arequipa
� Puno
� Madre de Dios
BAGCI � Beira Corridor
SAGCOT � Southern Corridor of the United Republic of Tanzania
MP3EI � Sumatra
� Java
� Kalimantan
� Sulawesi
� Bali-Nusa Tenggara
� Papua-Kepulauan Maluku
Sources: www.adb.org; www.proyectopra.com; AgDevCo and InfraCo, 2010; SAGCOT, 2011; CMEA, 2011.

Making economic corridors work for the agricultural sector42
Putting the corridors on the map. One of the most ambitious economic corridor initiatives worldwide takes place in Asia, in the Greater Mekong Subregion. The GMS corridor programme is the result of an economic cooperation and integration agreement signed in 1992 by Cambodia, the Lao People’s Democratic Republic, Myanmar, Thailand, Viet Nam (these five countries are thence referred to as GMS5) and southern China (Yunan province and the Guangxi Zhuang Autonomous Region), under the aegis of ADB.
As of December 2011, the programme had almost US$15 billion worth of investment projects completed or under implementation.42 As seen earlier, the
42 As at the end of 2011, 56 GMS priority projects worth around US$15 billion were either completed or being implemented (ADB, 2012d).
figure 4The three GMS corridors
Source: author’s elaboration based on Ishida, 2012.
Naypyitaw
Bangkok(Krung Thep)
Vientiane
Hanoi
Phnom Penh
Yangoon
Chiang Mai
Mandalay
Kunming
North-South
Nanning
Khon Kaen
Ho ChiMinh City
CAMBODIA
VIET N
AM
MY
AN
MA
R
LAOPEOPLE’SDEM. REP.
Yunnan
Guangxi
THAILAND
East-West
Southern
Corridor
National capital
Major city

Chapter 4 – Introduction to the corridor cases 43
programme comprises three corridors and nine subcorridors running across six Southeast Asian nations (Figure 4).
Already in its third decade, the GMS initiative has become ADB’s flagship exercise in regional economic cooperation, and has spawned a number of spin-offs, with CAREC being the main one.
The CAREC programme, also supported by ADB, capitalizes on the success of its predecessor. It is a partnership of ten countries (Afghanistan, Azerbaijan, the Xinjiang province of China, Kazakhstan, the Kyrgyz Republic, Mongolia, Pakistan, Tajikistan, Turkmenistan and Uzbekistan) and six multilateral institutions – ADB, the European Bank for Reconstruction and Development (EBRD), the International Monetary Fund (IMF), the Islamic Development Bank (IDB), the United Nations Development Programme (UNDP) and the World Bank – working together to promote development through regional cooperation, leading to accelerated growth and poverty reduction (CAREC, 2010; ADB, 2011f).
Spanning nearly 4 000 km across Central Asia, CAREC promotes six corridors that extend inland along historic trade routes in Central Asia, linking western China to the Caspian Sea. These corridors connect mostly landlocked members with each other and to markets beyond by providing the finance and expertise to increase mobility of people and goods across Central Asia, as seen in Figure 5.
figure 5Corridors of the CAREC programme
CAREC 1b
CAREC 1a,c
CAREC 6b,c
CAREC 2
CAREC 3
CAREC 1,2,5Baky
Aqtau
Nukus
Uchquduq
Ashgabat
KabulHirat
Dushanbe
Tashkent
Bishkek
Türkmenbashi
Balkanabat
Serakhs
Mary
Türkmenabat
Bukhoro NawoiyJizzakh
QarshiSamarqand
KunduzMazariSharif
Termez
Taraz
Osh
BekabadKhujand
Shu
Shymkent
Türkistan
Qyzylorda
Almaty
Chust
KashgarTURKMENISTAN
UZBEKISTAN
KAZAKHSTAN
TAJIKISTAN
KYRGYZSTAN
Corridor
National capitalMajor city
Source: author’s elaboration (UN Map No. 3763 Rev. 7, December 2011, Department of Field Support - Cartographic Section).

Making economic corridors work for the agricultural sector44
Besides the valuable contribution of GMS and CAREC as individual pro-grammes, it is interesting to analyse both initiatives back to back. They share origi-nators, approach and the goal of linking landlocked countries and areas to attractive regional and international markets. They also have in common that they have been designed as regional programmes that support simultaneously several interrelated corridors. Yet, at the same time, these programmes have adapted their components, sectoral and market targeting, as well as their organizational structures to their specific circumstances and needs.
The PRA Project supports several corridors that pursue economic development within the subregions of Peru (Figure 6). The number of corridors supported by the project has experienced some variations during the project’s lifetime, ranging from ten to 13. In this subnational region context, economic corridors can be qualified as natural commercial networks that link rural areas with intermediate cities that exhibit high rates of poverty coupled with potential for economic growth. PRA cor-ridors are geographically circumscribed to an administrative region or department43 and they are usually named after the principal intermediate city. By way of example, the Tarapoto corridor covers the Region of San Martín and takes its name from the city of Tarapoto, San Martín’s commercial (not administrative) capital.
The links between adjacent corridors lying along the same strategic transport routes are also taken into account. In the previous example that would imply con-sidering the linkages between the corridors of Piura, Jaén and Tarapoto, which are all located along the IIRSA North highway.
The PRA Project employs a singular approach to infrastructure development and collaboration with the private sector. The interest of the PRA case lies as well in its evolution over a long period of time, during which new partners have been added from the ranks of local governments and the private sector. Another significant factor is the programme’s penchant for private sector participation and solutions, which extends even to the Project’s institutional arrangements based on outsourcing and PPPs.
USAID has spearheaded the programme’s creation and growth since its incep-tion. The Project’s success has spawned several spin-offs all over the world, in which USAID has applied the lessons learned from this pioneer initiative in Peru.
BAGCI was launched in January 2010 with the purpose of promoting com-mercial agriculture44 in the Mozambican transport corridor of Beira. This corridor is a bimodal network (roads and railways) established along one of the major southern African transport routes. It links the port of Beira (Mozambique) to several Mozambican provinces and parts of Malawi, Zambia and Zimbabwe. The agrocorridor, although regional in scope, focuses mostly on the Mozambican provinces of Manica, Sofala and Tete, which together cover an area of 22.7 million ha. Figure 7 shows a graphic representation of the corridor. BAGCI took the form of a long-term (2010–2030) PPP between the Government of Mozambique (GoM), the private sector and the international community (AgDevCo and InfraCo, 2010).
43 Peru is divided into 25 regions or departments and one province.44 See Glossary for a definition of subsistence, emergent and commercial farmers.

Chapter 4 – Introduction to the corridor cases 45
The SAGCOT or Kilimo Kwanza corridor initiative was established as a PPP in May 2010 to promote agricultural development in the Southern Corridor of the United Republic of Tanzania. This (transport) corridor spans 930 km from Dar es Salaam to the Democratic Republic of the Congo, Malawi and Zambia. It runs along a backbone multimodal infrastructure, including roads, rail and power, anchored by the Tanzanian port of Dar es Salaam. Within the country the corridor covers approximately 28.7 million ha and is host to some nine million people. It passes
figure 6Economic corridors currently supported by the PRA Project
PA
CI
FI
C
O
C
E
A
N
Huancavelica Ayacucho
Huancayo
Ica
Cerrode Pasco
Huaraz Huánuco
Moyobamba
Pucallpa
Cajamarca
Chachapoyas
Chiclayo
Callao
Iquitos
Piura
Tumbes
Trujillo
Abancay
Cusco
PuertoMaldonado
Puno
Arequipa
Moquegua
Tacna
ECUADOR
PERU
COLOMBIA
BRAZIL
BOLIVIA
CHILE
Sierra La Libertad
Ancash
Sierra Norte Lima-Huánuco
Pasco Junín
Huancavelica
Ayacucho-VRAE
Cusco
Arequipa
Puno
Madre de Dios
National capital
Major city
La Paz
Lima
Quito
Source: author’s elaboration (UN Map No. 3838 Rev. 3, May 2004, Department of Peacekeeping Operations - Cartographic Section).

Making economic corridors work for the agricultural sector46
through an area with some of the richest farmland in Africa, running from the Republic’s coastal plains and the valleys of Kilombero and Ruaha, to the hills and valleys of the Southern Highlands and the Usangu flats (Figure 8). This area could become the country’s breadbasket, and beyond, a globally significant agricultural and livestock producer. Regionally, the corridor reaches mining industries in Zam-bia and Malawi, as well as Katanga province in the DRC (SAGCOT, 2010).
Members of the SAGCOT partnership incorporate government, multina-tional companies, the Tanzanian private sector, farmers and development partners. It strives to attract investments into Tanzania’s Southern Corridor to tap on its agri-cultural potential. As of today, this potential could be qualified as dormant, leaving a large fraction of the rural population poor and food insecure. The corridor’s action plan seeks to triple its agricultural output by bringing 350 000 ha into commercial production – most of them under irrigation – by 2030 (ibid.).
In Indonesia, the MP3EI is an example of a government-led programme to accelerate national growth using the corridor approach. This does not mean that Indonesia’s is the “average” national corridor programme. First, the nation is a major international player in terms of population and GDP and it is growing at such
figure 7The Beira Agricultural Growth Corridor
BOTSWANA
SOUTH AFRICA
ZIMBABWE
MA
LAW
I
MOZAMBIQUE
ZAMBIA
UNITEDREPUBLIC
OF TANZANIA
DEMOCRATICREPUBLIC
OF THE CONGO
Lusaka
Harare
Lilongwe
Bulawayo
Tete
Beira
Blantyre
National capital
Road
Beira agriculturalgrowth corridor
Major city
Rail and road link
Source: author’s elaboration (UN Map No. 4045 Rev. 7, November 2011, Department of Field Support - Cartographic Section).

Chapter 4 – Introduction to the corridor cases 47
high rates45 that by 2025 it may become one of the top ten global economic powers (Kuncoro, 2013). Few emerging and developing countries have that many economic and human resources to devote to this type of development initiative: Indonesia has allocated nearly US$400 billion to its corridor programme.
Second, Indonesia is the largest archipelagic country in the world. This translates into a programme in which each one of the six corridors selected cover one island, with the additional challenge of improving inter-island connectivity.
Third, the geography of the country (17 000 islands stretching for 5 200 km east to west and 1 870 km north to south) determines a high spatial concentration in the western regions, e.g. the islands of Java and Sumatra where population and economic activity (particularly manufacturing and services) tend to agglomerate,
45 As of 2012, Indonesia was the fourth most populous country in the world. The country’s real GDP growth has been growing at an average of 6 percent, 2010–2013, year on year (Kuncoro, 2013).
figure 8SAGCOT map
UNITEDREPUBLIC
OF TANZANIA
ZAMBIA
MA
LAW
I
MOZAMBIQUE
Dodoma
Sumbawanga
Tunduma
Makambako
Iringa
Mbeya
Kibaha
Mlandizi
KinonkoMorogoro
Dar es Salaam
National capital
Major city Port
Road
Railway
Electric grid Agricultural growthcorridor (indicative)
Source: author’s elaboration (UN Map No. 4045 Rev. 7, November 2011, Department of Field Support - Cartographic Section).

Making economic corridors work for the agricultural sector48
creating a wealth gap with the relatively less advanced eastern regions (ibid.). This explains why the Indonesian corridor programme focuses not only on accelerating growth but also on reducing regional inequality – and especially reducing disparities in post-conflict areas.
In spite of these peculiarities, the case of Indonesia provides useful insights into a national corridor programme driven by the government (both central and regional), without any donor support but in partnership with the private sector (Figure 9).
4.2 TIMELINE OF THE CORRIDORS STUDIEDThe varying approaches identified across the study are determined by the lead convener of the corridor and the different regional and national socio-economic contexts, but also by the length of time during which the corridor programmes have been in operation. The first economic corridor initiative in Asia, the GMS programme, started in 1992. In over two decades of existence, it has evolved from a purely transport corridor to a development or economic corridor stage. The pioneer economic corridor programme in Latin America dates back to late 1998, whereas corridors in Africa are late bloomers. It is only natural that they are at different stages of evolution. The timeline of the corridors analysed is presented in Figure 10.
Figure 10 specifies the year in which the initiatives were officially launched. However, most of the corridor programmes needed more time to take off properly. For instance, the GMS economic corridor programme formally started in 1992, but it was not until 1998 that its masterplan and first ADB loan were approved.
figure 9Indonesia economic corridors
Sumatra EC
Java EC
Sulawesi EC
Papua – KepulauanMaluku EC
Bali – NusaTenggara EC
Mega Economic Center
Economic Center
Kalimantan EC
Source: author’s elaboration.

Chapter 4 – Introduction to the corridor cases 49
Similarly, the CAREC programme went through an inception phase from 1996 to 2001, and in 2002 its institutional framework was finally established (Figure 11).
In the same way, the official date of commencement of the PRA corridor programme was 1998, but only in 2000 did it become fully operational with the establishment of the first corridor centres, as shown in Figure 12.
Corridor programmes can evolve remarkably over time. New components can be added or phased out. Corridors and subcorridors can be modified. New stake-holders can get involved and governance mechanisms may change. A good example of such fluid transition is illustrated in Box 6.
figure 11Phases of the CAREC programme
RETA initiatives StrategicFramework 2020
Set-up ofinstitutionalframework
CARECComprehensiveAction Plan
Phase I. Groundwork Phase II. Trust-building and awareness raising
Phase III. Strategic direction and focus
Phase IV. Towards economic corridors
Source: author’s elaboration based on ADB, 2012e.
figure 10Timeline of the selected corridor programmes
CAREC corridorprogramme
PRA corridorprogramme
GMS corridorprogramme
BAGCI &SAGCOT
Indonesian corridorprogramme
ADB-driven USAID-driven WEF-driven GoI-driven
Sisterprojects
1992 1996 1998 2010 2011
Source: author’s elaboration.

Making economic corridors work for the agricultural sector50
46 This encompasses the technical, financial and legal design of the concession transaction, which typically includes prequalification and evaluation criteria, cost recovery and affordability.
47 http://peru.usaid.gov [last accessed August 2013].48 http://www.planbinacional.org.pe [last accessed August 2013].
BOX 6
Evolution of the PRA corridors: a moving target
The PrA Project was put in motion in 1998 by uSAiD. The Project envisaged three compo-nents: business development, infrastructure and policy dialogue – all of which started at differ-ent times and with different implementers. The first component began with the establishment of eSCs in the corridors during 1999 and 2000. its implementation was initially the responsibil-ity of the National Confederation of Private Business institutions (CONfieP) of Peru, but it was later entrusted to an international consulting firm. The infrastructure PPP component came into being into 2003 and was active until 2007. it was implemented in close collaboration with the Ministries of Transport and finance, and with Proinversión, the Peruvian investment promotion agency in charge of implementing infrastructure concessions. The infrastructure component facilitated the concession of the port of Callao and the iirSA North highway, and accomplished the transaction design phase46 for the iirSA Central highway. Policy dialogue only became a fully fledged component in the second phase (2009 to present).
The number of corridors supported by the Project have not remained stable over time. in the first phase, it worked in 13 economic corridors in the Peruvian jungle and highlands: the ten original corridors were established in 2000 and three other corridors were added later on: Huancavelica (2002), Piura (2005) and Ancash (2007). in 2004, three eSCs (Cajamarca, Puno and Huaylas) closed down.
The opening and closure of eSCs happened for reasons both internal and external to the Project’s management. The internal reasons were a shift in strategic priorities of uSAiD/Peru’s Mission,47 which resulted in changes in intervention areas in 2003; and resource limitations, which compounded by the diversion of funds to the new and intensified corridors, provoked the closure in 2004 of the three eSCs already mentioned. Such shifting budget priorities, midway through the life of the Project, dictated that higher priority be given to: � alternative development zones (i.e. areas making the transition from coca to licit eco-
nomic activities), which translated into an intensification of activities in some segments of the economic corridors of Ayacucho, Huánuco, Pucallpa and Tarapoto; and
� border areas between Peru and ecuador, namely, Jaén – one of the original PrA cor-ridors – and Piura, where an eSC started up in 2005. These two corridors were financed by uSAiD’s Peru-ecuador Border Programme, and were associated with the ecuador-Peru Binational Commission.48
The external motivation derived from the interest expressed by private companies and public agencies in the project model, and their subsequent decision to co-fund the opening of new eSCs. The private sector made the first move. in 2002, a mining company located in Huancavelica, Minas Buenaventura, decided to finance an eSC in that corridor – the first PPP

Chapter 4 – Introduction to the corridor cases 51
anywhere in the world under uSAiD’s then-new global Development Alliance (gDA).49 in 2007, another mining company, Antamina, followed suit, investing in the establishment of a new eSC in Ancash. in November 2008, the Clinton-giustra Sustainable growth initiative (CgSgi)50 signed a cooperation agreement with the Antamina Mining fund to extend the term of operation and scope of the eSC in Ancash.
from the public sector side, the Sierra exportadora (SieX) programme51 – in operation since 2006 to encourage exports from the Peruvian highlands – also became interested in the PrA model. Peru and the united States of America had just signed a free Trade Agreement (fTA),52
and the Peruvian government saw in the PrA methodology and its good export record (uS$54 million of additional exports to the united States of America in the first phase) an excellent post-fTA initiative. rather than attempting to replicate it on its own, SieX decided to collabo-rate formally with the Project and its private partners at the time (Minas Buenaventura and Antamina) through a PPP agreement (the PrA Alliance) signed in March 2007 (uSAiD, 2008a).
PrA i ended in 2008, but uSAiD soon launched the second phase (September 2009), convening public and private actors to join this effort. The successful alliances with Minas Buenaventura, Antamina and CgSgi presented the private sector as a powerful ally in the country strategy to combat poverty. for the second phase of the PrA, uSAiD renewed its strategic alliance with PrA i partners, added six new private ones, expanded the partnership with SieX and built a new one with Lima’s regional government (ibid.).
The second and current phase (PrA ii) has tried a new approach. instead of preselecting eco-nomic corridors, it has focused on engaging strategic partners (public sector agencies and local private firms) to co-finance the operation of the eSCs. This strategy materialized in 2010 into a partnership between uSAiD/Peru, the government of Peru (goP) through its SieX programme, the government of the Lima region and nine private sector organizations. PrA ii operates eSCs in ten trade corridors to connect SMes to new markets, and identifies critical regulatory reforms to ease trade and investment, and facilitates meaningful PPPs (uSAiD, 2008a; 2008b).
in January 2012, uSAiD/Lima and SieX signed a Memorandum of understanding (MOu) to facilitate uSAiD’s transfer of the Peru PrA model into Peruvian hands as official economic development policy. The signing of this MOu sought to merge further the capacities and funding from the governments of Peru and the united States of America, as well as private sector companies to help the citizens of the highlands region overcome poverty.53
BOX 6 (Continued)
49 The Global Development Alliance (GDA) is a market-based business model for partnerships between the public and private sectors to address jointly defined business and development objectives. Alliances are co-designed, co-funded, and co-managed by partners so that the risks, responsibilities and rewards of partnership are equally shared. Private actors include private businesses, financial institutions, entrepreneurs, venture capitalists and investors; foundations and philanthropists; and other for-profit and not-for-profit non-governmental entities. Further information is available at: http://idea.usaid.gov/gp/about-gda-model [last accessed August 2013].
50 http://www.clintonfoundation.org/main/our-work/by-initiative/clinton-giustra-enterprise-partnership/programs/peru.html [last accessed August 2013].
51 www.sierraexportadora.gob.pe [last accessed August 2013].52 The Peru-United States Trade Promotion Agreement was signed in 2006 and entered into force in
February 2009. 53 www.chemonics.com [last accessed July 2014].

Making economic corridors work for the agricultural sector52
The timeline indicated in Figure 10 also denotes the phenomenon of contagion between corridor initiatives. Examples are multiple, as follows. � From GMS in the Mekong to CAREC in Central Asia: ADB initially promoted
the CAREC programme by presenting Central Asian Republics with the GMS model of regional cooperation and transport/economic corridors. The seed planted soon bore fruit, giving way to the CAREC regional cooperation programme.
� From Mozambique’s Beira Corridor to SAGCOT in the United Republic of Tanzania – in turn, these eastern African corridors were influenced by the North-South corridor initiative in southern Africa. The example of BAGCI and SAGCOT is illustrated in Figure 13.
� The Peruvian PRA Project has resulted in several spin-off corridor programmes.
This contagion also takes place at the national level. Box 6 illustrated the case of Peru, where the GoP has institutionalized the PRA model of economic corridors. Similarly, the Ministry of Agriculture of Mozambique (2010) sees the Beira Cor-ridor as the pilot for several similar agricultural corridors that it is planning to develop through its Centro de Promoção da Agricultura (CEPAGRI). The focus on agricultural corridors offers Mozambique an opportunity to fast track the development of its agricultural sector and to ensure food security, by building on existing infrastructure networks and encouraging clusters of agricultural busi-nesses to develop.
All the experiences analysed are, at least conceptually, in the “economic cor-ridor” stage. However, many initiatives still devote most of their resources to developing transportation infrastructure. For instance, as of 2012, 63 percent of GMS programmed investments had gone to infrastructure development; in the case of CAREC, this figure reaches nearly 80 percent of the overall budget. It is only natural that in the process of evolving from transport to economic corridors, the focus on infrastructure development still prevails for some time, to the detriment
figure 12PRA project timeline
1999–2000. Opening of ESCs
2008.End of PRA I
1998.Start of PRA I
2009.Start of PRA II
2002. CONFIEP »» Chemonics1st PPP with private company to fund ESC in new corridor (Huancaelica)
2007. PRA Allianceand end of infrastructure component
2012.MOU with GoPto transferthe PRA model
2014.End of PRA II
2003. Start of infrastructure component
2010. Expansion of PRA Allianceto 12 signatories
Source: author’s elaboration.
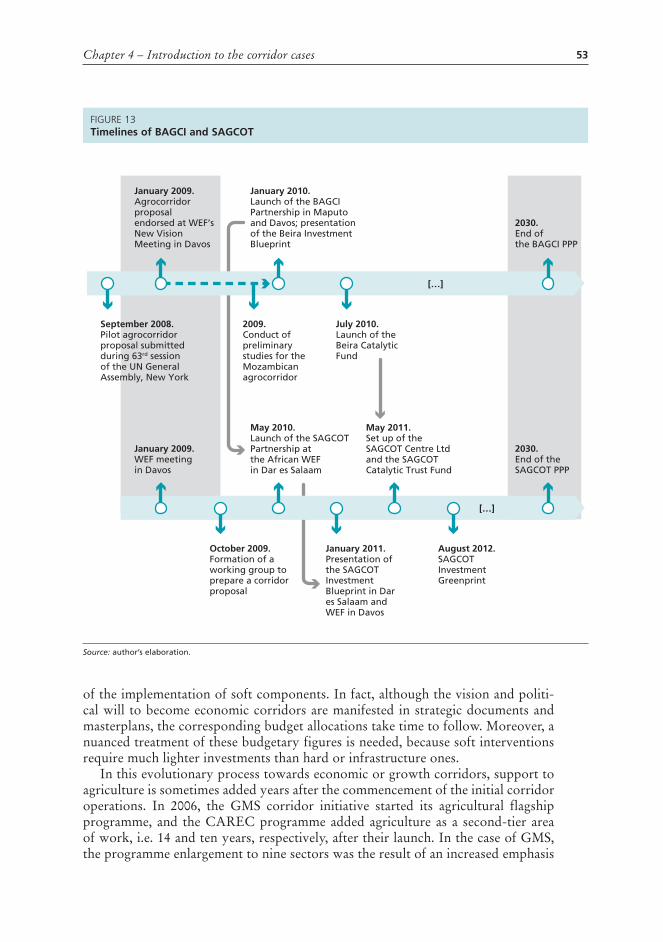
Chapter 4 – Introduction to the corridor cases 53
figure 13Timelines of BAGCI and SAGCOT
[...]
January 2009. Agrocorridor proposal endorsed at WEF’s New Vision Meeting in Davos
January 2010.Launch of the BAGCI Partnership in Maputo and Davos; presentation of the Beira Investment Blueprint
September 2008. Pilot agrocorridor proposal submitted during 63rd sessionof the UN General Assembly, New York
2009. Conduct of preliminary studies for the Mozambican agrocorridor
July 2010.Launch of the Beira Catalytic Fund
2030. End of the BAGCI PPP
[…]
January 2009. WEF meetingin Davos
May 2010. Launch of the SAGCOT Partnership at the African WEF in Dar es Salaam
May 2011. Set up of the SAGCOT Centre Ltd and the SAGCOT Catalytic Trust Fund
January 2011. Presentation of the SAGCOT Investment Blueprint in Dar es Salaam and WEF in Davos
August 2012. SAGCOT Investment Greenprint
October 2009. Formation of a working group to prepare a corridor proposal
2030. End of the SAGCOT PPP
[…]
Source: author’s elaboration.
of the implementation of soft components. In fact, although the vision and politi-cal will to become economic corridors are manifested in strategic documents and masterplans, the corresponding budget allocations take time to follow. Moreover, a nuanced treatment of these budgetary figures is needed, because soft interventions require much lighter investments than hard or infrastructure ones.
In this evolutionary process towards economic or growth corridors, support to agriculture is sometimes added years after the commencement of the initial corridor operations. In 2006, the GMS corridor initiative started its agricultural flagship programme, and the CAREC programme added agriculture as a second-tier area of work, i.e. 14 and ten years, respectively, after their launch. In the case of GMS, the programme enlargement to nine sectors was the result of an increased emphasis
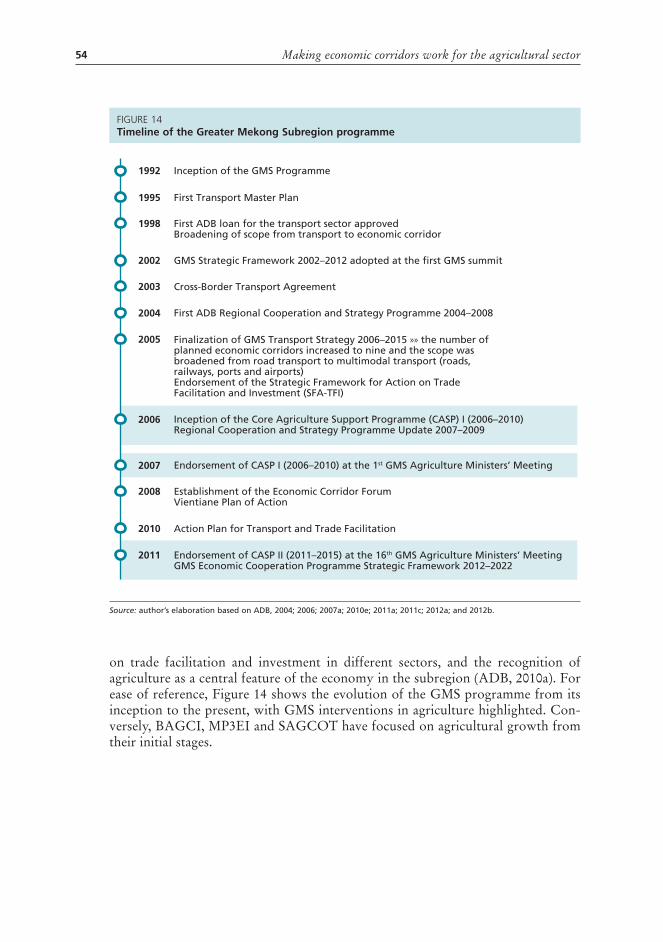
Making economic corridors work for the agricultural sector54
on trade facilitation and investment in different sectors, and the recognition of agriculture as a central feature of the economy in the subregion (ADB, 2010a). For ease of reference, Figure 14 shows the evolution of the GMS programme from its inception to the present, with GMS interventions in agriculture highlighted. Con-versely, BAGCI, MP3EI and SAGCOT have focused on agricultural growth from their initial stages.
figure 14Timeline of the Greater Mekong Subregion programme
1992 Inception of the GMS Programme
First Transport Master Plan1995
First ADB loan for the transport sector approvedBroadening of scope from transport to economic corridor
1998
GMS Strategic Framework 2002–2012 adopted at the first GMS summit2002
Cross-Border Transport Agreement2003
2007 Endorsement of CASP I (2006–2010) at the 1st GMS Agriculture Ministers’ Meeting
2008 Establishment of the Economic Corridor ForumVientiane Plan of Action
2010 Action Plan for Transport and Trade Facilitation
2006 Inception of the Core Agriculture Support Programme (CASP) I (2006–2010)Regional Cooperation and Strategy Programme Update 2007–2009
2011 Endorsement of CASP II (2011–2015) at the 16th GMS Agriculture Ministers’ Meeting GMS Economic Cooperation Programme Strategic Framework 2012–2022
First ADB Regional Cooperation and Strategy Programme 2004–20082004
2005 Finalization of GMS Transport Strategy 2006–2015 »» the number of planned economic corridors increased to nine and the scope was broadened from road transport to multimodal transport (roads, railways, ports and airports)Endorsement of the Strategic Framework for Action on Trade Facilitation and Investment (SFA-TFI)
Source: author’s elaboration based on ADB, 2004; 2006; 2007a; 2010e; 2011a; 2011c; 2012a; and 2012b.
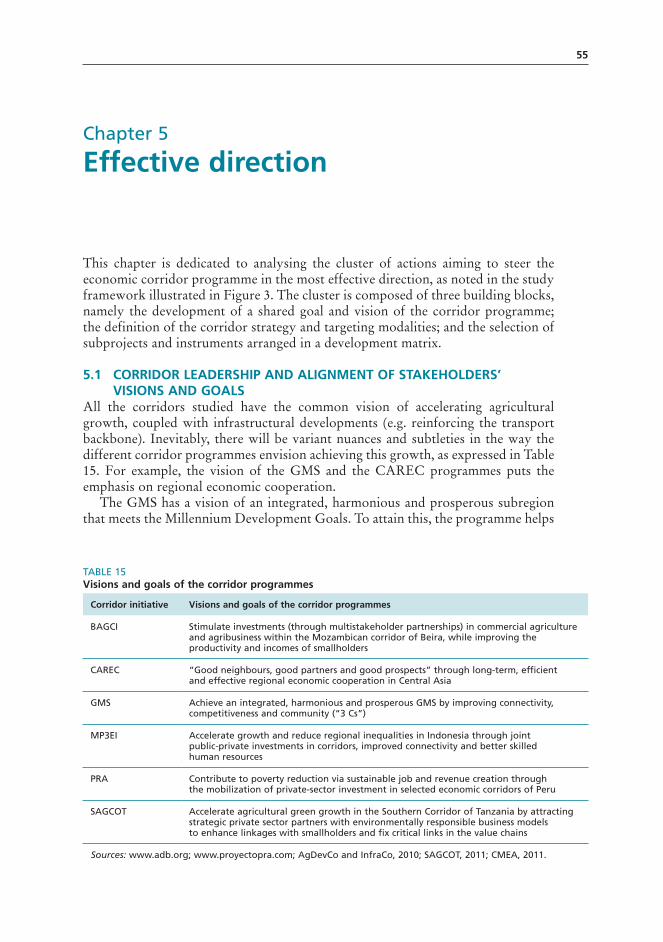
55
Chapter 5
Effective direction
This chapter is dedicated to analysing the cluster of actions aiming to steer the economic corridor programme in the most effective direction, as noted in the study framework illustrated in Figure 3. The cluster is composed of three building blocks, namely the development of a shared goal and vision of the corridor programme; the definition of the corridor strategy and targeting modalities; and the selection of subprojects and instruments arranged in a development matrix.
5.1 CORRIDOR LEADERSHIP AND ALIGNMENT OF STAKEHOLDERS’ VISIONS AND GOALS
All the corridors studied have the common vision of accelerating agricultural growth, coupled with infrastructural developments (e.g. reinforcing the transport backbone). Inevitably, there will be variant nuances and subtleties in the way the different corridor programmes envision achieving this growth, as expressed in Table 15. For example, the vision of the GMS and the CAREC programmes puts the emphasis on regional economic cooperation.
The GMS has a vision of an integrated, harmonious and prosperous subregion that meets the Millennium Development Goals. To attain this, the programme helps
TABLE 15Visions and goals of the corridor programmes
Corridor initiative Visions and goals of the corridor programmes
BAGCI Stimulate investments (through multistakeholder partnerships) in commercial agriculture and agribusiness within the Mozambican corridor of Beira, while improving the productivity and incomes of smallholders
CAREC “Good neighbours, good partners and good prospects” through long-term, efficient and effective regional economic cooperation in Central Asia
GMS Achieve an integrated, harmonious and prosperous GMS by improving connectivity, competitiveness and community (“3 Cs”)
MP3EI Accelerate growth and reduce regional inequalities in Indonesia through joint public-private investments in corridors, improved connectivity and better skilled human resources
PRA Contribute to poverty reduction via sustainable job and revenue creation through the mobilization of private-sector investment in selected economic corridors of Peru
SAGCOT Accelerate agricultural green growth in the Southern Corridor of Tanzania by attracting strategic private sector partners with environmentally responsible business models to enhance linkages with smallholders and fix critical links in the value chains
Sources: www.adb.org; www.proyectopra.com; AgDevCo and InfraCo, 2010; SAGCOT, 2011; CMEA, 2011.
Making economic corridors work for the agricultural sector56
the participating countries to improve the so-called “3 Cs”: connectivity, competi-tiveness and community. It thus enhances connectivity by investing in subregional transport corridors, and power and telecommunications interconnection systems. It boosts competitiveness through better connectivity, transport and trade facilitation, the information superhighway network, tourism promotion and the expansion of cross-border agricultural trade and investments. Finally, it fosters a greater sense of community as it serves as a framework for GMS countries to address jointly shared economic, social and environmental concerns.
The long-term vision of the CAREC regional cooperation programme is “good neighbours, good partners and good prospects” (ADB, 2012e). CAREC’s goal is to improve living standards and to reduce poverty in CAREC countries through long-term, efficient and effective regional economic cooperation.
PRA’s vision is to contribute to poverty reduction via sustainable job and revenue creation in corridor areas, with an entrepreneurial and demand-driven approach. It seeks to generate income and employment through the mobilization of private sector investment in selected economic corridors in Peru. In this process, the Project recognizes, as mentioned earlier, the function of intermediate cities in the corridor – linked to larger cities in the rest of the country – as hotspots where the demand for agricultural and food products produced in the corridor originates.
The Beira and SAGCOT corridors have common visions and goals, which makes sense, considering that they are both part of WEF’s “New Vision for Agriculture”. Their vision is to transform agriculture, through partnerships, into a highly produc-tive sector and an engine of economic growth, with major benefits for domestic food supply, export earnings, smallholder farmers and local communities. The goal of both corridors is to stimulate investments in commercial agriculture and agribusiness within the corridors, while improving the productivity and incomes of smallholders. These initiatives work towards attracting strategic private sector part-ners with environmentally responsible business models to enhance linkages with smallholders and to fix critical links in the value chains. By doing so, the corridor partners expect to transform the corridor area into a major agricultural producing and processing region and a key contributor to achieving food security.
The vision of the MP3EI is to create a self-sufficient, advanced, just and prosper-ous Indonesia (Kuncoro, 2013). Its goal is to accelerate growth and reduce regional inequalities through joint public-private investments in growth centres, improved connectivity and better skilled human resources.
Having a clear vision is not enough. This vision needs to be shared by all the corridor stakeholders. This is why one of the first steps in a corridor programme is to forge a consensus vision and to align stakeholders around shared goals and strategies. An example of such an alignment process is given in Box 7.
5.2 CORRIDOR STRATEGY AND TARGETING MODALITIES Not all the corridor experiences considered follow the same planning and targeting processes. Yet some common traits can be found. The formula for elaborating a successful corridor strategy starts with the suitable selection of geographic areas, i.e. those with adequate economic potential and capacity to develop and maintain sustainably competitive advantage over time (Thomas, 2009). But then the road forks in two directions.

Chapter 5 – Effective direction 57
BOX 7
Vision alignment among corridor stakeholders in the BAGC and SAGCOT
The idea of supporting the development of agrocorridors in Mozambique and the United Republic of Tanzania has been the result of various parallel processes gathering steam across the globe.
One such process started in 2008 at the General Assembly of the United Nations (UN) in New York. During the event, a UN Private Sector Forum was held to join efforts to pro-mote agricultural growth in developing and emerging countries. It was at the Forum that the concept of an agricultural growth corridor was first discussed, following the proposal of Yara – an international fertilizer company – to pilot an agricultural corridor programme. The idea was well received by private sector leaders and representatives of development agencies, including FAO, the International Finance Corporation (IFC) and the Alliance for a Green Revo-lution in Africa (AGRA). Some Mozambican government representatives who attended the presentation became interested in participating in the initiative (WEF, 2010). From there, a process unfolded that would see the concept launched on the Mozambican side of the Beira Corridor (BAGCI). Soon afterwards, the United Republic of Tanzania followed suit (SAGCOT).
The proposal to foster agricultural growth corridors was formally endorsed in the context of WEF’s “New Vision for Agriculture” initiative, launched in Davos in January 2009. New Vision found a perfect match in the vision of the Mozambican Government. Planning for and invest-ments in the Beira Transport Corridor have been going on since the 1960s, although much of the progress made vanished during the Mozambican civil war (1977–1992) (Meeuws, 2004). In the 2000s, with the help of donors and the private sector, the corridor reached a point where key infrastructure investments were again operational.54 Conditions then became right for the GoM to move forward to an economic corridor approach. The strong interest of multinational investors in the corridor was instrumental in building momentum (World Bank, 2010). Further to embracing the corridor approach, the GoM developed an agricultural strategy (Plano Estra-tégico para o Desenvolvimento do Sector Agrário, PEDSA) entirely in line with the New Vision, and directly made or promoted major investments in irrigation and transportation infrastructure (port and railway enhancements) along the Beira Corridor.
Mozambican-based private firms were also receptive to BAGCI. National corporations were already making large investments in the mining and agriculture sectors (through com-mercial farms and smallholder aggregation), and the port of Beira.55 These investments were geared towards increasing the volume of goods transported, and catalysing agricultural out-put in the corridor, as a result of an improved freight network and expanded cargo handling capacity (AgDevCo and InfraCo, 2010).
54 Including rehabilitation work carried out with funds from a World Bank post-conflict project to rebuild the Beira Transport Corridor in the 1990s. See: http://www.worldbank.org/projects/P001770/beira-transport-corridor-project?lang=en [last accessed July 2013].
55 The port of Beira is the natural freight port for Zimbabwe, but can also play a significant role for Malawi, Zambia, Botswana and the Congo.

Making economic corridors work for the agricultural sector58
BOX 7 (Continued)
The agrocorridor model was further concretized during 2009 through contributions from international consulting firms such as Prorustica (specialized in supporting PPP development), InfraCo (specialized in infrastructure services such as irrigation) and AgDevCo (agricultural development).56 Ultimately, this shared vision translated into the establishment of BAGCI, marked by an inaugural meeting on 20 January 2010 in Maputo. A few days later, BAGCI was internationally launched and the Beira Investment Blueprint57 presented at the 2010 WEF Annual Meeting in Davos (Kaarhus et al., 2010).
In January 2009, the Minister of Agriculture of the United Republic of Tanzania attended the WEF in Davos and expressed the interest of the country, together with Mozambique, in taking a lead role in developing agricultural growth corridors (SAGCOT, 2010). In October of that year, with efforts in Mozambique gathering steam, key players in Tanzanian agriculture met to discuss the possibility of launching a pilot agricultural growth corridor in the country. The meeting convened representatives of the Tanzanian Prime Minister’s Office (PMO), the Tanzania Agriculture Partnership (TAP), the Tanzania Investment Centre (TIC), Yara, the Nor-wegian Embassy, Norfund, the AfDB and the World Bank. Following the meeting, a working group under TAP developed a concept note, exploring the establishment of an agricultural corridor linking the fertile southern highlands to the port of Dar es Salaam, with support from national and international stakeholders. The concept note of SAGCOT, as the corridor was labelled, was presented and approved at the African WEF in Dar es Salaam in May 2010. The initiative is personally driven by the Tanzanian President and counts on the support of G20 countries (DFID, 2012).
With the SAGCOT initiative formally launched, the first step was to prepare an Investment Blueprint (presented in January 2011, exactly one year after the approval of that of BAGC), which would identify public and private sector investment opportunities and propose an investment promotion strategy for the corridor (SAGCOT, 2011). In 2012, SAGCOT launched its Investment Greenprint,58 which lays out a strategy for implementing “Agriculture Green Growth” in the corridor to intensify agriculture sustainably for both smallholder and com-mercial agriculture, while conserving the natural resource base. In May 2011, the two main institutions of the partnership – the SAGCOT Centre and the SAGCOT Catalytic Trust Fund – were established.
56 InfraCo is a project development company founded in 2005 to provide infrastructure development services. It is donor-funded (e.g. British, Netherlands and Swedish cooperation) but privately managed (Kaarhus et al., 2010). AgDevCo is a not-for-profit company operating in sub-Saharan Africa that invests “social venture capital” to create commercially viable agribusiness investment opportunities. Source: www.agdevco.com [last accessed July 2013].
57 This type of blueprint is an investment roadmap for the corridor that comprises an indicative long-term financing plan and a short-term project portfolio, with both “fast-track” and “ready to go” investment opportunities (Kaarhus et al., 2010).
58 See Glossary.
Chapter 5 – Effective direction 59
One direction is to select sectors or industries. Two types of industries could be targeted: those with strong current performance, which will yield near-term economic benefits, but also those with high future potential to ensure, to the extent possible, a healthy diversification of corridor activities in the medium and long term. The subsequent step is to identify within the corridor area, growth centres or nodes of high economic density where dynamic companies, their suppliers and their customers are geographically concentrated, forming clusters with sustainable com-petitive advantage, grounded both in current and potential economic performance.
Having completed the selection process of potentially strong industries and identified their regional groupings, it is time to assess the status of the major con-nective infrastructure linking clusters by roads, railroads and air connections and, if needed, study the feasibility of completing, complementing or upgrading such infrastructures. Afterwards, corridor developers might ask themselves about the growth potential of adjacent areas and which other economic activities could be promoted along the corridor. This option has been that favoured by all the corridor programmes, except for the PRA.
The latter programme decided to go down the second road, i.e. selecting “star connecting firms” according to certain criteria and a rule for ensuring the effective-ness of the intervention, the 5:1 rule. This rule means that the project engages in a TA intervention only when it is reasonable to expect a client’s sales to augment at least five times the cost of the assistance in question (USAID, 2008a; 2008b).
The selection of star firms eventually reveals the competitive structure of the corridor, which usually confirms the findings of prefeasibility studies carried out to
BOX 7 (Continued)
As a result, the Beira and SAGCOT corridors have several common traits. They started only months apart, driven by the same champions. They both have a focus on the selected sector (agriculture) and geographic areas (growth poles and clusters), coupled with enabling infrastructure improvements. Essentially, agribusiness and mining are the two sectors driving growth and competing somewhat over the same resources and services (e.g. logistics). The emphasis of both corridors on agriculture is hence not surprising, especially considering that they have plenty of fertile arable land available, yet a low level of commercial agriculture. In addition, these corridor initiatives have a similar organizational arrangement consisting of multilateral partnerships that include the public and private sectors, development partners and civil society. They also utilize the same tools to pilot innovative economic development models: investment blueprints, Catalytic Funds59 and the implementation of agricultural sub-projects grouped in selected agrobased clusters. Last but not least, they are both aligned with their respective national agricultural strategies, PEDSA in Mozambique and Kilimo Kwanza or “Agriculture First” in the United Republic of Tanzania.
59 See Glossary.
Making economic corridors work for the agricultural sector60
assess the competitiveness of sectors or industries. This means that if these studies were adequately conducted, there should not be much difference between the tar-geting in the first (star sectors and industries) and second (star firms’) options. The difference, as already explained, would be the possibility to discover out-of-the-box business opportunities using the star firms’ model, which relies on the natural selection of products/value chains/sectors, as opposed to an ex ante targeting. For further information on the PRA strategy see Box 8.
Regardless of the path taken in the previous point, the subsequent step consists of steering both public and private investment into the corridor areas targeted for development. The key is to ensure that limited public resources are not distributed so widely – something that might happen for political reasons, e.g. to reach a wider base of citizens – that they fail to have the intended impacts. On the contrary, these resources should rather be focused on helping the corridor to achieve its maximum economic potential (Thomas, 2009). Finally, countries could move sequentially, learning from successful corridors in one region or (sub)sector before spreading investments to others.
Sectoral targeting. The corridor programmes studied have selected a variable num-ber of sectors, as noted in Table 16. The exception was the PRA Project that decided to support star connecting firms, as already mentioned, but ended up supporting mostly agribusiness companies.
Table 16 shows that BAGCI and SAGCOT focus primarily on the agriculture sector, coupled with infrastructure improvement. Agribusiness is also the primary recipient of support from the PRA Project. The GMS cooperation programme involves coordinated efforts in agriculture and eight other targeted sectors in order to reduce business costs and facilitate the start-up and operation of business ventures.
TABLE 16Sectors prioritized by the corridor programmes
BAGCI CAREC GMS MP3EI PRA SAGCOT
Agriculture ¾ ¾ ¾ ¾ ¾ ¾
Infrastructure ¾ ¾ ¾ ¾ ¾ ¾
Transport ¾ ¾ ¾ ¾ ¾ ¾
Energy ¾ ¾ ¾ ¾ ¾ ¾
Telecommunications ¾ ¾
Other sectors
Trade ¾ ¾
Environment ¾ ¾ ¾
Tourism ¾ ¾ ¾
Others ¾ ¾
Source: author’s elaboration. Note: ¾ priority sector; ¾ second-tier area.

Chapter 5 – Effective direction 61
BOX 8
The development of a corridor strategy: the case of the PRA Project
The PRA Project is markedly business oriented but, paradoxically, its origin can be traced back to Peru’s mid-1990s food security strategy. The Peruvian Government worked closely with USAID between 1994 and 1997 to develop and implement a national food security and anti-poverty strategy, with poverty being the main cause of food insecurity. The strategy developers concluded that Peru’s rising poverty levels at the time called for a radically differ-ent approach, and hence departed from conventional anti-poverty or food security strategies in four ways (Riordan et al., 2003).
1. The point of departure was the explicit recognition of the link between intermedi-ate cities, growth and poverty reduction (USAID, 2008a). The strategy developers maintained that the solution to the problem (poverty) did not necessarily lie close to the place where the problem was (rural areas). They believed that growth radiates from intermediate cities or regional centres and extends to the economic corridors between these centres, which in turn are linked to large cities or megacities (Lima). Consequently, they recommended spatial prioritization to channel scant public resources into selected economic corridors (linking intermediate cities) that were stricken by poverty but that had economic potential (ibid.).
2. The second element was the perception that the Peruvian Government could not do it all, and that market forces could significantly contribute to poverty reduction. From this premise, the strategy traced out a number of directions for public policy to part-ner with the private sector in order to take advantage of its ability to link poor people with markets and create job opportunities (ibid.).
3. The third innovative feature was the combination of two types of interventions (social and productive) that work in tandem, despite having different goals (equity versus efficiency concerns), approaches and implementers. The social interventions envis-aged required targeted investments in social infrastructure across the entire country, using poverty maps and related tools. On the contrary, productive interventions were to be exclusively carried out in selected economic corridors. This latter category includ-ed both hard investments in supporting public infrastructure (roads, energy and ports) and soft investments such as publicly financed (or donor-financed) but privately run business promotion centres to reduce transaction costs in economic corridors (ibid.).
4. Finally, the strategy recommended considering an outsourcing model to provide busi-ness services in the corridors and improve productive infrastructure, expanding the use of concessions and competitive performance contracting (ibid.).
Such an unconventional, rather controversial approach was put in motion in 1998 by USAID in the PRA Project. To achieve the objective of poverty reduction, the Project envisaged an interrelated set of interventions concerning the provision of BDS, infrastructure development and policy dialogue.

Making economic corridors work for the agricultural sector62
BOX 8 (Continued)
To implement the business development component, the first step was to establish both functional and geographic limits. As per design, the PRA Project became organized geo-graphically in economic corridors. All of Peru was mapped into 24 economic corridors that were ranked according to two criteria: economic potential, and the prevalence of extreme and moderate poverty. Given budgetary and design conditions, the project team decided to work in the top ten ranked corridors, namely Ayacucho, Cajamarca, Cusco, Huancayo, Huá-nuco, Huaylas, Jaén, Pucallpa, Puno and Tarapoto (USAID, 2008a; 2008b).
Within these corridors, the PRA Project favoured a transaction-focused approach based on “star connector firms”. The Project intentionally runs counter to mainstream development approaches that are based on “star products” or “star sectors” (i.e. product or sectoral/industrial targeting). Therefore, within the corridors, the Project was open in principle to all licit economic sectors and industries. However, an ex post analysis shows that it is primarily an agricultural value-chain project.
Once the geographic scope had been delineated, it was time for functional targeting. The decision fell on business and infrastructure development. The first function was to be achieved through the provision of non-financial BDS (facilitating access to information, com-mercial brokering and policy dialogue) to reduce market transaction costs. To provide these services, the project established regional ESCs that assisted individual client firms to overcome specific impediments to business expansion. Through these ESCs, the project linked buyers with proven demand to local suppliers and lifted producer bottlenecks in meeting buyer requests. By doing this, it generated rural income and employment.
The second function was based on the facilitation of public investment with the highest economic return, such as roads and electricity. These investments were selected according to their capacity to stimulate private sector economic activity, and consequently employment generation. The infrastructure component, rather than directly funding and implementing the development of such infrastructure, provided comprehensive TA to the GoP in order to develop and implement a PPP model for innovative infrastructure concession in the corridors.
The above process determined a corridor strategy defined by the following elements: � the combination of business services offered by privately managed centres that provide
non-financial BDS to potential investors and existing enterprises in economic corridors, and the provision of TA for developing high-impact infrastructure improvements (high-ways and ports) through PPPs;
� strict compliance with the Project’s “orders first” mantra – which encapsulates a practical market-pull approach – that subsequently triggers its engagement in supply-push activities;
� continuous performance monitoring that zeroes in on three indicators (additional sales, employment and productive investments) with monetary incentives for staff linked to the achievement of targeted sales and investment values (employment is calculated as a function of additional sales);
� adoption of an outsourcing model for the overall implementation contractor (USAID) and the ESC operators (mostly NGOs, but also consulting companies and universities), thus allowing a high degree of flexibility.

Chapter 5 – Effective direction 63
The priority sectors envisaged are agriculture, energy, environment, human resourc-es development, investment, tourism, telecommunications, transport infrastructure and transport and trade facilitation. Specific long-term plans have been developed for most of the sectors, as will be explained in section 5.3. CAREC has four priority sectors: transport, trade facilitation, trade policy and energy.60 From 2001 to 2012, CAREC invested more than US$21 billion in almost 140 CAREC-related projects in these core sectors (ADB, 2011f). The Indonesian corridor programme has identified eight sectors as the focus of national development, inter alia, agriculture, mining, energy, industrial, marine and telecommunications. Within these sectors, the programme encourages large-scale investment in 22 primary activities, of which seven belong to extended agriculture, namely food and beverages, palm oil, rubber, cocoa, animal husbandry, timber and fisheries (Strategic Asia, 2012).
Whether by design or not, all of them support agribusiness development but they do so in three different ways. The first is to have agriculture as priority or core sector – either the “only one” (i.e. agriculture plus infrastructure) or one of many. Examples of the former type of corridor are BAGCI and SAGCOT, given that they target agriculture, together with the transport and energy sectors. Cases in point of multisectoral corridors targeting agriculture are the GMS and Indonesian corridors programme.
The second approach is that employed by the CAREC programme, in which agriculture is a second-tier sector, as shown in Figure 15. Being a second-tier area implies that corridor interventions in agriculture are the following: � Unlike first-tier initiatives, they are not sector wide. Rather, they are limited to
highly focused projects, which are smaller, less sensitive, but quick yielding and conducive to building confidence and mutual trust among CAREC countries.
� The focus on project implementation is accompanied by additional ADB support to capacity development of national and regional institutions in defining regional cooperation projects, mobilizing funds and catalysing stronger coordination across CAREC ministries of agriculture. Agricultural interventions in this scheme are principally designed to support efforts in core or first-tier areas and notably (agricultural) trade facilitation.
� These areas are subject to fund availability, principally from other support-ers, as opposed to core areas of work that are funded by the champions of the corridor programme. In fact, second-tier activities usually involve new development partners.
� These interventions are subject to different governance mechanisms from those regulating core areas of work. For example, CAREC coordinating committees required for priority sectors are not necessary for second-tier activities; instead, the CAREC Secretariat should monitor and report on them. Furthermore, the dominant mode of cooperation in agriculture has so far been building on knowledge and information exchange through the CAREC Institute.61 This
60 http://www.carecprogram.org/index.php?page=carec2020-strategic-framework [last accessed July 2013]; investments as of December 2012. The accumulated estimated investment is expected to amount to US$46 billion by 2014.
61 www.carecinstitute.org [last accessed July 2013].
Making economic corridors work for the agricultural sector64
institute is a virtual information hub that acts as a provider of training and of Web-based information in core and second-tier sectors. The CAREC Institute is in charge of conducting analytical work to determine how the core areas could be enhanced by special initiatives in agriculture and, on this basis, provides guidance to CAREC countries willing to initiate cooperative activities (special projects) in the agricultural sector, according to a set of mutually agreed principles and criteria.
The third approach is a de facto targeting of the agribusiness sector, as in the PRA corridors. The PRA Project favoured the principle of “star connector firms” instead of targeting core or star prioritized sectors, value chains or products. However, this selection process ended up by pointing at firms operating mainly in the agricultural sector, as predicted by the initial feasibility studies that identified agriculture as one of the sectors with greatest economic potential in the corridors.
When following the first approach, interventions to promote agricultural growth within the boundaries of a corridor are planned comprehensively and bundle up together to generate synergies and maximize impacts. The hallmark of an agrocor-ridor – and, by the same token, of the agricultural component of an economic corridor initiative – is the concentration and cross-linking of resources62 around a long-term plan to promote sustainable growth throughout the corridor (Milder et al. 2012; Kuroiwa, 2012). For example, the blueprint of the SAGCOT corridor (SAGCOT, 2011) states that the objective of the corridor initiative is to “establish southern Tanzania as a regional food exporter [...] by concentrating and linking agri-cultural investment from the public sector, development partners, and Tanzanian and international investors [...] (around) a targeted strategy and realistic action plan to deploy resources, engage partners, and coordinate activities and investments” (Milder et al., 2012; p. ii).
62 These resources should be enough to facilitate a critical mass in a physical and economic sense.
FIGURE 15First- and second-tier system of the CAREC programme
CAREC Programme Strategy 2020
CAREC’s priority sectors
Energy Tradefacilitation
Transport Tradepolicy
CAREC’s second-tier areas
Agriculture Environmentalmanagement
Control ofcommunicablediseases
Businessdevelopment
Source: author’s elaboration based on ADB, 2012e.

Chapter 5 – Effective direction 65
Pillars of the corridor programmes. The six corridor programmes have a varying number of pillars, as shown in Table 17, but they all have three in common: infra-structure development, investment promotion and business development.
Apart from these common elements, each corridor programme has a different number of pillars and nuances in the way the pillars are approached. It is worth examining the various programmes in detail (Box 9). The GMS programme, for example, has five pillars concerning: (i) the strengthening of infrastructure linkages through a multisectoral approach; (ii) facilitation of cross-border trade, investment and tourism; (iii) enhancement of private sector participation and competitiveness; (iv) development of human resources and required skill competencies; (v) protection of the environment and promotion of the sustainable use of shared natural resources (ADB, 2011a).
The CAREC programme has four pillars, as shown in Figure 16. The first pillar refers to regional infrastructure networks, and notably the development of a seam-less network of six transport corridors – the programme’s backbone – including some 3 600 km of road building and improvements, almost 2 000 km of railway track, the upgrading of ports and border crossings, and also better energy security, efficiency and distribution (ADB, 2011f). The second pillar provides an integrated framework for fostering trade, investment and business development, laying the ground for subsequently building economic corridors. It would be the equivalent of merging pillars two and three of the GMS programme. The third pillar is knowledge transfer and capacity building to increase the capacity of member countries for designing and implementing mutually beneficial regional initiatives, as well as to form a cadre of officials skilled in regional cooperation processes. The fourth pillar pertains to the provision of regional public goods to address transboundary issues,
TABLE 17Sectors prioritized by the corridor programmes
BAGCI CAREC GMS MP3EI PRA SAGCOT
Infrastructure linkages/connectivity ¾ ¾ ¾ ¾ ¾ ¾
Trade facilitation ¾ ¾
Investment promotion ¾ ¾ ¾ ¾ ¾ ¾
Business development/private sector competitiveness
¾ ¾ ¾ ¾ ¾ ¾
Policy dialogue ¾ ¾ ¾
Development of human resources ¾ ¾
Environmental management ¾
Capacity building/organizational strengthening
¾ ¾
Provision of regional public goods to address transboundary issues
¾
Source: author’s elaboration, based on www.adb.org; www.proyectopra.com; AgDevCo & InfraCo, 2010; SAGCOT, 2011; CMEA, 2011.
Making economic corridors work for the agricultural sector66
such as environmental protection, natural resources management and the control of transboundary animal diseases (CAREC, 2006).
The configuration of each pillar responds to a logic or rationale that is implicit in the corridor strategy. The case of CAREC is given as an example. Box 9 explains the rationale of the pillars that sustain the programme.
BAGCI has three pillars in addition to the implicit strengthening and expansion of the Beira Transport Corridor, as depicted in Figure 17 (AgDevCo, 2012; BAGC, 2012). The first pillar deals with institutional strengthening and corridor governance.
FIGURE 16Pillars of the CAREC programme
CAREC corridor programme
Improvement of regional infrastructure networks
Regional integrated framework for fostering trade, investment and business development
Knowledge transfer and capacity building for implementing regional initiatives
Provision of regional public goods to address transboundary issues
Source: author’s elaboration based on CAREC, 2010; and ADB, 2011f.
BOX 9
Rationale behind the design of the corridor programme pillars
The four pillars of the CAREC programme facilitate the transformation from transport to economic corridors across the region. This transformation is measured under the CAREC programme according to the evolution of “nodes” along the corridor. The programme distinguishes three distinct phases consistent with the progress achieved in and among the nodes. � The development of connective infrastructure among the nodes, i.e. transport cor-
ridors. The second pillar is instrumental in doing this. � The economic development of corridor nodes through soft and hard infrastructural
support. These nodes can be: (i) commercial nodes (i.e. where major business activ-ity is carried out); (ii) border nodes, where cross-border movements of goods and services occur; (iii) gateway nodes, where a corridor ends, and the entry and exit points to the corridor are located; and (iv) interchange nodes, where two or more corridors intersect.
� The establishment of soft links among nodes. It is through the spatial interaction among corridor nodes that new opportunities for trade and investment are cre-ated, making the corridor function as an economic space. The third and fourth pillars of the CAREC programme contribute to improving interaction among cor-ridor nodes.
Source: CAREC, 2011.

Chapter 5 – Effective direction 67
The second component supports agribusinesses with inclusive business models to invest in prioritized clusters of high agricultural potential with good existing backbone infrastructure. This component facilitates commercial opportunities for national firms but also for sophisticated global companies that can catalyse the upgrade of agricultural supply chains in the corridor. BAGCI foresees that this combination of global investors (with their technological, financial and manage-rial capabilities), together with the regional expertise of domestic players, will be conducive to SME growth (AgDevCo and InfraCo, 2010; WEF, 2010). The business opportunities identified in the corridor are a mix of “brownfield” and “greenfield” investments.63 In this sense, BAGCI has understood the importance of supporting fast-track brownfield developments and other quick-win agribusiness projects to demonstrate success on the ground. The assumption is that once the wheels have been put in motion, the existence of a critical mass of businesses, coupled with focused planning and rapid implementation in these locations, will attract other agribusiness investors.
The third component encompasses promoting policy dialogue and improving the business environment. The latter point requires the removal of specific business con-straints that prevent the development of the selected agrobased clusters, including the rather suboptimal provision of public services such as agricultural extension.64
BAGCI’s strategy to improve the agribusiness climate involves partnering with other stakeholders to address policy constraints, such as the accessibility of land to investors and the fruit fly problem65 affecting investments in the corridor (BAGC, 2012). BAGCI has also supported the GoM in the revision of the seed and fertilizer regulations approved in 2012 (DFID, 2013).
SAGCOT envisages two pillars: (i) support the development of agricultural clusters in the corridor; and (ii) policy dialogue to ensure an enabling environment for the agribusiness sector. The first pillar resembles the corresponding pillar of BAGCI. The pillar on policy dialogue reflects the priorities of the Government of
63 See Glossary.64 See Glossary.65 BAGC has a partnership with the Provincial Directorate of Agriculture in Manica of the
Mozambican Ministry of Agriculture to support monitoring the incidence of fruit fly.
FIGURE 17Components of the Beira Corridor programme
BEIRA corridor programme
Organizational strengthening and
corridor governance
Support to investors with inclusive business modelsin prioritized agricultural clusters
Policy dialogue to improve agribusiness
environment
Agricentre CatalyticFund
Smallholderfacility
Source: author’s elaboration based on AgDevCo, 2012; and BAGCP, 2012.
Making economic corridors work for the agricultural sector68
the United Republic of Tanzania (GoT). Special task forces have been established to address specific investor issues regarding land leasing (through regional land banks), export regulations, taxation and imports of seeds, other inputs and agri-cultural machinery. Private sector participation in this dialogue is ensured by the SAGCOT Centre, which coordinates with the Tanzania Private Sector Foundation, the Agricultural Council of Tanzania and other private sector organizations that bring together local and international investors to guarantee that priority issues for the corridor are addressed at the highest levels.
MP3EI unfolds a development strategy with three interrelated pillars. The first pillar regards the development of existing and new growth centres along economic corridors through the promotion of clusters and SEZs, conforming to the core competencies of each region. This component seeks to optimize agglomeration advantages, explore regional strengths and reduce the spatial imbalance of economic development throughout the country. The GoI provides incentives to SEZ firms, such as favourable taxation and customs policies, labour regulations and licensing developed in consultation with the private sector. The second pillar refers to the improvement of connectivity between the centres of economic growth (major cities) and main clusters supported by improved infrastructures including roads, seaports, airports, power, water and other related infrastructures. Connectivity is understood in a triple sense: intracorridor (or intra-island) connectivity, inter-economic-cor-ridor connectivity and international trade logistics or global connectivity, notably with other ASEAN countries. The last pillar points at the investment in human resources – through training, research and development (R&D) and technology transfer – to strengthen the capacities required to support the development of cor-ridor initiatives (CMEA, 2011).
5.3 PROCESSES AND TOOLS FOR PLANNING AND LAUNCHING CORRIDOR PROGRAMMES
Each corridor intervention analysed has as its starting-point the elaboration of a masterplan or blueprint that shows the development path for the corridor and establishes the contributions and responsabilities of each stakeholder involved. The ultimate goal of the agribusiness components contained in the masterplan or strategic framework (SF) is to promote agriculture-driven economic growth along the corridor (SAGCOT, 2011; Milder et al., 2012). In the case of the WEF-led cor-ridors, detailed blueprints assessing the feasibility of the agricultural corridors and modelling the development of agricultural activities were prepared. The approval of the SAGCOT and BAGCI blueprints marked the beginning of corridor activi-ties. SAGCOT also prepared a greenprint to promote green growth and minimize potential negative environmental impacts. Likewise, Indonesia laid its corridor strategy in its masterplan (MP3EI).
ADB-led corridors have long-term SF documents as reference points to guide their interventions. For example, the GMS programme has ten-year plans, i.e. the GMS Strategic Frameworks 2002–2012 and 2012–2022 (the latter document is described in Box 10). For further information, see documents in the bibliography (ADB, 2011a; 2012e). Such frameworks function as roadmaps that provide the stakeholders with the general layout of the programme strategy and with a multi-year implementation plan. They are also pivotal to present a “business plan” for the

Chapter 5 – Effective direction 69
corridor(s) that can be utilized to persuade other actors to co-finance specific areas of work or activities detailed in the plan.
The SFs of both GMS and CAREC are operationalized through medium-term action plans. They have also developed specific long-term plans for each flagship programme or priority sector, which are well aligned with the overall framework contained in the medium- and long-term plans. For instance, the GMS programme
BOX 10
The GMS Strategic Framework 2012–2022
The GMS Strategic Framework 2012–2022 strives to adopt fully the regional economic corri-dor approach, which implies promoting “multisector investments to foster economic corridor development, stronger cross-sectoral linkages, more local stakeholder involvement [...]”, as well as more effective monitoring and evaluation (ADB and ADBI, 2013; p. 58).
The framework proposes widening and deepening the GMS corridors in three ways. � Adding “area development plans” through a variety of measures, namely: promoting
agribusiness investments; developing market and storage infrastructure; providing incen-tives to industrial development; enhancing business climate and capacities for SMEs; increasing rural-urban linkages by developing “green” value chains; enhancing resilience of investments by using climate friendly technologies; and investing in tourism infrastruc-ture. The emphasis of these measures is on facilitating environmentally and socially sound trade and investment initiatives in the newly connected areas, as a means to generate income, employment and more intraregional trade.
� Finalizing incomplete infrastructural linkages and funding multimodal transport initiatives with regional impact (railways, water and air transportation). Extending the network of feeder roads linked to the main road arteries is also contemplated.
� Enhancing regional transport and trade facilitation to reduce national barriers. This includes the development and strengthening of logistics companies and the standardiza-tion of custom procedures in the corridors. This strategy recognizes the critical role that the private sector, and particularly logistics firms, can have in reducing costs and increas-ing the flow of intermodal exchange of goods and services across the corridors (ADB, 2010e; 2011a; 2011c; 2012a; 2012b).
To underpin such economic corridor development, the new SF introduces two innovative elements. The first element is a second-generation project pipeline with increased TA to implement the action plan in agriculture and other targeted sectors. The second element is a revamped approach on coordination and capacity development, based on the understand-ing that a “business as usual” path is not an option for going forward. The new generation of corridor development undertakings foreseen in the SF includes complex and integrated multisector initiatives that encompass both hard and soft aspects. Such interventions entail greater need for knowledge generation and management, institutional adaptation and, more specifically, a stronger engagement with local authorities and private firms in the corridor areas (ADB, 2010e).

Making economic corridors work for the agricultural sector70
has five-year plans for the agricultural sector, i.e. CASP I and II, and strategies for other prioritized sectors, as noted in Table 18.
According to Sanghvi, Simons and Uchoa (2011), governments of developing countries should make their corridor-based plans to foster agricultural growth as targeted and explicit as possible. PRA designers disagree with this premise, hence their attitude to the planning instrument described is slightly different. The PRA Project has a project document that maps out the strategy, sets targets (results framework) and indicates the components available, but keeps a flexible approach on how to deliver targets. An essential ingredient of such flexibility is the absence of selected sectors, industries and beneficiaries.
The blueprints or masterplans usually include a results framework and develop-ment matrix for planning corridor subprojects. The matrix contains a list of priority investments and TA corridor projects. The main purpose of the matrix is to serve as a basis for corridor planning, programming and monitoring (Table 19). In addition, it is of use for mapping the different funding sources, classifying the subprojects into the various supported sectors, and differentiating which projects are funded through loans, grants and/or TA funds. This matrix underlines the existing areas of work with funding gaps and can be used as a platform for donor cooperation, i.e. for negotiating with potential financiers and donors.
The preparation of the masterplan can be carried out in a participatory man-ner through corridor working groups and stakeholder meetings. Opening up the
TABLE 18Sectors targeted by the GMS cooperation programme and their corresponding plans
Targeted sector Support strategy or programme Flagship project(s)
1. Agriculture Core Agriculture Support Programme (CASP)
Flood control and water resource management
2. Energy GMS Energy Roadmap Regional power interconnection and trading arrangements
3. Environment Core Environment Programme and Biodiversity Conservation Corridors Initiative (CEP-BCI)
Strategic environment framework
4. Human resources development
Phnom Penh Plan for Development Management (of human resources)
Development of human resources and skill competencies
5. Investment Strategic Framework for Action on Trade Facilitation and Investment (SFA-TFI)
Enhancement of private sector participation and competitiveness
6. Telecommunications Telecommunications backbone
7. Tourism GMS tourism sector strategy GMS tourism development
8. Trade Action Plan for Transport and Trade Facilitation
Facilitation of cross-border trade and investment
9. Transport Cross-Border Transport Agreement (CBTA)
North-South Economic Corridor (NSEC) East-West Economic Corridor (EWEC) Southern Economic Corridor (SEC)
Source: www.adb.org [last accessed July 2013].
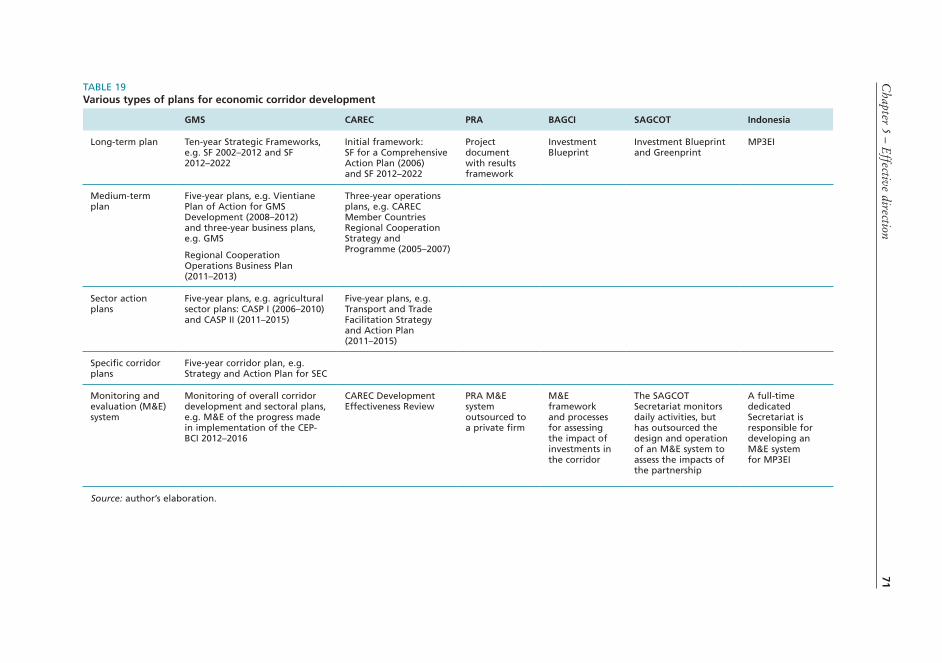
Chapter 5 – E
ffective direction71
TABLE 19 Various types of plans for economic corridor development
GMS CAREC PRA BAGCI SAGCOT Indonesia
Long-term plan Ten-year Strategic Frameworks, e.g. SF 2002–2012 and SF 2012–2022
Initial framework: SF for a Comprehensive Action Plan (2006) and SF 2012–2022
Project document with results framework
Investment Blueprint
Investment Blueprint and Greenprint
MP3EI
Medium-term plan
Five-year plans, e.g. Vientiane Plan of Action for GMS Development (2008–2012) and three-year business plans, e.g. GMS
Regional Cooperation Operations Business Plan (2011–2013)
Three-year operations plans, e.g. CAREC Member Countries Regional Cooperation Strategy and Programme (2005–2007)
Sector action plans
Five-year plans, e.g. agricultural sector plans: CASP I (2006–2010) and CASP II (2011–2015)
Five-year plans, e.g. Transport and Trade Facilitation Strategy and Action Plan (2011–2015)
Specific corridor plans
Five-year corridor plan, e.g. Strategy and Action Plan for SEC
Monitoring and evaluation (M&E) system
Monitoring of overall corridor development and sectoral plans, e.g. M&E of the progress made in implementation of the CEP-BCI 2012–2016
CAREC Development Effectiveness Review
PRA M&E system outsourced to a private firm
M&E framework and processes for assessing the impact of investments in the corridor
The SAGCOT Secretariat monitors daily activities, but has outsourced the design and operation of an M&E system to assess the impacts of the partnership
A full-time dedicated Secretariat is responsible for developing an M&E system for MP3EI
Source: author’s elaboration.

Making economic corridors work for the agricultural sector72
design and preparation process to the national and international community is indispensable in order to maximize the engagement of key stakeholders. Corridors take different pathways to engage partners. Mozambique and the United Republic of Tanzania have invested substantial time in building trust among stakeholders and defining shared goals and principles before launching pilot projects. This is a “fun-damentals first” approach. It takes time but it helps build a strong foundation for sustained collaboration, without which success can never last. In the CAREC and PRA Projects the focus is on initiating action-oriented commitments first, using this process as an avenue for building collaboration. The strength of this “action first” approach is to kick start commitments and activities; however, once initial action is under way, the risks of “learning by doing” can weigh down performance and the lack of a common platform can slow resource mobilization and the engagement of additional stakeholders.
Ultimately, it is important to understand that this is an open-ended process. The corridor programmes analysed have established baselines according to their results frameworks and put in place M&E systems to assess the progress made against the baselines, and modify or redesign the strategy and action plan as appropriate. In some cases, the monitoring of daily activities falls under the mandate of the corridor secretariat or executive body, while the target and impact assessment is frequently outsourced to ensure neutrality and the application of the right type of expertise.
Some M&E systems have a smarter design – with simple but clear targets and a stronger degree of consistency and internal coherence – and are more carefully implemented than others. In the former case, it is easier to measure results and effectiveness, as in the case of the PRA Project. Thanks to its M&E, plus ad hoc impact analysis studies, it can show the impact of corridor development on clients and beneficiaries (effectiveness measures) and institutions (demonstration effect).
For instance, the PRA Project introduced a cost-effectiveness rule for each intervention that required close monitoring but produced excellent results: every dollar spent in the BDS component resulted in US$7.26 in new client sales. This achievement was due in part to the 5:1 rule applied to TA. The final evaluation of PRA I comprised a product-by-product analysis of the ratio between new sales and related direct TA expenditures66 throughout PRA I’s life span. It was found that the ratio for the total portfolio was 75:1. However, within this aggregate ratio there was broad variation. Processed products were among the most cost-effective products, with primary products frequently being the least cost-effective ones (USAID, 2008a). Likewise, for the infrastructure PPP component, every dollar invested leveraged US$87 in private capital investments plus commitments to operate and maintain the infrastructure over the next 30 years in excess of US$103 (ibid.).
When the corridor programme is closely monitored, it is possible to detect the need to redesign some elements to address any gaps identified and/or adapt to evolving situations. For instance, the geographic boundaries of the corridors may undergo some changes during programme implementation, as happened with the
66 The analysis excluded the fixed costs of the ESCs or the Lima office and the indirect costs of the implementation contractor (USAID, 2008a).

Chapter 5 – Effective direction 73
subdivision of the three GMS corridors into nine subcorridors, and the possible extension to India. Again, in the PRA Project, the number of corridors varied repeatedly as a result of various internal and external dynamics. Furthermore, new components can be added (e.g. the addition of agriculture development and other areas of work in the GMS and CAREC programmes), and governance mechanisms can be introduced or enhanced when the institutions concerned are ripe and ready for greater involvement.
The M&E system of the PRA Project detected some vulnerability in the first phase, and so PRA II made a conscious effort to fix this by mainstreaming gender equity, compliance with labour standards, environmental protection, biodiversity preservation and the inclusion of vulnerable groups in ESC activities. This main-streaming effort has encompassed the redesign of business plan formats and the M&E system to incorporate these dimensions, as well as the provision of training and mentoring to comply with good agricultural and livestock practices, the Pes-ticide Evaluation Report and Safe Use Action Plan (PERSUAP), and labour and environmental standards (USAID, 2010).
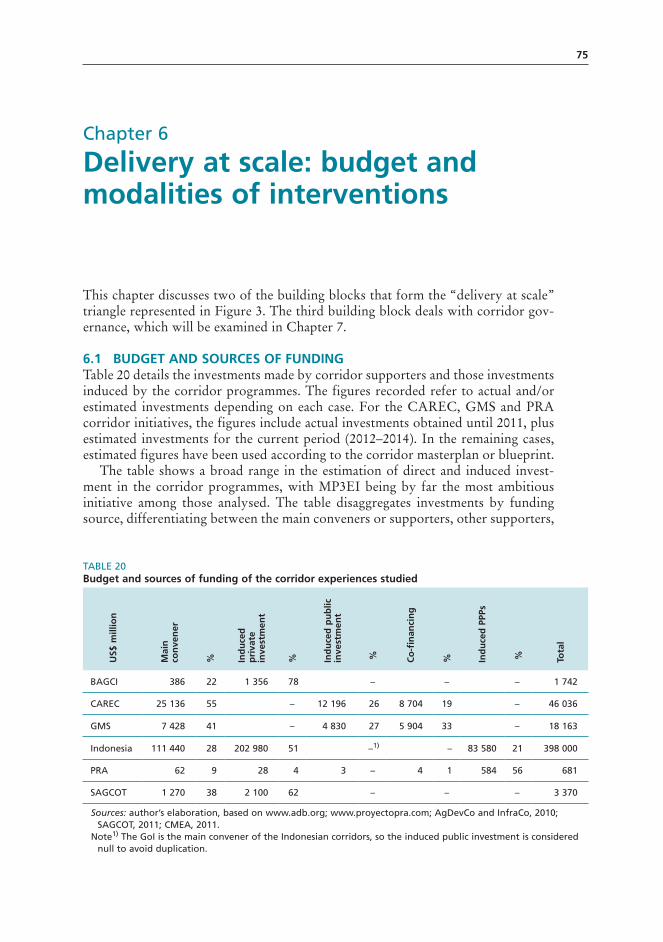
75
Chapter 6
Delivery at scale: budget and modalities of interventions
This chapter discusses two of the building blocks that form the “delivery at scale” triangle represented in Figure 3. The third building block deals with corridor gov-ernance, which will be examined in Chapter 7.
6.1 BUDGET AND SOURCES OF FUNDINGTable 20 details the investments made by corridor supporters and those investments induced by the corridor programmes. The figures recorded refer to actual and/or estimated investments depending on each case. For the CAREC, GMS and PRA corridor initiatives, the figures include actual investments obtained until 2011, plus estimated investments for the current period (2012–2014). In the remaining cases, estimated figures have been used according to the corridor masterplan or blueprint.
The table shows a broad range in the estimation of direct and induced invest-ment in the corridor programmes, with MP3EI being by far the most ambitious initiative among those analysed. The table disaggregates investments by funding source, differentiating between the main conveners or supporters, other supporters,
TABLE 20 Budget and sources of funding of the corridor experiences studied
US$
mill
ion
Mai
n
con
ven
er
% Ind
uce
d
pri
vate
in
vest
men
t
% Ind
uce
d p
ub
lic
inve
stm
ent
% Co
-fin
anci
ng
% Ind
uce
d P
PPs
% Tota
l
BAGCI 386 22 1 356 78 – – – 1 742
CAREC 25 136 55 – 12 196 26 8 704 19 – 46 036
GMS 7 428 41 – 4 830 27 5 904 33 – 18 163
Indonesia 111 440 28 202 980 51 –1) – 83 580 21 398 000
PRA 62 9 28 4 3 – 4 1 584 56 681
SAGCOT 1 270 38 2 100 62 – – – 3 370
Sources: author’s elaboration, based on www.adb.org; www.proyectopra.com; AgDevCo and InfraCo, 2010; SAGCOT, 2011; CMEA, 2011.
Note1) The GoI is the main convener of the Indonesian corridors, so the induced public investment is considered null to avoid duplication.

Making economic corridors work for the agricultural sector76
national governments and the private sector. For example, in the CAREC, GMS and Indonesian cases, the corridor countries contribute to the programme with over a quarter of the total budget, i.e. 26, 27 and 28 percent, respectively.
In all the cases, the contribution of the private sector to the development of the corridor – registered either as induced PPPs or induced private investment – is note-worthy. The exceptions are the corridors following the ADB model, but basically because these data are not available.
Table 21 tries to put things into perspective and allow cross-comparison by detailing the estimated accumulated investments per corridor and per country.
Another piece of data worth highlighting is the percentage of the corridor’s budget that goes into the agricultural sector (Table 22). This ratio range is extremely variable since it depends on the number of economic sectors and industries targeted, but also on the fraction of the budget dedicated to the development of backbone infrastructure, which can be very high. For instance, in the GMS corridor pro-
TABLE 21Estimated accumulated investments per corridor and per country
Number of corridors
Accumulated investments per corridor (US$ million)
Accumulated investments per country (US$ million)
BAGCI 1 1 742 1 742
CAREC 6 7 673 4 604
GMS 3 6 054 3 027
Indonesia 6 66 333 398 000
PRA 10–15 54 681
SAGCOT 1 3 370 3 370
Sources: author’s elaboration, based on www.adb.org; www.proyectopra.com; AgDevCo and InfraCo, 2010; SAGCOT, 2011; CMEA, 2011.
TABLE 22Percentage of corridor budget dedicated to agriculture
Corridor budget allocated to the agricultural sector (%)1)
BAGCI 35.0
CAREC n.a.
GMS 5.0
Indonesia 7.7
PRA 80.0
SAGCOT 49.0
Sources: author’s elaboration, based on www.adb.org; www.proyectopra.com; AgDevCo and InfraCo, 2010; SAGCOT, 2011; CMEA, 2011.
1) These figures have been calculated taking into account exclusively the direct budget of the corridor programme (not the induced investments). In the cases of BAGCI and SAGCOT, investments in last-mile infrastructure are included in the calculation, but investments in backbone infrastructure are not.
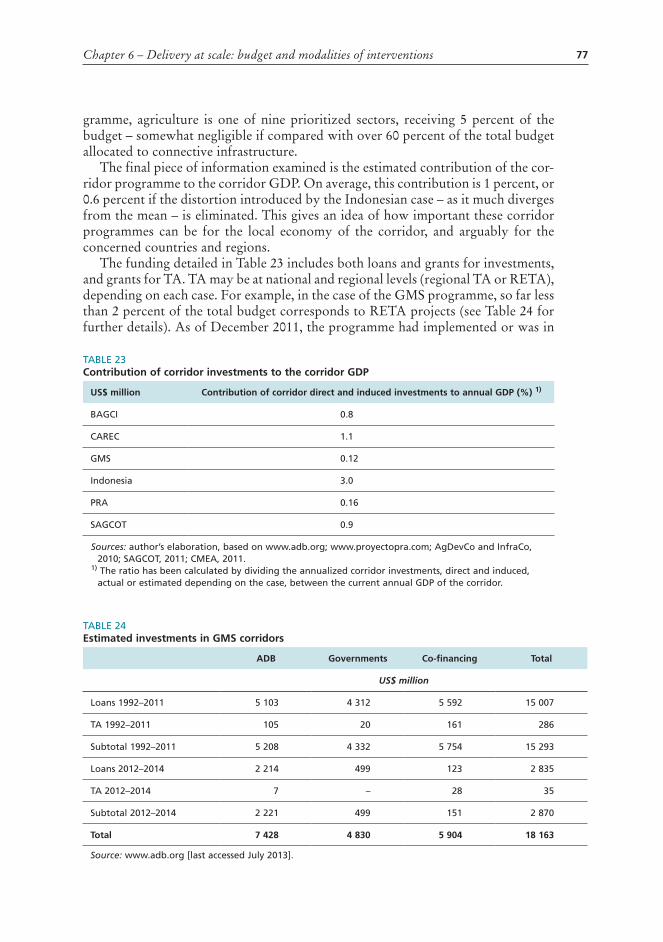
Chapter 6 – Delivery at scale: budget and modalities of interventions 77
gramme, agriculture is one of nine prioritized sectors, receiving 5 percent of the budget – somewhat negligible if compared with over 60 percent of the total budget allocated to connective infrastructure.
The final piece of information examined is the estimated contribution of the cor-ridor programme to the corridor GDP. On average, this contribution is 1 percent, or 0.6 percent if the distortion introduced by the Indonesian case – as it much diverges from the mean – is eliminated. This gives an idea of how important these corridor programmes can be for the local economy of the corridor, and arguably for the concerned countries and regions.
The funding detailed in Table 23 includes both loans and grants for investments, and grants for TA. TA may be at national and regional levels (regional TA or RETA), depending on each case. For example, in the case of the GMS programme, so far less than 2 percent of the total budget corresponds to RETA projects (see Table 24 for further details). As of December 2011, the programme had implemented or was in
TABLE 23Contribution of corridor investments to the corridor GDP
US$ million Contribution of corridor direct and induced investments to annual GDP (%) 1)
BAGCI 0.8
CAREC 1.1
GMS 0.12
Indonesia 3.0
PRA 0.16
SAGCOT 0.9
Sources: author’s elaboration, based on www.adb.org; www.proyectopra.com; AgDevCo and InfraCo, 2010; SAGCOT, 2011; CMEA, 2011.
1) The ratio has been calculated by dividing the annualized corridor investments, direct and induced, actual or estimated depending on the case, between the current annual GDP of the corridor.
TABLE 24 Estimated investments in GMS corridors
ADB Governments Co-financing Total
US$ million
Loans 1992–2011 5 103 4 312 5 592 15 007
TA 1992–2011 105 20 161 286
Subtotal 1992–2011 5 208 4 332 5 754 15 293
Loans 2012–2014 2 214 499 123 2 835
TA 2012–2014 7 – 28 35
Subtotal 2012–2014 2 221 499 151 2 870
Total 7 428 4 830 5 904 18 163
Source: www.adb.org [last accessed July 2013].
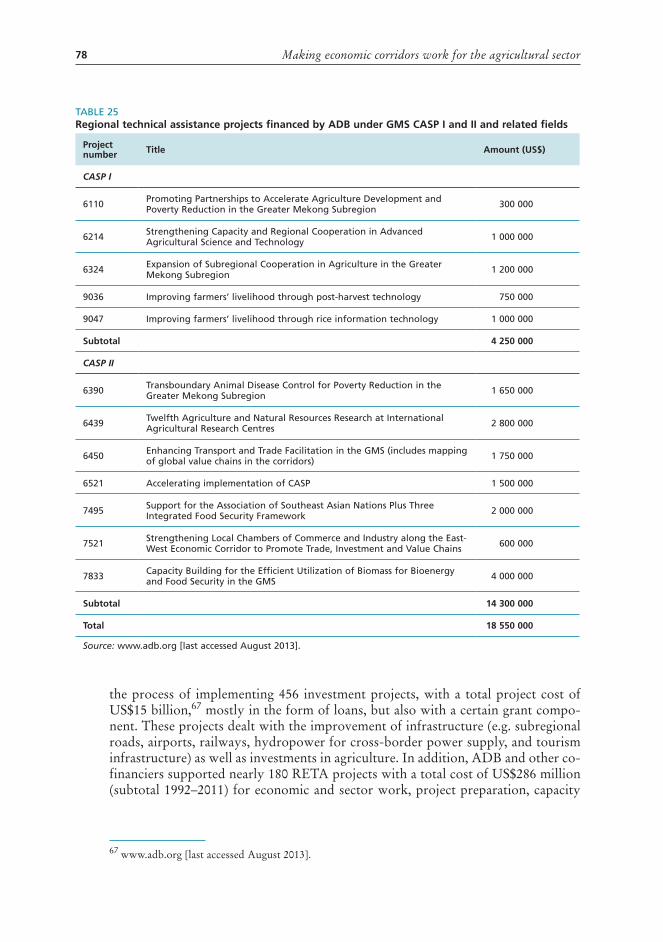
Making economic corridors work for the agricultural sector78
the process of implementing 456 investment projects, with a total project cost of US$15 billion,67 mostly in the form of loans, but also with a certain grant compo-nent. These projects dealt with the improvement of infrastructure (e.g. subregional roads, airports, railways, hydropower for cross-border power supply, and tourism infrastructure) as well as investments in agriculture. In addition, ADB and other co-financiers supported nearly 180 RETA projects with a total cost of US$286 million (subtotal 1992–2011) for economic and sector work, project preparation, capacity
67 www.adb.org [last accessed August 2013].
TABLE 25 Regional technical assistance projects financed by ADB under GMS CASP I and II and related fields
Project number Title Amount (US$)
CASP I
6110 Promoting Partnerships to Accelerate Agriculture Development and Poverty Reduction in the Greater Mekong Subregion 300 000
6214 Strengthening Capacity and Regional Cooperation in Advanced Agricultural Science and Technology 1 000 000
6324 Expansion of Subregional Cooperation in Agriculture in the Greater Mekong Subregion 1 200 000
9036 Improving farmers’ livelihood through post-harvest technology 750 000
9047 Improving farmers’ livelihood through rice information technology 1 000 000
Subtotal 4 250 000
CASP II
6390 Transboundary Animal Disease Control for Poverty Reduction in the Greater Mekong Subregion 1 650 000
6439 Twelfth Agriculture and Natural Resources Research at International Agricultural Research Centres 2 800 000
6450 Enhancing Transport and Trade Facilitation in the GMS (includes mapping of global value chains in the corridors) 1 750 000
6521 Accelerating implementation of CASP 1 500 000
7495 Support for the Association of Southeast Asian Nations Plus Three Integrated Food Security Framework 2 000 000
7521 Strengthening Local Chambers of Commerce and Industry along the East-West Economic Corridor to Promote Trade, Investment and Value Chains 600 000
7833 Capacity Building for the Efficient Utilization of Biomass for Bioenergy and Food Security in the GMS 4 000 000
Subtotal 14 300 000
Total 18 550 000
Source: www.adb.org [last accessed August 2013].
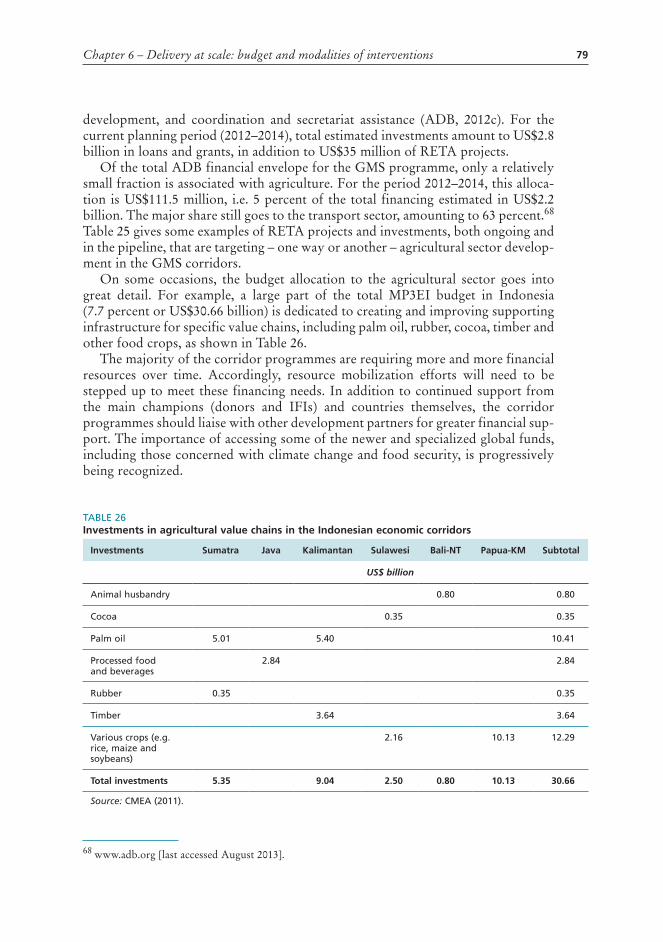
Chapter 6 – Delivery at scale: budget and modalities of interventions 79
development, and coordination and secretariat assistance (ADB, 2012c). For the current planning period (2012–2014), total estimated investments amount to US$2.8 billion in loans and grants, in addition to US$35 million of RETA projects.
Of the total ADB financial envelope for the GMS programme, only a relatively small fraction is associated with agriculture. For the period 2012–2014, this alloca-tion is US$111.5 million, i.e. 5 percent of the total financing estimated in US$2.2 billion. The major share still goes to the transport sector, amounting to 63 percent.68 Table 25 gives some examples of RETA projects and investments, both ongoing and in the pipeline, that are targeting – one way or another – agricultural sector develop-ment in the GMS corridors.
On some occasions, the budget allocation to the agricultural sector goes into great detail. For example, a large part of the total MP3EI budget in Indonesia (7.7 percent or US$30.66 billion) is dedicated to creating and improving supporting infrastructure for specific value chains, including palm oil, rubber, cocoa, timber and other food crops, as shown in Table 26.
The majority of the corridor programmes are requiring more and more financial resources over time. Accordingly, resource mobilization efforts will need to be stepped up to meet these financing needs. In addition to continued support from the main champions (donors and IFIs) and countries themselves, the corridor programmes should liaise with other development partners for greater financial sup-port. The importance of accessing some of the newer and specialized global funds, including those concerned with climate change and food security, is progressively being recognized.
68 www.adb.org [last accessed August 2013].
TABLE 26Investments in agricultural value chains in the Indonesian economic corridors
Investments Sumatra Java Kalimantan Sulawesi Bali-NT Papua-KM Subtotal
US$ billion
Animal husbandry 0.80 0.80
Cocoa 0.35 0.35
Palm oil 5.01 5.40 10.41
Processed food and beverages
2.84 2.84
Rubber 0.35 0.35
Timber 3.64 3.64
Various crops (e.g. rice, maize and soybeans)
2.16 10.13 12.29
Total investments 5.35 9.04 2.50 0.80 10.13 30.66
Source: CMEA (2011).

Making economic corridors work for the agricultural sector80
Corridor programmes also need to tap private sources of financing more effec-tively, and review various possible mechanisms, including guarantees and PPPs. The latter modality is already being developed in some of the concerned countries, and may be viable during the next decade in the rest of the developing world.
6.2 MODALITIES OF INTERVENTIONSThe corridor models identified propose various modalities of intervention to trans-form classic transport corridors into effective economic corridors and make them work for the agricultural sector. There is something that all the corridor models agree upon: the need to design a holistic intervention that combines a smart-mix of soft and hard instruments. Both hard and soft corridor components aim to reduce the cost of doing business in the area and facilitate start-up and operation of busi-ness ventures in their corridors. As mentioned earlier, hard interventions include infrastructural elements such as roads, ports, railways, airports, energy and telecom-munications networks, dams, irrigation infrastructure, market centres, warehouses, dryports and other productive infrastructure. Infrastructure is a major contributor to shaping the market along the corridor, but its development implies longer-term higher cost investments. The financial situation of the corridor partners and the baseline of the corridor will influence the choices and balances between soft and hard interventions.
Soft interventions are those that deal with the development of institutions and human resources aiming to build capacity to promote economic growth. Among the soft interventions are the following: � Policy research and dialogue (e.g. border policies and national policies dealing with
land use, standards and public-private collaboration), treaties and streamlining of procedures to improve ease of business in the corridor (e.g. legislation, regulation and administration).
� Improvement of BDS, such as agricultural marketing, extension services and investment promotion.
� Financial and risk management instruments. � Transport facilitation (e.g. shipping and port services, trucking, railways,
handling, warehousing, customs, insurance, banking and freight forwarding) and trade facilitation, including customs cooperation.
� Incentives for the development of regional integration initiatives. � Management of natural resources. � Human capital development and innovation (R&D and technology transfer). � Capacity building and organizational strengthening of both dedicated corridor
institutions and national and regional institutions involved in the implementation of the corridor programme.
Soft interventions require fewer financial resources than infrastructure ones, but the former investments improve capacities and institutions so that it is possible to raise returns to hard investments. Most corridor subprojects or components (e.g. area development plans, value-chain initiatives, clusters and SEZs) combine both soft and hard features.
Another way to classify corridor interventions is according to their impact on two corridor dimensions: broadness and national and/or regional scope (ADB, 2011c).
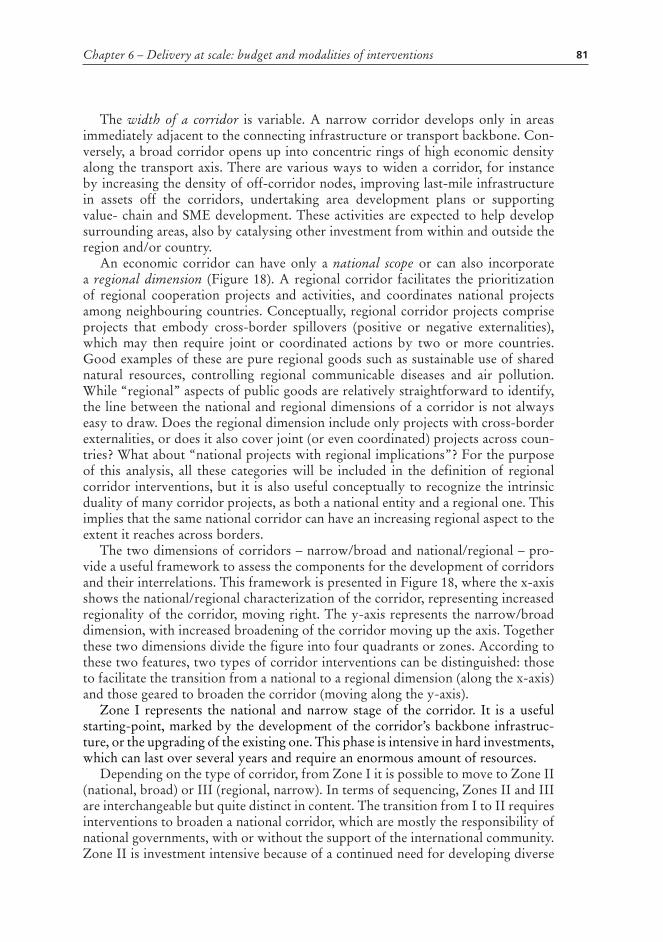
Chapter 6 – Delivery at scale: budget and modalities of interventions 81
The width of a corridor is variable. A narrow corridor develops only in areas immediately adjacent to the connecting infrastructure or transport backbone. Con-versely, a broad corridor opens up into concentric rings of high economic density along the transport axis. There are various ways to widen a corridor, for instance by increasing the density of off-corridor nodes, improving last-mile infrastructure in assets off the corridors, undertaking area development plans or supporting value- chain and SME development. These activities are expected to help develop surrounding areas, also by catalysing other investment from within and outside the region and/or country.
An economic corridor can have only a national scope or can also incorporate a regional dimension (Figure 18). A regional corridor facilitates the prioritization of regional cooperation projects and activities, and coordinates national projects among neighbouring countries. Conceptually, regional corridor projects comprise projects that embody cross-border spillovers (positive or negative externalities), which may then require joint or coordinated actions by two or more countries. Good examples of these are pure regional goods such as sustainable use of shared natural resources, controlling regional communicable diseases and air pollution. While “regional” aspects of public goods are relatively straightforward to identify, the line between the national and regional dimensions of a corridor is not always easy to draw. Does the regional dimension include only projects with cross-border externalities, or does it also cover joint (or even coordinated) projects across coun-tries? What about “national projects with regional implications”? For the purpose of this analysis, all these categories will be included in the definition of regional corridor interventions, but it is also useful conceptually to recognize the intrinsic duality of many corridor projects, as both a national entity and a regional one. This implies that the same national corridor can have an increasing regional aspect to the extent it reaches across borders.
The two dimensions of corridors – narrow/broad and national/regional – pro-vide a useful framework to assess the components for the development of corridors and their interrelations. This framework is presented in Figure 18, where the x-axis shows the national/regional characterization of the corridor, representing increased regionality of the corridor, moving right. The y-axis represents the narrow/broad dimension, with increased broadening of the corridor moving up the axis. Together these two dimensions divide the figure into four quadrants or zones. According to these two features, two types of corridor interventions can be distinguished: those to facilitate the transition from a national to a regional dimension (along the x-axis) and those geared to broaden the corridor (moving along the y-axis).
Zone I represents the national and narrow stage of the corridor. It is a useful starting-point, marked by the development of the corridor’s backbone infrastruc-ture, or the upgrading of the existing one. This phase is intensive in hard investments, which can last over several years and require an enormous amount of resources.
Depending on the type of corridor, from Zone I it is possible to move to Zone II (national, broad) or III (regional, narrow). In terms of sequencing, Zones II and III are interchangeable but quite distinct in content. The transition from I to II requires interventions to broaden a national corridor, which are mostly the responsibility of national governments, with or without the support of the international community. Zone II is investment intensive because of a continued need for developing diverse

Making economic corridors work for the agricultural sector82
infrastructure, notably last-mile infrastructure that feeds into the major infrastruc-ture supported under the first quadrant.
The movement from Zone I to Zone III symbolizes the adoption of measures to support integration in a regional corridor. Figure 19 is a snapshot of a regional corridor in Zone III that links three (narrow) national corridors crossing countries A, B and C.
Rather than interpreting the regional corridor as an extension beyond national boundaries of three different corridors, it is more usefully viewed as the subsequent stage of reducing national barriers through transport and trade facilitation measures. Figure 19 shows an example of complementary national interventions to increase regionality on two levels: among the participating countries and complementarity between integration hardware and software initiatives. The focus of Zone III is on transport and trade facilitation, i.e. moving goods and people easily and cost effi-ciently from place to place, which in Figure 19 is a port in Country A and another in Country C.
Developing Zone III requires facilitating regional cooperation through several coordination mechanisms, such as regional blocs or dedicated corridor bodies that pursue regional integration. Zone III is relatively investment light, with the focus being on creating or strengthening the software for the physical infrastructure already in place (e.g. within the border policies, transport facilitation and trade and investment promotion).
Zone IV marks the last stage of development of a regional corridor, which becomes a broad and seamless regional entity. Movement towards Zone IV cor-
figure 18Making economic corridors broader and regionally integrated
y
xRegional
Bro
ad National+ broad
ZON
E II
last-mileinfrastructure
areadevelopment
value chain
Regional+ broad
ZON
E IV
cross-borderagroparks & SEZs
contractfarming
National+ narrow
ZON
E I
roads andrailways
power &telecommunic.
ports
Regional+ narrow
ZON
E III
tradefacilitation
logistics
Source: author’s elaboration based on ADB, 2011c.

Chapter 6 – Delivery at scale: budget and modalities of interventions 83
ridors may require joint regional plans, or joint plans for cross-border area develop-ment (clusters, SEZs, etc.) by the concerned countries or, at the least, coordination of national plans. The alternative, of coordinating national plans (including private sector investment and activities), is often the most viable option.
This framework shows a sequence across the four zones, with Zone I preceding Zones II and III, which in turn pave the way for Zone IV development. The next sections detail the types of measures that are characteristic of each zone and those needed to broaden and deepen or “regionalize” a corridor, i.e. to move from one quadrant to another.
6.3 LAYING THE CORRIDOR BASIS: INFRASTRUCTURE DEVELOPMENTCorridors in Zone I focus on creating, expanding and rehabilitating infrastructure stock within the corridor. Zone I interventions tackle both the hard and the soft aspects that need to work together to make the infrastructure backbone of the cor-ridor as efficient as possible. Overcoming infrastructure failure is expected to lead to increased firm competitiveness and enhanced delivery of public services.
When key connective infrastructures and facilities are not in place, or require upgrading and upscaling, the corridor programme needs to come up with a strategy
figure 19Example of a narrow, regional corridor (Zone III)
Country A Country B Country C
Integration hardware
Roads
Airports
Ports
Border initiative
Trade/investmentagreements
Trade facilitation/logistics
Trade/investment promotion
Non-financial products
Strategic initiatives
Research anddevelopment
Policy dialogue
Capacity building
Investment loans,guarantees and grants
Investment loans,guarantees and grants
Policyinterventions
Policyinterventions
Policyinterventions
Policyinterventions
Investmentloans,
guaranteesand grants
Integration software
Source: IaDB, 2011 (adapted with permission).

Making economic corridors work for the agricultural sector84
to address these bottlenecks. In these cases, the magnitude of the resources pooled together may be substantial - especially when confronted with demand for large infrastructural investments. Therefore, the participation of both the public and private sectors is required. Should the infrastructure gap be considerable, incentives and other support measures may be provided for greenfield developments, as noted in the African agricultural growth corridors.
When analysing infrastructure interventions (Zone I) of the six corridor initia-tives appraised, four issues emerge as worth highlighting. The first is the prioritiza-tion of high-impact infrastructure, namely roads, railways, ports and energy. The second refers to the sequencing of interventions: what comes first, infrastructure development or interventions in agriculture and other selected economic sectors? Third, three different ways of approaching the infrastructure component in an economic corridor programme have been observed. Finally, there is a discussion on the increasingly important role of the private sector in the financing, development and management of corridor infrastructure projects through PPPs.
The corridor programmes studied have favoured high-impact infrastructure improvements, particularly highways and ports. Within this high-impact category, two main types of infrastructure can be distinguished. The first is physical con-nectivity to reduce transportation costs, and travel and border crossing time. The second encompasses telecommunications and energy to reduce business costs. Many corridor programmes also enhance last-mile infrastructure, but this type of intervention belongs to the second quadrant and, hence, will be analysed in section 6.4. Box 11 provides an overview of the way in which BAGCI and SAGCOT tackle infrastructure development in their respective corridors.
Removing infrastructure bottlenecks is often the main budget ticket of the cor-ridor programme. This is the experience of GMS and CAREC to date. As of 2011, priority infrastructure projects worth approximately US$10 billion were completed or about to be completed in the GMS area, with road networks representing the largest share (ADB, 2012a). CAREC had invested over US$21 billion in major infrastructure by the end of 2012. In both cases, the lion’s share of this figure went to the development of road and railway networks: an indicative 63 percent of the total budget for the GMS, and 79 percent for the CAREC programme.
At present, road infrastructure projects are almost complete in the GMS. However, certain gaps remain, regarding multimodalism (particularly inclusion of rail and inland water navigation), the improvement of logistics and other software elements (e.g. road safety, enhanced competition in the transport sector and climate proofing of transportation infrastructure) and the development of some corridor sections in Myanmar (ADB, 2010f). CAREC has also built and improved some 3 600 km of road and almost 2 000 km of railway track (ADB, 2011f), but important expansions and enhancements are still required. The current emphasis is on final-izing the road and rail networks and on enhancing the software partnering with transporters and other private actors. The approach to building and rehabilitating these roads and railway lines has mostly been national, in the sense that each coun-try has taken responsibility for the sections of the transportation backbone of the three corridors and nine subcorridors that fall within its territory. Yet, put together, all these projects form the puzzle of regional road and railway networks ensuring intra- and intercorridor transport connectivity.

Chapter 6 – Delivery at scale: budget and modalities of interventions 85
BOX 11
How BAGCI and SAGCOT approach infrastructure development
BAgCi distinguishes between major connective infrastructure (e.g. roads, railways and ports) and last-mile infrastructure (AdDevCo and infraCo, 2010). The latter infrastructure is clearly lacking, whereas overall transport infrastructure is fair along the corridor (ibid.). The Beira Blueprint has provisions only for improving last-mile infrastructure, whereas the Mozam-bican government undertakes investments in major transport infrastructure with funds from its regular budget, donors, loans from international financial institutions and PPPs. SAgCOT follows the same approach.
The Beira Corridor has a multimodal, mostly functional, transport backbone com-posed of a road network among urban centres that is considered adequate: the Sena and Machipanda railway lines69 and the port of Beira70. The railway lines and the port have attracted private firms to take care of their management and invest in their expansion (Domínguez-Torres and Briceño-garmendia, 2011). The port of Beira has been privately operated since 1998, when its general cargo and terminals management and operation were conceded to a Netherlands company (ibid.). Similarly, the two railway lines serving the corridor were given in concession to indian consortia in December 2004.71 BAgCi’s road net-work has recently seen a revamp in investment and rehabilitation, with a second-generation road fund set in place (Domínguez-Torres and Briceño-garmendia, 2011). Likewise, the Sena railway line has recently been rehabilitated and the port of Beira is undergoing a major upgrade, with channels being dredged to allow the transit of larger vessels, and handling capacity being doubled from five to ten million tonnes (ibid.). funding for the port upgrade comes from several development agencies, multilateral banks and private investors. The Danish international Development Agency (DANiDA)72 is funding the rehabilitation of some parts of Beira airport.
in the SAgCOT case, there are several relevant ongoing investments in backbone infra-structure by the goT, development institutions and private companies, as summarized in Table 27. furthermore, in the 2010–2015 period, public investments of uS$445 million are required to improve the rural road network, mostly coming through the national budget (SAgCOT, 2010).
under current conditions in SAgCOT, much of the immediate upfront expenditure required for new farming projects and farm improvement is in the last-mile infrastructure connections, with an estimated budget envelope of uS$570 million. With access to patient capital, private players can manage the implementation of these investments, which should provide a financial return over the long term (Wef, 2012).
69 The 680 km-long Sena line linking the port of Beira to the coal-mining town of Moatize and the Malawian border, and the Machipanda railway line between Beira and Harare, Zimbabwe.
70 As explained earlier, the port of Beira acts as an international gateway, not only for Mozambique, but also for the region’s landlocked countries – Malawi, Zambia and Zimbabwe.
71 Rail India Technical and Economic Services (RITES) Ltd and IRCON International.72 http://um.dk/en/danida-en/ [last accessed July 2013].

Making economic corridors work for the agricultural sector86
BOX 11 (Continued)
Among other things, the ongoing upgrade of major infrastructure in both corridors offers a great potential for strengthening channels to markets for agricultural producers. for this potential to be realized, the charges for use of these facilities should be affordable for agri-cultural players, particularly in the early years of corridor development (AgDevCo and infraCo, 2010). The expected decrease in transport costs will likely have a favourable impact on the competitiveness of Mozambican and Tanzanian agricultural production and agro-exports.
Besides the anticipated investments in transport and last-mile infrastructure, major anchor investments in the mining sector, proposed and under way in BAgC, will probably impact the corridor infrastructure. On the one hand, mining activities – among them, two very large mining projects in construction near Tete, with a combined potential to produce approximately 13 million tonnes of coal by 2015 – are expected to drive marked improve-ments in transport, power and water infrastructure (ibid.). The agricultural sector will pos-sibly be one of the most important beneficiaries of these infrastructure enhancements (ibid.). On the other hand, the rising demand for transport of the mining sector poses an enormous hurdle both institutionally and financially, as the size of the road and rail network seems to overshadow the national capacity to fund its rapid expansion and maintenance. The com-bined transport demand of the mining and agricultural sectors in the corridor will require additional sustained and massive investments over decades, with the participation of the pri-vate sector and non-traditional financiers (Domínguez-Torres and Briceño-garmendia, 2011).
TABLE 27 Investments in backbone infrastructure along SAGCOT
Backbone infrastructure Donor and budget in US$ million Item financed
Railway network China: 39 Tanzania-Zambia Railway Authority (TAZARA) railway
Road network AfDB: 230 and Japan International Cooperation Agency (JICA): 87.7
Dodoma-Iringa road
Millennium Challenge Corporation (MCC): 373
Tunduma-Sumbawanga road and others
DANIDA: 84.8 Tanzam highway
Power network EU: 4.7; MCC: 206; Swedish International Development Agency (SIDA): 70; Rural Energy Fund: 6.8
Ports Tanzania Port Authority: 18 Dar es Salaam (Dar) Port upgrade
Tanzania Port Authority: 80 New liquid bulk terminal
Yara: 20 Dedicated fertilizer terminal at Dar Port
DSM Corridor Group: 4 Bulk fertilizer terminal at Dar Port
DSM Corridor Group and East African Trading Company: 10
Dry port at Mbeya
Source: WEF, 2012.

Chapter 6 – Delivery at scale: budget and modalities of interventions 87
In Peru, the infrastructure component of the project did not fund the develop-ment of transport infrastructure through loans and grants, but assisted the GoP to develop an infrastructure PPP scheme to tap private investments and manage the existing stock more efficiently. This assistance also prepared the GoP to programme and manage key infrastructural projects of corridors through a national project and negotiate their insertion as priority in the IIRSA pipeline.
Indonesia plans to invest over US$177 billion in general infrastructure serving the six economic corridors. This represents an annual investment of over 1.25 percent of the country’s GDP. Most of this investment goes to road and railway infrastructure followed, inter alia, by energy, ports and airports (CMEA, 2011).
In Mozambique and the United Republic of Tanzania, the main roads and railway lines of the corridors were in fair condition, but needed some upgrading and/or expansion. In these corridors, infrastructure projects have been linked to the extraction of agricultural commodities from producing areas or agrobased clusters to ports and large consumer centres (Beira and Dar es Salaam). These two experiences can offer useful policy lessons about best practices and pitfalls of commodity-led infrastructure development in Africa and its potential to pay growth dividends.
Ports are as strategically important for corridor growth as roads and railway lines. Most economic corridors are anchored by ports, which are essential for intraregional trade (GMS) and exports to distant markets. For example, GMS transport corridors end at large port complexes that are located near dynamic agricultural and industrial areas. Some corridors even take their name from the port that serves as the main gateway, as in the case of BAGC, which ends at the port of Beira. Interventions related to port development belong to Zone I because, even if the port serves as the gateway for a regional corridor, responsibility for developing or upgrading the port and managing it falls within the national sphere.
The corridor programmes studied often encompass the development or upgrad-ing of sea and river ports. For example, Table 28 gives a list of the major river and sea ports along the GMS corridors. However, these ports work as secondary ports that then feed two major hub ports in Asia: Hong Kong and Singapore.
Other examples of ports that have been upgraded as part of the corridor action plan are the port of Dar es Salaam (United Republic of Tanzania), and the port of Callao (Peru), which are the principal international gateways for agricultural goods produced in the SAGCOT and PRA corridors, respectively. An example of the development of a new port is the project for developing a deep seaport in Dawei, Myanmar, which is at the western end of the SEC. This port is essential for China and the rest of the Mekong countries to reach the Indian Ocean.
Secondary or feeder ports serving hub ports are also important for intracorridor connectivity. Cases in point are the inland ports on Lakes Tanganyika and Nyasa in the SAGCOT corridor. Other examples are the seaport of Paita and the river port of Yurimaguas in the Peruvian corridors analysed, and the ports of Da Nang and Hai Phong in Viet Nam, which are part of the EWEC. CAREC has also upgraded some river ports (ADB, 2011f). Indonesia, as an archipelago nation, has allocated US$11.4 billion of the overall MP3EI budget envelope to developing new ports (international hub, regional hub and feeder ports) and upgrading existing ones (CMEA, 2011).
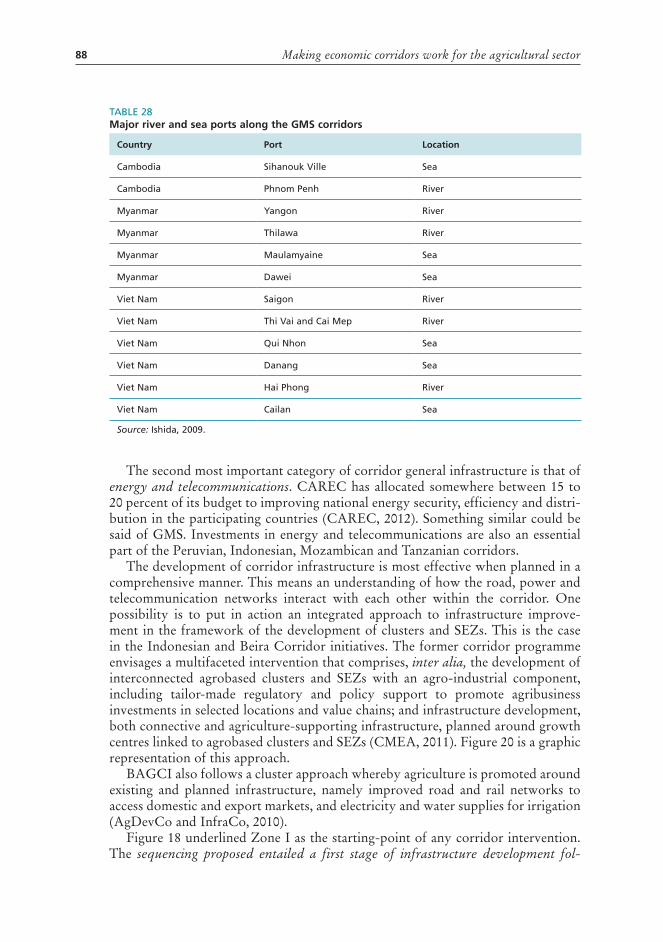
Making economic corridors work for the agricultural sector88
The second most important category of corridor general infrastructure is that of energy and telecommunications. CAREC has allocated somewhere between 15 to 20 percent of its budget to improving national energy security, efficiency and distri-bution in the participating countries (CAREC, 2012). Something similar could be said of GMS. Investments in energy and telecommunications are also an essential part of the Peruvian, Indonesian, Mozambican and Tanzanian corridors.
The development of corridor infrastructure is most effective when planned in a comprehensive manner. This means an understanding of how the road, power and telecommunication networks interact with each other within the corridor. One possibility is to put in action an integrated approach to infrastructure improve-ment in the framework of the development of clusters and SEZs. This is the case in the Indonesian and Beira Corridor initiatives. The former corridor programme envisages a multifaceted intervention that comprises, inter alia, the development of interconnected agrobased clusters and SEZs with an agro-industrial component, including tailor-made regulatory and policy support to promote agribusiness investments in selected locations and value chains; and infrastructure development, both connective and agriculture-supporting infrastructure, planned around growth centres linked to agrobased clusters and SEZs (CMEA, 2011). Figure 20 is a graphic representation of this approach.
BAGCI also follows a cluster approach whereby agriculture is promoted around existing and planned infrastructure, namely improved road and rail networks to access domestic and export markets, and electricity and water supplies for irrigation (AgDevCo and InfraCo, 2010).
Figure 18 underlined Zone I as the starting-point of any corridor intervention. The sequencing proposed entailed a first stage of infrastructure development fol-
TABLE 28Major river and sea ports along the GMS corridors
Country Port Location
Cambodia Sihanouk Ville Sea
Cambodia Phnom Penh River
Myanmar Yangon River
Myanmar Thilawa River
Myanmar Maulamyaine Sea
Myanmar Dawei Sea
Viet Nam Saigon River
Viet Nam Thi Vai and Cai Mep River
Viet Nam Qui Nhon Sea
Viet Nam Danang Sea
Viet Nam Hai Phong River
Viet Nam Cailan Sea
Source: Ishida, 2009.
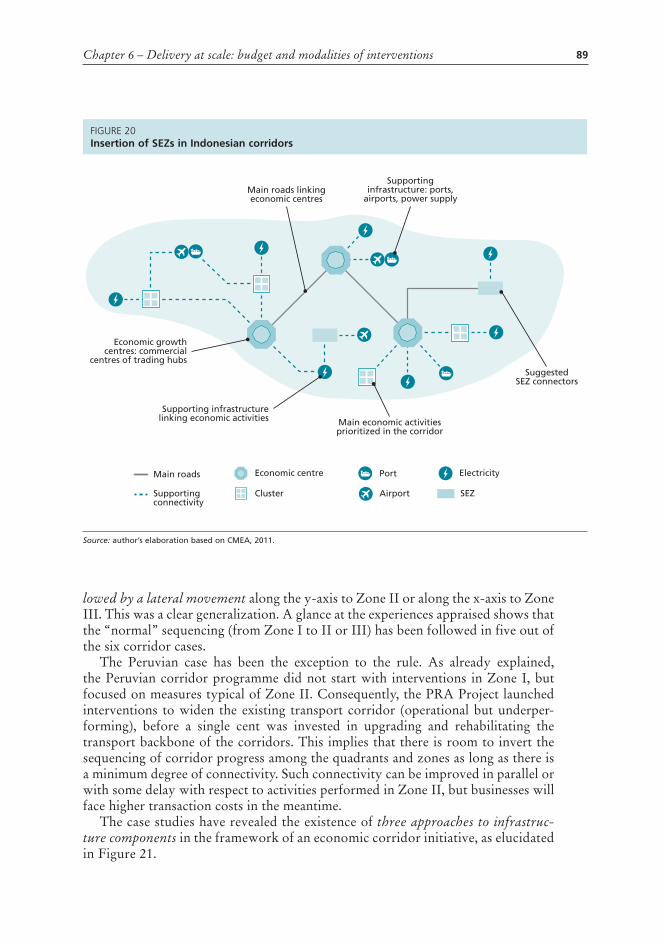
Chapter 6 – Delivery at scale: budget and modalities of interventions 89
lowed by a lateral movement along the y-axis to Zone II or along the x-axis to Zone III. This was a clear generalization. A glance at the experiences appraised shows that the “normal” sequencing (from Zone I to II or III) has been followed in five out of the six corridor cases.
The Peruvian case has been the exception to the rule. As already explained, the Peruvian corridor programme did not start with interventions in Zone I, but focused on measures typical of Zone II. Consequently, the PRA Project launched interventions to widen the existing transport corridor (operational but underper-forming), before a single cent was invested in upgrading and rehabilitating the transport backbone of the corridors. This implies that there is room to invert the sequencing of corridor progress among the quadrants and zones as long as there is a minimum degree of connectivity. Such connectivity can be improved in parallel or with some delay with respect to activities performed in Zone II, but businesses will face higher transaction costs in the meantime.
The case studies have revealed the existence of three approaches to infrastruc-ture components in the framework of an economic corridor initiative, as elucidated in Figure 21.
figure 20Insertion of SEZs in Indonesian corridors
Main roads linkingeconomic centres
Supportinginfrastructure: ports,
airports, power supply
SuggestedSEZ connectors
Economic growthcentres: commercial
centres of trading hubs
Main economic activitiesprioritized in the corridor
Supporting infrastructurelinking economic activities
Main roads
Supportingconnectivity
Economic centre
Cluster SEZ
Port
Airport
Electricity
Source: author’s elaboration based on CMEA, 2011.
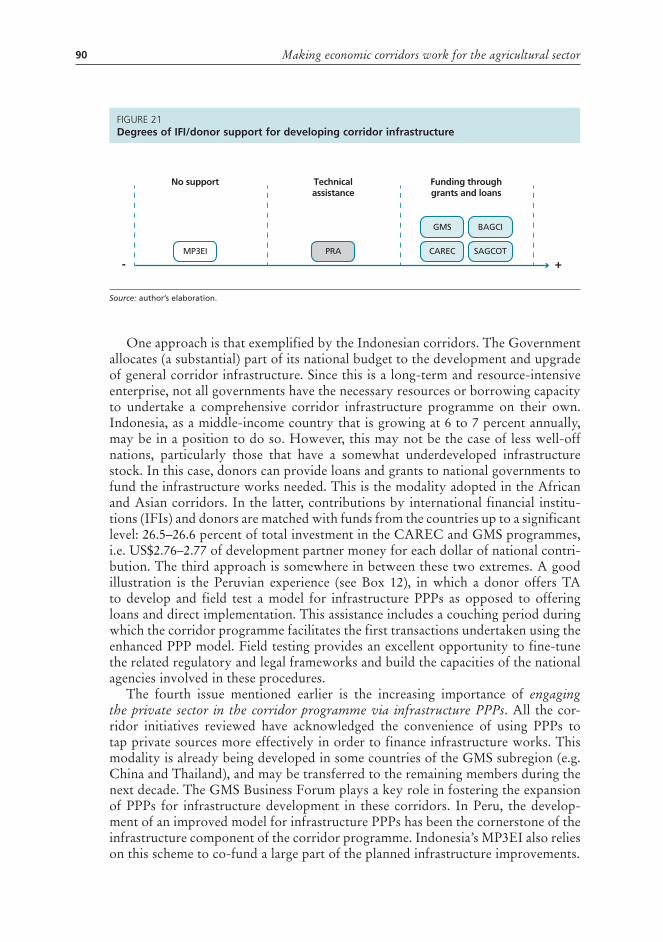
Making economic corridors work for the agricultural sector90
One approach is that exemplified by the Indonesian corridors. The Government allocates (a substantial) part of its national budget to the development and upgrade of general corridor infrastructure. Since this is a long-term and resource-intensive enterprise, not all governments have the necessary resources or borrowing capacity to undertake a comprehensive corridor infrastructure programme on their own. Indonesia, as a middle-income country that is growing at 6 to 7 percent annually, may be in a position to do so. However, this may not be the case of less well-off nations, particularly those that have a somewhat underdeveloped infrastructure stock. In this case, donors can provide loans and grants to national governments to fund the infrastructure works needed. This is the modality adopted in the African and Asian corridors. In the latter, contributions by international financial institu-tions (IFIs) and donors are matched with funds from the countries up to a significant level: 26.5–26.6 percent of total investment in the CAREC and GMS programmes, i.e. US$2.76–2.77 of development partner money for each dollar of national contri-bution. The third approach is somewhere in between these two extremes. A good illustration is the Peruvian experience (see Box 12), in which a donor offers TA to develop and field test a model for infrastructure PPPs as opposed to offering loans and direct implementation. This assistance includes a couching period during which the corridor programme facilitates the first transactions undertaken using the enhanced PPP model. Field testing provides an excellent opportunity to fine-tune the related regulatory and legal frameworks and build the capacities of the national agencies involved in these procedures.
The fourth issue mentioned earlier is the increasing importance of engaging the private sector in the corridor programme via infrastructure PPPs. All the cor-ridor initiatives reviewed have acknowledged the convenience of using PPPs to tap private sources more effectively in order to finance infrastructure works. This modality is already being developed in some countries of the GMS subregion (e.g. China and Thailand), and may be transferred to the remaining members during the next decade. The GMS Business Forum plays a key role in fostering the expansion of PPPs for infrastructure development in these corridors. In Peru, the develop-ment of an improved model for infrastructure PPPs has been the cornerstone of the infrastructure component of the corridor programme. Indonesia’s MP3EI also relies on this scheme to co-fund a large part of the planned infrastructure improvements.
figure 21Degrees of IFI/donor support for developing corridor infrastructure
MP3EI PRA CAREC
GMS
SAGCOT
BAGCI
No support
- +
Technicalassistance
Funding throughgrants and loans
Source: author’s elaboration.

Chapter 6 – Delivery at scale: budget and modalities of interventions 91
BOX 12
The infrastructure component of the PRA Project
Two features distinguish the PrA corridor intervention from the gMS and CAreC pro-grammes: the inversion of the sequential interventions (which component goes first, soft or hard); and how infrastructure development is financed (i.e. direct financing through loans from ifis and government budgets or facilitation of infrastructure PPP design and implementation). unlike gMS and CAreC, the PrA Project did not wait to have improved infrastructure in place to launch soft components seeking to capitalize on the economic impacts of the enhanced connectivity. it started providing BDS in the selected corridors to promote business growth, even before launching the infrastructure PPP component, making the most of the existing, albeit limited, transport infrastructure.
in 2001, as a first step, the PrA Project conducted a study to quantify the economic losses that socio-economic agents in the economic corridors were incurring because of poor transport and energy infrastructure. up to 24 infrastructure projects were assessed to determine which ones would potentially yield the highest direct economic benefits. The rehabilitation of the Tarapoto-Aucayacu stretch of the fernando Belaúnde Terry (fBT) high-way, in the San Martín region, was deemed the project with the highest estimated impact.
The Project held a series of meetings to inform Peruvian members of Congress and senior government officials on the study findings. However, it soon became apparent that the goP had neither the necessary financial resources nor the capacity to borrow beyond the estab-lished public debt ceiling, already capped.73 eventually, the Project adopted a two-pronged strategy. first, it joined forces with the Tocache group – a lobby group formed by a broad cross-section of public officials, private firms and NgOs in the department of San Martín – to promote the rehabilitation of the fBT highway. The Tocache group considered out-of-the-box financing solutions, such as relinquishing the tax exonerations that the department enjoyed at the time and earmarking the resulting revenues for the highway. The idea gained traction and became law in 2005.
The second prong of the strategy drew inspiration from the active involvement of busi-ness people in the Tocache group, and more broadly from corporate participation in trans-port infrastructure development and management – a fairly widespread phenomenon across OeCD countries. uSAiD provided additional funding to formalize the infrastructure PPP component “to explore the potential of concessions as a way to leverage capital investment in transportation by the private sector, both domestically and abroad” (uSAiD, 2008a). The PrA Project provided TA to Proinversión, the Peruvian agency in charge of implementing the national infrastructure concessions programme, from the onset of each concession project design through to transaction closure. Between 2003 and 2007, the Project and Proinversión worked together with the Ministry of Transport and other public entities in designing and implementing five projects: three highways, the expansion of the main Peruvian port and one energy project, summarized in Table 29.
73 GoP and PRA/USAID noted that current and projected government budgets – even when supplemented with donor infrastructure loans – fell far short of meeting the country’s infrastructural requirements.

Making economic corridors work for the agricultural sector92
BOX 12 (Continued)
As mentioned earlier, the PrA Project neither directly financed nor built roads and ports, but supported the goP in designing, structuring and implementing innovative PPP-concession business schemes and transactions to attract private investment and expertise to finance, build, operate and maintain in the long term highways, ports and energy infrastructure projects. its PPP work resulted in uS$584 million in private capital investment commitments to build and rehabilitate roads (iirSA North highway) and port infrastructures (state-of-the art container terminal and improvements to overall Callao port facilities) during the life of PrA i (uSAiD, 2008a), and an additional uS$115 million in road infrastructure investment commitments (iirSA Central highway) proposed for the national five-year infra-structure investment plan from 2012 to 2016 (BNamericas, 2012).
The hallmarks of the PrA Project intervention in infrastructure were: � innovative PPP design and financing schemes to engage private sectors in otherwise not
so attractive concessions; � intense promotional campaigns to ensure the participation of both national and inter-
national bidders; � the vocation to transcend the corridor programme and propose a PPP scheme for coun-
trywide and multisectoral application.
TABLE 29PRA-facilitated infrastructure developments
Item Cost (US$ million) Corridors involved
IIRSA North highway (964 km) 220 Piura (coast), Jaén and Tarapoto (port of Yurimaguas), thus enabling river transport to and from Manaus, Brazil
FBT Highway (450 km) 162 Tarapoto, Huánuco and Pucallpa
IIRSA Central highway (867 km) 115 Connecting Lima with the corridors of Junín, Huánuco and Pucallpa
Callao port (Southern Container Terminal)
Phase IPhase II
364253
Serves all corridors
Four rural electric systems 10.1 Ayacucho, Pucallpa and San Martín
Source: www.proyectopra.com [last accessed August 2013].

Chapter 6 – Delivery at scale: budget and modalities of interventions 93
BOX 12 (Continued)
When the Project’s infrastructure component started operations, there were already some ongoing infrastructure concessions in Peru. However, Peru’s complicated geography makes corridor infrastructure projects expensive, and thin domestic markets prevent many con-cessions from meeting the private sector’s expectations in terms of revenue generation. furthermore, concessions frequently encountered problems pertaining to crossing fibre optic networks and legal and social issues regarding land acquisition and expropriation (BNamericas, 2012).
The Project’s main contribution was the introduction of innovative transaction design features to the existing Peruvian infrastructure concession model, in order to improve not only the bankability and attractiveness of the concessions, but also to protect the public interest by providing mechanisms to share larger than expected revenues. for example, the Project introduced state-of-the-art financial engineering schemes to make the projects more enticing for private investment. One such scheme was developed for the iirSA Central highway concession. To make up for the expected insufficient stream of toll revenues on this highway, the goP agreed to provide a minimum revenue guarantee (determined at the bidding stage). A safeguard mechanism was also introduced – should revenues be higher than expected, a public-private revenue-sharing mechanism would be deployed. Another example is the case of the iirSA North highway concession. The goP introduced annual payments for construction (i.e. securitization of construction progress certificates prorated to the advancement of work), and payments for operation and maintenance of up to uS$15 million, with collections from tolls deducted from the yearly payment. The transaction was further enhanced by a partial credit guarantee from iaDB to cover the goP’s payment obli-gations for an amount up to uS$60 million74 (uSAiD, 2008a). Moreover, a revolving uS$60 million bridge loan was negotiated with the Andean Development Corporation to avoid delays on the commencement of construction works, while the winning concessionaire managed to secure long-term financing (uSAiD, 2006).
in the case of the fBT highway, one of the key features of the financing scheme was the creation of a trust fund specifically earmarked for the completion of the highway, fed by the proceeds of the value-added tax (uS$14 million annually for 50 years) upon the elimination of the fiscal exoneration (upon request of local, provincial and regional governments of the corridor) that the department of San Martin had up to then enjoyed (ibid.). The enhanced model also emphasized the adoption of good design practices to minimize the need to make substantial modifications during contract execution, e.g. completing the appropriate techni-cal prefeasibility, feasibility and environmental studies, as well as studies on land acquisition before awarding the concession.
The PrA Project conducted an aggressive local, regional and international project pro-motion campaign to ensure competitive and transparent bidding processes. it also prepared promotional brochures, sent information bulletins to over a hundred firms and conducted road shows targeting high-level government officials in South America (uSAiD, 2008a).
74 www.proinversion.gob.pe [last accessed May 2013].
Making economic corridors work for the agricultural sector94
BOX 12 (Continued)
eventually, these promotional efforts to foster the participation of international bidders for the concession contracts yielded fruit. The iirSA North highway concession contract was granted to a consortium of Brazilian and Peruvian firms, and that of the new container ter-minal in the port of Callao to a Dubai-Peruvian consortium. These concessionaries brought with them not only ample financial resources but also first-class technical expertise and managerial expertise (ibid.).
The infrastructure component transcended the mandate and lifetime of the project. in 2006, the Peruvian Ministry of Transport and Communications approved the Transport Sec-tor Policy, which specified that transport infrastructure was “[...] not an end in itself, but an appropriate means to foster safe, efficient and quality transport services”75 that help in improving the competitiveness of economic corridors, thus mainstreaming the PrA model. furthermore, in 2007, the Ministry created the “Project Peru programme”,76 designed to improve road infrastructure to connect and integrate economic corridors better, forming a sustainable development axis in order to raise the competitiveness of rural areas. The Peru-vian concession programme for transport infrastructure under the PrA-designed PPP model has kept the momentum going. The regulations of this model were published in 2008 and, as of March 2012, there were 26 transport infrastructure contracts, 14 of which involved highways, amounting to an investment of uS$3.5 billion (BNamericas, 2012).
efforts to improve the competitiveness of Peruvian economic corridors through infra-structural improvements have been further developed under iirSA, the uNASur umbrella programme mentioned in Chapter 3. This programme has taken the iirSA North highway and transformed it into a multimodal transport corridor connecting the Pacific (from the port of Paita on the north coast of Peru) and Atlantic Oceans, through the Brazilian State of Amazonas via three PrA corridors (Sierra La Libertad, Jaén and Tarapoto). The main infrastructural works in the multimodal corridor are the concession of the port of Paita (granted in March 2009 for uS$227.8 million), and a logistics platform in Paita; the iirSA North highway between Paita and the city of Yurimaguas in the Tarapoto corridor; a port, airport and logistics centre in Yurimaguas; and other facilities in the inland water transport corridor formed by the Huallaga, Marañón and Amazon rivers between Yurimaguas and the industrial pole of Manaus, capital of Amazonas State.77
The African agricultural growth corridors use PPPs intensively in various fields, including infrastructure PPPs such as the one mentioned regarding the management of the main ports and railway lines. In particular, they pay attention to ensuring the correct supervision and monitoring of infrastructure PPPs.
75 Ministerial Resolution 817/2006-MTC/09, dated 7 November 2006.76 Ministerial Resolution 223/2007-MTC-02, as amended by Ministerial Resolution 408/2007-MTC/02. 77 www.iirsa.org [last accessed July 2013].
Chapter 6 – Delivery at scale: budget and modalities of interventions 95
6.4 COMPONENTS GEARED TOWARDS WIDENING NATIONAL CORRIDORSMeasures undertaken under Zone II try to address falling trade and rising costs of business, which are among the main contributing factors to a slowdown in economic growth in developing economies. Zone II includes activities that may broadly be termed “area development plans” aiming to develop linkages to the local economy through last-mile or feeder infrastructure; business linkages to producer organizations and SMEs; improvement of urban infrastructure; promotion of indus-trial development; and investments in tourism infrastructure.
The scope of this section is intentionally limited to interventions that add the agricultural dimension to a narrow national corridor. Certainly a narrow corridor could gain in width by developing other economic activities (mining, tourism, banking, etc.), but this possibility will not be investigated here. While the inter-ventions above refer to government initiatives, considerable private investments are also required to achieve meaningful development impacts. This will require public policies that encourage crowding in of private investment, and utilize PPPs as appropriate.
To go from Zone I to II, corridor planners can design an agricultural plan or strategy detailing all the planned interventions. These interventions can be classified into two main categories: those that improve the corridor hardware, and those that enhance its software.
The hardware category comprises improvements in last-mile infrastructure (e.g. feeder roads, irrigation and small dams), and food-specific infrastructure such as wholesale markets, collection points and warehouses. Building last-mile infrastruc-ture is a way to open up the corridor towards the agricultural hinterland with farm-to-market roads and provincial road networks to increase mobility, accessibility and affordability, creating the conditions (functional electricity, transportation and communication infrastructure) to foster agribusiness development. Additionally, the development of secondary or rural roads that link to the corridors, expanding the market and effectively linking agribusiness companies to competitive suppliers of goods and services (such as producer and business associations, ports, customs and rail and road systems) would also contribute to corridor widening. See examples of interventions on last-mile infrastructure in Box 13.
The second category, i.e. food chain-supporting infrastructure, serves as a basis for creating a diversified service industry that includes warehousing, distribution, wholesale and retail operations. This is a critical step towards a more efficient management of the agricultural supply chain, so that it is possible to tap the potential savings resulting from efficiency in private sector logistics by stream-lining areas such as warehousing, shipping, certification and inventory control (Banomyong, 2008).78
78 http://www.yara.com/sustainability/how_we_engage/africa_engagement/growth_corridors/ index.aspx [last accessed August 2013].
Making economic corridors work for the agricultural sector96
BOX 13
Examples of last-mile infrastructure development in economic corridors
The BAgC and SAgCOT initiatives emphasize the importance of developing last-mile infra-structure to alleviate critical constraints hindering commercial agriculture in their respective corridors. Specifically, investments are needed to overcome the low accessibility in rural areas to all-weather feeder roads79 and power networks, and the lack of adequate irriga-tion infrastructure.
BAgCi plans to upgrade sections of rural roads and critically expand coverage in strips of high agricultural potential land in the northern part of Tete, southwestern Manica and east of Dombe in Mozambique (AgDevCo and infraCo, 2010). it also envisages enhancing the coverage of power networks in the Beira Corridor which, although reasonable, leaves many areas of fertile agricultural land unattended. Likewise, the current irrigation area will be expanded significantly to take advantage of the country’s generous endowment of water resources (Domínguez-Torres and Briceño-garmendia, 2011). Out of BAgCi’s target of uS$1.7 billion of private investment, the majority of investment costs pertain to last-mile infrastructure, including on-farm (irrigation) and off-farm infrastructure, which includes the costs of bringing road access, power and water to the farmgate. estimated investment costs are distributed as shown in Table 30.
Similarly, the SAgCOT blueprint calculates that uS$108 million will be needed for mar-keting, storage and processing infrastructure along the corridor, including processing/milling facilities, warehouses and cold storage, and a network of wholesale markets and collection points. Some of these facilities and infrastructure are likely to be funded publicly (e.g. whole-sale markets), and others commercially (agroprocessing plants). However, patient capital will probably be needed to help the private sector to achieve economies of scale and ensure strong farmer-firm linkages in the initial years of the corridor programme (Wef, 2012).
The gMS programme has also developed agriculture-specific last-mile infrastructure, such as agrifood wholesale markets, warehouses, logistics and trading centres and feeder roads linking priority agricultural and agro-industrial hotspots in the corridor with major transport links (ADB, 2008b; 2011a). for instance, fresh primary and wholesale markets have been constructed, at a cost of uS$150 000 each, in certain segments of the gMS cor-ridors, particularly in the Lao People’s Democratic republic, to facilitate the participation of smallholder farmers in agricultural marketing chains (Zola, 2009).
The CAreC programme finances and develops different types of infrastructure in a sequencing manner. in the first phase, the focus is on developing the transport backbone of the corridors. Then comes the turn of last-mile infrastructure, including: (i) infrastructure of corridor towns, such as agricultural collection points, wholesale markets and agricultural warehouses; (ii) agrobased cluster infrastructure; and (iii) infrastructure and facilities that contribute to ensuring that the agricultural products originating from different areas along the corridor meet the standards required by domestic or foreign markets (ADB, 2012e).
79 The countrywide rural accessibility level is only 24 percent, and over 40 percent of rural roads are in poor condition (Domínguez-Torres and Briceño-Garmendia, 2011).
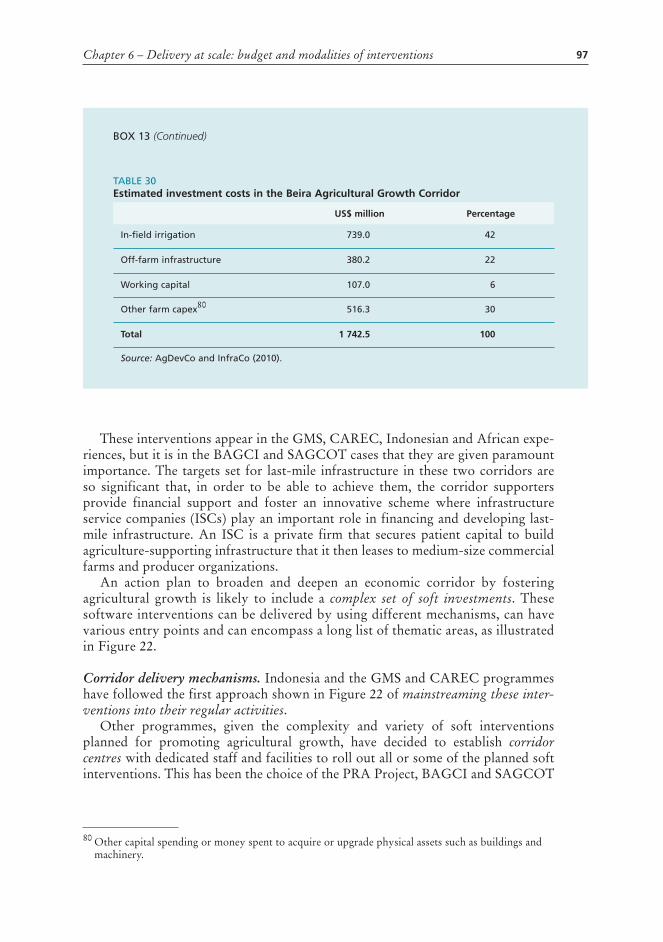
Chapter 6 – Delivery at scale: budget and modalities of interventions 97
BOX 13 (Continued)
TABLE 30 Estimated investment costs in the Beira Agricultural Growth Corridor
US$ million Percentage
In-field irrigation 739.0 42
Off-farm infrastructure 380.2 22
Working capital 107.0 6
Other farm capex80 516.3 30
Total 1 742.5 100
Source: AgDevCo and InfraCo (2010).
These interventions appear in the GMS, CAREC, Indonesian and African expe-riences, but it is in the BAGCI and SAGCOT cases that they are given paramount importance. The targets set for last-mile infrastructure in these two corridors are so significant that, in order to be able to achieve them, the corridor supporters provide financial support and foster an innovative scheme where infrastructure service companies (ISCs) play an important role in financing and developing last-mile infrastructure. An ISC is a private firm that secures patient capital to build agriculture-supporting infrastructure that it then leases to medium-size commercial farms and producer organizations.
An action plan to broaden and deepen an economic corridor by fostering agricultural growth is likely to include a complex set of soft investments. These software interventions can be delivered by using different mechanisms, can have various entry points and can encompass a long list of thematic areas, as illustrated in Figure 22.
Corridor delivery mechanisms. Indonesia and the GMS and CAREC programmes have followed the first approach shown in Figure 22 of mainstreaming these inter-ventions into their regular activities.
Other programmes, given the complexity and variety of soft interventions planned for promoting agricultural growth, have decided to establish corridor centres with dedicated staff and facilities to roll out all or some of the planned soft interventions. This has been the choice of the PRA Project, BAGCI and SAGCOT
80 Other capital spending or money spent to acquire or upgrade physical assets such as buildings and machinery.
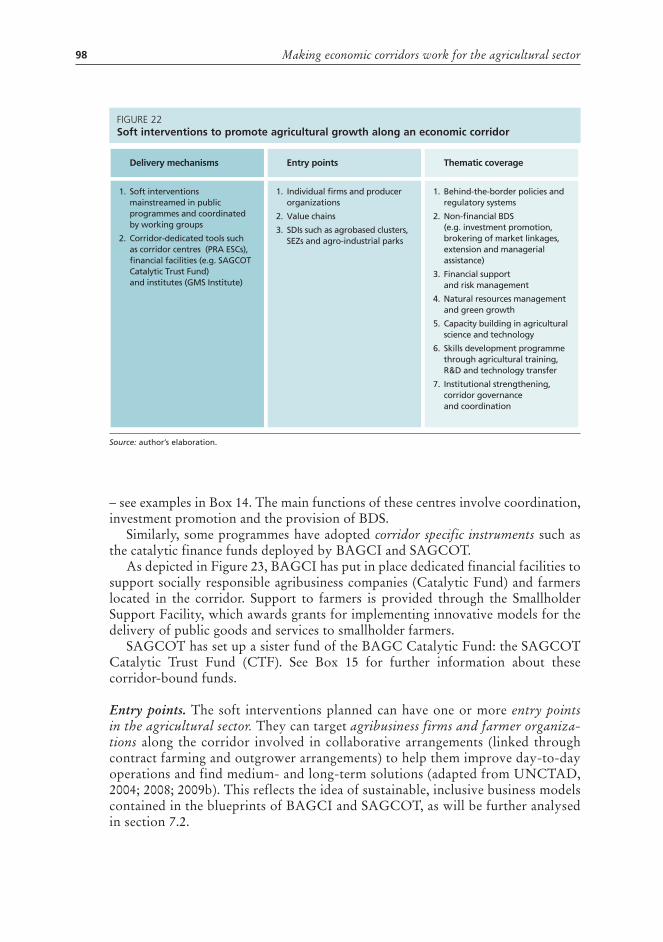
Making economic corridors work for the agricultural sector98
– see examples in Box 14. The main functions of these centres involve coordination, investment promotion and the provision of BDS.
Similarly, some programmes have adopted corridor specific instruments such as the catalytic finance funds deployed by BAGCI and SAGCOT.
As depicted in Figure 23, BAGCI has put in place dedicated financial facilities to support socially responsible agribusiness companies (Catalytic Fund) and farmers located in the corridor. Support to farmers is provided through the Smallholder Support Facility, which awards grants for implementing innovative models for the delivery of public goods and services to smallholder farmers.
SAGCOT has set up a sister fund of the BAGC Catalytic Fund: the SAGCOT Catalytic Trust Fund (CTF). See Box 15 for further information about these corridor-bound funds.
Entry points. The soft interventions planned can have one or more entry points in the agricultural sector. They can target agribusiness firms and farmer organiza-tions along the corridor involved in collaborative arrangements (linked through contract farming and outgrower arrangements) to help them improve day-to-day operations and find medium- and long-term solutions (adapted from UNCTAD, 2004; 2008; 2009b). This reflects the idea of sustainable, inclusive business models contained in the blueprints of BAGCI and SAGCOT, as will be further analysed in section 7.2.
figure 22Soft interventions to promote agricultural growth along an economic corridor
Delivery mechanisms
1. Soft interventions mainstreamed in public programmes and coordinated by working groups
2. Corridor-dedicated tools such as corridor centres (PRA ESCs), financial facilities (e.g. SAGCOT Catalytic Trust Fund) and institutes (GMS Institute)
Entry points
1. Individual firms and producer organizations
2. Value chains
3. SDIs such as agrobased clusters, SEZs and agro-industrial parks
Thematic coverage
1. Behind-the-border policies and regulatory systems
2. Non-financial BDS (e.g. investment promotion, brokering of market linkages, extension and managerial assistance)
3. Financial support and risk management
4. Natural resources management and green growth
5. Capacity building in agricultural science and technology
6. Skills development programme through agricultural training, R&D and technology transfer
7. Institutional strengthening, corridor governance and coordination
Source: author’s elaboration.
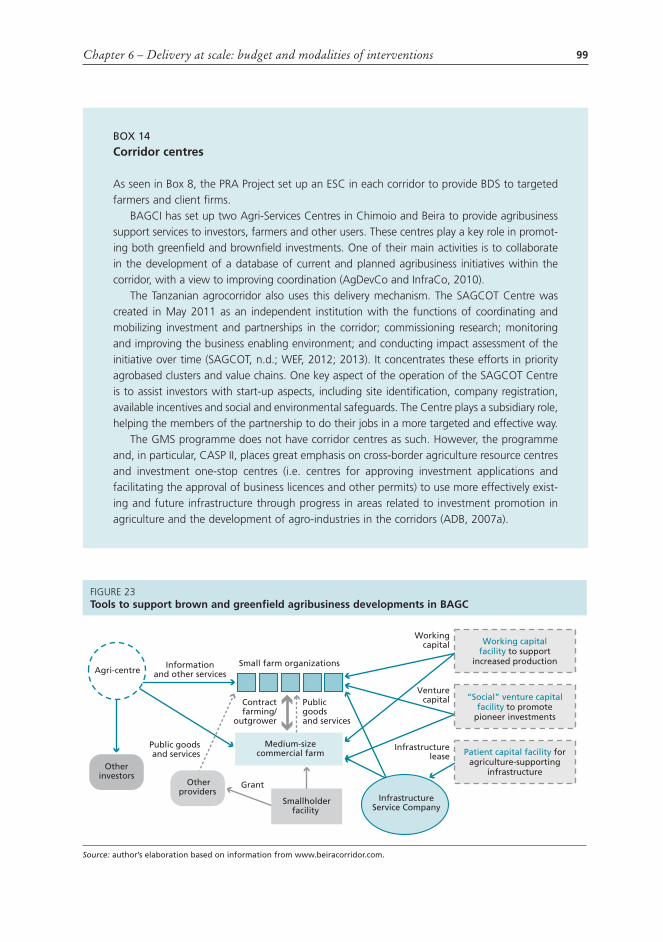
Chapter 6 – Delivery at scale: budget and modalities of interventions 99
BOX 14
Corridor centres
As seen in Box 8, the PrA Project set up an eSC in each corridor to provide BDS to targeted farmers and client firms.
BAgCi has set up two Agri-Services Centres in Chimoio and Beira to provide agribusiness support services to investors, farmers and other users. These centres play a key role in promot-ing both greenfield and brownfield investments. One of their main activities is to collaborate in the development of a database of current and planned agribusiness initiatives within the corridor, with a view to improving coordination (AgDevCo and infraCo, 2010).
The Tanzanian agrocorridor also uses this delivery mechanism. The SAgCOT Centre was created in May 2011 as an independent institution with the functions of coordinating and mobilizing investment and partnerships in the corridor; commissioning research; monitoring and improving the business enabling environment; and conducting impact assessment of the initiative over time (SAgCOT, n.d.; Wef, 2012; 2013). it concentrates these efforts in priority agrobased clusters and value chains. One key aspect of the operation of the SAgCOT Centre is to assist investors with start-up aspects, including site identification, company registration, available incentives and social and environmental safeguards. The Centre plays a subsidiary role, helping the members of the partnership to do their jobs in a more targeted and effective way.
The gMS programme does not have corridor centres as such. However, the programme and, in particular, CASP ii, places great emphasis on cross-border agriculture resource centres and investment one-stop centres (i.e. centres for approving investment applications and facilitating the approval of business licences and other permits) to use more effectively exist-ing and future infrastructure through progress in areas related to investment promotion in agriculture and the development of agro-industries in the corridors (ADB, 2007a).
figure 23Tools to support brown and greenfield agribusiness developments in BAGC
Otherinvestors
Venturecapital
Workingcapital
Infrastructurelease
Small farm organizations
Grant
Informationand other services
Public goodsand services
Medium-size commercial farm
Contract farming/
outgrower
“Social” venture capital facility to promote
pioneer investments
Patient capital facility for agriculture-supporting
infrastructure
Publicgoodsand services
Agri-centre
InfrastructureService Company
Otherproviders
Smallholderfacility
Working capitalfacility to support
increased production
Source: author’s elaboration based on information from www.beiracorridor.com.

Making economic corridors work for the agricultural sector100
BOX 15
Corridor financial facilities
The BAgC blueprint considered three types of financial facilities, as illustrated in figure 23: a working capital facility, a social venture capital facility and a patient capital facility.81 So far, only the social venture facility has been put in place under the name of the Beira Catalytic fund (BCf). The fund was set up in 2010 with an initial endowment of uS$20 million with support from the governments of Mozambique, Norway, the Netherlands and the united Kingdom.82 AgDevCo manages the fund.83 This facility invests “social” venture capital in early-stage agribusiness projects, taking out many of the front-end costs and risks that deter private investment in the corridor. More specifically, the fund makes debt and equity invest-ments on attractive terms to support the capital structure in the development of both exist-ing and greenfield agribusinesses (on-farm operations, value addition and services). it also provides entrepreneurs with managerial and technical support through the full project devel-opment cycle, from design to implementation (e.g. helping to secure access to land respon-sibly), as seen in figure 24. in particular, it helps to leverage domestic and foreign capital in support of the business, including local credit facilities and guarantees, as well as patient capital from the international community to fund irrigation and other last-mile infrastructure.
figure 24 Support to entrepreneurs provided by the Beira Catalytic Fund
Source: author’s elaboration based on AgDevCo, 2012.
The venture capital provided is tied to the recipient’s commitment to supply affordable goods, services and end-markets to smallholder farmers. Amounts invested by the BCf are typically in the range uS$50 000 to uS$500 000 per business (AgDevCo, 2012). BCf operates as a competitive,84 revolving facility85 that seeks to recover its capital and make a financial return (in the range of 5–10 percent overall) where available from incoming com-mercial investors.
81 See Glossary.82 http://www.agdevco.com/userfiles/file/AgDevCo %20Brochure %20June %202013 %20low
%20res.pdf [last accessed July 2013].83 http://www.agdevco.com [last accessed July 2013].84 Calls for proposals are regularly published. 85 All returns are recycled into funding new agribusiness opportunities.
2
Work withlocal communitiesand businesses tosecure land rights
1
Identifyproject withstakeholdersparticipation
3
Feasibility study(economic,social and
environmental)
4
Develop�nancing
plan and buildinfrastructure
5
Exit by saleto commercial
investors
Chapter 6 – Delivery at scale: budget and modalities of interventions 101
BOX 15 (Continued)
As of february 2013, BCf had invested over uS$3 million in 12 projects, directly ben-efiting over 10 000 smallholder farmers.86 The large majority of the supported projects fund commercial and outgrower production of crops (e.g. citrus, banana, litchis and other fruit, organic sugar, maize and seeds) and livestock (goat products and broiler chickens) (AgDevCo, 2012). The portfolio of the BCf is expected to reach approximately 25 projects in a way that optimizes the achievement of direct impact at scale for smallholders while at the same time recognizes the need to build agribusinesses across the extended value chain (DfiD, 2013). BCf’s performance is measured in terms of the income and capital generated from the facility, as well as the business turnover, profit and formal jobs generated by the fund portfolio (i.e. investee businesses) (ibid.).
Over time, other finance and insurance mechanisms are expected to complement this facility. examples of these mechanisms are working capital and patient capital facilities, and weather-index insurance products for agriculture. An example of the latter type of tool is a pilot index-based weather microinsurance product for maize, soybeans and sesame farmers in the Chimoio region of Manica province, recently launched by BAgCi, in partnership with AgDevCo and a local agricultural training college, instituto Superior Politécnico de Manica (iSPM), a technical university.87
The Smallholder Support facility is a matching-grant facility88 managed by the BAgC Partnership (see Chapter 7) that finances the provision of public goods and services89 to smallholder farmers in the framework of a wide range of sustainable and replicable initia-tives geared to integrating smallholder farmers into markets. These initiatives can be divided into two main categories: private sector-driven outgrower and contract farming schemes in priority value chains, and innovative models for supplying agricultural support services (e.g. technology development and transfer, farmer organization, training and credit) to small-scale producers.
Such grants are extended to up to uS$100 000 per annum, for a maximum of two years. eligible applicants are farmers’ organizations, private firms, research institutions and NgOs that are able to demonstrate that a “one-off” investment can result in a sustainable increase in smallholder income, without the need for an ongoing subsidy. it is seen as a “smart subsidy”90 to support the non-commercial components of smallholder support programmes and induce earlier adoption of improved farming technologies. examples include demon-stration plots (e.g. Phoenix Seeds has established over 58 demonstration sites of maize and
86 http://www.agdevco.com/userfiles/file/BAGC %20press %20release_photosv3.pdf [last accessed July 2013].
87 http://seedinvestors.blogspot.com.es/2012/12/beira-agricultural-growth-corridor-bagc.html [last accessed July 2013]
88 See Glossary.89 See Glossary.90 See Glossary.

Making economic corridors work for the agricultural sector102
BOX 15 (Continued)
soya in the corridor); extension and training programmes (e.g. the establishment of iSPM’s agricultural mechanization centre to provide short-term courses to tractor and machinery operators); capacity building for farmers’ organizations; and last-mile infrastructure to serve smallholder farmers, and particularly irrigation (e.g. rDi’s “hub and spoke” irrigation scheme for avocados) (DfiD, 2013).
As in the case of the Beira Corridor, the SAgCOT CTf is the mechanism by which sub-projects are appraised and implemented in the corridor. The CTf has two windows. The first is a Matching grant facility (Mgf) for established commercial agribusinesses working with smallholder farmers to build or extend competitive supply chains in a way that generates income and creates employment for smallholders. The second is a Social Venture Capital fund (SVCf) to encourage the development and expansion of smaller and younger agri-business firms (provided with start-up finance), also linked to smallholders (government of Tanzania, 2012). The CTf is expected to be at least uS$50 million in size, although proposed contributions are much higher: uS$73.75 million (see breakdown of this figure in Table 31). The CTf counts on financial backing from the Tanzanian government and development partners (DfiD, 2012).
TABLE 31 Estimated contributions to the SAGCOT Catalytic Trust Fund
SAGCOT Catalytic Trust Fund
Matching Grant Facility World Bank US$40-45 million
Social Venture Capital Fund Government of the United Republic of Tanzania
USAID
DFID
US$1 million.
US$12.5 million
£10 m ~US$15.25 million
Total US$68.75–73.75 million
Source: DFID, 2012; USAID, 2012.
Alternatively or coincidently, these soft interventions can be designed at the value chain level or, in other words, agricultural corridor-bound programmes can concen-trate investment on a value chain or selection of agricultural value chains within a corridor. Farooki (2012) notes the policy need to align infrastructure spending with development needs, for example, around agrifood chains. The rationale for working at this level is that the selection of value chains that stand out as strategically impor-tant avoids spreading out limited resources. This option also provides a framework for attaining better results by launching value-chain-bound actions, such as improv-ing supply chain management; creating a database of inputs and services providers for the value chain; engineering value-chain finance schemes; and launching value-chain-wide partnerships to coordinate collective efforts to define and implement a roadmap for the value chain. Successful value-chain interventions are characterized by the

Chapter 6 – Delivery at scale: budget and modalities of interventions 103
presence of interrelated elements such as active links for farmers to markets, support to farmer aggregation and broad-based access to finance. Given the importance of value-chain targeting in corridor programmes, this issue is studied in section 6.6.
Another option is to support the development of agrobased clusters by selecting areas with potential for improving economies of scale and reducing transaction costs for the acquisition of inputs and services specific to the agribusiness activities that are to be promoted, such as agricultural inputs, machinery, or logistics-related services (UNCTAD, 2004; 2008; 2009b). This strategy favours the appearance and clustering of service providers, wholesalers, retailers, exporters and other agricultural traders, and their associations (World Bank, 2009b). Clustering efforts are often coupled with the promotion of SEZs and agro-industrial parks along the corridor, according to the advantages of the specific region. The objective is to generate a diversified agro-industrial base, in the sense of covering a wide range of agroprocessing activi-ties (notably transitioning towards higher-value processed commodities), but also in terms of mixing small-, medium- and large-scale agroprocessing companies.
BAGCI is one of the corridor programmes that promotes the concentration of agricultural activity in selected clusters or locations where processors, agricultural support service providers (e.g. extension and finance), specialized suppliers and associated institutions are also present. SAGCOT shares the clustering approach of the Beira model, as described in Box 16.
In Indonesia, the development of growth centres on the establishment of clusters and SEZs is one of the three MP3EI pillars. The location of agrobased clusters and SEZs responds to the logic of maximizing the efficiency of agricultural crop move-ment patterns to processing zones and ports (CMEA, 2011). The Indonesian mas-terplan foresees a sequencing of agrobased cluster development in support of the six economic corridors in three phases: 2011–2014, 2015–2019 and 2020–2030. The nature of the interventions outlined in each phase depends on the level of perfor-mance and existing critical mass of firms and supporting/connective infrastructure in each corridor. In particular, the type and size of infrastructure improvements are dictated by the economic activities carried out in the clusters.
These SEZs are multisectoral platforms (agriculture and other sectors) linked to agricultural clusters and plantation nodes to stimulate value addition in the corridors (ibid.). One example of agribusiness SEZs is Sei Mangke in the northern part of the Sumatra Corridor. This SEZ has been earmarked as the centre for palm oil-based industries (Presidential Decree 32/2012). The public sector has made commitments to fund infrastructure developments to improve the connectivity of the SEZ – primarily a 30-km railway line and the development of the nearby ports of Dumai and Belawan. The private sector reacted positively to this initiative: many multinational companies submitted plans to the tune of US$1 billion to establish themselves within the SEZ. However, land acquisition issues were encountered because of the refusal of the head of the district or bupati, empowered under regional autonomy laws, to approve the land transfer.91 This is a reflection of the
91 http://www.accessmylibrary.com/article-1G1-301373032/mp3ei-infrastructure-projects-flounder.html [last accessed July 2013].

Making economic corridors work for the agricultural sector104
lack of coordination among line ministries, agencies and local governments, which may hinder the implementation of MP3EI.
Most corridor models opt for a combination of all the above entry points. For instance, the agricultural plan of the GMS programme (CASP II) underscores that
BOX 16
Clustering in SAGCOT
SAgCOT has planned to focus initially on six agrobased clusters. These clusters have been selected on the basis of the presence of large commercial farms, land availability, transport and productive infrastructure, along with the potential for profitable groupings of farming and processing to emerge over time. Building on existing operations and planned invest-ments, these clusters are intended to bring together nucleus farms and outgrower schemes, irrigated block farming operations, processing and storage facilities, transport and logistics hubs, agricultural research stations and related service providers (SAgCOT, 2011).
each cluster requires investments along the entire agricultural value chain, and particu-larly those needed to improve last-mile infrastructure to farms and local communities. Some investments are public goods, for example rural infrastructure, and as such will be provided by the goT and its development partners – uS$1.3 billion according to the SAgCOT blue-print. Others, with potential to generate financial returns will likely come from the private sector – estimated at uS$2.1 billion – such as professionally managed irrigated farm blocks (SAgCOT, 2010; 2011).
Six priority sites have been selected, communities consulted, and environmental and social impact assessments performed. firms interested in investing in the clusters can obtain land leases through the National Land Allocation Committee. Land leases are bid out to investors ranked according to scoring criteria, which included the extent of outgrower sup-port, value addition, community integration and protection of natural resources.
These clusters have been divided into three categories depending on the relative ease or difficulty involved in developing agribusiness ventures. Accordingly, “Type 1” clusters incor-porate most of the “quick win” projects, where significant development of medium- and large-scale commercial farming, public irrigation schemes and backbone infrastructure are already in place. examples of Type 1 clusters are the ihemi (figure 25) and Kilombero clusters. “Type 2” and “Type 3” require further investment in backbone infrastructure and careful assessment of social and environmental impacts.
The initial focus on Type 1 clusters is critical to establish the momentum needed for SAg-COT’s long-term success. for example, in the ihemi and Kilombero clusters, over a dozen new or expanded nucleus farms can be established in the first five years – in livestock, sugar, rice and other cereals, and high-value horticulture – all with associated outgrower/service block schemes to extend the benefits to smallholder farmers in the vicinity.
Agribusiness SeZs will also be deployed along key locations of SAgCOT. These SeZs will give preferential treatment to all agricultural production businesses, including – in addition to agroprocessing – distribution of agricultural inputs, manufacturing and hiring of agroma-chinery, and packing and transportation of agricultural products (OeCD, 2013).

Chapter 6 – Delivery at scale: budget and modalities of interventions 105
building regional competitiveness requires the promotion of pro-poor agricultural value chains, agrobased clusters and SEZs, and cross-border contract farming.
Thematic coverage. The range of topics covered by the different corridors varies greatly. However, seven broad clusters of soft agrobound interventions used to develop agrocorridors, either individually or concomitantly, can be individualized.
These are the following:1. Improved behind-the-border policies and regulatory systems. Policy research
and dialogue to provide an enabling environment for private investments in
BOX 16 (Continued)
figure 25 Ihemi: example of an agricultural cluster in the SAGCOT corridor
Source: SAGCOT, 2011. Iringa
MpwapwaDistrict
IringaDistrict
MufindiDistrict
KilosaDistrict
KilomberoDistrict
Mafinga
Kihansidam
Kiweredam
Nyanzwadam
Kisolanza
Sao HillCattleRanch
KisolanzaHorticulture
Project
Corporation Mill
National Milling
Asas Dairy Farms
Unilever Tea
Stone Valley Tea
Mufindi Tea
Mtanga Farm
Kilombero Rice Plantation
Merera Plantation
RuahaNational
Park
Main road Market
Research station
Mixed farm
DamCompany
Source: author’s elaboration (UN Map No. 4045 Rev. 7, November 2011, Department of Field Support - Cartographic Section).

Making economic corridors work for the agricultural sector106
agribusiness are an important part of many corridor programmes. Broadly speaking, policy areas of interest to agrobased corridors are those dealing with agricultural and agro-industrial development, trade, food security, the adoption of climate friendly practices, territorial planning and SME-friendly policies. Specifically, there are seven policy topics that appear recurrently in this study. � Public engagement with the private sector. Agrocorridor programmes
require the active engagement of private agents such as farmers and their associations (Kaarhus and Woodhouse, 2012), SMEs and large domestic and multinational agribusiness companies. Agricultural corridor developers may also want to engage private companies already present in the corridor but working in other sectors such as oil and mining (as in the case of the Peruvian corridors documented in later chapters), which are starting to show interest in becoming major investors in the agribusiness sector. If governed and regulated effectively, agribusiness PPPs may bring increased production, employment generation, increased revenues and incomes, as well as increased tax revenues. However, a supportive legal framework is essential to do this. As a result, many of the corridor programmes studied have begun to improve their legal, regulatory and policy framework to make it more conducive to public-private collaboration, including specific PPP legislation. For example, SAGCOT benefits from recent enhancements in the Tanzanian regulatory framework to encourage private participation across infrastructure sectors. The new legal instruments (PPP Act 2010, the PPP Regulations 2011 and the Public Procurement Act 2011) are accompanied by the efforts of the country’s two PPP units: a PPP Coordination Unit, placed under the Tanzania Investment Centre (TIC) and tasked with promotion and attraction of PPP investors; and a PPP Finance Unit, placed under the Ministry of Finance in order to ascertain the affordability, fiscal consequences and value for money of proposed PPP projects (OECD, 2013).
� Land policy. Most corridor programmes have engaged in policy dialogue to improve land use and tenure agreements. For example, the PRA Project stimulated a secure land titling initiative, SAGCOT seeks to promote equitable land-lease systems through regional land banks, and BAGCI is working towards a land policy that makes land accessible to investors in a way that is agreeable to local governments and communities.
� Enhancement of the legal, regulatory and policy framework that enables contract farming. Corridor programmes have embarked upon two types of actions to promote contract farming: initiatives to debottleneck regulations and procedures that made the implementation of contract farming and outgrower arrangements difficult; and policy interventions geared towards fostering more equitable agreements, such as the “2+3” policy in the Lao People’s Democratic Republic (ADB, 2011d).
� Investment promotion policies, in particular those necessary to catalyse investment in specific SEZs and agrobased clusters so that they become trade and service hubs of the corridors.
� Trade reforms. Dialogue has been extremely active to remove restrictive agricultural trade policies (such as export bans on maize and rice and the regulatory restrictions on trade imposed by some crop boards affecting

Chapter 6 – Delivery at scale: budget and modalities of interventions 107
SAGCOT), and facilitate the import of seeds, other agricultural inputs and machinery, thanks to simplified import procedures and light taxation (OECD, 2013).
� Improvement and enforcement of standards, such as food safety and traceability standards, organic, and sanitary and phytosanitary standards (SPS). Cases in point are the PRA Project’s policy dialogue on SPS and BAGCI’s work regarding fruit fly regulations.
� Specific policies conducive to the development of prioritized value chains such as biofuel policies (GMS and MP3EI) and certifiable forest concession development (PRA), which is essential to develop the forest products value chain.
Most corridors have taken the approach of addressing issues of policy and creating an enabling environment, as these issues arise in the course of programme implementa-tion. For example, the dialogue between the PRA Project and the GoP led to stream-lining and strengthening the national policies for forest concessions and food safety standards. An alternative to this approach is to address multiple agricultural policies through a coordinated set of actions. Mozambique, the United Republic of Tanzania and other Grow Africa countries participating in G8’s New Alliance for Food Security and Nutrition Country Cooperation Frameworks have made upfront commitments to improve policy and create an enabling environment for agribusiness development as part of a joint agreement with development partners and donors (WEF, 2013).
2. Non-financial BDS to develop potential business opportunities in the agri-cultural sector. The provision of non-financial BDS is key to improving the corridor’s domestic sales and exports, mobilizing investments and generating employment in the corridor. These services include: brokering of market link-ages and promotion of contract farming in the interior areas of corridor coun-tries; investment promotion; SME-support services; information services; and other technical and entrepreneurial assistance as required. More specifically, these services include the following: � Brokering of advantageous market linkages and promotion of contract
farming and outgrower arrangements. This issue is the cornerstone of almost all the corridors analysed. However, they have approached the topic from various angles and hence have arrived at different strategies. For example, one of the main functions of the PRA ESCs is to act as brokers, advisors and moral guarantors of contract farming deals between buyers and local farmers. Other corridors take a less direct but equally important engagement in contract farming via other means of promotion, such as innovative financial models for offering incentives and support services to agribusiness farmers and producer organizations engaged in contract farming and outgrower deals, as found in BAGCI and SAGCOT; facilitating information; and offering incentives, among other mechanisms.
� Investment promotion. Agricultural corridors are means to reduce critical constraints that limit investments required to enhance the competitiveness and inclusiveness of the agricultural and agro-industrial sectors, by providing, inter alia, critical infrastructure (waterbound transport and railway and road systems, including farm-to-market roads and provincial road networks to

Making economic corridors work for the agricultural sector108
increase mobility, accessibility and affordability of agricultural products) and adopting measures to improve the territorial and sectoral investment environment. Therefore, corridor developers need to: (i) analyse whether the conditions required for policies and strategies promoting investment in agribusiness to be effective are in place; (ii) characterize the coordination requirements among local stakeholders, the private sector, government bodies (including Ministries of Agriculture and Trade and Industry, investment promotion agencies (IPAs) and local/regional government units) and international institutions where applicable; and (iii) identify the specific channels through which agricultural corridors can influence investor decisions (SAGCOT, 2011; Milder et al., 2012).
� Promotional and support measures targeting SMEs in corridor areas by upgrading production standards, management and marketing, and developing the link of SME production processes with existing large enterprises. Corridors could reduce the size threshold and simplify the application process when applying for incentives, and propose stronger intellectual property rights assistance for SMEs. Clearer supply-side policies for improving human resources and infrastructure in specific sectors eliciting investment linkages could also be considered.
� Corridor programmes, particularly through dedicated corridor centres, can facilitate access to information critical for the development of agribusinesses, such as market information, information about providers of inputs and services and information on available financial and risk management products. For example, a key function of the Peruvian and Indonesian corridors is to facilitate farmers’ access to financial services via provision of information and strategic partnerships.
� Other technical and entrepreneurial assistance regarding production and marketing extension services, entrepreneurial development and couching, market research and intelligence, and advice on post-harvest handling and value addition through agroprocessing, among other issues. In particular, the introduction of innovative, efficient extension models is crucial for agribusiness development in the corridor.
3. Financial and risk management tools. These include catalytic finance and finance to promote market access and the provision of embedded services, such as agricultural extension. The African corridor programmes studied have rolled out dedicated financial facilities to support greenfield investments by companies with socially responsible business models, as well as innovative models for delivering public goods and services to organized smallholder farmers located in the corridor. These corridors have also devised risk man-agement tools, such as loan guarantees and currency risk instruments to help leverage capital from national banks into agribusiness firms operating in the corridor. Another option they have explored is to pilot index-based weather microinsurance for selected corridor crops, as done by BAGCI (Box 15). Another example pertains to the collaboration in SAGCOT and the Sulawesi Corridor in Indonesia between corridor managers and local banks to develop warehouse receipts systems for key corridor crops.
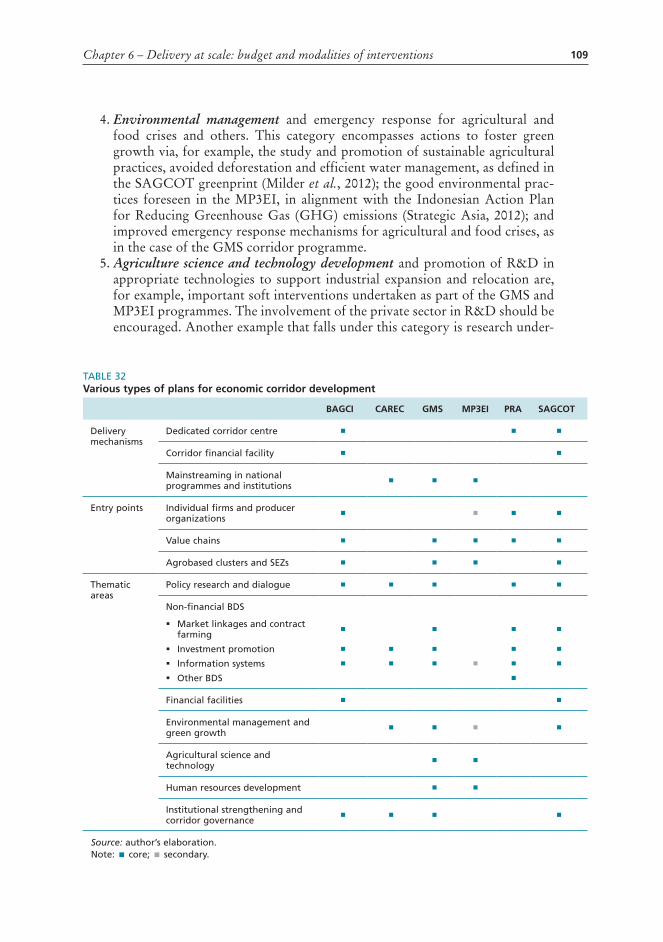
Chapter 6 – Delivery at scale: budget and modalities of interventions 109
4. Environmental management and emergency response for agricultural and food crises and others. This category encompasses actions to foster green growth via, for example, the study and promotion of sustainable agricultural practices, avoided deforestation and efficient water management, as defined in the SAGCOT greenprint (Milder et al., 2012); the good environmental prac-tices foreseen in the MP3EI, in alignment with the Indonesian Action Plan for Reducing Greenhouse Gas (GHG) emissions (Strategic Asia, 2012); and improved emergency response mechanisms for agricultural and food crises, as in the case of the GMS corridor programme.
5. Agriculture science and technology development and promotion of R&D in appropriate technologies to support industrial expansion and relocation are, for example, important soft interventions undertaken as part of the GMS and MP3EI programmes. The involvement of the private sector in R&D should be encouraged. Another example that falls under this category is research under-
TABLE 32Various types of plans for economic corridor development
BAGCI CAREC GMS MP3EI PRA SAGCOT
Delivery mechanisms
Dedicated corridor centre ¾ ¾ ¾
Corridor financial facility ¾ ¾
Mainstreaming in national programmes and institutions
¾ ¾ ¾
Entry points Individual firms and producer organizations
¾ ¾ ¾ ¾
Value chains ¾ ¾ ¾ ¾ ¾
Agrobased clusters and SEZs ¾ ¾ ¾ ¾
Thematic areas
Policy research and dialogue ¾ ¾ ¾ ¾ ¾
Non-financial BDS
� Market linkages and contract farming
¾ ¾ ¾ ¾
� Investment promotion ¾ ¾ ¾ ¾ ¾
� Information systems ¾ ¾ ¾ ¾ ¾ ¾
� Other BDS ¾
Financial facilities ¾ ¾
Environmental management and green growth
¾ ¾ ¾ ¾
Agricultural science and technology
¾ ¾
Human resources development ¾ ¾
Institutional strengthening and corridor governance
¾ ¾ ¾ ¾
Source: author’s elaboration. Note: ¾ core; ¾ secondary.

Making economic corridors work for the agricultural sector110
taken in the framework of corridor programmes on biofuel production and climate change adaptation strategies.
6. Skills development in agricultural policy and extension, among other issues. Again, the GMS and MP3EI programmes dedicate resources to develop human resources and equip them with the skills necessary to increase the competitiveness of specific value chains, as well as general agricultural issues.
7. Institutional strengthening, corridor governance and coordination. This cat-egory refers to actions to strengthen and build the capacities of both corridor institutions (corridor governing bodies, corridor centres, fund managers and institutes, etc.) and national organizations that are relevant for the implemen-tation of the corridor programmes, such as national institutions with a man-date to ensure food safety and SPS, to foster investment in agriculture (Cham-bers of Commerce in the case of GMS, and IPAs in BAGCI and SAGCOT). In some cases, the corridor champion incorporates capacity-building activities in the corridor programme with a view to empower national governments of corridor countries to step up mobilization efforts to meet financing needs, by accessing specialized global funds and other opportunities offered by the international community and partners in the private sector.
Figure 26 summarizes the information presented in this section regarding soft interventions for widening national corridors by fostering the development of the agricultural sector. It refers to the delivery mechanisms, entry points and thematic coverage of the soft interventions undertaken in the national corridor experiences studied.
6.5 CORRIDOR COMPONENTS DEALING WITH REGIONAL INTEGRATION: FROM NATIONAL TO REGIONAL CORRIDORS
In the GMS and CAREC regional corridor programmes the majority of interven-tions fall under Zones III and IV, given that their emphasis is on regional coordina-tion and joint regional planning and implementation.
Regional corridors fulfil a unique role in the promotion of intraregional trade and investments and, by doing so, they increase regional competitiveness and pro-ductivity. The regionalization of corridors involves enhancing physical connectivity across nations by diminishing transportation costs and cross-border transactions. The above implies not only improving the infrastructure hardware (e.g. regional highways and infrastructure at border crossing points) but also facilitating cross-border transport and custom procedures and addressing other important software concerns, such as road safety and the incorporation of climate concerns in road upgrading and maintenance. For example, the GMS corridor programme implements a Cross-Border Transport Agreement (CBTA) that seeks to put in place simplified and harmonized customs procedures (ADB, 2008b). Developing and strengthening logistics companies, upgrading vehicles and standardizing procedures in the corridor may also enhance the regionality of narrow corridors. These are the type of inter-ventions implemented in Zone III. The private sector (notably logistics firms) has a critical role to play in Zone III development, as the lead stakeholder in enhancing transport and trade facilitation. In recognition of this, the GMS corridor programme has supported the establishment and built the capacities of a regional association of

Chapter 6 – Delivery at scale: budget and modalities of interventions 111
logistics companies in GMS countries. Clearly, a well-performing logistics sector can reduce costs and intensify the flow of goods and services across the corridor.
From the point of view of institutional connectivity, a regional corridor strengthens the competitiveness of agriculture and other selected sectors, thanks to economies of scale generated by cross-border trade and investments and the provi-sion of regional public goods associated with agricultural development and natural resources management. One example is the GMS initiative for sharing agricultural/market information across the regional corridors via public-private collaboration. This initiative encompassed knowledge transfer activities on post-harvest (RETA 9036) and rice information technology (RETA 9047); and knowledge management initiatives, such as operationalizing the Agriculture Information Network Service, officially launched during the GMS Agriculture Ministers’ Meeting in April 2007. Furthermore, regional corridors support the development of the private sector (e.g. agribusiness firms and farmers’ organizations) through joint financial, technologi-cal, production and other collaboration (ADB, 2011c; 2011e; 2012e; ADBI and EE, 2009; IaDB, 2011). An example of this is presented in Box 17. These interventions are characteristics of Zone IV.
Zone IV marks the emergence of broad regional corridors in which cross-border initiatives are coordinated among the corridor countries, i.e. interventions to widen the corridor are undertaken beyond the scope of a country’s own territory. A case in point is a corridor initiative in which agricultural investments are coordinated between two or more countries (Carciofi, 2012), for instance, cross-border SEZs, agrobased parks, clusters and other cross-border investments. In the GMS corridor programme, the responsibility of fostering cross-border investments is the mandate of member countries, supported by the GMS Working Group on Investment, which guides the implementation of SFA-TFI, in collaboration with the GMS ECF and the Business Forum. A representative case of cross-border investments along GMS corridors is the large long-term investment92 of Thailand’s biggest producer and exporter of sugar, Mitr Phol Sugar Corp., in Savannakhet, Lao People’s Democratic Republic, to serve the Laotian market and export to China and the Republic of Korea (ADB, 2008c; Bafoil et al., n.d.).
Cross-border agricultural clusters and SEZs have become prominent fixtures of regional development in the GMS, as determined by the overall strategy plan to foster the clustering of the industries along the corridors (ADB, 2010a). Many of these growth areas are located in or connected to borders between Thailand and the remaining GM5 countries (ADB, 2012f). They deal with both cash crops (e.g. maize, soybeans, green beans, peanuts, potatoes, cashew nuts and eucalyptus) and biofuel crops (e.g. oil palm and sugar cane). Private firms participate actively, especially in ensuring reliable input supplies (e.g. agricultural products) by relocating close to the border or entering into contract farming to guarantee supply availability (ibid.).
92 US$22.5 million in a 40-year concession.

Making economic corridors work for the agricultural sector112
BOX 17
Engaging the private sector in regional corridor programmes: the case of GMS
To ensure that private sector perspectives were well reflected in the deliberations of all the gMS sector fora and working groups, the gMS programme launched the gMS Business forum in 2000, with support from ADB and the united Nations economic and Social Com-mission for Asia and the Pacific (uN eSCAP). This forum brings together the business com-munity throughout the subregion via the national Chambers of Commerce and industry.93 it provides a channel for public-private dialogue on policy issues; promotes networking among enterprises, business chambers and iPAs in the context of gMS-related activities; fosters the expansion of PPPs for infrastructure development and encourages the develop-ment of SMes; and plays a vital role in the capacity building of the private sector and its associations in the gMS.94 in particular, the forum supports the implementation of CASP and CBTA, especially the development of business networking along the corridors and the development of quality standards for services. for example, in 2010, the forum established a private sector-led Trade and Transport facilitation Task force (TTf-TAf) to review the busi-ness environment and facilitate the implementation of customs and transit systems in all the corridors. in 2011, the forum set up a unified platform for trade, transport, and logistics companies, called the gMS freight Transport Association (freTA) to support TTf-TAf and work together with gMS governments.
A fairly recent development in the gMS programme governance is the establishment of an umbrella structure at the corridors, known as the economic Corridors forum (eCf). This forum is the main advocate and promoter of multisector coordination in the gMS corridors by rais-ing awareness of needs and priorities, and increasing the involvement of local authorities and private actors in corridor affairs (ADB, 2011a). The first eCf took place in Kunming, China, in June 2008, followed by the eCf-2 in 2009, the eCf-3 in 2011 and the eCf-4 in 2012.95
These agricultural clusters now appear to be an overriding principle of the GMS corridor programme, especially when the ASEAN-China Free Trade Area is taken into account. The rationale behind this is that these clusters offer an opportunity
93 www.gmsbizforum.com [last accessed July 2013].94 Ibid. 95 ECF-2, held in Phnom Penh, Cambodia in September 2009, “GMS Economic Corridors: Pathways
to an Integrated, Harmonious and Prosperous Subregion”, discussed and generally agreed with the directions set forth in the corridor strategy and action plans. ECF-3, “Strengthening Pathways for Sustained Progress in the GMS”, took place in Vientiane, Lao People’s Democratic Republic, in June 2011. ECF-4, “Towards Implementing the New GMS Strategic Framework (2012–2022): Expanding, Widening, and Deepening Economic Corridors in the GMS”, which took place in Mandalay, Myanmar in June 2012, sought to promote strong country and sector ownership further, as a critical requirement for effective delivery of an investment framework aligned with the development of inclusive economic corridors in the GMS.
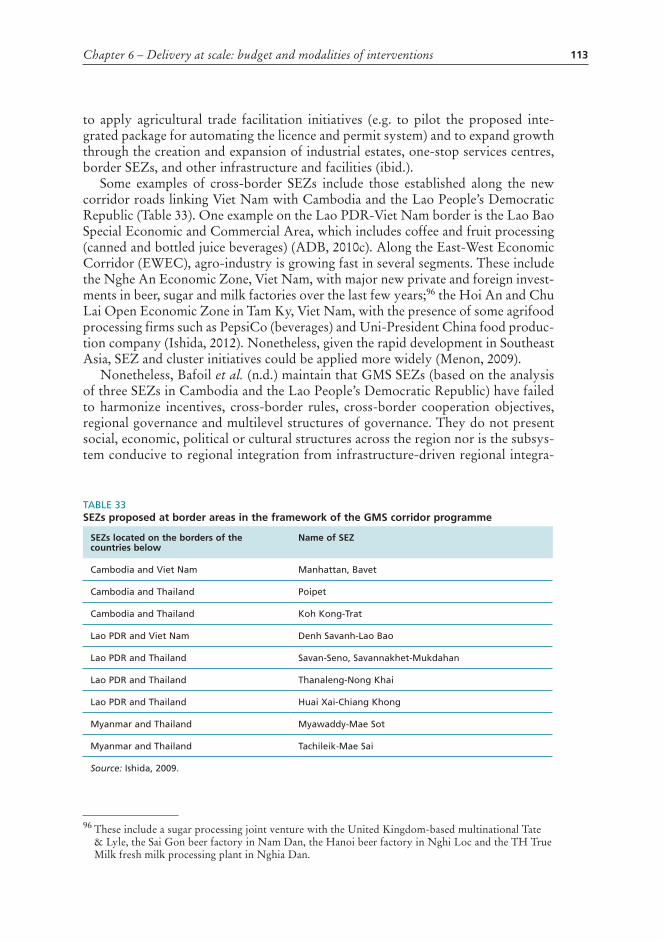
Chapter 6 – Delivery at scale: budget and modalities of interventions 113
to apply agricultural trade facilitation initiatives (e.g. to pilot the proposed inte-grated package for automating the licence and permit system) and to expand growth through the creation and expansion of industrial estates, one-stop services centres, border SEZs, and other infrastructure and facilities (ibid.).
Some examples of cross-border SEZs include those established along the new corridor roads linking Viet Nam with Cambodia and the Lao People’s Democratic Republic (Table 33). One example on the Lao PDR-Viet Nam border is the Lao Bao Special Economic and Commercial Area, which includes coffee and fruit processing (canned and bottled juice beverages) (ADB, 2010c). Along the East-West Economic Corridor (EWEC), agro-industry is growing fast in several segments. These include the Nghe An Economic Zone, Viet Nam, with major new private and foreign invest-ments in beer, sugar and milk factories over the last few years;96 the Hoi An and Chu Lai Open Economic Zone in Tam Ky, Viet Nam, with the presence of some agrifood processing firms such as PepsiCo (beverages) and Uni-President China food produc-tion company (Ishida, 2012). Nonetheless, given the rapid development in Southeast Asia, SEZ and cluster initiatives could be applied more widely (Menon, 2009).
Nonetheless, Bafoil et al. (n.d.) maintain that GMS SEZs (based on the analysis of three SEZs in Cambodia and the Lao People’s Democratic Republic) have failed to harmonize incentives, cross-border rules, cross-border cooperation objectives, regional governance and multilevel structures of governance. They do not present social, economic, political or cultural structures across the region nor is the subsys-tem conducive to regional integration from infrastructure-driven regional integra-
96 These include a sugar processing joint venture with the United Kingdom-based multinational Tate & Lyle, the Sai Gon beer factory in Nam Dan, the Hanoi beer factory in Nghi Loc and the TH True Milk fresh milk processing plant in Nghia Dan.
TABLE 33 SEZs proposed at border areas in the framework of the GMS corridor programme
SEZs located on the borders of the countries below
Name of SEZ
Cambodia and Viet Nam Manhattan, Bavet
Cambodia and Thailand Poipet
Cambodia and Thailand Koh Kong-Trat
Lao PDR and Viet Nam Denh Savanh-Lao Bao
Lao PDR and Thailand Savan-Seno, Savannakhet-Mukdahan
Lao PDR and Thailand Thanaleng-Nong Khai
Lao PDR and Thailand Huai Xai-Chiang Khong
Myanmar and Thailand Myawaddy-Mae Sot
Myanmar and Thailand Tachileik-Mae Sai
Source: Ishida, 2009.

Making economic corridors work for the agricultural sector114
tion. There is also a gap between regional market integration; the SEZ cases do not reflect any horizontal relations between them, not even at a national level. To sum up, there are systemic problems in the approach to hard and soft aspects of trade facilitation towards regional integration.
Another key intervention in Zone IV is the promotion of cross-border contract farming, for instance, through the operation of cross-border agriculture resource centres and the passing of enabling legislation. Consequently, Chinese and Thai firms are increasingly engaging in cross-border contract farming with farmers from Cambodia, the Lao People’s Democratic Republic, Myanmar and Viet Nam. Thai-land has been actively pursuing contract farming as a tool for regional economic integration, building upon the Declaration of the 2005 ACMECS Summit. In the declaration, Thailand pledged tariff-free imports of all approved agricultural prod-ucts produced under contract farming in ACMECS (GMS5) countries.
The declaration included an agreement to accelerate cooperation on contract farming, including the conclusion of MOUs on the topic and the establishment of joint bilateral working committees. For instance, in keeping with this agreement, the Governments of Thailand and Myanmar signed an MOU to facilitate Thai invest-ments in crops for which local demand is not met in Thailand. Myanmar provides Thai agribusiness firms with access to 7 million ha of arable land. In return, the Thai firms provide seeds, technology and equipment for the farmers and purchase all the products from contract farms (ADBI, 2008a).
Thailand also has bilateral projects with the Lao People’s Democratic Republic, especially through the Sister Cities project under ACMECS. The Laotian Govern-ment has taken a proactive stance as well, with regard to cross-border contract farming, by promoting the so-called “2+3” policy to ensure that all the parties involved obtain benefits. This policy implies that under a contract farming arrange-ment, producers contribute land and labour (two elements), while investors provide inputs, technical advice and access to markets (three elements) (Fullbrook, 2007). This arrangement takes advantage of lower labour costs and land availability on one side of the border, and more advanced entrepreneurship and technology, and greater availability of capital and management skills, on the other. Buyers sometimes offer more than the three factors mentioned; for instance, Chinese agricultural scientists have been able to develop a special variety of rubber tree suited to conditions in northern Lao PDR. Several examples can be found of the 2+3 business model in the Laotian section of GMS corridors.
Table 34 lists subsectors and value chains in GMS corridors where cross-border contract farming agreements abound.
Another important area of regional corridor cooperation is the improvement of regional regulatory systems for agricultural and food products, and the harmoniza-tion of the different national systems, notably the following. � Modernize sanitary and phytosanitary (SPS) measures to facilitate trade in
agricultural and food products in the CAREC corridors (ADB, 2012e); and improve SPS handling in GMS for Cambodia, the Lao People’s Democratic Republic and Viet Nam.97
97 www.adb.org

Chapter 6 – Delivery at scale: budget and modalities of interventions 115
� Harmonize food safety standards and the development of regional food traceability systems in the GMS.
� Introduce pesticide regulations and a partnership for pesticide management, notably the elimination of persistent organic pollutants in agricultural production in Central Asia (ADB, 2012e).
� Promote voluntary standards (e.g. organic and fairtrade certified products), ecolabelling and pro-poor certification systems in the GMS.
The multisectoral approach of the regional corridors studied highlights the importance of deploying activities to improve the points of convergence of agri-culture with other sectors, such as natural resources, trade facilitation and others, as exemplified in Figure 26. This figure gives some examples of cross-sectoral activities that are important for achieving sustainable green agricultural growth in regional corridors.
TABLE 34 Contract farming experiences in GMS agrifood chains
Corridor Participating countries Subsectors and value chains
NSEC Lao PDR, Myanmar, China and Thailand
� Rubber, tea and maize (northern Lao PDR/China)
� Cassava and sugar (Guangxi/Viet Nam)
� Sugar cane, maize, watermelons, bananas, cabbages, tamarind and other horticultural products (northern Lao PDR/Thailand)
� Forest products
� Agricultural machinery and equipment
� Biofuel production
- Biofuel from cassava, jatropha and sugar cane (China)
- Biodiesel from jatropha and oil palm (Thailand)
- Bioethanol from maize, cassava and sweet sorghum (Myanmar)
EWEC Lao PDR, Myanmar, Thailand and Viet Nam
� Beer, sugar, beverages and milk production (Viet Nam)
� Pinewood oil, beer and sugar (Lao PDR)
� Rice (Thailand and Viet Nam)
� Organic food
SEC Cambodia, Thailand and Viet Nam
� Maize (Cambodia and Thailand)
� Ethanol from cassava and sugar cane
� Rubber
� Rice
� Pulses
� Fruit and vegetables (e.g. durian, pepper)
Sources: ADB (2007a; 2009; 2010b; 2010c); ADBI (2008a; 2008b); Nguyen and Ha-Duong, 2009; Malik et al., 2009; Shepley et al., 2009; USAID, 2009; Manorom et al., 2010.

Making economic corridors work for the agricultural sector116
6.6 SPECIALIZATION IN VALUE CHAINS AND MARKET ORIENTATIONEach agrocorridor specializes in different commodities, depending on their core competencies and natural resources allotment. However, there are three broad cat-egories of agricultural products that appear consistently in the experiences analysed: biofuel crops, cereals and other food security crops and high-value commercial crops (e.g. animal and fish products, forest products and fruit and vegetables).
In all the corridor cases there was evidence of biofuel production, either ethanol from sugar cane, cassava, sweet sorghum and maize, or biodiesel from palm oil, jatropha and catfish oil (Box 18). A summary of this information is presented in Table 35. Biofuel production from palm oil and sugar cane is widespread across the corridors examined.
Biofuel chains are gaining importance in the GMS partly because of the grow-ing demand for energy, notably bioenergy, at global and regional levels. Under a business-as-usual scenario over the next decade, energy consumption in the GMS is likely to increase at a rate of 7 to 16 percent per annum, thereby substantially surpassing economic growth rates (ADB, 2007a; 2009). The transport sector, in particular, will likely augment its fuel consumption manifold if the current trends in vehicle sales and registration persist (ADB, 2007a). Furthermore, some GMS countries, notably China, Thailand and Viet Nam, have already established national biofuel programmes encompassing enabling policies, targets and incentives (ibid.).
figure 26Examples of corridor soft-side interventions aiming to promote regional integration
Agriculture
Facilitation of agricultural tradeSingle-window facilities for one-stop customs clearance
Development of human resources• Skills development programmes in agricultural policy and extension• Cooperation in agricultural research and development
Logistics• Promotion and deregulation of cross-border logistics investments• Corridor-based associations of logistics firms
Coordination mechanisms• Development of corridor coordination institution and mechanisms involving public and private stakeholders and other corridor supporters• Creation of corridor institutes to create and share knowledge on key issues
Environmental management• Regional cooperation in research and development on climate friendly agriculture• Climate change mitigation and adaptation in agriculture• Flood and drought management
Source: author’s elaboration based on ADB, 2007a.
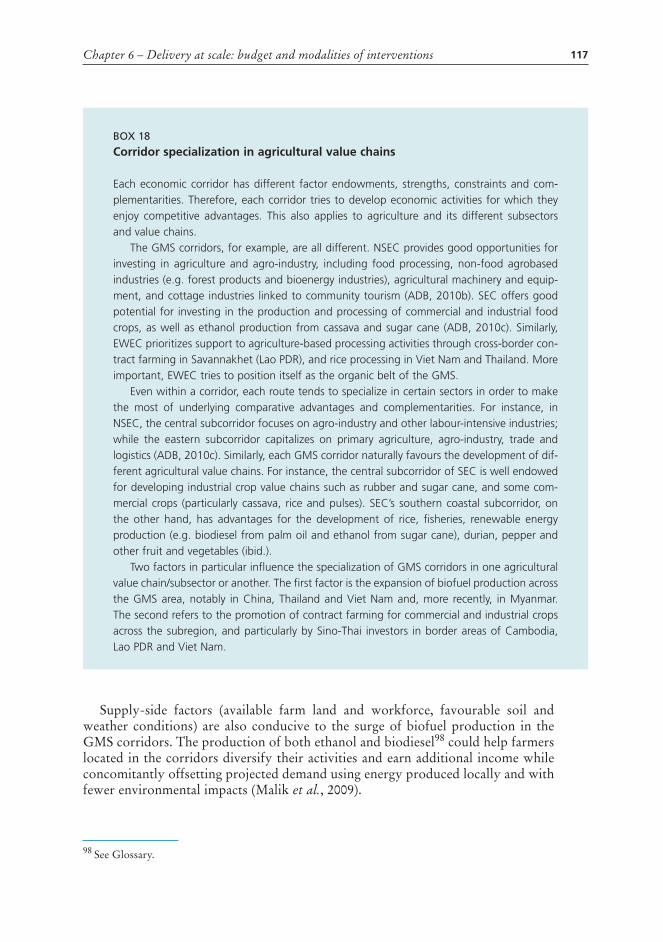
Chapter 6 – Delivery at scale: budget and modalities of interventions 117
Supply-side factors (available farm land and workforce, favourable soil and weather conditions) are also conducive to the surge of biofuel production in the GMS corridors. The production of both ethanol and biodiesel98 could help farmers located in the corridors diversify their activities and earn additional income while concomitantly offsetting projected demand using energy produced locally and with fewer environmental impacts (Malik et al., 2009).
98 See Glossary.
BOX 18
Corridor specialization in agricultural value chains
each economic corridor has different factor endowments, strengths, constraints and com-plementarities. Therefore, each corridor tries to develop economic activities for which they enjoy competitive advantages. This also applies to agriculture and its different subsectors and value chains.
The gMS corridors, for example, are all different. NSeC provides good opportunities for investing in agriculture and agro-industry, including food processing, non-food agrobased industries (e.g. forest products and bioenergy industries), agricultural machinery and equip-ment, and cottage industries linked to community tourism (ADB, 2010b). SeC offers good potential for investing in the production and processing of commercial and industrial food crops, as well as ethanol production from cassava and sugar cane (ADB, 2010c). Similarly, eWeC prioritizes support to agriculture-based processing activities through cross-border con-tract farming in Savannakhet (Lao PDr), and rice processing in Viet Nam and Thailand. More important, eWeC tries to position itself as the organic belt of the gMS.
even within a corridor, each route tends to specialize in certain sectors in order to make the most of underlying comparative advantages and complementarities. for instance, in NSeC, the central subcorridor focuses on agro-industry and other labour-intensive industries; while the eastern subcorridor capitalizes on primary agriculture, agro-industry, trade and logistics (ADB, 2010c). Similarly, each gMS corridor naturally favours the development of dif-ferent agricultural value chains. for instance, the central subcorridor of SeC is well endowed for developing industrial crop value chains such as rubber and sugar cane, and some com-mercial crops (particularly cassava, rice and pulses). SeC’s southern coastal subcorridor, on the other hand, has advantages for the development of rice, fisheries, renewable energy production (e.g. biodiesel from palm oil and ethanol from sugar cane), durian, pepper and other fruit and vegetables (ibid.).
Two factors in particular influence the specialization of gMS corridors in one agricultural value chain/subsector or another. The first factor is the expansion of biofuel production across the gMS area, notably in China, Thailand and Viet Nam and, more recently, in Myanmar. The second refers to the promotion of contract farming for commercial and industrial crops across the subregion, and particularly by Sino-Thai investors in border areas of Cambodia, Lao PDr and Viet Nam.

Making economic corridors work for the agricultural sector118
TABLE 35 Corridor specialization in biofuel crops
Ethanol from
cassava
Ethanol from maize
Ethanol from
sorghum
Biodiesel from
jatropha
Palm oil/ biodiesel
Soybeans/ biodiesel
Sugar/ ethanol
BAGCI ¾
GMS ¾ ¾ ¾ ¾ ¾ ¾ ¾
MP3EI ¾
PRA ¾
SAGCOT ¾ ¾
Source: author’s elaboration, based on www.adb.org; www.proyectopra.com; AgDevCo and InfraCo, 2010; SAGCOT, 2011; CMEA, 2011.
Note: ¾ core; ¾ secondary.
Biofuel production is uneven across the GMS corridors, in terms of the crops used, production levels and scale of operations. The two Chinese provinces belonging to the eastern branch of NSEC, Yunnan and Guangxi, are important producers of bioethanol. In Guangxi, the state-run COFCO – China’s largest grain trader and processor – operates a cassava-based ethanol plant (one of China’s five largest bioethanol plants) that produces 200 000 tonnes per year, plus 30 000 tonnes per year of second-generation biofuel99 from cassava residues and stalks (ADB, 2009; Malik et al., 2009). Furthermore, a subsidiary of the state energy company, the China National Offshore Oil Corporation (CNOOC), is planning to set up first- and second-generation facilities in the province of Guangxi to process 180 000 tonnes of ethanol per year from cassava. Yunnan has specialized in jatropha biodiesel production; in fact, it has been designated as the demonstration province to roll out the national jatropha programme (Malik et al., 2009). The provincial government has proposed 14 biodiesel refining plants with an aggregated annual production capacity of 3.2 million tonnes of biodiesel. Additionally, Yunnan and Guangxi have great potential for producing bioethanol from sugar cane.
Viet Nam produces bioethanol from sugar cane, sweet sorghum and cassava, and biodiesel from jatropha and catfish oil. Its estimated annual capacity is approxi-mately 320 million litres of bioethanol from cassava and 53 million litres from sugar cane (Nguyen and Ha-Duong, 2009). The Thai segment of the NSEC corridor produces biodiesel from oil palm and jatropha in large- and small-scale operations, respectively. In Myanmar, sugar cane is the main source of bioethanol followed by maize, cassava and sweet sorghum; in contrast, biodiesel production (mainly from jatropha) is still at the demonstration phase, in spite of the ambitious three-year government plan (2006–2008) that attracted much interest initially but created some land conflicts (ADB, 2007a).
99 See Glossary, under biofuel.

Chapter 6 – Delivery at scale: budget and modalities of interventions 119
Likewise, the Beira Corridor bears witness to a significant interest in large-scale investments along the sugar/ethanol value chain. Since 2007/08, private firms investing mostly in sugar cane for ethanol (and jatropha) have been allocated over 80 000 ha (AgDevCo and InfraCo, 2010). However, just a small fraction of this area has been put into production so far because of prevailing business and infrastruc-ture constraints, which BAGCI plans to address. The selection of these crops is not fortuitous, but has been inspired to a large extent by the resemblance that the Beira Corridor bears with the Brazilian Cerrado, in terms of ecosystems and strong regional markets (Ministry of Agriculture of Mozambique, 2010). The Cerrado region has become a global source of soybeans, sugar and ethanol, among other crops, and Beira has the potential and willingness to emulate the Brazilian success story. Accordingly, one of the biofuel investments foreseen under BAGCI is that of Principle Energy, a Mozambican project that agreed to invest US$400 million towards producing sugar-cane ethanol on 14 000 ha in Dombe (Manica province) to be exported through the port of Beira.100 Similarly, Mozambican Prio-Agricultura, which is already farming oilseeds and cereals on 9 200 ha of land, has secured a second plot of land with a total investment of US$48 million (ibid.).
Grains and roots are also consistently found as key crops promoted in the cor-ridors studied because of their importance for food security, as noted in Table 36. In the case of the GMS, these crops are mostly produced through contract farming in one corridor country to tackle unmet demand in a neighbouring country also connected to the corridor.
Fisheries, aquaculture and animal production are also given great importance in the corridors studied in this report, as seen in Table 37. This is consistent with the global trend to increase protein consumption from animal and fish sources.
The fruit and horticultural value chains also rank high in the list of value chains promoted in the corridors appraised. Some crops are produced as part of cross-border contract farming deals, as in the case of the GMS corridors. Further crops,
100 http://beiracorridor.com/ [last accessed July 2013].
TABLE 36 Corridor specialization in grains and other crops key to ensuring food security
Cassava Maize Rice Sorghum Wheat
BAGCI ¾ ¾
GMS ¾ ¾ ¾ ¾
MP3EI ¾ ¾ ¾ ¾
PRA ¾
SAGCOT ¾ ¾ ¾ ¾ ¾
Source: author’s elaboration, based on www.adb.org; www.proyectopra.com; AgDevCo and InfraCo, 2010; SAGCOT, 2011; CMEA, 2011.
Note: ¾ core; ¾ secondary.

Making economic corridors work for the agricultural sector120
TABLE 37Corridor specialization in animal and fish protein production
Dairy products Fisheries/aquaculture
Livestock Poultry
BAGCI ¾
GMS ¾
MP3EI ¾ ¾ ¾
PRA ¾ (trout) ¾ ¾
SAGCOT ¾ ¾ ¾ ¾
Source: author’s elaboration, based on www.adb.org; www.proyectopra.com; AgDevCo and InfraCo, 2010; SAGCOT, 2011; CMEA, 2011.
Note: ¾ core; ¾ secondary.
TABLE 38 Corridor specialization in fruit and vegetables
Artichokes Bananas Citrus Litchis Mangoes Misc. fruit Misc. vegetables
BAGCI ¾ ¾ ¾ ¾ ¾
GMS ¾ ¾ ¾ ¾ (tamarind)
¾
MP3EI ¾ ¾
PRA ¾ ¾ (proc. fruit)
¾ (proc. potatoes)
SAGCOT ¾ ¾
Source: author’s elaboration, based on www.adb.org; www.proyectopra.com; AgDevCo and InfraCo, 2010; SAGCOT, 2011; CMEA, 2011.
Note: ¾ core; ¾ secondary.
on the other hand, are cultivated for the export market, for example, artichokes and other non-traditional export crops in the Peruvian corridors.
The penchant of the corridors reviewed for high-value agricultural products goes beyond the production of biofuel, horticultural, animal and fisheries products. Other high-value crops produced are detailed in Table 39.
A large fraction of these products are cultivated with the export market in mind. In the case of GMS, there is particular emphasis on producing for the subregion, as shown in the rising intraregional trade statistics.
The exception is CAREC. Given that agriculture is a second-tier area in the CAREC corridor programme, efforts are ad hoc and highly focused, not sectoral or even value-chain-wide. Therefore, there is no use talking about specialization in these corridors. With regard to market orientation, the main destination markets for agricultural production have traditionally been Europe for Central Asian countries and eastern China (Xinjiang province) (ADB, 2012e). Partially because of this, there
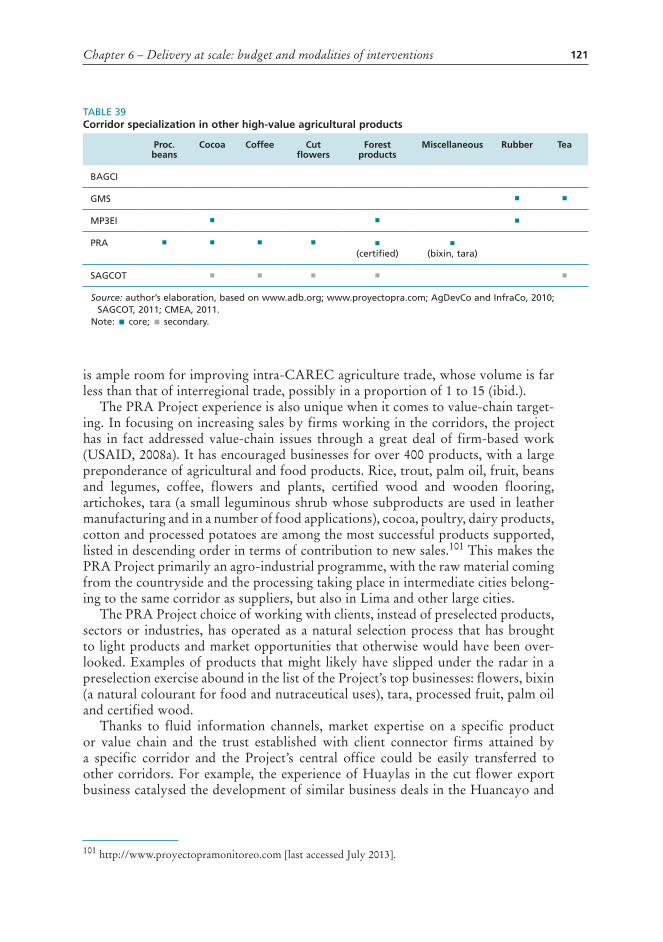
Chapter 6 – Delivery at scale: budget and modalities of interventions 121
is ample room for improving intra-CAREC agriculture trade, whose volume is far less than that of interregional trade, possibly in a proportion of 1 to 15 (ibid.).
The PRA Project experience is also unique when it comes to value-chain target-ing. In focusing on increasing sales by firms working in the corridors, the project has in fact addressed value-chain issues through a great deal of firm-based work (USAID, 2008a). It has encouraged businesses for over 400 products, with a large preponderance of agricultural and food products. Rice, trout, palm oil, fruit, beans and legumes, coffee, flowers and plants, certified wood and wooden flooring, artichokes, tara (a small leguminous shrub whose subproducts are used in leather manufacturing and in a number of food applications), cocoa, poultry, dairy products, cotton and processed potatoes are among the most successful products supported, listed in descending order in terms of contribution to new sales.101 This makes the PRA Project primarily an agro-industrial programme, with the raw material coming from the countryside and the processing taking place in intermediate cities belong-ing to the same corridor as suppliers, but also in Lima and other large cities.
The PRA Project choice of working with clients, instead of preselected products, sectors or industries, has operated as a natural selection process that has brought to light products and market opportunities that otherwise would have been over-looked. Examples of products that might likely have slipped under the radar in a preselection exercise abound in the list of the Project’s top businesses: flowers, bixin (a natural colourant for food and nutraceutical uses), tara, processed fruit, palm oil and certified wood.
Thanks to fluid information channels, market expertise on a specific product or value chain and the trust established with client connector firms attained by a specific corridor and the Project’s central office could be easily transferred to other corridors. For example, the experience of Huaylas in the cut flower export business catalysed the development of similar business deals in the Huancayo and
101 http://www.proyectopramonitoreo.com [last accessed July 2013].
TABLE 39Corridor specialization in other high-value agricultural products
Proc. beans
Cocoa Coffee Cut flowers
Forest products
Miscellaneous Rubber Tea
BAGCI
GMS ¾ ¾
MP3EI ¾ ¾ ¾
PRA ¾ ¾ ¾ ¾ ¾ (certified)
¾ (bixin, tara)
SAGCOT ¾ ¾ ¾ ¾ ¾
Source: author’s elaboration, based on www.adb.org; www.proyectopra.com; AgDevCo and InfraCo, 2010; SAGCOT, 2011; CMEA, 2011.
Note: ¾ core; ¾ secondary.

Making economic corridors work for the agricultural sector122
Huanuco corridors. Likewise, a trout experiment supported by the Junín ESC was replicated in the Huancayo, Huancavelica and Puno corridors. The artichoke processing initiated in Huaylas and Huancayo then extended to the Huancavelica and Ayacucho corridors (USAID, 2005). Such spin-offs occurred sometimes via the interest of a client firm to operate in new areas (such as trout). However, it was mainly a demonstration effect, an eye-opening call to seize a business opportunity. This phenomenon was highly unlikely to have occurred in a spontaneous manner among geographically distant corridors without the knowledge exchange channels existing among the corridors and through the central office in Lima.
The PRA Project often discovered business opportunities in new agricultural value chains through the symbiotic relationship established with connector firms. For instance, the Project helped an entrepreneur to introduce new varieties of thornless artichokes for the European market, establish a processing plant in Concepción, home to 5 000 people in the Mantaro Valley in the Central Andes, and enter into contract farming with dozens of small local producers. A new market opportunity was further spotted: the possibility of supplying processed jalapeño chillies to a company in the United States of America. The Project helped its client to identify farmers willing to cultivate the new crop in the corridor and organize the value chain. The company now sources from over 200 artichoke and jalapeño growers and hires more than 600 employees in its processing plant, 90 percent of whom are women employed in their first formal job (USAID, 2008a; 2008b).
The PRA Project has made a particularly substantial impact on three value chains: artichokes, trout and certified wood products. The artichoke value chain is especially noteworthy. In the first phase, the Project convinced six artichoke pro-cessing and exporting companies to start operating in the highlands (export-oriented artichoke production in Peru started in the 1990s but only on the coast), and helped them to adapt the artichoke cultivation package to the highlands’ edaphoclimatic conditions, and link up with small-scale growers in the Mantaro Valley, Ancash, Ayacucho and Cusco. A total of 740 ha of land was planted, for sales worth US$4.5 million, and export channels were developed in the United States of America and the EU. Exporting companies provided growers with inputs and ensured produce purchases. The Project facilitated the deals between growers and buying companies, and provided field TA. These businesses created many positive externalities in the corridors: new businesses emerged, inter alia, input suppliers (fertilizers, pesticides and tools), transport and logistics services from and to remote growing areas, field supervising services, and glass jar suppliers. Partly because of these efforts, Peru managed to climb up to third position (after Italy and Spain) in the global export ranking of artichokes, where it was absent only a decade ago.102 In fact, during the first phase of the programme, project clients were responsible for 30 to over 50 percent of the total export of artichokes from Peru (USAID, 2008a; 2008b).
The strategy of the Project to develop the trout value chain was different: it focused on helping one large client develop a large supply base (more than 600 small trout producers) in various corridors. By linking this client with potential custom-
102 http://www.siicex.gob.pe [last accessed May 2013].

Chapter 6 – Delivery at scale: budget and modalities of interventions 123
ers, the Project helped achieve new deals for 680 tonnes of trout products worth US$5.8 million by identifying small-scale trout farmers in Huancayo, Huancavelica and Puno interested in and able to supply the processing firm. It also facilitated consultancies and TA to help the company transfer trout farming technology to its suppliers to comply with technical standards for exports to the EU, United States of America and other markets (ibid.).
In May 2006, USAID added forestry certification to the PRA Project’s BDS com-ponent. The target was to achieve Forest Stewardship Council (FSC) certification of 400 000 ha of forestland in the Cusco, Pucallpa and San Martín corridors through the application of a PRA business approach. Such certification does not necessarily translate into higher prices, but is instrumental for accessing international markets. The Project helped to forge alliances between private enterprises and native com-munities, and provided training and TA to help them achieve the FSC certification, improve their forest management standards and market their forestry products bet-ter. In addition, it worked closely with the forest certification office of the national Natural Resources Institute to expedite administrative procedures – the time to pro-cess certifications was cut by as much as 60 percent. The Project contributed to the certification of 394 115 ha of forest, with 70 percent of this certification occurring in collaboration with native communities and 30 percent on forestry concessions (USAID, 2006; 2008a; 2008b).

125
Chapter 7
Delivery at scale: corridor governance
7.1 CORRIDOR LEADERSHIP AND ALIGNMENT OF STAKEHOLDERS’ VISIONS AND GOALS
The corridor’s reason for existing, whether it is geographic, demand driven or political, is a significant determinant in its evolution from transport to economic corridor. The same logic applies to the institutional driver or main supporter of the corridor programme. The promoter can be a national and/or local government, an international financial institution (IFI) (regional bank), a bilateral agency or a regional integration body, among others; or a combination of all these actors via a partnership agreement, officialized in one way or another. The nature of the cor-ridor programme is closely linked to the identity of the main driver.
By nature, corridor programmes are complex and resource-intensive operations. This means that behind the leading corridor institution there is a cohort of develop-ment partners and private companies that collaborate in the design and implementa-tion of operations. This is exemplified in Table 40, which provides a summary of the various actors involved in the six corridor experiences appraised.
Among the main promoters of economic corridors are multilateral development finance institutions. In particular, regional banks – ADB in Asia, AfDB in Africa and IaDB in Latin America – are highly involved in this type of initiative. They primarily support cross-country corridors, but also national corridor experiences. Both ADB and IaDB are currently using economic corridors as their main strategy for regional integration (ADB, 2011c; 2012e; IaDB, 2011). Symbiotic partnerships frequently emerge between these IFIs and regional trading blocs. Some examples found in the course of this study are the cases of UNASUR and the IIRSA corridor programme, ASEAN in the GMS corridor programme and EAIC, as well as the tripartite in the North-South, Northern and Central Corridors in eastern and southern Africa. For example, Bafoil and Ruiwen (2010; p. 80) noted “GMS regional integration is largely driven by ASEAN, but also by ADB which has made significant loans to the GMS economies for their development projects”.
Moreover, bilateral and multilateral aid plays a key role in corridor programmes. Although there are several examples of “neutral” bilateral aid (e.g. in the Nordic countries), most donors have either historical ties (such as a colonial past) with the corridor countries or strategic interests in them. In particular, the United Kingdom through DFID and the United States of America through USAID are two bilateral donors that participate in almost all the corridor programmes, except in the Indonesian case, which is the only one without support from development
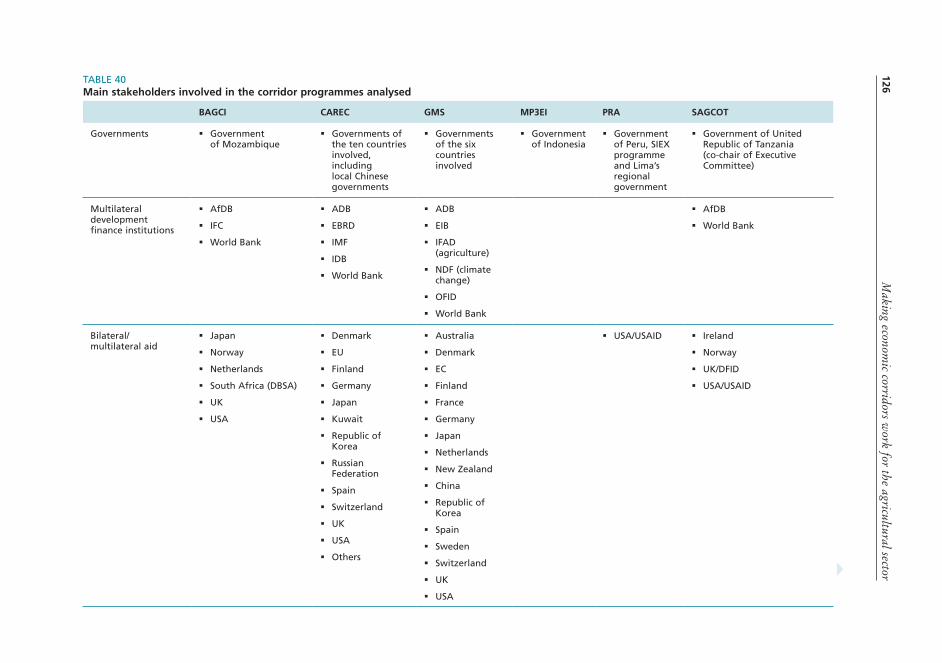
Making econom
ic corridors work for the agricultural sector
126TABLE 40Main stakeholders involved in the corridor programmes analysed
BAGCI CAREC GMS MP3EI PRA SAGCOT
Governments � Government of Mozambique
� Governments of the ten countries involved, including local Chinese governments
� Governments of the six countries involved
� Government of Indonesia
� Government of Peru, SIEX programme and Lima’s regional government
� Government of United Republic of Tanzania (co-chair of Executive Committee)
Multilateral development finance institutions
� AfDB
� IFC
� World Bank
� ADB
� EBRD
� IMF
� IDB
� World Bank
� ADB
� EIB
� IFAD (agriculture)
� NDF (climate change)
� OFID
� World Bank
� AfDB
� World Bank
Bilateral/ multilateral aid
� Japan
� Norway
� Netherlands
� South Africa (DBSA)
� UK
� USA
� Denmark
� EU
� Finland
� Germany
� Japan
� Kuwait
� Republic of Korea
� Russian Federation
� Spain
� Switzerland
� UK
� USA
� Others
� Australia
� Denmark
� EC
� Finland
� France
� Germany
� Japan
� Netherlands
� New Zealand
� China
� Republic of Korea
� Spain
� Sweden
� Switzerland
� UK
� USA
� USA/USAID � Ireland
� Norway
� UK/DFID
� USA/USAID

Chapter 7 – D
elivery at scale: corridor governance 127
BAGCI CAREC GMS MP3EI PRA SAGCOT
Multilateral technical agencies
� UNDP � FAO
� ILO
� IOM
� UNDP
� UNEP
� UN ESCAP
� UNESCO
� WHO
� FAO
Private actors (for profit)
� AgDevCo (lead technical team)
� InfraCo
� Prorustica
� Yara International
� Other agribusiness firms, private banks and mining companies
� Private companies via infrastructure PPPs
� Private companies via infrastructure PPPs
� Private companies via private investments and PPPs
� One international consulting firm (main contractor)
� Seven mining companies and one construction company (PPPs to set up ESCs)
� AgDevCo (co-lead technical team)
� Prorustica (co-lead technical team)
� Unilever (co-chair of Executive Committee)
� Yara Int.
� Others
Private foundations and international/ national NGOs
� Hewlett Foundation
� NEPAD Business Foundation
� AGRA
� TechnoServe
� Others
� CONFIEP
� Clinton Foundation
� WEF
� AGRA (funded by Rockefeller Foundation and Bill & Melinda Gates Foundation)
Source: www.adb.org [last accessed August 2013].
TABLE 40 (Continued)
Making economic corridors work for the agricultural sector128
partners, given its middle-income country status.103 Other countries lend assistance to the corridor programmes analysed in accordance with their “good neighbour” policy. For example, South Africa supports BAGCI, whereas Australia, China and Japan support the GMS corridor programme. Australia has invested around US$150 million in transport and energy projects in the GMS corridor programme under co-financing arrangements with ADB and the World Bank (AusAID, 2009). China and Japan are essential donors and supporters of the GMS corridor programme, both within and outside the framework of the programme.104 For both Japan and China, maintaining strong ties with GMS countries is strategically important, given the trade and FDI flows established between them and the GMS5 economies. Moreover, for China, cooperation with Southeast Asian nations is a crucial test of its “good neighbour” policy, particularly for Yunnan province. There seems to be a geographic division of tasks between the two countries. Japan is keen on supporting the development of the EWEC corridor, given the strategic importance of Viet Nam and Thailand for Japanese interests (Cochrane, 2012; Reilly, 2013). For China, on the other hand, NSEC is vital to link land-locked areas of southern China to areas where deep seaports can be constructed in Southeast Asia. In particular, China per-ceives NSEC’s potential as a “landbridge” between Shanghai and Singapore (ibid.).
Some bilateral agencies support corridors where multinational corporations originating in their countries have strategic interests, such as in the African cor-ridors. These circumstances may create some unease within civil society.
An essential actor in this picture is the government of the host countries, either as promoter or supporter of the corridor initiative or, in some cases, as aid recipi-ents. The involvement of the public sector is heterogeneous, but can encompass line ministries (e.g. agriculture, transport, energy and trade), regional and provin-cial governments, and state-owned enterprises or parastatals, depending on the case. Regional and provincial governments and agencies are indispensable for the successful realization of corridor plans. Examples are the contributions of the Vale do Zambeze agency to BAGCI, the Chinese provinces of Guangxi, Xinjiang and Yunan to the CAREC and GMS programmes, the regional government of Lima to the PRA corridor project and the Indonesian states to MP3EI. The relationships between central and decentralized governments and among central agencies are not always without problems. Some coordination issues were found, for example, between federal and regional authorities in Indonesia and Ethiopia, creating prob-lems to deploy or implement the economic corridor programmes.
The level of ownership of the programme by the national/local govern-ments varies from one country to another. The strongest involvement is obviously that of the Government of Indonesia, in its role as main promoter. SAGCOT also has high-level buy-in from the government, with the Tanzanian President showing a strong personal commitment to the initiative (GMF, 2013).
103 http://data.worldbank.org/income-level/MIC [last accessed July 2013].104 Japan and China are two of the largest subscribers to ADB, holding 15.65 and 6.46 percent shares in the Bank’s capital, respectively; their respective voting rights are 12.82 and 5.47 percent (Brahmawong and Sukhraromana, 2013). These countries have also made significant investments in the GMS corridors through their official development assistance and through private corporations.
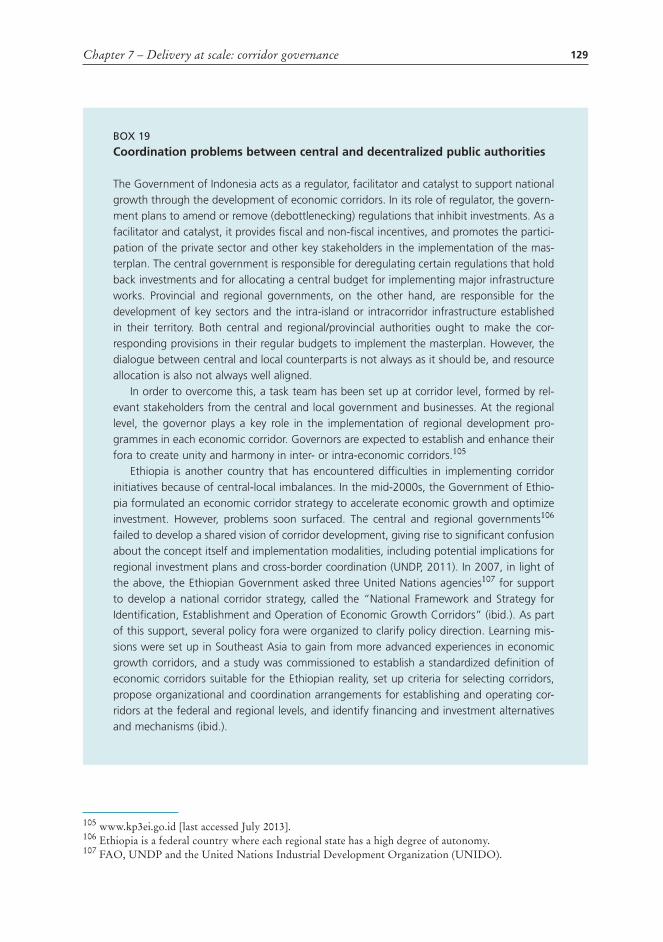
Chapter 7 – Delivery at scale: corridor governance 129
BOX 19
Coordination problems between central and decentralized public authorities
The Government of Indonesia acts as a regulator, facilitator and catalyst to support national growth through the development of economic corridors. In its role of regulator, the govern-ment plans to amend or remove (debottlenecking) regulations that inhibit investments. As a facilitator and catalyst, it provides fiscal and non-fiscal incentives, and promotes the partici-pation of the private sector and other key stakeholders in the implementation of the mas-terplan. The central government is responsible for deregulating certain regulations that hold back investments and for allocating a central budget for implementing major infrastructure works. Provincial and regional governments, on the other hand, are responsible for the development of key sectors and the intra-island or intracorridor infrastructure established in their territory. Both central and regional/provincial authorities ought to make the cor-responding provisions in their regular budgets to implement the masterplan. However, the dialogue between central and local counterparts is not always as it should be, and resource allocation is also not always well aligned.
In order to overcome this, a task team has been set up at corridor level, formed by rel-evant stakeholders from the central and local government and businesses. At the regional level, the governor plays a key role in the implementation of regional development pro-grammes in each economic corridor. Governors are expected to establish and enhance their fora to create unity and harmony in inter- or intra-economic corridors.105
Ethiopia is another country that has encountered difficulties in implementing corridor initiatives because of central-local imbalances. In the mid-2000s, the Government of Ethio-pia formulated an economic corridor strategy to accelerate economic growth and optimize investment. However, problems soon surfaced. The central and regional governments106 failed to develop a shared vision of corridor development, giving rise to significant confusion about the concept itself and implementation modalities, including potential implications for regional investment plans and cross-border coordination (UNDP, 2011). In 2007, in light of the above, the Ethiopian Government asked three United Nations agencies107 for support to develop a national corridor strategy, called the “National Framework and Strategy for Identification, Establishment and Operation of Economic Growth Corridors” (ibid.). As part of this support, several policy fora were organized to clarify policy direction. Learning mis-sions were set up in Southeast Asia to gain from more advanced experiences in economic growth corridors, and a study was commissioned to establish a standardized definition of economic corridors suitable for the Ethiopian reality, set up criteria for selecting corridors, propose organizational and coordination arrangements for establishing and operating cor-ridors at the federal and regional levels, and identify financing and investment alternatives and mechanisms (ibid.).
105 www.kp3ei.go.id [last accessed July 2013].106 Ethiopia is a federal country where each regional state has a high degree of autonomy. 107 FAO, UNDP and the United Nations Industrial Development Organization (UNIDO).
Making economic corridors work for the agricultural sector130
In the case of Peru, the Peruvian Government has gradually increased its commit-ment to the PRA Corridor Project. Initially, its involvement was limited to ProIn-versión, the SIEX programme and Project Peru,108 but eventually the GoP became the recipient of the PRA model, officially transferred in 2012. Something similar has occurred in the CAREC and GMS programmes where ADB insisted in transferring increased responsibilities to national counterparts and focal points, including the function of resource mobilization.
Multinational and domestic corporations also support corridor programmes, either through multistakeholder partnerships such as those in Africa or through private-donor collaborations (as in Peru). For example, multinational agribusiness firms and some local firms have been pivotal in the realization of the corridor partnerships in Mozambique and the United Republic of Tanzania. A sign of their importance is that Unilever (United Kingdom/Netherlands) and the Norwegian-based Yara International are on the Executive Committee of SAGCOT. Moreover, the Chief Executive Officer of Yara was the one who put forward the idea of piloting an agrocorridor experience in Africa, which eventually gave way to the SAGCOT and BAGC partnerships.
Another alternative is the involvement of private actors in corridor programmes as part of their corporate social responsibility strategy. In Peru, eight private firms signed a partnership agreement with the donor (USAID) to co-finance the establish-ment of corridor centres in their regions. These firms, mostly mining companies, were not involved in agribusiness operations, but saw an opportunity in the corridor programme to contribute to the development of their territories and communities.
International consulting firms play a pivotal role in corridors, particularly in the prefeasibility and design phases, but also as managers or technical leaders of the corridor implementing bodies. Cases in point are Chemonics International in the Peruvian corridors, and AgDevCo, InfraCo and Prorustica in the African corridors.
Two important categories of private sector actors involved in corridor operations are companies specialized in infrastructure development that enter into partnership with the public sector to build, co-finance and operate infrastructure works. These companies may develop and/or manage either large connective infrastructure (e.g. ports and roads) or last-mile infrastructure, as in the ISCs mentioned in the BAGCI case. The second category is logistics and trade companies that are key partners in the design and deployment of transport and trade facilitation activities, which are a core area of work in regional corridor programmes.
From the discussions so far, it might seem that private actors play only a second-ary role in corridor programmes, accompanying initiatives championed by national governments alone or supported by the international community. However, in many parts of the world, private actors are leading corridor efforts, as in the Mercosur soybean corridors or the Maputo-Gauteng Corridor in southern Africa. The rule of thumb is that in countries and regions where the private sector is quite developed, the evolution from transport to economic corridor is mostly left to the
108 ProInversión is the Peruvian IPA. The SIEX programme promotes exports from the Peruvian highlands and Project Peru seeks to enhance intra- and intercorridor connectivity.

Chapter 7 – Delivery at scale: corridor governance 131
initiative of private actors. But even in the cases analysed where the private sector is not particularly thriving, private investments constitute a large proportion, ranging from a third to half of the overall estimated investments induced by the corridor programmes (see discussion in section 6.1.) In fact, the corridor initiatives studied have been primarily conceived as catalysers of private investment and entrepre-neurial glue. This is an expression of the most common pro-corridor argument, which postulates that the attraction of private sector investments in growth nodes along corridors may alleviate coordination failures and the scarcity of capital in developing countries (World Bank, 2010).
Obviously, the extent to which a corridor development initiative is championed by the private or public sectors influences the type of policies promoted and the impacts generated. The Maputo-Gauteng experience in southern Africa shows that, when corridor development is led by the private sector, it may be more difficult for governments to impose people-centred policies. In contrast, expectations in BAGCI – which is largely in the hands of public authorities – are that the corridor benefits be more equitably distributed.
In any case, multilevel governance systems are in place in the majority of inter-ventions, including public and private sector actors, IFIs, donors and civil service actors, among others. Such systems should in theory balance the interest of the various stakeholders and contribute to a more equitable distribution of the value added through corridor interventions.
7.2 ENGAGEMENT MODELSContract farming is the cornerstone of the strategy of the GMS, PRA and Indone-sian corridors to link farmers to markets. Contract farming operations are facilitated to improve smallholder farmers’ access to markets, inputs and services.
Similarly, the agrocorridors of Mozambique and the United Republic of Tanzania focus on promoting commercial farming in a way that is socially inclusive and envi-ronmentally sustainable. The agricultural potential of both corridors is noteworthy. In SAGCOT, there are 7.5 million ha of arable land available, of which less than one-third is currently under cultivation, against 10 million ha in BAGC, where the percentage actually cultivated is even lower at 15 percent (Table 41). However, in both corridors, commercial farming is the exception rather than the rule: 0.26 and 1.5 per-cent of the available arable land in Beira and SAGCOT, respectively. In the latter case, only 5 percent of the area under production corresponds to medium- and large-size holdings dedicated to sugar, rice and tea production (SAGCOT, 2011; DFID, 2012). Smallholder farming is overwhelmingly predominant (95 percent of cultivated land), and is mostly subsistence-oriented (rice, maize, cassava and pulses) using traditional methods (SAGCOT, 2011). The baseline of area under irrigation for food and horti-culture crops in the corridor is under 1 percent of total cultivated land, approximately 20 000 ha. Over 18 000 ha belong to two large sugar and tea estates, whereas less than 2 000 ha are dedicated mainly to smallholder rice cultivation (SAGCOT, 2011).
The goal is to put 350 000 ha into profitable production in SAGCOT and 270 000 ha in the Beira Corridor to serve regional and international markets, as seen in Table 41. The new cultivated land and other efforts to develop agriculture in the southern corridor are intended to generate a threefold increase in agricultural output (SAGCOT, 2010; 2011).

Making economic corridors work for the agricultural sector132
To promote commercial agriculture, BAGCI has explicitly expressed a prefer-ence for contract farming, outgrower schemes and other equitable agribusiness models that benefit smallholders and their communities. Through such arrange-ments, large nucleus farms are expected to provide goods and services such as irrigation; input provision – seeds, fertilizers and pesticides; agricultural machinery; processing and storage services; financing; and access to markets, for smallholders or outgrowers living in the surrounding area. BAGCI encourages the concentration of farming hubs, nucleus farms and irrigated farm blocks109 in specific locations or clusters where processors, agricultural support service providers (e.g. extension and finance), specialized suppliers and associated institutions are also present. See the graphic representation of this strategy in Figure 27.
The BAGC Catalytic Fund, as mentioned earlier, invests in early-stage farming and agroprocessing businesses that integrate smallholder and emergent farmers.
SAGCOT’s approach to agricultural growth, similar to that of the Beira Corri-dor, revolves around smallholder farmers engaging in contract farming with nucleus estates, agroprocessing and trading companies. Through these schemes, smallholder individual producers and their associations can access inputs, extension services, value-adding facilities and markets (SAGCOT, 2011).
The SAGCOT investment blueprint foresees other types of innovative finance, besides the Catalytic Fund, to help catalyse private investment in socially respon-sible agriculture projects, such as (i) patient capital provided by donors to finance last-mile infrastructure; and (ii) loan guarantees and currency risk instruments to help leverage capital from the domestic banking sector into agricultural companies. The SAGCOT initiative plans to roll out activities pertaining to these new financing facilities (SAGCOT, 2011).
109 See Glossary.
TABLE 41 Use of land in BAGC and SAGCOT
BAGC SAGCOT
Total corridor land (ha) 22 700 000 28 700 000
Available arable land 10 000 000 7 500 000
Baseline of cultivated land … 1 498 200 2 090 000
… by smallholder producers 1 472 500 1 980 000
… by large commercial farmers 25 700 110 000
Additional cultivated land (target) … 270 000 350 000
… under cultivation 190 000 –
… rainfed 80 000 –
Sources: AgDevCo and InfraCo (2010); SAGCOT (2011).

Chapter 7 – Delivery at scale: corridor governance 133
The preferred engagement models may also refer to environmentally sustainable business practices. For example, SAGCOT favours green growth models. Research on this topic is crucial. This is why, as part of the SAGCOT Investment Greenprint, Yara, Syngenta, the University of Life Sciences in Norway and the University of Sokoine in the United Republic of Tanzania have launched a research project exam-ining the effects of best practices in sustainable farming. Preliminary field trials have demonstrated a high potential to double yields and farmer income levels without expanding farm area, while keeping GHG unchanged.110
110 http://www.yara.com/sustainability/how_we_engage/africa_engagement/growth_corridors/index.aspx [last accessed July 2013].
FIGUrE 27Nucleus farm hub, outgrower model and smallholder block farming
Serviced outgrower
plots
Small dam/ storage reservoir
Commercial farm hub with packing house and storage facilities
Local village
Outgrower irrigated farm blocksconnected to water and power supply
Trunk infrastructure: main road and power network
Feeder road
Electricity
Water supply
Source: author’s elaboration based on AgDevCo and InfraCo, 2010.

Making economic corridors work for the agricultural sector134
7.3 INSTITUTIONAL ARRANGEMENTS AND DELIVERY MECHANISMSAll the corridor cases covered by this study point at multilevel governance systems that influence the operation of agricultural corridors. Many players are involved in the implementation of these corridors, including public authorities/entities, the private sector, NGOs and civil society. Therefore, adequate governance mechanisms such as partnerships are vital.
There are various institutional models to structure these complex multistake-holder relationships, as summarized in Table 42.
Indonesia has not established additional organizational structures to implement the corridor strategy. It relies on the existing public structures at national and local level to implement the corridor strategy stated in the MP3EI. The funding for implementing this strategy comes from the national budget.
ADB-led corridors have embraced a dual model that at regional level counts on corridor coordination bodies, but at national level leaves implementation to the central and local authorities of the participating countries. This model has functional corridor institutions that involve political and technical authorities of the participat-ing countries, supported by an ADB-run Secretariat. There are working groups and fora that coordinate the regional activities concerning each sector. See the example regarding the GMS in Box 20.
Moreover, these corridor programmes have put in place regional mechanisms and institutions to engage and activate key stakeholders. For example, CAREC has set up a Business Forum to promote and support effectively private sector participa-tion in economic corridor development. Similarly, in the GMS corridors, Economic and Business Fora play a pivotal role to improve coordination of GMS programme measures and private sector engagement, respectively (ADB, 2010c). In addition, institutions to create and disseminate knowledge on corridor-related issues have been created, such as the CAREC Institute.
TABLE 42Corridor institutional settings
Type of model Main organizational traits
ADB-led corridorsRegional coordination structure assisted by ADB-run Secretariat + principle of subsidiarity to implement the corridor plan at the national level
GoI-led corridors Lack of corridor-specific institutions. The corridor programme is mainstream in the public system and budget
PRA model
Direct implementation through corridor-specific institutions: a central office and ESCs, outsourced to different types of operators following a competitive process
Market-based PPPs to fund and operate the development strategy of some corridors
WEF modelDirect implementation through corridor-specific institutions: a corridor PPP legally registered, supported by an independent Secretariat, corridor centres and funds (e.g. CTF)
Source: author’s elaboration.

Chapter 7 – Delivery at scale: corridor governance 135
BOX 20
Institutional arrangements and delivery mechanisms of the GMS corridor programme
The GMS programme has opted for a model of functional corridor-led institutions for tech-nical cooperation. It is managed by a multilevel institutional mechanism dating from 1995 that involves both political and operational authorities of the GMS participating countries, as evidenced in Figure 28.
The GMS Summit is the maximum decision body of the GMS programme, where the Prime Ministers of the six countries gather together with ministers and country delegations, representatives of the private sector, ADB and other development partners. The Summit is held every three years and is hosted by GMS countries on a rotational basis.111 They serve as an important venue for GMS leaders to provide high-level political commitment, discuss and agree on priority actions in the GMS programme, and endorse important documents, such as the ten-year GMS Strategic Frameworks, specific corridor strategies and sectoral action plans, including those in agriculture (ADB, 2012a).
FIGUrE 28 GMS programme institutional structure
Source: author’s elaboration based on ADB, 2012a.
111 The first Summit was held in Phnom Penh (Cambodia) in 2002; the second in Kunming (Yunnan Province, China) in 2005; the third in Vientiane (Lao PDR) in 2008; and the fourth and last in Naypyidaw (Myanmar) in 2011 (ADB, 2012a).
WG on Investment
WG on Trade Facilitation
WG on Agriculture
WG on Environment
WG on HR Development
Subr. transport forum
GMS Business forum
WG on tourism
Energy sector forum
Subr. telecoms forum
ADB GMSSecretariat
NationalCoordinatingCommittee
in eachcountry
Ministerial-level Conference(annual)
SeniorOfficials’meeting
GMS Summit(triennal)

Making economic corridors work for the agricultural sector136
BOX 20 (Continued)
The GMS Ministerial Conferences are yearly meetings involving GMS Ministers, accompa-nied by GMS senior officials, headed by the GMS National Coordinators, together with ADB, other development partners and representatives from the private sector. The Conference reviews the overall progress of key deliverables for the GMS programme; gives broad direc-tions to the programme and prepares action plans; dialogues with development partners and the private sector to determine ways of increasing their participation; and undertakes preparatory work for the GMS Leaders’ Summits. Senior Officials’ meetings, for example of senior agricultural civil servants, are held periodically to discuss and agree on the programme and activities, and conduct other preparatory work for the Ministerial Conferences (ibid.).
Each country has set up a national GMS Secretariat that acts as the government focal point to assist in the implementation and coordination of the GMS programme. The Secre-tariat implements, evaluates and follows up the working plan on GMS economic coopera-tion, and reports to the respective line ministries and working sectors. It also coordinates with other stakeholders such as NGOs, local and provincial governments, and the private sector at the regional (GMS Business Forum), national and provincial levels. As shown in Figure 28, the ADB GMS Secretariat provides central technical, administrative, facilitation and financing support to GMS meetings and subprojects (ibid.).
The implementation of the GMS programme has been supported by sector fora and working groups in the nine sectors of cooperation, as shown. There is a specific Working Group on Agriculture (WGA), whose core mandate is to support the design and implemen-tation of priority projects under CASP “to promote agriculture trade, food security, and sustainable livelihoods”.112 WGA was proposed as a mechanism for agricultural cooperation in the GMS at the Tenth GMS Ministerial Conference in November 2001, and was eventu-ally established in 2002. It has a national Secretariat in each country composed of a WGA national coordinator and support staff.
Under the current strategic framework, the GMS WGA continues to monitor the overall implementation of CASP II and ensures that it is well coordinated with other sector programmes. However, new elements have been introduced to improve WGA’s performance, as follows: � WGA is expected to seek a broader range of financing sources, including multilateral and
bilateral development partners, private enterprises and national government financing. Actions are being taken to strengthen WGA’s linkages with FAO, IFAD, CIrAD, CGIAr, SEArCA and others involved in agriculture in the subregion (ADB, 2007a).
� Plans for further strengthening the WGA Secretariat with full-time technical and adminis-trative in-country staff are under way. Furthermore, a more effective institutional mecha-nism for WGA is being defined to improve its performance and engage GMS member countries in a more systematic and sustained manner. Following the endorsement of the new strategic framework, GMS countries undertook a fine-tuning of GMS fora and working groups, including WGA, to sharpen their focus and make them more effective (ADB, 2012a).
112 www.adb.org/countries/gms/sector-activities [last accessed July 2013].

Chapter 7 – Delivery at scale: corridor governance 137
BOX 20 (Continued)
� WGA’s current mandate emphasizes country-led initiatives aimed to promote cross-bor-der agricultural trade and agribusiness investment as well as other regional cooperation initiatives in agriculture.
To ensure that private sector perspectives are well reflected in the deliberations of all the GMS sector fora and working groups, the GMS programme launched the GMS Busi-ness Forum in 2000, with support from ADB and UN ESCAP. This forum brings together the business community throughout the subregion via the national Chambers of Commerce and Industry.113 It provides a channel for public-private dialogue on policy issues; promotes net-working among enterprises, business chambers and investment promotion agencies in the context of GMS-related activities; fosters the expansion of PPPs for infrastructure develop-ment and encourages the development of SMEs; and plays a vital role in the capacity build-ing of the private sector and its associations in GMS.114 In particular, the Business Forum supports the implementation of CASP and CBTA, especially the development of business networking along the corridors and the development of quality standards for services. For example, the forum established in 2010 the private sector-led TTF-TAF to review the business environment and facilitate the implementation of customs and transit system in all the cor-ridors. In 2011, the forum set up a unified platform for trade, transport, and logistics com-panies, known as FrETA, to support TTF-TAF and work together with GMS governments.
A fairly recent development in the GMS programme governance is the establishment of an umbrella structure at the corridors, known as the ECF.115 This forum is the main advocate and promoter of multisector coordination in the GMS corridors, raising awareness of needs and priorities, and increasing the involvement of local authorities and private actors in cor-ridor affairs (ADB, 2011a).116
The current Strategic Framework 2012–2022 has introduced three new elements related to corridor and overall programme governance. � The creation of a knowledge platform to address second-generation issues where high-
quality analytical work, effective discussion and consensus building around its results will be critical, such as the interlinkages between energy, agriculture, food security and the environment (ADB, 2011a; 2012a).
113 www.gmsbizforum.com [last accessed July 2013].114 Ibid.115 www.gmsec.org [last accessed July 2013].116 The first ECF took place in Kunming, China, in June 2008, followed by ECF-2 in 2009, ECF-3 in 2011 and ECF-4 in 2012.

Making economic corridors work for the agricultural sector138
BOX 20 (Continued)
� A renewed commitment to develop stronger linkages with other regional initiatives and organizations working in the GMS, such as CArEC and ASEAN, among others.117
� The formation of a high-level board of advisors to review the programme periodically and advise member countries on areas for improvement (ADB, 2011a; 2012a).
One of the main differences between the GMS and CAREC programmes so far as this study is concerned is the treatment of agriculture as a core sector in the first programme and as a second-tier sector in the latter. This implies that the GMS has a regional coordination committee in place for the agricultural sector that interacts with sectoral focal points nominated by each GMS country. On the other hand, CAREC collaboration in agricultural issues is ad hoc, and therefore there is no specific commit-tee for agriculture or other specific governance mechanism. It is the CAREC Secre-tariat that coordinates activities in this field as part of its general coordinating functions.
At a country level, national coordination committees have been established to liaise with the different ministries and local agencies concerned with the imple-mentation of specific corridor activities at the national level. Bafoil and Ruiwen (2010; p. 80) point out that GMS “economic corridors are a mix of formal (because they are signed by heads of state) and informal mechanisms (they tend to involve local actors) for regional cooperation” – and the same could be said of CAREC. The important point is that implementation of the corridor interventions is not undertaken through a parallel structure at the national level, but through already established channels involving national and local public agencies.
The PRA corridors, on the contrary, have created corridor-specific structures using an outsourcing model where private companies, NGOs or consortia of various organizations are contracted out to run the corridor centres or ESCs. These centres are the direct providers of BDS and promoters of investment along the cor-ridor. The overall management and coordination of the corridor programme have been entrusted to a company, together with M&E. Evidently, the corridor centres liaise with national and local authorities and other actors that would like to pursue some kind of collaboration with the programme. As a result of this opening to other stakeholders, the PRA Project has succeeded in creating market-based business models for PPPs, for the funding/operation of the corridor strategy and in creating interest to mainstreaming the PRA model to the point that it has become a national programme. See Box 21 for further information.
117 ASEAN and ASEAN+3 focused on the integration process and formation of an ASEAN economic community; the Mekong River Commission (on water transport infrastructure development and management, and other aspects of water resource management of the Mekong River; CAREC and ACMECS (on the transport and trade agenda); the Bay of Bengal Initiative for Multi-Sectoral Technical and Economic Cooperation; the Indonesia-Malaysia-Thailand Growth Triangle (on broader connectivity issues); and the Southeast Asian Ministers of Education Organization (on human resources development).
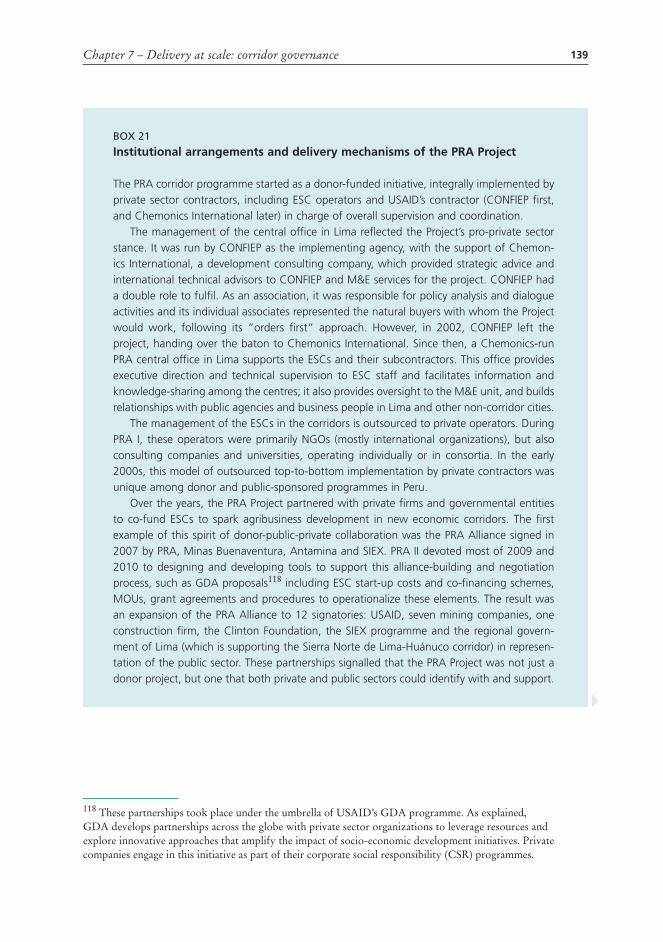
Chapter 7 – Delivery at scale: corridor governance 139
BOX 21
Institutional arrangements and delivery mechanisms of the PRA Project
The PrA corridor programme started as a donor-funded initiative, integrally implemented by private sector contractors, including ESC operators and USAID’s contractor (CONFIEP first, and Chemonics International later) in charge of overall supervision and coordination.
The management of the central office in Lima reflected the Project’s pro-private sector stance. It was run by CONFIEP as the implementing agency, with the support of Chemon-ics International, a development consulting company, which provided strategic advice and international technical advisors to CONFIEP and M&E services for the project. CONFIEP had a double role to fulfil. As an association, it was responsible for policy analysis and dialogue activities and its individual associates represented the natural buyers with whom the Project would work, following its “orders first” approach. However, in 2002, CONFIEP left the project, handing over the baton to Chemonics International. Since then, a Chemonics-run PrA central office in Lima supports the ESCs and their subcontractors. This office provides executive direction and technical supervision to ESC staff and facilitates information and knowledge-sharing among the centres; it also provides oversight to the M&E unit, and builds relationships with public agencies and business people in Lima and other non-corridor cities.
The management of the ESCs in the corridors is outsourced to private operators. During PrA I, these operators were primarily NGOs (mostly international organizations), but also consulting companies and universities, operating individually or in consortia. In the early 2000s, this model of outsourced top-to-bottom implementation by private contractors was unique among donor and public-sponsored programmes in Peru.
Over the years, the PrA Project partnered with private firms and governmental entities to co-fund ESCs to spark agribusiness development in new economic corridors. The first example of this spirit of donor-public-private collaboration was the PrA Alliance signed in 2007 by PrA, Minas Buenaventura, Antamina and SIEX. PrA II devoted most of 2009 and 2010 to designing and developing tools to support this alliance-building and negotiation process, such as GDA proposals118 including ESC start-up costs and co-financing schemes, MOUs, grant agreements and procedures to operationalize these elements. The result was an expansion of the PrA Alliance to 12 signatories: USAID, seven mining companies, one construction firm, the Clinton Foundation, the SIEX programme and the regional govern-ment of Lima (which is supporting the Sierra Norte de Lima-Huánuco corridor) in represen-tation of the public sector. These partnerships signalled that the PrA Project was not just a donor project, but one that both private and public sectors could identify with and support.
118 These partnerships took place under the umbrella of USAID’s GDA programme. As explained, GDA develops partnerships across the globe with private sector organizations to leverage resources and explore innovative approaches that amplify the impact of socio-economic development initiatives. Private companies engage in this initiative as part of their corporate social responsibility (CSR) programmes.

Making economic corridors work for the agricultural sector140
BOX 21 (Continued)
Each centre is run by an ESC Steering Board, which is formed by a representative of each partner organization and alternate members. Each board meets on a quarterly basis to discuss and approve the centre’s annual work plan, discuss the business plans signed with clients, and review progress made towards sales and investment targets. The partner companies have internalized the PrA Project’s practical approach to business development and offer ideas proactively in the ESC board meetings.119
Operationalizing the GDA-based model with ESCs funded from multiple sources posed some initial challenges. With financial reporting and administrative management guidance often varying from one funding source to the next, the programme focused on streamlin-ing operational systems and procedures (emphasizing the need for simplicity, flexibility and effectiveness) that would comply with the internal policies of each financing source without hindering the ESC performance.
WEF-led corridors have also developed corridor-specific institutions. To start with, these corridors are led by multistakeholder partnerships legally registered in their respective countries. These PPPs are assisted by independent, professional secretariats (same outsourcing model as in Peru). Two other corridor structures have been set up: an independent institutional setting to manage the financial facilities envisaged in the corridor strategy; and corridor centres (two in BAGCI and one in SAGCOT) that promote investment and facilitate information and BDS to farmers and firms. For example, these centres help investors obtain licens-ing, meet tax regulations, procure utilities, facilitate import/export and assist in labour recruitment.
One factor that has helped to shape or transform the institutional setting of the appraised corridor programmes is the extensive use of PPPs and multistake-holder partnerships. Four types of PPPs emerge from monographs on corridor programmes, as presented in Table 43.
The corridor programme, for example, can facilitate PPPs between cor-ridor beneficiaries thanks to dedicated financial facilities (e.g. catalytic and smallholder-support funds) and brokering and investment promotion services provided by the corridor centres. This type of PPP is widespread in the PRA and SAGCOT corridors.
Furthermore, PPPs are increasingly becoming the vehicle for delivering soft and hard interventions in the corridors. A case in point is the use of a PPP for developing a corridor-bound agricultural market information system in the GMS.
119 Source: personal communication.
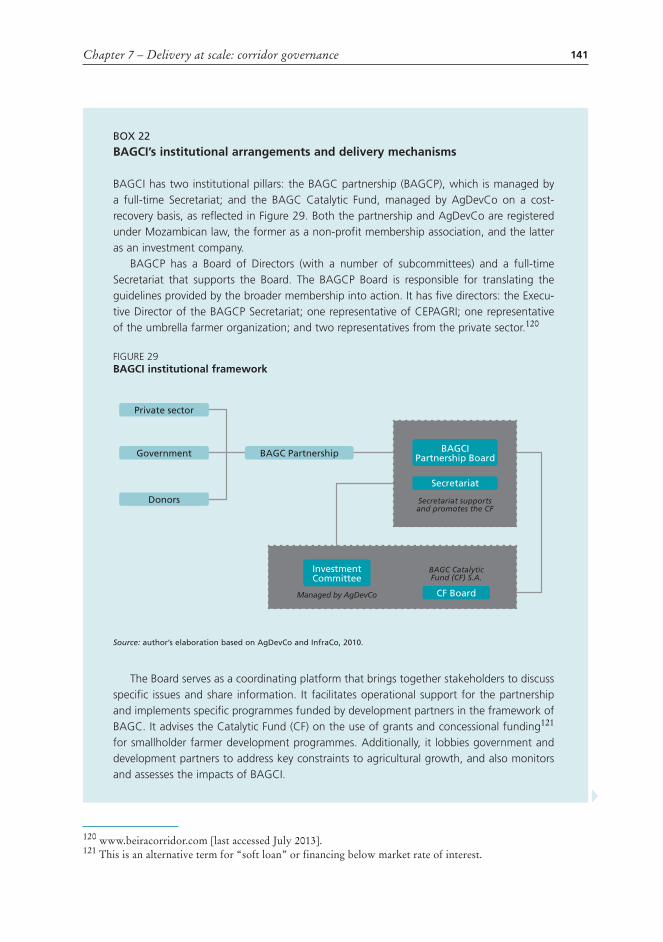
Chapter 7 – Delivery at scale: corridor governance 141
BOX 22
BAGCI’s institutional arrangements and delivery mechanisms
BAGCI has two institutional pillars: the BAGC partnership (BAGCP), which is managed by a full-time Secretariat; and the BAGC Catalytic Fund, managed by AgDevCo on a cost-recovery basis, as reflected in Figure 29. Both the partnership and AgDevCo are registered under Mozambican law, the former as a non-profit membership association, and the latter as an investment company.
BAGCP has a Board of Directors (with a number of subcommittees) and a full-time Secretariat that supports the Board. The BAGCP Board is responsible for translating the guidelines provided by the broader membership into action. It has five directors: the Execu-tive Director of the BAGCP Secretariat; one representative of CEPAGrI; one representative of the umbrella farmer organization; and two representatives from the private sector.120
FIGUrE 29 BAGCI institutional framework
Source: author’s elaboration based on AgDevCo and InfraCo, 2010.
The Board serves as a coordinating platform that brings together stakeholders to discuss specific issues and share information. It facilitates operational support for the partnership and implements specific programmes funded by development partners in the framework of BAGC. It advises the Catalytic Fund (CF) on the use of grants and concessional funding121 for smallholder farmer development programmes. Additionally, it lobbies government and development partners to address key constraints to agricultural growth, and also monitors and assesses the impacts of BAGCI.
120 www.beiracorridor.com [last accessed July 2013].121 This is an alternative term for “soft loan” or financing below market rate of interest.
Managed by AgDevCo
Private sector
Government
Donors
BAGC Partnership
BAGC CatalyticFund (CF) S.A.
Secretariat supportsand promotes the CF
BAGCIPartnership Board
Secretariat
CF Board
InvestmentCommittee
Making economic corridors work for the agricultural sector142
BOX 22 (Continued)
The BAGC CF, as mentioned earlier, invests in early-stage farming and agroprocessing businesses that integrate smallholder and emergent farmers.122 It has a board of four direc-tors: a representative from AgDevCo, the fund manager, and three directors appointed by the BAGCP Board (AgDevCo and InfraCo, 2010). It also has an Investment Committee responsible for making allocation decisions in accordance with the recommendations of the fund manager. A Mozambican company (BAGC Investment Company) is being established to inherit the work from AgDevCo. There are challenges ahead to operationalize the new governance structures and ways of working between BACG and the local fund manager in an effective and efficient manner (DFID, 2013).
Another example is the launching of an insurance scheme for selected agricultural crops in the Beira Corridor via a PPP. One of the most recurrent applications of the PPP model is for infrastructure development, as seen in BAGCI, MP3EI, PRA and SAGCOT. Such partnerships can tackle the funding, building and management of major connective infrastructure such as ports and highways as discussed earlier; market infrastructure such as agrifood markets and warehouses; or last-mile infra-structure as in the case of the ISCs in the Tanzanian corridor.
The last type of PPP identified is exemplified by the Peruvian PPPs established in the framework of the GDA programme. In this case, the partnership is between the Government of the United States of America, through its development agency, and a private firm (e.g. a mining or construction company). The private company, most often as part of its CSR strategy, contributes to setting up and operating a corridor centre to benefit local firms, farmers and communities in general located in the corridor.
Multistakeholder partnerships go beyond the collaboration between private companies and governmental insitutions to engage farmer associations, civil society organizations, IFIs, international technical agencies and bilateral and multilateral donors. Examples of this model are the Beira and SAGCOT partnerships, which are among the several country-level partnerships affiliated with the New Vision for Agriculture. The approach of the SAGCOT Partnership, although innovative, is not new to the United Republic of Tanzania. In 2005, the Tanzania Agriculture Partner-ship (TAP) was launched under the coordination of the Agricultural Council of Tanzania (ACT). TAP is an agricultural PPP with 50 public and private partners123 (SAGCOT, 2010; 2011).
122 See Glossary for a definition of emergent farmer.123 TAP is an informal PPP platform that works towards improving the production and marketing of agricultural crops (mainly maize and rice) using a value-chain approach in 25 districts of the United Republic of Tanzania. TAP’s members include development partners, central and local government agencies, agribusiness multinational companies, local private companies and international and domestic NGOs. For further information, see: www.tap.or.tz [last accessed July 2013].

Chapter 7 – Delivery at scale: corridor governance 143
These partnerships have two main benefits. First, at the country level they broaden stakeholder engagement to farmers’ associations, civil society organiza-tions, local private sector firms, multiple ministries and local governments. Second, the partnership becomes a vehicle for coordinating and reinforcing global support for on-the-ground corridor activity. This support is not just financial, but also includes expertise, and knowledge about efficient new approaches to agricultural and local development (WEF, 2013).
Despite their importance, all the above partnerships are fairly new in terms of their application not only to corridor programmes, but countrywide. This newness implies a need to transform country-level institutional mindsets and mechanisms. For instance, in order to work properly, these partnerships may require a transfor-mation of the legal, regulatory and policy framework in which they are embedded. Consequently, one of the roles of economic corridors is to test new concepts such as those of PPPs and multistakeholder partnerships, which can then be upscaled to the entire country or other fields of work.
TABLE 43 Types of public-private collaboration present in (agro)corridor programmes
Type Actors Description
Agribusiness PPP Agribusiness firms and farmer organizations
A collaboration (usually informal) facilitated by corridor centres between an agribusiness firm and farmers, e.g. a partnership built around a contract farming arrangement
Infrastructure PPP
Government/lead corridor convener + private company from the transport, energy or construction sectors, etc.
Public-private collaboration for co-financing, building and managing corridor infrastructures and facilities, such as highways, ports, markets and warehouses
PPPs for implementing soft corridor interventions
Government/lead corridor convener + private companies, universities, research centres, etc.
Public-private collaboration for co-financing and implementing soft corridor interventions such as corridor-bound market information systems or agricultural insurance products
Market-based PPP concerning the corridor centres
Government/lead corridor convener + private companies interested in local/agricultural development
Public-private collaboration for co-funding and managing the operation of a corridor centre and implementation of its strategy
Source: author’s elaboration.

145
Chapter 8
Gains and pitfalls of agrocorridor initiatives
Agrocorridors are perceived as a promising development model that may generate significant gains and impacts on economic growth, trade and connectivity (Infante, 2012). Corridor programmes, as the megaprojects that they are, often become the backbone of national and even regional economies. However, the megaproject label entails many difficulties. It means that corridors – especially regional integration ones – mobilize formidable resources; engage multiple stakeholders; deal with a complex, interwoven set of sectors (e.g. transport, energy, telecommunications, agri-culture, mining and tourism); and extend beyond political cycles (ibid.). Therefore, they need greater implementation efficiency, oversight, transparency and (mutual) accountability. Many things can go wrong and offset the potential gains that cor-ridors may have.
This chapter reviews both the gains and the challenges facing the corridor initia-tives appraised.
8.1 POTENTIAL GAINS OF AGROCORRIDORS FOR ECONOMIC GROWTH, TRADE AND CONNECTIVITY
When adequately designed and implemented, agricultural corridors have sub-stantial positive impacts in terms of economic development, as well as social and environmental sustainability. Available qualitative and quantitative data showing such impacts have been gathered and analysed, particularly regarding investment attraction and income and employment generation. Some corridor initiatives are young – between one and three years old – so data on quantitative impact are limited even though results are visible in pilot activities and specific subprojects. In these cases (BAGCI, MP3EI and SAGCOT), the information presented corresponds to the expected development benefits associated with the corridors, according to their masterplans or blueprints.
There are different indicators of the economic performance of corridors. The most important are GDP gains, additional exports and domestic sales, (private) investments and employment generation. A summary of some of these indicators is given in Table 44.
The contribution of these initiatives to the GDP of the corridor area ranges from 1.1 to 12.9 percent, as noted in Table 44. For example, in the GMS corridor improve-ments represented, GDP gains 1.1–8.3 percent, or 0.7–7.7 percent, excluding China (ADBI, 2010). The impact of corridors on GDP is highest in the least well-connected countries, and particularly in Cambodia, followed by the Lao People’s Democratic Republic and Myanmar. CAREC countries have grown consistently

Making economic corridors work for the agricultural sector146
from 2006 (baseline year) to 2010, with a GDP per capita growth rate of 17 percent (CAREC, 2010). Some countries such as Afghanistan, Azerbaijan, Turkmenistan and Uzbekistan have experienced increases of 30–48 percent in GDP per capita (ibid.). Nonetheless, in the absence of specific data, it is impossible to quantify the exact contribution of the CAREC corridors to this growth.
PRA I had a sizeable effect on the GDP of some corridors: 1.65 percent in Pucallpa, 1.90 in San Martín and 2.35 in Ayacucho (ibid.). However, its impact was more visible on the corridor agricultural GDP, notably in Ayacucho, Cajamarca, Pucallpa and San Martín, where PRA activities ranged from 4.5 to 8.7 percent of the agricultural GDP.
For the remaining corridor programmes, Table 44 records the estimated GDP gains. Indonesia estimates that by applying MP3EI, the annual national GDP growth will be approximately 12.7 percent nationally, versus a 10.3 percent growth in a business-as-usual (non-MP3EI) scenario. This signifies a 2.4 percent GDP gain associated with the corridor programme. Internal growth within the corridor is estimated at 12.9 percent, while growth in the areas outside the corridors would also increase by 12.1 percent as a result of the spillover effects of corridor development (CMEA, 2011).
Finally, BAGCI and SAGCOT plan to generate total incremental revenues per annum worth US$1 875 and US$1 300 million, respectively. These increases repre-sent GDP gains estimated at 12.9 percent in the case of Mozambique and 5.2 percent in the Tanzanian corridor. More specifically, the BAGCI programme is projected to generate US$1 billion of farming revenue annually, plus additional supply-chain revenues in the order of US$0.5 billion (AgDevCo and InfraCo, 2010). The distribu-tion of these direct benefits is consistent with the corridor business model that puts smallholder farmers at centre stage. BAGCI is also expected to have major indirect benefits for a broad section of the corridor population by inducing growth in other sectors (e.g. construction, services and retail), which generate a multiplier effect. Table 45 sets out order-of-magnitude estimates of the incremental direct and indirect benefits, assuming that the Investment Blueprint is fully implemented by 2030.
TABLE 44 Economic performance indicators
GDP gain (%) Incremental jobs Private investment (US$ million)
BAGCI 12.9 350 0001) 1 356
CAREC – – –
GMS 1.1–8.3 – –
MP3EI 2.4 – 202 980
PRA 1.65–2.35 109 0002) 28
SAGCOT 5.2 420 0001) 2 100
Sources: AgDevCo and InfraCo, 2010; CAREC, 2010; 2012; ADBI, 2010; CMEA, 2011; USAID, 2008a; 2008b; Milder et al., 2012.Notes: 1) These data are estimates that include both direct and indirect jobs. 2) This figure reflects the actual generation of direct jobs created; it does not account for the creation of indirect new jobs.

Chapter 8 – Gains and pitfalls of agrocorridor initiatives 147
Employment generation, as noted in Table 44, is also significant in the corridor programmes for which there are data available. PRA I helped approximately 200 Peruvian SMEs (star connecting firms) generate close to 82 000 new jobs from 2000 through 2008. For the current PRA II, the goals set include creating 27 000 new permanent jobs by the end of 2014.124
SAGCOT expects to create at least 420 000 new employment opportunities in agriculture. In total, the programme seeks to lift 2.3 million people permanently out of poverty through the creation of employment opportunities, as detailed in Figure 30.
BAGCI sees employment creation as one of its main outcomes: 350 000 wage-paying jobs, as noted in Table 46. While the first generation of BAGCI investments seeks to ensure the access of smallholder farmers to profitable markets, the second- or third-generation investments target job creation in upstream and downstream linkages and SME development (World Bank, 2010). Table 46 disaggregates the employment generation targets by direct and indirect effects and value-chain links.
As shown in Table 47, another important impact of corridors is the inducement of private investments. The Table also gives the ratio of private investments induced in the corridor to each US$ invested in the corridor programme. This ratio is highly variable, from 1 to 0.45 in the PRA corridors, to 1 to 3.51 in Mozambique. This depends mainly on two factors. The first is the type of private firm concerned: mostly local SMEs in the PRA Project versus multinational agribusiness firms in BAGCI and SAGCOT. The second is the type of investment mobilized: infrastruc-ture investment (e.g. feeder roads and on-farm infrastructure that are among the main items in the African and Indonesian corridors), versus productive investments relating to agribusiness and agro-industry processes typical of the Peruvian corri-dors (e.g. processing facilities and equipment for bixin, trout and dairy production).
Although there are no statistics available on private investments attracted to the GMS and CAREC corridors, intra- and cross-subregion inflows of FDI to the
124 www.proyectopra.com [last accessed August 2013].
TABLE 45 Estimated benefits of BAGCI
Estimated benefits US$ million per annum
Gross on-farm revenue, including irrigated outgrower plots 1 000
Additional supply-chain revenues (e.g. input supply, machinery leasing, transport) 500
Multiplier effects 375
Total incremental revenues associated with BAGC 1 875
Gross value added (wage income + return on capital + taxes) 750
Fiscal revenues to the Government of Mozambique 50
Source: AgDevCo and InfraCo, 2010.
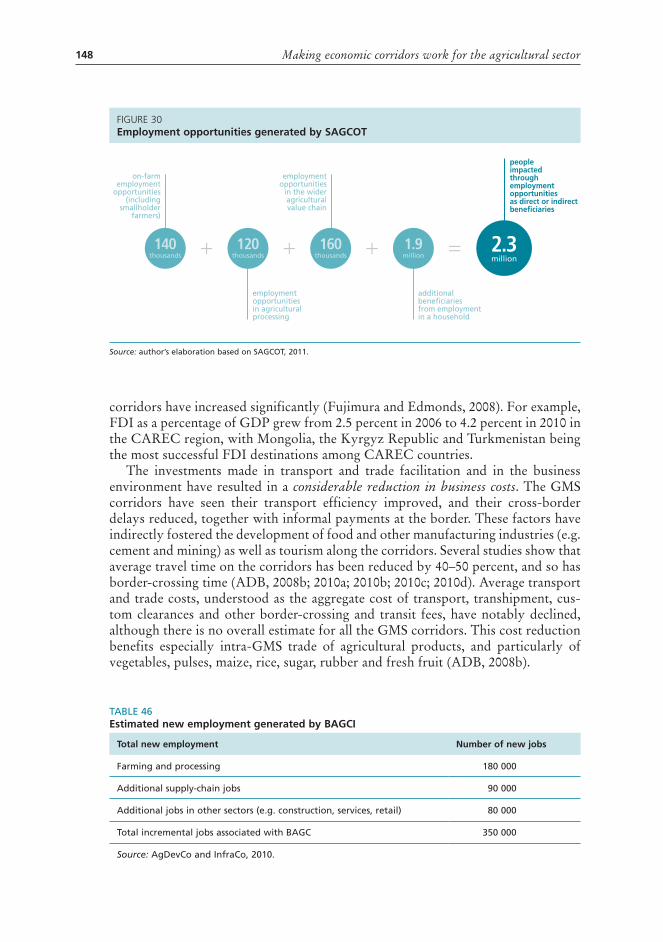
Making economic corridors work for the agricultural sector148
corridors have increased significantly (Fujimura and Edmonds, 2008). For example, FDI as a percentage of GDP grew from 2.5 percent in 2006 to 4.2 percent in 2010 in the CAREC region, with Mongolia, the Kyrgyz Republic and Turkmenistan being the most successful FDI destinations among CAREC countries.
The investments made in transport and trade facilitation and in the business environment have resulted in a considerable reduction in business costs. The GMS corridors have seen their transport efficiency improved, and their cross-border delays reduced, together with informal payments at the border. These factors have indirectly fostered the development of food and other manufacturing industries (e.g. cement and mining) as well as tourism along the corridors. Several studies show that average travel time on the corridors has been reduced by 40–50 percent, and so has border-crossing time (ADB, 2008b; 2010a; 2010b; 2010c; 2010d). Average transport and trade costs, understood as the aggregate cost of transport, transhipment, cus-tom clearances and other border-crossing and transit fees, have notably declined, although there is no overall estimate for all the GMS corridors. This cost reduction benefits especially intra-GMS trade of agricultural products, and particularly of vegetables, pulses, maize, rice, sugar, rubber and fresh fruit (ADB, 2008b).
TABLE 46Estimated new employment generated by BAGCI
Total new employment Number of new jobs
Farming and processing 180 000
Additional supply-chain jobs 90 000
Additional jobs in other sectors (e.g. construction, services, retail) 80 000
Total incremental jobs associated with BAGC 350 000
Source: AgDevCo and InfraCo, 2010.
figure 30Employment opportunities generated by SAGCOT
1.9million
160thousands
120thousands
on-farmemployment
opportunities(including
smallholderfarmers)
140thousands
employmentopportunitiesin agriculturalprocessing
employmentopportunities
in the wideragriculturalvalue chain
peopleimpactedthroughemploymentopportunitiesas direct or indirectbeneficiaries
additionalbeneficiariesfrom employmentin a household
+ + + = 2.3million
Source: author’s elaboration based on SAGCOT, 2011.

Chapter 8 – Gains and pitfalls of agrocorridor initiatives 149
Similarly, in the CAREC corridors in 2011 almost one hour was shaved off border-crossing time, and costs to clear the border decreased by an average 16 per-cent (CAREC, 2012). Furthermore, the average time required to start a business and the cost of business start-up procedures have been cut in half from 2006 (31 days and 26.6 percent of gross national income per capita, respectively) through 2010 (15 days and 10.8 percent) (ibid.).
Although it is too soon to assess the broader economic impacts of the PRA Project’s PPP infrastructure component, some of the PRA-supported highway con-cessions completed offer significant savings in terms of transport time and costs. For example, in the Tarapoto-Yurimaguas segment of the IIRSA North highway, trans-port costs have decreased by 44 percent, and transport time by 70 percent (USAID, 2008a; 2008b). Moreover, the estimated benefits of the port of Callao concession could easily surpass US$2 billion in the initial three years of operation (ibid.).
An underlying objective of BAGCI is to improve trade and transportation linkages (AgDevCo and InfraCo, 2010). Although no specific trade targets have been set out in the blueprint, BAGCI intends to build further on the combination of multimodal transport infrastructure and recently improved trade logistics that have been increasingly positioning Mozambique as one of the sub-Saharan coun-tries with the lowest costs of trading across borders. More precisely, according to Domínguez-Torres and Briceño-Garmendia (2011) the costs of export and import in Mozambique are about 60 percent of the sub-Saharan average, and the time required to export and import is around 70 percent of the regional average.
Moreover, the corridors described have had a significant impact on regional and international trade and on domestic sales. For instance, cumulative sales of goods and services generated by the PRA Project are worth US$397 million (PRA I: US$307 million and PRA II: US$90 million). About 47.8 percent of the addi-tional sales generated in the first phase – US$146.8 million – were exports, while the remaining 52.2 percent was channelled to the domestic market.
The GMS and CAREC corridors are also becoming a platform for boosting trade flows, because of the growth and strengthening of regional institutions, and
TABLE 47 Actual and estimated new investments triggered by the corridors
Budget of the corridor initiative (US$ million)
Private investments (US$ million)
Ratio of private investments per US$ invested in the corridor programme
BAGCI 386 1 356 1:3.51
CAREC 25 136 – –
GMS 7 428 – –
Indonesia 111 440 202 980 1:1.82
PRA 62 28 1:0.45
SAGCOT 1 270 2 100 1:1.65
Sources: AgDevCo and InfraCo, 2010; CAREC, 2010; 2012a; ADBI, 2010; CMEA, 2011; USAID, 2008a; 2008b; Milder et al., 2012. Note: data registered in the Table exclude investments brought in by the private sector via PPPs.
Making economic corridors work for the agricultural sector150
the development of shared experiences and sense of community that increases trust, as well as their ability to deliver jointly regional public goods and services. Total GMS exports and imports grew 17.4 and 16.6 percent, respectively, from 2000 to 2009. Intraregional trade among the GMS countries in value terms has been dou-bling almost every three to four years since 2000, with China seizing the lion’s share, followed at a distance by Thailand and Viet Nam (ADB, 2012c). Intra-GMS trade is now estimated at 30–50 percent of the area’s total trade (Shrestha and Chongvilai-van, 2013). The size of intra-GMS trade increased at an average annual growth rate of 21.7 percent between 2000 and 2009, from US$13.9 to US$81.2 billion (ADB, 2012f). However, this estimate excludes informal trade, which appears to account for a significant share of intra-GMS trade, perhaps in the order of 20–30 percent of total trade (ADB, 2007b). The composition of GMS5 exports varied. Cambodia, the Lao People’s Democratic Republic and Myanmar increased their share of exports of primary products, while Thailand and Viet Nam exported manufacturing products (ibid.). Extra-GMS trade (i.e. GMS trade with the rest of Asia and the world) has also augmented at double-digit rates since 2000 (ibid.).
Agricultural trade is growing among the GMS countries, through the GMS coun-tries (especially for the landlocked Lao PDR), and with the rest of the world (mainly Japan, EU and the United States of America) (ADB, 2012f). The exact amount of intra-GMS agricultural trade is difficult to estimate, in part because of the high level of informality enabled by the porous borders and the relatively small volumes of agricultural products traded (ibid.). Similarly, there are no studies that document the exact percentage of trade growth attributable to corridor development.
Even in the absence of exact data, the significant reductions in transport and border crossing time and costs resulting from the GMS programme’s infrastructural improvements and trade facilitation measures have definitely improved trade perfor-mance. In particular, the increase in cross-border and intra-GMS agricultural trade is expected to lead to greater cross-border investment, complementing trading activities and involving cross-border production, agroprocessing and marketing tie-ups that relieve raw material supply constraints, upgrade technology and improve capacity utilization. The expansion in extra-GMS trade can also enable agribusiness com-panies in the GMS corridors to link up with regional supply chains and networks. Investments in agriculture and other anchor industries, and labour mobility among the Mekong countries are also experiencing a wave of dynamism (ADB, 2012c).
In Central Asia, the establishment and upgrading of a network of six multi-modal transport corridors of more than 80 000 km are providing greater access to major external markets for trade to and from the region. The corridors are expected to have a regional multiplier effect that could triple trade flows by 2017, compared with 2006 (CAREC, 2010). For example, the Southern Transport Cor-ridor Road Rehabilitation Project in the Kyrgyz Republic (part of CAREC Cor-ridors 2, 3, and 5) has spurred trade between the Xinjiang Autonomous Region of China and the Kyrgyz Republic, which grew annually by 13 percent from 2003 to 2010 (CAREC, 2012).
Most corridors have significant economic impacts on smallholder farmers. An evaluation carried out in 2008 documented improvements in the GMS corridors with regard to farmers’ incomes and diversification of income-generating activi-ties, access to markets and credit, land ownership patterns and other issues (ADB,
Chapter 8 – Gains and pitfalls of agrocorridor initiatives 151
2008b). For instance, surveys show that the income of farmers living along EWEC rose by 20 percent because of the increase in selling volumes and prices received after road completion (ADB, 2008a).
By assisting its clients, PRA I helped to improve the productivity and income generation of more than 42 000 small producers and firms (beneficiaries) via the long-term commercial linkages established. An estimated 43 percent of these ben-eficiaries were very poor, i.e. earned less than US$1 per day (USAID, 2008a) and 37 percent were women (USAID, 2008b). Evidence of the PRA Project’s impact on beneficiaries is available for some value chains and corridors. Artichoke producers in the Mantaro Valley, for example, experienced an average net income increase of 30 percent; and in the Ayacucho corridor the PRA-assisted replacement of potatoes by snow peas resulted in an additional US$351 in sales and 269 person-days of employment per ha (USAID, 2008a; 2008b).
Finally, in the African corridors, growth of commercial agriculture on the scale and in the manner inclusively and sustainably envisaged in the BAGCI and SAGCOT blueprints would have a positive transformational impact on smallholder farmers and rural communities. Consequently, BAGCI plans to generate US$1 billion of gross on-farm income (AgDevCo and InfraCo, 2010). Its main direct benefits are higher and more predictable incomes for farmers and other chain actors and increased employment opportunities for on-farm and off-farm labour, but also capital income generated from investment and fiscal revenue accruing to the Mozam-bican Government. Equally, the SAGCOT plan to mobilize US$3.4 billion of public and private investment to “kick start” the region’s latent potential for commercial agriculture is expected to contribute to the transformation of several thousand small-holders into commercial farmers, with access to irrigation and weather insurance. As a result, an annual value of additional farming revenues of US$1.2–1.3 billion will be generated by 2030 (SAGCOT, 2011; Milder et al., 2012). Impacts on regional food security are also anticipated thanks to some new 350 000 ha of land in profitable production, serving regional and international markets. The resulting surge in cor-ridor production is estimated at 630 000 tonnes of rice and 680 000 tonnes of other grains, 4.4 million tonnes of sugar cane, 3 500 tonnes of red meat, and 32 000 tonnes of fruit and vegetables (ibid.).
The corridor programmes have had other long-term impacts. For example, one of the PRA Project’s most significant contributions – which goes even beyond the actual and potential impacts highlighted above – lies in the development of a second-generation PPP infrastructure model adapted to the Peruvian con-text. This model includes state-of-the-art concession contracts, environmental management tools and financial engineering. The importance of the model is its applicability beyond PRA. For instance, after developing the concession scheme for the port of Callao with PRA Project support, ProInversión decided to prepare bidding documents to attract private companies to invest and operate in another five Peruvian ports.125 The model is also being applied to numerous IIRSA infra-structure initiatives.
125 www.proinversion.gob.pe [last accessed May 2013].
Making economic corridors work for the agricultural sector152
The PRA Project impacted not only on people but also on institutions. The demonstration effect on the agribusiness sector and on governmental and develop-ment initiatives was evident from the first phase. As of September 2008, 25 instances of producer associations and firms had invested, following in the wake of PRA pioneer clients, but without Project support. Similarly, at that time, 38 development projects and NGOs, and 32 public instances had adapted the Project’s market-pull methodology (USAID, 2008a; 2008b).
In the private sphere, the demonstration effect has been very important in vari-ous agricultural value chains. For example, the Project introduced the production of artichokes in the Junín corridor in 2002. The total artichoke production area in the corridor went from none to almost 700 ha by the end of Phase I, of which only half were PRA-supported. More growers, alerted by the attractive returns of fellow farmers, decided to plant artichokes, without the assistance of the Project but taking advantage of the presence of new buyers in the area. A similar pattern was observed in the black-eye pea chain in the Piura corridor, where 400 ha were planted without Project support out of 2 200 additional ha, and the number of processors increased from one to seven, forming a regional bean cluster. Another example is the Ama-ranth Road (amaranth or kiwicha is an Andean grain), linking Cusco, Abancay and Andahuaylas. Only in Andahuaylas, 80 additional ha were planted without PRA Project support, of a total of 340 ha in the zone (USAID, 2008a).
As discussed in previous sections, institutional instability and the changing business and public environment introduced continuous modifications in the PRA Project’s original format. However, the results achieved seem to indicate that the programme has managed to weather the storms without slowing down performance. The potential institutional risk involved in collaborating with mining and other sector companies has not yet materialized. On the contrary, the private partners have shared the PRA model and have proactively engaged in the promotion of agribusiness development in their corridors. PRA II faces many challenges ahead and particularly how to transfer the programme’s philosophy, methodologies and tools to SIEX successfully. Being a privately managed initiative worked for the PRA Project, but it is still to be seen whether the PRA model can be as highly performing when managed by a public entity (ibid.).
The WEF model, although still at an early stage of development, also has poten-tial to be adapted in other countries and applied to other sectors. In 2011, a number of African leaders agreed to launch Grow Africa to support CAADP. Building on SAGCOT, BAGCI and other models piloted by the New Vision for Agriculture, Grow Africa can play a catalytic role in accelerating private sector investment and expanding knowledge of best practices across Africa (Jenkins, 2012).
As important as economic sustainability is environmental sustainability. A typical step in the design of corridors is an environmental assessment to gauge environmental impacts and develop alternatives and mitigation options to guide interventions and set priorities. For example, the GMS programme conducted a transboundary, cross-sectoral strategic environmental assessment to support gov-ernments in ensuring that economic corridors have the best possible impact on the environment. Spatial modelling tools have been used to help locate and quantify the environmental impacts geographically (both in terms of opportunities and risks) of corridor development (Ramachandran and Linde, 2011).

Chapter 8 – Gains and pitfalls of agrocorridor initiatives 153
SAGCOT went one step forward with its agricultural green growth strategy. From 2010 to 2030, the implementation of this strategy will result in a net reduc-tion of GHG emissions totalling nearly 30 million tonnes of CO2-equivalent, worth almost US$300 million.126 More than 90 percent of these reductions are associated with avoided deforestation, while the remainder results from increased soil carbon127 and avoided emissions from agricultural practices. Avoided GHGs associated with sustainable intensification of rice and livestock production were not included in the model, because of data uncertainties, but could significantly increase these estimates. The anticipated emissions reductions from the green strategy could open the door to significant new financing from international carbon markets and REDD+128 financing mechanisms (Milder et al., 2012). The SAGCOT agricultural green growth strategy will also generate annual water savings of about 940 million m3 per year on irrigated land (Milder et al., 2012).
8.2 PITFALLS TO AVOIDThe next paragraphs will flag some concerns derived from the incorrect design and implementation of agrocorridor programmes. These concerns do not necessarily refer to the six cases analysed in depth but could relate to other initiatives spot-lighted during the initial mapping exercise. Corridor programmes do not always get things right when it comes to promoting the type of agribusiness development that reduces poverty and real food prices; creates employment; stimulates real wages; improves food safety, quality and consumer choice; and takes into account social and environmental considerations.
More specifically, corridor initiatives may face problems from design and imple-mentation issues. The latter category encompasses problems concerning delivery of the corridor programme and governance factors.
Some of the most frequent design problems include the following:1. Devising an oversized programme that exceeds the financial and human
capacities of those responsible for corridor development. The Indonesian cor-ridor programme has only been in operation for a few months so it is hard to draw valid conclusions, but it runs the risk of being oversized. Concretely, its design may not adequately reflect the human and fiscal capacities of local governments to do their part of the corridor work.
2. Inducing the development of corridors starting from scratch instead of build-ing on already existing agglomerations, as in the case of the Desert Develop-ment Corridor in Egypt. Economic corridors should be developed in areas where there is already economic density and potential that can be maximized,
126 At recent carbon prices of US$10 per tonne of CO2-equivalent (Milder et al., 2012).127 See Glossary.128 REDD is the UN Collaborative Programme on Reducing Emissions from Deforestation and Forest Degradation (REDD) in developing countries. REDD+ goes beyond deforestation and forest degradation, by incorporating the role of conservation, sustainable management of forests and enhancement of forest carbon stocks. The REDD/REDD+ programme offers several financing options, including market mechanisms, fund-based systems and their combination. For further information, see: http://www.un-redd.org/AboutREDD/tabid/102614/Default.aspx [last accessed July 2013].
Making economic corridors work for the agricultural sector154
i.e. viable in areas with untapped growth potential. Conversely, blind support to backward regions with little potential for economic growth and where eve-rything needs to be developed is plainly objectionable.
3. Misaligning hard and soft interventions in the corridors. Corridor initiatives do not always pay equal attention to hard and soft components – there is a tendency to invest first in hard infrastructure, thinking that soft interventions will logically follow. However, this is not the case since such alignment has to be planned and prepared. Failure to do this (i.e. developing lacking connective infrastructure without improving the business environment and investing in transport and trade facilitation) gives way to a scenario in which returns on investments are not maximized, and economies of scale are more difficult to attain. The long experience of the GMS and CAREC programmes indicates how long it takes in the real world to introduce soft interventions in a corridor initiative. The design and planning of an effective hard-soft mix is challenging because it requires intense capacity building and coordination skills to orches-trate the participation of various actors, each with a vested interest in its own part of the agenda.
4. Mistargeting is another common mistake. The selection of sectors, value chains, crops and geographic areas ought to be guided by criteria of economic perfor-mance and social and environmental sustainability. Sometimes, the wrong areas, sectors and industries are selected on political grounds or dictated by lobby and pressure groups. In other cases, the mistargeting is caused by inad-equate appraisals based on wrong assumptions and insufficient evidence. The targeting or selection process in the design of the corridor programme should be carried out on the grounds of economic and technical feasibility studies and preferably through some kind of multilevel and multistakeholder checks-and-balances mechanism. For instance, Ambrosio-Albalá and Bastiaensen (2010) suggest that there is a high risk of local governments being captured by local groups and elites, which can lead to a failure to identify economies of scale for delivering public services or a failure to deal with corridor spillovers. This risk could be minimized by ensuring the active involvement of central governments in the design, regulation and coordination of corridor initiatives. In other cases, multinational agribusiness companies can exert excessive pres-sure on governments and development partners to the point where they can hijack the design of the corridor programme. A good measure to avoid this is to invite domestic firms, producer federations and civil society to engage in the corridor and counterbalance the influence of multinationals.
The right selection of growth centres, usually large urban areas, can do much to stimulate regional development and integration. However, because of sheer dyna-mism, there is a risk that these novel urban configurations do not necessarily feature high on policy agendas. Recognizing the role of these urban centres, as the PRA Project did with its “intermediate cities” theory, is key to spreading the economic, spatial and infrastructural synergies of large cities geographically over an area within the corridor vastly exceeding their current municipal boundaries.

Chapter 8 – Gains and pitfalls of agrocorridor initiatives 155
5. Disregarding issues that, although vital for the success of the agricorridor, require unpopular actions(s) that will not produce political gains, such as land reform or corruption. For example, if the lack of security in land tenure dis-courages potential investors and the design of the agricorridor programme fails to tackle this critical issue, the corridor investment strategy will be unlikely to be successful.
6. Neglecting the introduction of environmental, social and food security safe-guards. The quest for sustainable spatial development entails ecological and social aspects being harmonized with economic objectives. Therefore, cor-ridor developers should ascertain whether the strategy to develop agribusiness within the corridor contributes to maximizing the economic, social and envi-ronmental benefits of the corridor for local communities.
Problems in implementation. As mentioned above, corridor implementers may face problems related to the delivery of the strategy and to ensuring good governance. Possible delivery problems when implementing an agrocorridor programme include administrative and institutional shortcomings; lack of coordination at various levels; and other issues related to the implementation of megaprojects. The most common governance issue is the lack of or late reaction against a corridor’s negative side effects on food security, communities and the environment.
Notionally, corridors pursue a hard-soft continuum that increases connectivity, competitiveness and the sense of community. These are the three Cs that the GMS programme aspires to achieve. This is, however, difficult in practice. Even in one of the most advanced corridor experiences, the three Cs are often implemented in a non-systemic way. For example, GMS countries have successfully implemented the hard components of the corridor programme, such as roads and ports. Nonetheless, the three Cs remain unmet without the softer components fully in place. Connectiv-ity has been partially achieved, but could go much further. Competitiveness-wise, GMS corridors are currently performing well in the global arena thanks to low labour costs, but reliance on low wages is not a viable long-term strategy (Bafoil et al., n.d.). To attain long-term competitiveness, the GMS region should strengthen the implementation of soft elements that stimulate clustering and diversification of eco-nomic activities. Political and cultural power barriers among GMS countries, which are yet to be broken down, hinder the sense of community along the corridors.
The ADB-led model shows some institutional shortcomings. For instance, there are some regional governance gaps. There are no proper multilateral struc-tures of negotiations inside the GMS programme to accelerate the harmonization time and the ratification of the agreements regulating the soft interventions (e.g. transport and trade facilitation annexes) that complement the infrastructure. The underlying problem is a gap in the delegation process of cross-border issues to regional instances, given that the participating countries do not count on a com-mon regulatory system nor share a common rights system (Bafoil et al., n.d.). This gap could be a reflection of the diverse institutional paths of countries within the Mekong and Central Asian regions. But it also signals the need for improved governance structures that push for a systemic approach on soft issues in order to foster priority economic activities, infrastructure connections and social structures within the corridor (ibid.).

Making economic corridors work for the agricultural sector156
Furthermore, at national level, there is a local capacity deficit at the implementa-tion stage. In particular, weak coordination among agencies involved in transport, agriculture, trade and investment facilitation at both the central and local levels is a major issue. Water-related issues, for example, often fall between the responsi-bilities of the ministries for water, agriculture, urban development, energy and the environment; land-use issues between those of the agriculture, forestry, energy, and environment ministries at the national level, with multiple other stakeholders at the provincial and district levels. The international system for development assistance exacerbates matters, since it has its own parallel set of international agencies. This fragmented institutional approach means that governments may not emphasize suf-ficiently the highest priority resource opportunities in the corridors.
There is also a lack of connection between the higher levels and the operational levels of national governments. These issues have contributed to problems and delays in implementing agreements already adopted and ratified. The involvement of local authorities and communities in developing the GMS and CAREC corridors has been insufficient. Moreover, there is a glaring gap between the capacities of local officials versus the planning and negotiation process that takes place at the ministe-rial meetings (Bafoil and Ruiwen, 2010). The provision of an enabling environment is not enough. In spite of the progress made, there is a lack of understanding at low levels; lack of communication; lack of harmonization of rules; weak negotiation processes; no education provision for the local personnel involved in the implemen-tation; and lack of incentives at the national level to enforce corridor agreements.
Moreover, the increasing use of the PPP model in corridor strategies, as seen in section 6.6, poses multiple challenges when it comes to implementation. Many of the countries reviewed do not have adequate regulatory frameworks in place to gov-ern public-private collaboration (in some cases, the only piece of legislation in place is the general public contract law). Therefore, corridor partners may feel unprepared to face the prevailing economic challenges (such as technical difficulties that drive up the cost and thin domestic markets that limit revenue generation); social issues (land acquisition and expropriation); and challenges derived from climate change that reduce the interest of the private sector in infrastructure projects along the corridor. Consequently, they fail to attract enough private expertise and investments to finance, build, operate and maintain highways, ports and energy infrastructure projects in the corridors in the long term.
The above situation makes the facilitation (through TA grants) of key PPP infra-structure concessions a key ingredient of a corridor programme. A set of corridor interventions can be designed to equip the national authorities with legal, regulatory and procedural instruments that tackle the challenges mentioned above. The first steps might be to identify critical regulatory reforms needed to facilitate meaningful infrastructure PPPs, and to develop PPP-concession business schemes and trans-actions step by step (design, structuring and implementation), or enhance those already existing. For example, the competent national authorities can be retooled to introduce innovative financial engineering schemes that improve the bankability and attractiveness of infrastructure projects in the corridors and introduce safeguard mechanisms to protect the public interest. Assistance can be directed to launching innovations to ensure the climate proofing of corridor infrastructures developed and managed through PPPs. It is also important to empower host governments so

Chapter 8 – Gains and pitfalls of agrocorridor initiatives 157
that they are able to engage in international promotional campaigns to ensure the participation of both national and international bidders. Finally, PPPs, being a fairly new model, require changes in mindsets. For example, officials at the ministries most relevant to the corridor system – agriculture, transport, energy, finance – are unlikely ever to have dealt with a mechanism as complex as these partnerships. To respond, they will need new skills and a more business-like approach.
Governance issues. Concerns of a social nature such as land tenure issues, exclusion of economic actors and lack of equity or fairness, and an environmental nature – land degradation, inadequate management of water resources and agro-industrial waste – may emerge during the implementation of the corridor programme. Accordingly, governance issues pertaining to inclusiveness, fairness and environmental concerns stemming from agricultural corridor interventions need to be assessed.
The potential environmental problems derived from both infrastructure and agro-industrial developments undertaken in economic corridors first need to be established. Infrastructure projects of the magnitude and scope implemented in the corridors, and the resulting increased mobility of people and goods, may trig-ger faster exploitation of natural resources (land, water and soils). For example, in the GMS corridors road upgrading and expansion led to deforestation and biodiversity loss in some areas, because of the involuntary facilitation of logging and transporting of timber. Similarly, augmented agro-industrial activity along the economic corridors could lead to pollution and waste disposal issues. Land clearing for agro-industrial and commercial purposes could also result in deforestation and biodiversity loss (ADB, 2008a; ADB, 2011b). Intensifying agricultural production for markets because of amplified demand and economic opportunities along the corridors, may lead to undesirable environmental consequences if the required increase in chemical and water use is poorly managed (Pingali, 2001).
Ensuring the social sustainability of corridors is equally vital. However, eco-nomic corridor programmes can trigger up to four types of negative social impacts on communities and vulnerable groups. These are: displacement of local communi-ties and ethnic minorities, and poorly managed resettlement schemes; emergence of vulnerabilities in the labour market of corridors; land grabbing; and exclusion from value chains, and agriculture in general, of small-scale actors, such as farmers and agribusiness SMEs.
For example, some GMS infrastructure projects have required the relocation and resettlement of local inhabitants, causing changes in their socio-economic environ-ment. The impact of this displacement can be particularly severe for marginalized groups, such as small, remote rural communities and ethnic minorities. While resettlement and compensation schemes usually complement major infrastructure projects, they need to be better planned and implemented (ADB, 2010b). Further-more, land prices around road construction sites tend to rise because of speculation and expected increase in demand. This may cause small landowners to sell their properties prematurely or they may be dispossessed of them, particularly in areas where land rights are not properly defined or enforced (ibid.).
The dynamism of economic corridors can cause problems in the labour market. For instance, the rapid growth experienced in the Mekong countries, partially driven by the GMS corridor programme, has spawned vulnerabilities in the local

Making economic corridors work for the agricultural sector158
labour market (Shrestha and Chongvilaivan, 2013). Vulnerable employment con-stitutes the major part of total employment in the subregion: 90 percent in the Lao People’s Democratic Republic, 85 percent in Cambodia, 80 percent in Viet Nam and 55 percent in Thailand (ibid.). Safeguard measures should be put in place to prevent and resolve such imbalances.
Host governments generally welcome FDI in agriculture in low- and middle-income countries. Nevertheless, these investments are too often associated with land grabs129 and their expected benefits to local development, poverty reduction and food security fail to materialize (APRODEV, 2013). An increasing number of land-grabbing episodes have been reported in the aftermath of the food and financial crises of 2007 and 2008. These crises triggered a massive wave of large-scale land investments in developing countries, fuelled not only by agribusiness companies, but also by equity investors and pension funds seeking new asset classes for investment. The race for acquiring land in developing countries has witnessed several episodes where land investors were not fully respectful of local communi-ties and of the land tenure regime of the host country. This sheds a suspicious light over all such investments taking place in the developing world, including those in agrocorridors. For instance, in several corridors studied, especially in Mozambique and the United Republic of Tanzania, farmer organizations and civil society are voicing their concerns over alleged land grabs by multinational companies from the EU and the United States of America. Not only foreign investors are under the spotlight. Land conflicts between large domestic investors and local communities, in particular in horticulture, are common, and former political leaders have been accused of grabbing large tracts of land. In response, corridor managers have taken action to prevent land grabbing. First, local land banks130 have been established to allocate land to investors following a consultation process with local governments and communities. Second, corridor partners have agreed to follow worldwide-recognized good investment principles, such as the Voluntary Guidelines on the Responsible Governance of Tenure of Land. These are global land tenure agreements with the potential to protect community rights in the face of possible land grabs (FAO, 2012c).
Finally, the process of agro-industrial concentration fostered by the corridor programme may lead to exclusionary practices that crowd out undercapitalized domestic firms and farmers, enrichment of local urban elites at the expense of the rural poor, and depletion or degradation of natural resources (Reardon and Barrett, 2000). There are important social considerations related to the scale of bioenergy-related investments in corridors, where the risk of smallholder exclusion is consider-able. This is particular crucial for ethanol production, which requires a large-scale processing plant and production scheme, as opposed to biodiesel processing that can be supplied from smallholder-based developments. Overall, there are several suc-cessful examples from within the GMS of sustainable biofuel expansion involving smallholder-based production of non-food crops and second-generation biofuels on
129 See Glossary.130 See Glossary.

Chapter 8 – Gains and pitfalls of agrocorridor initiatives 159
surplus land, which could be upscaled across the GMS corridors. However, experi-ence from the region and elsewhere has shown that, if deployed unsustainably, biofuel developments can be associated with numerous risks, particularly in terms of food security, impacts on soil, water quality and availability, and biodiversity (USAID, 2009).
The current investment pattern in the GMS corridors appears to favour large plantations, which may lead to smallholder exclusion (ADB, 2007a). For example, farmers engaged in small-scale jatropha developments in Yunnan, and corridor areas in Myanmar and Viet Nam, are vulnerable to uncertainties and high-transaction costs in processing and marketing (ADB, 2007a; Shepley et al., 2009). Similarly, the predominant model in Cambodia and the Lao People’s Democratic Republic is a concession that utilizes farmers only as daily wage labour and therefore may limit inclusive growth in the long term (Malik et al., 2009).

161
Chapter 9
Guidance for making economic corridors work for the agricultural sector
Acknowledging the complexity of the corridor approach, this chapter presents a series of best practices and a checklist to guide policy-makers through the design and implementation of agrocorridor programmes. These two elements are based on evidence gathered through the analysis of the corridor cases, reinforced by a review of relevant literature.
The section on best practices underscores important elements that could be emulated and adapted in other corridor programmes elsewhere. The checklist offers more systematic, step-by-step guidance on how to design and implement these pro-grammes. The checklist does not detail items in the same way as the best practices section. The high complementarity between the two sections is evident and calls for a combined, integrated implementation approach.
9.1 BEST PRACTICES IN ECONOMIC CORRIDOR DESIGN AND IMPLEMENTATION
The following paragraphs underline elements of best practice that may contribute to successful corridor interventions. The list is not comprehensive since its goal is rather to offer good examples and food for thought for policy-makers interested in corridor initiatives. It also reinforces the findings and general messages expressed throughout this study.
The main best practices identified are the following:1. Find the optimal mix of hard-soft elements that optimizes corridor com-
petitiveness, particularly in the agribusiness sector. As tirelessly repeated in the study, hard (infrastructure-related) investments on their own have the potential to improve corridor performance only to a certain degree – it is only when combined with soft elements that they can take a corridor to the next level. More concretely, corridor interventions targeting the agricultural sector should combine improvements to physical infrastructure (farm-to-market roads, irrigation systems, collection points, market centres, agro-industrial plants and warehouses); policy and regulations; human and institutional capac-ity; and strategic agribusiness elements (e.g. farmer aggregation, farmer-market linkages and access to finance) as essential enablers for inclusive transforma-tional growth.
In the quest for an effective hard-soft continuum, corridor developers should take into consideration all the key economic actors in the corridor:

Making economic corridors work for the agricultural sector162
inter alia, farmer organizations, logistics firms, multinational and large domestic companies, and small-scale agribusinesses. Since the latter are often overlooked in corridor planning, an example of corridor actions to support agribusiness SMEs is offered specifically. Hard investments related to the development of a SEZ that targets agribusiness SMEs should be accompanied, for instance, by well-designed matching grants and training programmes, with components on business planning, supplier networks, market informa-tion, and product and process innovations. The combination of hard and soft actions multiplies the chances to invigorate small agribusiness companies in the corridor, and help them serve larger investments, expand their markets and upgrade their capacity.
2. Mainstream the adoption of inclusive business models that empower small-holder producers and SMEs into corridor tools. Corridor programmes can deploy innovative business models to ensure that small-scale farmers and agribusiness SMEs benefit and are empowered by corridor activity. This inclusiveness approach may extend to women, youth and other vulnerable population groups. Corridor developers can examine each corridor invest-ment and intervention through an “engagement model” lens, i.e. how small-holder farmers and SMEs are being linked to a particular corridor activity. For example, smallholders can be directly employed, act only as land lessors or take part in contract farming and outgrower schemes. The latter often include arrangements that improve farmers’ access to financial services, seeds, agro-chemicals and farming and post-harvest technologies. Such engagements are at the core of the BAGCI, SAGCOT and PRA corridor initiatives. For these programmes, the adoption of an inclusive business model is a sine qua non condition for accessing corridor funds (e.g. catalytic financing in BAGCI and SAGCOT) or services (PRA Project).
The corridor strategy can also promote the inclusion of support arrange-ments for local agribusiness SMEs in business-to-business engagements with multinational corporations. Through such arrangements, support can be chan-nelled to agribusiness SMEs to enable their upgrading and modernization.
Since each investment is different, a one-size-fits-all approach to engage-ment models is not justified. In given circumstances, some models will make sense while others will not (WEF, 2013).
Ideally, the corridor governing body should make sure that the “right” inclusive business models are identified and employed. Corridor centres may play a key role in the facilitation and monitoring of the preferred models for inclusive engagement. They could also reinforce them by providing essential BDS as appropriate. Consultation with smallholders and SMEs will ensure that they are informed about the proposed models, opportunities and potential impacts, and have a voice and role in corridor investments. Any inclusive cor-ridor must also ensure that women and youth are actively involved in decision-making to shape projects and business models. The outcomes of these discus-sions can be monitored, tracked and regularly reviewed to ensure that the shared goals of small-scale farmers and firms, and large investors are achieved, and that the overarching goal of inclusive sustainable growth is being met.

Chapter 9 – Guidance for making economic corridors work for the agricultural sector 163
3. Design for scale and mobilize the right “change agent”. Corridors are good vehicles for piloting and testing new business and governance approaches but, beyond that, they should be designed for scaling up to a transformative level. Only interventions that incorporate a smart mix of strategic elements (pro-ducer aggregation, market linkages and finance) and have clearly identified a change agent (i.e. the entity that can act as a key driver in scaling the initiative and establishing links to smallholders) are really upscalable (WEF, 2013).
Successfully designing for scale often involves identifying critical barriers in the value chain, and discovering the change agent that is best placed to over-come them. Based on this diagnosis, the corridor strategy will focus support on these change agents.
Change agents can be found in different parts of the value chain. They could be government extension agents or farmer groups. Nonetheless, in most cases, they are what the PRA Project refers to as “star connecting firms”. They can be, for example, large investors that have set up nucleus farms and receive some corridor support in return for aggregating the produce of smallholder farmers in their area/cluster and providing them with extension services and inputs, as seen in SAGCOT. Change agents can also be seen on the off-take and processing side of the agrifood chain, where agroprocessors, traders, supermarkets and other entrepreneurs with networks of small-scale suppliers manage to aggregate production and add value.
Scaling up can be undertaken in phases by, for example, leveraging exten-sion workers in one agrobased cluster or agrifood chain at a time or on one particular practice or issue. Another possibility is to launch a multiphase plan that prioritizes support to different agrifood chains in consecutive waves, as SAGCOT is set to do.
4. Ensure the availability of sustainable financing models and risk reduction mechanisms able to attract more investment to the corridors. Innovative ancil-lary financing tools and risk management instruments are critical ingredients for corridor success. Corridor promoters can perform a diagnostic analysis of the national financial system to identify existing gaps for agriculture-related financing. They can also examine the particular agrifood chains and clusters they plan to support to identify specific financing needs and how that financ-ing can be best employed along the corridors. Once diagnosed, corridors can incorporate in their programme financial tools that are tailor made to fit the needs of smallholders and other intended beneficiaries. These tools can be low-interest microloans; matching grants and weather and crop insurance products at different points in the agrifood chain; financial products that deal with crop seasonality; innovative payment platforms in rural areas; and patient capital approaches, as required by the long-term horizon of agriculture development. Upon the completion of this exercise, corridors can identify and engage with the right organizations to define and deliver the exact types of financial and insur-ance services required. This implies a search for the optimal financing mix from financial institutions and donors that originally convene the corridor, or from new private sources (such as banks and insurance companies) or other donors (bilateral agencies, multilateral development banks and large foundations) called

Making economic corridors work for the agricultural sector164
to join in. Financial institutions should preferably be involved at an earlier stage of a corridor’s strategy development and in the design phase of specific projects.
The corridor programme can either participate in, or lead, the provision of the above instruments, or it can just facilitate access to them. For instance, the BAGCI and SAGCOT Catalytic Funds are directly operated by the programme, whereas the PRA Project acts as a facilitator that interacts with financial institutions in the corridor (or attracts new ones to that area) to bring them on board to offer improved services. Corridor authorities can, for exam-ple, influence the supply-side of the financial market by making the business case for banks to open new branches in the corridor (e.g. to serve agrobased clusters). They can contribute to the financial engineering required to fit the specific needs of selected agrifood chains (e.g. by preparing value-chain finan-cial and insurance products). They can also improve the demand-side by dis-seminating information about available products and conditions, by helping farmers and SMEs to present bankable projects (e.g. prepare business plans) and by granting guarantees.
5. Identify the most appropriate model for corridor governance and delivery mechanism(s) to manage and implement the corridor programme and offer the planned corridor services. Again, the aptness or otherwise of a given corridor institutional model is very context specific: in some cases the establishment of corridor centres presents itself as the optimal solution, while in others it is more suitable to build upon existing structures and complement them with coordinating mechanisms such as liaison officers, focal points or high-level ministerial committees, depending on the circumstances. The model for cor-ridor authority can be selected from various options. For example, the govern-ance of the GMS corridor relies on a system formed by summits, conferences and technical meetings, combined with a centralized corridor secretariat and national focal points. In the PRA Project, the corridor authority is held by a central manager, an outsourced private firm, which coordinates the various corridor centres, whose management is equally outsourced to private firms, NGOs and consortia. In addition, there could be several delivery mechanisms operating concomitantly, each with a different function. For example, there could be an overall corridor authority responsible for providing strategic guidance and monitoring the delivery of the programme; Corridor Centres in charge of delivering corridor services, as in the corridors of the United Republic of Tanzania, Mozambique and Peru; Corridor Funds, either managed internally or by an external entity, which provide financing and guarantees to corridor beneficiaries (SAGCOT and BAGCI funds); and finally, Cor-ridor Institutes and Observatories responsible for developing and dissemi-nating information and studies on key corridor topics, such as the CAREC Institute,131 the GMS Environment Operations Center132 or transport and
131 http://www.carecprogram.org/index.php?page=carec-institute [last accessed September 2013].132 www.gms-eoc.org [last accessed September 2013].
Chapter 9 – Guidance for making economic corridors work for the agricultural sector 165
trade observatories to monitor progress against trade and logistics targets and perform the corresponding studies and surveys.
6. Promote multistakeholder governance mechanisms. Corridors offer advan-tages for multiple stakeholders. Local companies can engage in corridors to increase access to capital and non-financial business services, and to enlarge their supply base, largely made up of smallholder producers. Global firms can ensure alignment of their business and corporate social responsibility goals, and open up new markets and supply sources. Farmers are the core target of agrocorridor support, in terms of financial and business development assis-tance. Public sector stakeholders can capture capital from private sources and the international community – which is crucial in this era of limited public funding for infrastructure and agribusiness development – to implement cor-ridor initiatives to realize economic targets (increased investments, exports, fiscal revenues, etc.) and social goals (e.g. employment generation, fair income distribution and community strengthening) in a cost-effective manner. The large number of corridor stakeholders, each with its own agenda and capaci-ties, calls for advanced governance mechanisms to harness public, private, and collective perspectives and interests in the corridor.
It is critical that such governance mechanism be propped up by high politi-cal support (Harrison and Rodríguez-Clare, 2009), which will send investors a clear signal about the government’s commitment to enforcing property rights, ensuring the inclusion of the different stakeholders and enhancing the business climate. This mechanism will be most effective if the nascent local civil society and NGO community are involved in corridor operations and policy dialogue to keep both the local government and agribusiness firms on the right track. But more than anything it is essential to activate the engagement of private actors in the corridor governance mechanism. This engagement can be in terms of core partners as in the case of the PRA corridors and the partnership cor-ridors in Mozambique and the United Republic of Tanzania. It can also adopt the form of participation in corridor fora to encourage public-private policy dialogue. Receiving feedback from the private sector is essential for improving the operational environment for agribusinesses in the corridor.
7. Establish a strong mandate for intersectoral, multilevel and multistakeholder coordination. Corridor planners should consider plans and priorities from other sectors, through a well-designed process of information sharing and coordination. For instance, if spatial priorities for irrigation development, agro-industrial initiatives, wildlife habitat and hydropower generation in rural areas are considered together, the corresponding water-related investment projects could be better aligned and win-win solutions encouraged. To the extent that such coordination requires modifying the modus operandi of the ministries, high-level commitment to do so is crucial (Milder et al., 2012).
Corridor coordination goes beyond intersectoral action: multilevel pro-cesses are in widespread use, for they respond to the complex web of relation-ships among corridor stakeholders. The depth of this coordination structure is proportional to the layers of administrative units involved. For example,

Making economic corridors work for the agricultural sector166
regional corridors require the establishment of a coordination framework comprising not only national governments, but also regional integration stake-holders (e.g. regional economic communities, regional industry organizations and corridor authorities) and the development partners supporting regional integration. Corridors taking place in an area within a single country stand in need of coordination among central, regional, provincial and district govern-ment agencies.
Also critical, however, is the need to include other stakeholders in the cor-ridor dialogue, representing the private sector and civil society, at all those lev-els. Multistakeholder partnerships such as the ones established in the African corridors are an option to formalize coordination arrangements.
8. Ensure the provision of an adequate agribusiness environment. Stable macro-economic environments and competitive farmer associations acting as input suppliers for processors and traders are vital preconditions that need to be in place for corridor initiatives to work.
Moreover, corridor programmes cannot function properly without the right kind of legislation to govern and regulate efficiently enterprises and other business concessions, and grant the rights to use and develop assets, property and natural resources in an inclusive, sustainable manner. The scope of actions to improve the business environment in the corridor must be tai-lored so as to focus on relevant legal frameworks that govern infrastructure PPPs and small-scale, often informal, agribusiness PPPs; contract farming and outgrower arrangements; agrifood standards; land regulation; and other ele-ments that contribute to lessening the cost of doing business in the corridor. Regarding the latter, corridors can perform a business survey, along the lines of the World Bank’s Investment Climate Assessment,133 to identify business barriers in the corridor. A good way to address the business barriers identified is to set up one-stop shops or provide assistance to increase the performance of those already existing.
9. Take measures to avoid land grabbing and other land tenure problems. Cor-ridor authorities are often in a position to influence and provide high-quality, practical inputs to national land reform processes. However, more corridor-specific actions to encourage ethical behaviour in (trans)national land deals are often required. These include the adoption of responsible investment guidelines and the establishment of land banks. SAGCOT has pushed for this twin-track approach. The SAGCOT partners and G8 members involved in the New Alliance for Food Security and Nutrition have confirmed their intention to take account of the Voluntary Guidelines on the Responsible Governance of Tenure of Land [...] adopted by the Committee on World Food Security (FAO, 2012c), as well as the Principles for Responsible Agricultural Invest-ment (PRAI) produced by FAO, IFAD, UNCTAD and the World Bank
133 www.wbginvestmentclimate.org [last accessed September 2013].
Chapter 9 – Guidance for making economic corridors work for the agricultural sector 167
(FAO et al., 2010). In addition, they intend to develop joint pilot implementa-tion programmes for the Voluntary Guidelines and the PRAI in the United Republic of Tanzania (G8, 2012).
As seen previously, a land bank might be established to link investors to suitable sites in the corridor in an efficient, transparent and equitable manner. Land banks seem to operate best when professionally maintained. This way, investors do not need to search for land as part of the business development process, thus reducing their financial risk and costs. Situations in which plan-ners face conflicts of interest and communities in planning and negotiation pro-cesses – some of which are coercive – can also be averted (Milder et al., 2012).
10. Devise green growth or environmental strategies for the corridor. Corridor plans are increasingly based on the belief that environmental sustainability and economic growth are not only compatible, but should be integrated. The Southern Corridor of Tanzania has made an explicit commitment to advance the practice of green growth; the GMS corridors are also progressively embracing this model.
The first step towards green growth is to conduct an environmental assessment in order to identify effective approaches to maintain the quality of ecosystems, mitigate climate change and ensure access to clean energy and water in the cor-ridors, among other issues. One essential element in the pursuit of green growth corridors is the inclusion in the masterplan of measures to ensure that major investments in transport and agriculture are realized sustainably (Ramachandran and Linde, 2011). Accordingly, the corridor investment programme should incorporate agriculture green growth practices to position the corridor as a place that attracts “best in class” investors and innovators willing to integrate environ-mental sustainability into their business plans (Milder et al., 2012).
Agrocorridors can use a variety of approaches to measure and track pro-gress on green growth. One option is to embed in the masterplan explicit guidelines and smart targets for environmental sustainability in activities and investments, and scrupulously adhere to them. This can be done for the corri-dor programme as a whole, and for each individual agrifood chain, cluster/SEZ and investment project. The corridor plan can develop its own framework or make use of well-tested, groundbreaking initiatives such as the Field to Market or the Sustainable Agriculture Initiative Platform.134
9.2 CHECKLIST TO GUIDE THE DESIGN AND IMPLEMENTATION OF AN (AGRO-)ECONOMIC CORRIDOR
The checklist that follows has been structured according to the framework for economic corridors proposed in section 3.6. It considers the life cycle of the cor-ridor, so that it covers the planning process that confers an effective direction to the corridor, and the implementation process that emphasizes the delivery at scale and tracks performance to introduce adjustments in the corridor strategy as appropriate.
134 www.fieldtomarket.org; www.saiplatform.org [last accessed September 2013].

Making economic corridors work for the agricultural sector168
1. Defining the corridor strategy and roadmap � Conduct preparatory work. Examples include the following.
- Identify potential change agents. - Perform value-chain and feasibility analyses for selected agricultural chains. - Analyse the competitiveness of existing agrobased clusters – by applying,
for instance, the “competitive diamond model” (see Porter’s work [1998]) – to benchmark their performance and growth potential.
- Identify key transport and trade bottlenecks and conduct feasibility and environmental impact studies for the related infrastructure investments.
- Prepare detailed analyses of the types of hydrologic and watershed management that can ensure adequate water availability for wildlife habitat, tourism and domestic uses, as well as sustain water flows for irrigation (Milder et al., 2012).
- Run a survey on business climate in the corridor. - Execute a stakeholder and institutional mapping for the corridor. - Prepare a diagram of existing policies (cross-referencing to relevant poli-
cies) and identify bottlenecks. - Assess the country legislation to see whether there is already in place
a legal framework and enforcement system regarding PPPs, contract farming, agrifood standards, an overview of megaprojects/corridors and other issues that influence the business climate (World Bank, 2010). This exercise comprises not only outlining the relevant legal framework – and ensuring commitment to it – but also reflecting upon whether the cor-ridor intends to go further than the law in developing good practice, e.g. by adopting voluntary standards, guidelines and codes of practice.
� Prepare a corridor masterplan or blueprint. - Define the corridor vision. - Ensure that this vision relates to the outcomes of the corridor programme. - Agree on the corridor strategy: star connecting firm versus targeting of
(sub)sectors/value chains/clusters. - Select the governance model that better suits the specific context and
circumstances of the corridor. - Document the vision, approach, development strategy, and workplan and
governance model for the corridor programme. - Launch a roadmap for stakeholders.
� Ensure the presence of strategic elements of agricultural initiatives (associativity, market linkages and access to finance and appropriate technologies) during the design phase of the corridor programmes and in each of their individual investments and activities.
� Make sure that the corridor plan strikes a balance between the different goals being served (e.g. competitiveness of the agricultural sector, food safety, food security and the adoption of climate-friendly practices). Ensure that the interaction between agriculture and other sectors, such as renewable energy, tourism or mining, is also factored into the plan.
� Plan the corridor programme in a way that it is ready for scalability from the start. Identifying and activating change agents, sequencing plans and leveraging stakeholder capacities in new ways are essential actions to accomplish this.

Chapter 9 – Guidance for making economic corridors work for the agricultural sector 169
� Ensure that corridor initiatives have top political support, and are monitored directly from the office of the president, highly influential ministers or high-level coordinating committees.
� Verify that the design of the corridor programme guards against “ownership gaps” at either the local, national or regional levels.
� Incorporate good practices such as inclusive business models that empower smallholder farmers, good investment and land tenure principles, innovative financing and green growth practices.
� Adopt an explicit focus on engaging and working closely with small-scale farmers and firms, women and youth, and ensure that they are actively involved in decision-making to shape projects and new business models. - Consider offering definitions of each vulnerable group identified in the
inclusion policy. - Make sure that corridor resources are deployed to maximize inclusion
outcomes. - Foster a community-driven, decision-making process involving all stake-
holders to ensure that the rights of these vulnerable groups are protected. � Make sure that the corridor masterplan reflects the policy framework
within the corridor and identify key issues for policy dialogue and action.
2. Engaging and activating key stakeholders � Align stakeholders around a shared vision.
- Communicate the vision, scope, objectives, benefits and impacts of the corridor programme to all stakeholders involved and/or impacted.
- Consult the stakeholders concerned to make sure that the content of the vision and strategy is acceptable to them.
- Jointly define stakeholders’ accountabilities and responsibilities. � Prepare a (formal) stakeholder agreement delineating what each stakeholder
has agreed to do. � Value the role of partnerships to break new ground in engaging and
aligning stakeholders around shared priorities to mobilize investment and collaboration in corridors and key agricultural chains.
� Send a call to action to other potential national stakeholders and the global community to participate in the corridor initiative.
� [For corridors led by the private sector and/or the international community.] Foster the engagement of governments to strengthen national plans, enhance policies to improve the enabling environment for domestic and international agriculture-related investment, increase investment in agriculture-related infrastructure and programmes in the corridor, and incentivize environmental sustainability and inclusive development.
� [For corridors led by the public sector and/or the international community.] Mobilize the private sector to increase agriculture sector-related investment with an emphasis on developing sustainable, innovative and smallholder-inclusive business models.
� Activate farmers to organize cooperatively to improve access to market oppor-tunities, financing and training programmes, and actively engage in corridor programmes and advocacy to influence the direction and impact of the corridor.
Making economic corridors work for the agricultural sector170
� Expand the participation of civil society to implement community-level capacity-building programmes, monitor programmes to ensure alignment with public-interest goals and proven practices, and engage key stakeholder groups and the public.
� Mobilize donor agencies and international organizations to support the strengthening of governmental delivery capacity, leverage catalytic and innovative forms of financing, and facilitate measurement, evaluation and knowledge exchange.
3. Programme targeting: area, sector, value chain, product and firm � Identify the key objective(s) that will guide the targeting, e.g. increase the
competitiveness of the agricultural sector and enhance food security. � Apply additional criteria, supplementing those highlighted above with
cross-cutting themes such as poverty reduction, women’s empowerment, environmental management and employment creation.
� Select geographic areas with the reduction of transaction costs for the acquisition of inputs and services specific to the agribusiness activities to be promoted, such as agrochemicals, machinery or logistics-related services as their main criterion. This usually implies clustering around growth areas with functional electricity, transportation and communication infrastructure that effectively links agribusinesses to key suppliers, such as producer associations. The reduction of transaction costs achieved in these areas can be more influential on investor decisions than fiscal incentives, such as tax holidays (FAO, 2013).
� [For corridors following a strategy based on targeting core sectors, etc.] Give priority to high economic impact sectors. Look for subsectors and value chains with perceived competitive advantage, perceptions of high impact on rural incomes and employment, and export market potential or import substitution. - Check that these subsectors or value chains have private sector appeal, i.e.
that they are already a focus of the private sector, or that they have a high likelihood of attracting FDI and private domestic investment.
- Take into account in the programme design the complexity of agri-culture value chains, which comprise many stakeholders with highly diverse interests.
- Base the selection on the value-chain/cluster analysis and feasibility studies performed to verify soundness and identify business/invest-ment opportunities.
� [For corridors following a “star firm” strategy.] Prepare a set of criteria for selecting “star firms” that will receive support, as part of the “change agent” strategy of the corridor.
� Develop detailed analytical methods for spatially targeting sustainable investments where they are most needed and stand to deliver the greatest socio-economic and ecological benefits (Milder et al., 2012).
Chapter 9 – Guidance for making economic corridors work for the agricultural sector 171
4. Preparing a corridor development matrix � Establish a core set of priority projects in the corridor areas where there is
demonstrated private and local public sector commitment and ownership (World Bank, 2010).
� Gather input for and prepare a sustainable finance pipeline with emphasis on the investment portfolio (Milder et al., 2012). The portfolio will be constituted by bankable infrastructure and agribusiness projects, to be financed through unilateral and multilateral initiatives. The preparation of the portfolio requires the identification of opportunities across the agrifood chains/clusters and engagement of the right groups and organizations to participate in these opportunities, with incentives to motivate them. It also entails carrying out a thorough assessment of the growth potential of the corridor. This can include the following: - A framework for the selection of priority areas and projects. - A results framework for evaluating outcomes and assessing the benefits
and costs of implementing a corridor strategy. Long-term targets can be determined for corridor countries, for instance, for sustainable agricul-tural yield improvements, adoption of improved production technologies (e.g. improved seed varieties and post-harvest management practices), and measures to ensure social inclusion and ecological sustainability and safeguard agrobiodiversity.
- A timeline for the proposed interventions, and estimation of available public, donor and private sector financing.
� Review the portfolio of initiatives to ensure that the necessary strategic elements mentioned earlier (associativity, market linkages and access to finance and appropriate technologies) are integrated into the overall programme and specific activities.
� Define effectiveness measures to decide which firms to support and which projects to implement.
� Undertake, as part of the corridor’s portfolio or investment generation programme, an identification and screening process to select candidate companies and proactively approach them to explore investment opportunities in the corridors. A starting-point would be to approach major international commodity round tables (for sugar, soybeans, beef and biomaterials) to identify industry leaders on sustainable production135 (Milder et al., 2012).
5. Financial and risk management � Devise tailor-made innovative financing mechanisms that fill the gaps
identified in the corridor.
135 These round tables include the Better Sugar Cane Initiative (Bonsucro – www.bettersugar.org); the Round Table on Responsible Soy (www.responsiblesoy.org); the Global Roundtable for Sustainable Beef (www.sustainablelivestock.org); and the Roundtable on Sustainable Biomaterials (http://rsb.epfl.ch) [last accessed May 2013].

Making economic corridors work for the agricultural sector172
� Identify and engage the right organizations to deliver the above financial products. If the path chosen is to set up a corridor body responsible for this delivery, choose the most appropriate model and initiate its establishment.
� Establish investment guidelines to help steer investors towards socially responsible and agriculture green growth practices with broad social and environmental benefits. These investment guidelines would enhance, but not duplicate, environmental and social safeguards put in place through other mechanisms (e.g. SAGCOT).
� Accelerate the availability and adoption of agricultural index insurance in the corridor, in order to mitigate risks to farmers, especially smallholders and women farmers, and increase income and nutritional security.
� Complete corridor agricultural risk assessment strategies, with the mandate of identifying key risks to food and nutrition security and agribusiness development and recommending options for managing these risks.
� Ensure that there is adequate fiscal margin for the public investments required and place emphasis on the due diligence work of the Central Bank.
� Minimize the risk of major infrastructure projects by selecting partners for joint ventures with proven expertise and a solid financial background.
� Strengthen social and environmental safeguards management, including bolstering the capacity of the staff of the corridor authority and corridor partners (particularly the public sector) to conduct better environmental impact assessments.
� Implement a single coherent process for identifying lands suitable for agriculture or forestry investment, for example, by establishing land banks and voluntary guidelines.
� Devise strategies to minimize risks involved in the concentration of resources in the corridor (as a typical megaproject). For example, it is important to monitor and enhance the health of the adjacent landscape, upon which the long-term value of corridors depends.
6. Soft interventions in agriculture and related sectors � Use a structured approach to break the strategy into manageable soft
components. � Encourage contract farming/outgrower schemes with new investors through
corridor centres that could train and support smallholder farmers to connect to large-scale investments and facilitate investment in agribusiness facilities and technologies (irrigation, post-harvest, agroprocessing, etc.), among others.
� Carry out investment promotion activities within the corridor by undertaking the following: - Making information on the investment portfolio available to potential
investors using the designated channels: a dedicated Corridor Investment Promotion Centre, IPAs, the Agribusiness Unit of the Ministry of Agri-culture, the Ministry of Commerce, etc.
- Designing and putting in place a communications strategy for showcasing the specific investment opportunities identified in the investment genera-tion portfolio/programme to potential business and financial investors.

Chapter 9 – Guidance for making economic corridors work for the agricultural sector 173
- Programming fora and roadshows for corridor-based business leaders and public sector representatives to meet investors for sustainable invest-ment funds, and international agricultural and forestry companies previ-ously identified as socially and environmentally responsible investors.
- Convening events on financing sustainable investments for country- and region-based banks, donors, investment groups and international com-modity round tables to showcase opportunities to scale up successful businesses in the agrocorridor.
- Developing a pipeline of investable smallholder-based projects in col-laboration with private investors, coupled with actions to strengthen the managerial and technical capacities of individual farmers and their organizations to help them be “investment ready” (Milder et al., 2012).
� Implement interventions planned to support value-chain, cluster and SEZ development, paying particular attention to those in border areas when the main objective of the corridor is regional integration.
� Design and implement a programme to ease the burden on businesses, focusing on issues identified by a survey.
� Provide support to SME development in agribusiness and ancillary industries, as well as the development of small manufacturers and medium-size exporters within a corridor.
� Scale up differentiated agricultural markets for the corridor under profitable sustainable production through certified or differentiated value chains (Milder et al., 2012).
� Implement the activities envisaged in the masterplan vis-à-vis human resource development. Support the establishment or strengthening of strategic agricultural and food technical schools, universities, R&D centres and other providers of relevant training.
� Assess the need for strengthening/reforming customs and transport authorities (World Bank, 2010) and for harmonizing customs procedures.
� Align corridor, urban, national and regional policies to avoid major development imbalances across regions.
� Harmonize trade and transport regulations and standards that are relevant for corridors that have a binational or multinational scope.
� Set up a corridor data and analysis facility for supporting the integrated development process, by maintaining and using information on agriculture, environment and economic development. - Ensure that the facility includes a component of spatial data, with techni-
cal expertise to run geographic information systems (GIS). - Hire a cadre of professional planning facilitators to run planning and
monitoring processes at village, district, provincial and corridor levels. - Provide additional training and backstopping as needed. - Put in place mechanisms for ensuring that relevant data do not remain
siloed in different institutions and sectors. � Develop and advance “business as unusual” solutions that contribute to achieve
environmental sustainability/green growth. Explore, for example, the potential demand and development options for ecofriendly and climate-friendly prod-uct labelling for corridor producers and businesses (Milder et al., 2012).

Making economic corridors work for the agricultural sector174
� Develop revenue management strategies to prepare for the increase in revenues from corridor industries.
7. Hard-side interventions � Execute planned infrastructure investments along the corridor using the
preferred governance models (e.g. direct implementation and infrastructure PPPs), and applying international best practices for developing and managing transport and trade corridors. See, for example, Arnold, Olivier and Arvis (2005) and Arnold (2006).
� Ensure that the development of the corridor transport axis is complemented with adequate rural infrastructure development to support access to markets and corridor widening.
� Enhance the environmental and social regulatory framework applicable to connective, energy and last-mile infrastructure and strengthen the national/corridor capacity to enforce compliance and apply sanctions for non-compliance.
� Implement logistics programmes, with active industry participation through platforms and fora.
� Strengthen existing mechanisms for modelling road toll and port revenues based on applicable fiscal provisions; for the collection and auditing of such revenues; and for interagency coordination.
� Implement mechanisms for information sharing, transparency and accountability, including eventual publication of revenues and possibly infrastructure PPP/concession contracts.
8. Institutional arrangements and delivery mechanisms � Set up a corridor governing body, development authority or task force
responsible for the planning, coordination, promotion and facilitation of corridor interventions and investment projects. - Study whether this authority or task force could be embedded within an
existing agency or with enhanced collaboration between existing agen-cies, rather than establishing yet another public institution.
- Analyse whether the governing body is representative of the local com-munity.
- Study the convenience of bringing various public agencies that support rural and commercial agriculture together under one roof or establishing coordinating committees.
- Establish a land bank and/or a local task force that monitor the reset-tlement of local communities and liaise with social programmes linked to such resettlement.
� Consider establishing an advisory board of independent agribusiness development professionals and institutions.
� Take a proactive approach to cooperate with and support local authorities in the implementation of the corridor roadmap.
� Find a balance between the authority’s executive powers and broad support from the various stakeholders.

Chapter 9 – Guidance for making economic corridors work for the agricultural sector 175
� Build sufficient coordination capacity as corridor initiatives develop, as a key to aligning stakeholder involvement, providing a responsive process for partners and investors and ensuring delivery on the corridor programme goals. - Establish a strong mandate for intersectoral coordination, as well as coor-
dination between central and decentralized public bodies. - Set up procedures to manage interdependencies effectively with other
programmes and systems. - Put in place adequate procedures for corridor coordination and status
reporting. � Consider the scope for and sustainability of the following:
- Vocational training institutes tailored to produce skilled labour for the new investors and suppliers.
- Specialized centres to provide BDS in the corridor (if different from the corridor authority).
- Corridor institute or organization to disseminate information, exchange good practices and lessons learned.
- Corridor observatories to monitor various topics such as transport and trade performance or green growth targets.
- Consider the convenience of using PPP models in the establishment of these institutions.
� Set up effective corridor institutional structures to liaise with private stakeholders such as business fora, corridor-based logistics associations or linkages via Chambers of Commerce.
� Set up effective corridor institutional structures to liaise with relevant regional integration schemes.
9. Strengthening implementation capacity � Provide appropriate training and support for corridor stakeholders to
implement the corridor roadmap. - Provide adequate time for orientation and training of local and central
government staff participating in the corridor programme. - Identify the focal points for each critical area with the necessary skills and
competence and reach agreement for their participation in the programme. - Make certain that more attention is paid to building the capacities of the
weakest links in the corridors, which are likely to be producer organiza-tions and SMEs.
� Identify culture and change management requirements to implement the corridor roadmap and act on them.
10. Monitoring progress and refining corridor strategies � Develop an M&E system to supervise and track progress against the
corridor targets over time, and correct as needed. - Develop an evaluation framework and methodology for the investment
strategy and implementation plan that can be used to sustain multi-stakeholder engagement in the corridor and individual clusters (Milder et al., 2012).

Making economic corridors work for the agricultural sector176
- Set up milestone deliverables and their respective target dates. - Verify that the M&E system is able to track change in the corridor across
multiple landscape dimensions, such as sustainable productivity, employ-ment, ecological integrity, livelihoods, food security and institutional capacity (Milder et al., 2012).
- Make sure that the corridor programme uses tracking and data profiling to inform future planning for corridor improvement, and incorporate measurements and feedback mechanisms in tracking component progress and refine impact estimating techniques.
� Establish a process to monitor corridor risks and make provisions to reassess the risks associated with the corridors at the various stages of programme implementation.
� Establish mechanisms to share experiences and lessons learned across corridors to develop and refine effective approaches. These abilities become even more important as corridor initiatives move towards scale.
� Convene regular meetings to drive and track corridor implementation, and report to partners on progress towards achieving commitments, including those made by the private sector.
� Hold regular and transparent discussions to evaluate progress. This will ensure solutions are found when needed, and help keep the right amount of focus on performance and sustainability.
� Set up mechanisms for ensuring that smallholder producers and SMEs contribute to the evaluation process and are aware of the findings of the same.

177
Chapter 10
Conclusions
This chapter has been kept purposely short because comprehensive and detailed conclusions and recommendations have already been presented in Chapter 9.
10.1 GENERAL CONCLUSIONSMany initiatives are taking place in low- and middle-income countries to foster the development of economic corridors in parallel with, and on the basis of transport infrastructure and trade routes. These corridor initiatives help improve physical connectivity and generate economies of scale in selected sectors, while working to strengthen inclusive markets through broader improvements to the enabling environment. Precisely, this integration between hard and soft investments is the hallmark of economic corridors.
Corridor programmes seek to ensure the complementarity of these two types of investments, strike a balance between them, and find the right sequencing (simul-taneous versus consecutive implementation) to generate high synergies. However, soft and hard interventions have associated substantially different financial com-mitments. Infrastructure improvements require financial commitments estimated at over 0.5 percent of corridor GDP. Software interventions, on the other hand, do not have significant fiscal impact, but rather require political capital, specialized technical capacity for implementation and an enabling environment and institu-tional framework.
Economic corridors are variable in scope, ranging from an area within a country to a regional grouping of countries. In both cases, the main goal of the corridor initiative is to develop the targeted area economically, but regional corridors have an added dimension: the harness of regional integration. Consequently, regional corridors are vital to deepen and help materialize regional integration agreements in a specific territory, as in the case of GMS and ASEAN. They are also pivotal to smooth the transition from centrally planned to market-driven economies (CAREC and GMS), to strengthen the weakest links of the region, e.g. the Lao People’s Democratic Republic, Cambodia and Myanmar in the GMS, and to transmute “landlocked” into “landlinked” countries (CAREC countries and the Lao PDR in the GMS programme).
Agriculture is typically one of the sectors targeted in economic corridor initia-tives in developing and emerging countries. This is a reflection of the importance of agriculture for food security and the national economy in terms of GDP contribu-tion, exports and employment generation. It is also an expression of the increasing interest of multinational agribusiness companies in developing economies. But instead of taking countries as the unit for the benchmarking exercise that will lead to an investment decision, multinational agribusinesses are starting to think about

Making economic corridors work for the agricultural sector178
non-conventional market groupings such as corridors in order to build critical mass and drive higher returns more quickly.
Corporations wishing to invest in primary agriculture, stimulated by the high prices of agricultural commodities in the past years, may perceive agrocorridors as a suitable location with available fertile land and favourable policy and operational environments. Other agribusinesses looking for new markets for their products and services may see agrocorridors in developing and emerging nations as attractive markets. Corridors are likely to provide the kind of scale that can make them com-mercially attractive. So, for instance, while to an agribusiness company the United Republic of Tanzania and the broader East African region may look daunting in terms of market development, SAGCOT may represent a good-size dynamic mar-ket. Besides its own attractiveness, the corridor may serve as an advantageous entry point, from which to expand to the rest of the country and region.
Agrocorridors are also appealing for domestic agribusiness firms because they offer not only a critical mass of potential consumers (farmers and firms clustered in growth hubs), but also a more enabling business environment than the rest of the country. Another factor that attracts national companies is the provision of subsidized financial products and BDS to corridor investors. Furthermore, corridor programmes typically increase the effective demand for agribusiness goods and services by smallholder farmers, who would not be able to afford them without the corridor support package.
The appeal of agrocorridors could be such that agribusiness firms may convene or join multistakeholder partnerships for developing a corridor. This is the case of the multinational companies, members of the WEF’s New Vision for Agriculture initiative, which became partners in the SAGCOT and BAGCI partnerships. It could also be that private firms, both national and international from other sectors decide to support corridor programmes as part of their CSR strategy, as in Peru.
Governments may see in the corridor model a vehicle for better focusing their resources in areas of high growth potential (corridors, and clusters and SEZ within them), while creating synergies between hardware and software infrastructure. The public sector finds it easier to align the work of various ministries (ranging from portfolios of finance, transport and public works, customs and immigration to quar-antine and agriculture) and decentralized governments around a common roadmap for corridor development. Moreover, a corridor roadmap, aligned to national plans and strategies, provides the basis for negotiating with and engaging donors and other development partners, and for coordinating their interventions.
Similarly, for the international community an agrocorridor is a highly systematic model to foster agricultural and economic development in general. Not only does this approach make it simpler to coordinate investments, align interventions and mobilize additional support, but it also offers an opportunity to pilot and test new models at scale. Clearly, delivering new development models at scale presents multiple challenges and requires sustained high-level commitment from all corridor partners for several years.
Regional economic corridors require impetus and assistance from regional organizations to sustain the momentum created by strong country-level political support, and vice versa. The multiplicity of countries, agreements and players involved amounts to a challenge of coordination. Moreover, decentralization pro-
Chapter 10 – Conclusions 179
cesses are ongoing and extremely important in developing regions, so the interaction between central and federal or regional governments within each country has to be added to the formula. Without mutual support between national and regional organizations, it would be difficult to face the complexity of inter-institutional implementation and the need for standardized and harmonized, and yet innovative corridor execution and financing models.
Motivated by these reasons, some of the actors mentioned have teamed up to promote agribusiness development through six economic corridors, as shown throughout these pages. These corridors have been fostered by different lead con-veners or actors that have shaped four distinct corridor models. As could not be otherwise, the four models analysed have diverse strategies, stakeholders, objectives, engagement and governance models, as well as corridor programme components. Nevertheless, they also have much in common for they share the basic principles of agrocorridor development.
The approach used in characterizing these agrocorridor models has been to deconstruct them along the lines of the core factors that have been defined in theory as key to the contribution of corridor performance. These factors are, inter alia, public policy, investment incentives, infrastructure, labour performance (through human resources development) and regional and global integration. This decon-struction has been captured through the establishment of monographs of corridor characteristics, understanding the (core) developer, the development phases of the corridors and the nature of corridor institutions such as corridor authorities, centres and funds. A tailor-made framework for analysis has been applied to ensure the systematic, coherent comparison across the cases. The framework looks at the com-parative advantage of each corridor, the extent of its connectivity and infrastructure, its composition of firms and farmers, the soft interventions deployed to develop the agribusiness opportunities, its supported agrifood chains, and the specific processes and tools used for planning and implementing the corridor programme. This analy-sis has culminated in implications on governance, impacts on local, national and regional development, and finally the sustainability of these corridors.
The study of the cases reveals that corridor programmes come in all shapes and sizes. Some are multicountry, multicorridor and multisectoral, while others deal with a single country, corridor and sector. Obviously, this wide variability is also observed in the budget and target for induced investments attributable to each corridor intervention.
An important element of differentiation among the six cases studied is the way they approach the agribusiness sector. Some corridor programmes have been cre-ated with the sole purpose of contributing to agribusiness development; others have agriculture as one of several core sectors they support. Finally, agribusiness can be a second-tier sector that corridor programmes deal with in an ad hoc manner, when specific initiatives for joint action are identified and agreed upon.
Each approach may yield a different outcome, but each has the potential to impact the agribusiness sector in a substantial, positive manner. Long-lasting gains in agricultural and total GDP have been observed, incremental jobs have been created along the agrifood chain and ancillary industries and services, agricultural exports have steadily increased and farmers’ income have risen. In particular, the impacts of agrocorridors in terms of employment generation are noteworthy. As highlighted in Chapter 9, incremental jobs are created not only on farm but also off

Making economic corridors work for the agricultural sector180
farm, mostly in the agroprocessing sector, but also in other stages of the agricul-tural value chain. Indirect effects on employment in other sectors are also far from being negligible. Furthermore, the emphasis of many agrocorridor programmes on inclusive and socially responsible engagement models will likely have long-lasting positive effects on the income levels of small-scale farmers and agribusiness firms.
The impressive positive impacts of agrocorridor programmes can blind us to the existence of some negative effects, such as land tenure issues, environmental degra-dation, overuse of water resources and the exclusion of small-scale actors. To avoid the emergence of these issues, social and environmental safeguards can be built into the corridor masterplan. Some of these safeguards might seek to reduce the market asymmetry of information and bargaining power between the farmers and their suppliers and buyers, which are often multinational agribusiness companies. Other safeguards will try to address the potential negative externalities associated with agricultural intensification. Further social safeguards are broader in scope, such as enabling communities to sustain themselves, protect their land rights and create favourable ecoenvironmental conditions in the corridor area where they live.
To shield the agrocorridor programme against the potential poor design, imple-mentation and governance issues underscored in Chapter 9, guidance is provided for those concerned with corridor/agribusiness development. A two-pronged approach is followed: a best practices summary and a checklist are offered to be used in com-bination. The main goal of these guidance elements is to maximize the potential of the corridor plan to yield positive outcomes (triple bottom line of economic, social and environmental effects) and minimize the likelihood of negative outcomes.
10.2 LOOKING FORWARD: IMPLICATIONS AND SUGGESTIONS FOR FUTURE STUDIES
This study has provided a detailed account of six economic corridors in developing countries that target agricultural sector development. It has highlighted the inter-ests, objectives and means of the various corridor stakeholders towards local devel-opment and regional integration. Being long-term, complex megaprojects, many of the economic corridors are still at their early stages, which means that there is still time for evaluation to provide a feedback platform that informs a more strategic approach to policy and practice on the future of (agro-) economic corridors.
Development is a process with successes and failures along the way. Some failures, however, can be minimized and corrected if more rigorous monitoring arrangements are in place. This is particularly important in the face of potential negative externalities that may emerge during the implementation of agrocorridor programmes. Again, the appearance of negative effects should be closely monitored so as to avoid a point of no return in the future.
A follow-up on the impacts of the various engagement and governance models used by agrocorridors in developing countries is also advisable. New models are emerging so fast that more time is needed to allow the ongoing processes of trial-and-error experimentation to stabilize, so that the lessons drawn from agrocorridor initiatives can be fine-tuned and expanded. While waiting for time to generate hard evidence, policy-makers and practitioners can lend a watchful eye to the evolution of governance and market structures affecting agrocorridors, so that they may reward smallholder inclusion as well as environmentally responsible corporate practices.
181
Annex 1
Glossary
AgribusinessAgribusiness is a broad concept that covers input suppliers, agroprocessors, trad-ers, exporters and retailers. Agro-industry broadly refers to the establishment of enterprises and supply chains for developing, transforming and distributing specific inputs and products in the agricultural sector. Agro-industry refers to the establishment of enterprises and supply chains for developing, transforming and distributing specific inputs and products in the agricultural sector. (Source: FAOTERM.) For the sake of simplification, these two terms are considered interchangeable in this document.
Agricultural extension“Agricultural extension provides non-formal agriculturally related continuing adult education for multiple audiences: farmers, spouses, youth, community, urban horticulturalists (continuing agricultural education and community development) and for various purposes (including agricultural development, community resource development, group promotion and cooperative organizational development)” (FAO, 2001; p. 9).
Agricultural value chainsAgricultural value chains “comprise a set of actors who conduct a linked sequence of value-adding activities involved in bringing a product from its raw material stage to the final consumer”, i.e. from farm to fork (Miller and Jones, 2010; p. xv). These value chains encompass activities that take place at the farm level (or before, such as input supply) and off farm (handling, processing and distribution). The term “value” refers to the fact that as agricultural products move through the successive stages, transactions between chain actors take place, and value is progressively added (FAO, 2007). Support services and the “rules of the game” (laws, regulations, policies and other institutional elements) are also part of the chain concept (ibid.).
Biofuel (ethanol and biodiesel)Both ethanol and biodiesel are biofuels. The former is an alcohol product pro-duced from corn, sorghum, potatoes, wheat, sugar cane and even biomass such as cornstalks and vegetable waste. Biodiesel, on the other hand, can be made from soybeans, sunflowers, oil palm, jatropha or other oil crops.
Second-generation biofuels are produced from cellulose, hemicellulose, or lignin (ADB, 2007a), while first-generation biofuels are primarily derived from food crops, such as grain (corn, wheat, etc.), sugar cane for bioethanol, and oilseeds (such as palm oil) for biodiesel production.

Making economic corridors work for the agricultural sector182
Block farmingBlock farming is a farming system in which groups of smallholder farmers join together to farm large tracts under the guidance of a technical supervisor in order to minimize labour, input and extension costs (Milder et al., 2012). In this specific case, the term refers to farm blocks under irrigation that are leased to commercial and smallholder producers (AgDevCo and InfraCo, 2010).
Breadbasket (project/intervention)A breadbasket project consists of the priority development of an area or region with the potential for providing most of the food for a country. The Cerrado region of Brazil and the northeast region of Thailand are two examples of successful bread-basket corridor programmes in the developing world, carried out by two relatively backward and landlocked agricultural regions in otherwise dynamic nations (World Bank, 2009b). They have developed at a rapid pace and have become leading agricul-tural exporters, through investing in large connective infrastructure and large dams, agricultural research, and soil recuperation in well-defined corridor areas (World Bank, 2009b).
Brownfield investmentsBrownfield investments entail the expansion of existing ventures. Greenfield invest-ments, on the other hand, are ventures that finance new physical facilities for a business in a location where no existing facilities are currently present.
Catalytic financingCatalytic financing is long-term capital to support companies and organizations to undertake project development (in this case, of sustainable agriculture projects) that can be taken to scale.
Contract farmingContract farming is an agricultural production system carried out according to an agreement between a buyer and farmers. The agreement establishes conditions for the production and marketing of a farm product or products (FAO, 2012d). An out-grower scheme is a system under which small-scale farmers (outgrowers) produce crops for sale to a specific purchaser, usually an agricultural processing operation or nearby large-scale farm. Frequently, the outgrowers receive training, extension and input supplies to help improve product quantity and quality (Milder et al., 2012).
Dry portA dry port is a facility that provides services for the handling and temporary storage of containers, general and/or bulk cargoes that access the dry port by any mode of transport such as road, railways, inland waterways or airports. (Source: www.unescap.org [last accessed July 2013].)
Dutch diseaseThe Economist (1977, pp. 82–83) coined this term in relation to the role of natural gas in the Dutch economy following the oil crisis of 1973. It referred to the fact that the rise in natural resource exports (gas in the case of the Netherlands) can cause an

Annex 1 – Glossary 183
appreciation of the national currency, which might trigger a divergence in develop-ment between the tradable and the non-tradable sectors.
Economic integrationEconomic integration is often defined as the abolition of the various restraints of trade between nations. However, in this report economic integration refers not only to the concept of free trade areas, but also to more advanced processes of integra-tion that have more to do with economic convergence and catching-up processes. There are several levels of economic integration: (i) free trade area with no tariffs against members and individual tariffs against outsiders (e.g. the North American Free Trade Area [NAFTA] and the European Free Trade Area [EFTA]); (ii) customs union (no tariffs against members, common tariff against outsiders, e.g. the Andean Group and Caribbean Community and Common Market [CARICOM]); (iii) com-mon market (a customs union without limitations on factor mobility, such as the European Union); and (iv) complete economic integration (unification of monetary, fiscal, social and counter-cyclical policies).
Freight forwardingFreight forwarding is a service used by firms that deal in international trade. Instead of directly handling the transportation of their products, which can involve a multitude of carriers, requirements and legalities, these firms can hire a “freight for-warder” to act as an intermediary between them and various transportation services.
Global servicesGlobal services are those necessary for companies competing on the world market, such as easy access to global destinations for passengers and freight (in particular airborne services), and the existence of advanced services supporting international finance and market development. Other services include those in the field of marketing and information and communication technology, and human resources development to obtain a workforce with sufficient skills for meeting international requirements.
GovernanceThe term “governance”is linked to the work of Williamson (1975; 1985) and other new institutional economists, who state that institutions matter in many ways that are pertinent for industrial organization, economic development and other fields of social sciences. The institutional perspective encompasses two levels of analysis. The first level is broader in scope and deals with the institutional environment or “rules of the game” (or environment in which the institutional actors are embed-ded). The second level is more focused on the microanalytic level pertaining to the “institutions of governance”, which operate at the level of individual transactions, and include markets, hybrids (mixed governance structure composed of hierarchic and market elements) and hierarchies (i.e. a governance structure, with a ruling body of clergy organized into orders or ranks each subordinate to the one above it) (Williamson, 1973). Using this second, narrower sense, each mode of governance has associated transaction costs; thus, taking the institutional environment as given, economic agents align transactions with governance structures to effect economiz-

Making economic corridors work for the agricultural sector184
ing outcomes. Hence, a governance structure is “an institutional framework in which [the integrity of] a transaction, or related set of transactions, is decided” (Williamson, 1996; p. 11).
Hardware (investment/interventions)Hard components or investments refer to public spending aimed at developing material infrastructure. “Hardware” concerns operations that enhance the connec-tivity of national infrastructure investments (in transport, energy and communica-tions) and associated regulatory frameworks to sustainable trade and investment integration corridors, with the goal of reducing cross-border transaction costs, boosting external competitiveness through productive integration, and promoting balanced territorial development” (IaDB, 2011).
(Investment) greenprintAn investment “greenprint” can be defined as an investment framework to stimulate “green growth”, i.e. growth that respects the environment and uses natural resources adequately. Agriculture green growth is an approach for attracting and coordinating investment in agricultural production, processing and distribution that is efficient, profitable, sustainable and resilient to climate change (Milder et al., 2012).
Land bankLand banks consist of general land available for investments, as determined by local land-use plans, where investors can pick available areas in which to invest (Theting and Brekke, 2010).
Land grabbingLand grabbing is the transfer of rights to large areas (over 200 ha) of agricultural land from local communities to foreign or domestic investors under false pretences and questionable contracts, and occasionally with clear breaches of traditional rights to land (Theting and Brekke, 2010; EC, 2013). Such land grabs typically involve limited consultation with local communities, limited compensation, and a lack of regard for environmental sustainability and equitable access to, or control over, water resources.
Last-mile infrastructureThis concept refers to infrastructure that links smallholders and local communities into the network, such as feeder roads, power and irrigation connections to the farmgate.
Market thicknessIn agglomeration economics, “market thickness” refers to the effective number of firms in a given market; thus, a thicker market indicates that more transactions of a homogeneous good take place in a unit of time (Lippman and McCall, 1986). Conversely, “thin markets” have a low number of buyers and sellers, and transac-tions are scant; thus, they are less liquid and more volatile (since the few trades that take place can affect prices significantly). The term “market thickness” has a long history in the study of financial markets and commodity exchanges (Telser, 1981), particularly in finance microstructure literature under the term “liquidity” (Lipp-
Annex 1 – Glossary 185
man and McCall, 1986), and in the transactions cost literature. See, for example, the literature review in Hubbard (2001).
Matching grantThis type of grant encourages applicants to provide matching contributions in cash or in kind, e.g. personnel time or assets. Consequently, the facility operates on a co-investment basis, pairing up with national sponsors to create investment opportunities to attract private investors.
Meta-trendsSystem-wide developments arising from the simultaneous occurrence of a number of independent social, economic and technological trends.
One-stop shopA one-stop shop relates to the ability of providing a comprehensive selection of goods or services at a single location. The rationale of a one-stop shop or centre is to provide a convenient, efficient and comprehensive selection of services to targeted clients.
Patient capitalPatient capital can be defined as equity funding with return requirements that are delayed in time or lower in profitability than normal commercial thresholds (EC, 2004). In the context of the Beira Agricultural Growth Corridor (BAGC), it refers to long-term, low-cost, subordinated capital to develop on-farm infrastructure, mostly funded by development partners, such as bilateral donors, multilateral development banks and large foundations (AgDevCo, 2010).
Public goodsPublic goods are investments that deliver significant collective benefits but are not profitable in their own right.
Public-private partnerships (PPPs)PPPs are collaborative agreements between the government and the private sec-tor regarding the provision of a public good or service. Such partnerships are characterized by the sharing of investment, risk, knowledge, responsibility and reward between the partners. PPP Units or Agencies are entities whose main goal is to facilitate, promote and monitor PPPs. PPPs for infrastructure development are commonplace in many countries around the world, but more recently this arrangement has come into focus as a potential mechanism to further sustainable agricultural development objectives. Hereinafter, such a partnership will be referred to as an agribusiness PPP. Agribusiness PPPs may have several advantages, such as bringing needed capital to public projects and lessening the risks inherent in doing business in agriculture.
Smart subsidiesSmart subsidies are those characterized by being transparent (and designed to mini-mize scope for political interference and administrative allocation), target-effective, cost-effective, cost-efficient and non-distortionary (World Bank, 1998).

Making economic corridors work for the agricultural sector186
Software (investment/interventions)Investments in soft components (policy and regulatory coordination) mean public or development funding that prepares the ground for “hard” investments (physical integration), for example by improving governance, developing human resources and business capacity, building a fostering enabling environment and strengthening rel-evant organizations (Streeck and Mertens, 2011). Software refers to “operations that support policy reforms, regulatory upgrades, institutional strengthening and capac-ity development needed to facilitate the movement of goods, services, capital, people and technology across borders, with the goal of promoting a better integration of country systems and private operators into the global economy” (IaDB, 2011).
Soil carbon sequestration “Soil carbon sequestration” or increasing the storage of carbon in the soil is the pro-cess of transferring carbon dioxide (CO2) from the atmosphere into the soil through crop residues and other organic solids, and in a form that is not immediately re-emitted (OSU, n.d.). It helps to slow down rising atmospheric CO2 concentrations.
Trade facilitation measures Trade facilitation measures are those that encourage the efficient flow of goods and services across borders by focusing on the rationalization, standardization and harmonization of trade-related procedures (UNCTAD, 2011).
Transformative investmentA “transformative investment” is characterized by its catalytic nature and ability to impact on markets and people, beyond its chronological and geographic scope (Katz and Wagner, 2008).
Value-chain financeValue-chain finance refers to “the financial flows to those actors from both within the value chain and financial flows to those actors from the outside as a result of their being linked within a value chain” (Miller and Jones, 2010; p. xv).
Subsistence, emergent and commercial farmer
Subsistence farmer Emergent farmer Commercial farmer
Agricultural method used Traditional Traditional/modern Modern
Agricultural products for: Self-consumption Self-consumption/sale Sale
Income Nil – low Low–medium Medium–high

187
Annex 2
Economic corridors identified
No. Region Corridor name Countries involved
1 Africa Maputo Development Corridor Mozambique and South Africa
2 Africa Coast-to-Coast Corridor Mozambique, Swaziland, South Africa, Botswana and Namibia
3 Africa Nacala Corridor Mozambique, Malawi and Zambia
4 Africa Beira Agricultural Growth Corridor Mozambique
5 Africa Southern Agricultural Growth Corridor of Tanzania
United Republic of Tanzania, Zambia and Malawi
6 Africa North-South Corridor South Africa, Zimbabwe and Zambia
7 Africa Northern Corridor Kenya, Uganda, Burundi, Rwanda and Democratic Republic of the Congo (DRC)
8 Africa Central Corridor United Republic of Tanzania, Burundi, DRC, Rwanda and Uganda
9 Africa The Greater Cairo Region corridors:
1) Cairo-Suez
2) Cairo-Alexandria
3) Cairo-Ismaïlia
Egypt
10 Africa Greater Ibadan Lagos Accra (GILA) Corridor Benin, Ghana, Nigeria and Togo
11 Africa Gauteng City Region Corridor South Africa
12 Africa Dakar-Touba Corridor Senegal
13 Africa Abidjan-Ouagadougou Corridor Côte d’Ivoire and Burkina Faso
14 Africa Lamu Growth Corridor Ethiopia, Kenya and South Sudan
15 Asia North-South Economic Corridor (Greater Mekong Subregion [GMS programme])
China, Myanmar, Lao People’s Democratic Republic (Lao PDR) and Thailand
16 Asia East-West Economic Corridor (GMS programme)
Myanmar, Thailand, Lao PDR and Viet Nam
17 Asia Southern Economic Corridor (GMS programme)
Viet Nam, Cambodia and Thailand
18 Asia Central Asia Regional Economic Cooperation Corridors (CAREC)
Afghanistan, Azerbaijan, China (Xinjiang province), Kazakhstan, the Kyrgyz Republic, Mongolia, Pakistan, Tajikistan, Turkmenistan and Uzbekistan
19 Asia Mekong-India Economic Corridor India, Thailand, Cambodia, Myanmar and Viet Nam
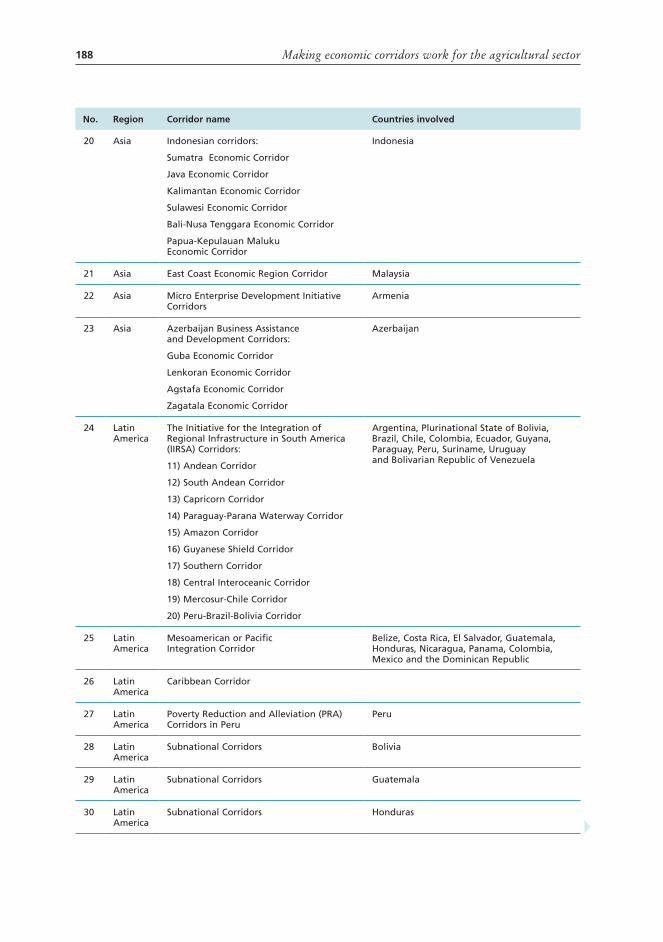
Making economic corridors work for the agricultural sector188
No. Region Corridor name Countries involved
20 Asia Indonesian corridors:
Sumatra Economic Corridor
Java Economic Corridor
Kalimantan Economic Corridor
Sulawesi Economic Corridor
Bali-Nusa Tenggara Economic Corridor
Papua-Kepulauan Maluku Economic Corridor
Indonesia
21 Asia East Coast Economic Region Corridor Malaysia
22 Asia Micro Enterprise Development Initiative Corridors
Armenia
23 Asia Azerbaijan Business Assistance and Development Corridors:
Guba Economic Corridor
Lenkoran Economic Corridor
Agstafa Economic Corridor
Zagatala Economic Corridor
Azerbaijan
24 Latin America
The Initiative for the Integration of Regional Infrastructure in South America (IIRSA) Corridors:
11) Andean Corridor
12) South Andean Corridor
13) Capricorn Corridor
14) Paraguay-Parana Waterway Corridor
15) Amazon Corridor
16) Guyanese Shield Corridor
17) Southern Corridor
18) Central Interoceanic Corridor
19) Mercosur-Chile Corridor
20) Peru-Brazil-Bolivia Corridor
Argentina, Plurinational State of Bolivia, Brazil, Chile, Colombia, Ecuador, Guyana, Paraguay, Peru, Suriname, Uruguay and Bolivarian Republic of Venezuela
25 Latin America
Mesoamerican or Pacific Integration Corridor
Belize, Costa Rica, El Salvador, Guatemala, Honduras, Nicaragua, Panama, Colombia, Mexico and the Dominican Republic
26 Latin America
Caribbean Corridor
27 Latin America
Poverty Reduction and Alleviation (PRA) Corridors in Peru
Peru
28 Latin America
Subnational Corridors Bolivia
29 Latin America
Subnational Corridors Guatemala
30 Latin America
Subnational Corridors Honduras

Annex 2 – Economic corridors identified 189
No. Region Corridor name Countries involved
31 Latin America
Subnational Corridors Paraguay
32 Latin America
Soybean Export Corridors Argentina
33 Latin America
Sugar-cane Ethanol Export Corridors Brazil

191
Bibliography
ADB. 2004. The GMS Beyond Borders. Regional Cooperation Strategy and Program (2004–2006). Mandaluyong City, the Philippines, Asian Development Bank.
ADB. 2006. The GMS Beyond Borders. Regional Cooperation Strategy and Program (2007–2009). Mandaluyong City, the Philippines, Asian Development Bank.
ADB. 2007a. Strategic Framework for Subregional Cooperation in Agriculture 2006–2010. Mandaluyong City, the Philippines, Asian Development Bank.
ADB. 2007b. Trade Performance of GMS Countries. Trends, Patterns and Policy Options, by P. Athukorala. Mandaluyong City, the Philippines, Asian Development Bank. (unpublished)
ADB. 2008a. Accelerating the Implementation of the Core Agriculture Support Program (Cofinanced by the Government of the People’s Republic of China). Technical Assistance Report, Project 39542. Regional Policy and Advisory Technical Assistance (R-PATA). December. Mandaluyong City, the Philippines, Asian Development Bank.
ADB. 2008b. Transport and Trade Facilitation in the Greater Mekong Subregion. Time to Shift Gears. Evaluation Study. SAP: REG 2008-86. Sector Assistance Program (SAP) Evaluation. December. ADB Operations Evaluation Department. Mandaluyong City, the Philippines, Asian Development Bank.
ADB. 2008c. Lao People’s Democratic Republic and Socialist Republic of Viet Nam – Greater Mekong Subregion: East-West Corridor Project. Performance Evaluation Report. December. ADB Operations Evaluation Department. Mandaluyong City, the Philippines, Asian Development Bank.
ADB. 2009. Status and Potential for the Development of Biofuels and Rural Renewable Energy. The People’s Republic of China, by J. Huang, H. Qiu, J. Yang & Y. Zhang. Mandaluyong City, the Philippines, Asian Development Bank.
ADB. 2010a. Toward sustainable and balanced development. Strategy and Action Plan for the Greater Mekong Subregion East-West Economic Corridor. Mandaluyong City, the Philippines, Asian Development Bank.
ADB. 2010b. Toward Sustainable and Balanced Development. Strategy and Action Plan for the Greater Mekong Subregion – North-South Economic Corridor. Mandaluyong City, the Philippines, Asian Development Bank.
ADB. 2010c. Toward Sustainable and Balanced Development. Strategy and Action Plan for the Greater Mekong Subregion – Southern Economic Corridor. Mandaluyong City, the Philippines, Asian Development Bank.
ADB. 2010d. Seventh Meeting of the GMS Working Group on Agriculture (WGA-7). Hanoi, 15–16 November. Mandaluyong City, the Philippines, Asian Development Bank.
ADB. 2010e. Support for Implementing the Action Plan for Transport and Trade Facilitation in the Greater Mekong Subregion. Technical Assistance Report. Project 44174–01. November. Mandaluyong City, the Philippines, Asian Development Bank.

Making economic corridors work for the agricultural sector192
ADB. 2010f. Fourteenth Meeting of the GMS Subregional Transport Forum. Summary of Proceedings. Nanning, China, 2–3 December. GMS Economic Cooperation Program. Mandaluyong City, the Philippines, Asian Development Bank.
ADB. 2011a. The Greater Mekong Subregion Economic Cooperation Program Strategic Framework 2012–2022. Mandaluyong City, the Philippines, Asian Development Bank.
ADB. 2011b. Core Agriculture Support Program Phase II (2011–2015). Greater Mekong Subregion Working Group on Agriculture. Mandaluyong City, the Philippines, Asian Development Bank.
ADB. 2011c. Regional Corridors Development in Regional Cooperation, by P. Srivastava. ADB Economics Working Paper Series 258. Mandaluyong City, the Philippines, Asian Development Bank.
ADB. 2011d. Cross-border Contract Farming Arrangement. Variations and Implications in the Lao People’s Democratic Republic, by K. Manorom, D. Hall, X. Lu, S. Katima, M.T. Medialdia, S. Siharath & P. Srisuphan. Greater Mekong Subregion-Phnom Penh Plan for Development Management. Research Report Series 1(2). Mandaluyong City, the Philippines, Asian Development Bank.
ADB. 2011e. Trade and Investment in the Greater Mekong Subregion. Remaining Challenges and the Unfinished Policy Agenda, by J. Menon & A.C. Melendez. ADB Working Paper Series on Regional Economic Integration 78. Mandaluyong City, the Philippines, Asian Development Bank.
ADB. 2011f. The New Silk Road. Ten Years of the Central Asia Regional Economic Cooperation Program. Mandaluyong City, the Philippines, Asian Development Bank.
ADB. 2012a. Greater Mekong Subregion Economic Cooperation Program. Overview. Mandaluyong City, the Philippines, Asian Development Bank.
ADB. 2012b. Biofuels in the Greater Mekong Subregion. Energy Sufficiency, Food Security and Environmental Management, by P. Tharakan, N. Crishna, J. Romero & D. Morgado. ADB Southeast Asia Working Paper Series. Mandaluyong City, the Philippines, Asian Development Bank.
ADB. 2012c. Trade and Trade Facilitation in the Greater Mekong Subregion. P. Srivastava & U. Kumar, eds. August. Mandaluyong City, the Philippines, Asian Development Bank. Available at: http://www.adb.org/sites/default/files/pub/2012/trade-and-trade-facilitation-gms.pdf
ADB. 2012d. Asian Economic Integration Monitor. July. Mandaluyong City, the Philippines, Asian Development Bank.
ADB. 2012e. A Strategic Framework for the Central Asia Regional Economic Cooperation Program: 2011–2020. Mandaluyong City, the Philippines, Asian Development Bank.
ADB. 2012f. Agricultural Trade Facilitation in the Greater Mekong Subregion. Mandaluyong City, the Philippines, Asian Development Bank.
ADB & ADBI. 2013. Connecting South Asia and Southeast Asia. Interim Report. Tokyo, Asian Development Bank and Asian Development Bank Institute.
ADBI. 2008a. Global Partnership in Poverty Reduction. Contract Farming and Regional Cooperation, by S. Setboonsarng. ADBI Discussion Paper 89. Tokyo, Asian Development Bank Institute.
ADBI. 2008b. Rice Contract Farming in Lao PDR. Moving from Subsistence to Commercial Agriculture, by S. Setboonsarng, P.S. Leung & A. Stefan. ADBI Discussion Paper 90. Tokyo, Asian Development Bank Institute.

Bibliography 193
ADBI. 2010. Assessing Socioeconomic Impacts of Transport Infrastructure Projects in the Greater Mekong Subregion, by S. Stone, A. Strutt & T. Hertel. ADBI Working Paper Series 234. Tokyo, Asian Development Bank Institute.
ADBI & EE. 2009. Trade Facilitation and Regional Cooperation in Asia. Edited by D.H. Brooks & S.F. Stone. Asian Development Bank Institute; Cheltenham, United Kingdom and Northampton, MA, United States of America, Edward Elgar Publishing.
African Union. 2007. Action Plan for the Accelerated Industrial Development of Africa. AU Conference of Ministers of Industry. 1st Extraordinary Session, 24–27 September. Midrand, Republic of South Africa, AU. Available at: http://www.unido.org/fileadmin/user_media/Services/Investment_and_Technology_Promotion/University_Chair/ACTION_PLAN_ON_INDUSTRIALIZATION_Final.pdf
AgDevCo. 2010. Agricultural growth and poverty reduction in Africa. The case for patient capital. Available at: http://www.agdevco.com/sysimages/the_case_for_patient_capital_rpt16.pdf
AgDevCo. 2012. Investment Portfolio. June. Available at: http://www.agdevco.com/userfiles/file/AgDevCo_Investment_Summary %20June %202012.pdf
AgDevCo & InfraCo. 2010. Beira Agricultural Growth Corridor. Delivering the Potential. Mozambique, Beira Agricultural Growth Corridor Initiative (BAGCI). January. Available at: http://www.agdevco.com/sysimages/BAGC_Investment_Blueprint.pdf
Albrechts, L. & Tasan-Kok, T. 2009. Corridor and Axis Development. International Encyclopedia of Human Geography, MS no. 833.
Ambrosio-Albalá, M. & Bastiaensen, J. 2010. The new territorial paradigm of rural development: theoretical foundations from systems and institutional theories. Discussion Paper. Institute of Development Policy and Management. Belgium, University of Antwerp.
APRODEV. 2013. Policy Brief. The Role of European Development Finance Institutions in Land Grabs. May.
Arnold, J. 2006. Best Practices in Management of International Trade Corridors. World Bank Transport Papers 13. Washington, DC, the International Bank for Reconstruction and Development/ World Bank.
Arnold, J., Olivier, G. & Arvis, J.F. 2005. Best Practices in Corridor Management. Washington, DC, World Bank.
AusAID. 2009. Mekong Connectivity Statement 2008–09. Canberra, Australian Agency for International Development.
Bafoil, F., Diaz, N., Guerin, S., Morris, A. & Sen, S. n.d. Developing Dependency. Special Economic Zones in the Greater Mekong Sub-Region. A Comparative Perspective. Capstone.
Bafoil, F. & Ruiwen, L. 2010. Re-examining the Role of Transport Infrastructure in Trade, Regional Growth and Governance. Comparing the Greater Mekong Subregion (GMS) and Central Eastern Europe (CEE). J. Current Southeast Asian Affairs, 2: 73–119.
BAGC. 2012. BAGC Partnership Progress Report to 30 June 2012. Beira Agricultural Growth Corridor Partnership. Available at: http://www.beiracorridor.com/lib/docs/anexos/BAGC_six_month_progress_report-2012_Ing.pdf

Making economic corridors work for the agricultural sector194
Banomyong, R. 2008. Logistics development in the Greater Mekong Subregion. A study of the North-South Economic Corridor. J. Greater Mekong Subregion Development Studies, 4: 43–58. December.
Berger, S. 2009. The Foundations of Non-Equilibrium Economics. The principle of circular and cumulative causation. London and New York, Routledge.
Bialasiewicz, L. 2011. Europe in the World. EU Geopolitics and the Making of European Space. Farnham, Surrey, United Kingdom and Burlington, Vermont, United States of America, Ashgate Publishing.
BNamericas. 2012. Inca roads. Peru sees competitiveness via road building and concessions. Infrastructure Intelligence Series. Business News Americas. March.
Borjas, G.J. 1992. Ethnic Capital and Intergenerational Mobility. Quarterly J. Economics, 107: 123–50.
Borjas, G.J. 1995. Ethnicity, Neighborhoods, and Human Capital Externalities. American Economic Review, 85(3): 365–390.
Brahmawong, P. & Sukhraromana, R. 2013. East-West Economic Corridor and Southern Economic Corridor of Greater Mekong Subregion. Who Gains and Who Loses? Economics and Public Policy, 3(6): 131–155.
Bunnell, T. & Coe, N.M. 2005. Re-fragmenting the “political”: globalization, governmentality and Malaysia’s Multimedia Super Corridor. Political Geography, 24: 831–49.
Campbell, M.M., Maritz, J. & Hauptfleisch, D. 2009. The Impact of the Maputo Development Corridor on Wealth Creation within the Region it Serves.
Carciofi, R. 2012. Cooperation for the Provision of Regional Public Goods. The IIRSA Case. In P. Riggirozzi & D. Tussie, eds. The Rise of Post-Hegemonic Regionalism, pp. 65–79. United Nations University Series on Regionalism 4.
CAREC. 2006. Central Asia Regional Economic Cooperation. Comprehensive Action Plan. Good neighbors, good partners and good prospects. Endorsed by the Fifth Ministerial Conference on Central Asia Regional Economic Cooperation, 18–20 October 2006, Urumqi, XUAR, China.
CAREC. 2010. Draft 10-year Commemorative Study. Reference Document for the Working Dinner on 30 October 2010, presented at the 9th Ministerial Conference on Central Asia Regional Economic Cooperation, 31 October to 2 November. Cebu, the Philippines.
CAREC. 2011. A Pilot Study on the Development of “CAREC Corridors”. Promoting transformation of CAREC Corridors to economic corridors. Reference Document for Session 3a of the CAREC Senior Officials’ Meeting, 7 – 8 June, Baku, Azerbaijan. Available at: http://www.carecprogram.org/uploads/events/2011/SOM-Jun/Pilot-Study-Development-of-CAREC-Corridors-Paper.pdf
CAREC. 2012. Development Effectiveness Review 2011. CAREC 2020 – Focus, Action, Results. Manila, Central Asia Regional Economic Cooperation.
CEMAT. 2007. Spatial development glossary. European Conference of Ministers responsible for Spatial/Regional Planning (CEMAT). Strasbourg, Council of Europe Publishing.
CMEA. 2011. Masterplan for the Acceleration and Expansion of Indonesia Economic Development, edited by the Deputy Minister for Coordinating Infrastructure and Regional Development, Coordinating Ministry for Economic Affairs of Indonesia.
Bibliography 195
Cochrane, G. 2012. The Greater Mekong Sub-Region at 20. Japan’s Role in the Region and its Implications for Regional Integration. Centre for East and Southeast Asian Studies. Lund, Sweden, Lund University.
Cohen, J.P. & Morrison Paul, C.J. 2007. Agglomeration, Productivity and Regional Growth. Production Theory Approaches. Davis, California, United States of America, University of Hartford and University of California. September 2008.
Collier, P. & O’Connell, S. 2007. Opportunities and choices. In The Political Economy of Economic Growth in Africa, 1960–2000. Cambridge, United Kingdom, Cambridge University Press.
De, P. 2013. Connectivity, Trade Facilitation and Regional Cooperation in South Asia. New Delhi, Commonwealth Secretariat.
DFID. 2012. Business Case and Intervention Summary. Southern Agricultural Growth Corridor in Tanzania (SAGCOT).London, Department for International Development.
DFID. 2013. Annual Review of the Beira Agricultural Growth Corridor (BAGC) Project. Review undertaken on 30 April. London, Department for International Development.
Dicken, P., Peck, J. & Tickell, A. 1997. Unpacking the global, In R. Lee. & J. Wills, eds. Geographies of Economies. London, Edward Arnold.
Domínguez-Torres, C. & Briceño-Garmendia, C. 2011. Mozambique’s Infrastructure. A Continental Perspective. Washington, DC, International Bank for Reconstruction and Development /World Bank. Available at: http://siteresources.worldbank.org/MOZAMBIQUEEXTN/Resources/AICD-Mozambique_Country_Report.pdf
Du Pisanie, J.A. 2002. Competition versus Co-Operation the Case of SADC’s Regional Development Corridors. South African J. Economics, 70(2): 145–154. March. Oxford, United Kingdom, Blackwell Publishing Ltd.
Durchslag, S. Rao, A. & Puri T. 1994. The promise of infrastructure privatization. McKinsey Quarterly. February.
Easterly, W. & Levine, R. 1998. Troubles with the Neighbours. Africa’s Problem, Africa’s Opportunity. J. African Economies, 7(1): 120–142.
Easterly, W. & Levine, R. 2001. What have we learned from a decade of empirical research on growth? It’s Not Factor Accumulation: Stylized Facts and Growth Models. The World Bank Economic Review, 15(2): 177–219.
EC. 1999. ESDP. European Spatial Development Perspective. Towards Balanced and Sustainable Development of the Territory of the European Union. Committee on Economic Development of the EC. Agreed at the Informal Council of Ministers responsible for Spatial Planning in Potsdam, May.
EC. 2004. The Patient Capital Initiative. A Proposal for a Global Renewable Energy Fund of Funds in the Context of the Johannesburg Renewable Energy Coalition. Brussels, European Commission.
EC. 2013. European Commission (2/02/2013) Science for Environment Policy. Issue 318, DG Environmental News Alert Service. Brussels, European Commission.
ECDPM. 2013. Corridors of power or plenty? Lessons from Tanzania and Mozambique and implications for CAADP. Discussion Paper 138. Maastricht, the Netherlands, European Centre for Development Policy Management.
ERIA. 2008. The Mekong-India Economic Corridor. Concept Paper. ERIA Research Project Report 2008-4-2. Economic Research Institute for ASEAN and East Asia.
Making economic corridors work for the agricultural sector196
Ernst & Young. 2011a. Eye on Africa: how to write yourself into the African growth story. Special Issue, December/January 2011. Available at: http://www.ey.com/Publication/vwLUAssets/Eye_special_ed_Africanm_Growth_Story/$FILE/Eye_special_ed_African_Growth_Story.pdf
Ernst & Young. 2011b. An African dawn. Dynamics, 4: 30, September 2011. Available at: http://www.ey.com/Publication/vwLUAssets/Dynamics_Growing_international_development_Brick_by_brick/$FILE/Dynamics_Growing_international_development_Brick_by_brick.pdf
FAO. 2001. Agricultural and Rural Extension Worldwide. Options for Institutional Reform in the Developing Countries, by W.M. Rivera, M.K. Qamar & L.Van Crowder. Rome. Available at: ftp://ftp.fao.org/docrep/fao/004/y2709e/y2709e.pdf
FAO. 2006. Agro-industrial parks. Experience from India, by K. Laxminarayana Rao. Agricultural and Food Engineering Working Document 3. Rome. Available at: http://www.fao.org/ag/ags/publications/docs/AGST_WorkingDocuments/J7714_e.pdf
FAO. 2007. Guidelines for rapid appraisals of agrifood chain performance in developing countries, by C.A. da Silva & H.M. de Souza Filho. Agricultural Management, Marketing and Finance Occasional Paper 20. Rural Infrastructure and Agro-Industries Division. Rome. Available at: http://www.fao.org/docrep/010/a1475e/a1475e00.htm
FAO. 2009a. High food prices and the food crisis – Experiences and lessons learned. The State of Agricultural Commodity Markets 2009. Rome. Available at: ftp://ftp.fao.org/docrep/fao/012/i0753e/i0753e00.pdf
FAO. 2009b. How to feed the world in 2050. Based on J. Schmidhuber, J. Bruinsma & G. Baedeker. 2009. Capital requirements for agriculture in developing countries to 2050. Presented at the Expert Meeting on “How to feed the world in 2050”. FAO, 24–26 June. Rome. Available at www.fao.org/fileadmin/templates/wsfs/docs/expert_paper/How_to_Feed_the_World_in_2050.pdf
FAO. 2010. Agro-based clusters in developing countries: staying competitive in a globalized economy, by E. Gálvez-Nogales. Agricultural Management, Marketing and Finance Occasional Paper 25. Rural Infrastructure and Agro-Industries Division. Rome. Available at: http://www.fao.org/docrep/012/i1560e/i1560e.pdf
FAO. 2011. The rise of agrifood technopoles in the Middle East and North Africa, by E. Gálvez-Nogales. Agricultural Management, Marketing and Finance Working Document 30. Rural Infrastructure and Agro-Industries Division. Rome. Available at: http://www.fao.org/docrep/016/ap292e/ap292e.pdf
FAO. 2012a. Trends and impacts of foreign investment in developing country agriculture. Evidence from case studies. Rome. Available at: http://www.fao.org/fileadmin/user_upload/newsroom/docs/Trends %20publication %2012 %20November %202012.pdf
FAO. 2012b. The State of Food and Agriculture 2012. Rome. Available at:http://www.fao.org/docrep/017/i3028e/i3028e.pdfFAO. 2012c. Voluntary Guidelines on the Responsible Governance of Tenure of Land,
Fisheries and Forests in the Context of National Food Security. Rome. Available at: http://www.fao.org/nr/tenure/voluntary-guidelines/en/
FAO. 2012d. Guiding principles for responsible contract farming operations. Pultrone, C., Da Silva, C.A. & Shepherd, A. Rome: Food and Agriculture Organization of the United Nations, FAO. Available at: http://www.fao.org/docrep/016/i2858e/i2858e.pdf
Bibliography 197
FAO, IFAD, UNCTAD & the World Bank. 2010. Principles for Responsible Agricultural Investment that Respects Rights, Livelihoods and Resources. Rome, FAO, International Fund for Agricultural Development, the UNCTAD Secretariat and the World Bank Group. Available at: http://www.fao.org/fileadmin/templates/est/INTERNATIONAL-TRADE/FDIs/RAI_Principles_Synoptic.pdf
FAO & UNIDO. 2009. Agro-industries for development. C.A. Da Silva, D. Baker, A. Shepherd & S. Miranda-da-Cruz, eds. Oxfordshire and Cambridge, The Food and Agriculture Organization of the United Nations and The United Nations Industrial Development Organization, by arrangement with CAB International. Available at: http://www.fao.org/docrep/013/i0157e/i0157e00.pdf
Farooki, M. 2012. Policy Arena. The Infrastructure and Commodities Interface in Africa. Time for Cautious Optimism? J. International Development, 24: 208–219. Development Policy and Practice Group, Open University, Milton Keynes, United Kingdom.
Fergie J.A. & Satz, M. 2007. Harvesting Latin America’s agribusiness opportunity. McKinsey Quarterly, March. Available at: https://www.mckinseyquarterly.com/Harvesting_Latin_Americas_agribusiness_opportunity_1970
Fujimura, M. & Edmonds, C. 2008. Road Infrastructure and Regional Economic Integration. Evidence from the Mekong. In D.H. Brooks & J. Menon, eds. Infrastructure and Trade in Asia. Cheltenham, United Kingdom, Edward Elgar Publishing.
Fullbrook, D. 2007. Contract Farming in Lao PDR. Cases and Questions. Produced by the Laos Extension for Agriculture Project (LEAP) for the Government-Donor Sub Working Group on Farmers and Agribusiness. October.
G8. 2012. G8 Cooperation Framework to Support The “New Alliance for Food Security and Nutrition” in Tanzania. Available at: http://www.usaid.gov/sites/default/files/documents/1868/TanzaniaCooperationFramework.pdf
GAA. 2012. Growth Corridor Plans. Managing Melbourne’s Growth. Melbourne, Australia, Growth Areas Authority.
Giordano, P. 2012. Investing in integration. Institute for the Integration of Latin American and the Caribbean (INTAL), IaDB. Integration & Trade Journal, 34(16): 47–67. January–June. Available at: http://www.iadb.org/intal/intalcdi/integracion_comercio/i_INTAL_IYT_34_2012_Giordano.pdf
GMF. 2013. The New Alliance for Food Security and Nutrition. Pushing the Frontier of Enlightened Capitalism, by J.M. White. Washington, DC, German Marshall Fund of the United States.
Government of Tanzania. 2012. Environmental and Social Management Framework (ESMF) of the Southern Agricultural Growth Corridor of Tanzania (SAGCOT). Report prepared by Environmental Resources Management Ltd. July. Available at: http://letstalklandtanzania.com/s/download/reports/SAGCOT%20Environmental %20and %20Social %20Management %20Framework.pdf
Hallam, D. 2011. International investment in developing country agriculture – issues and challenges. Food Security J., 3 (Suppl. 1): 91–98.
Harrison, A. & Rodríguez-Clare, A. 2009. Trade, Foreign Investment, and Industrial Policy for Developing Countries. NBER Working Paper 15261. Cambridge, Massachusetts, United States of America, The National Bureau of Economic Research.
Healey, P. 2004. The Treatment of Space and Place in the New Strategic Spatial Planning in Europe. International J. Urban and Regional Research, 28(1): 45–67. February.
Making economic corridors work for the agricultural sector198
Hubbard, T.N. 2001. Contractual form and market thickness in trucking. RAND J. Economics, 32(2): 369–86. Summer.
IaDB. 2011. Sector Strategy to Support Competitive Global and Regional Integration. Vice-Presidency for Sectors and Knowledge, Integration and Trade Sector of IaDB. Washington, DC, Inter-American Development Bank.
IDB. 2011. A study of international transport corridors in OIC member countries. Jeddah, Saudi Arabia, Islamic Development Bank.
IIRSA. 2010. Agenda de Implementación Consensuada 2005–2010. Informe de Evaluación. Initiative for the Integration of Regional Infrastructure in South America. Buenos Aires, Institute for the Integration of Latin American and the Caribbean (INTAL).
Infante, I. 2012. The Mesoamerican Integration Corridor. Integrating Mesoamerica through the Pacific. Integration & Trade Journal, 34: 69–78. January–June. Institute for the Integration of Latin America and the Caribbean (IDB-INTAL). Available at: http://idbdocs.iadb.org/wsdocs/getdocument.aspx?docnum=36877594
Ishida, M. 2009. Special Economic Zones and Economic Corridors. ERIA Discussion Paper Series 16/2009. Bangkok, IDE-JETRO.
Ishida, M. 2012. Emerging Economic Corridors in the Mekong Region. BRC Research Report 8. Bangkok Research Center. Bangkok, IDE-JETRO.
Jenkins, B. 2012. Mobilizing the Southern Agricultural Growth Corridor of Tanzania. A Case Study. The Corporate Social Responsibility (CSR) Initiative at the Harvard Kennedy School. Cambridge, Massachusetts, United States of America.
Kaarhus, R., Haug, R., Hella, J.P. & Makindara, J.R. 2010. Agro-investment in Africa – Impact on land and livelihoods in Mozambique and Tanzania. Noragric Report 53. August. Department of International Environment and Development Studies (Noragric), Norwegian University of Life Sciences.
Kaarhus, R. & Woodhouse, P. 2012. Development of National Producer Organizations and Specialized Business Units in Mozambique. Noragric Report 63. January. Department of International Environment and Development Studies (Noragric), Norwegian University of Life Sciences.
Karlsson, C. 2008. Handbook of Research on Cluster Theory. Cheltenham, United Kingdom, Edward Elgar Publishing Limited.
Katz, B. & Wagner, J. 2008. Transformative Investments. Remaking American Cities for a New Century. ETHOS, World Cities Summit Issue, June. Singapore, Centre for Governance and Leadership, Civil Service College.
Krugman, P. 1991. Increasing Returns and Economic Geography. J. Political Economy, 99(3): 483–499. June.
Kuncoro, M. 2013. Economic Geography of Indonesia. Can MP3EI Reduce Inter-Regional Inequality? South East Asia Journal of Contemporary Business, Economics and Law, 2(2). June.
Kuroiwa, I. 2012. Economic Integration and the Location of Industries. The Case of Less Developed East Asian Countries. London, IDE-JETRO.
Lewis, O. 1969. The culture of poverty. In D.P. Moynihan, ed. On Understanding Poverty: Perspectives from the Social Sciences, pp. 187–200. New York, Basic Books.
Lippman, S. & McCall, J. 1986. An operational measure of liquidity. American Economic Review, 76(1): 43–55.

Bibliography 199
Luiz, J.M. 2003. The relevance, practicality and viability of spatial development initiatives: a South African case study. Public Administration and Development, 23(5): 433–443. December.
Malik, U.S., Ahmed, M., Sombilla, M.A. & Cueno, S. L. 2009. Biofuels production for smallholder producers in the Greater Mekong Sub-region. Applied Energy, 86: 58–68.
Manorom, K., Hall, D., Lu, X., Katima, S., Medialdia, M.T., Siharath, S. & Srisuphan, P. 2010. Cross-border contract farming arrangements. Variations and implications in the Lao People’s Democratic Republic. J. Greater Mekong Subregion Development Studies, 5: 33–54. December. Manila.
Marín-Quemada, J.M., García-Verdugo, J. & Escribano, G. 2012. Energy Security for the EU in the 21st Century. Markets, Geopolitics and Corridors. London and New York, Routledge.
Marrian, B. 2001. Towards a general theory of corridor development in South Africa. Paper presented at the 20th Annual South African Transport Congress, 16–20 July, South Africa. Available at: ol.up.ac.za/upspace/bitstream/2263/8193/1/5b6.pdf
Marshall, A. 1890. Principles of Economics. London, MacMillan.Mavrakis, D., Thomaidis, F. & Ntroukas, I. 2006. An assessment of the natural gas
supply potential of the south energy corridor from the Caspian Region to the EU. Energy Policy 34(13): 1671-1680, February 2006.
McDonald, J. & McMillen, D. 2007. Urban Economics and Real Estate. Theory and Practice. Hampshire, United Kingdom, Blackwell Press.
Meadowcroft, J. 2007. Who is in Charge here? Governance for Sustainable Development in a Complex World. J. Environmental Policy & Planning, 9: 3–4.
Meeuws, R. 2004. Mozambique – Trade and Transport Facilitation Audit. Available at: http://siteresources.worldbank.org/INTTLF/Resources/Mozambique_Final_Report.pdf
Menon, J. 2009. Regional efforts to create an attractive investment climate. Presentation at the Second OECD-Southeast Asia Regional Forum “Enhancing Competitiveness through Regional Integration”, 27–28 April, Bangkok.
Milder, J.C., Buck, L.E., Hart, A.K. & Scherr, S.J. 2012. The SAGCOT Greenprint. A Green Growth Investment Framework for the Southern Agricultural Growth Corridor of Tanzania. August. Dar es Salaam, United Republic of Tanzania, SAGCOT. (draft)
Miller, C. & Jones, L. 2010. Agricultural Value Chain Finance. Tools and Lessons. Rome, Food and Agriculture Organization of the United Nations and Bourton on Dunsmore, Rugby, Warwickshire, United Kingdom, Practical Action Publishing.
Ministry of Agriculture of Mozambique. 2010. Strategic Plan for Agricultural Development. PEDSA 2010–2019. Available at: http://aec.msu.edu/fs2/mozambique//caadp/PEDSA_FINAL-English_22_Nov.pdf
Morgan, K. 2008. Greening the Realm. Sustainable Food Chains and the Public Plate. Regional Studies, 42(9): 1237–1250.
Myrdal, G. 1957. Economic Theory and Underdeveloped Regions. London, Duckworth.Nguyen, T.N. & Ha-Duong, M. 2009. Economic potential of renewable energy in
Vietnam’s power sector. Energy Policy, 37(5): 1601–1613.OECD. 2013. OECD Investment Policy Reviews. Tanzania. Working draft. Paris,
Organisation for Economic Co-operation and Development.

Making economic corridors work for the agricultural sector200
Ohio State University (OSU). n.d. Soil Carbon Sequestration Fundamentals, by A. Sundermeier, R. Reeder & R. Lal. Columbus, Ohio, United States of America. Available at: http://ohioline.osu.edu/aex-fact/pdf/0510.pdf
Ottaviano, G. & Thisse, J-F. 2004. Agglomeration and Economic Geography. In J.V. Henderson & J.F. Thisse, eds. Handbook of Regional and Urban Economics. Vol. 4. Oxford, United Kingdom, Elsevier.
Pannell, D.J. & Schilizzi, S. 1999. Sustainable Agriculture. A Matter of Ecology, Equity, Economic Efficiency or Expedience? J. Sustainable Agriculture, 13(4): 57–66.
Panzar, J.C. & Willig, R.D. 1981. Economies of Scope. American Economic Review 71(2): 268–272. Papers and Proceedings of the Ninety-Third Annual Meeting of the American Economic Association. May.
Pingali, P. 2001. Environmental consequences of agricultural commercialization in Asia. Environment and Development Economics, 6(4): 483–502.
Porter, M.E. 1998. Clusters and the new economic of competition. Harvard Business Review.
Ramachandran, P. & Linde, L. 2011. Integrating spatial support tools into strategic planning. SEA of the GMS North-South Economic Corridor Strategy and Action Plan. Environmental Impact Assessment Review, 31(6): 602–611. November. Oxford, United Kingdom, Elsevier.
Reardon, T. & Barrett, C.P. 2000. Agroindustrialization, Globalization, and International Development. An Overview of Issues, Patterns, and Determinants. Agricultural Economics, 23(3): 195–205.
Reardon, T., Pingali, P. & Stamoulis, K. 2006. Impacts of Agrifood Market Transformation during Globalization on the Poor’s Rural Nonfarm Employment. Lessons for Rural Business Development Programs. Michigan State University and FAO. Plenary Paper presented at the 2006 meeting of the International Association of Agricultural Economists, Queensland, Australia, 12–18 August.
Reardon, T., Timmer, C.P., Barrett, C.B. & Berdegué, J. 2003. The Rise of Supermarkets in Africa, Asia and Latin America. American J. Agricultural Economics, 85(5): 1140– 1146.
Reardon, T., Timmer, C.P. & Minten, B. 2010. Supermarket revolution in Asia and emerging development strategies to include small farmers. P. Pingali, ed. Proceedings of the National Academy of Sciences of the United States of America (PNAS). Early Edition, approved 12 October (received for review 10 March). Seattle, United States of America, Bill and Melinda Gates Foundation. Available at: www.pnas.org/cgi/doi/10.1073/pnas.1003160108
Reilly, J. 2013. China and Japan in Myanmar. Aid, Natural Resources and Influence. Asian Studies Review, 37(2): 141–157.
Riordan, J.T., Vásquez, E., van Haetnen, R., Mann, F. & Figueroa, C. 2003. Attacking poverty. A market approach. Lima, University of the Pacific/Universidad del Pacífico and the United States Agency for International Development.
Roberts, M. & Deichmann, U. 2011. International Growth Spillovers, Geography and Infrastructure. The World Economy, 34(9): 1507–1533.
Rodrigue, J-P., Comtois, C. & Slack, B. 2009. The Geography of Transport Systems. New York, Routledge.

Bibliography 201
Ruben, R., Slingerland, M. & Nijhoff, H. 2006. Agro-food chains and networks for development, 1–25. The Netherlands, Wageningen, Wageningen University and Research Centre.
Sachs, J.D. & Warner, A.M. 1995. Natural Resource Abundance and Economic Growth. Development Discussion Paper 517a. United States of America, Harvard Institute for International Development.
Sachs, J.D. & Warner, A.M. 2001. The curse of natural resources. European Economic Review, 45: 827–838.
SAGCOT. n.d. Southern Agricultural Growth Corridor of Tanzania. Membership Principles and Obligations. Available at: www.sagcot.com/uploads/media/SAGCOT_Partnership_principles.pdf
SAGCOT. 2010. Concept note. May. Available at: http://www.agdevco.com/sysimages/sagcot_concept_note_rpt14.pdf
SAGCOT. 2011. Southern Agricultural Growth Corridor of Tanzania. Investment Blueprint. January. Available at: http://www.sagcot.com/uploads/media/Invest-Blueprint-SAGCOT_High_res.pdf
Sanghvi, S., Simons, R. & Uchoa, R. 2011. Four lessons for transforming African agriculture. Mckinsey Quarterly, 1–11. April.
Shepley, S., Souksavat, O., Tola, P., Quang, T.L., Bajracharya, S.L., Sharma, S. & Boswell, M. 2009. Developing Sustainable Pro-poor Biofuels in the Mekong Region and Nepal. A holistic approach looking at smallholder benefits from an economic, social and environmental point of view. SNV (Netherlands Development Organization) and the World Wide Fund for Nature (WWF).
Shrestha, O.L. & Chongvilaivan, A. eds. 2013. Greater Mekong Subregion. From Geographical to Socio-economic Integration. Institute of Southeast Asian Studies. Singapore, ISEAS Publishing.
Sovacool, B.K. & Bulan, L.C. 2012. Energy security and hydropower development in Malaysia. The drivers and challenges facing the Sarawak Corridor of Renewable Energy (SCORE). Renewable Energy, 40(1): 113–129. April.
Strategic Asia. 2012. Implementing Indonesia’s Economic Master Plan (MP3EI). Challenges, Limitations and Corridor Specific Differences. June.
Streeck, W. & Mertens, D. 2011, Fiscal Austerity and Public Investment. Is the Possible the Enemy of the Necessary? MPIfG Discussion Paper. Available at SSRN: http://ssrn.com/abstract=1894657
Teece, D.J. 1980. Economies of scope and the scope of the enterprise. J. Economic Behavior and Organization 1(3): 223–247. September.
Telser, L.G. 1981. Why there are Organized Futures Markets. J. Law and Economics XXIV(1): 1–22, April.
The Economist. 1977. “The Dutch Disease”, 26 November.Theting, H. & Brekke, B. 2010. Land investments or land grab? A critical view from
Tanzania and Mozambique. Oslo, Spire.Thomas, R.H. 2009. Development Corridors and Spatial Development Initiatives in
Africa. January. Travers, R. 2008. Economic Corridor and Ecotourism. Whither Tourism in Laos? In J.
Cochrane, ed. Asian Tourism. Growth and Change. Oxford, United Kingdom, Elsevier.

Making economic corridors work for the agricultural sector202
UNCTAD. 2004. Expert Meeting on Design and Implementation of Transit Transport Arrangements, 24–26 November. New York and Geneva, United Nations Conference on Trade and Development.
UNCTAD. 2008. Trade facilitation opportunities for landlocked and transit developing countries. Global preparatory meeting on the midterm review of the implementation of the Almaty Programme of Action, Geneva, 8–9 July 2008. Chair’s summary. UNCTAD/DTL/TLB/MISC/2008/2. New York and Geneva, United Nations Conference on Trade and Development.
UNCTAD. 2009a. World Investment Report 2009. Transnational Corporations, Agricultural Production and Development. New York and Geneva, United Nations Conference on Trade and Development.
UNCTAD. 2009b. Freedom of Transit. UNCTAD Trust Fund for Trade Facilitation Negotiations Technical Note 8. New York and Geneva, United Nations Conference on Trade and Development.
UNCTAD. 2011. World Investment Report 2011. New York and Geneva, United Nations Conference on Trade and Development.
UNCTAD. 2012. World Investment Report 2012. Towards a New Generation of Investment Policies. New York and Geneva, United Nations Conference on Trade and Development.
UNDP. 2011. UNDP’s Enhanced Economic Growth Programme in Ethiopia 2010–2011. An Evaluation of Two Outcomes. Economic Growth Corridor & Private Sector Development, by J.H. van Leeuwen & B. Tadesse. Final Report. December.
UN ESCAP. 2007. Toward an Asian Integrated Transport Network (2nd ed.). Transport Division, Asian Institute of Transport Development (AITD). UN ESCAP ST/ESCAP/2399. Bangkok, United Nations Economic and Social Commission for Asia and the Pacific.
UN-HABITAT. 2010a. State of the World Cities 2010/2011. Bridging the Urban Divide. Kenya, United Nations Agency for Human Settlements.
UN-HABITAT. 2010b. (The) State of African Cities 2010. Governance, Inequality and Urban Land Markets. Kenya, United Nations Agency for Human Settlements.
UN-HABITAT. 2012. State of the World’s Cities Report 2012/2013. Prosperity of Cities. Kenya, United Nations Agency for Human Settlements.
USAID. 2000. Zona Paz Economic Corridor Strategy. Concept Paper. Guatemala-CAP Income Generation Activities Project (AGIL) Guatemala City, United States Agency for International Development office, Guatemala.
USAID. 2003. Implementing policy reform. Results and reflections on the Honduras PEP Experience. Honduras Policy Enhancement and Productivity Project. Final Report. December. Tegucigalpa, Honduras. United States Agency for International Development office, Honduras.
USAID. 2005. Peru PRA Project Annual Report FY2005. Lima, United States Agency for International Development office, Peru.
USAID. 2006. Peru PRA Project Annual Report FY2006. Lima, United States Agency for International Development office, Peru.
USAID. 2008a. The Peru Poverty Reduction and Alleviation (PRA) Project. Submitted by Chemonics International Inc. to the United States Agency for International Development office, Peru. September.

Bibliography 203
USAID. 2008b. Final Evaluation of USAID/Peru Poverty Reduction and Alleviation (PRA) Activity. Final Report. Submitted by Weidemann Associates, Inc. to the United States Agency for International Development office, Peru. May.
USAID. 2009. Biofuels in Asia. An Analysis of Sustainability Options. Bangkok, United States Agency for International Development, Regional Development Mission for Asia.
USAID. 2010. Peru PRA Project Annual Report FY 2010. New Private Sector Competitiveness and Poverty Reduction and Alleviation Activity. Lima, United States Agency for International Development.
USAID. 2012. Trust Deed of SAGCOT Catalytic Trust Fund. Dar es Salaam, United Republic of Tanzania, United States Agency for International Development.
VCC & WAIPA. 2010. Investment Promotion Agencies and Sustainable FDI. Moving toward the fourth generation of investment promotion. Report of the findings of the Vale Columbia Center on Sustainable International Investment (VCC) and the World Association of Investment Promotion Agencies (WAIPA). Available at: http://www.vcc.columbia.edu/files/vale/content/IPASurvey.pdf
WEF. 2010. Realizing a New Vision for Agriculture. A roadmap for stakeholders. Prepared in collaboration with McKinsey & Company. Geneva, World Economic Forum.
WEF. 2012. Putting the New Vision for Agriculture into Action. A Transformation is Happening. A report by the World Economic Forum’s New Vision for Agriculture Initiative. Prepared in collaboration with McKinsey & Company. Geneva, World Economic Forum.
WEF. 2013. Achieving the New Vision for Agriculture. New Models for Action. A report by the World Economic Forum’s New Vision for Agriculture Initiative. Prepared in collaboration with McKinsey & Company. Geneva, World Economic Forum.
Wells, L. & Wint, A. 2000. Marketing a country: promotion as a tool for attracting foreign investment. Washington, DC, International Finance Corporation.
Williamson, O.E. 1973. Markets and Hierarchies. Some Elementary Considerations. The American Economic Review, 63(2): 316–325. Papers and Proceedings of the 85th
Annual Meeting of the American Economic Association. May.Williamson, O.E. 1975. Markets and Hierarchies. Analysis and Antitrust Implications.
New York, Free Press. Williamson, O.E. 1985. The Economic Institutions of Capitalism. New York,
Free Press.Williamson, O.E. 1996. The Mechanisms of Governance. New York, Oxford
University Press.Wilson, W.J. 1987. The Truly Disadvantaged. The Inner City, the Underclass and Public
Policy. Chicago, United States of America, University of Chicago Press. World Bank. 1998. Financial Intermediary Lending. Operational Policy OP 8.30.
Washington, DC. World Bank. 2008a. World Development Report 2008. Agriculture for Development.
Washington, DC. World Bank. 2008b. Providing for the people: policy note on utility service reform in
Mauritania’s Mining Corridor. A Poverty and Social Impact Analysis. Report 40019-MR, Mauritania. Washington, DC.
World Bank. 2009a. World Development Report 2009. Reshaping Economic Geography. Washington, DC.

Making economic corridors work for the agricultural sector204
World Bank. 2009b. Awakening Africa’s Sleeping Giant. Prospects for Commercial Agriculture in the Guinea Savannah Zone and Beyond. Washington, DC.
World Bank. 2010. Prospects for Growth Poles in Mozambique. The World Bank Finance and Private Sector Development Africa Region. August. Washington, DC.
Wright, G. & Czelusca, J. 2004. The myth of the resource curse. Challenge, 47(2): 6–38. March/April.
Yeung, H.W. 1998. Capital, State and Space. Contesting the Borderless World. Transactions of the Institute of British Geographers, 23(3): 291–309.
Zola. 2009. A Preliminary Assessment of Contract Farming Arrangements and Plantations in the Agriculture and Natural Resources Sector of Southern Lao PDR. Vientiane.

Food and Agriculture Organization of the United Nations (FAO)Viale delle Terme di Caracalla, 00153 Rome, Italywww.fao.org
4
I4204E/1/11.14
ISSN 2304-5191ISBN 978-92-5-108636-0
9 7 8 9 2 5 1 0 8 6 3 6 0
Making economic corridors workfor the agricultural sector
Developing countries are increasingly using agrocorridors to develop their agricultural sectors. These corridors promote inclusive agribusiness growth, building on a linear agglomeration of people and activities along existing transportation infrastructure.
Based on initiatives in Central Asia, the Greater Mekong Subregion, Indonesia, Mozambique, Peru and the United Republic of Tanzania, this report shows how agrocorridors help improve physical connectivity and functioning of markets, while generating economies of scale in agriculture. Agrocorridors do this because they integrate public and private investments in “hardware” (transport and agribusiness infrastructure), “software” (policy and regulatory framework) and “orgware” (institutional strengthening and capacity building).
The goal of the book is to provide policy-makers and practitioners with a series of evidence-based, practical instruments (a checklist and a good practices tool) to guide the design and implementation of agrocorridors.
Agribusinessand FoodIndustries
Series