making distribution logistics in big cities more sustainable: rail
TRANSCRIPT
Making distribution logistics in big cities more sustainable:
rail transport solutions
Francesco FilippiCentre for Transport and LogisticsUniversity of Rome La Sapienza

Current trends
The correlation between economic growthand transport demand can hardly be questioned. Technological innovation in propulsion systems and fuels can only partially offset the growth of environmental impacts from growth of transport demand, in particular CO2 emissions.

The SPRITE project
SPRITE, Separating the Intensity of Transport from Economic Growth,addressed the issue of decoupling of transport growth from economic growth.
Funded by the European Commission within the Key Action on Sustainable Mobility and Intermodality of the Fifth Framework Programme.

Decoupling as a policy objective
It means separation of economic growth from the negative externalities of transport.This objective together with that of improving economic efficiency ensures that society as a whole is better off. Any policy intervention leaves winners and losers. Thus, there is a third objective, equity.

The villain
Road traffic causes the most negative externalities.
Trucks are the worst air and noise polluters.
The presence of trucks in communities and neighbourhoods is ranked high on lists of factors that cause concern.
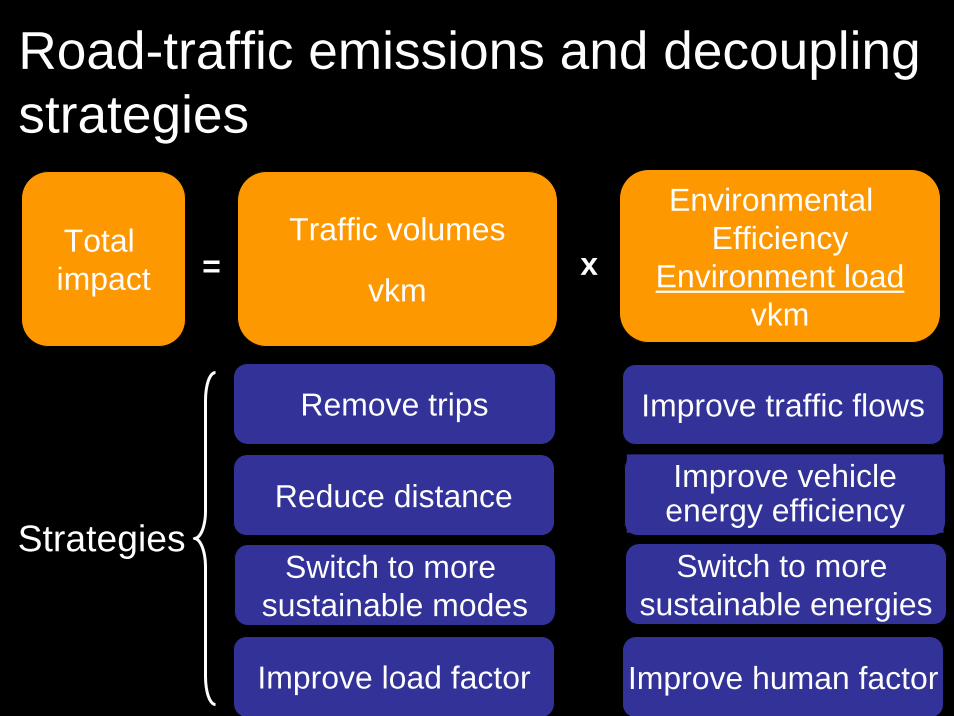
Road-traffic emissions and decoupling strategies
Strategies
Improve traffic flows
Total impact
Environmental Efficiency
Environment loadvkm
Traffic volumes
vkm= x
Remove trips
Reduce distance
Switch to more sustainable modes
Improve load factor
Improve vehicle energy efficiency
Improve human factor
Switch to more sustainable energies

Can rail save the city?
Yes, if the rail is a “more sustainable mode”:• Better energy efficiency• More sustainable energies for traction• Less noise• Fewer accidents
But also if it is economically efficient and does not pose equity problems.

Comparing rail and road freight
Mode Cost Fuel HC CO NOx
Cents Gallons Lb Lb Lb
Rail 2.53 0.005 0.46 0.64 1.83
Truck 5.35 0.017 0.63 1.90 10.17
Unit ton-mileSource: TRB (2001)

The right comparison
• well-defined, homogeneous, and competing markets;
• complete transport chains; • anticipated future environmental
performance of the two modes.

CO2 emissions (bulk goods)
0
20
40
60
80
100
Truck > 20 t Freight train(electric)
Freight train(diesel)
Average kg/1000 t-km for long distance freight transport
Source: CE (2003)
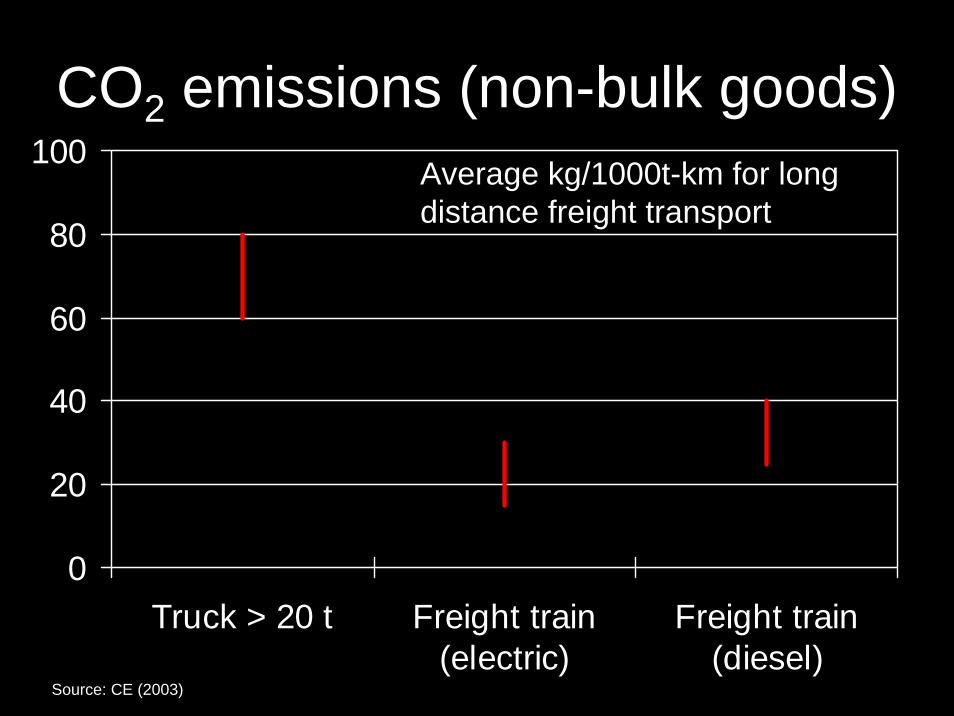
CO2 emissions (non-bulk goods)
0
20
40
60
80
100
Truck > 20 t Freight train(electric)
Freight train(diesel)
Average kg/1000t-km for long distance freight transport
Source: CE (2003)

Primary energy consumption
Swap body
Rolling highway
1129Truck
0 20 40 60 80 100
Antwerp–Busto Arsizio
Munich–Verona
Nuremberg–Verona
Milan–Bari
Manching–Brennersee
Szeged–Wels
Source: IRU/BGL (2002)

Noise
Trains and trucks have comparable levels of noise. Although at high speed trains can be louder, the noise can easily be contained and the corridor insulated. It cannot spread like the noise of trucks on the street.

Safety• Rail accidents, much rarer than road, on the
order of 1/100 per tkm, are sometimes more catastrophic and always get more media coverage.
• The drive to make rail even safer adds costs and constraints that are not consistently applied to roads.
• Road vehicles have the ‘privilege’ of being allowed to operate at much higher levels of risk. This is one reason why they are often quicker, cheaper, and more convenient.

Rail economic efficiency in EU
• a fluid, cross-border has not been realized; • decline of market share is continuing under
open access;• few new entrants and little competition;• failure to respond to changing market; • offer of undifferentiated, non-transparent, and—
in shippers’ eyes—inflexible transport service; • governments subsidize large unmet costs.

Rail economic efficiency in US• strong competition for almost 25 years;• mergers have produced savings in
administration, operations, and capital asset requirements;
• legislation has encouraged shedding unprofitable traffic and more investment;
• changed labour environment has allowed massive technology improvements;
• operators are addressing intermodal, door-to-door customer solutions.

0 1 2 3 4 5 6 7
USAU
SwedenSpain
ItalyGermany
UKFranceAustria
Switzerland
Rail freight charges (US cents per tkm)
Source: UIC International Railway Statistics 1998; Mercer analysis; company annual reports.

EU and US railway trendsEU Rail’s share of the freight market
has dwindled by almost 1% each year to just 8%, as against 30% three decades ago.
US In the same period, rail traffic has increased by more than half, with a market share of around 42%.

Rail productivity in EU and US
0
2
4
6
8
10
12
EU 15 US
Million UT/employee 1998
Source: EU Energy & Transport in Figures, 2001

The equity objective
Rail’s productivity is related to the high concentration of traffic. The impact of the road-traffic generation of rail-linked city terminals is a constraint on the wider acceptance and implementation of a rail strategy. Rail’s capabilities and environmental credentials can be undermined by city-planning concernsabout the level of road traffic around a terminal in an urban area.

Some international rail initiatives
ACTS Abroll Container Transport System CH
Cargo Domino CH
SNCF-Fret Freight stations F
Waste Material Transport J
Waste Material Transport I
Urban Distribution I
A rail solution in Italy
Italian State Railways
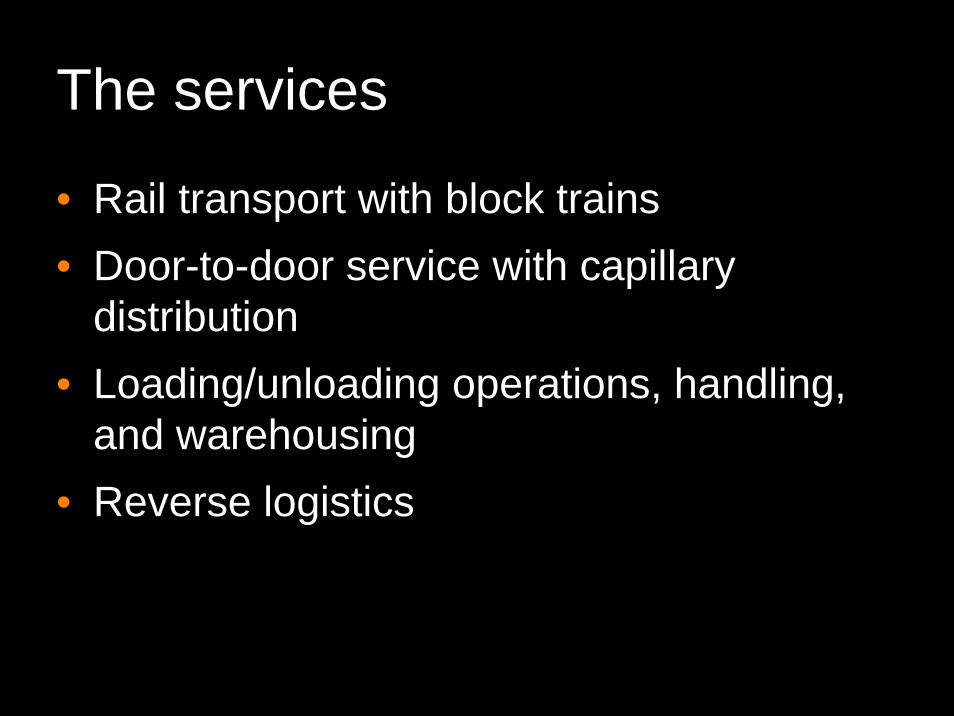
The services
• Rail transport with block trains• Door-to-door service with capillary
distribution• Loading/unloading operations, handling,
and warehousing• Reverse logistics
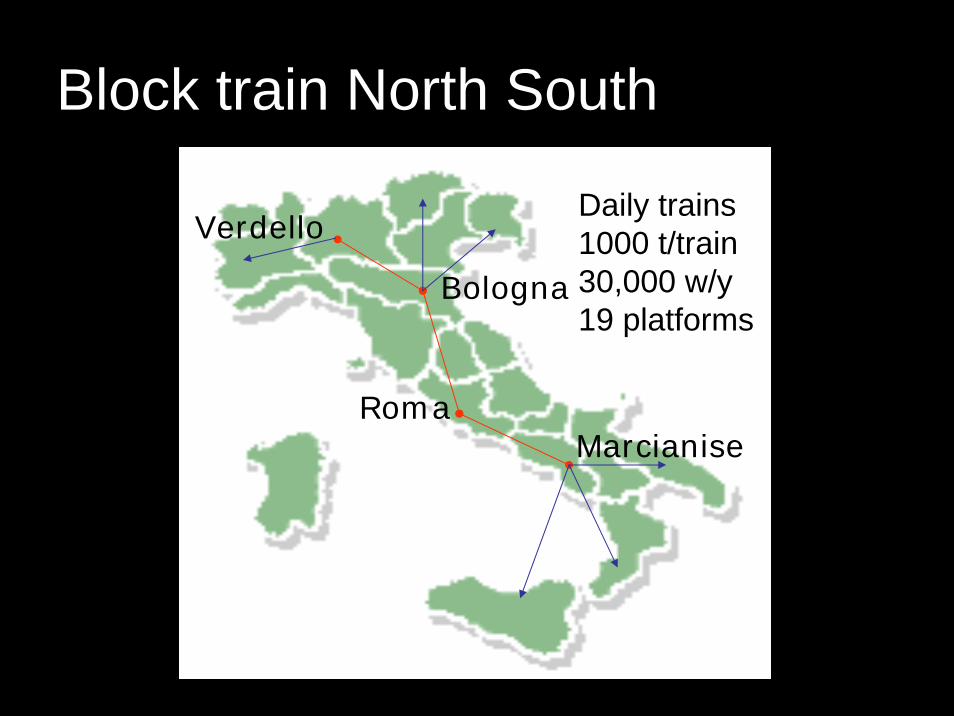
Block train North South
Roma
Bologna
Verdello
Marcianise
Daily trains1000 t/train30,000 w/y19 platforms

Main kinds of freight
• Mineral water
• Paper and products
• Fruit juice and preserved foods
• Misc. non-food products for large retailers
• Cement

The supply chain
Train from Bologna to Roma S. Lorenzo freight terminal
OMNIARome city centerDistribution 3P C
3P Carrier
3P Carrier
OMNIA
TCTCTC
TCTCTC
TCTCTCRoma S. Lorenzo freight terminal wagon unloading, truck loading for distribution
Bologna freight villagewagon loading and composition of a Trenitalia Cargo (TC) train

HQ and warehouses in Rome
Warehouses
Offices

Delivery points in Rome
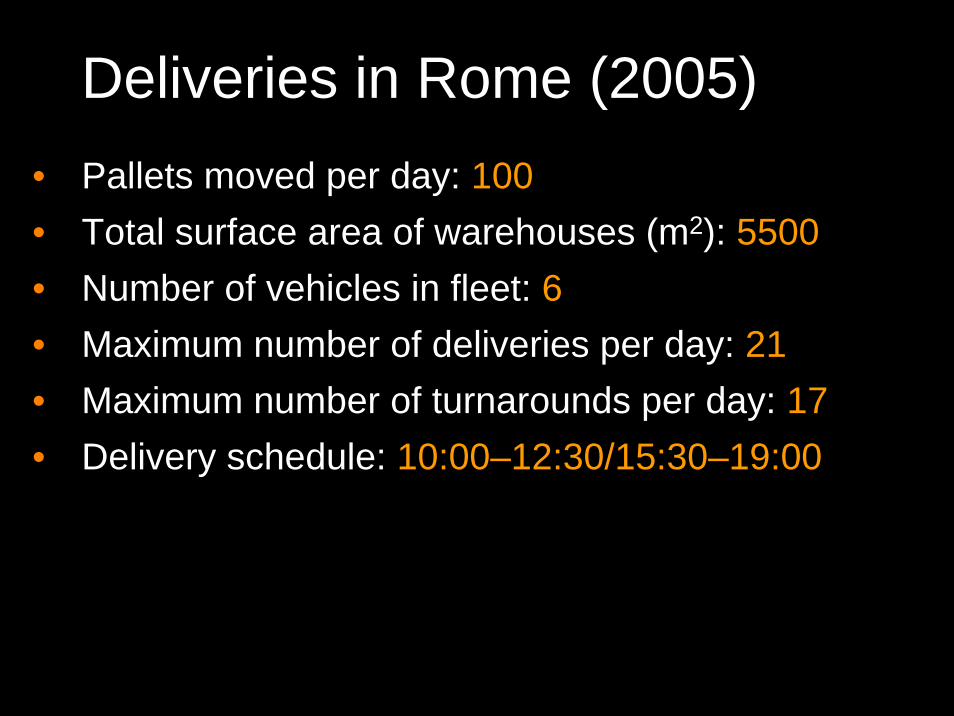
Deliveries in Rome (2005)• Pallets moved per day: 100• Total surface area of warehouses (m2): 5500• Number of vehicles in fleet: 6• Maximum number of deliveries per day: 21• Maximum number of turnarounds per day: 17• Delivery schedule: 10:00–12:30/15:30–19:00

Delivery truck
• Capacity (tons): 8• Capacity (no. pallets): 12• Type of fuel: diesel• Consumption (declared): 4 km/l

The HOST Project
HOST, Human Oriented Sustainable Transport, addressed hybrid wheel motor vehicle featuring horizontal transhipment for cross docking operations.
Funded by the European Commission within the Key Action on Sustainable Mobility and Intermodality of the Sixth Framework Programme.

Multimodal Urban Distribution Centre

Horizontal transhipment for cross docking operations in MUDC’s
Conclusions
• Rail externalities have fewer impacts, but sometimes with slight margins.
• EU rail economic efficiency is very poor; the institutions and organizations are to blame.
• Rail terminals impact strongly on the area and can meet strenuous opposition.
• Environment, economic efficiency, and equity are interconnected.

To switch or not to switch?