making and breaking bonds in superconducting sral si … and breaking bonds in superconducting sral...
TRANSCRIPT

Making and Breaking Bonds in Superconducting SrAl4-xSix (0 ≤≤≤≤ x ≤≤≤≤ 2)
Alex Zevalkink, Matej Bobnar, Ulrich Schwarz, Yuri Grin
Max Planck Institute for Chemical Physics of Solids, Nöthnitzer Straße 40, Dresden 01187, Germany
Supplementary Information
SI.1. Structural Refinements
Full profile refinements of powder X-ray diffraction data for samples prepared using high pressure were
performed using JANA2006. Peak positions for the majority phase in the I4/mmm space group are
marked by the top row of tics. The peak positions of the secondary phase, SrAlSi, is denoted by the lower row of tics in SrAl3.5Si0.5, SrAl3Si, and SrAl2.5Si1.5 samples.

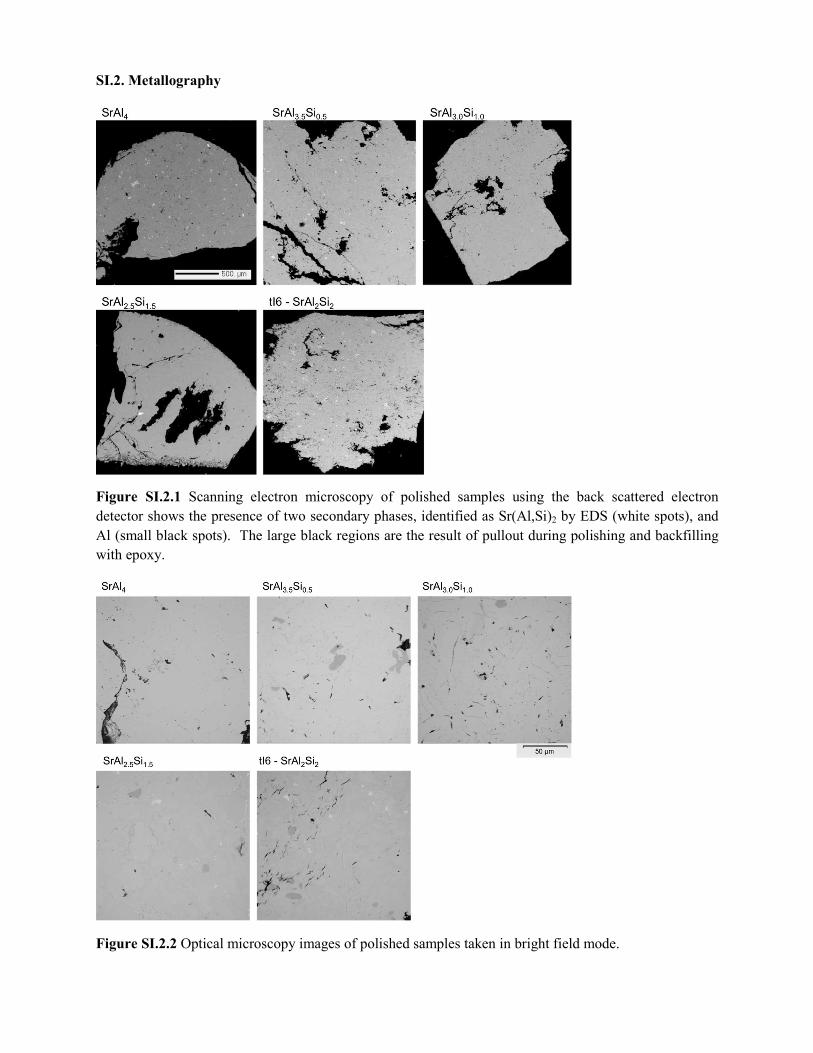
SI.2. Metallography
Figure SI.2.1 Scanning electron microscopy of polished samples using the back scattered electron
detector shows the presence of two secondary phases, identified as Sr(Al,Si)2 by EDS (white spots), and
Al (small black spots). The large black regions are the result of pullout during polishing and backfilling with epoxy.
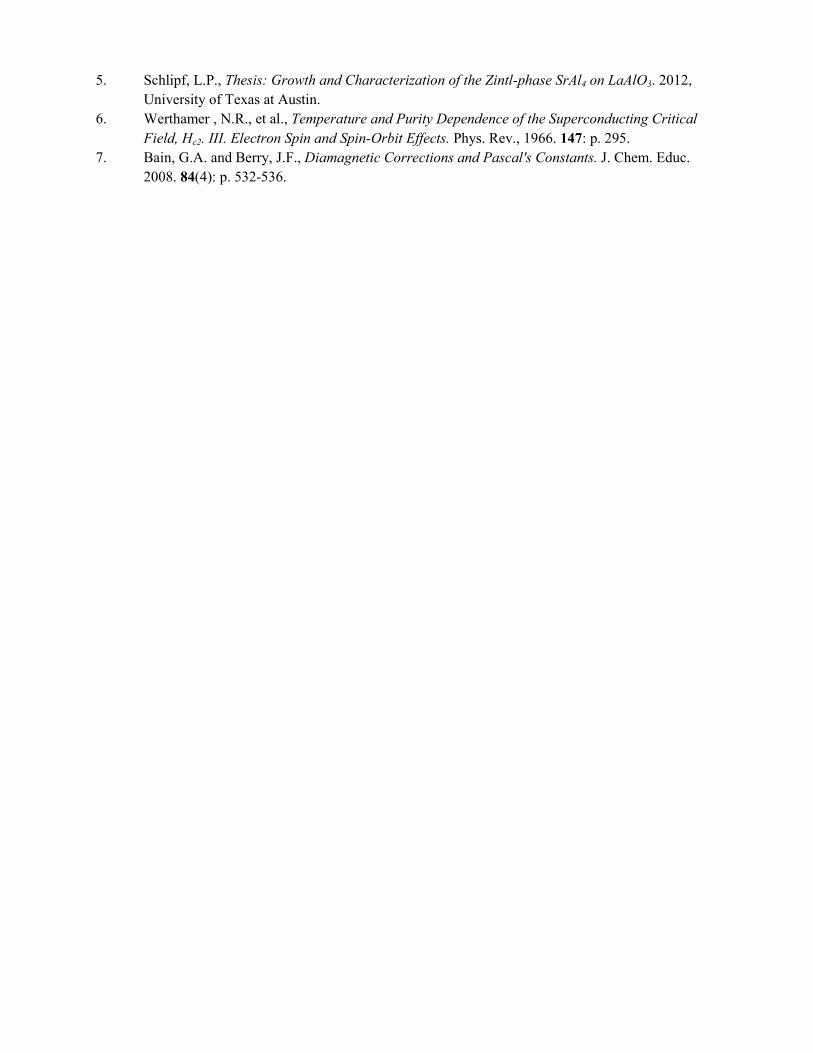
Figure SI.2.2 Optical microscopy images of polished samples taken in bright field mode.

SI.3 Nuclear Magnetic Resonance Spectroscopy 27Al and 27Si nuclear magnetic resonance (NMR) was
used to determine whether or not Si has a strong site
preference, as this is not clear from powder X-ray
diffraction. Figure 3a-b in the main text shows the 27Al
frequency-sweep NMR spectra of SrAl4 and
tI10−SrAl2Si2 as solid black curves. Having a nuclear
spin of 5/2, the 27Al spectra consist of the narrow signal
arising from the central transition (-1/2 ↔ +1/2) and the
specifically shaped broad background arising from the
satellite transitions in the presence of the quadrupole
interaction with the electric field gradient (EFG) [1]. All
signals also include positive Knight shift due to the
magnetic interaction of conduction electrons with the
observed nuclei. Asymmetry of the central lines is a
result of the second order quadrupole interaction and the
anisotropy of the Knight shift.
Focusing on the central line, the results for SrAl4 are
consistent with a previous report by Pecher et al [2], in which the lower frequency signal was identified as
belonging to 5-bonded Al2 (4e site) and the high frequency signal to 4-bonded Al1 (4d site). In contrast,
the spectrum of tI10−SrAl2Si2 exhibits a single, broader signal with a non-specific bell-shaped satellite
background. The MAS result (at the spinning rate of 32 kHz), shown as the dotted black curve, indicates
that this signal arises primarily from one crystallographic Al position. Figure SI.3.2 shows MAS
measurements on tI10−SrAl2Si2 performed with different spinning frequencies. The sidebands spread out
slightly at high frequencies as expected. However, they do not appear to be positioned symmetrically due
to the asymmetry of the isotropic peak. This asymmetry might indeed be due to the Al at the 4e position.
The absence of a distinctively shaped satellite-background in the static spectrum also points to the fact
that some disorder in the site occupancy remains.
Likewise, 29Si MAS NMR spectroscopy (Figure S.I.3.b) of tI10−SrAl2Si2 shows only one sharp signal, an
indication of a single Si position. With the absence of a quadrupole coupling (nuclear spin I = ½), the 29Si
signal is mostly affected by the Knight shift, a contact interaction between polarized conduction electrons
and the nuclear spins, which is proportional to the DOS at Fermi level. tI10−SrAl2Si2 shows much lower
Knight shift compared with the SrAl3Si sample, consistent with the former’s lower density of states at the
Fermi level (see Figure S.I.4). The large broadness of the SrAl3Si sample’s signal is an indication of the
disorder of Al and Si which must be present even if Si occupies only the 4e site.
Figure SI.3.2. 27Al MAS NMR measurements at different frequencies. The sidebands spread out slightly at high frequencies as expected. However, they do not appear to be positioned symmetrically due to the asymmetry of the isotropic peak. This asymmetry might be due to some disorder at the 4e position. Note: a tiny signal of the metallic Al impurity phase is observed at about 1640 ppm.

SI.4. Electronic structure calculations
Figure SI.4.1 Electronic density of states of SrAl4, SrAl3Si, and tΙ10 - SrAl2Si2 in the ThCr2Si2-type
structure and hP5- SrAl2Si2 in the CaAl2Si2-type structure were calculated using the FPLO code with the
experimentally determined lattice parameters and atomic positions. The calculated electronic structures
of the high pressure and ambient pressure compounds have significant density of states at the Fermi level,
indicating metallic behavior. The clear pseudo-gap present in hP5-SrAl2Si2 becomes less pronounced as
we proceed to tI10−SrAl2Si2, to SrAl3Si, and finally to SrAl4. Experimentally, the resistivity of
tI10−SrAl2Si2 is found to be metal-like, consistent with calculations. hP5-SrAl2Si2 and SrAl4 have both
been previously reported to exhibit metal-like resistivity [3-5].
0.0
1.0
2.0
3.0
4.0
5.0
6.0
7.0
-8.0 -6.0 -4.0 -2.0 0.0 2.0 4.0 6.0
DOS (states / f.u.)
E-EF
SrAl4 (I4/mmm) Sr
Al1
Al2
total
0.0
1.0
2.0
3.0
4.0
5.0
6.0
7.0
-8.0 -6.0 -4.0 -2.0 0.0 2.0 4.0 6.0
DOS (states / f.u.)
SrAl3Si (P4/mmm) Sr
Al1
Al2
total
Si2
0.0
1.0
2.0
3.0
4.0
5.0
6.0
7.0
-8.0 -6.0 -4.0 -2.0 0.0 2.0 4.0 6.0
DOS (states / f.u.)
E-EF
tI10 - SrAl2Si2 (I4/mmm) Sr
Al1
Si2
total
0.0
1.0
2.0
3.0
4.0
5.0
6.0
7.0
-8.0 -6.0 -4.0 -2.0 0.0 2.0 4.0 6.0
DOS (states / f.u.)
E-EF
hP5 - SrAl2Si2 (P3m1) Sr
Al
Si
total

To investigate the site preference of Si, we used the virtual crystal approximation (VCA) in FPLO to compare the relaxed lattice constants of each SrAl2-xSix composition with Si on the 4d (tetrahedral) vs. 4e (apical) sites. VCA assumes that at each disordered site there is a virtual atom that is an interpolation between Al and Si. It therefore neglects effects such as local distortions around atoms and therefore misses many of the finer details of disordered structures.
Figure SI.4.2. VCA calculations were performed for each composition, with all of the Si assigned to either the tetrahedral (4d) or the apical (4e) site. Note that a constant value of z = 0.38 was used for the 4e site for all compositions. For each configuration, the relaxed lattice parameters were found by minimizing the total energy. When Si is assigned to the apical 4e site, the relaxed lattice parameters agree very well with the experimentally observed trend. If, in contrast, Si is assigned to the tetrahedral 4d site, the agreement is good at low Si concentrations, but diverges at high Si concentrations. The difference in energy, ∆E =Etotal,4e – Etotal,4d, confirms that the total energy when the lattice parameters are minimized is lower when Si is on the 4e position.
x in SrAl4-xSix
10
10.5
11
11.5
12
12.5
0 0.5 1 1.5 2
c
x in SrAl4-xSix
2.1
2.2
2.3
2.4
2.5
2.6
2.7
2.8
2.9
3
0 0.5 1 1.5 2
c/a
x in SrAl4-xSix
-0.6
-0.55
-0.5
-0.45
-0.4
-0.35
-0.3
-0.25
-0.2
-0.15
-0.1
-0.05
0
0 0.5 1 1.5 2
∆E (eV)
x in SrAl4-xSix
Etotal,4e – Etotal,4d
Relaxed la ce with Si on 4d site
Relaxed la ce with Si on 4e site
Experimentally observed
c (Å)
a (Å)
c / a
(Å
)

Details of LMTO calculations:
Because the calculation within the atomic sphere approximation (ASA) already includes corrections for
neglected interstitial regions and partial waves of higher order [26] an addition of empty spheres was not
necessary. The following radii of the atomic spheres were applied for the calculations: r(Sr) = 2.357 Å,
r(Al1) = 1.560 Å, r(Al2) = 1.441 Å for SrAl4; r(Sr1) = 2.431 Å, r(Sr2) = 2.391 Å, r(Al1) = r(Al2) = 1.445
Å, r(Al3) = r(Al4) = 1.450 Å, r(Si1) = r(Si2) = 1.342 Å for SrAl3Si; r(Sr1) = 2.414 Å, r(Sr2) = 2.213 Å,
r(Al1) = 1.435 Å, r(Al2) = 1.541 Å, r(Al3) = 1. 441, r(Si3) = 1.554 Å, r(Si1) = 1.353 Å, r(Si2) = 1.352 Å
for SrAl2.5Si1.5; r(Sr) = 2.324 Å, r(Al) = 1.447 Å, r(Si) = 1.469 Å for SrAl2Si2 and r(Sr) = 2.049 Å, r(Al1)
= 2.343 Å, r(Al) = 1.434 Å, r(Si) = 1.456 Å for hp-SrAl2Si2. A basis set containing Sr(5s,4d), Al(3s,3p),
Si(3s,3p) orbitals was employed with Sr(5p,4f), Al(3d), Si(3d) functions being down-folded.
The structural models for SrAl4 and hp-SrAl2Si2 were taken from the experiment. For the intermediate
compositions, the ordered models in the space group P4mm were used.
SI.5 Superconductivity in SrAl2.5Si1.5 and tI10-SrAl2Si2
Figure SI.5.1 The upper critical field, µ0Hc2, as a function of Tc is shown as open circles; the straight lines are the linear extrapolation of µ0Hc2(Tc) to 0 K, and the full circles are the obtained WHH values of µ0Hc2(0). In red and green are the values obtained from the resistivity dropping to 90 % and 10 % of its value at 3 K. The linear extrapolation of µ0Hc2(T) to 0 K leads to the upper limit for of 0Hc2(0) ≈ 844 mT, while the Werthamer-Helfand-Hohenberg [6] extrapolation from the initial slope of the first five points gives0Hc2(0) ≈ 506 �T. The real value of 0Hc2(0) should lie in between these limits.

Figure SI.5.2. The magnetic susceptibilities of SrAl4, SrAl3.5Si0.5, SrAl3Si, SrAl2.5Si1.5 and tI10-SrAl2Si2 were measured in the external fields of µ0H = 3.5 and 7 T and when necessary extrapolated to infinite field to eliminate a saturated magnetization of a very small ferromagnetic impurity. In most cases, the susceptibilities above 100 K were modelled by a Curie-like behaviour plus a constant; otherwise small linear and quadratic contributions were added. The Curie-like upturns at the lowest temperatures are probably due to minor paramagnetic impurities. The constant contributions were taken as the extrapolated values of susceptibilities at T = 0 K, χ0 = -3.8x10⁻⁵, -2.6x10⁻⁵, +2.1x10⁻⁵, -3.0x10⁻⁵ and -4.0x10⁻⁵ emu mol-1, respectively. By calculating diamagnetic contributions of Sr2+ ion and covalently bonded Si and Al atoms [7], the measured Pauli susceptibilities are χP = +3.3×10⁻⁵, +4.5×10⁻⁵, +9.2×10⁻⁵, +4.1×10⁻⁵ and +3.1×10⁻⁵ emu mol-1, giving DOS(EF) = 1.0, 1.4, 2.8, 1.3, 1.0 states/(eV f.u.), respectively.

Figure SI.5.3 Left) The low-temperature specific heat of the tI10-SrAl2Si2 measured at the indicated magnetic fields. Right) The difference between the superconducting and normal-state specific heat, ∆Cp = CpS - CpN, for measured magnetic fields.
SI.6. Chemical bonding
Figure SI.6.1. ELI-D distributions in the (100) planes in SrAl3Si (left) and SrAl2.5Si1.5 (right) reveal the Si2-Si2 and Al2-Si2 interactions, respectively. Color code as in Figure 7 in the main article.
References:
1. Abragam, A., Principles of Nuclear Magnetism,. 1962, Oxford: Oxford University Press.
2. Pecher, O. and F. Haarmann, In intermetallische Phasen hineinschauen. Nachrichten aus der
Chemie, 2013. 61: p. 1017-1021.
3. Kauzlarich, S.M., et al., Structure and high-temperature thermoelectric properties of SrAl2Si2. J.
Solid State Chem., 2009. 182(2): p. 240-245.
4. Lue, C.S., et al., Electronic structure and transport properties of SrAl2Si2: Effect of yttrium
substitution. Intermetallics, 2011. 19(10): p. 1448-1454.
5. Schlipf, L.P., Thesis: Growth and Characterization of the Zintl-phase SrAl4 on LaAlO3. 2012,
University of Texas at Austin.
6. Werthamer , N.R., et al., Temperature and Purity Dependence of the Superconducting Critical
Field, Hc2. III. Electron Spin and Spin-Orbit Effects. Phys. Rev., 1966. 147: p. 295.
7. Bain, G.A. and Berry, J.F., Diamagnetic Corrections and Pascal's Constants. J. Chem. Educ.
2008. 84(4): p. 532-536.