make observations to state the problem *a statement that defines the topic of the experiments and...
TRANSCRIPT

Scientific Methodand
Measurements
Make observations to state the problem
*a statement that defines the topic of the experiments and identifies the relationship between thetwo variables to be tested.
*It is a cause and effect relationship where thechange or manipulation of a variable will cause the responseby another variable.
*The relationship must be TESTABLE and the responsemust be MEASURABLE.
This all means that—”The effect of the (independent ormanipulated variable) upon the cause of the (dependent or responding variable).”
Form a Hypothesis
*Make a prediction of what you think will happen next!*Written as an “If….then…” statement*Formats:
If the (independent variable) is (changed),then the (dependent variable) will (change) because of(your reasoning).
(Changing) the (independent variable) willcause the (dependent variable) to (change) because of (your reasoning).
Form a Hypothesis
*Make a prediction of what you think will happen next!*Written as an “If….then…” statement*Used to predict a trend NOT just a single outcome!*Your prediction may be true or not true….that is why an experiment must be performed!

Determining and Defining Variables
*A variable is a factor or condition which can change change during an experiment.*Change only one variable to determine its effect upon another variable.*Must identify all other variables and keep them normal or constant.
Determining and Defining Variables
Three Types of Variables
INDEPENDENT VARIABLE the factor being purposely changed or manipulated.
the changes that you make to this variable will cause the changes that you measure

Determining and Defining Variables
Three Types of Variables
INDEPENDENT VARIABLE the factor being purposely changed or manipulated.
must determine the level: the amount or concentration determine the trials: the number of times
the test is repeated

Determining and Defining Variables
Three Types of Variables
DEPENDENT VARIABLE the factor which responds to the change in the IV.
this is the response you predicted! its response is measured as data
Must designate how you will measure this variable.
Determining and Defining Variables
Three Types of Variables
CONSTANT (CONTROLLED) VARIABLE not manipulated during the experiment
these are often potential IV for future experiments
MATERIALS AND PROCEDURE
*Simply a recipe for your experiment
list of materials step by step instructions
Must be very SPECIFIC!
state how the response of the DV should be measured

QUALITATIVE DATA
*data collected by using your senses (are not measured)*simply descriptions
organized into tables, diagrams or by drawing pictures

QUANTATIVE DATA MEASUREMENTS
*the ratio of the magnitude (how much) of a quantity to a standard value, a unit.
*all measurements require a magnitude and unit!
QUANTATIVE DATA MEASUREMENTS
*Measurements are never perfect! So, the uncertaintyof a measurement is determined by the scale of the measuringdevice.
Accuracy is the closeness of a measurement to thetrue value of what is being measured. *depends upon the quality and calibration of
the instrument Precision indicates how close individual measurementsagree.
*depends upon the calibration and the adjustment of the instrument

QUANTATIVE DATA MEASUREMENTS Estimate Guidelines for Common Measuring Instruments
Measuring Instrument
SmallestIncrement
Record To Nearest
Metric ruler 1 mm 0.1 mm
Graduated cylinder 1 mL 0.1 mL
Celsius thermometer 2⁰C 1⁰C
Triple beam balance 0.1 g 0.01 g
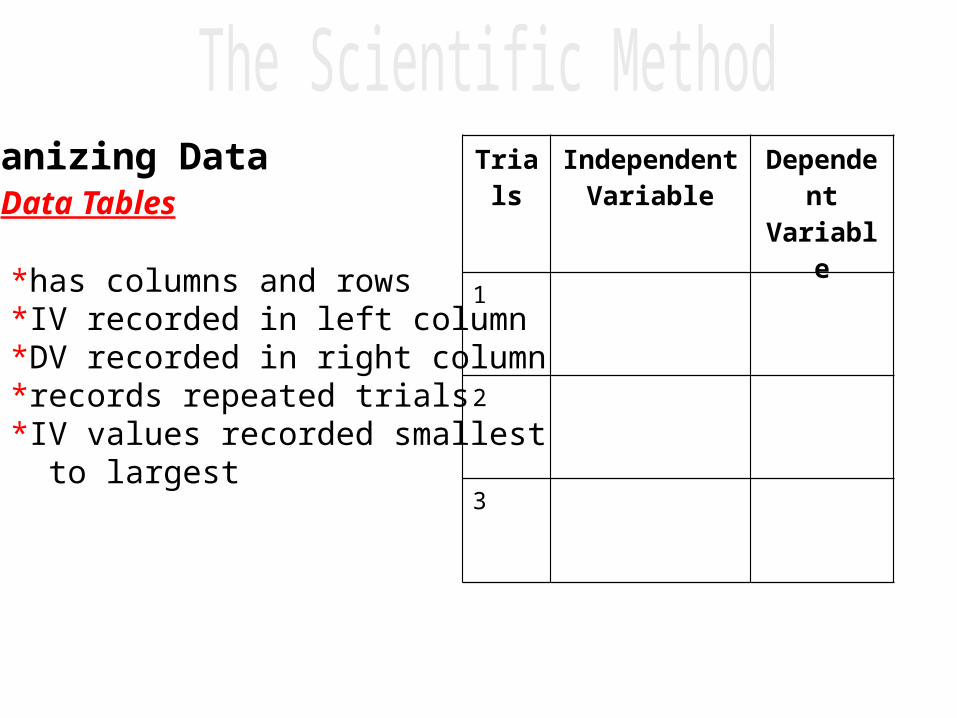
Organizing Data Data Tables
*has columns and rows *IV recorded in left column *DV recorded in right column *records repeated trials *IV values recorded smallest to largest
Trials IndependentVariable
DependentVariable
1
2
3

Organizing Data Data Tables
Must have a title *includes purpose of experiment and both the IV and DV
Must include units for all measurements
If more than one table per lab report then number each table: *number to the left of the title
Tell who collected data by placing name below the table on the left side
Trials IndependentVariable
DependentVariable
1
2
3
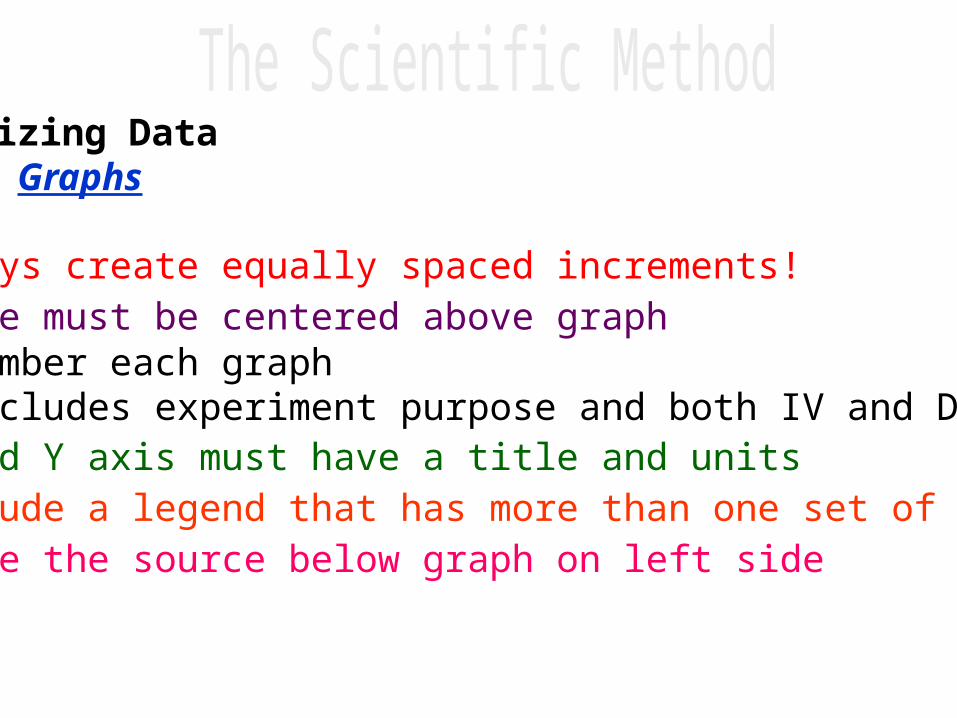
Organizing Data Graphs
Always create equally spaced increments!Title must be centered above graph
*number each graph*includes experiment purpose and both IV and DV
X and Y axis must have a title and unitsInclude a legend that has more than one set of dataWrite the source below graph on left side

Organizing Data Graphs
Pie Graphs *used to show percentages *circle represents the whole and slices represents percentages
1st Qtr59%2nd Qtr
23%
3rd Qtr10%
4th Qtr9%
Title

Organizing Data Graphs
Histographs or Bar Graphs *use when there are various kinds of things *use when the IV has no standard numerical scale *bar represents the count or amount of things
Category 1
Category 2
Category 3
Category 4
0 1 2 3 4 5 6
Series 3Series 2Series 1

Organizing Data Graphs
Line Graphs *used for continuous data *IV goes on the x-axis DV goes on the y-axis
Catego
ry 1
Catego
ry 2
Catego
ry 3
Catego
ry 4
0123456
Series 1Series 2Series 3

Organizing Data Graphs
Line Graphs--SCALING the GRAPH
*find the highest and lowest value on axis*if numbering begins at zero, use as lowest value *find the difference between the highest and lowest value
*divide the difference by the number of boxes along axis
*each box must have the same value increment

Organizing Data Graphs
Line Graphs—Plotting*find the value for each point and place a mark where the
two values would intersect Drawing the “line of best fit”
*examine the points and the graph, draw a line through as many points as possible with even number of unconnected points on each side of the line
*points far away from the connected points are to be considered human error
Organizing Data Graphs
Line Graphs—Human Errors
*Circle points which represent human error (mistakes) *explain by way of notation what caused the human
mistake

Analyzing Data STATISTICAL ANALYSIS
Measurement of Central Tendency *Mean is the average.
Used to analyze random error. *Median is the middle value.
*Mode is the value that occurs most frequently or often.
Analyzing Data STATISTICAL ANALYSIS
Measurement of Variation
*Range is the difference between the high value and the low value.
Range = (largest value) – (smallest value)
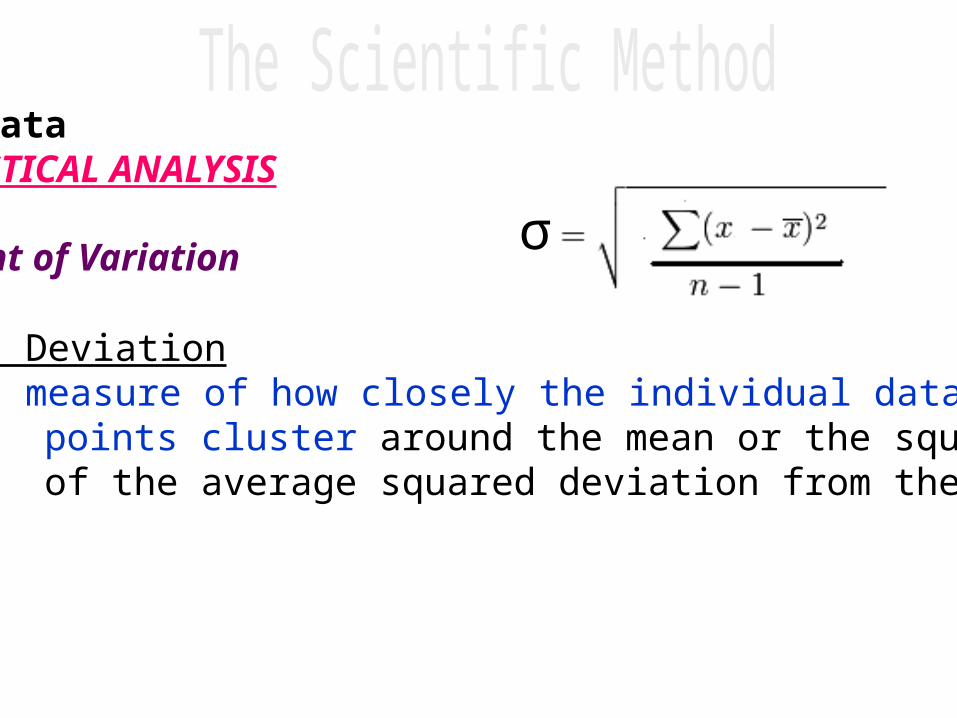
Analyzing Data STATISTICAL ANALYSIS
Measurement of Variation
*Standard Deviation is a measure of how closely the individual data
points cluster around the mean or the square root of the average squared deviation from the mean.
σ
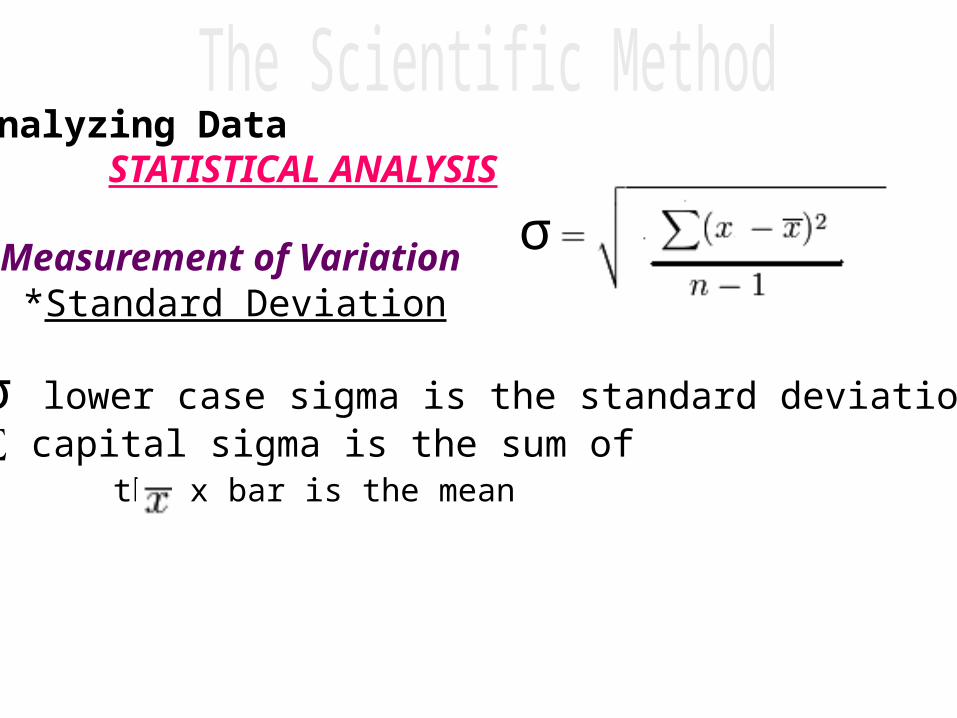
Analyzing Data STATISTICAL ANALYSIS
Measurement of Variation*Standard Deviation
σ
σ lower case sigma is the standard deviation∑ capital sigma is the sum of the x bar is the mean
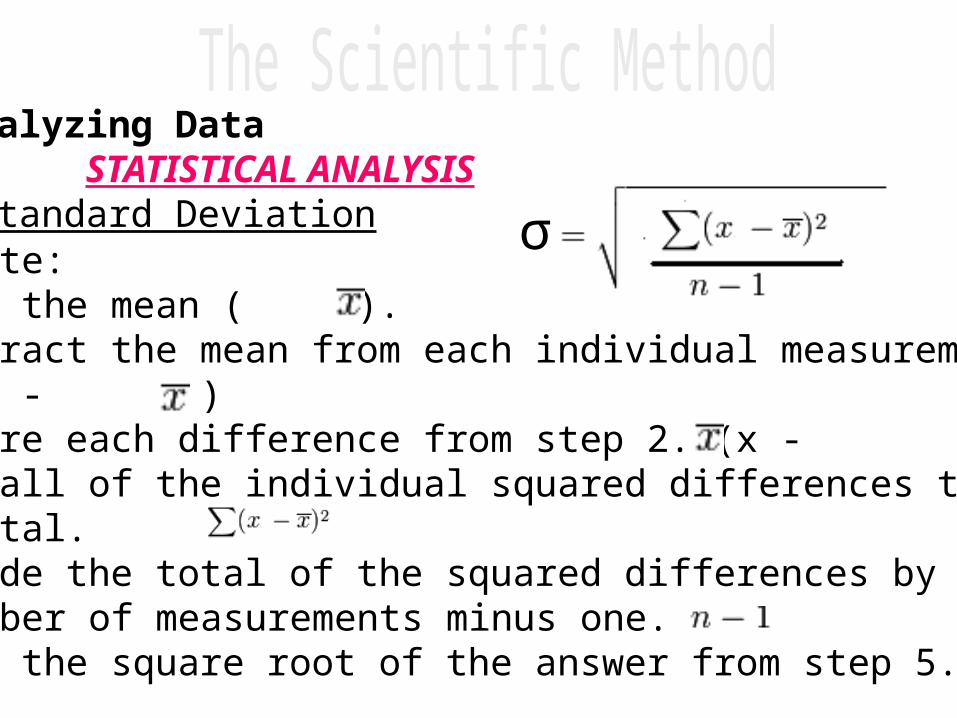
Analyzing Data STATISTICAL ANALYSIS*Standard Deviation
σTo calculate: 1. Find the mean ( ). 2. Subtract the mean from each individual measurement. (x - ) 3. Square each difference from step 2. (x - )2
4. Add all of the individual squared differences to obtain a total. 5. Divide the total of the squared differences by the number of measurements minus one. 6. Take the square root of the answer from step 5.
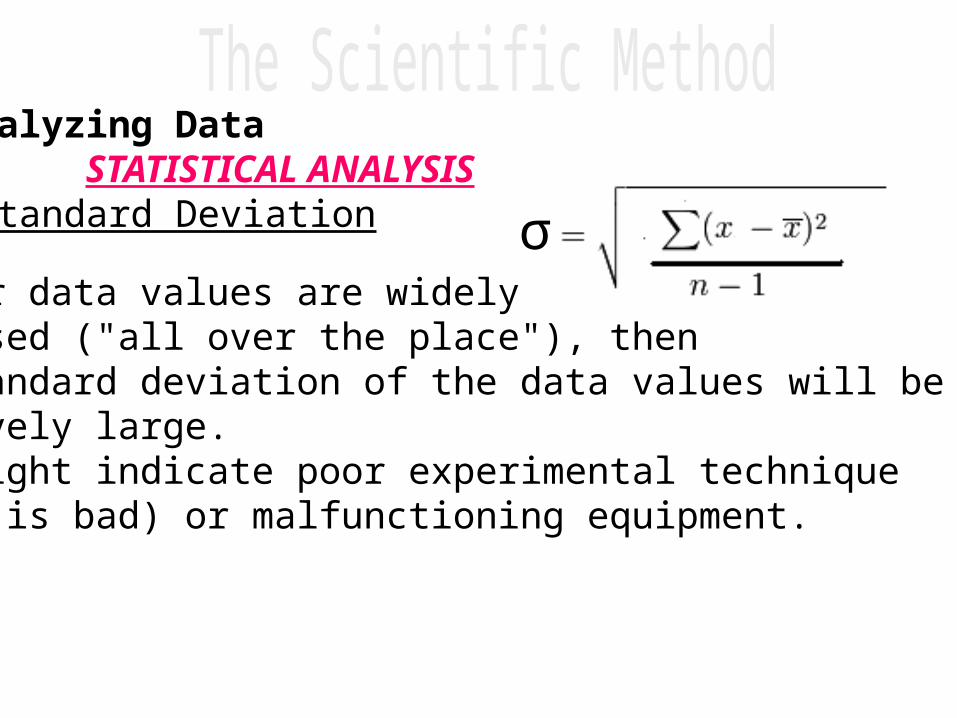
Analyzing Data STATISTICAL ANALYSIS*Standard Deviation
σIf your data values are widely dispersed ("all over the place"), then the standard deviation of the data values will be relatively large. This might indicate poor experimental technique (which is bad) or malfunctioning equipment.

Analyzing Data STATISTICAL ANALYSIS*Standard Deviation
σ
If your data values are tightly grouped about a mean value the standard deviation will be a relatively small number.

Analyzing Data STATISTICAL ANALYSIS
Amount of Error--Percent Error *is a measure of how close an experimental value is to the expected value. *calculated only when the expected value is known.
% error = (observed – expected) x 100 expected

Analyzing Data STATISTICAL ANALYSIS
Amount of Error--Percent Difference *is a measure of the comparison of two or more experimental measurements.
*used to measure the precision of the instrument
% difference = (largest value – smallest value) mean
Conclusion
*is where you put everything together!*a summary of your entire experiment.*whoever reads this must know what was done and what
happened.