mainstreaming gender sensitivity in cash crop market supply chains
TRANSCRIPT
Mainstreaming Gender Sensitivity in Cash Crop Market Supply Chains Ruth Vargas Hill and Marcella Vigneri1
Background Report for SOFA 2010
December 2009
This paper considers the impact of gender specific constraints on the production and
marketing of cash crops. Cash crop production differs from general agricultural
production in that it entails engaging in output markets to make sales. This in turn
requires reliable access to these markets, and has implications on the necessary
scale and quality of production. Assessing the nature of female involvement in cash
crop production is important, not just because it differs from the production of other
crops, but because cash crop production holds significant potential as a means by
which rural households can improve their welfare. Through a combination of review
and original data analysis, this paper stresses the point that women are equally
productive as men and receive equal prices to men, when they farm with the same
resources and sell their crops in the same way. However, our review and analysis
shows that women rarely have similar access to assets and markets as men and this
has a non‐trivial impact on production and marketing of cash crops. These gender
inequalities in resources result in different levels of participation, methods of
production and modes of marketing cash crops, and bear consequences for women’s
potential outcome in the cultivation of these high value crops.
1 Ruth Vargas Hill ([email protected]) is Research Fellow with the Markets, Trade and Institutions Division of the International Food Policy Research Institute (IFPRI, Washington DC, US). Marcella Vigneri is Research Fellow ([email protected]) with the Rural Policy and Governance Group of the Overseas Development Institute (London, UK). We thank Jose Deustua‐Rossel (IFPRI) for his excellent research assistance.

1. Introduction and rationale
This paper reviews the impact of gender specific constraints on the production and marketing
of cash crops, which‐‐in our discussion‐‐are defined as those crops which are grown primarily for
marketing rather than for household consumption. A rich literature illustrates the existence of
structural socio‐economic barriers for women’s ability to access land, markets, education and
networks which often add more time pressure on the complex workload of women in rural areas.
Moreover, several studies have explained how these constraints impact women farmers’ uptake of
lower levels of input use and their lack of technology adoption (The World Bank et al., 2009;
Morrison et al., 2007; Doss, 2001; Quisumbing 1994).
Our specific research interest is to consider the impact of such constraints on cash crop production.
We dwell less on the often reported finding that, all else equal, productivity outcomes are usually
equal across male and female farmers: and instead direct our attention to the fact that all else is
usually not equal. These gender inequalities in resources result in different levels of participation,
methods of production and modes of marketing cash crops, and bear consequences for women’s
potential outcome in the cultivation of these high value crops.
Cash crop production differs from general agricultural production in that it entails engaging in
output markets to make sales. This requires reliable access to these markets, and has implications on
the scale and quality of production (Fafchamps 1992, Key et al., 2000). In a number of contexts
“cash” crops also differ from “food” crops in that social norms dictate that they traditionally imply
more male involvement in some of the decision making, production and sale processes. Evidence
suggests that female participation in cash crop markets is often lower than male participation (The
World Bank et al., 2009) As an example, women only represent 20 percent of cocoa farmers in
Ghana (Vigneri and Holmes, 2009), and female headed households are significantly less likely to farm
coffee than households headed by men in Uganda.
This paper specifically looks at the constraints women face when they do participate in cash
crop markets, through a combination of review and original data analysis. We also examine the root
causes of these constraints, whether they arise as a result of discrimination in input and output
markets for cash crops themselves, or as a result of constraints in assets and other resources.
Assessing the nature of female involvement in cash crop production is important, not just
because it differs from the production of other crops, but because cash crop production holds
significant potential as a means by which rural households can improve their welfare. Farm incomes
and productivity in cash crops can be higher in the presence of well‐developed channels for
procuring inputs, accessing credit and marketing the crop. There are also important indirect effects
of cash cropping on productivity of other household activities such as food cropping.
The paper begins with a literature review that analyzes the major constraints women face in
cash crop production, particularly focusing on discussing the literature that identifies the constraints
women face in accessing input and output markets. Two case studies will then be presented that
provide some empirical evidence on these constraints. The first case study on cocoa farmers in
Ghana focuses on constraints women cocoa farmers face in accessing input markets, particularly
accessing labor and non‐labor inputs and the effect this has on their choice of production
technology. The second case study on coffee in Uganda highlights the differential nature of sale
transactions made by male and female farmers. In the final section we conclude and present
recommendations to increase the access of women to cash‐crop markets.
Our discussion begins with an important distinction between different definitions of women
farmers. The case of women who head households (i.e. female‐headed households) and women in
households headed by men are different. In many of the papers we reviewed, and in one of the
case‐studies we present (coffee in Uganda), comparisons between female and male headed
households are the basis for the discussion on the differential access of men and women to cash
crop markets. However, access also differ between adult women and men in the same household
(households usually headed by men) as clearly shown in research on Ghana (Udry et al., 1995),
pastoralist communities (Doss and McPeak, 2005), and one case‐study discussed (cocoa in Ghana).
When considering cash crop participation of women within a household, issues of intra‐household
bargaining become important (for example women may end up producing subsistence crops due to
an “implicit” agreement within the household).
2. Literature review
The defining feature of cash crop production is that it entails engaging in output markets. This
in turn depends on the ability to produce at scale, to achieve quality, and to secure low costs of
transacting in markets. Before turning to the literature on the constraints women may face in each
of these areas, we briefly set out a conceptual framework as to why these factors are important.
i. As two seminal studies show (Fafchamps, 1992; Key, et al., 2000), scale becomes
important for cash crop production as a result of (i) the price risk inherent to
exchanging cash crops for cash and cash for food, and (ii) the fixed costs involved in
transacting with markets: Engaging in the market as a net seller of one crop implies
engaging in the market as a net buyer for other crops. As Fafchamps (1992) argues,
food price volatility that results from poorly integrated food markets can make being a
net buyer of food quite risky. This is compounded by any price volatility that may exist
in the cash crop price. Fafchamps (1992) shows that this risk causes the observed
empirical relationship between farm size and cash crop production: it is only those
households that are able to achieve food security first that choose to engage in cash
crop production.
ii. Key et al. (2000) present a model which identifies the impact of transaction costs on a
household’s production and marketing decisions. A defining characteristic of this
model is that it distinguishes between two types of transaction costs‐‐proportional
and fixed. Proportional transaction costs are affected by anything that contributes to
the unitary cost of participating in the market, such as transportation or bagging. Fixed
transaction costs include things such as searching for a buyer, negotiation and
bargaining over the terms of the transaction. They show that whilst both are
important in determining whether a household decides to be a net‐ buyer or net‐seller
of a given commodity, fixed transaction costs are important in setting a minimum size
of the transaction. For quantities smaller than a given amount, undertaking the fixed
costs of marketing does not pay. This is quite different to production in which few
economies of scale have been identified (in fact a number of studies have found
decreasing returns to scale, e.g. Barrett, 1996). As a result, achieving scale in
production is often important for engaging in cash crop production.
In addition, for some cash crops, such as fruit and vegetables produced for export market,
there are quality requirements that need to be met to ensure market access. As presented in World
Bank (2007) fresh and processed fruits and vegetables, fish and fish products, meat, nuts, spices, and
floriculture account for about 47 percent of the agricultural exports from developing countries. The
continued growth of these high‐value exports will require efficient value chains, particularly
domestic transport, handling, and packaging, which make up a large share of the final costs.
Moreover, modern procurement systems for integrated supply chains and supermarkets with
stringent food‐safety standards raise concerns about how to ensure small farmers’ participation in
high‐value agricultural products markets.
The concept of transaction costs is also useful when it comes to assessing the ease with which
households and individuals can access markets. Households are nearly always able to physically
access some output market for their crops, but when the costs of doing so are prohibitively high we
can think of the household or individual having limited market access.
The costs of transacting vary with the type of market channel and the crop being sold. For
example, crops that are highly perishable carry higher timing and coordination costs, higher
transportation costs and higher search costs (tomatoes and bananas) than crops that can be easily
stored (maize and coffee). Sometimes the same crop can have quite different transaction costs
based on different aspects of its market. For example mangos sold in rural retail markets do not
have the same requirements (and associated transaction costs) for SPS (Sanitary and Phytosanitary
Standards) testing as mangos sold to European supermarkets. For a given crop and market,
Fafchamps and Hill (2005), Chowdhury (2002) and Roberts and Key (2005) show that both the
market price and transaction costs a farmer faces will vary with the way in which farmers choose to
make a sale: whether the farmer sells at the farm‐gate or travels to an output market (Fafchamps
and Hill, 2005), whether they sell on contract (Roberts and Key, 2005), and whether they sell
processed or unprocessed goods.
The costs of transacting also vary considerably across individuals. Empirical studies of market
participation have underlined the importance of proximity to a rural market in determining whether
farmers participate in it, but whilst a household’s proximity to market is the most obvious source of
heterogeneity in transaction costs across individuals, other characteristics of the household are
important in how much they decide to sell (Goetz, 1992; Key et al., 2000; Bellemare and Barrett,
2005; and Holloway, Barrett and Ehui 2005). In a given location we can expect transaction costs to
vary substantially across individuals with different assets, such as individuals with mobile phones
versus those without and individuals with transport compared to those without. Skills and human
capital characteristics ‐ such as a capacity for contract negotiation ‐ will also impact the cost of
transacting, as will social capital (the number of buyers and sellers one knows, and the ethnicity or
caste of the individual).

In the following subsections we assess what constraints women face in producing and
accessing cash crop markets. That is, we analyze the constraints women face for increasing the sales
of their produce, to achieve quality, and to secure low costs of transacting in markets. We discuss
access to land and labor (important determinants of scale), purchased inputs (important
determinants of quality and quantity), and access to markets. We note that there are a number of
comprehensive reviews carefully analyzing the gender biases among women farmers (see
Quisumbing and Pandolfelli, 2009; The World Bank et al., 2009; Morrison et al., 2007; Doss, 2001;
Quisumbing, 1994), therefore, the emphasis in this paper is its focus on and discussion of the
constraints that relate to scale, input and output market access.
In focusing on these issues we dwell less on the well‐known finding that, all else equal,
productivity outcomes are usually equal across male and female farmers (e.g. Quisumbing 1996),
instead we direct our attention to the fact that all else is usually not equal. Inequalities in resources
result in different levels of participation, methods of production and modes of marketing for men
and women.
2.1. Male and female crops
One frequent distinction made in the literature is that cash crops and export crops are male
crops, while subsistence crops are female crops (e.g., Koopman, 1993; Kumar, 1987; Randolph and
Sanders, 1988). Evidence suggests that men may take over production and marketing, even of
traditional women’s crops, when it becomes financially lucrative to do so (The World Bank et al.,
2009). A standard explanation for the division of crops by gender is that women are responsible for
feeding the family and thus grow subsistence crops. On the other hand, men are responsible for
providing cash income and to this end they grow cash and export crops (Doss, 2001).
Doss (2002), using empirical data from Ghana, argues that we cannot divide crops into those
grown by men and those grown by women. Although men are more heavily involved in cash crop
production, women are involved in the production and sales of all of the major crops in Ghana.
However, their data indicates that there are gender based cropping patterns in Ghana. Many crops
are disproportionately grown by men or women, depending on the ecological zone and the method
of defining the farmer.
It is also important to note that social norms as they relate to women’s and men’s crops
change over time. There are a number of examples of crops or commodities that started in the
women’s domain but became controlled by men as they were commercialised (Kasante et al., 2001;
Doss, 2001; Lilja and Sanders, 1998; Von Braun and Webb, 1989). However, this is not always the
case. Saito et al. (1994) noted that traditional pattern of intra‐household rights and obligations may
change in response to evolving social and economic circumstances and migration of men in search of
more remunerative activities elsewhere. Saito et al. found that the gender‐specific nature of African
farming were disappearing as women were growing high value crops, taking on tasks traditionally
performed by men (such as land clearing), and making decisions on the daily management of the
farm and household.
It is difficult to know whether women grow lower‐value subsistence crops because social
norms dictate the types of crops they can grown, or because social norms constrain access to land,
the availability of labor, access to extension and credit, or access to output markets (Doss, 2001).
However, in this literature review, and in the case studies presented, we primarily consider the
constraints social norms place to access these important resources for cash crop production. This
helps us deal with the fact that crops are not easily divided into male and female crops, and that the
nature of crops changes over time.
2.2. Constraints to producing at scale: access to land and labor
A primary factor of production—land—is often more constrained in female headed
households and also for women in households headed by men. A rich literature reports that
regardless of how access to land is gained, female‐headed households tend to have smaller
landholdings than households headed by men (Morrison et al., 2007; Doss, 2001). In addition,
women's landholdings may be less fertile and more distant from the homestead (Doss, 2001).
However, direct empirical evidence on the gender‐disaggregated effects of land on the probability of
producing cash crops has not been conducted. Still, we note that a number of studies have found
that households with smaller plots of land are less likely to engage in cash crop production
(Fafchamps, 2003; Fafchamps, 1992) and this can be partly understood by the need for scale.
Having smaller plots thus disadvantages women. Additionally, women who do access cash
crop markets often cultivate smaller plots of land (Vigneri and Holmes, 2009) which has a bearing on
the type of fixed marketing costs it makes sense for them to incur. This may in turn have a knock‐on
effect on the type of marketing channel chosen when it comes time to marketing their crops.
Limited land ownership also has indirect effects on ability to produce cash crops. First, it
inhibits the production of cash crops given that land ownership provides collateral for securing
access to credit and credit is important in ensuring the use of purchased inputs for cash crop
production (see Ghana case study below). Second, since careful studies show that tenure insecurity
impairs investment incentives (Morrison et al., 2007), the higher tenure insecurity faced by women
results in lower investment incentives for women compared to men. Goldstein and Udry (2005)
provide some evidence of this. They find that individuals in positions of power in the local political
hierarchy have more secure land rights and, as women are rarely in positions of power, they face
more insecure property rights.
A second primary factor of production—labor—is also often more constrained in female
headed households and also for women in households headed by men. Labor availability depends on
the amount of household labor that can be mobilized for agriculture and on the labor that can be
hired in local labor markets. Female‐headed households may have less access to labor because they
include fewer men and may have fewer resources for hiring non‐family labor. Within male‐headed
households, women who manage agricultural activities may also have difficulty in mobilizing labor
due to social constraints.
An important constraint for women labor is the time burden imposed by domestic tasks. As
presented by Blackden and Wodon (2006), there is an important gender division of labor among
various agricultural tasks. Women are primarily responsible for food processing, crop transportation,
and weeding and hoeing, while men do most of the land clearing. This is inevitably a limiting factor
in the amount and quality of time women can allocate to look after their farms. Moreover, women
in poor households face particularly serious time constraints because of their various livelihood
activities and childcare responsibilities (Quisumbing and Pandolfelli, 2009). Paolisso et al. (2002), by
evaluating the effect of the Vegetable and Fruit Cash Crop Program in Nepal, found that men and
women spend roughly the same average time in cereal and livestock production; however, women
spend more time caring for children under five years of age, while men spend more time in fruit and
vegetable production. Von Braun and Webb (1989) also found that the adoption of new
technologies in Gambia led to increased work on communal plots for both men and women, with
relatively larger increases for women than men.
Differential access to labor not only has the potential to reduce the scale of production, it can
also decrease the efficiency of production. Udry (1996) found that lower productivity on female
plots compared to male plots within households is because labor and fertilizer (manure) tended to
be more intensively applied on men’s plots. Similarly, Holden, Shiferaw, and Pender (2001) found
that female‐headed households in Ethiopia have lower land productivity due to insufficient access to
male labor and oxen, and low substitutability among factors of production.
It is worth noting that land and labor constraints may change over time and may also be
impacted by participation in cash crop markets. Quisumbing et al. (2004a) found that in Ghana’s
Western region women’s active participation in cocoa production has challenged and changed the
norms by which women usually acquire land. Land is being transferred from husband to wife if the
wife helps the husband establish cocoa fields. In this same case, the adoption of labor intensive
cocoa farming increased the demand for women’s labor in Ghana (Quisumbing et al., 2004a).2
2.3. Constraints to quality: input use and technology adoption
The application of fertilizer and sprays, the use of new varieties of seeds, and adoption of
improved technology (management practices) can all increase the scale of production. Adoption of
these inputs and practices can also increase access to high value cash markets in which quality of
produce is a significant factor in gaining access. Access to credit, extension, and networks of
adopters often determine whether a household uses such inputs (Sunding and Zilberman, 2001; The
World Bank, 2007; Bandiera and Rasul. 2006; Conley and Udry, 2005; Doss et al., 2003).
A recent review of the literature that assesses the use of fertilizer, sprays, and new varieties of
seeds (Peterman et al., forthcoming) shows that whilst rates of adoption tend to be lower for
women than for men, in more than half of the studies reviewed it is differences in human capital,
access to credit, extension and networks that explains these differences. Once these factors are
controlled for, in multivariate regression analysis, gender differences disappear. In some cases
2 The positive impact of this increased demand of labor need to be discussed since it may cause an increase in the total working hours of women.
gender differences remain, but overall the evidence appears to suggest that many of the constraints
to access inputs and adopt new technologies are not related to the characteristics of the input or
technology per se but instead originate in other markets that are relevant for the adoption decision,
such as land, labor, credit, and information (Morrison et al., 2007). Gladwin (1992) found that the
critical factors that significantly limit fertilizer application are lack of access to credit and cash, not
the sex of the farmer. However, since female farmers have less access than males to credit and cash,
they apply less fertilizer, and obtain lower yields and incomes as a result. Doss and Morris (2001)
found that women’s and men’s differentials in planting improved varieties of maize were explained
by women’s and men’s different access to complementary inputs, especially to land and extension
services. Once those inputs were controlled for, the sex of the farmer was no longer statistically
significant in explaining adoption decisions. Quisumbing (1994) found that farmers with larger areas
cultivated and higher values of farm tools are more likely to adopt new technology. To the extent
that women farmers may have less education, less access to land and own fewer tools, they may be
less likely to adopt new technologies.
It appears from the evidence that women farmers who are also household heads may be
affected more by the constraints on input access and technology adoption. Croppenstedt et al.
(2003) found that female‐headed and male‐headed households of equal factor endowments do not
differ in their adoption and intensity of fertilizer use; however, female‐headed households are
generally at the lower end of the endowment distribution and any differences are driven by this fact.
Doss and Morris (2001) found that female farmers residing in male‐headed households in Ghana are
just as likely to adopt new technologies as male farmers, while female farmers in female‐headed
households are less likely to adopt than male farmers, ceteris paribus. The reason seems to be that
female‐headed households tend on average to be smaller than male‐headed households and have
lower incomes3.
When considering access to cash crop markets, it is the unconditional differences in input use
and technological adoption between men and women that are important as it is the ability to
produce high‐value crops that counts. Quisumbing and Pandolfelli (2009) argued that women
farmers may be better able to adopt high‐value crops that do not require large initial investments or
asset ownership, since women’s access to credit is more constrained than men’s.
Human Capital
Most of the available evidence suggests that education (usually defined as formal schooling or
literacy) is an important additional determinant of the decision to adopt new technologies (as well as
of the decision to adopt new technologies early) since it increases the ability of the individual to
process relevant (new) information (Morrison et al., 2007). As suggested by Morrison et al. (2007),
to the extent that women are less educated than men, they are more likely to delay adoption or to
forgo it entirely. The adoption of new technologies is important for accessing cash crop markets
since these markets often require better quality products.
3 However, as stated by Doss and Morris (2001), it is difficult to disentangle the causal relationships among these factors. To the extent that household size and composition affect productivity, female‐headed households will be less productive. Reverse causality may also apply: a household may be female‐headed because the farm had low productivity and the male head left to find better opportunities.
Since cash crop may require a higher level of technology adoption, the low ability of women
farmer to process relevant and new information might also constraint their access to cash crop
markets. The importance of own‐schooling for adoption is probably greater in the case of female‐
headed households, where the potential for positive education spillovers to other household
members (male members) is reduced (Morrison et al., 2007). Doss and Morris (2001) found in their
Ghana study that female farmers in male‐headed households tend to have less formal schooling
than male farmers, and that female farmers in female‐headed households have even less. Similarly,
Croppenstedt et al. (2003) found that very few female‐headed households are literate, and virtually
none have four or more years of formal schooling.
Credit
A farmer's ability to obtain credit is often correlated with land tenure and agricultural
productivity (see for example, Hoff and Stiglitz, 1990; and Bell, 1990). Following Doss (2001), where
some land is titled, it may be difficult for a farmer whose land is not titled to obtain credit, a
common circumstance for many smallholders. Credit may also be tied to the lender's perception of
the farmers' ability to repay the loan. In this regard, to receive credit farmers have to prove their
ability to produce a marketable surplus, which is in turn associated to the type and size of the land
they work. Therefore, to the extent that women have less quality land, and are perceived as
producing more for home consumption and less for the market, they may have a harder time
obtaining credit when these criteria are employed. In addition, institutional bias towards providing
financial services to the head of the household owning title deeds discriminates against women who
are not head of the household (Vigneri and Holmes, 2009).
Extension Services
Agricultural extension services are an important instrument for the provision of information
on new technologies and crops (Anderson and Feder, 2003; Evenson, 2001; Doss and Morris, 2001).
However, extension services often fail to reach female farmers, in particular female‐headed farming
households (Doss and Morris, 2001; Quisumbing, 1994; Saito et al., 1994); even though, female
farmers often indicate a strong demand for such services (Saito et al., 1994). However, Doss and
Morris (2001) argue that the differential pattern of extension contact by gender may have less to do
with gender per se and more to do with the fact that extension agents tend to approach farmers
who are relatively better‐off in terms of access to and/or endowments of land, labor, and capital
(both human and financial), and who might already have a history of adopting technological
innovations. To the extent that women are under‐represented among these better‐off farmers, the
more likely extension agents are to overlook them in their extension programs.
Networks and Information
Learning about a new technology and its use from other farmers in the community (via
imitation or information exchange within social networks) has been shown to be an important
determinant of the adoption decision (Morrison et al., 2007). Conley and Udry (Forthcoming) found
that farmers in Ghana are more likely to have information links with other farmers of the same
gender, clan, and age, and that these links were important for technology diffusion. Similarly, Wier
and Knight (2000) found that 88 percent of adopters indicated that their decision was influenced by
somebody of the same gender. To the extent that female farmers have less‐extensive or poorer‐
quality information networks, knowledge transfer through these networks are more likely to be
impaired (Morrison et al., 2007).
Since cash crop may require a higher level of information to adopt improved crops, new
technologies or inputs, and obtain prices information, the reduced access to information by women
might constraint their access to cash crop markets. The importance of information constraints is
probably greater in the case of female‐headed households as suggested by Saito et al. (1994)who
noted that extension agents often prefer to talk to women in male‐headed households rather than
those in female‐headed households. Thus, a bias might not simply be based on gender, but also on
status and household structure.
2.4. Accessing output markets
As noted at the beginning of this section, the costs of transacting in output markets vary
considerably across individuals. Physical distance from markets is important, but so is access to
transport assets, or sources of market information (radios, mobile phones, personal relationships
with traders). Skills and human capital characteristics ‐ such as a capacity for contract negotiation ‐
will also impact the cost of transacting.
Research in the United States (Fu et al., 1988; Edelman, et al., 1990; Fletcher and Terza 1986)
has shown that farmer characteristics influence farmers’ choice of sale mechanism. They find that
the profile of producers associated with newer forms of market organisation largely coincides with
the expected profile of early adopters of new methods and technology (i.e. relatively more
educated, diligent information seeking, and willingness and ability to take risks). Fafchamps and Hill
(2005) find that for coffee farmers in Uganda, wealthy farmers are less likely to sell at the market if
they are selling a small amount, but are more likely to sell at the market the higher the quantity sold
reflecting their greater ability to pay for public transportation to the nearest market. They also find
that owning a bicycle is a significant determinant of transporting coffee to the nearby market.
A number of studies have shown that farmer characteristics determine whether or not they
enter contracts. Warning, Key and Soo Hoo (2005) suggest there is less access for smaller farmers to
contracts, as do Balsevich et al (2003) who found that in Costa Rica 80 percent of the volume of
vertical arrangements comes from medium and large‐scale producers and packers (p.1149).
However, Warning and Key (2002) find that rich and poor farmers have equal access to contract
farming arrangements in Senegal, and it was found that smallholders in Indonesia, unlike in Latin
America, are integrated into the modern value chain (Chowdhury et al., 2005).
To the extent that female farmers have differential levels of wealth, ownership of bicycles,
knowledge of trader networks, and access to market information we can expect differences in the
extent and nature of their transactions in output markets. Additionally, the higher the fixed costs of
transacting, the larger the scale of production is required. Female farmers also face many gender‐
specific constraints for accessing cash crop output markets as presented by Morrison et al. (2007).
These constraints include: (i) physical harassment by market or health officials when the high cost of
permits leads women to market their wares outside market boundaries; (ii) time burdens that
constrain women from seeking the best prices for their output; (iii) marital conflict if fluctuating
prices lead a husband to believe that his wife is withholding money from him because she brought
home more money on previous trips to the market. In addition, women’s farmer groups are less
successful than men’s groups both at searching for and accessing new output markets for their
existing products and at pursuing new products under contract arrangements, because men are
more likely to be approached for their products by agricultural companies or other chain actors who
wrongly assume that men are the primary producers in the household (Barham and Chitemi, 2009).
Finally, as stated before, men may also appropriate crops for which women are traditionally
responsible once they enter the market economy and become profitable.
3. Case Study: Producing cocoa in Ghana
This section presents an important example of how gender barriers in cash crops production affect
the productivity outcomes of women cultivating cocoa in Ghana. This case study is indicative of the
constraints in input use reviewed in section 2.3.
In a country like Ghana which is well on track to achieving Middle Income Status by 2015, and
where cocoa farmers represent a decreasing share of the rural poor, women remain a minority of
the population of smallholders growing the tree crop, and continue to share on uneven terms the
economic benefits of this internationally traded crop. Using original data for a period of observed
production expansion occurred between 2002 and 2004, this section offers insights on how male
and female cocoa farmers raised the land productivity on their managed farms given their different
levels of inputs use.
3.1. Background on cocoa in Ghana
The cocoa sector of Ghana is reputedly considered an engine of growth for the country’s
economy. Exports generate revenues which are second only to gold (in 2005 alone cocoa beans and
cocoa products jointly accounted for about 28 percent of total exports). Since 2001 a significant
share of the country’s agricultural productivity gains has been generated by the export crop (World
Bank 2008), with official production figures more than doubling between 2001 and 2003 alone.
Cocoa accounts for 10 percent of total crop and livestock production values (World Bank 2007),
contributing to 28 percent of agricultural growth in 2006 ‐ up from 19 per cent in 2001 (Breisinger et
al., 2008).
Unlike most other countries producing the crop, Ghana’s cocoa marketing system remains partly
liberalized, combining elements of a market‐based system with strong state regulation (Laven, 2007;
Fold, 2008). There are a proliferation of private buying companies who purchase cocoa directly from
the farmer, but the producer price is fixed by the state marketing board (Cocobod), which exercises
a regulatory role in the internal market and retains full control on all exports. As prices are fixed,
farmers choose between different private buyers based on a variety of non‐price criteria (cash,
reputation, loans, free inputs, and equipment).
At the micro level, cocoa provides livelihoods for over 700,000 smallholders. Cocoa, a perennial
tree crop with a life‐cycle of twenty‐five to thirty years, is characterized by a production technology
requiring the use of working capital mainly to hire labor for clearing and weeding the land, and to
purchase chemicals for controlling the spread of pests and diseases.
The key productive assets are land and labor. Changes in the mode of land acquisition have
taken place in Ghana since the mid‐1980s where an intestate law was introduced to allow individuals
to leave parts of their cultivated land in inheritance to both their spouse and children. Quisumbing et
al. (2004b) report that in Ghana’s Western region land is now transferred from husbands to wives
and children as gifts in return for the time spent to establish men cocoa fields. Once this land is given
it cannot be taken away by other family members, and this has partly contributed to increasing
women’s bargaining power in the sector.
Labor employed on cocoa farms, the second pivotal input to production, is clearly gender
differentiated by farming tasks. While male labor is essential for clearing and tree felling, female
labor is used for less physically demanding tasks such as weeding and harvesting. Asymmetric
divisions of labor in the household however, also mean that women are required to allocate a
substantial amount of time to domestic chores. Extensive responsibilities in the household,
combined with demands for working on husband’s land or farming activities, limit the time women
spend on their own productive economic assets, or it means they work many more hours a day than
men (Baden et al., 1994; Sarpong, 2006).
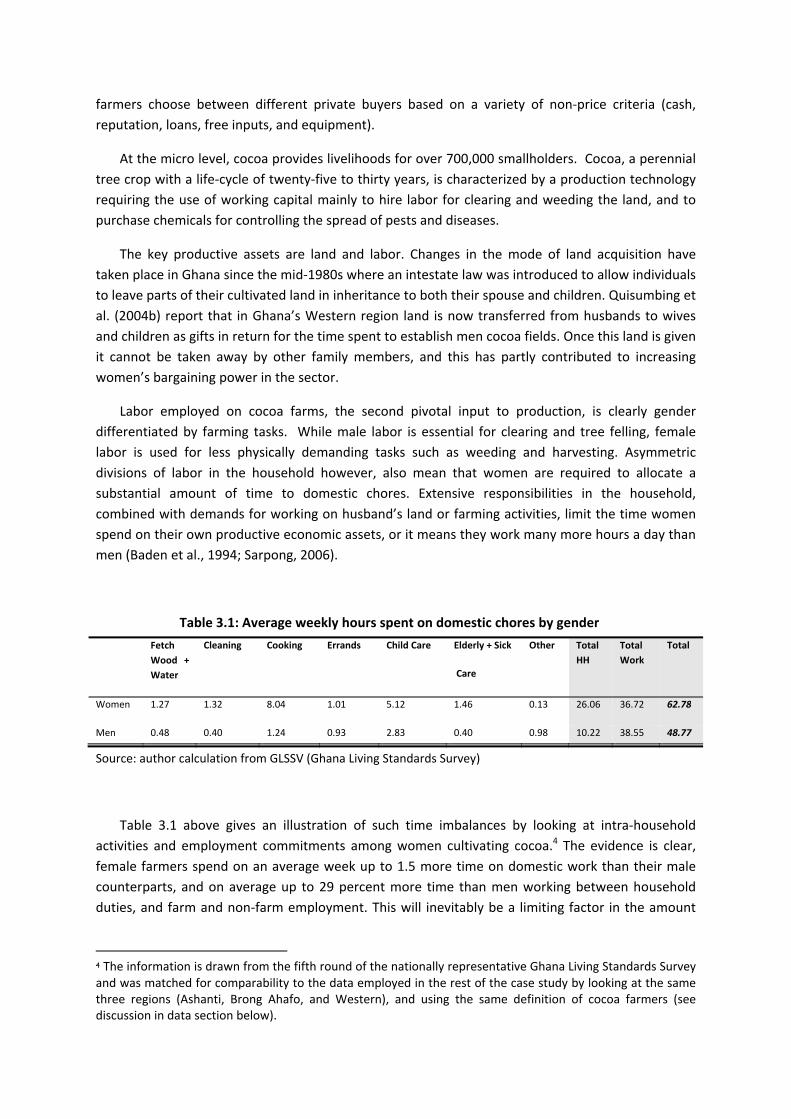
Table 3.1: Average weekly hours spent on domestic chores by gender
Fetch
Wood +
Water
Cleaning Cooking Errands Child Care Elderly + Sick
Care
Other Total
HH
Total
Work
Total
Women 1.27 1.32 8.04 1.01 5.12 1.46 0.13 26.06 36.72 62.78
Men 0.48 0.40 1.24 0.93 2.83 0.40 0.98 10.22 38.55 48.77
Source: author calculation from GLSSV (Ghana Living Standards Survey)
Table 3.1 above gives an illustration of such time imbalances by looking at intra‐household
activities and employment commitments among women cultivating cocoa.4 The evidence is clear,
female farmers spend on an average week up to 1.5 more time on domestic work than their male
counterparts, and on average up to 29 percent more time than men working between household
duties, and farm and non‐farm employment. This will inevitably be a limiting factor in the amount
4 The information is drawn from the fifth round of the nationally representative Ghana Living Standards Survey and was matched for comparability to the data employed in the rest of the case study by looking at the same three regions (Ashanti, Brong Ahafo, and Western), and using the same definition of cocoa farmers (see discussion in data section below).
and quality of time they can allocate to look after their cocoa farms, a point to which we return
below.
As for the non‐household labor hired in, annual labor is a comparatively cheaper way to
maintain a farm, as payment can be deferred until harvest (Masdar, 1998). Yet, the precarious state
of farmers’ finances means that many have become reluctant to enter into such contracts, and it is
daily wage contracts that are the most frequently used. However, hiring labor outside the household
requires availability of cash which farmers are in general very short of. As will be shown further
below, women farmers are often more cash constrained than their male counterparts, with this
implying that they are likely to face a more stringent constraint on this key resource, unless they are
able to source it from other household members.
There is, however, another type of non household labor known as nnoboa groups. These are
labor exchange groups, which are typically used more frequently by poorer farmers who cannot
afford to pay cash to obtain needed farm labor. There is an important difference in labor
deployment strategies between male and female farmers: male farmers generally tend to use more
nnoboa labor while female farmers rely more on wage labor. This is because female farmers cannot
obtain male labor through nnoboa, for which men and women form separate groups. Farmers need
male labor for strength‐demanding tasks such as tree felling, consequently, female farmers in the
lower wealth ranks who have no other means of procuring male labor, have to rely on wage or
annual labor.
3.2. Data
The dataset used in this case study is the Ghana Cocoa Farmers Survey (GCFS). This was first
collected in 2002, and had a follow up visit in 2004 which generated the two year panel described
below.
The GCFS covered a diverse range of instruments on land use, inputs, production, and marketing
choices (Teal et al., 2006). The original sampling frame for the 2002 baseline survey was the 1999
Ghana Living Standard Survey (GLSS), from which a representative cross section of cocoa farmers
was identified and compared with the production records of the cocoa marketing board (Cocobod).
This combined sampling methodology generated a representative geographical coverage in the
survey, which was carried out in the three most important areas of production ‐ Ashanti, Brong
Ahafo and Western (Vigneri, 2005).
An important feature of the GCFS is the definition of cocoa farmers used. These were identified
by the individuals managing all aspects relating to cocoa production: the amount of inputs used
(land, labor and non‐labor), the share of land allocated to the cultivation of the tree crop, and the
final choice of who to sell production to on the market; but were not necessarily the owner of the
land.
3.3. Characteristics of female and male managers
Cocoa has traditionally been considered a ‘men’s’ crop: because of the high returns it generates
and the intensity of the labor use requirements, male farmers have always featured as the dominant
gender in the composition of the cocoa farming population. More recently, however, with the
progressive individualization and commercialization of land rights (Quisumbing et al., 2004b),
cultivating cocoa trees has become a more gender balanced farming practice in that women are also
able to acquire land rights, and in so doing to manage their own farms and to retain control of the
income generated by their sales.
Cocoa production is particularly good for female farmers for two reasons: i) it can provide
women a more secure way to gain rights to land; and ii) it provides economic security as it is known
to represent over 75 percent of income to its smallholder producers (Teal et al., 2006; Vigneri, 2005).
Table 3.2 below describes the gender profile of farmers across the two rounds of the GCFS,
pointing to a number of differences in how men and women engage in the production of the crop.
The first feature in the sample is that it predominantly includes owners of land (on average 84
percent in 2002 and 89 percent in 2004). This is the case for both male and female farmers, and
largely mirrors the ownership status of smallholders observed in larger representative samples of
cocoa farmers’ population.
A clear distinction separates the gender profile of farmers: women are older and markedly less
educated than their male counterparts. They produce less cocoa on systematically smaller farms.
They are noticeably more cash constrained,5 apply lower levels of fertilizer and insecticide, and use
less agricultural equipment.
This evidence confirms the existence of important gender inequalities in the use of productive
resources. However, the one indicator in which male and female cocoa farmers do not show any
statistically significant difference is land productivity: the levels observed are comparable across
gender groups.
The second half of the table further highlights the differences in the composition of labor on
male and female farms, the labor to land ratios and labor productivity. In both years women employ
more household labor than men on each unit of farm land. What is interesting, though, is the use of
hired labor on the intensive margin and its productivity (output per unit of hired labor input)
observed on women controlled farms which are comparable to the figures observed on male
managed farms. Moreover, in 2004 the productivity of hired labor on women managed farms is
almost double as that observed on land controlled by male farmers.
5 By which we identify all farmers who do not have a bank account
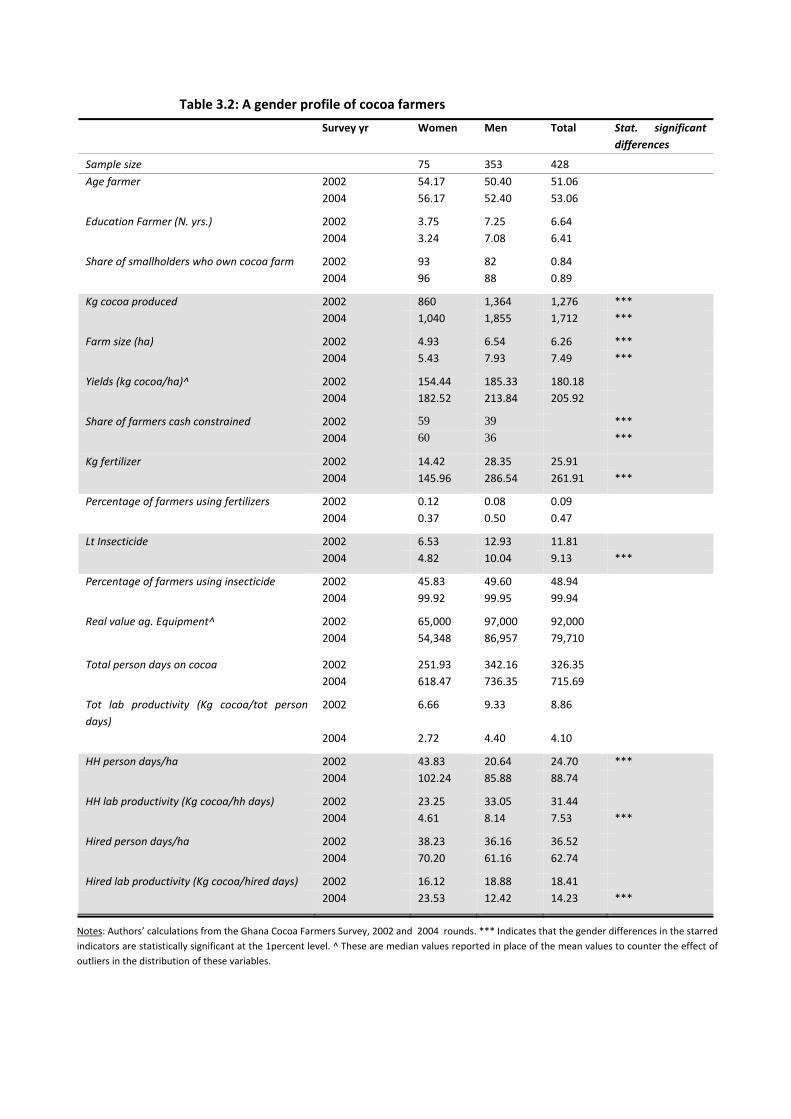
Table 3.2: A gender profile of cocoa farmers
Survey yr Women Men Total Stat. significant
differences
Sample size 75 353 428
Age farmer 2002 54.17 50.40 51.06
2004 56.17 52.40 53.06
Education Farmer (N. yrs.) 2002 3.75 7.25 6.64
2004 3.24 7.08 6.41
Share of smallholders who own cocoa farm 2002 93 82 0.84
2004 96 88 0.89
Kg cocoa produced 2002 860 1,364 1,276 ***
2004 1,040 1,855 1,712 ***
Farm size (ha) 2002 4.93 6.54 6.26 ***
2004 5.43 7.93 7.49 ***
Yields (kg cocoa/ha)^ 2002 154.44 185.33 180.18
2004 182.52 213.84 205.92
Share of farmers cash constrained 2002 59 39 ***
2004 60 36 ***
Kg fertilizer 2002 14.42 28.35 25.91
2004 145.96 286.54 261.91 ***
Percentage of farmers using fertilizers 2002 0.12 0.08 0.09
2004 0.37 0.50 0.47
Lt Insecticide 2002 6.53 12.93 11.81
2004 4.82 10.04 9.13 ***
Percentage of farmers using insecticide 2002 45.83 49.60 48.94
2004 99.92 99.95 99.94
Real value ag. Equipment^ 2002 65,000 97,000 92,000
2004 54,348 86,957 79,710
Total person days on cocoa 2002 251.93 342.16 326.35
2004 618.47 736.35 715.69
Tot lab productivity (Kg cocoa/tot person
days)
2002 6.66 9.33 8.86
2004 2.72 4.40 4.10
HH person days/ha 2002 43.83 20.64 24.70 ***
2004 102.24 85.88 88.74
HH lab productivity (Kg cocoa/hh days) 2002 23.25 33.05 31.44
2004 4.61 8.14 7.53 ***
Hired person days/ha 2002 38.23 36.16 36.52
2004 70.20 61.16 62.74
Hired lab productivity (Kg cocoa/hired days) 2002 16.12 18.88 18.41
2004 23.53 12.42 14.23 ***
Notes: Authors’ calculations from the Ghana Cocoa Farmers Survey, 2002 and 2004 rounds. *** Indicates that the gender differences in the starred
indicators are statistically significant at the 1percent level. ^ These are median values reported in place of the mean values to counter the effect of
outliers in the distribution of these variables.
This would suggest the existence of a gender difference in the allocative efficiency of productive
inputs, a point to which we return in greater detail in the empirical section below.
The third feature of the descriptive statistics is the use of fertilizer. Between 2002 and 2004 both
female and male cocoa farmers increased the amount of fertilizer used by a factor of nine. Adoption
rates, however, have not risen at par across gender groups. The percentage of women using
fertilizer has gone up by 25 percentage points, whilst that of men has increased by 42 percentage
points. This is a remarkable difference which indicates the persistence of substantial gender
differences in the access to and use of productive inputs.
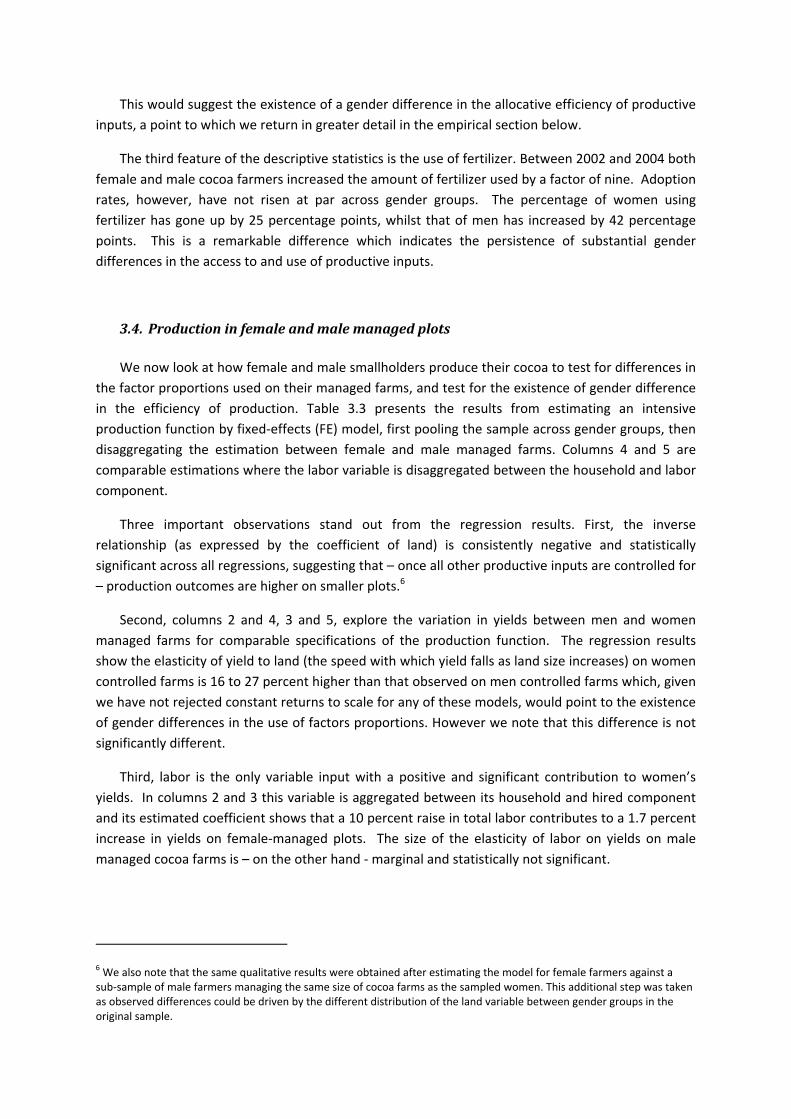
3.4. Production in female and male managed plots
We now look at how female and male smallholders produce their cocoa to test for differences in
the factor proportions used on their managed farms, and test for the existence of gender difference
in the efficiency of production. Table 3.3 presents the results from estimating an intensive
production function by fixed‐effects (FE) model, first pooling the sample across gender groups, then
disaggregating the estimation between female and male managed farms. Columns 4 and 5 are
comparable estimations where the labor variable is disaggregated between the household and labor
component.
Three important observations stand out from the regression results. First, the inverse
relationship (as expressed by the coefficient of land) is consistently negative and statistically
significant across all regressions, suggesting that – once all other productive inputs are controlled for
– production outcomes are higher on smaller plots.6
Second, columns 2 and 4, 3 and 5, explore the variation in yields between men and women
managed farms for comparable specifications of the production function. The regression results
show the elasticity of yield to land (the speed with which yield falls as land size increases) on women
controlled farms is 16 to 27 percent higher than that observed on men controlled farms which, given
we have not rejected constant returns to scale for any of these models, would point to the existence
of gender differences in the use of factors proportions. However we note that this difference is not
significantly different.
Third, labor is the only variable input with a positive and significant contribution to women’s
yields. In columns 2 and 3 this variable is aggregated between its household and hired component
and its estimated coefficient shows that a 10 percent raise in total labor contributes to a 1.7 percent
increase in yields on female‐managed plots. The size of the elasticity of labor on yields on male
managed cocoa farms is – on the other hand ‐ marginal and statistically not significant.
6 We also note that the same qualitative results were obtained after estimating the model for female farmers against a sub‐sample of male farmers managing the same size of cocoa farms as the sampled women. This additional step was taken as observed differences could be driven by the different distribution of the land variable between gender groups in the original sample.
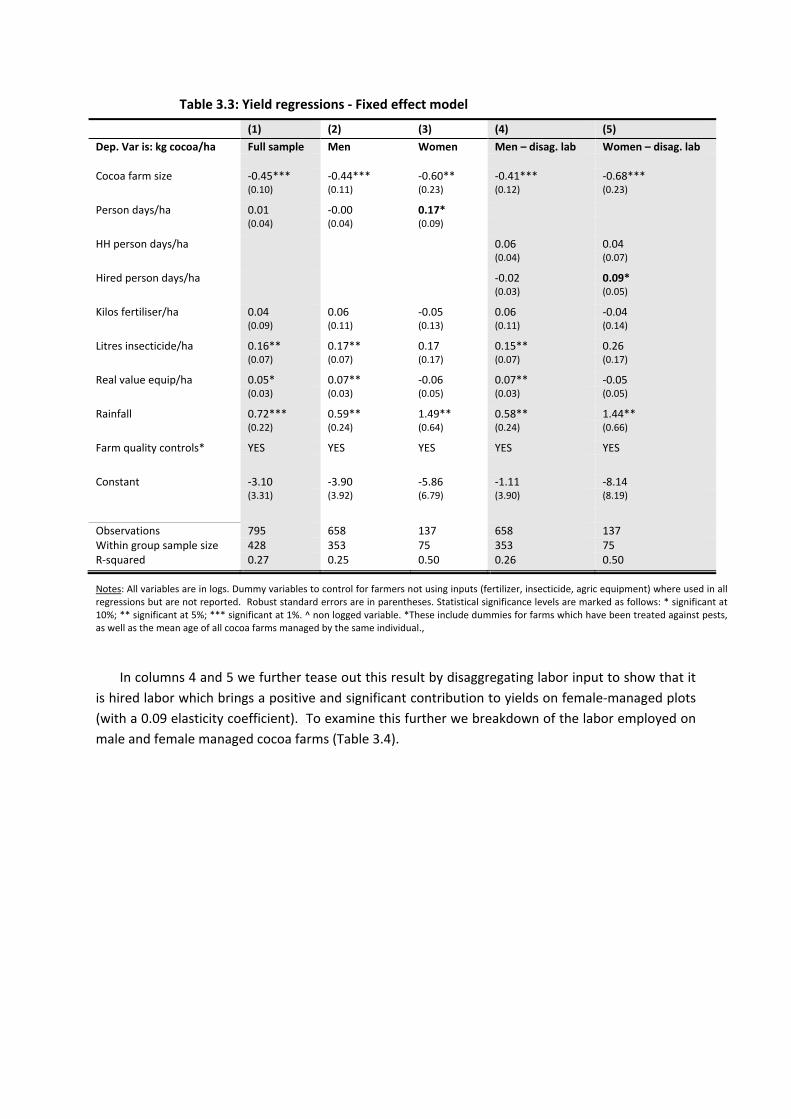
Table 3.3: Yield regressions ‐ Fixed effect model
(1) (2) (3) (4) (5)
Dep. Var is: kg cocoa/ha Full sample Men Women Men – disag. lab Women – disag. lab Cocoa farm size ‐0.45*** ‐0.44*** ‐0.60** ‐0.41*** ‐0.68*** (0.10) (0.11) (0.23) (0.12) (0.23)
Person days/ha 0.01 ‐0.00 0.17* (0.04) (0.04) (0.09)
HH person days/ha 0.06 0.04 (0.04) (0.07)
Hired person days/ha ‐0.02 0.09* (0.03) (0.05)
Kilos fertiliser/ha 0.04 0.06 ‐0.05 0.06 ‐0.04 (0.09) (0.11) (0.13) (0.11) (0.14)
Litres insecticide/ha 0.16** 0.17** 0.17 0.15** 0.26 (0.07) (0.07) (0.17) (0.07) (0.17)
Real value equip/ha 0.05* 0.07** ‐0.06 0.07** ‐0.05 (0.03) (0.03) (0.05) (0.03) (0.05)
Rainfall 0.72*** 0.59** 1.49** 0.58** 1.44** (0.22) (0.24) (0.64) (0.24) (0.66)
Farm quality controls* YES YES YES YES YES
Constant ‐3.10 ‐3.90 ‐5.86 ‐1.11 ‐8.14 (3.31) (3.92) (6.79) (3.90) (8.19)
Observations 795 658 137 658 137 Within group sample size 428 353 75 353 75 R‐squared 0.27 0.25 0.50 0.26 0.50
Notes: All variables are in logs. Dummy variables to control for farmers not using inputs (fertilizer, insecticide, agric equipment) where used in all regressions but are not reported. Robust standard errors are in parentheses. Statistical significance levels are marked as follows: * significant at 10%; ** significant at 5%; *** significant at 1%. ^ non logged variable. *These include dummies for farms which have been treated against pests, as well as the mean age of all cocoa farms managed by the same individual.,
In columns 4 and 5 we further tease out this result by disaggregating labor input to show that it
is hired labor which brings a positive and significant contribution to yields on female‐managed plots
(with a 0.09 elasticity coefficient). To examine this further we breakdown of the labor employed on
male and female managed cocoa farms (Table 3.4).
Table 3.4: labor employed on male and female managed cocoa farms
Source: Ghana Cocoa Farmers Survey, 2002 and 2004 rounds
While the limited number of observations in this case study does not allow to conduct further
regression analysis on the ‘labor’ effect that we find, this table provides some indications. We note a
striking feature of how male and female cocoa farmers have increased the labor deployed on their
farm over the period of increased expansion. Male farmers increased the input from male members
in their households by almost a factor of four and increased other sources of family and hired labor
more moderately (between 35‐64 percent), even decreasing their use of nnoboa labor. Female
farmers substantially increased the amount of female household labor as well as all three
components of hired labor. In particular increases annual and nnoboa labor—the sources of hired
labor less subject to cash constraints—were large (247‐271 percent).
In sum, the Ghana case study on women farming cocoa provides three important lessons about
gender differences in high value cash crops. First, while women farmers remain a minority group
among smallholders engaged in the cultivation of these crops, there are some clear signals that the
conditions underlying this imbalance are changing. The progressive, more individualized evolution
of land rights ‐ which is observed in cases such as the Ghanaian one discussed above – provides
some clear if not common illustrations of the benefits from relaxing important barriers historically
faced by women farmers in securing privileges over the farms they manage which – consequently –
strengthen their control over the cash income generated from marketing the crops they grow.
Secondly, and in line with what is known in the literature, female‐managed farms are as productive
Person Days Employed
survey Female MCF Male MCF
2002 HH men 56.12 38.63
2004 75.17 186.05
t 0.34 3.82
2002 HH women 28.40 47.68
2004 75.63 78.18
t 1.66 0.64
2002 HH child 9.68 8.49
2004 11.15 11.48
t 0.15 0.35
2002 Annual 16.12 43.97
2004 56.01 59.81
t 2.47 0.36
2002 Daily wage 130.85 168.10
2004 226.08 274.55
t 0.73 0.63
2002 Nnoboa 10.76 35.04
2004 39.87 26.18
t 2.71 ‐0.25
as male‐managed ones. In fact the data shows that, if anything, female farmers became more
productive than their male counterparts at a time of expansion in the sector as a whole. Thirdly, and
more importantly for the general thrust of this paper, we have shown that the ‘all else equal’
statement in the available empirical evidence on comparable productivity outcomes observed on
male and female managed farms conceals important differences in how women access productive
inputs. In the case of cocoa we have shown that female farmers were able to increase the hired
labor component and in doing so, increase their productivity. However, they do so by increasing use
of a particular type of non‐household labor labor(nnoboa) that is not subject to cash constraints.
They also do not sufficiently increase their use of non‐labor inputs – again possibly as a result of
serious cash constraints and this implies their use of labor intensive, low‐tech production
technologies.
4. Case Study: Marketing coffee in Uganda
In this section we present data on coffee transactions for 300 coffee farmers in the central and
western districts of Uganda. A quarter of the households in the sample are female headed, and this
analysis presents data on the differences in coffee production and harvesting, access to market
information, the nature of coffee market transactions between male and female headed
households. We first provide some background information on coffee production and marketing in
Uganda, and describe the data collected.
4.1. Background on coffee in Uganda
Uganda is a land‐locked country blessed with fertile soil, sufficient rainfall and plentiful natural
resources. As peace established itself after years of civil war Uganda experienced substantial growth.
With growth came reductions in urban and rural poverty, both as a result of increased agricultural
productivity and increased sources of off‐farm income (Appleton, 2001a; Appleton, 2001b). Poverty
fell from 56 percent in 1992 to 31 percent in 2006, resulting in part from increased returns to
agricultural production and in part from growth in off‐farm income. Poverty remains high in rural
areas, particularly areas in the north and east which have not traditionally been large areas of coffee
production.
Coffee is Uganda’s largest export good, comprising 26 percent of export earnings in 2000/2001,
and providing direct and indirect, partial employment to an estimated 5 million people (Bank of
Uganda, 2001; Kempaka, 2001). Robusta coffee accounts for nearly 90 percent of Uganda’s coffee
production with the remainder being Arabica, grown in highland areas in the East, on the slopes of
Mount Elgon, around the Rwenzori Mountains in the West, and in the West Nile. Robusta is
predominantly grown in lowland areas in central and south western Uganda. Like so much
commodity crop production in low income countries, production of coffee is concentrated amongst
small‐holder farmers. In Uganda, coffee is usually intercropped with staple crops ‐ often matooke (a
banana‐like staple), beans, sweet potatoes and maize. The production technology is basic. Few
farmers use purchased inputs such as fertilizer or pesticides, and few use of modern farming
methods such as irrigation.
In comparison to other crops that Ugandan coffee farmers have available to them to grow,
coffee is a relatively profitable crop. The Uganda Coffee Development Authority provides some
estimates of the costs of growing coffee, which can be used to estimate the return to coffee
production for an average farmer.7 For traditional Robusta the costs of production are low,
amounting mainly to labor and land costs. The UCDA study calculated 100 days of man labor were
needed to produce 1,000 kilos of kiboko from one hectare of land. Using the UCDA study and
estimates of the rental price of land per hectare from Deininger and Mpuga (2002), the per kilo cost
of production comes to about 190 shillings per kilo.8 The average price for a kilo of unmilled coffee
since coffee market liberalization at the end of 1991 is 30 cents (in 2001 prices), which suggests a
return of $197 per hectare. To compare this to the return from growing other crops, the return to
matooke production is estimated using information in Bibagambah (1996). The average yield of
matooke is 2,300 kilos per hectare, with a value of $182 per hectare.9 Very little labor maintenance
is needed for matooke ‐ only about 35 man days per hectare per year, which suggests the return to a
hectare planted with matooke is $150. However, although the average price of coffee since coffee
market liberalization is 30 cents, there is a large degree of variation in this price as Figure 4.1 shows ‐
much more so than for other crops. Prices during the year in which data was collected were much
lower than average: the median price recorded for a kilo of unmilled kiboko was 16 cents which
would imply a per hectare return of $57.89.
7 The data used comes from sensitivity studies conducted by UCDA throughout 2001 in which farmers in Masaka, Bushenyi and Kiboga regions of Uganda were interviewed. 8 The cost of man labor was estimated at $0.80 per day. The cost of inputs (which were unspecified) were $15.80. The cost of land was not factored into the UCDA analyses, but Deininger and Mpuga (Deininger and Mpuga 2002) state the rental price per hectare to range between $1.84 and $5.80 for the regions of Uganda sampled in the UCDA survey. 9 In 2001 matooke is sold at an average price of $0.80 for a ten kilo bunch.
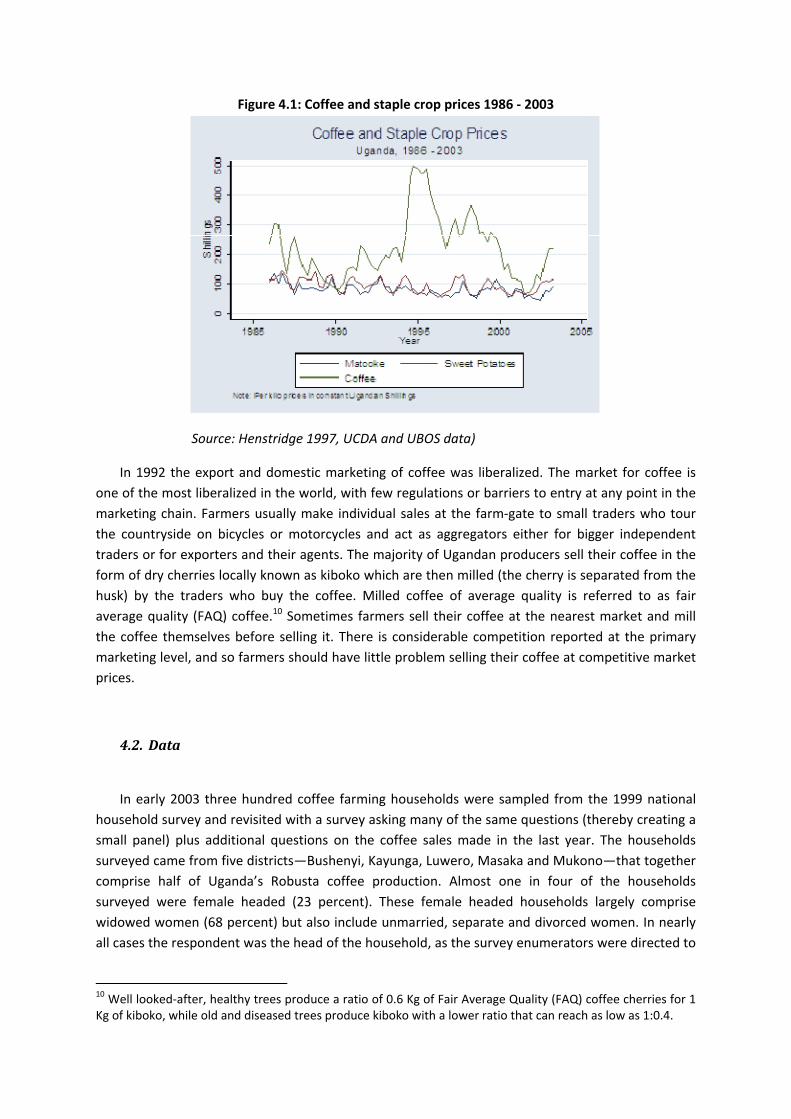
Figure 4.1: Coffee and staple crop prices 1986 ‐ 2003
Source: Henstridge 1997, UCDA and UBOS data)
In 1992 the export and domestic marketing of coffee was liberalized. The market for coffee is
one of the most liberalized in the world, with few regulations or barriers to entry at any point in the
marketing chain. Farmers usually make individual sales at the farm‐gate to small traders who tour
the countryside on bicycles or motorcycles and act as aggregators either for bigger independent
traders or for exporters and their agents. The majority of Ugandan producers sell their coffee in the
form of dry cherries locally known as kiboko which are then milled (the cherry is separated from the
husk) by the traders who buy the coffee. Milled coffee of average quality is referred to as fair
average quality (FAQ) coffee.10 Sometimes farmers sell their coffee at the nearest market and mill
the coffee themselves before selling it. There is considerable competition reported at the primary
marketing level, and so farmers should have little problem selling their coffee at competitive market
prices.
4.2. Data
In early 2003 three hundred coffee farming households were sampled from the 1999 national
household survey and revisited with a survey asking many of the same questions (thereby creating a
small panel) plus additional questions on the coffee sales made in the last year. The households
surveyed came from five districts—Bushenyi, Kayunga, Luwero, Masaka and Mukono—that together
comprise half of Uganda’s Robusta coffee production. Almost one in four of the households
surveyed were female headed (23 percent). These female headed households largely comprise
widowed women (68 percent) but also include unmarried, separate and divorced women. In nearly
all cases the respondent was the head of the household, as the survey enumerators were directed to
10 Well looked‐after, healthy trees produce a ratio of 0.6 Kg of Fair Average Quality (FAQ) coffee cherries for 1 Kg of kiboko, while old and diseased trees produce kiboko with a lower ratio that can reach as low as 1:0.4.
speak to someone who was knowledgeable about the production and marketing of the crop. And
this was the household head.
Whilst detailed data on the nature of coffee sales was collected, there was no question that
asked who it was that made the sale. We make the assumption that in male‐headed households it
was the male head that made the sale, and in female headed households it was the female head.
The analysis in the proceeding sections thus relies on a comparison of male and female headed
households. Whilst this is, in general, an imperfect proxy in this context it is an appropriate
approximation (although still is an approximation), as coffee sales are in general handled by the
head of the household.
4.3. Characteristics of female and male headed households
Table 4.1 compares basic characteristics of female and male headed households. We see that
there are a number of basic differences between these households. Female‐headed households
have less labor, land and coffee trees than male headed households. In particular the difference in
the mean size of land owned and thus the number of coffee trees owned is substantial. To
determine whether this is driven by outliers we also compare the median of these two variables. The
median value of land owned by male headed households is 4 acres and the median number of trees
is 200, Compared to 3 acres and 100 trees for female‐headed households. A Pearson Chi‐squared
test shows that the null of equal medians can be rejected at 1 percent degree of significance for
both variables.
Female headed households also tend to have lower levels of wealth and lower levels of
education. Women household heads also tend to be older, given many women head a household
once their male partner has died. As a result of these basic differences in scale, liquidity and human
capital we may expect crop choice, production methods and access to markets to be quite different
for male and female headed households.
Table 4.1 also presents some information on the nature of coffee production. First we note that
women plant proportionately fewer trees—15 percent of the trees women plant are too young to
produce compared to 23 percent of trees owned by male‐headed households. This may be as a
result of the lower level of wealth (and perhaps liquidity) that female headed households have
access to: planting coffee entails no coffee income for three years as the trees mature, and this can
be a prohibitive cost for poor households (Hill, 2008). The share of labor allocated to coffee
production and the proportion of trees harvested are comparable between these two types of
households, as is the yield per tree (counting only those trees in production). However, because
female‐headed households farm on a much smaller scale than male‐headed households, the
quantities sold by women are much smaller than the quantities sold by men. Transactions made by
female headed households are 47kg on average compared to 151 kg for men. Again we also
compare the median values of quantities sold. The median quantity (of FAQ equivalent) sold by
women is 32.4kg and 54kg for men. A Pearson Chi‐squared test shows that the null of equal medians
can be rejected at 1 percent degree of significance.
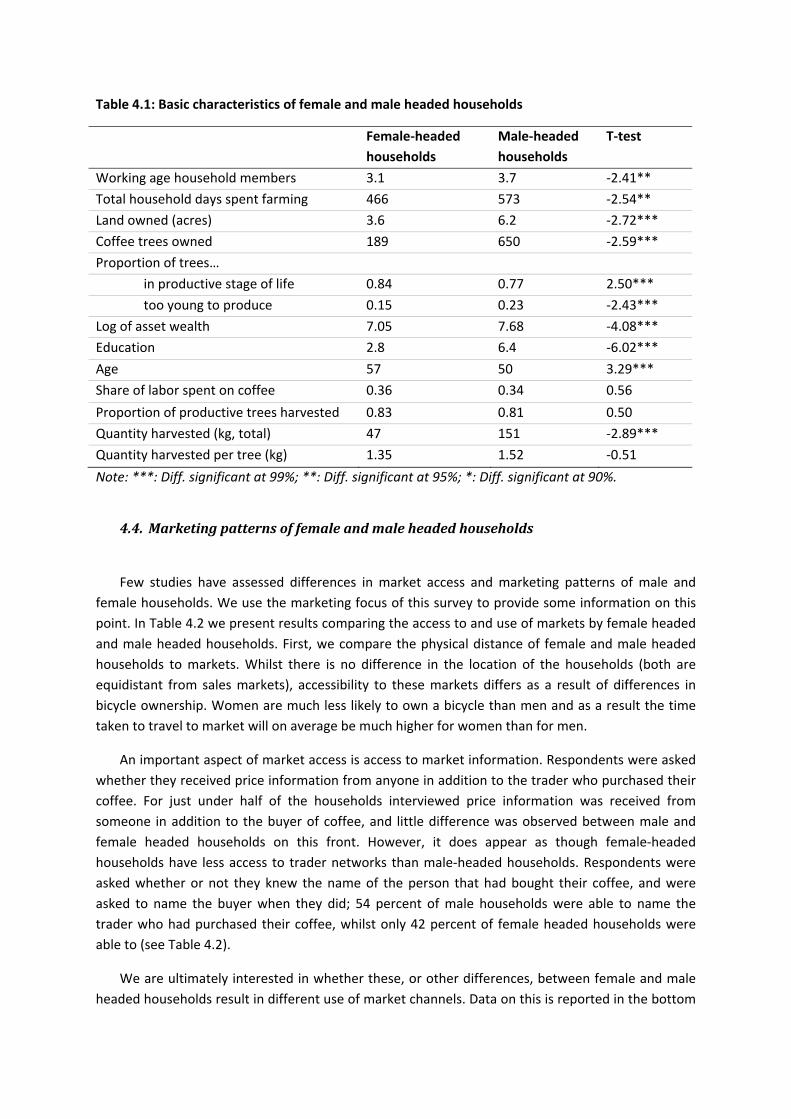
Table 4.1: Basic characteristics of female and male headed households
Female‐headed
households
Male‐headed
households
T‐test
Working age household members 3.1 3.7 ‐2.41**
Total household days spent farming 466 573 ‐2.54**
Land owned (acres) 3.6 6.2 ‐2.72***
Coffee trees owned 189 650 ‐2.59***
Proportion of trees…
in productive stage of life 0.84 0.77 2.50***
too young to produce 0.15 0.23 ‐2.43***
Log of asset wealth 7.05 7.68 ‐4.08***
Education 2.8 6.4 ‐6.02***
Age 57 50 3.29***
Share of labor spent on coffee 0.36 0.34 0.56
Proportion of productive trees harvested 0.83 0.81 0.50
Quantity harvested (kg, total) 47 151 ‐2.89***
Quantity harvested per tree (kg) 1.35 1.52 ‐0.51
Note: ***: Diff. significant at 99%; **: Diff. significant at 95%; *: Diff. significant at 90%.
4.4. Marketing patterns of female and male headed households
Few studies have assessed differences in market access and marketing patterns of male and
female households. We use the marketing focus of this survey to provide some information on this
point. In Table 4.2 we present results comparing the access to and use of markets by female headed
and male headed households. First, we compare the physical distance of female and male headed
households to markets. Whilst there is no difference in the location of the households (both are
equidistant from sales markets), accessibility to these markets differs as a result of differences in
bicycle ownership. Women are much less likely to own a bicycle than men and as a result the time
taken to travel to market will on average be much higher for women than for men.
An important aspect of market access is access to market information. Respondents were asked
whether they received price information from anyone in addition to the trader who purchased their
coffee. For just under half of the households interviewed price information was received from
someone in addition to the buyer of coffee, and little difference was observed between male and
female headed households on this front. However, it does appear as though female‐headed
households have less access to trader networks than male‐headed households. Respondents were
asked whether or not they knew the name of the person that had bought their coffee, and were
asked to name the buyer when they did; 54 percent of male households were able to name the
trader who had purchased their coffee, whilst only 42 percent of female headed households were
able to (see Table 4.2).
We are ultimately interested in whether these, or other differences, between female and male
headed households result in different use of market channels. Data on this is reported in the bottom
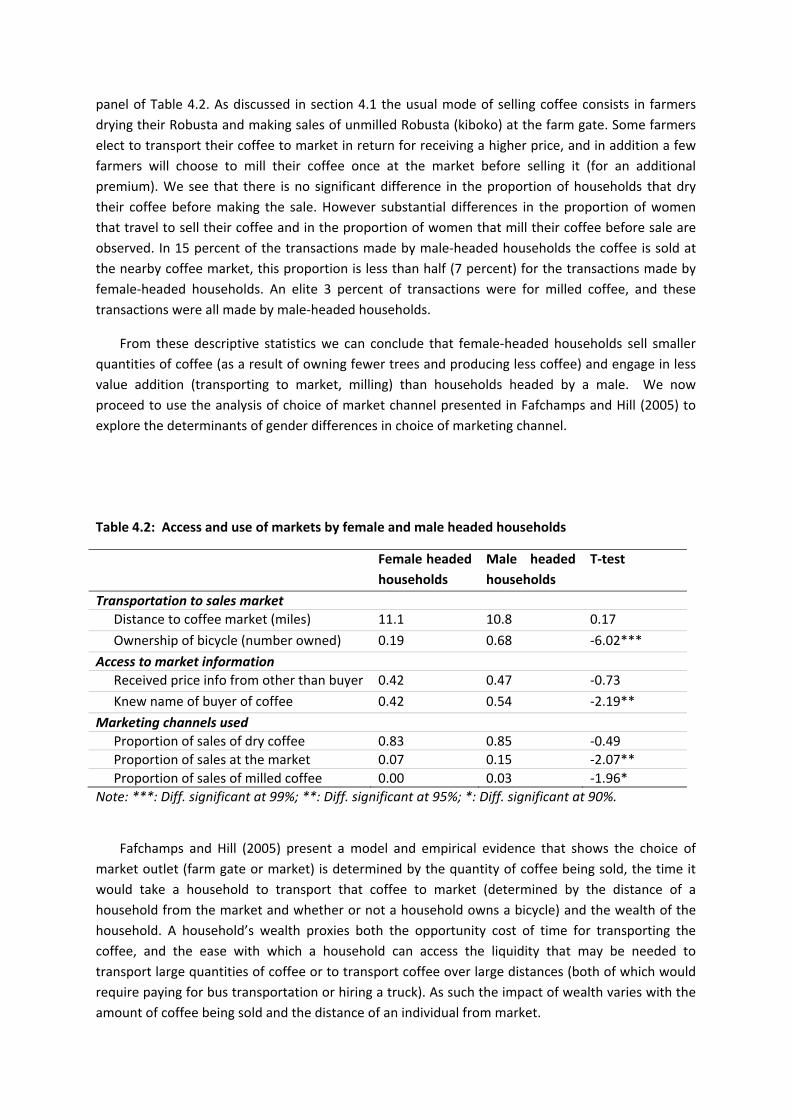
panel of Table 4.2. As discussed in section 4.1 the usual mode of selling coffee consists in farmers
drying their Robusta and making sales of unmilled Robusta (kiboko) at the farm gate. Some farmers
elect to transport their coffee to market in return for receiving a higher price, and in addition a few
farmers will choose to mill their coffee once at the market before selling it (for an additional
premium). We see that there is no significant difference in the proportion of households that dry
their coffee before making the sale. However substantial differences in the proportion of women
that travel to sell their coffee and in the proportion of women that mill their coffee before sale are
observed. In 15 percent of the transactions made by male‐headed households the coffee is sold at
the nearby coffee market, this proportion is less than half (7 percent) for the transactions made by
female‐headed households. An elite 3 percent of transactions were for milled coffee, and these
transactions were all made by male‐headed households.
From these descriptive statistics we can conclude that female‐headed households sell smaller
quantities of coffee (as a result of owning fewer trees and producing less coffee) and engage in less
value addition (transporting to market, milling) than households headed by a male. We now
proceed to use the analysis of choice of market channel presented in Fafchamps and Hill (2005) to
explore the determinants of gender differences in choice of marketing channel.
Table 4.2: Access and use of markets by female and male headed households
Female headed
households
Male headed
households
T‐test
Transportation to sales market
Distance to coffee market (miles) 11.1 10.8 0.17
Ownership of bicycle (number owned) 0.19 0.68 ‐6.02***
Access to market information
Received price info from other than buyer 0.42 0.47 ‐0.73
Knew name of buyer of coffee 0.42 0.54 ‐2.19**
Marketing channels used
Proportion of sales of dry coffee 0.83 0.85 ‐0.49
Proportion of sales at the market 0.07 0.15 ‐2.07**
Proportion of sales of milled coffee 0.00 0.03 ‐1.96*
Note: ***: Diff. significant at 99%; **: Diff. significant at 95%; *: Diff. significant at 90%.
Fafchamps and Hill (2005) present a model and empirical evidence that shows the choice of
market outlet (farm gate or market) is determined by the quantity of coffee being sold, the time it
would take a household to transport that coffee to market (determined by the distance of a
household from the market and whether or not a household owns a bicycle) and the wealth of the
household. A household’s wealth proxies both the opportunity cost of time for transporting the
coffee, and the ease with which a household can access the liquidity that may be needed to
transport large quantities of coffee or to transport coffee over large distances (both of which would
require paying for bus transportation or hiring a truck). As such the impact of wealth varies with the
amount of coffee being sold and the distance of an individual from market.
Table 4.1 and Table 4.2 highlighted that a number of these determinants of market choice vary
between female and male‐headed households: female‐headed households are poorer, sell smaller
quantities of coffee and are less likely to own bikes than male‐headed households. Any or all of
these differences could drive the gender differences we observe in choice of market channel. To
determine the relative importance of these factors we re‐estimate the Fafchamps and Hill model,
adding in a dummy that takes the value 1 if the household is headed by a female. Results are
presented in Table 4.3. In the first column we show the simple gender difference in the probability of
selling at the market and the farm‐gate. This difference is significant at 5 percent. In the final column
(column 6) we estimate the full model including the gender dummy. Once distance, quantity and
wealth are included there is no significant difference in the way female and male‐headed
households market. Gender differences thus arise as a result of differences in these other
characteristics.
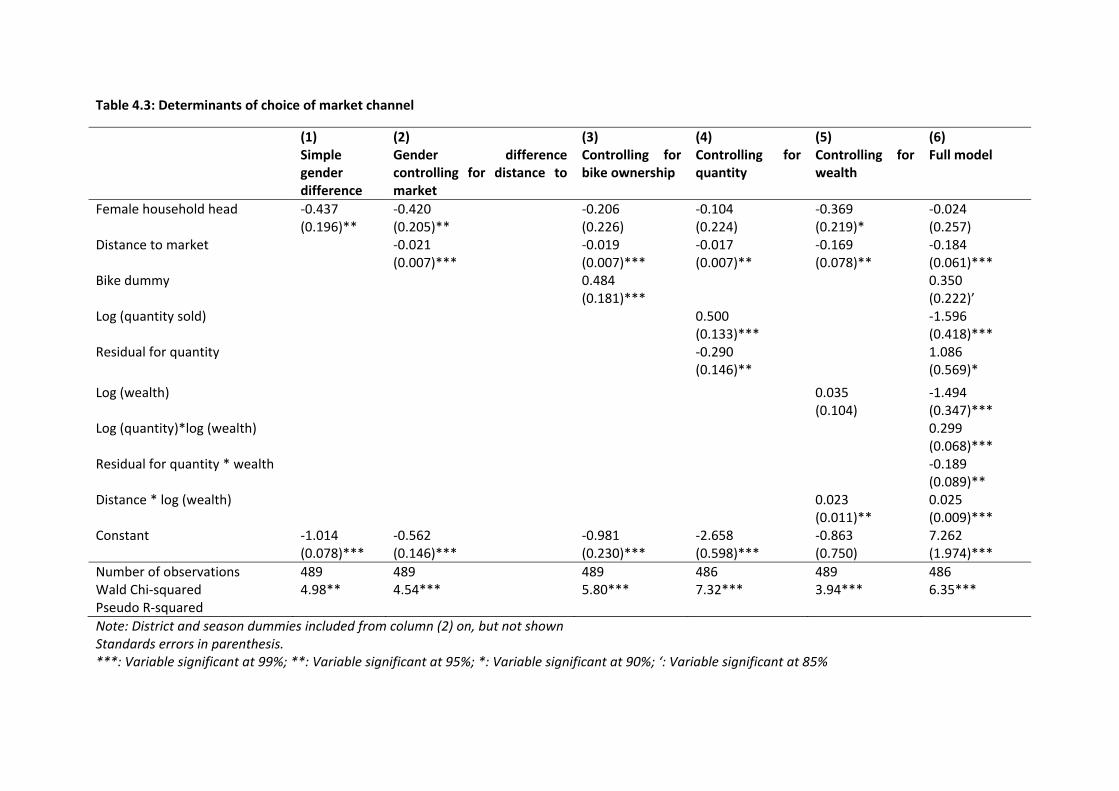
Table 4.3: Determinants of choice of market channel
(1) Simple gender difference
(2) Gender difference controlling for distance to market
(3) Controlling for bike ownership
(4) Controlling for quantity
(5) Controlling for wealth
(6) Full model
Female household head ‐0.437 (0.196)**
‐0.420 (0.205)**
‐0.206 (0.226)
‐0.104 (0.224)
‐0.369 (0.219)*
‐0.024 (0.257)
Distance to market ‐0.021 (0.007)***
‐0.019 (0.007)***
‐0.017 (0.007)**
‐0.169 (0.078)**
‐0.184 (0.061)***
Bike dummy 0.484 (0.181)***
0.350 (0.222)’
Log (quantity sold) 0.500 (0.133)***
‐1.596 (0.418)***
Residual for quantity ‐0.290 (0.146)**
1.086 (0.569)*
Log (wealth) 0.035 (0.104)
‐1.494 (0.347)***
Log (quantity)*log (wealth) 0.299 (0.068)***
Residual for quantity * wealth ‐0.189 (0.089)**
Distance * log (wealth) 0.023 (0.011)**
0.025 (0.009)***
Constant ‐1.014 (0.078)***
‐0.562 (0.146)***
‐0.981 (0.230)***
‐2.658 (0.598)***
‐0.863 (0.750)
7.262 (1.974)***
Number of observations 489 489 489 486 489 486 Wald Chi‐squared 4.98** 4.54*** 5.80*** 7.32*** 3.94*** 6.35*** Pseudo R‐squared
Note: District and season dummies included from column (2) on, but not shown Standards errors in parenthesis. ***: Variable significant at 99%; **: Variable significant at 95%; *: Variable significant at 90%; ‘: Variable significant at 85%
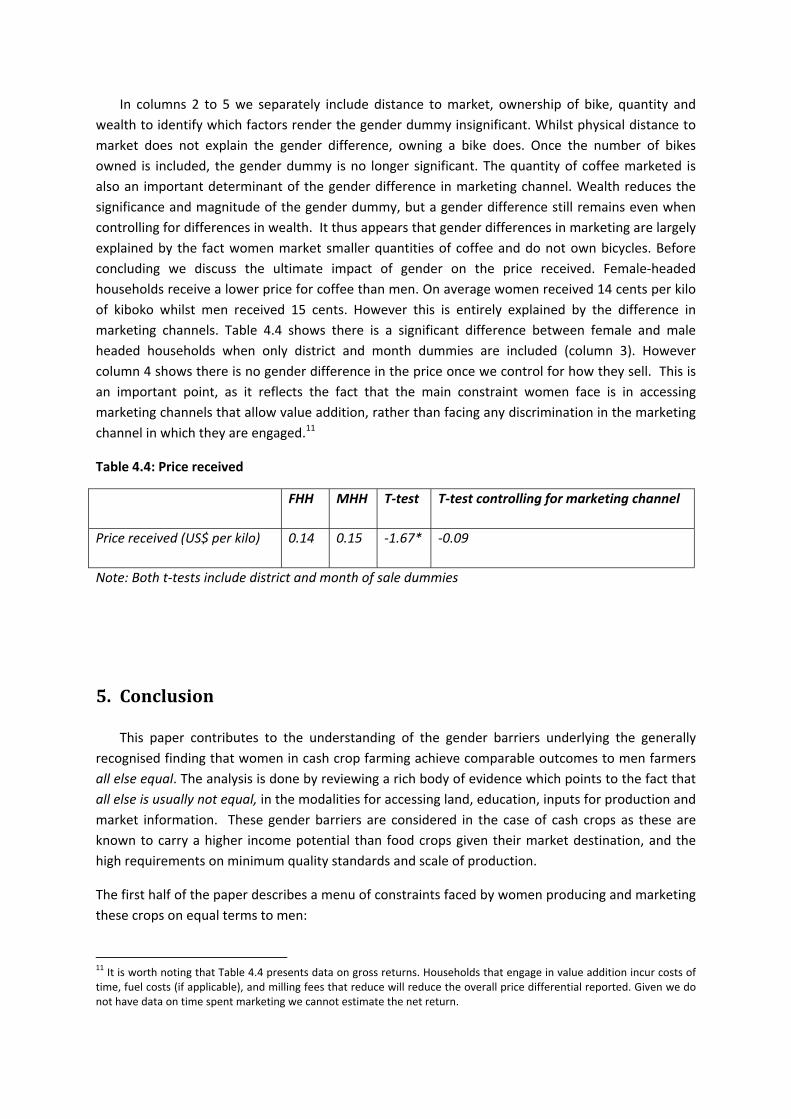
In columns 2 to 5 we separately include distance to market, ownership of bike, quantity and
wealth to identify which factors render the gender dummy insignificant. Whilst physical distance to
market does not explain the gender difference, owning a bike does. Once the number of bikes
owned is included, the gender dummy is no longer significant. The quantity of coffee marketed is
also an important determinant of the gender difference in marketing channel. Wealth reduces the
significance and magnitude of the gender dummy, but a gender difference still remains even when
controlling for differences in wealth. It thus appears that gender differences in marketing are largely
explained by the fact women market smaller quantities of coffee and do not own bicycles. Before
concluding we discuss the ultimate impact of gender on the price received. Female‐headed
households receive a lower price for coffee than men. On average women received 14 cents per kilo
of kiboko whilst men received 15 cents. However this is entirely explained by the difference in
marketing channels. Table 4.4 shows there is a significant difference between female and male
headed households when only district and month dummies are included (column 3). However
column 4 shows there is no gender difference in the price once we control for how they sell. This is
an important point, as it reflects the fact that the main constraint women face is in accessing
marketing channels that allow value addition, rather than facing any discrimination in the marketing
channel in which they are engaged.11
Table 4.4: Price received
FHH MHH T‐test T‐test controlling for marketing channel
Price received (US$ per kilo) 0.14 0.15 ‐1.67* ‐0.09
Note: Both t‐tests include district and month of sale dummies
5. Conclusion
This paper contributes to the understanding of the gender barriers underlying the generally
recognised finding that women in cash crop farming achieve comparable outcomes to men farmers
all else equal. The analysis is done by reviewing a rich body of evidence which points to the fact that
all else is usually not equal, in the modalities for accessing land, education, inputs for production and
market information. These gender barriers are considered in the case of cash crops as these are
known to carry a higher income potential than food crops given their market destination, and the
high requirements on minimum quality standards and scale of production.
The first half of the paper describes a menu of constraints faced by women producing and marketing
these crops on equal terms to men:
11 It is worth noting that Table 4.4 presents data on gross returns. Households that engage in value addition incur costs of time, fuel costs (if applicable), and milling fees that reduce will reduce the overall price differential reported. Given we do not have data on time spent marketing we cannot estimate the net return.
The size of land cultivated is often smaller and the rights over land are difficult to
establish;
Labor on women’s farms is scarce—women are severely time constrained owing to the
numerous intra‐household chores they are responsible for and can often rely on fewer
male household members‐‐and women face difficulties in purchasing waged labor;
Formal education achievements are systematically lower;
Access to credit is reduced and hindered by lack of collateral and because of social
norms which often select them out of available credit schemes;
Information on new crop varieties and market conditions, and access to trader networks
is often not good, limiting female farmer’s ability to make the best informed decisions
on production and sales.
In describing the sources of such constraints we point to the fact that women cultivating cash
crops face a problem of interlocked barriers in accessing different productive resources. By this we
mean that it is often their initial condition of owning less land for these crops, and of being less
informed about how best to produce and market their harvest that hinders access to credit to
purchase inputs. This in turn reduces the total amount of crop they harvest, which can make it
unattractive to sustain the costs of market transactions.
The second section of the paper then illustrates a number of key findings about women farming
two high value exportable cash crops‐‐cocoa in Ghana and coffee in Uganda‐‐using original data
collected by the authors. From the gender specific information available in these data, we draw a
number of suggestive conclusions. First, we reiterate a point largely documented in the existing
literature: women are just as productive as men and receive just as high prices as men when they
farm with equal resources and sell their crops in the same way. Second, rarely do women have
similar access to assets and markets as men and this has non‐trivial implications for how they
produce and market the cash crops.
In the Ghanaian case, limited access to liquidity for purchasing inputs induces women farmers to
adopt sub‐optimal production technologies (that are labor and land using; the two factors which are
more costly/scarce to farmers).
In the Uganda case study, the low quantities marketed, and lack of access to bicycles constrain
female farmers to marketing channels that have very low transaction costs, but also lower prices.
While we acknowledge that our conclusions are based on two very specific crops and contexts
(both cocoa and coffee are traditional perennial export cash crops, quite different in nature from
newer cash crop markets, such as cash crop production for domestic markets, or horticulture or
flower exports), we are able to draw three context‐specific recommendations from this analysis.
1. In contexts in which food crop markets are characterised by poor integration and
relatively high price volatility, scale in production will be an important determinant of
whether or not individuals produce cash crops, disproportionately affecting female
farmers that produce at a smaller scale. Both improving women’s access to land, and
encouraging better integration of food markets through improved roads, increased
mobile networks (to reduce trader search costs) will enable women to engage in cash
crop production.
2. In marketing channels characterised by high fixed costs of transacting, scale in marketing
is required, again disproportionately affecting female farmers for whom this is more
difficult. Whilst this would be addressed by increasing the scale at which female farmers
can produce, it could also be addressed by enabling a female farmer to market at scale
by combining their harvest with that of other farmers. Interventions that strengthen
female farmers groups, or marketing groups to which female farmers can belong, will
allow women to access marketing channels with high fixed costs, such as transporting
produce to the nearby market. Such interventions could include group leadership
training, financial management training, training group leaders on how to find buyers, or
introducing local buyers to female marketing groups. Directly reducing transaction costs
specifically faced by women—in the Uganda case by encouraging female use of bicycles
to be more socially acceptable—is also essential.
3. When purchasing quantity or quality enhancing inputs is difficult, female farmers may
compensate by increasing resources which do not require upfront payment in cash such
as labor. Whilst such substitution may be possible (even if costly) to produce for some
markets, other markets which require a certain seeds to be purchased, or certain sprays
to be applied may not allow for this. Improving access to credit (through contract
farming targeted at female farmers, improved access to microfinance for women, or
female savings schemes and credit associations) and extension becomes even more
important in ensuring cash crop production in these situations.
Further work in assessing the patterns and underlying determinants of female engagement in a
wide variety of cash crop markets is needed to better identify the most appropriate interventions.
This will require piloting some suggested interventions and evaluating their impact to better
determine how best to achieve access to inputs, lower transaction costs and scale in production and
marketing. This work should be done in a way that allows us to better understand the intra‐
household dynamics at play when cash crop markets develop, something that we were not able to
fully address in this paper.
Finally, this paper has shown the merit of conducting such work: cash crop production can be
highly profitable and women produce and market cash crops just as effectively as men, but are often
constrained in doing so. Left unaddressed, these gender inequalities generate important missed
opportunities for rural poverty reduction strategies.
References
Anderson, Jock, and Gershon Feder. 2003. “Rural Extension Services.” World Bank Policy Research Working Paper 2976.
Appleton, S. 2001a. Changes in poverty and inequality. In R. Reinikka and P. Collier (Eds.), Uganda’s Recovery: The Role of Farms, Firms, and Government, pp. 83‐121.Washington DC: World Bank.
Appleton, S. 2001b. Education, incomes and poverty in Uganda in the 1990s. CREDIT Research Paper No. 01/22.
Baden, S., Green, C., Otoo‐Oyortey, N. and Peasgood, T. 1994. Background Paper on gender issues in
Ghana. Report prepared for the West and North Africa Department, Department for Overseas
Development (DFID), UK. Bridge, Brighton.
Bandiera, Oriana, and Imran Rasul. 2006. “Social Networks and Technology Adoption in Northern Mozambique”. Economic Journal, 116(514): 862‐902
Bank of Uganda. 2001. Annual Report 2000 ‐ 2001. Kampala, Uganda.
Barham, James, and Clarence Chitemi. 2009. “Collective Action Initiatives to Improve Marketing Performance: Lessons from Farmer Groups in Tanzania”. Food Policy, 34 (1): 53‐59.
Barrett, C. 1996. On price risk and the inverse farm size‐productivity relationship. Journal of Development Economics 51: 193‐215
Bellemare, M.F. and Barrett, C.B. 2006. An ordered Tobit model of market participation: evidence from Kenya and Ethiopia American Journal of Agricultural Economics 88(2):324‐337
Bibagambah, J. R. 1996. Marketing of Smallholder Crops in Uganda. Kampala: Fountain Publishers.
Blackden, Mark, and Quentin Wodon, ed. 2006. Gender, Time Use, and Poverty in Sub‐Saharan Africa. Washington, D.C.: World Bank Publications.
Bell, Clive. 1990. “Interactions between Institutional and Informal Credit Agencies in Rural India.” World Bank Economic Review, 4(3): 297‐328.
Breisinger, C., Diao, X., Kolavalli, S., and Thurlow, J. 2008. “The Role of Cocoa in Ghana’s Future
Development Ghana.” IFPRI Background Paper 11.
Chowdhury, Shyamal K. 2002. "Access to Information, Transaction Costs and Marketing Choice of Rural Households between Middlemen and Direct Buyers in Bangladesh," Royal Economic Society Annual Conference 2002 50, Royal Economic Society.
Chowdhury, Shyamal, Ahsok Gulati, and E. Gumbira‐Sa'id. 2005. "High Value Products, Supermarkets and Vertical Arrangements in Indonesia." IFPRI, MTID Discussion Papers 83.
Conley, Timothy, and Christopher Udry. 2001. “Social Learning Through Networks: The Adoption of New Agricultural Technologies in Ghana.” American Journal of Agricultural Economics, 83(3): 668‐73.
Conley, Timothy, and Christopher Udry. Forthcoming. “Learning About a New Technology: Pineapple in Ghana.” American Economic Review.
Croppenstedt, Andre, Mulat Demeke, and Meloria Meschi. 2003. “Technology Adoption in the Presence of Constraints: The Case of Fertilizer Demand in Ethiopia.” Review of Development Economics, 7(1): 58‐70.
Deininger, K. and P. Mpuga. 2002. Land markets in Uganda: Incidence, impact and evolution over time. World Bank Policy Research Working Paper, Washington DC.
Doss, Cheryl. 2001. “Designing Agricultural Technology for African Women Farmers: Lessons from 25 Years of Experience.” World Development, 29(12): 2075‐2092.
Doss, Cheryl. 2002. “Men’s Crops? Women’s Crops? The Gender Patterns of Cropping in Ghana.” World Development, 30(11): 1987‐2000.
Doss, Cheryl, and Michael Morris. 2001. “How Does Gender Affect the Adoption of Agricultural Technologies? The Case of Improved Maize Technology in Ghana”. Agricultural Economics 25:27‐39.
Doss, Cheryl, Wilfred Mwangi, Hugo Verkuijl, and Hugo de Groote. 2003. “Adoption of Maize and Wheat Technologies in Eastern Africa: A Synthesis of the Findings from 22 Case Studies”. International Maize and Wheat Improvement Center, Economics Working Paper 03‐01.
Doss, Cheryl, and John McPeak. 2005. “Are Household Production Decisions Cooperative?: Evidence on Pastoral Migration and Milk Sales from Northern Kenya.” Yale University, Economic Growth Center Discussion Paper 906.
Edelman, Mark, Brian Schmiesing, and Douglas Olsen. 1990. “Use of Selected Marketing Alternatives by Iowa Farmers.” Agribusiness, 6 (2):121–32.
Evenson, Robert. 2001. “Economic Impacts of Agricultural Research and Extension”. In Handbook of Agricultural Economics, Vol. 1, ed. Bruce Gardner and Gordon Rausser, 573‐628. Elsevier
Fafchamps, Marcel. 1992. “Cash Crop Production, Food Price Volatility and Rural Market Integration in the Third World.” American Journal Agricultural Economics, 74(1): 90–99.
Fafchamps, Marcel. 2003. Rural Poverty, Risk and Development. Cheltenham, U.K.: Edward Elgar Publishing.
Fafchamps, Marcel, and Ruth Vargas Hill. 2005. "Selling at the Farmgate or Traveling to Market," American Journal of Agricultural Economics, 87(3): 717‐734.
Fletcher, Stanley, and Joseph Terza. 1986. “AnalysingFarmer’s Selection of Available Marketing Alternatives Using the Multivariate Probit Model.” Canadian Journal of Agricultural Economics 34(2): 243–52.
Fold, N. 2008. “Transnational sourcing practices in Ghana’s perennial crop sectors” Journal of Agrarian Change, 8: 1, pp. 94‐122.
Fu, Tsu‐tan, James Epperson, Joseph Terza, and Stanley Fletcher. 1988. “Producer Attitudes towards Peanut Market Alternatives: An Application of Multivariate Probit Joint Estimation.” American Journal of Agricultural Economics, 70(4): 910–18.
Gladwin, C. H. 1992. “Gendered Impacts of Fertilizer Subsidy Removal Programs in Malawi and Cameroon.” Agricultural Economics, 7(2): 141–153.
Goetz, S.J. 1992. “A Selectivity Model of Household Food Marketing Behavior in Sub‐Saharan Africa.” American Journal of Agricultural Economics, 74(2):444–52.
Goldstein, Markus, and Christopher Udry. 2005. “The Profits of Power: Land Rights and Agriculture Investment in Ghana”. Yale University, Economic Growth Center Discussion Paper 929.
Henstridge, N. M. 1997. The reconstruction of a macroeconomic dataset for Uganda. Centre for the Study of African Economies Working Paper Series No. 98‐3.
Hill, R.V. 2008. "Understanding the Investment and Abandonment Behavior of Poor Households" IFPRI Discussion Paper 783.
Hoff, Karla, and Joseph Stiglitz. 1990. “Imperfect Information and Rural Credit Markets‐Puzzles and Policy Perspectives.” World Bank Economic Review, 4(3): 235‐50.
Holden, Stein, Bekele Shiferaw, and John Pender. 2001. “Market Imperfections and Land Productivity in the Ethiopian Highlands.” Journal of Agricultural Economics, 52(3): 53–70.
Holloway, G., C.B. Barrett, and S. Ehui. 2005. “The Double‐Hurdle Model in the Presence of Fixed Costs.” Journal of International Agricultural Trade and Development 1:17–28.
Kasante, Deborah, Matthew Lockwood, Jessica Vivian, and Ann Whithead. 2001. “Gender and the Expansion of Non Traditional Agricultural Exports in Uganda.” In Shifting Burdens: Gender and Agrarian Change Under Neoliberalism, ed. Shahra Razavi, 35‐65. Bloomfield, CT, USA : Kumarian Press Inc.
Laven, A. 2007. “Marketing Reforms in Ghana’s Cocoa Sector”. ODI Background Note.
Kempaka, G. 2001. Coffee and its impact and relevance to PEAP (Poverty Eradication Action Plan). In The Coffee Yearbook 2000 ‐ 2001. Uganda Co¤ee Trade Federation, Kampala, Uganda.
Key, Nigel, Elisabeth Sadoulet, and Alain de Janvry. 2000. “Transactions Costs and Agricultural Household Supply Response.” American Journal of Agricultural Economics, 82(2): 245‐259.
Koopman, Jeanne. 1993. “The Hidden Roots of the African Food Problem: Looking within the Rural Household.” In Women's Work in the World Economy, ed. Nancy Folbre, Barbara Bergmann, Bina Agarwal and Maria Floro, 82–103. New York: New York University Press.
Kumar, Shubh K. 1987. “Women's Role and Agricultural Technology”. In Accelerating food production in sub‐Saharan Africa, ed. John W. Mellor, Christopher L. Delgado and Malcolm J. Blackie, 135‐47. Baltimore, MD: Johns Hopkins University Press.
Lilja, Nina, and John Sanders. 1998. “Welfare Impacts of Technological Change on Women in Southern Mali.” Agricultural Economics 19:73‐79.

Masdar. 1998. A Socio‐Economic Study of the Cocoa Farming Community. Wokingham (UK)
Morrrison, Andrew, Dhushyanth Raju, and Nistha Sinha. 2007. “Gender Equality, Poverty and Economic Growth.” The World Bank, Policy Research Working Paper 4349.
Paolisso, Michael, Kelly Hallman, Lawrence Haddad, and Sibesh Regmi. 2002. “Does Cash Crop Adoption Detract from Child Care Provision? Evidence from Rural Nepal”. Economic Development and Cultural Change, 50(2): 313‐337.
Peterman, Amber, Julia Behrman, and Agnes Quisumbing. Forthcoming. “A Review of Empirical Evidence on Gender Differences in Non‐Land Agricultural Inputs, Technology, and Services in Developing Countries”.
Quisumbing, Agnes. 1994. “Improving Women’s Agricultural Productivity as Farmers and Workers.” The World Bank, ESP Discussion Paper 37.
Quisumbing, Agnes. 1996. "Male‐female Differences in Agricultural Productivity: Methodological Issues and Empirical Evidence." World Development, 24(10): 1579‐95.
Quisumbing, Agnes, and Lauren Pandolfelli. 2009. “Promising Approaches to Address the Needs of Poor Female Farmers: Resources, Constraints, and Interventions.” IFPRI Discussion Paper 00882.
Quisumbing, Agnes , Ellen Payongayong, J. B. Aidoo, and Keijiro Otsuka. 2001. “Women’s Land Rights in the Transition to Individualized Ownership: Implications for Tree‐Resource Management in Western Ghana”. Economic Development and Cultural Change, 50(1): 157‐181.
Quisumbing, Agnes , Ellen Payongayong, and Keijiro Otsuka. 2004a. “Are Wealth Transfers Biased Against Girls? Gender Differences in Land Inheritance and Schooling Investment in Ghana’s Western Region”. IFPRI, FCND Discussion Paper 186.
Randolph, Sheron, and Rickie Sanders. 1988. “Constraints to Agricultural Production in Africa: A Survey of Female Farmers in the Ruhengeri Prefecture of Rwanda”. Studies in Comparative International Development, 23 (3): 78–98.
Roberts, Michael, and Nigel Key. 2005. “Losing under Contract: Transaction‐Cost Externalities and Spot Market Disintegration.” Journal of Agricultural and Food Industrial Organisation 3(2): 1–17.
Saito, Katrine, Hailu Mekonnen, and Daphne Spurling. 1994. “Raising the Productivity of Women Farmers in Sub‐Saharan Africa”. World Bank Discussion Paper 230.
Sarpong, G.A. 2006. Improving Tenure Security for the Rural Poor: Ghana Case Study. LEP Working
Paper Number 2, FAO
Sunding, David, and David Zilberman. 2001. “The agricultural innovation process: research and technology adoption in a changing agricultural sector.” In Handbook of Agricultural Economics, Vol. 1, ed. Bruce Gardner and Gordon Rausser, 207‐261. Elsevier.
Teal, F., Zeitlin, A., and Maamah, H. 2006. “Ghana Cocoa Farmers Survey 2004: Report to Ghana Cocoa Board” Centre for the Study of African Economies, Oxford University. http://www.gprg.org/pubs/reports/pdfs/2006‐04‐teal‐zeitlin‐maamah.pdf
The World Bank. 2008. Country Brief: Ghana. World Bank, Washington D.C.
The World Bank. 2007. World Development Report 2008: Agriculture for Development. Washington, D.C.: World Bank Publications.
The World Bank, Food and Agriculture Organization, and International Fund for Agricultural Development. 2009. Gender in Agriculture: Sourcebook. Washington, D.C.: World Bank Publications.
Udry, Christopher. 1996. “Gender, agricultural production, and the theory of the household.” Journal of Political Economy 104(5): 1010‐1046.
Udry, Christopher, Jhon Hoddinott, Harold Alderman, and Lawrence Haddad. 1995. Food Policy, 20(5): 407‐423.
Vigneri M. 2005. “Trade Liberalisation and Agricultural Performance: Micro and Macro Evidence on
Cash Crop Production in Sub‐Saharan Africa.” DPhil thesis. Oxford University.
Vigneri, Marcella, and Rebecca Holmes. 2009. “When Being More Productive Still Doesn’t Pay: Gender Inequality and Socio‐Economic Constraints in Ghana’s Cocoa Sector.” Paper presented at the FAO‐IFAD‐ILO Workshop on Gaps, Trends and Current Research in Gender Dimensions of Agricultural and Rural Employment, Rome.
Von Braun, Joachim, David Hotchkiss, and Maarten Immink. 1989. Non Traditional Exports in Guatemala: Effects on Production, Income, and Nutrition. Washington, DC : International Food Policy Research Institute.
Von Braun, Joachim, and Patrick Webb. 1989. “The Impact of New Crop Technology on the Agricultural Division of Labor in a West Africa Setting”. Economic Development and Cultural Change, 37(3): 513‐534.
Warning, Ke, and Soo Hoo. 2005. Small farmer participation in contract farming.
Warning and Key 2002. Social performance and distributional consequences of contract farming.
Wier, Sharada, and John Knight. 2000. “Adoption and Diffusion of Agricultural Innovations in Ethiopia: The role of education.” University of Oxford, CSAE Working Paper 2000‐5.