macroeconomic issues in japan and vietnam
TRANSCRIPT

Secret of Japanese Economy - Macroeconomic Issues in Japan & Vietnam –
March 2015
Hiroyuki Taguchi
Issues to be discussed Where is Japanese economy going by “Abenomics”?
How to avoid “middle income trap” in Vietnam
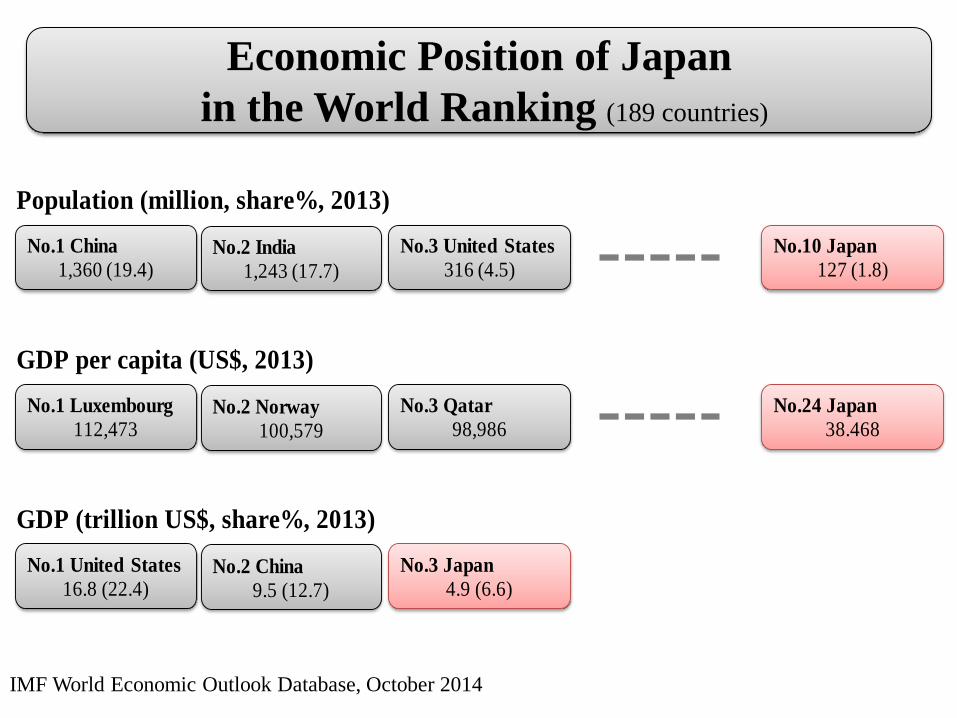
Economic Position of Japan
in the World Ranking (189 countries)
Population (million, share%, 2013)
GDP per capita (US$, 2013)
GDP (trillion US$, share%, 2013)
No.1 China
1,360 (19.4) No.2 India
1,243 (17.7)
No.3 United States
316 (4.5)
No.10 Japan
127 (1.8)
No.1 Luxembourg
112,473 No.2 Norway
100,579
No.3 Qatar
98,986
No.24 Japan
38.468
No.1 United States
16.8 (22.4) No.2 China
9.5 (12.7)
No.3 Japan
4.9 (6.6)
IMF World Economic Outlook Database, October 2014

-6
-4
-2
0
2
4
6
8
10
12
14
FY
195
2
54
56
58
60
62
64
66
68
70
72
74
76
78
80
82
84
86
88
90
92
94
96
98
2000 2 4 6 8
10
Growth rate of real GDP
Average growth rate during the period
Reconstruction High-growth Stable-growth Lost two decades
World financial crisis
Plaza Accord
3
Challenges to Japanese Economy (1):
Persistent Low Growth in its History
3 National Account Statistics
1st oil crisis
Collapse of
the bubble
economy
2ndoil crisis
Asset bubble
Earthquake
0.8% 1994-2013
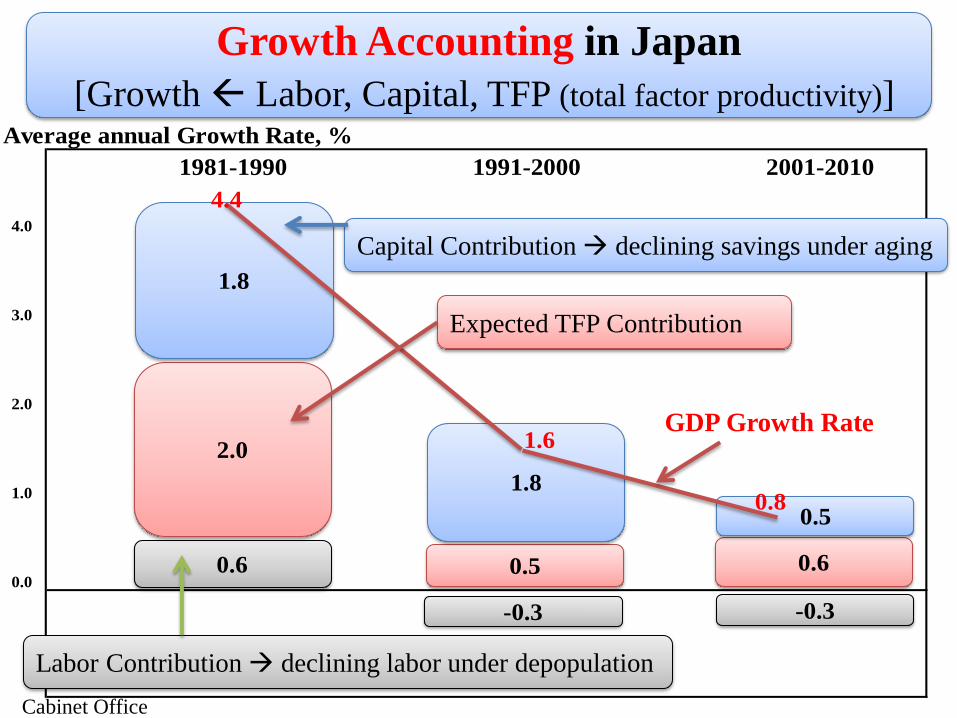
Average annual Growth Rate, %
1981-1990 1991-2000 2001-2010
4.0
3.0
2.0
1.0
0.00.6
2.0
1.8
-0.3
0.5
1.8
-0.3
0.6
0.5
4.4
1.6
0.8
Growth Accounting in Japan
[Growth Labor, Capital, TFP (total factor productivity)]
Cabinet Office
Capital Contribution declining savings under aging
Expected TFP Contribution
GDP Growth Rate
Labor Contribution declining labor under depopulation

1920
1930
1940
1950
1960
1970
1980
1990
2000
2010
2020
2030
2040
2050
2060
2070
2080
2090
2100
2110
0.0
5.0
10.0
15.0
20.0
25.0
30.0
35.0
40.0
45.0
0.0
20.0
40.0
60.0
80.0
100.0
120.0
140.0
19
20
19
30
19
40
19
50
19
60
19
70
19
80
19
90
20
00
20
10
20
20
20
30
20
40
20
50
20
60
20
70
20
80
20
90
21
00
21
10
Aging Rate (actual, right, %) Aging Rate (projection, right, %)
Population (actual, left, mil.) Population (projection, left, mil.)
2013
127.3 mil
25.1%
2110
42.9 mil
41.3%
5
Note: The Figure is based on the medium variant projections in "Population Projections for Japan (January 2012)" by the
National Institute of Population and Social Security Research in Japan. Until 2014, the total fertility rate shifted around
1.39, and afterwards, it is expected to drop to 1.33 by 2024 and hover at around 1.35. Aging means over 65 years old.
Depopulation & Aging in Japan

6
Challenges to Japanese Economy (2): Deflation
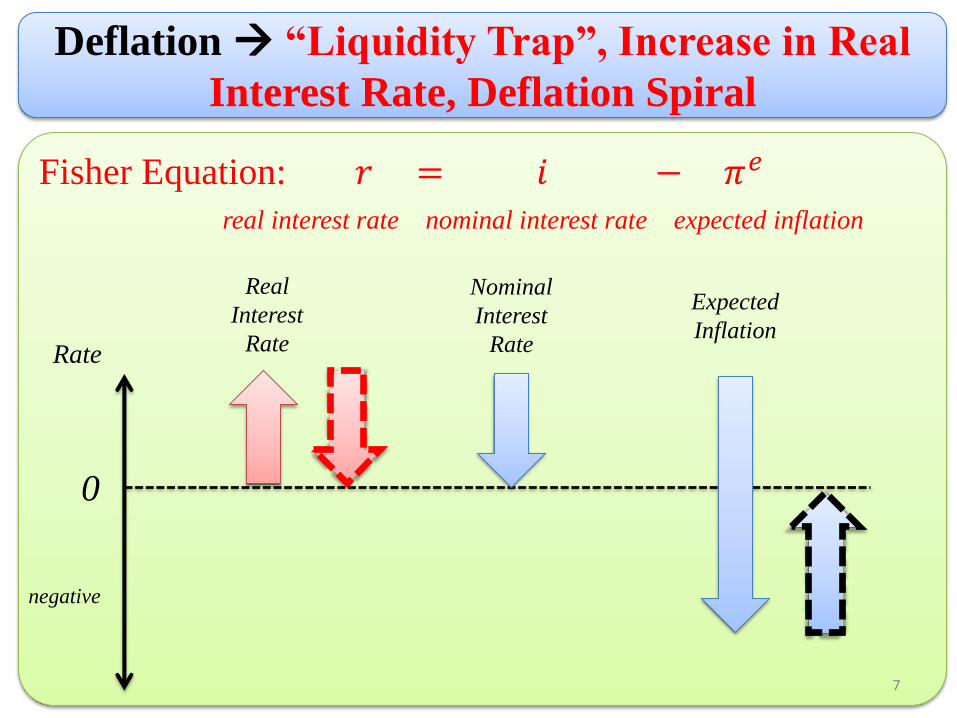
Fisher Equation: 𝑟 = 𝑖 − 𝜋𝑒
real interest rate nominal interest rate expected inflation
Rate
0
negative
Nominal
Interest
Rate
Expected
Inflation
Real
Interest
Rate
7
Deflation “Liquidity Trap”, Increase in Real
Interest Rate, Deflation Spiral

Abenomics (Dec. 2012 –): Three Arrows
Time
GDP
Growth Strategy for revitalizing economy:
towards 2% growth trend over the upcoming decade
Fiscal & Monetary Policy for ending “Deflation”: towards 2% inflation within 2 years

Fiscal & Monetary Policies
Fiscal Policy:
- Economic Stimulus Packages on Jan. & Dec. 2013 and
Dec. 2014 for revitalizing SMEs and regions
Monetary Policy (Unconventional):
- Quantitative Easing – more than double “monetary
base” raising inflationary expectations
- Qualitative Easing – portfolio rebalances
Progress:
- Yen depreciation, upturn in stock prices & firm profits
- Inflation: around 1% (FY2014, est., excluding consumption-tax effect)
- GDP growth: -0.5% (FY2014, est.) consumption-tax effect

Fiscal Problem in Japan
Ministry of Finance
Japan
Greece
Portugal
Spain
Huge Government Gross Debt
relative to GDP in 2014 (%)
Government Bond Holders
Domestic Share (%)
231.9
191.6
137.9
104.8
95
29
14
57
Fiscal Consolidation Plan: To Make Primary Balance Surplus by 2020

Growth Strategy
To Enhance Productivity in Domestic Market
- Create “National Strategic Special Zones” for Deregulation
- Reduce Effective Corporate Tax (34.6% 2X%)
- Reform Agricultural Sector by Farmland Consolidation and
Deregulating Agricultural business
- Reform Electricity System by Unbundling Generators and
Distributors
- Reform Health Care System by Promoting the Use of
Generic Medicine, etc.
To Earn in Overseas Markets
- Raise FTA Trade Ratio from 19% to 70% by 2018 through
Facilitating TPP, RCEP, etc.
- Supporting Overseas Activities of Japanese Companies
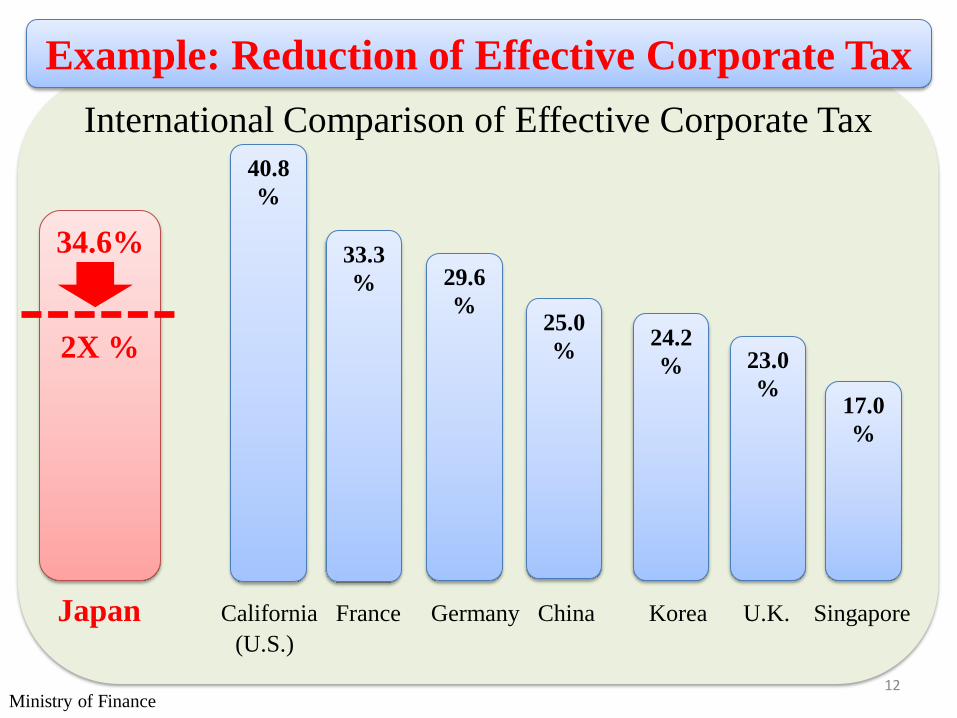
International Comparison of Effective Corporate Tax
34.6%
Japan California France Germany China Korea U.K. Singapore
(U.S.)
40.8
%
33.3
% 29.6
% 25.0
% 24.2
% 23.0
% 17.0
%
Ministry of Finance
2X %
12
Example: Reduction of Effective Corporate Tax

-20.0
-15.0
-10.0
-5.0
0.0
5.0
10.0
15.0
20.0
25.0
30.0
2005 2006 2007 2008 2009 2010 2011 2012 2013 2014
tril. yenGoods & Services Balance Income Balance Current Balance
181 215
250 226 268 256 265 296 325
0
100
200
300
400
2005 2006 2007 2008 2009 2010 2011 2012 2013 2014
tril. yen Net Foreign Assets
Earning in Overseas Markets
External Balance in Japan Income Balance is in Surplus though Trade balance is in deficit
Ministry of Finance 13

Asian Economies
Branch
Factories in
B Country
Headquarter of
Japanese Firm in Japan
Factories in A
Country
14
Repatriation of Profits
remitted earnings of
subsidiary
Earning though Global Value Chains
Win-win Relationship

Economic Integration of Japan with ASEAN
Intra-Trade Ratio in 2010
= Intra-Trade / Trade with the World
Japan-ASEAN
27%
ASEAN+6 (Japan, China, Korea, Australia, New Zealand, India)
45%
Japan-US
8% UN Comtrade

1820 1950 2010 2050 2050
Asian CenturyMiddle
Income Trap
ADB Scenarios
Asia59%
Europe
32%
Others
Asia
15%
North America
23%
Europe
52%
Others
Asia31%
North
America
25%
Europe
34%
Others
Asia51%
China 22%
India 14%
N.America15%
Europe
18%
Others
Asia32%
North America
23%
Europe
26%
Others
16
Asian Century or Middle Income Trap?
% Share to the World GDP
Scenarios: ADB (2011), Actual data: Suehiro (2014)
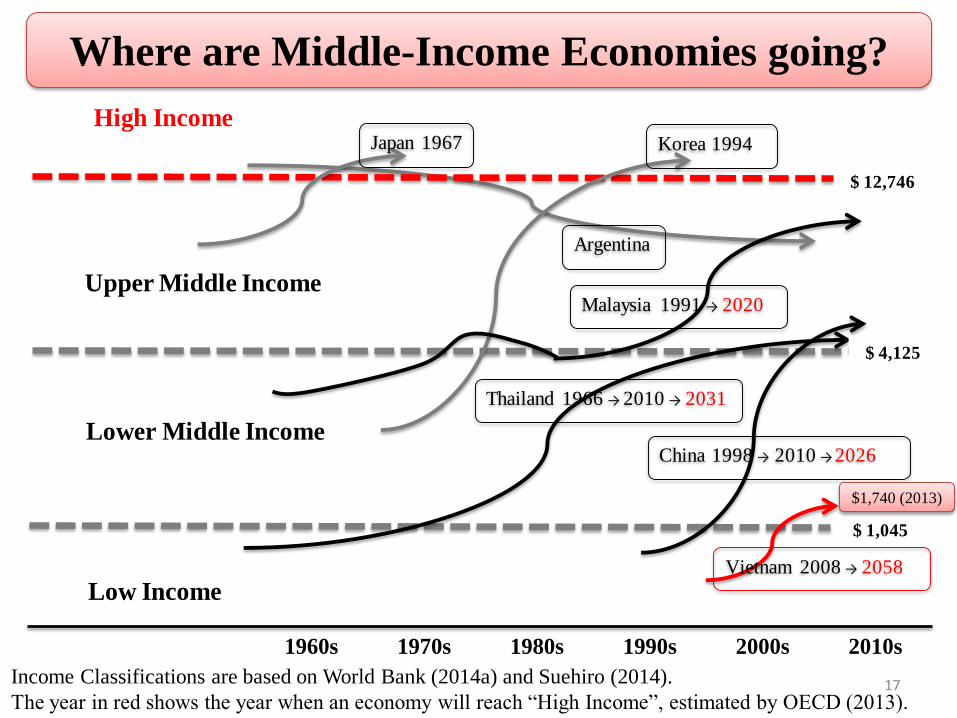
1960s 1970s 1980s 1990s 2000s 2010s
High Income
Upper Middle Income
Lower Middle Income
Low Income
$ 12,746
$ 4,125
$ 1,045
Japan 1967 Korea 1994
Argentina
Malaysia 1991 → 2020
Thailand 1966 → 2010 → 2031
China 1998 → 2010 → 2026
Vietnam 2008 → 2058
17
Where are Middle-Income Economies going?
Income Classifications are based on World Bank (2014a) and Suehiro (2014).
The year in red shows the year when an economy will reach “High Income”, estimated by OECD (2013).
$1,740 (2013)
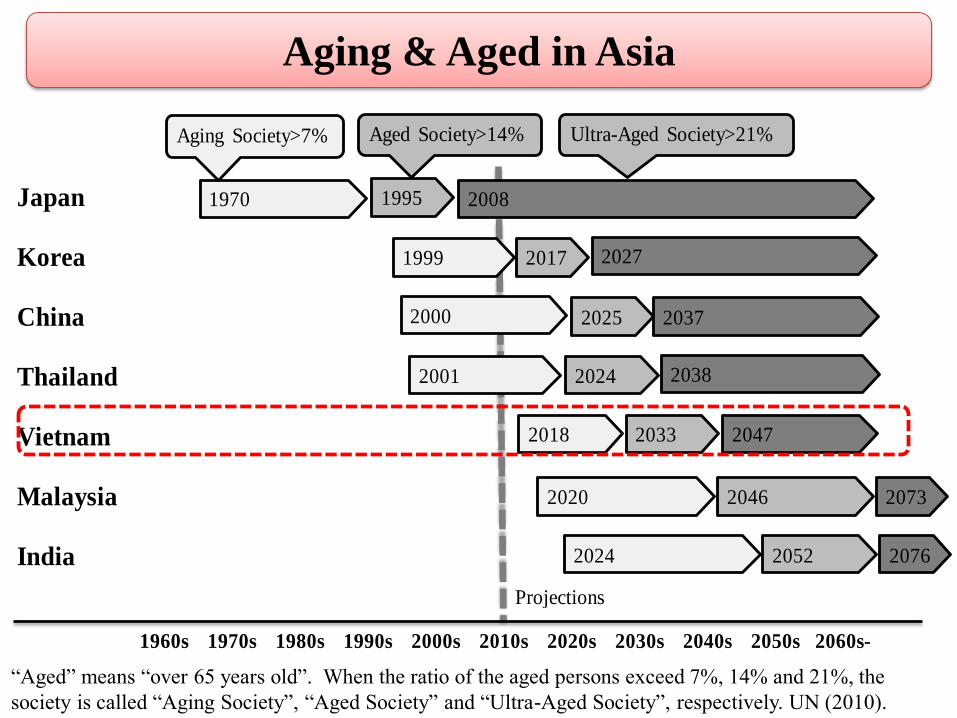
“Aged” means “over 65 years old”. When the ratio of the aged persons exceed 7%, 14% and 21%, the
society is called “Aging Society”, “Aged Society” and “Ultra-Aged Society”, respectively. UN (2010).
Japan
Korea
China
Thailand
Vietnam
Malaysia
India
Projections
1960s 1970s 1980s 1990s 2000s 2010s 2020s 2030s 2040s 2050s 2060s-
1970 1995 2008
1999 2017 2027
2000 2025 2037
2001 2024 2038
2018 2033 2047
2020 2046 2073
2024 2052 2076
Aging Society>7% Aged Society>14% Ultra-Aged Society>21%
Aging & Aged in Asia
19
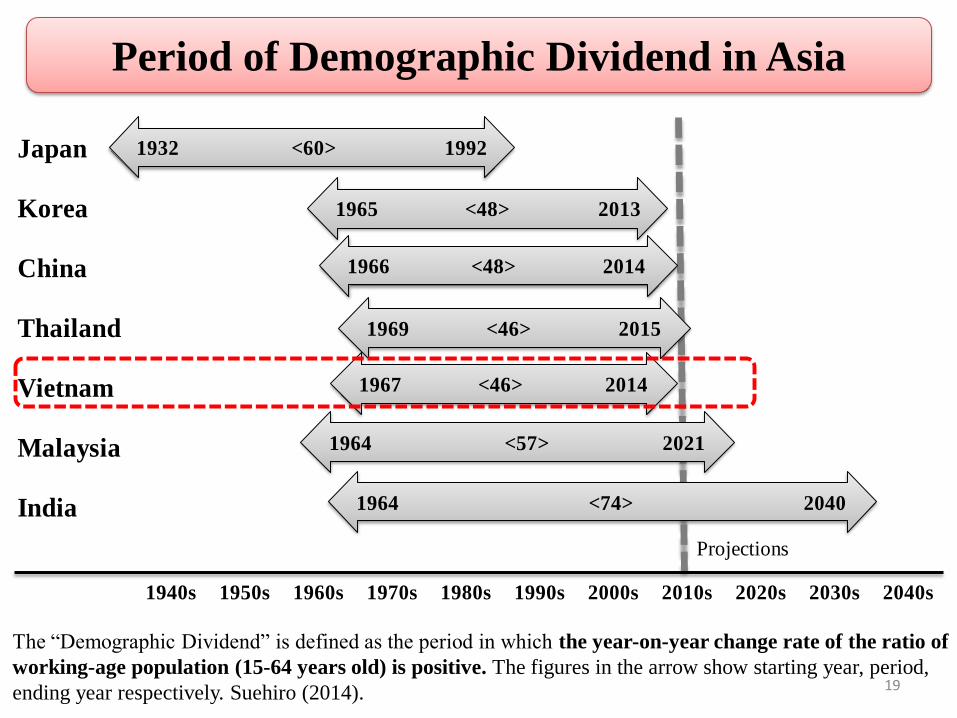
Period of Demographic Dividend in Asia
Japan
Korea
China
Thailand
Vietnam
Malaysia
India
Projections
1940s 1950s 1960s 1970s 1980s 1990s 2000s 2010s 2020s 2030s 2040s
1932 <60> 1992
1965 <48> 2013
1966 <48> 2014
1969 <46> 2015
1967 <46> 2014
1964 <57> 2021
1964 <74> 2040
The “Demographic Dividend” is defined as the period in which the year-on-year change rate of the ratio of
working-age population (15-64 years old) is positive. The figures in the arrow show starting year, period,
ending year respectively. Suehiro (2014).
20
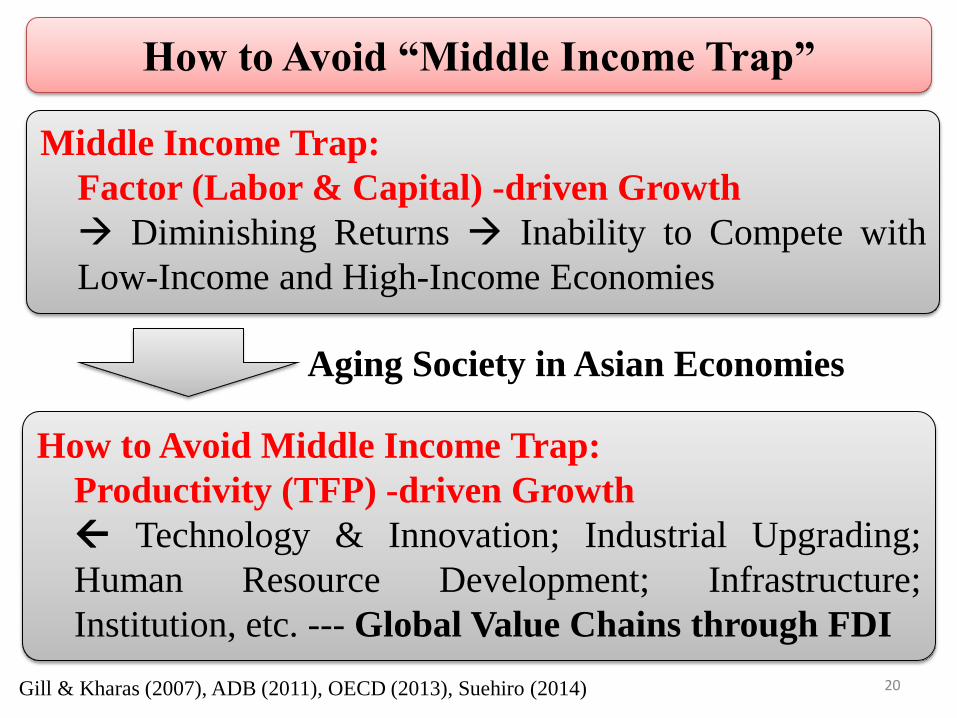
How to Avoid “Middle Income Trap”
Middle Income Trap:
Factor (Labor & Capital) -driven Growth
Diminishing Returns Inability to Compete with
Low-Income and High-Income Economies
How to Avoid Middle Income Trap:
Productivity (TFP) -driven Growth
Technology & Innovation; Industrial Upgrading;
Human Resource Development; Infrastructure;
Institution, etc. --- Global Value Chains through FDI
Gill & Kharas (2007), ADB (2011), OECD (2013), Suehiro (2014)
Aging Society in Asian Economies

Growth Accounting in Asian Economies
China
Korea
Malaysia
Vietnam
Thailand
India
Japan
TFP ContributionCapital
Contribution
Labor
Contribution
3.1 4.5 1.0 8.7
Annual Growth Rate
in 1970-2012
1.6 4.1 1.0 6.7
0.5 4.4 1.4 6.3
1.7 2.3 1.7 5.7
1.9 2.4 1.3 5.6
1.4 2.4 1.5 5.3
0.7 2.0 2.7
APO (2014)

22
For Participating in Global Value Chains ---
“Fragmentation” Theory:
Lower Factor Prices (e.g. Lower wages) + Lower Service-link
Costs (e.g. Logistics) Accept GVCs
Jones and Kierzkowski (2005), World Bank (2014b), and World Bank (2014c).
GNI per capita 2013
<USD>
Logistics Performance Index 2014
<Ranking among 160 Countries>
Singapore 54,040 5Malaysia 10,430 25China 6,560 28Thailand 5,340 35Indonesia 3,580 53Philippines 3,270 57Vietnam 1,740 48India 1,570 54Lao PDR 1,450 131Myanmar 1,113 145Cambodia 950 83

Participating in GVCs --- Successful
FDI Promotes Export-Oriented Growth Export Share to GDP (%)
Source: UNCTADSTAT Source: ADB Key Indicators
Inward FDI Stock to GDP (%)
20.0
25.0
30.0
35.0
40.0
45.0
50.0
55.0
20
00
20
01
20
02
20
03
20
04
20
05
20
06
20
07
20
08
20
09
20
10
20
11
20
12
20
13
Thailand Vietnam
40.0
45.0
50.0
55.0
60.0
65.0
70.0
75.0
80.0
85.0
90.0
20
00
20
01
20
02
20
03
20
04
20
05
20
06
20
07
20
08
20
09
20
10
20
11
20
12
20
13
Thailand Vietnam
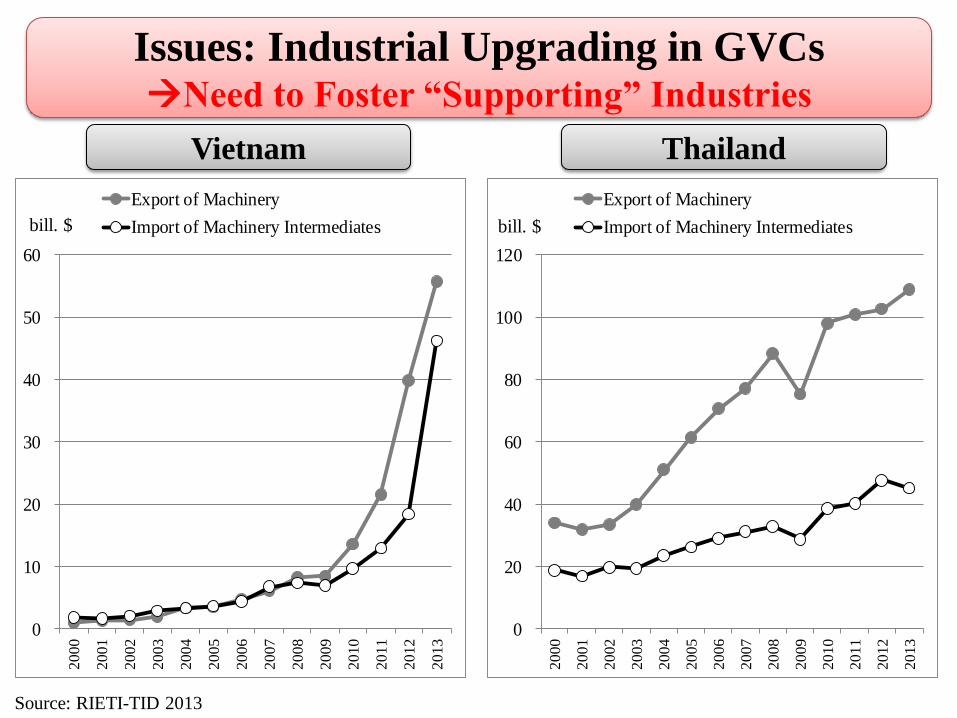
Issues: Industrial Upgrading in GVCs Need to Foster “Supporting” Industries
2000
2001
2002
2003
2004
2005
2006
2007
2008
2009
2010
2011
2012
2013
2000
2001
2002
2003
2004
2005
0
10
20
30
40
50
60
2000
2001
2002
2003
2004
2005
2006
2007
2008
2009
2010
2011
2012
2013
Export of Machinery
Import of Machinery Intermediates
0
20
40
60
80
100
120
2000
2001
2002
2003
2004
2005
2006
2007
2008
2009
2010
2011
2012
20
13
Export of Machinery
Import of Machinery Intermediates
Vietnam Thailand
bill. $ bill. $
Source: RIETI-TID 2013
25
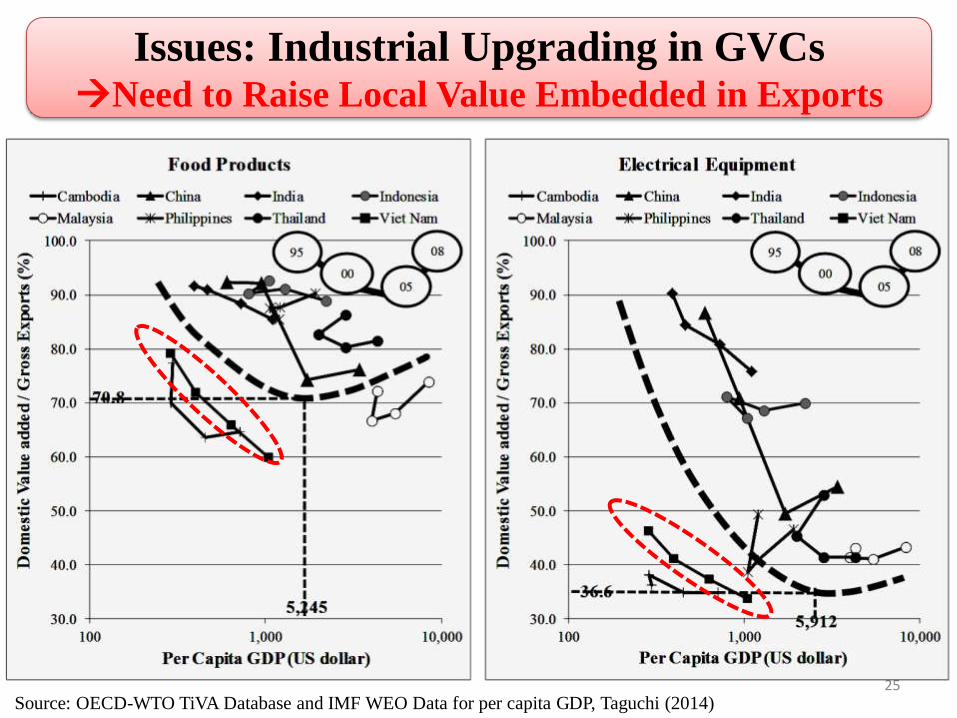
Issues: Industrial Upgrading in GVCs Need to Raise Local Value Embedded in Exports
Source: OECD-WTO TiVA Database and IMF WEO Data for per capita GDP, Taguchi (2014)
26
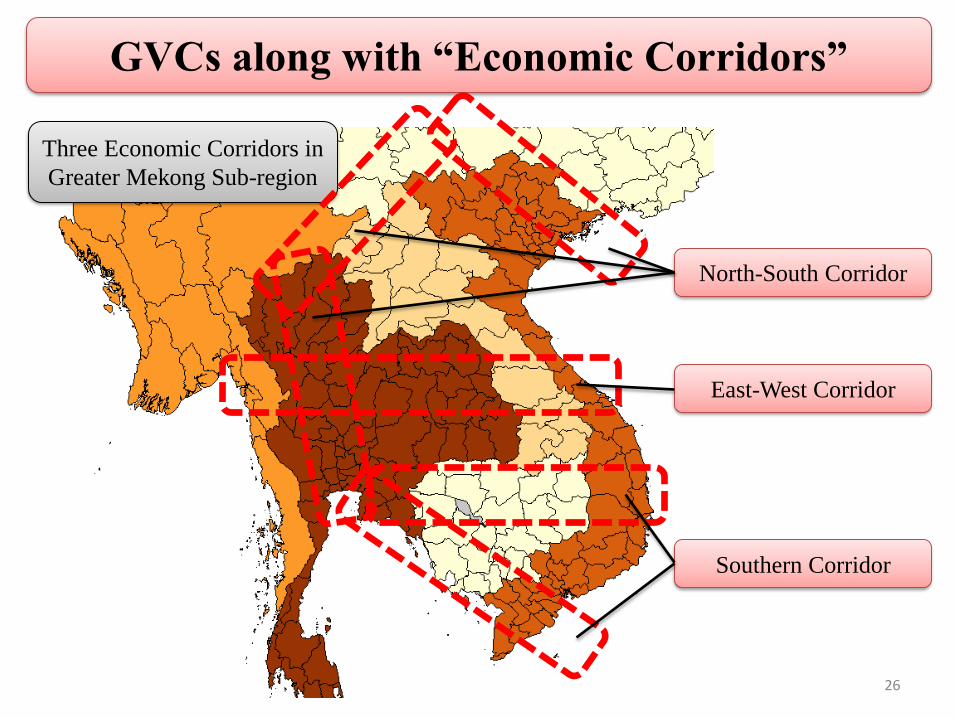
GVCs along with “Economic Corridors”
Three Economic Corridors in
Greater Mekong Sub-region
North-South Corridor
East-West Corridor
Southern Corridor

27
Income Distribution among Asian Economies Convergence: Less Developed Countries Grow Faster
IMF World Economic Outlook Database, October 2014
GDP per capita
2000, $
Japan 37,304
Singapore 23,793
Brunei 18,477
Korea 11,948
Malaysia 3,992
Thailand 1,983
Philippines 1,055
China 941
Indonesia 800
India 463
Vietnam 402
Cambodia 299
Lao PDR 292
Myanmar 222
Real GDP Growth Rate in 2000-2013, Annual %
0.8
5.4
1.2
4.1
4.7
4.0
5.0
10.0
5.4
6.5
7.8
7.3
9.6
7.0

28
Is the Kuznets Curve still Valid?
Industrial transition from agriculture to manufacturing / urban
sector increases inequality Shrinking agriculture sector reduces
inequality, trickle-down effect (Kuznets 1955) Evidence by
Barro (2008) with a turning point being 3,050 US$
Technical progress and globalization has recently increased
inequality based on skill & knowledge (ADB 2012; Palma 2011;
Piketty 2013)
?
Income Distribution among Asian People
Inequality has enlarged recently
29
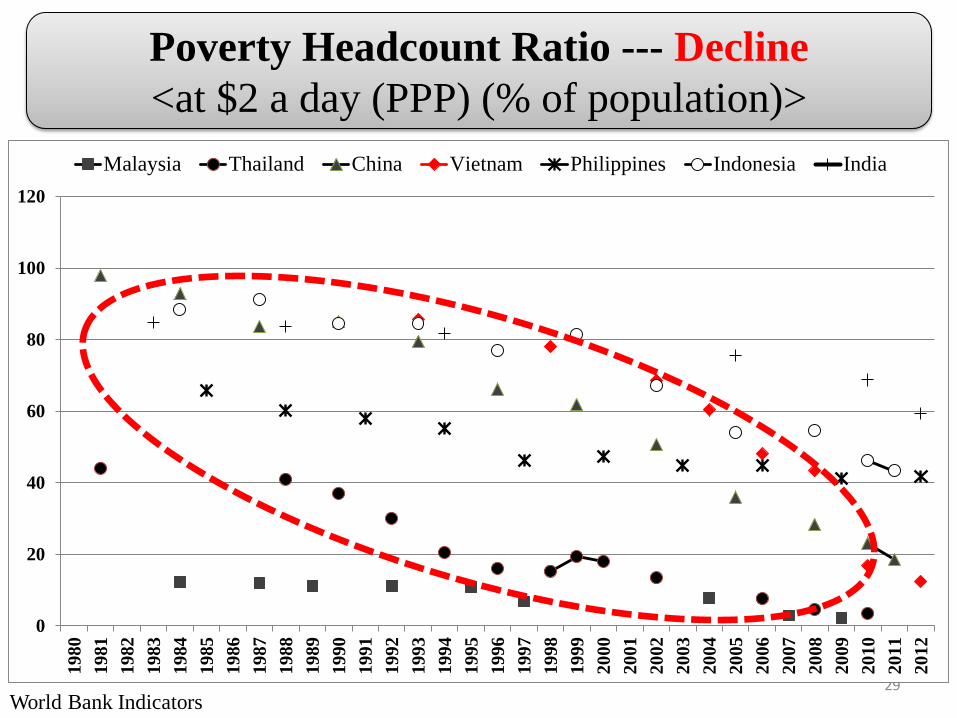
Poverty Headcount Ratio --- Decline
<at $2 a day (PPP) (% of population)>
World Bank Indicators
0
20
40
60
80
100
120
19
80
19
81
19
82
19
83
19
84
19
85
19
86
19
87
19
88
19
89
19
90
19
91
19
92
19
93
19
94
19
95
19
96
19
97
19
98
19
99
20
00
20
01
20
02
20
03
20
04
20
05
20
06
20
07
20
08
20
09
20
10
20
11
20
12
Malaysia Thailand China Vietnam Philippines Indonesia India

30
Quintile Ratios --- Mixed Outcomes <the ratio of the per capita expenditure of the top 20% to that of the bottom 20%>
0
2
4
6
8
10
12
Malaysia China Thailand Indonesia Philippines Vietnam India
11.4
5.1
8.8
4.1
8.6
5.6
4.8
11.3
9.6
7.16.6
8.3
5.9 5.7
1990s 2000s
ADB (2012)
31
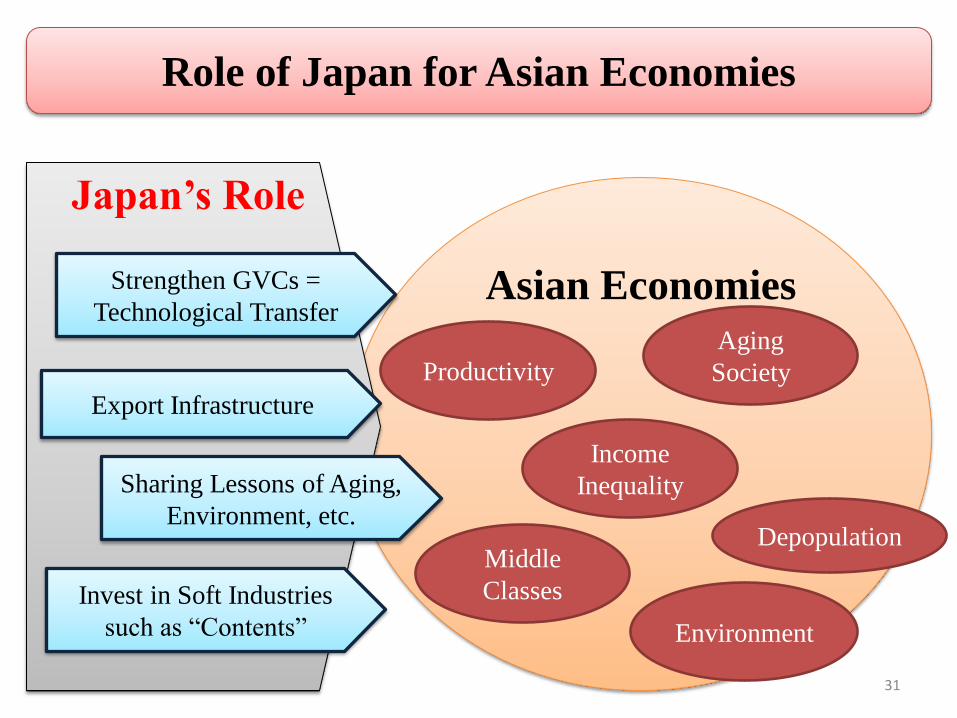
Role of Japan for Asian Economies
Asian Economies
Productivity
Aging
Society
Income
Inequality
Middle
Classes
Environment
Depopulation
Japan’s Role
Strengthen GVCs =
Technological Transfer
Export Infrastructure
Sharing Lessons of Aging,
Environment, etc.
Invest in Soft Industries
such as “Contents”

References ADB 2011. ASIA 2050: Realizing the Asian Century.
ADB 2012. Asian Development Outlook 2012: Confronting Rising Inequality in Asia.
APO (Asian Productivity Organization) 2014. APO Productivity Databook 2014.
Barro, R. 2008. Inequality and Growth Revisited. Working Paper Series on Regional Economic Integration No.11, ADB.
Gill, I. & Kharas, H. 2007. An East Asian Renaissance: Ideas for Economic Growth, World Bank.
Jones, R.W. and Kierzkowski, H. 2005. International Trade and Agglomeration: An Alternative Framework. Journal of Economics, 10(S1), 1-16.
Kuznets, S. 1955. Economic Growth and Income Inequality, American Economic Review, 65:1-29.
OECD 2013. Economic Outlook for Southeast Asia, China and India 2014: Beyond the Middle-Income Trap, OECD Publishing.
Palma, J.G. 2011. Homogeneous Middles vs. Heterogeneous Tails, and the End of the ‘Inverted-U’: The Share of the Rich is What It’s All About. Cambridge Working Papers in Economics (CWPE) No.1111.
Piketty, T. 2013. Capital in the Twenty-First Century. Éditions du Seuil, Harvard University Press .
Suehiro, A. 2014. Emerging Asian Economy, Iwanami (Japanese).
Taguchi, H. 2014. Dynamic Impacts of Global Value Chains Participation on Asian Developing Economies, Foreign Trade Review, 2014, 49(4):1-14.
UN (United Nations) 2010. World Population Prospects: The 2010 Revision.
World Bank 2014a. Updated Income Classifications. See the site below.
http://data.worldbank.org/news/2015-country-classifications.
World Bank 2014b. Indicators. See http://data.worldbank.org/indicator.
World Bank 2014c. Connecting to Compete 2014 - Trade Logistics in the Global Economy - The Logistics Performance Index and Its Indicators.
For “Abenomics”, see http://japan.kantei.go.jp/ongoingtopics/abenomics.html. 32