machine condition monitoring by verhaert
TRANSCRIPT

20.10.2006
Machine condition monitoring Machine condition monitoring
Slide 1
ww
w.m
aste
rsin
inno
vatio
n.co
m
Machine condition monitoring
Dany Robberecht
www.verhaert.com
VERHAERTINNOVATIONDAY – OCTOBER 20th, 2006
www.mastersininnovation.com
Commercially confidence – This presentation contains ideas and information which are proprietary of VERHAERT, Masters in Innovation®*, it is given in confidence. You are authorized to open and view the electronic copy of this document and to print a single copy. Otherwise, the material may not in whole or in part be copied, stored electronically or communicated to third parties without prior agreement of VERHAERT, Masters in Innovation®*.
* VERHAERT, Masters in Innovation is a registered trade name of Verhaert Consultancies N.V.

20.10.2006
Machine condition monitoring Machine condition monitoring
Slide 2
ww
w.m
aste
rsin
inno
vatio
n.co
m
The challenge of future maintenance programs

20.10.2006
Machine condition monitoring Machine condition monitoring
Slide 3
ww
w.m
aste
rsin
inno
vatio
n.co
m
The Maintenance Paradigm - general
The problem of operating potentially damaged equipmentLost efficiency through downtime and ineffective performanceCost of precautionary replacement Cost of repair after catastrophic failure Cost of precautionary spares inventoryCost of recovery to normal operation after failureUncertain yield and quality
Condition monitored maintenance programs envisage toImprove downtimeIncreased effectivenessReduced maintenance costReduced spares inventory

20.10.2006
Machine condition monitoring Machine condition monitoring
Slide 4
ww
w.m
aste
rsin
inno
vatio
n.co
m
Approaches towards maintenance
What maintenance mix does your organisation have?Is there a difference in process control and our equipment we manufacture?How good earning-generating capabilities has your mix?
Preventative
MaintenanceCorrective
Maintenance
Predictive
Maintenance
Condition Monitoring
Detective
Maintenance
On-site Diagnose
Remote Diagnose
Spare parts prorgrams

20.10.2006
Machine condition monitoring Machine condition monitoring
Slide 5
ww
w.m
aste
rsin
inno
vatio
n.co
m
The challenge for R&D
Need to predict equipment failureFrequency of monitoring is the lead time to failure (PF interval)Interval is variable (type of failure, lubrification, ...)Estimates most of the time conservative, but why can we all easily quote many undetected errors?
Need for an hollistic view of equipment conditionNeed for greater accuracy in failure predictionNeed to reduce the cost of condition monitoringNeed to improve equipment and process reliability (prolonge MTBF)
20.10.2006
Machine condition monitoring Machine condition monitoring
Slide 6
ww
w.m
aste
rsin
inno
vatio
n.co
m
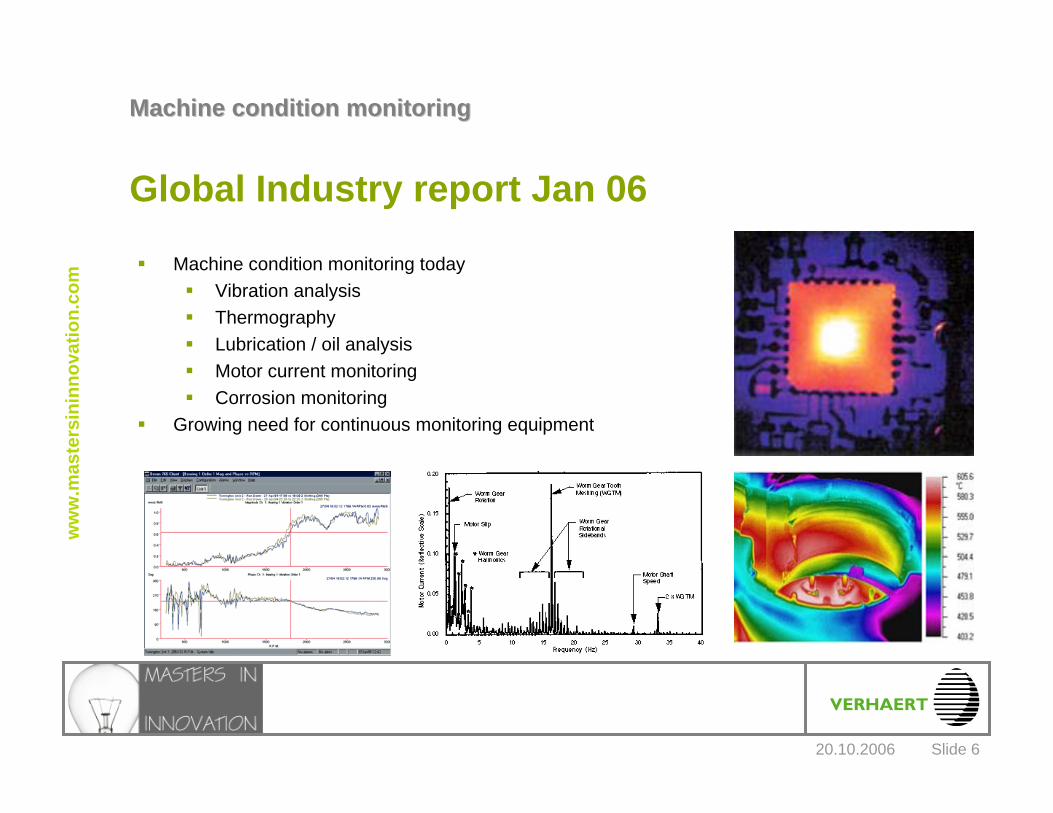
Global Industry report Jan 06
Machine condition monitoring todayVibration analysisThermographyLubrication / oil analysisMotor current monitoringCorrosion monitoring
Growing need for continuous monitoring equipment

20.10.2006
Machine condition monitoring Machine condition monitoring
Slide 7
ww
w.m
aste
rsin
inno
vatio
n.co
m
Beyond conventional sensors
20.10.2006
Machine condition monitoring Machine condition monitoring
Slide 8
ww
w.m
aste
rsin
inno
vatio
n.co
m
Signal processing for machine monitoring
a) Time-frequency data analysis or time-scale data processing have been investigated
These techniques enable the detection of incipient faults– computationally demanding – difficult to identify data features for automated and online condition monitoring from this
representation
b) Higher order statistics are a relatively new tool in the area of data processing (turbo-pump, rolling element bearing and electric motor faults)
– high computational overhead– only effective only for a limited range of faults.
c) independent component analysis is difficult to interpret physically
> Techniques require an expert and hardly give an early warning indicator of wear!
20.10.2006
Machine condition monitoring Machine condition monitoring
Slide 9
ww
w.m
aste
rsin
inno
vatio
n.co
m
The power of neural networks
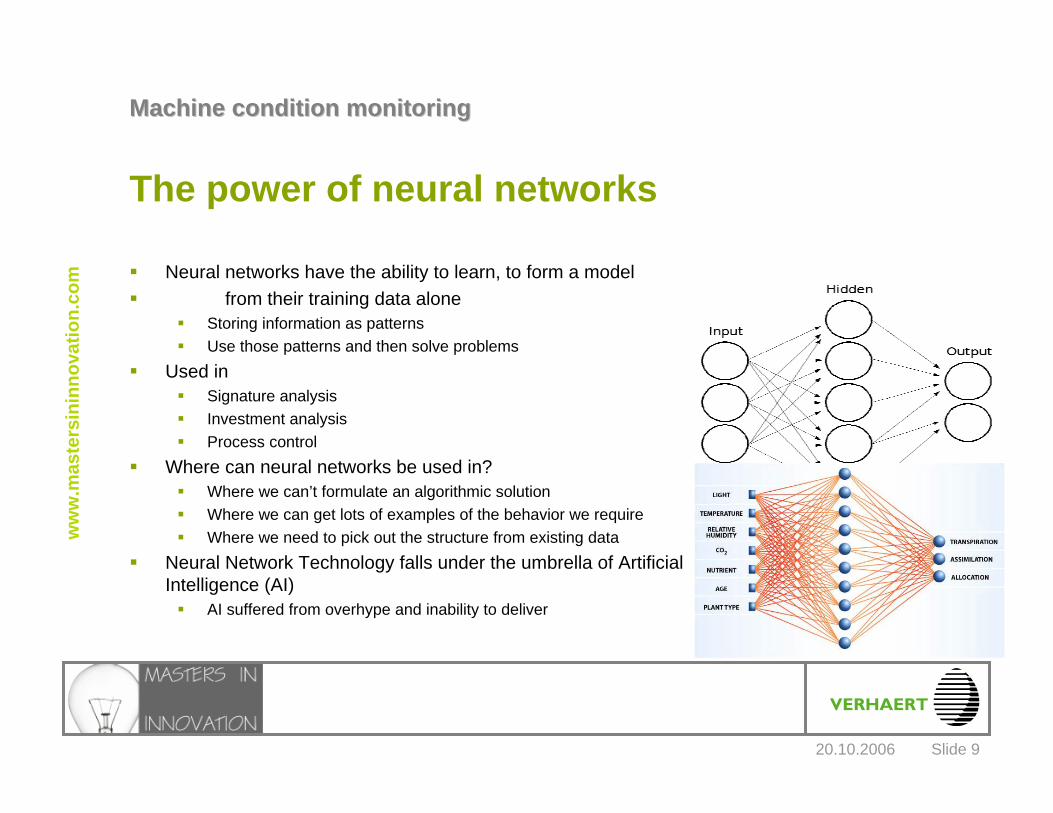
Neural networks have the ability to learn, to form a model from their training data alone
Storing information as patternsUse those patterns and then solve problems
Used inSignature analysisInvestment analysisProcess control
Where can neural networks be used in?Where we can’t formulate an algorithmic solutionWhere we can get lots of examples of the behavior we requireWhere we need to pick out the structure from existing data
Neural Network Technology falls under the umbrella of ArtificialIntelligence (AI)
AI suffered from overhype and inability to deliver
20.10.2006
Machine condition monitoring Machine condition monitoring
Slide 10
ww
w.m
aste
rsin
inno
vatio
n.co
m
AI for machine condition monitoring
Technology developed at QinetiQ ltd early 80’sExperiments with different AI technologySingle neuron layer networks provided good results in military applicationsQQ developed AI with tech transfer opportunity to an early warning anomaly detection system to predict wear and failure of equipment
Condition of machine: failure & faultSeverity of faultTime to failure
Patented technology
Malvern Technology CentreCentre for Signal &
Information Processing
St. Andrews RoadMalvern, Worcestershire
WR14 3LGwww.qinetiq.com
20.10.2006
Machine condition monitoring Machine condition monitoring
Slide 11
ww
w.m
aste
rsin
inno
vatio
n.co
m
Concept of the technology
Componential coding is an innovative approachUnsupervisedAdaptiveIt derives the features of the data based on training (no labeling of known faults, nor pre-processing to enhance known fault characteristics)
High fidelity, accurate modeling of the actual signal behavior leads to more sensitive and robust indicator = it allows to detect changes in the deep structure of the signal
Automatic alignment of the model to multi-dimensional datasets (convolution techniques)
Universal and rapidly applicable to any piece of equipment

20.10.2006
Machine condition monitoring Machine condition monitoring
Slide 12
ww
w.m
aste
rsin
inno
vatio
n.co
m
QinetiQ’s technology and others
Componential coding provides benefits over more familiar techniquesCompared to Principal Component Analysis(Statistical techniques -> averaging technique, blurs the signal)– Fine resolution (Impulsive noise of a bearing) - Better for subtle changes– Very good to detect intermittent faults– High fidelity, because it models the actual signal
Compared to RBF– No expert required to design the signal features (quality of the expert)– No bias/assumptions (typically build into expert derived features)– It does more than classification into healthy and non-healthyCompared to multi-layered networks– Less complex, able to deliver results
When is it particularly suited– When no machine-specific tailored techniques have been developed– When no previous monitoring experience is available

20.10.2006
Machine condition monitoring Machine condition monitoring
Slide 13
ww
w.m
aste
rsin
inno
vatio
n.co
m
Proof-of-technology

20.10.2006
Machine condition monitoring Machine condition monitoring
Slide 14
ww
w.m
aste
rsin
inno
vatio
n.co
m
Technology background
Prior application: Military (MOD)Little prior information on characteristics of target
Further research outlined technology transfer opportunitiesIn-house research to detect wear of mechanical equipmentCustomer funding to detect anomalies of an electric motor
The technology was benchmarked by the University of ManchesterOutperformed other techniques
20.10.2006
Machine condition monitoring Machine condition monitoring
Slide 15
ww
w.m
aste
rsin
inno
vatio
n.co
m
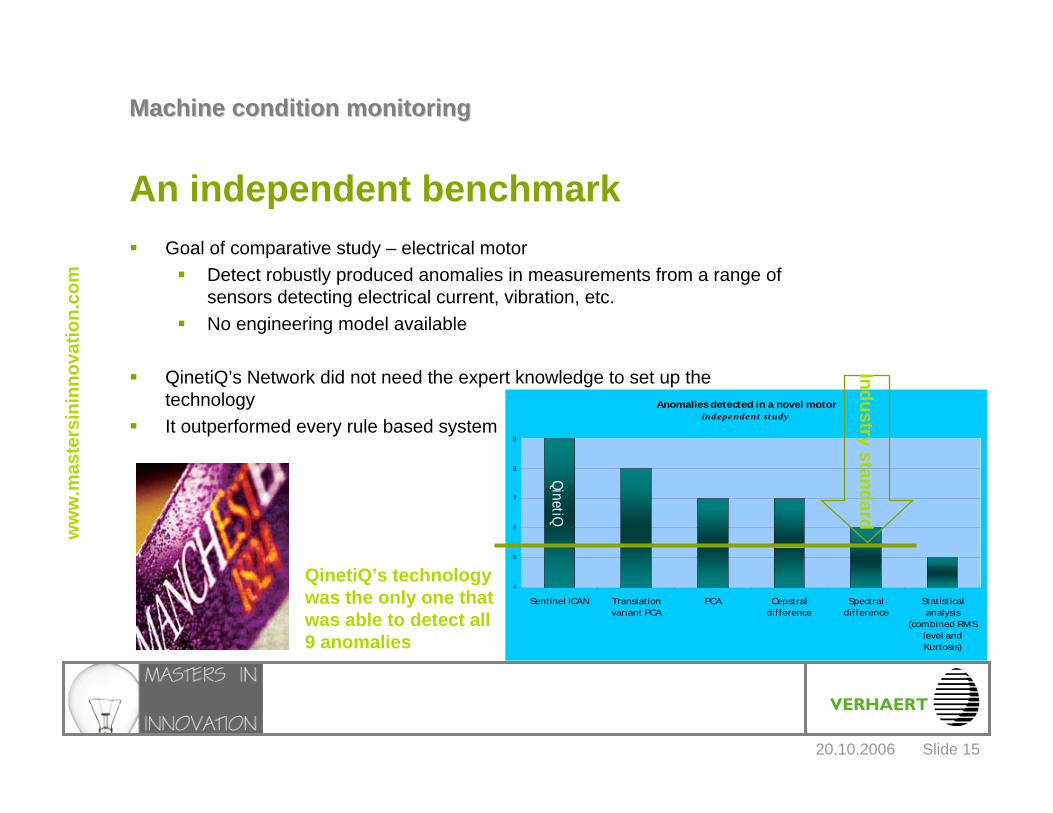
An independent benchmarkGoal of comparative study – electrical motor
Detect robustly produced anomalies in measurements from a range of sensors detecting electrical current, vibration, etc.No engineering model available
QinetiQ’s Network did not need the expert knowledge to set up the technologyIt outperformed every rule based system
Anomalies detected in a novel motorindependent st udy
QinetiQ
4
5
6
7
8
9
Sentinel ICAN Translat ionvariant PCA
PCA Cepstraldif ference
Spectraldif ference
Stat ist icalanalysis
(combined RMSlevel andKurtosis)
QinetiQ’s technology was the only one that was able to detect all 9 anomalies
Industry standard
20.10.2006
Machine condition monitoring Machine condition monitoring
Slide 16
ww
w.m
aste
rsin
inno
vatio
n.co
m
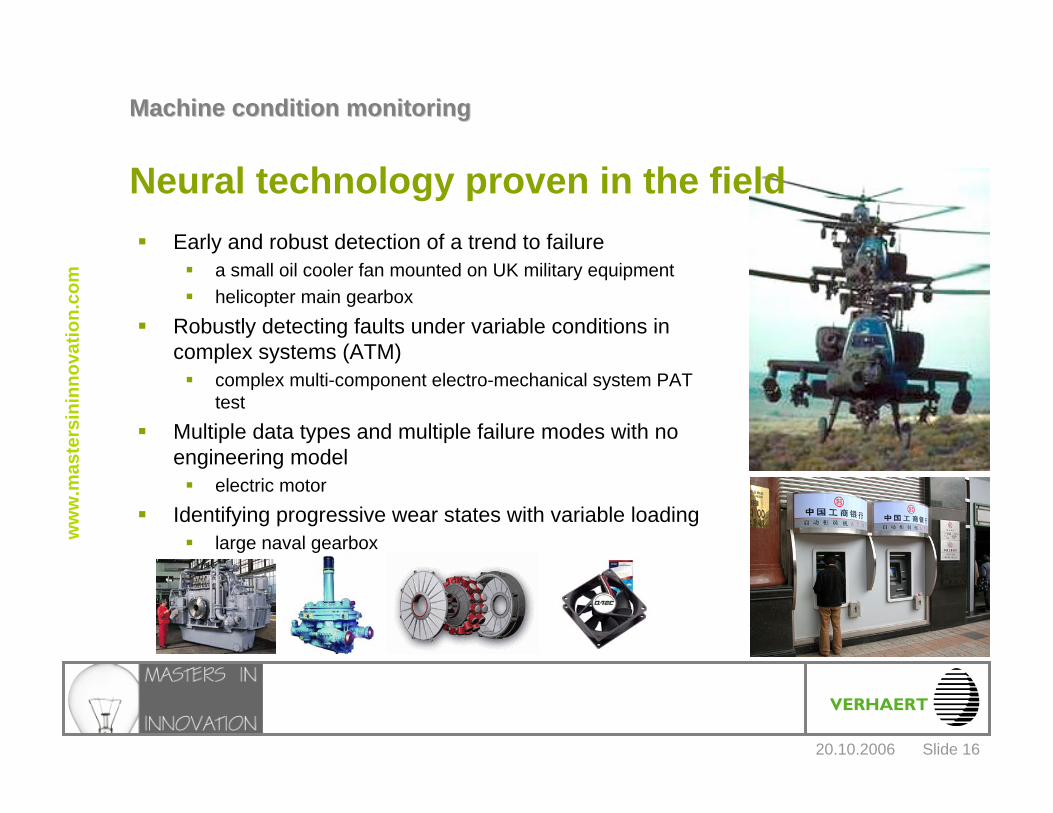
Neural technology proven in the fieldEarly and robust detection of a trend to failure
a small oil cooler fan mounted on UK military equipmenthelicopter main gearbox
Robustly detecting faults under variable conditions in complex systems (ATM)
complex multi-component electro-mechanical system PAT test
Multiple data types and multiple failure modes with no engineering model
electric motor Identifying progressive wear states with variable loading
large naval gearbox
20.10.2006
Machine condition monitoring Machine condition monitoring
Slide 17
ww
w.m
aste
rsin
inno
vatio
n.co
m
Neural technology proven in the field
00,5
11,5
22,5
33,5
44,5
1 2 3 4 5 6 7 8 9 10 11 12 13 14 15 16 17 18 19 20
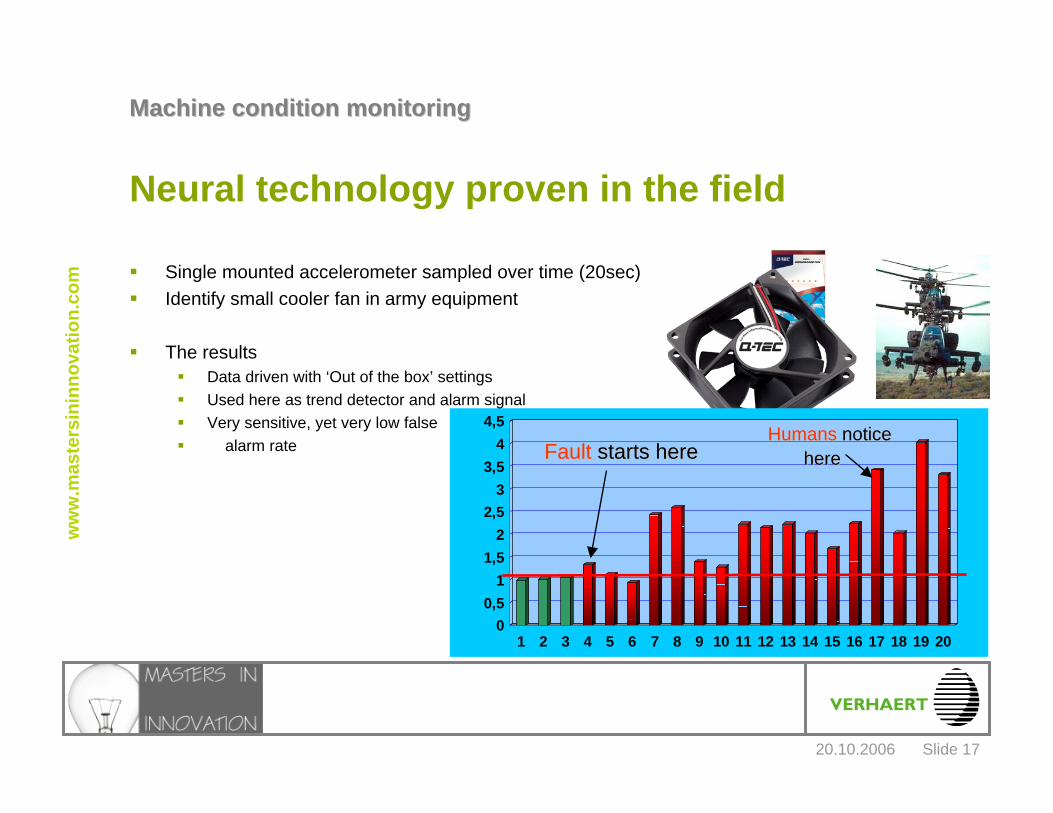
Fault Fault starts herestarts hereHumans Humans notice notice
herehere
Single mounted accelerometer sampled over time (20sec)Identify small cooler fan in army equipment
The resultsData driven with ‘Out of the box’ settingsUsed here as trend detector and alarm signalVery sensitive, yet very low false
alarm rate

20.10.2006
Machine condition monitoring Machine condition monitoring
Slide 18
ww
w.m
aste
rsin
inno
vatio
n.co
m
00,10,20,30,40,50,60,70,80,9
Dis
crim
inat
ion
Ratio
time
Neural technology proven in the field
EEaarlyrly roburobusst t indicatindicatiionon
CatastCatastrrophicophicfailurefailure
Single mounted accelerometer sampled over timeIdentify anomalies in helicopter gearbox
The resultsData driven with ‘Out of the box’ settingsUsed here as trend detectorEliminates subjective interpretation
Gearbox behaves differently in almost each helicopter
Experts give subjective thresholds

20.10.2006
Machine condition monitoring Machine condition monitoring
Slide 19
ww
w.m
aste
rsin
inno
vatio
n.co
m
Neural technology proven in the field
Fault detection accuracy and robustness
00.050.1
0.150.2
0.250.3
0.350.4
0.450.5
0.550.6
0.650.7
0.750.8
0.850.9
0.951
0 1 2 3 4 5 6 7 8 9Fault detection threshold
Prob
abilit
y
Prob(false alarm)Prob(missed detection
Decrease number of infant mortalitiesMoney jam, mechanical failuresset-up/configuration not accurate
Goals of the projectIdentify overall signatureObjective judgement it worksLocation of anomalie
Transaction time is <40 secondsVibration + acoustic signals
+10.000 samples of 4 sensors (20KHz)<0.5 seconds to translate inputs and testDistributed sensor set-up
The resultsData driven with ‘Out of the box’ settingsUsed here as alarmVery low false alarmsVery high detection rate

20.10.2006
Machine condition monitoring Machine condition monitoring
Slide 20
ww
w.m
aste
rsin
inno
vatio
n.co
m
How does it work?
20.10.2006
Machine condition monitoring Machine condition monitoring
Slide 21
ww
w.m
aste
rsin
inno
vatio
n.co
m
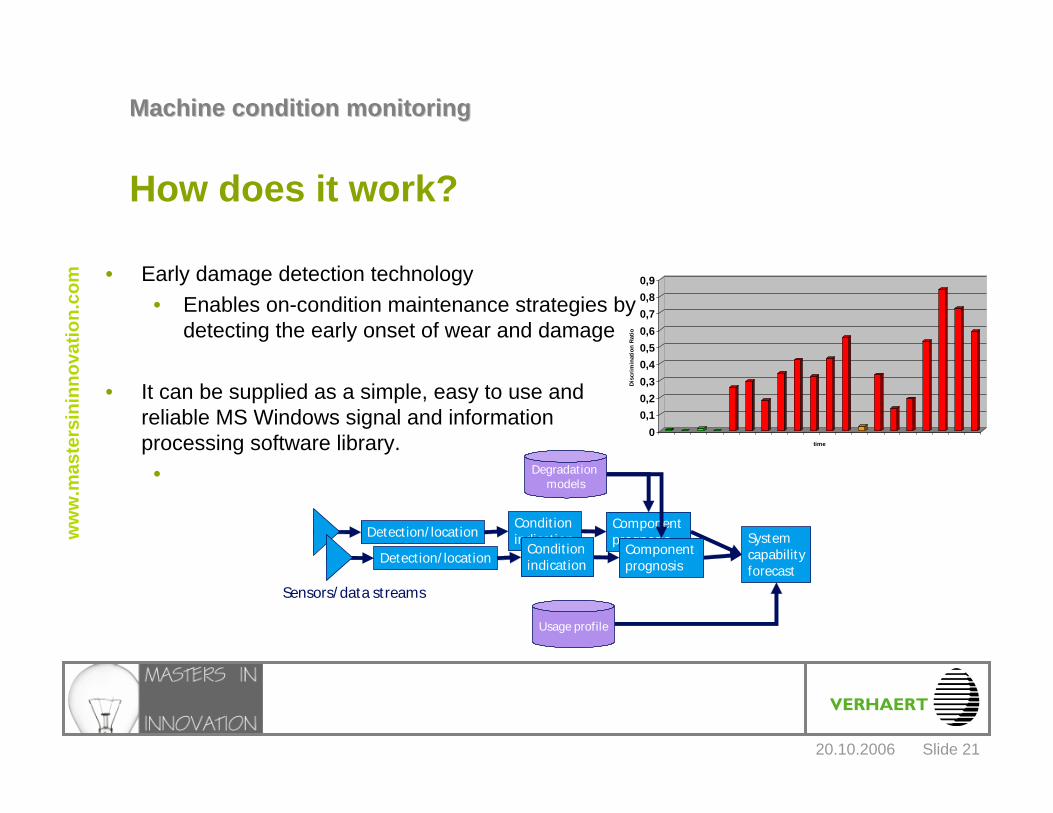
Detect ion/ location System capabilityforecast
Component prognosis
Condit ion indication
Sensors/ data streams
Degradation models
Usage profile
Detection/ location Component prognosis
Condit ion indication
How does it work?
• Early damage detection technology• Enables on-condition maintenance strategies by
detecting the early onset of wear and damage
• It can be supplied as a simple, easy to use and reliable MS Windows signal and information processing software library.
•
00,10,20,30,40,50,60,70,80,9
Dis
crim
inat
ion
Rat
io
time

20.10.2006
Machine condition monitoring Machine condition monitoring
Slide 22
ww
w.m
aste
rsin
inno
vatio
n.co
m
How does it work?• It is an advanced statistical model
• Layered statistical templates• Non linear transformation of data• Robust statistics to output one simple scalar
• It is not a typical rule-based system, that means• The templates are learned• The parameters are learned• It works unsupervised and takes decisions itself• It learns from the daily operations (e.g. From faulty data
to interprete severity of faults)
• Compare it to a lossy data compression algorithm• It tranforms input data into a coded form and back again• To achieve minimum quantity of information (scalar
output) with maximum relevant information
Signal Templates
20.10.2006
Machine condition monitoring Machine condition monitoring
Slide 23
ww
w.m
aste
rsin
inno
vatio
n.co
m
How does its core work?
The basic principle of the modelThe system is designed not to be able to reconstruct all data sets accurately, but to measure how inaccurately each data set gets reconstructed
Ability to differentiate between data sets having different statistical characteristics
It can reconstruct a model-based replica of any sensor typeIt is designed to optimise the accuracy with which the model reconstructs the input data signal
There are more than 90 parameters in the modelValidation process optimises the settings of the model
Sensitive & robust anomalie detection through multiple comparisons
Difference with reconstructed modelVariance of the size (shape of the movement)
Time into Recording
Data model defined by neurons’ parameters, used to non -linearly transform the input data signal into the encoding neural outputs
Reconstruction of an estimated replica of the input data signal:a linear transformation of the encoding neural outputs
The current input data signal: a vector of several sample -sequences from several sensors
Data model defined by neurons’ parameters, used to non-linearly transform the input data signal into the encoding neural outputs.
-
Reconstruction of an estimated replica of the input data signal:a linear transformation of the encoding neural outputs.
The current input data signal: a vector of several sample - sequences from several sensors.-
Sensor
Cha
nnel
Model-based reconstructed estimate of the current input data signal.

20.10.2006
Machine condition monitoring Machine condition monitoring
Slide 24
ww
w.m
aste
rsin
inno
vatio
n.co
m
How does its core work?
The reconstruction modelSingle layer of neurons, each of which uses the same input vectorEach neuron calculates a different neural output which is a function of both the input vector and neural parameters, whose values/settings differ from neuron to neuronNon linear transformation of the input signals is analogous to the way Fourrier analysis linearly transforms an input vector into Fourrier coefficients or that principal component analysis linearly transforms inputs into a set of coefficients (projections on the basis set of the eigenvectors of the covariance matrix)Robust statistics for reliable output (proprietary information, not disclosed)
Patent InformationFiled: 17.02.2000Title: Signal processing technique
PublicationsWO0161526 (A3)WO0161526 (A2)US6954721 (B2)
20.10.2006
Machine condition monitoring Machine condition monitoring
Slide 25
ww
w.m
aste
rsin
inno
vatio
n.co
m
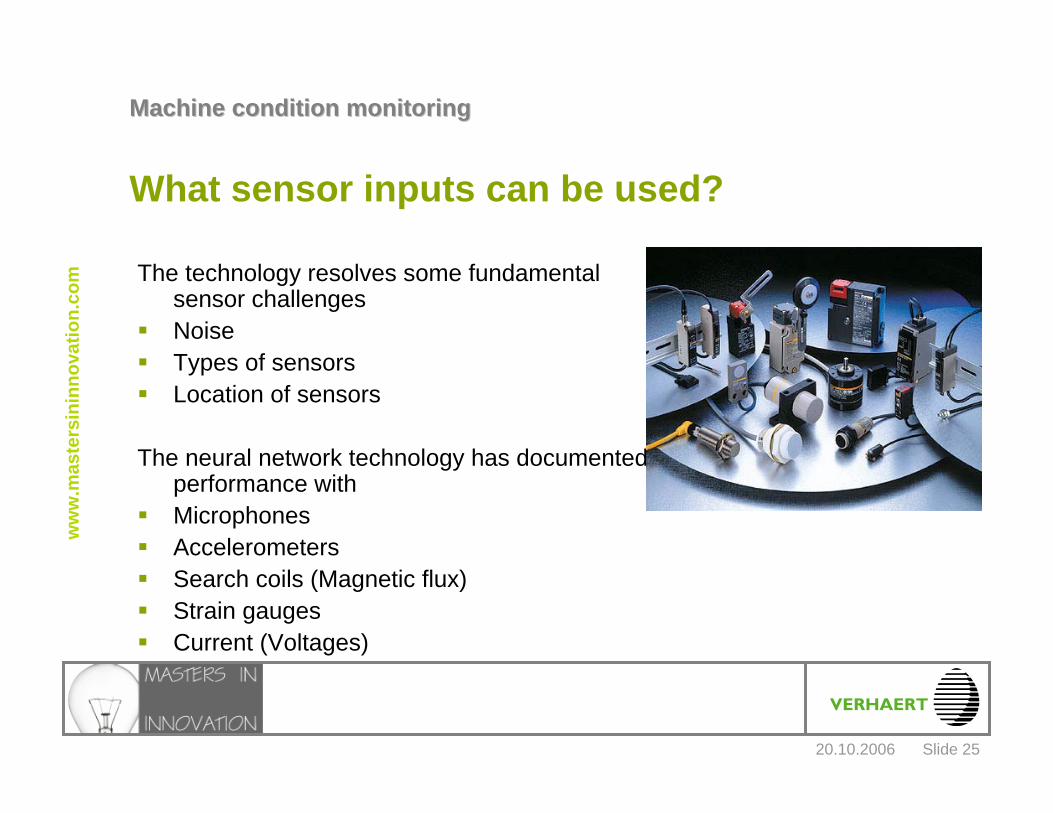
What sensor inputs can be used?
The technology resolves some fundamental sensor challengesNoiseTypes of sensorsLocation of sensors
The neural network technology has documented performance withMicrophonesAccelerometersSearch coils (Magnetic flux)Strain gaugesCurrent (Voltages)

20.10.2006
Machine condition monitoring Machine condition monitoring
Slide 26
ww
w.m
aste
rsin
inno
vatio
n.co
m
What kind of output does it provide?
Robust statistics to output one simple scalarDicrimination factor
Scalar can indicatePresent general condition – anomalie identificationSeverity of faultTime-to-critical-failureFailurePhysical location of faultWhat caused the failure
Scalar can be normalised to customer preferenceStandard: 0 – 1PercentageGraph – Diagram
From real time continuous monitoring to monitoring on request
Capability assuredCapability com
promised
1|)(~|
|)(~|2wU
2wMM −
−
−≡
xxx
xxx
E
EADI
20.10.2006
Machine condition monitoring Machine condition monitoring
Slide 27
ww
w.m
aste
rsin
inno
vatio
n.co
m
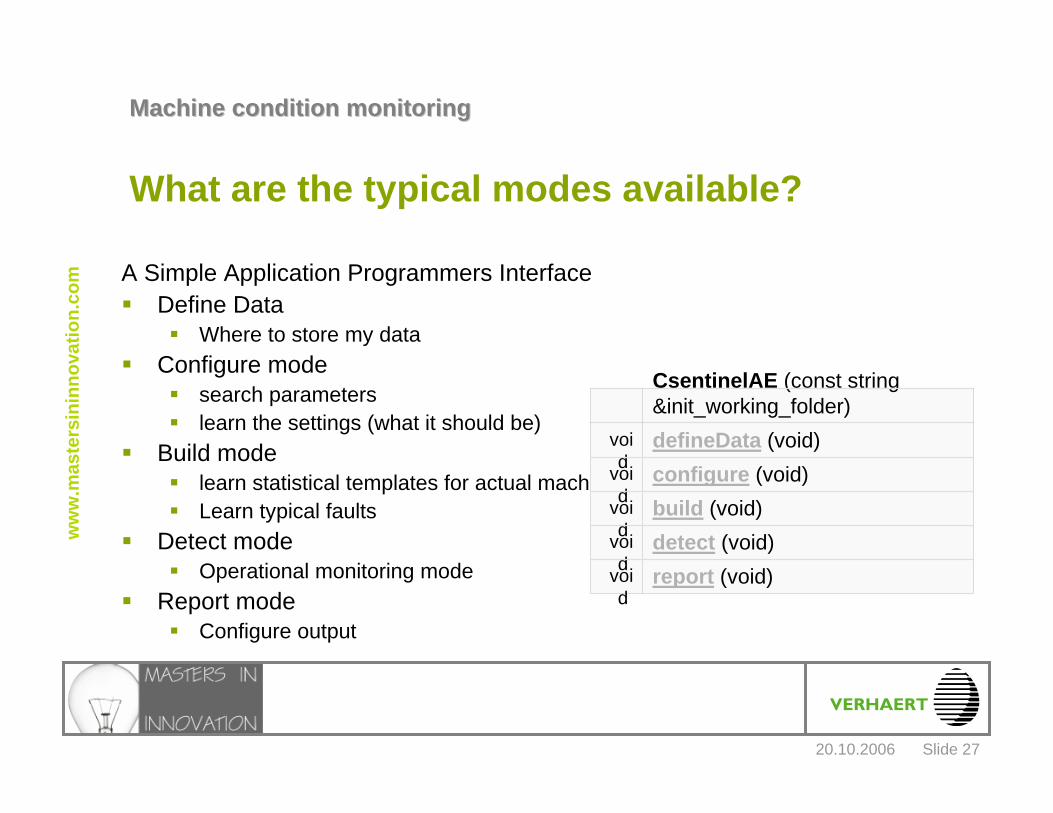
What are the typical modes available?
A Simple Application Programmers InterfaceDefine Data
Where to store my dataConfigure mode
search parameters learn the settings (what it should be)
Build modelearn statistical templates for actual machine Learn typical faults
Detect mode Operational monitoring mode
Report modeConfigure output
report (void)void
detect (void)void
build (void)void
configure (void)void
defineData (void)void
CsentinelAE (const string &init_working_folder)

20.10.2006
Machine condition monitoring Machine condition monitoring
Slide 28
ww
w.m
aste
rsin
inno
vatio
n.co
m
Is it difficult to configure?
Simple XML -configuration

20.10.2006
Machine condition monitoring Machine condition monitoring
Slide 29
ww
w.m
aste
rsin
inno
vatio
n.co
m
How do you train and calibrate the model?Training Process
Run down healthy data setsKnown configuration of sensorsNominal operating conditions
The model minimise the mean-squared-error (MSE)Validation ProcessMeasure how closely the model matches with new ‘unseen’ healthy data (collect under the same conditions as training data)The MSE of the new data set provides a natural variability of that machine
Make the system more robust with ‘faulty’ data
Faulty data is not to train the model and not to look for a particular faultStabilise the process - learn from a particular fault
If particular failure modes are known, then specific data on them can be added
Use different sensors to characterise input
Training Phase
Iterate to minimise error
Adapt the model parameters to reduce the mean-squared model-error for the training data-set as far as possible.
Validation Phase
Monitoring Phase
For the trained values of the model parameters, calculate the discrimination index for the data-set(s) to be monitored.
For the current values of the model parameters, measure the mean-squared model-error for the training data-set.
For the trained values of the model parameters, measure the mean-squared model-error for the validation data-set.
For the trained values of the model parameters, measure the mean-squared model-error for the data-set(s) to be monitored.
Optional: check statistical significance of discrimination index by repeating previous step (left) with different validation data-sets.
> Repeat this process whenever necessary
20.10.2006
Machine condition monitoring Machine condition monitoring
Slide 30
ww
w.m
aste
rsin
inno
vatio
n.co
m
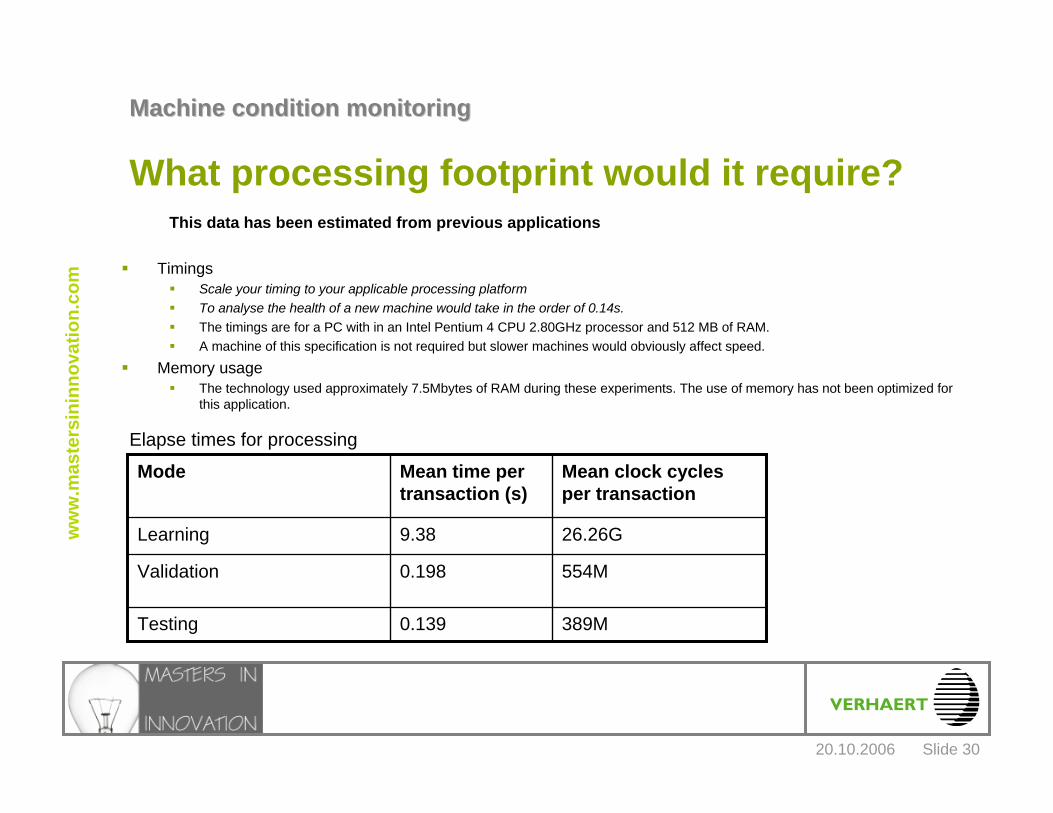
What processing footprint would it require?This data has been estimated from previous applications
TimingsScale your timing to your applicable processing platformTo analyse the health of a new machine would take in the order of 0.14s.The timings are for a PC with in an Intel Pentium 4 CPU 2.80GHz processor and 512 MB of RAM. A machine of this specification is not required but slower machines would obviously affect speed.
Memory usageThe technology used approximately 7.5Mbytes of RAM during these experiments. The use of memory has not been optimized for this application.
389M0.139Testing
554M0.198Validation
26.26G9.38Learning
Mean clock cycles per transaction
Mean time per transaction (s)
ModeElapse times for processing

20.10.2006
Machine condition monitoring Machine condition monitoring
Slide 31
ww
w.m
aste
rsin
inno
vatio
n.co
m
Can you use or make it smarter?Predict the time-to-failure
Physics of failure model – FMECAData on usage
Predict the severity of an errorSimply run several faulty data sets to understand discrimination indexDifferentiation between different faulty data sets is the basis for severity discrimination
Integrate an array of sensors: e.g. Improve fault recognitionCriticality of sensorsCost of sensors (more, but low cost components)Accessibility of component
Filter out spatial noise factor
20.10.2006
Machine condition monitoring Machine condition monitoring
Slide 32
ww
w.m
aste
rsin
inno
vatio
n.co
m
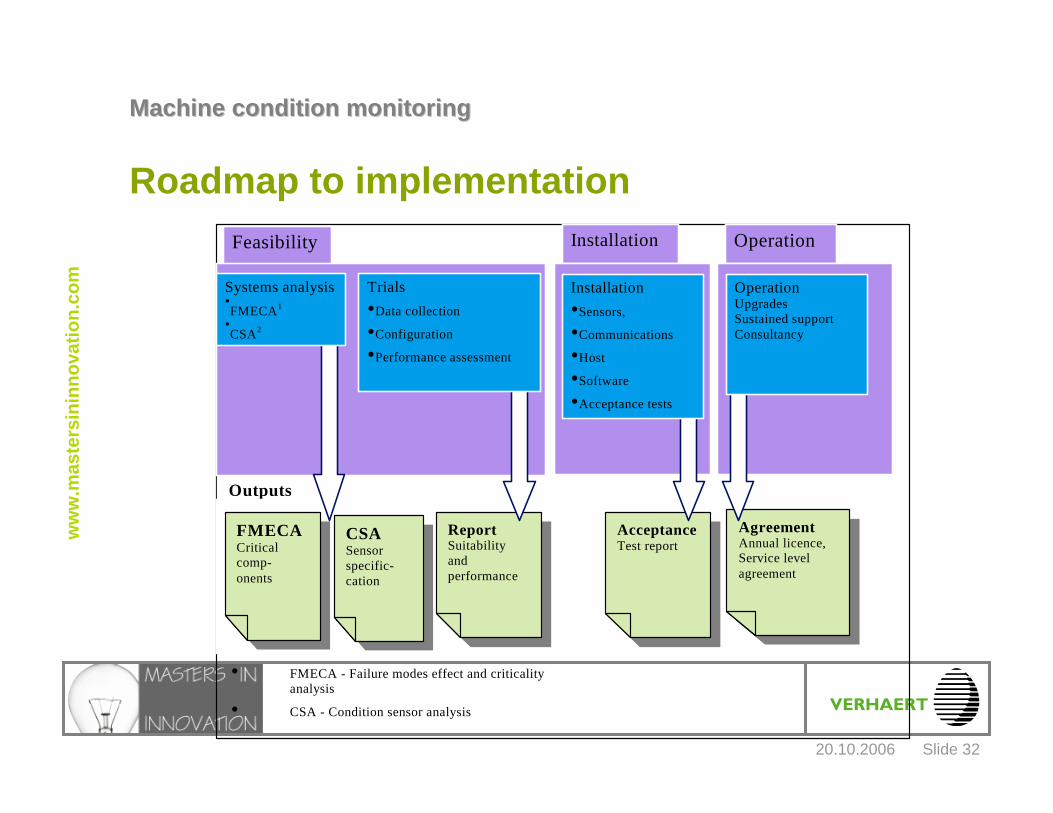
Roadmap to implementation
Outputs
Installation Feasibility
• FMECA - Failure modes effect and criticality analysis
• CSA - Condition sensor analysis
FMECA Critical comp- onents
CSA Sensor specific-cation
Agreement Annual licence, Service level agreement
Report Suitability and performance
Systems analysis•FMECA1
•CSA2
Trials •Data collection
•Configuration
•Performance assessment
Operation
AcceptanceTest report
Installation •Sensors,
•Communications
•Host
•Software
•Acceptance tests
Operation Upgrades Sustained support Consultancy

20.10.2006
Machine condition monitoring Machine condition monitoring
Slide 33
ww
w.m
aste
rsin
inno
vatio
n.co
m
Why is it different?
It is easy to use for health detector on EVERY system
It easy monitors complex systems (where expert analysis takes too long)
It easy monitors newly systems (where no or few expert data / knowledge)
It can be tuned as an expert system by adding expert knowledge or data in the setup phase
20.10.2006
Machine condition monitoring Machine condition monitoring
Slide 34
ww
w.m
aste
rsin
inno
vatio
n.co
m
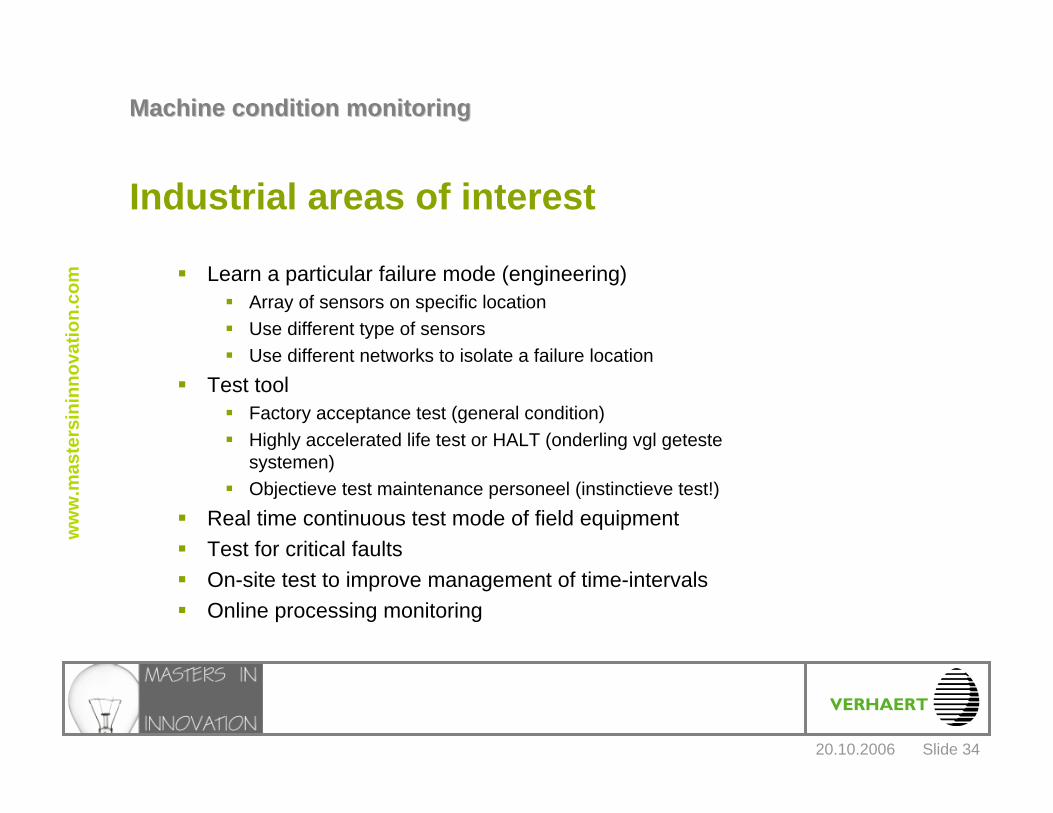
Industrial areas of interest
Learn a particular failure mode (engineering)Array of sensors on specific locationUse different type of sensorsUse different networks to isolate a failure location
Test toolFactory acceptance test (general condition)Highly accelerated life test or HALT (onderling vgl geteste systemen)Objectieve test maintenance personeel (instinctieve test!)
Real time continuous test mode of field equipmentTest for critical faultsOn-site test to improve management of time-intervalsOnline processing monitoring

20.10.2006
Machine condition monitoring Machine condition monitoring
Slide 35
ww
w.m
aste
rsin
inno
vatio
n.co
m
Verhaert New Products & Services nvHogenakkerhoekstraat 219150 KruibekeBelgiumTel +32 (0)3 250 19 00Fax +32 (0)3 254 10 [email protected]
www.mastersininnovation.com