mabpac rp columns - thermo fisher scientific · make sure you follow the precautionary statements...
TRANSCRIPT
For Research Use Only. Not for use in diagnostic procedures.
MAbPac RP Columns
065625 Revision 02 • March 2017
User M
anu
al

Thermo Scientific Product Manual for MAbPac RP Columns Page 2 of 27 065625-02 For Research Use Only. Not for use in diagnostic procedures.
Product Manual
for
MAbPac RP Analytical and Guard Columns
3 × 100 mm, (Item # 088644)
3 × 50 mm, (Item # 088645)
3 × 10 mm, (Item # 088646)
2.1 × 100 mm, (Item # 088647)
2.1 × 50 mm, (Item # 088648)
2.1 × 10 mm, (Item # 088649)
1.0 × 150 mm, (Item # 302598)
1.0 × 100 mm, (Item # 302695)
1.0 × 50 mm, (Item # 302597)

Thermo Scientific Product Manual for MAbPac RP Columns Page 3 of 27 065625-02 For Research Use Only. Not for use in diagnostic procedures.
© 2017 Thermo Fisher Scientific Inc. All rights reserved.
All trademarks are the property of Thermo Fisher Scientific Inc. and its subsidiaries.
Thermo Fisher Scientific Inc. provides this document to its customers with a product purchase to use in the product
operation. This document is copyright protected and any reproduction of the whole or any part of this document is
strictly prohibited, except with the written authorization of Thermo Fisher Scientific Inc.
The contents of this document are subject to change without notice. All technical information in this document is
for reference purposes only. System configurations and specifications in this document supersede all previous
information received by the purchaser.
Thermo Fisher Scientific Inc. makes no representations that this document is complete, accurate or error free and
assumes no responsibility and will not be liable for any errors, omissions, damage or loss that might result from
any use of this document, even if the information in the document is followed properly.
This document is not part of any sales contract between Thermo Fisher Scientific Inc. and a purchaser. This
document shall in no way govern or modify any Terms and Conditions of Sale, which Terms and Conditions of
Sale shall govern all conflicting information between the two documents.
For Research Use Only. Not for Use in Diagnostic Procedures.
Revision History:
Revision 2, March, 2017, Added information for 1 mm column format.

Thermo Scientific Product Manual for MAbPac RP Columns Page 4 of 27 065625-02 For Research Use Only. Not for use in diagnostic procedures.
Safety and Special Notices
Make sure you follow the precautionary statements presented in this guide. The safety and other
special notices appear in boxes.
Safety and special notices include the following:
Indicates a potentially hazardous situation which, if not avoided, could result in death or
serious injury.
Indicates a potentially hazardous situation which, if not avoided, could result in damage
to equipment.
Indicates a potentially hazardous situation which, if not avoided, may result in minor or
moderate injury. Also used to identify a situation or practice that may seriously damage
the instrument, but will not cause injury.
Indicates information of general interest.
IMPORTANT
Highlights information necessary to prevent damage to software, loss of data, or invalid
test results; or might contain information that is critical for optimal performance of the
system.
Tip Highlights helpful information that can make a task easier.
SAFETY
!
WARNING
!
CAUTION
!
NOTE
!

Contents
Thermo Scientific Product Manual for MAbPac RP Columns Page 5 of 27 065625-02 For Research Use Only. Not for use in diagnostic procedures.
Contents
1. Introduction.............................................................................................................................. 7
1.1 Introduction to the MAbPac RP Column ........................................................................................ 7
1.2 MAbPac RP Operating Limits and Specifications ......................................................................... 8
1.2.1 Operating Conditions ............................................................................................................................ 8
1.2.2 Physical Characteristics......................................................................................................................... 8
1.3 Formats of the MAbPac RP Columns ............................................................................................ 9
2. Getting Started; Step-By-Step Procedure .......................................................................... 10
2.1 Step 1 – Visually inspect the column ........................................................................................... 10
2.2 Step 2 – Mobile Phase Selection .................................................................................................. 10
2.3 Step 3 – Set up the LC system ...................................................................................................... 10
2.4 Step 4 – Condition the column ..................................................................................................... 11
2.5 Step 5 – Verify the performance of the column ........................................................................... 11
2.6 Step 6 – Real sample analysis ....................................................................................................... 11
3. Column Care .......................................................................................................................... 12
3.1 Column storage ............................................................................................................................. 12
3.2 Operating pH range: pH 0 to 14 .................................................................................................. 12
3.3 Operating temperature limit: up to 110 ºC .................................................................................... 12
3.4 Pressure limit: 4000 psi ................................................................................................................ 12
3.5 Flow rate ....................................................................................................................................... 12
3.6 Loading capacity........................................................................................................................... 13
3.7 Ruggedness ................................................................................................................................... 14
3.8 Column washing procedure .......................................................................................................... 15
4. Example Applications ............................................................................................................ 16
4.1 Optimization for protein separation .............................................................................................. 16
4.2 Separation of mAb and mAb fragments ....................................................................................... 17
4.3 LC/MS analysis of mAb ............................................................................................................... 18
4.4 LC/MS analysis of mAb fragments .............................................................................................. 19
4.5 LC/MS analysis of oxidized mAb ................................................................................................ 20
4.6 Analysis of Antibody-Drug Conjugate (ADC) ............................................................................. 23
4.7 Top-down LC/MS/MS Analysis of Intact Protein Mix ................................................................ 24

Contents
Thermo Scientific Product Manual for MAbPac RP Columns Page 6 of 27 065625-02 For Research Use Only. Not for use in diagnostic procedures.
5. Frequently Asked Questions ................................................................................................. 26
5.1 What factors do I need to consider for developing a high throughput method
using MAbPac RP ........................................................................................................................ 26
5.2 What is the recommended operating temperature for MAbPac RP? ............................................ 26
5.3 What is the carryover on MAbPac RP? ........................................................................................ 26
5.4 What is the recommended maximum flow rate? .......................................................................... 26
5.5 What is the recommended TFA concentration for protein separation? ........................................ 26
5.6 How to mitigate carryover issue? ................................................................................................. 26
5.7 How to optimize the HPLC system configuration to achieve the best separation
using the 1.0 mm ID MAbPac RP column? ................................................................................. 27

1 – Introduction
Thermo Scientific Product Manual for MAbPac RP Columns Page 7 of 27 065625-02 For Research Use Only. Not for use in diagnostic procedures.
1. Introduction
1.1 Introduction to the MAbPac RP Column
MAbPac RP is a reverse phase (RP) column specifically designed for separation of intact
monoclonal antibodies (mAbs) and mAb fragments (figure 1). The stationary phase is designed
to be compatible with mass spectrometry friendly organic solvent such as acetonitrile and
isopropanol and low pH eluents containing trifluoroacetic acid or formic acid. The MAbPac RP
is based on supermacroporous 4 µm polymer particles that are stable at extreme pH (0 – 14) and
high temperature (up to 110 °C). Particles are inherently hydrophobic so there is no bonded phase,
alkyl ligand required for reversed-phase separations. The large pore size polymeric resin enables
efficient separation of protein molecules with very low carry over.
Figure 1 – Structure of IgG and typical forms of heterogeneity
SS
SS
SS
SSS
S
SS
S
S
SS
SS
S
S
SS
S
SS
S
VH VH
CH1
CH2
CH3
CH1
CH2
CH3
VL
CL
VL
CL
S S
S S
Antigen-bindingsiteHeavy Chain
Glycosylation
Fc
Fab
SS
Reduction of disulfide bondor disulfide shuffling
Light Chain Asparagine deamidation
Methionine oxidation
Lysine truncationK K
Aspartic acid isomerization
Pyroglutamate formationfrom glutamine or glutamic acid
1 – Introduction
Thermo Scientific Product Manual for MAbPac RP Columns Page 8 of 27 065625-02 For Research Use Only. Not for use in diagnostic procedures.
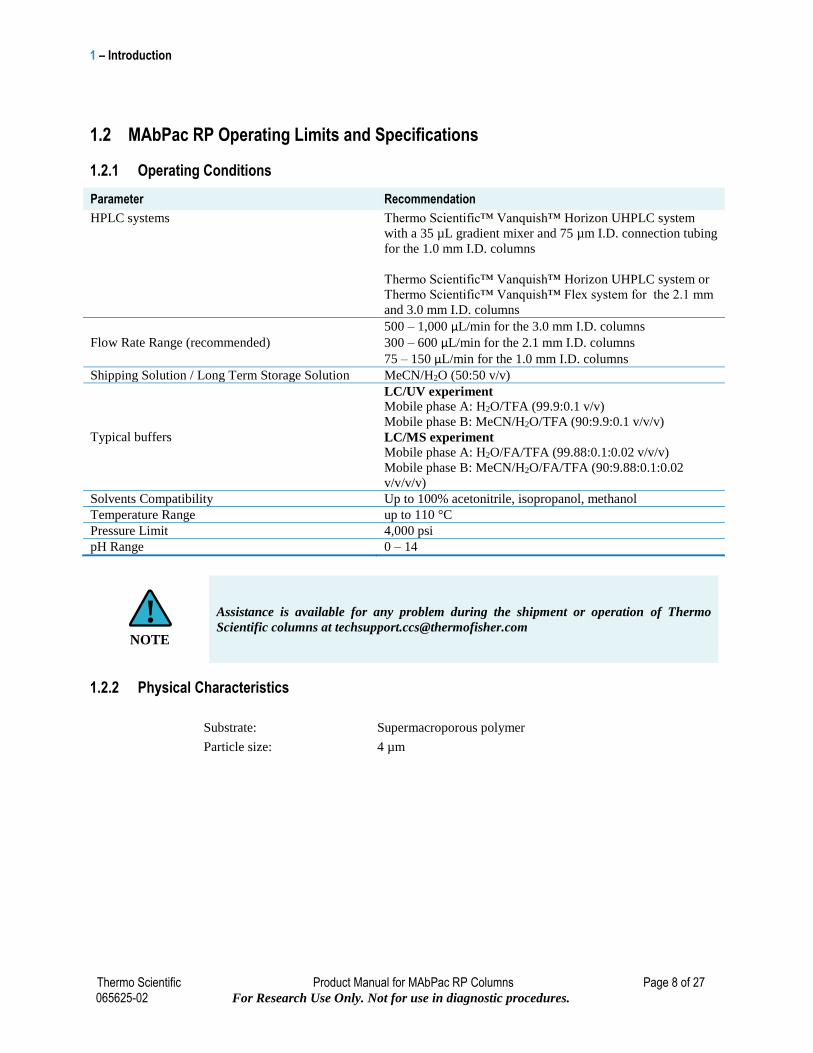
1.2 MAbPac RP Operating Limits and Specifications
1.2.1 Operating Conditions
Parameter Recommendation
HPLC systems Thermo Scientific™ Vanquish™ Horizon UHPLC system
with a 35 µL gradient mixer and 75 µm I.D. connection tubing
for the 1.0 mm I.D. columns
Thermo Scientific™ Vanquish™ Horizon UHPLC system or
Thermo Scientific™ Vanquish™ Flex system for the 2.1 mm
and 3.0 mm I.D. columns
Flow Rate Range (recommended)
500 – 1,000 µL/min for the 3.0 mm I.D. columns
300 – 600 µL/min for the 2.1 mm I.D. columns
75 – 150 µL/min for the 1.0 mm I.D. columns
Shipping Solution / Long Term Storage Solution MeCN/H2O (50:50 v/v)
Typical buffers
LC/UV experiment
Mobile phase A: H2O/TFA (99.9:0.1 v/v)
Mobile phase B: MeCN/H2O/TFA (90:9.9:0.1 v/v/v)
LC/MS experiment
Mobile phase A: H2O/FA/TFA (99.88:0.1:0.02 v/v/v)
Mobile phase B: MeCN/H2O/FA/TFA (90:9.88:0.1:0.02
v/v/v/v)
Solvents Compatibility Up to 100% acetonitrile, isopropanol, methanol
Temperature Range up to 110 °C
Pressure Limit 4,000 psi
pH Range 0 – 14
Assistance is available for any problem during the shipment or operation of Thermo
Scientific columns at [email protected]
1.2.2 Physical Characteristics
Substrate: Supermacroporous polymer
Particle size: 4 µm
NOTE
!

1 – Introduction
Thermo Scientific Product Manual for MAbPac RP Columns Page 9 of 27 065625-02 For Research Use Only. Not for use in diagnostic procedures.
1.3 Formats of the MAbPac RP Columns
Currently, MAbPac RP size exclusion columns are available in 3.0 mm, 2.1 mm, and 1.0 mm diameter formats.
Product Description Part Number
MAbPac RP, 4µm, Analytical column 3.0 × 100 mm 088644
MAbPac RP, 4µm, Analytical column 3.0 × 50 mm 088645
MAbPac RP, 4µm, Guard 3.0 × 10 mm 088646
MAbPac RP, 4µm, Analytical column 2.1 × 100 mm 088647
MAbPac RP, 4µm, Analytical column 2.1 × 50 mm 088648
MAbPac RP, 4µm, Guard 2.1 × 10 mm 088649
MAbPac RP, 4µm, Analytical column 1.0 × 150 mm 302598
MAbPac RP, 4µm, Analytical column 1.0 × 100 mm 302695
MAbPac RP, 4µm, Analytical column 1.0 × 50 mm 302597

2 – Getting Started; Step-By-Step Procedure
Thermo Scientific Product Manual for MAbPac RP Columns Page 10 of 27 065625-02 For Research Use Only. Not for use in diagnostic procedures.
2. Getting Started;
Step-By-Step Procedure
Thermo Fisher Scientific recommends that you perform an efficiency test on your MAbPac RP
column before use. The purpose of column performance validation is to ensure no damage has
occurred during shipping. Steps 1 – 5 below outline the necessary steps to perform this validation
test. Test the column using the conditions described on the Quality Assurance (QA) report
enclosed in the column box. Repeat the test periodically to track the column performance over
time. Note that slight variations may be found on two different HPLC systems due to system
electronic, hardware, plumbing, operating environment, reagent quality, column conditioning,
and operator technique.
2.1 Step 1 – Visually inspect the column
Report any visible damage upon receiving the column to Thermo Fisher Scientific immediately.
Depending upon the nature of the damage, we may request that you return the damaged column
back to us for a replacement column.
2.2 Step 2 – Mobile Phase Selection
The MAbPac RP column can be used with a variety of mass spectrometry friendly organic
solvents such as acetonitrile and isopropanol. In general we recommend adding 0.1% TFA to the
mobile phase for good separation. When the HPLC system is coupled to mass spectrometry, it is
recommended to reduce the TFA content to 0.02% to avoid ion suppression.
2.3 Step 3 – Set up the LC system
Use a standard LC system equipped with a LC pump, a column oven, a UV detector (210 - 220
nm and/or 280 nm) and an injector (or an autosampler). It is highly recommended that the system
be optimized for low dead volume; usage of small internal diameter tubing (such as 100 µm) and
a proper detector flow cell (such as the 2.5 µL semi-micro flow cell) is required for best results.
The system should be thoroughly primed before use. It is recommended the column is run at high
temperature (70 to 80 °C) to achieve better separation of mAb and mAb fragments.
Analytical format MAbPac RP columns in 2.1 mm ID and 3.0 mm ID format can be used with
HPLC system equipped with either high pressure mixing pump (HPG) or low pressure mixing
pump (LPG) to achieve high resolution separation. Low flow MAbPac RP columns in 1.0 mm ID
are normally operated in the flow rate range of 75 to 150 µL/min and therefore should be operated
with a high pressure mixing pump such as the Vanquish Horizon UHPLC system to avoid
excessive gradient delay. The 1.0 mm ID MAbPac RP is designed to be used with high resolution
mass spectrometer such as Thermo Scientific™ Q Exactive™ BioPharma for accurate intact mass
detection and top-down protein sequencing.

2 – Getting Started; Step-By-Step Procedure
Thermo Scientific Product Manual for MAbPac RP Columns Page 11 of 27 065625-02 For Research Use Only. Not for use in diagnostic procedures.
2.4 Step 4 – Condition the column
Set the pressure limit on the pump to ≤ 4000 psi (276 bar). Slowly ramp up the flow rate: 0.5
mL/min for 3.0 mm ID column, 0.3 ml/min for 2.1 mm ID column, or 0.1 ml/min for 1.0 mm ID
column. If possible, set 1-minute flow ramps up and down. Wash the column with mobile phase
for 20 minutes.
2.5 Step 5 – Verify the performance of the column
Perform the column performance test using the conditions described in the Quality Assurance
Report and compare the result with the one in the report. After the column is fully equilibrated,
multiple injections of protein samples should be made until the reproducible results are obtained.
Due to various reasons, such as differences in LC systems, mobile phases, etc, you may
observe somewhat different separation from that in the report.
2.6 Step 6 – Real sample analysis
Once the column performance is satisfactorily confirmed in Step 1-5, the column is ready for real
sample analysis. Equilibrate the column with the desired mobile phase before sample analysis.
It is recommended that the column performance test be performed periodically to monitor
the condition of the column.
NOTE
!
NOTE
!

3 – Column Care
Thermo Scientific Product Manual for MAbPac RP Columns Page 12 of 27 065625-02 For Research Use Only. Not for use in diagnostic procedures.
3. Column Care
3.1 Column storage The column can be stored in the mobile phase for short-term storage. For long-term storage (more
than 5 days), it is recommended to store the column in a solution containing 90% acetonitrile in
deionized water.
3.2 Operating pH range: pH 0 to 14
3.3 Operating temperature limit: up to 110 ºC MAbPac RP column is stable at high temperature up to 110 ºC. The typical operating temperature
for mAb and mAb fragment separation is between 70 ºC to 80 ºC.
3.4 Pressure limit: 4000 psi The back pressure of the column is strongly correlated to the column temperature and flow rate.
3.5 Flow rate Please refer to operating condition table (section 1.2) for recommended flow rate at 80 ºC.

3 – Column Care
Thermo Scientific Product Manual for MAbPac RP Columns Page 13 of 27 065625-02 For Research Use Only. Not for use in diagnostic procedures.
3.6 Loading capacity The loading capacity of MAbPac RP column spans at least three orders of magnitude. Figure 2
shows a mAb analyzed on MAbPac RP at four different sample loadings: 0.02 µg, 0.2 µg, 2 µg,
and 20 µg. The peak area to sample load is plotted and linear fit yields a R2 equal to 1. This
correlation allows the MAbPac RP column to be used for quantitation of mAb over a wide range
of concentrations.
Figure 2 – Loadability
Column: MAbPac RP, 4 µmFormat: 2.1 ×50 mmMobile phase A: H2O/TFA (99.9 : 0.1 v/v)
Mobile phase B: MeCN/ H2O/TFA (90: 9.9 :0.1
v/v/v/)Gradient:
Time (min) %A %B-1 85 15
0.0 85 15
2.5 50 502.7 50 50
2.8 85 153.0 85 15
Temperature: 80 ºC
Flow rate: 0.6 mL/minInj. volume: 1 µL
Detection: UV (280 nm)Sample: a. mAb (0.02 mg/mL)
b. mAb (0.2 mg/mL)
c. mAb (2 mg/mL)d. mAb (20 mg/mL)
-0.50
1.25
2.50
-2.0
10.0
18.0
-20
140
1.00 1.50 2.00 2.50 3.00 3.50 4.00
-100
500
900
Retention Time (min)
(a)
(d)
(c)
(b)

3 – Column Care
Thermo Scientific Product Manual for MAbPac RP Columns Page 14 of 27 065625-02 For Research Use Only. Not for use in diagnostic procedures.
3.7 Ruggedness Column ruggedness is a critical characteristic for accurate and reproducible results, as well as
good column lifetime. MAbPac RP columns are packed using a carefully developed packing
protocol to ensure excellent packed bed stability, column efficiency and peak asymmetry. Figure
3 demonstrates that the excellent performance of the MAbPac RP is maintained throughout 1,000
runs at 80 ºC providing consistent retention time, peak shape, and peak efficiency, with minimal
increase in column backpressure. The RSDs of retention time from four protein peaks are
tabulated in Figure 3.
Figure 3 – Excellent reproducibility
Column: MAbPac RP, 4 µmFormat: 2.1 ×50 mmMobile phase A: H2O/TFA (99.9 : 0.1 v/v)
Mobile phase B: MeCN/ H2O/TFA (90: 9.9 :0.1
v/v/v)Gradient:
Time (min) %A %B0.0 80 20
2.5 50 50
2.7 50 502.8 80 20
4.0 80 20
Temperature: 80 ºC
Flow rate: 0.6 mL/minInj. volume: 1 µL
Detection: UV (280 nm)Sample: 1. Ribonuclease A (0.5 mg/mL)
2. Cytochrome C (0.5 mg/mL)
3. Lysozyme (0.5 mg/mL)4. mAb (1 mg/mL)
0.00 0.50 1.00 1.50 2.00 2.50 3.00
-80
-60
-40
-20
0
20
40
60
80
100
120
#1101
#901
#801
#701
#651
#501
#401
#301
#201
#101
Retention Time (min)
1
2
3
4
Peaks 1 2 3 4
RSD of
Retention
Time 0.535 0.262 0.225 0.123

3 – Column Care
Thermo Scientific Product Manual for MAbPac RP Columns Page 15 of 27 065625-02 For Research Use Only. Not for use in diagnostic procedures.
3.8 Column washing procedure To elute very hydrophobic/sticky protein, increase the mobile phase organic content up 90% (such
as 90% acetonitrile) and wash the column for 10-20 min. MAbPac RP chemistry (PS-DVB) is
stable under a wide pH range. If needed, column can be washed with a mixture of organic solvent
and high pH eluent. Figure 4 shows that MAbPac RP column maintains its performance after 6
hours of wash with 0.8 M NaOH and 18% acetonitrile at 80 ºC. Compared to silica based RP
columns, the MAbPac RP has chemical stability, especially under alkaline condition and provides
a great advantage for column cleaning and removal of protein carryover.
To eliminate metal contamination, wash the column in the following sequence:
1. 100 mM NH4OAc for 10 column volumes
2. 100 mM Sodium Pyrophosphate solution for 100 column volumes
3. 100 mM NH4OAc for 10 column volumes
4. MeCN/100 mM NH4OAc (90:10; v/v) for 20 column volumes
5. MeCN/H2O (50:50; v/v) for 10 column volumes
Figure 4 – Superior chemical stability
Column: MAbPac RP, 4 µmFormat: 2.1 ×50 mmMobile phase A: H2O/TFA (99.9 : 0.1 v/v)
Mobile phase B: MeCN/ H2O/TFA (90: 9.9 :0.1
v/v/v)Gradient:
Time (min) %A %B0.0 85 15
2.5 50 50
2.7 50 502.8 85 15
5.0 85 15
Temperature: 80 ºC
Flow rate: 0.6 mL/minInj. volume: 1 µL
Detection: UV (280 nm)Sample: 1. Ribonuclease A (0.5 mg/mL)
2. Cytochrome C (0.5 mg/mL)
3. Lysozyme (0.5 mg/mL)4. mAb (1 mg/mL)
0.50 1.00 1.50 2.00 2.50 3.00 3.50
-20
0
13
25
38
50
63
75
88
100
113
125
140
After 6 hrs of 0.8 M NaOH
and 18% acetonitrile
wash at 80 C
Before NaOH wash
1
2
3
4
Retention Time (min)

4 – Example Applications
Thermo Scientific Product Manual for MAbPac RP Columns Page 16 of 27 065625-02 For Research Use Only. Not for use in diagnostic procedures.
4. Example Applications
4.1 Optimization for protein separation
The MAbPac RP column is designed for high resolution and fast separation of proteins. The speed and resolution of
the separation can be optimized by adjusting both gradient slope and flow rate. The supermacroporous nature of the
resin provides low back pressure characteristic and enables high flow rate. Figure 5 illustrates the separation of four
standard proteins: ribonuclease A, cytochrome C, lysozyme, and BSA. In figure 5a, the four proteins were baseline
separated using a 10-min gradient method with a gradient slope of 10% B per min. The total run time was 15 minutes.
By doubling the flow rate, a 4-min gradient method with a gradient slope of 25% B per min (figure 5b) can separate
the same four proteins, although the resolution is slightly lower than the separation achieved by the 10-min gradient
method. By doubling the flow rate and reducing the total gradient range (10% B to 60% B), slightly better separation
was achieved using a 4-min gradient method with a gradient slope of 12.5% B per min (figure 5c).
Figure 5 – Impact of flow rate and gradient slope on protein separation
-50
125
250
375
500
-50
100
200
350
0.0 1.0 2.0 3.0 4.0 5.0 6.0 7.0 8.0 9.0 10.0 11.0 12.0 13.0 14.0 15.0
-50
100
250
Retention Time (min)
Column: MAbPac RP, 4 µm
Format: 2.1 ×50 mmMobile phase A: H2O/TFA (99.9:0.1 v/v)
Mobile phase B: MeCN/H2O/TFA (90:9.9:0.1
v/v/v)Gradient slope: (a) 10% B/min
(b) 25% B/min(c) 12.5% B/min
Flow rate: (a) 0.3 mL/min
(b) 0.6 mL/min(c) 0.6 mL/min
Temperature: 80 ºCInj. volume: 2 µL
Detection: UV (280 nm)
Sample: 1. Ribonuclease A (2.5 mg/mL)2. Cytochrome C (2.5 mg/mL)
3. Lysozyme (2.5 mg/mL)4. BSA (5 mg/mL)
1
2
3
4
1
2
3
4
1
2
3
4
(a)
(b)
(c)
Time (min) %A %B
0.0 100 0
1.0 100 0
11.0 0 100
12.0 0 100
14.0 100 0
15.0 100 0
Time (min) %A %B
0.0 100 0
0.5 100 0
4.5 0 100
5.0 0 100
5.5 100 0
6.0 100 0
Time (min) %A %B
0.0 90 10
0.5 90 10
4.5 40 60
5.0 40 60
5.5 90 10
6.0 90 10

4 – Example Applications
Thermo Scientific Product Manual for MAbPac RP Columns Page 17 of 27 065625-02 For Research Use Only. Not for use in diagnostic procedures.
4.2 Separation of mAb and mAb fragments
Monoclonal antibodies are heterogeneous (Figure 1). Comprehensive analysis of mAb post-translational modifications,
such as deamidation, C-terminal lysine truncation, N-terminal pyroglutamation, methionine (Met) oxidation, and
glycosylation, requires complete digestion of the mAbs and sequencing of all the peptides. However, “peptide
mapping” is time consuming. A simpler and direct way to analyze the mAb variants and locate the modifications is to
measure mAb fragments. Light chain (LC) and heavy chain (HC) are generated by the reduction of mAb, Fc and Fab
fragments are generated by papain digestion. scFc and F(ab)2 fragments are generated by IdeS digestion. Figure 6
shows the analysis of Trastuzumab intact molecule and fragments. LC and HC (Figure 6b), Fc and Fab (Figure 6c),
scFc and F(ab)2 (Figure 6d) are baseline separated using a MAbPac RP column with a 10-min gradient. Similar
experiments have been carried out for Rituximab, Infliximab, and Bevacizumab. In all cases, mAb fragments have been
successfully separated (data not shown).
Figure 6 – Analysis of Trastuzumab and fragments using MAbPac RP.
(a) Trastuzumab; (b) Trastuzumab LC and HC; (c) Trastuzumab Fc and Fab fragments; (d) Trastuzumab scFc and
F(ab)2 fragments.
Column: MAbPac RP, 4 µmFormat: 3 ×50 mmMobile phase A: H2O/FA/TFA (99.88 : 0.1:0.02 v/v/v)
Mobile phase B: MeCN/ H2O/FA/TFA (90: 9.88
:0.1:0.02 v/v/v/v)Gradient:
Time (min) %A %B0.0 80 20
1.0 80 20
11.0 55 4512.0 55 45
14.0 80 2015.0 80 20
Temperature: 80 ºCFlow rate: 0.5 mL/min
Inj. volume: 5 µL Detection: UV (280 nm)
Sample: (a) Trastuzumab (5 mg/mL)
(b) Trastuzumab + DTT (4 mg/mL)(c) Trastuzumab + Papain (2 mg/mL)
(d) Trastuzumab + IdeS (2 mg/mL)
-20
140
-10.0
50.0
80.0
-10
50
90
1.0 2.0 3.0 4.0 5.0 6.0 7.0 8.0 9.0 10.0 11.0 12.0 13.0 14.0 15.0
-10
50
100
Retention Time (min)
mAb
LC
HC
Fc
Fab
scFc
F(ab)2
(b) Trastuzumab + DTT
(a) Trastuzumab
(c) Trastuzumab + Papain
(d) Trastuzumab + IdeS
4 – Example Applications
Thermo Scientific Product Manual for MAbPac RP Columns Page 18 of 27 065625-02 For Research Use Only. Not for use in diagnostic procedures.
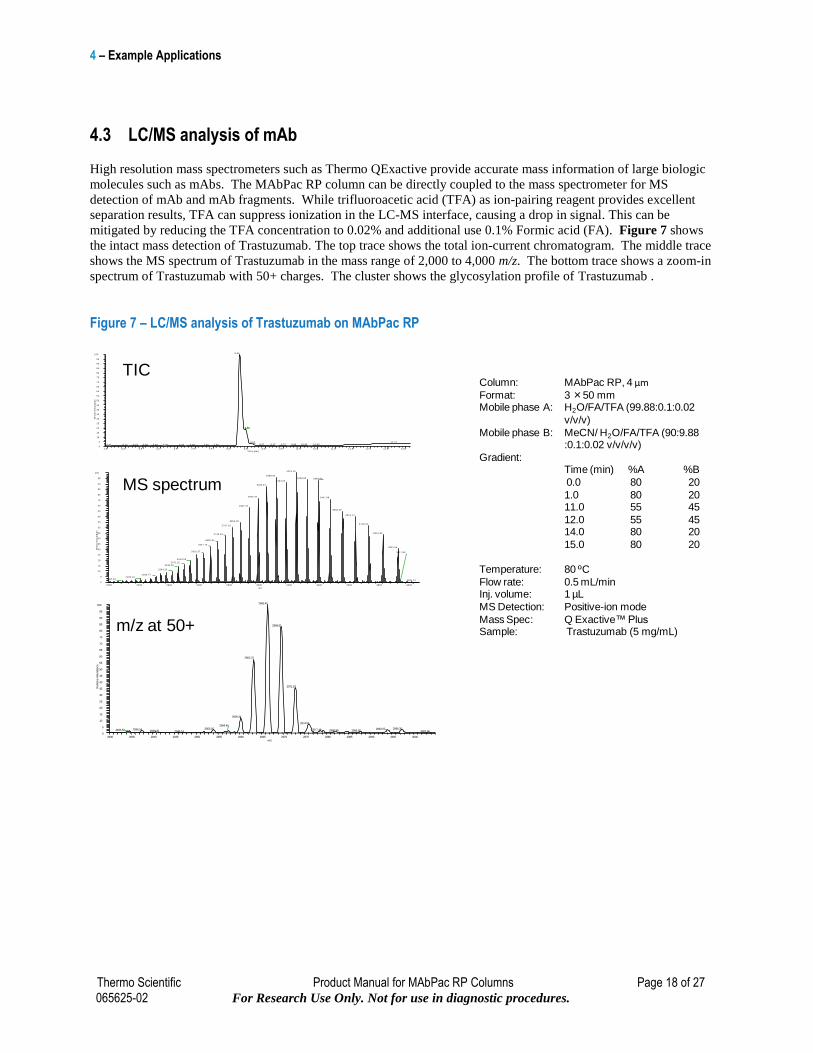
4.3 LC/MS analysis of mAb
High resolution mass spectrometers such as Thermo QExactive provide accurate mass information of large biologic
molecules such as mAbs. The MAbPac RP column can be directly coupled to the mass spectrometer for MS
detection of mAb and mAb fragments. While trifluoroacetic acid (TFA) as ion-pairing reagent provides excellent
separation results, TFA can suppress ionization in the LC-MS interface, causing a drop in signal. This can be
mitigated by reducing the TFA concentration to 0.02% and additional use 0.1% Formic acid (FA). Figure 7 shows
the intact mass detection of Trastuzumab. The top trace shows the total ion-current chromatogram. The middle trace
shows the MS spectrum of Trastuzumab in the mass range of 2,000 to 4,000 m/z. The bottom trace shows a zoom-in
spectrum of Trastuzumab with 50+ charges. The cluster shows the glycosylation profile of Trastuzumab .
Figure 7 – LC/MS analysis of Trastuzumab on MAbPac RP
Column: MAbPac RP, 4 µmFormat: 3 ×50 mmMobile phase A: H2O/FA/TFA (99.88:0.1:0.02
v/v/v)
Mobile phase B: MeCN/ H2O/FA/TFA (90:9.88 :0.1:0.02 v/v/v/v)
Gradient:Time (min) %A %B
0.0 80 20
1.0 80 2011.0 55 45
12.0 55 4514.0 80 20
15.0 80 20
Temperature: 80 ºC
Flow rate: 0.5 mL/minInj. volume: 1 µL
MS Detection: Positive-ion mode
Mass Spec: Q Exactive™ PlusSample: Trastuzumab (5 mg/mL)
TIC
MS spectrum
m/z at 50+
4.5 5 .0 5.5 6.0 6.5 7.0 7.5 8 .0 8.5 9.0 9.5 10.0 10.5 11.0 11.5 12.0 12.5 13.0Tim e (m in)
0
5
10
15
20
25
30
35
40
45
50
55
60
65
70
75
80
85
90
95
100
Re
lati
ve
Ab
unda
nce
8 .26
8.44
12.748.6310.5310.339.888.97 9.729.377.395.935.685.43 6.095.134.47 6.996.74 7.64
2000 2200 2400 2600 2800 3000 3200 3400 3600 3800 4000
m /z
0
5
10
15
20
25
30
35
40
45
50
55
60
65
70
75
80
85
90
95
100
Re
lati
ve
Ab
unda
nce
3223.20
3088.92
3294.80 3369.643154.64
3025.91
2965.42 3447.98
2907.27
3530.09
3616.14
2851.39
3706.502797.55
3801.532745.82
2695.91
2647.76
3901.54
2601.37
2513.18
2471.32
2430.80
2394.25
2283.772183.13
2057.49
3917.63
3994.21
2930 2935 2940 2945 2950 2955 2960 2965 2970 2975 2980 2985 2990 2995 3000
m/z
0
5
10
15
20
25
30
35
40
45
50
55
60
65
70
75
80
85
90
95
100
Rela
tive A
bundance
2965.42
2968.61
2962.22
2971.87
2959.34
2974.96
2996.302953.05 2993.072936.54 2977.49
2956.45
2933.53 2980.99 2986.822939.75 3002.662946.14

4 – Example Applications
Thermo Scientific Product Manual for MAbPac RP Columns Page 19 of 27 065625-02 For Research Use Only. Not for use in diagnostic procedures.
4.4 LC/MS analysis of mAb fragments
During characterization, mAb is often reduced to LC and HC. Mass spectrometry analysis of these fragments can
quickly review and localize the modifications. Figure 8 shows the separation of Trastuzumab LC and HC on a 3 × 50
mm MAbPac RP column. Total ion chromatogram (TIC) and UV spectrum show identical retention time of mAb
fragments. The mass spectrum of LC shows multiple charge states of a single polypeptide chain while the mass
spectrum of the HC shows multiple glycosylation forms of the heavy chain.
Figure 8 – LC/MS analysis of Trastuzumab light chain (LC) and heavy chain (HC) on MAbPac RP
Column: MAbPac RP, 4 µmFormat: 3 ×50 mmMobile phase A: H2O/FA/TFA (99.88:0.1:0.02 v/v/v)
Mobile phase B: MeCN/ H2O/FA/TFA (90:9.88
:0.1:0.02 v/v/v/v)Gradient:
Time (min) %A %B0.0 80 20
1.0 80 20
11.0 55 4512.0 55 45
14.0 80 2015.0 80 20
Temperature: 80 ºCFlow rate: 0.5 mL/min
Inj. volume: 1 µL UV Detection: 280 nm
MS Detection: Positive-ion mode
Mass Spec: Q Exactive™ PlusSample: Reduced trastuzumab (4 mg/mL)
TIC
UV
LC
HC
LC HC
31+
1200 1300 1400 1500 1600 1700 1800 1900 2000 2100 2200 2300 2400
m/z
0
10
20
30
40
50
60
70
80
90
100
0
10
20
30
40
50
60
70
80
90
100
Re
lativ
e A
bu
nd
an
ce
1954.161803.88
2131.63
1675.14
1563.47 2344.74
1465.80
1379.68
1303.031967.87 2146.62
1234.471687.01 2361.04
2233.121575.62
1819.28
1478.76
1762.96
2095.001392.86
1638.291539.03
1692.831493.85
1751.18
1446.471813.69
1410.901880.81
1953.111368.36
2031.28
2115.811336.67
2200.69
2308.14 2418.021269.96
1238.962472.972253.37
1180.58
2358.102158.66
3.0 3.5 4.0 4.5 5.0 5.5 6.0 6.5 7.0 7.5 8.0 8.5 9.0 9.5 10.0 10.5 11.0
Time (min)
0
50000
100000
150000
200000
250000
300000
350000
400000
450000
500000
550000
600000
uA
U
0
10
20
30
40
50
60
70
80
90
100
Rela
tive A
bundance
8.28
7.43
8.58 8.8610.7710.373.943.63 9.114.793.23 10.024.34 9.765.20 5.50 5.95 6.10 7.956.41 6.96
8.28
7.42
8.859.107.736.806.636.35
T:
1600 1605 1610 1615 1620 1625 1630 1635 1640 1645 1650 1655 1660 1665 1670m /z
0
5
10
15
20
25
30
35
40
45
50
55
60
65
70
75
80
85
90
95
100
Re
lati
ve
Ab
unda
nce
1638.29
1633.01
1643.60
1631.64 1640.081634.91
1628.281625.611646.93
1671.371624.16 1661.331605.32 1608.89 1666.591653.791620.161600.00 1615.28

4 – Example Applications
Thermo Scientific Product Manual for MAbPac RP Columns Page 20 of 27 065625-02 For Research Use Only. Not for use in diagnostic procedures.
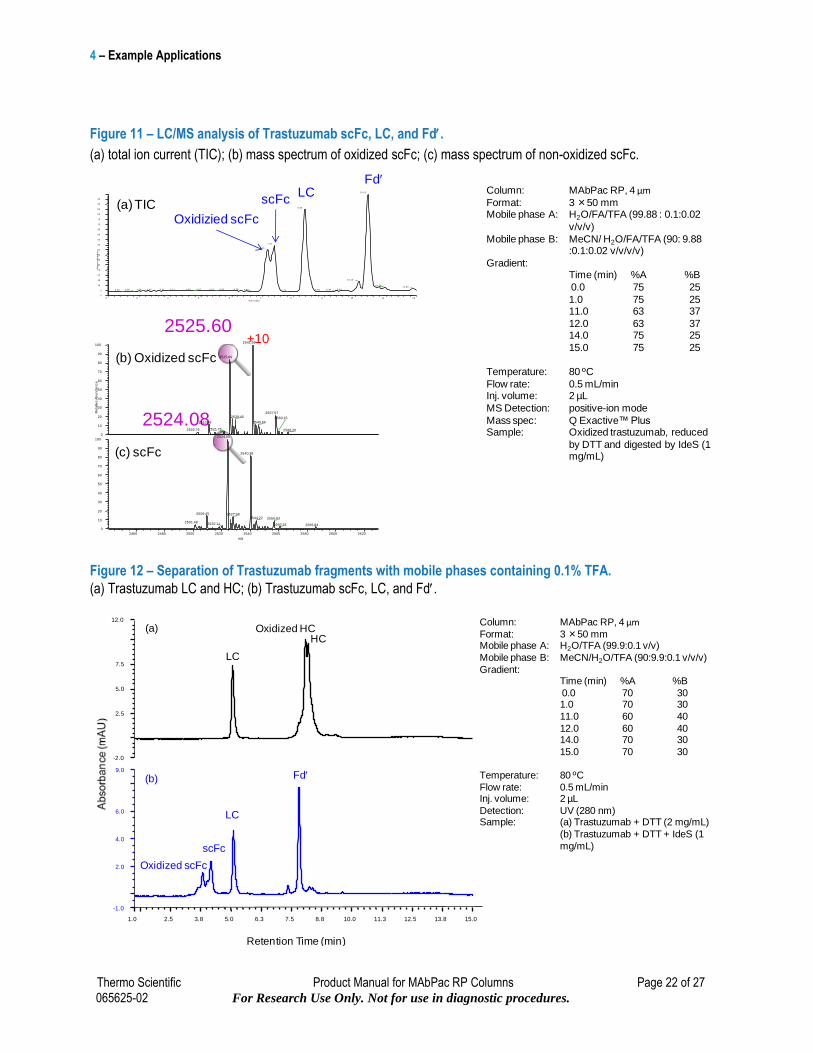
4.5 LC/MS analysis of oxidized mAb
Methionine (Met) oxidation is one of the critical quality attributes required to be closely monitored. The two Met
residues in the CH2-CH3 domain interface of recombinant humanized and fully human IgG1 antibodies were found
susceptible to oxidation. It is desirable to monitor the progress of the Met oxidation without complete digestion of mAb.
A workflow was designed to first reduce mAb and then further digest it with IdeS resulting in smaller (25 kDa)
fragments (Figure 9). Figure 10a shows that oxidized HC and non-oxidized HC can be barely separated
chromatographically, with 0.02% TFA in the mobile phase. However, the high resolution orbitrap instrument can
clearly resolve the oxidized (Figure 10b) and non-oxidized HC (Figure 10c) at m/z 1633.54 and 1633.06 respectively.
Further digestion of the HC by IdeS resulted in two smaller fragments: scFc and Fd. Figure 11a shows the baseline
separation of scFc, LC, and Fd. In addition, oxidized and non-oxidized scFc fragments are better separated than the
oxidized and non-oxidized HC. The +10 charge state of the oxidized scFc and non-oxidized scFc are shown in Figure
11b (at m/z 2525.60) and in Figure 11c (at m/z 2524.08). Separation of these oxidized and non-oxidized fragments can
be improved by increasing the mobile phase TFA concentration from 0.02% to 0.1% (Figure 12).
Figure 9 – mAb reduction and IdeS digestion flowchart.

4 – Example Applications
Thermo Scientific Product Manual for MAbPac RP Columns Page 21 of 27 065625-02 For Research Use Only. Not for use in diagnostic procedures.
Figure 10 – LC/MS analysis of Trastuzumab LC and HC. (a) total ion current (TIC); (b) mass spectrum of oxidized HC; (c) mass spectrum of non-oxidized HC.
Column: MAbPac RP, 4 µmFormat: 3 ×50 mmMobile phase A: H2O/FA/TFA (99.88:0.1:0.02
v/v/v)
Mobile phase B: MeCN/ H2O/FA/TFA (90:9.88 :0.1:0.02 v/v/v/v)
Gradient:Time (min) %A %B
0.0 75 25
1.0 75 2511.0 63 37
12.0 63 3714.0 75 25
15.0 75 25
Temperature: 80 ºC
Flow rate: 0.5 mL/minInj. volume: 2 µL
MS Detection: positive-ion mode
Mass spec: Q Exactive™ PlusSample: oxidized trastuzumab, reduced
by DTT (2 mg/mL)
(a) TIC
(b) Oxidized HC
(c) HC
LCoxidized HC
HC
+31
RT: 2.00 - 12.00
2 3 4 5 6 7 8 9 10 11 12
Time (min)
0
5
10
15
20
25
30
35
40
45
50
55
60
65
70
75
80
85
90
95
100
Rela
tive A
bundance
8.33
10.2710.21
10.78 11.445.134.93 5.493.873.37 4.07 5.69 8.936.09 6.393.02 6.75 7.15 7.352.81 9.537.702.51
1605 1610 1615 1620 1625 1630 1635 1640 1645 1650 1655 1660 1665
m/z
0
10
20
30
40
50
60
70
80
90
100
0
10
20
30
40
50
60
70
80
90
100
Re
lativ
e A
bu
nd
an
ce
1638.76
1633.54
1644.001628.94
1636.88 1640.111632.23
1649.171652.801626.281612.881610.041605.43 1660.831617.35 1665.641622.36
1633.05
1638.26
1643.51
1631.541636.69
1639.651610.59 1614.85 1625.56 1653.751647.531607.87 1622.58 1657.35 1664.30
4 – Example Applications
Thermo Scientific Product Manual for MAbPac RP Columns Page 22 of 27 065625-02 For Research Use Only. Not for use in diagnostic procedures.
Figure 11 – LC/MS analysis of Trastuzumab scFc, LC, and Fd.
(a) total ion current (TIC); (b) mass spectrum of oxidized scFc; (c) mass spectrum of non-oxidized scFc.
Figure 12 – Separation of Trastuzumab fragments with mobile phases containing 0.1% TFA.
(a) Trastuzumab LC and HC; (b) Trastuzumab scFc, LC, and Fd.
Column: MAbPac RP, 4 µmFormat: 3 ×50 mmMobile phase A: H2O/FA/TFA (99.88 : 0.1:0.02
v/v/v)
Mobile phase B: MeCN/ H2O/FA/TFA (90: 9.88 :0.1:0.02 v/v/v/v)
Gradient:Time (min) %A %B
0.0 75 25
1.0 75 2511.0 63 37
12.0 63 3714.0 75 25
15.0 75 25
Temperature: 80 ºC
Flow rate: 0.5 mL/minInj. volume: 2 µL
MS Detection: positive-ion mode
Mass spec: Q Exactive™ PlusSample: Oxidized trastuzumab, reduced
by DTT and digested by IdeS (1 mg/mL)
(a) TIC
(b) Oxidized scFc
(c) scFc
LCFd
Oxidizied scFc
scFc
+102525.60
2524.08
2 3 4 5 6 7 8 9 10 11 12
Tim e (m in)
0
5
10
15
20
25
30
35
40
45
50
55
60
65
70
75
80
85
90
95
Re
lati
ve
Ab
unda
nce
10 .42
8.35
7.37
7.16
10.10
10.7911.90
5.074.87 6.285.825.524.213.91 9.633.45 6.483.25 9.388.922.852.50 7.79
2460 2480 2500 2520 2540 2560 2580 2600 2620
m/z
0
10
20
30
40
50
60
70
80
90
100
0
10
20
30
40
50
60
70
80
90
100
Re
lativ
e A
bu
nd
an
ce
2541.99
2525.60
2557.972529.45
2510.98 2545.66
2560.15
2521.752502.76 2566.26
2524.08
2540.38
2509.45 2527.982544.22 2556.93
2501.48 2520.11 2560.78 2585.84
-2.0
2.5
5.0
7.5
12.0
1.0 2.5 3.8 5.0 6.3 7.5 8.8 10.0 11.3 12.5 13.8 15.0
-1.0
2.0
4.0
6.0
9.0
Retention Time (min)
Column: MAbPac RP, 4 µmFormat: 3 ×50 mmMobile phase A: H2O/TFA (99.9:0.1 v/v)
Mobile phase B: MeCN/H2O/TFA (90:9.9:0.1 v/v/v)
Gradient:Time (min) %A %B
0.0 70 301.0 70 30
11.0 60 40
12.0 60 4014.0 70 30
15.0 70 30
Temperature: 80 ºC
Flow rate: 0.5 mL/minInj. volume: 2 µL
Detection: UV (280 nm)Sample: (a) Trastuzumab + DTT (2 mg/mL)
(b) Trastuzumab + DTT + IdeS (1
mg/mL)
LC
scFc
LC
HC
Oxidized scFc
Fd
Oxidized HC(a)
(b)

4 – Example Applications
Thermo Scientific Product Manual for MAbPac RP Columns Page 23 of 27 065625-02 For Research Use Only. Not for use in diagnostic procedures.
4.6 Analysis of Antibody-Drug Conjugate (ADC)
Antibody-drug conjugates have proved to be a very effective cancer therapy. Due to the heterogeneous nature of the
ADC, it is critical to characterize its multiple Drug-to-Antibody Ratio (DAR) forms. The MAbPac RP column can be
utilized in the separation of mAb and its conjugates. In Figure 13, ADCs were prepared by enzymatically activating
mAb Fc domain glycans with azides using the mutant beta-galactosyltransferase enzyme. The azide-activated
antibodies were then conjugated with dibenzocyclooctyne6 (DIBO) -activated Val-Cit-PAB-Monomethyl Auristatin E
(MMAE) toxin in a copperless click reaction, resulting in a mixture of drug-loaded antibody species with 0 to 4 MMAE
molecules. The unmodified mAb and ADCs with DAR values ranging from 0 to 4 are well resolved on the MAbPac
RP column (Figure 14).
Figure 13 – Site-selective antibody-drug conjugates (ADCs)
Figure 14 – Site-selective antibody-drug conjugates (ADCs)
DIBO-MMAE
25 C, ON
Add in
GalT(Y289L)
UDP-GalNAzβ-1,4-Galactosidase
37 C, 5 hr
Azide-Activated Ab
(stable for long-term storage)
Antibody drug conjugate (ADC)Unlabeled Ab Cleave Terminal Gal
37 C, ON
N3
N3
N3
N3
MMAE
MMAE
MMAE
MMAE
Column: MAbPac RP, 4 µm
Format: 2.1 ×50 mm
Mobile phase A: H2O/TFA (99.9 : 0.1 v/v)
Mobile phase B: MeCN/ H2O/TFA (90: 9.9 :0.1
v/v/v)
Gradient:
Time (min) %A %B
0.0 65 35
0.5 65 35
4.5 45 55
5.0 45 55
5.5 65 35
6.0 65 35
Flow rate: 0.6 mL/min
Temperature: 80 ºC
Inj. volume: 2 µL
Detection: UV (280 nm)
Sample: Trastuzumab-MMAE
1.00 1.50 2.00 2.50 3.00 3.50 4.00
-5.0
0.0
5.0
10.0
15.0
20.0
25.0
Retention Time (min)

4 – Example Applications
Thermo Scientific Product Manual for MAbPac RP Columns Page 24 of 27 065625-02 For Research Use Only. Not for use in diagnostic procedures.
4.7 Top-down LC/MS/MS Analysis of Intact Protein Mix
ThermoFisher Pierce Intact Protein Mix consists of six recombinant proteins: IGF-I LR3 (9 kDa), Thioredoxin (12
kDa), Protein G (21 kDa), Carbonic Anhydrase II (29 kDa), Protein AF (51 kDa), and Exo Klenow (68 kDa). These
proteins are selected to satisfy the following criteria: 1) evenly covering a MW range of 10kD – 66kD, 2) presenting
mostly clean, modification and adduct-free ESI spectra, and 3) having ESI charge state distributions covered a wide
m/z range from 500-2,000. 1 mm ID MAbPac RP column is chosen to analyze these proteins because it provides
higher sensitivity. Figure 15 shows baseline separation of all six protein using an acetonitrile/H2O/formic acid
mobile phase. Top-down MS/MS spectra were acquired using Top 3-5 DDA methods. OT MS1 data was acquired at
resolution settings of 15 at m/z 200 and OTMS2 at a resolution of 120K at m/z 200. Top panel shows deconvolution
results from Protein Deconvolution 4.0 software and Bottom panel shows top down results from ProSight PD 1.1
node in Proteome Discoverer 2.1 software.
Figure 15 – LC/MS/MS Analysis of Intact Protein Mix
Column: MAbPac RP, 4 µmFormat: 1.0 × 150 mm
Mobile phase A: H2O/FA (99.9 : 0.1 v/v)
Mobile phase B: MeCN/FA (99.0: 0.1 v/v)
Gradient:
Time (min) %A %B
0.0 90 10
1.0 80 20
15.0 55 45
16.0 10 90
20.0 10 90
20.1 90 10
25.0 90 10
Temperature: 60 ºC
Flow rate: 0.1 mL/min
Inj. volume: 1 µL
MS Detection: positive-ion mode
Mass Spec: Q Exactive™ HF
Sample: Pierce Intact Protein Standard Mix
(500 ng/µL)
1. IGF-I LR3 (9 kDa)
2. Thioredoxin (12 kDa)
3. Protein G (21 kDa)
4. Carbonic Anhydrase II (29 kDa)
5. Protein AF (51 kDa)
6. Exo Klenow (68 kDa)6 8 10 12 14 16 18
Time (min)
0
5
10
15
20
25
30
35
40
45
50
55
60
65
70
75
80
85
90
95
100
Re
lative
Ab
un
da
nce
5
2
1
3
6
4

4 – Example Applications
Thermo Scientific Product Manual for MAbPac RP Columns Page 25 of 27 065625-02 For Research Use Only. Not for use in diagnostic procedures.
Protein G
CA II
Klenow
Protein AG
Thioredoxin
IGF-LR3

5 – Frequently Asked Questions
Thermo Scientific Product Manual for MAbPac RP Columns Page 26 of 27 065625-02 For Research Use Only. Not for use in diagnostic procedures.
5. Frequently Asked Questions
5.1 What factors do I need to consider for developing a high throughput method using MAbPac RP
Flow rate, column operating temperature, and gradient slope should be considered (see section
4.1). MAbPac RP is a polymer column which is stable at extreme high temperature and extreme
pH. If higher flow rate is desired, operating temperature can be increased to decrease the column
back pressure.
5.2 What is the recommended operating temperature for MAbPac RP?
For small proteins such as cytochrome C and lysozyme, 30 °C is sufficient. For large proteins
such as mAb, 70 °C to 80 °C is recommended in order to decrease the strength of secondary
interactions between mAb and the stationary phase and obtain decent peak shape.
5.3 What is the carryover on MAbPac RP?
In general, the carryover is less than 0.7% for mAb. For example, mAb peak area is determined
by injecting 25 µg of mAb onto a 3.0 × 50 mm MAbPac column; the carry over peak area is
determined from the blank run immediately following the mAb injection. The carryover is
calculated using the following equation: Areacarryover/AreamAb x 100%.
mAbs are large and very hydrophobic biomolecules. In order to achieve low carryover for mAb
analysis, such as less than 1%, the pore size of the column should be larger than the conventional
RP column and the stationary phase is optimized. MAbPac RP column is designed for low
carryover and high resolution mAb analysis.
5.4 What is the recommended maximum flow rate?
At 80 °C, the maximum flow rate for the 1.0 × 50 mm ID column is 0.15 ml/min.
At 80 °C, the maximum flow rate for the 2.1 × 50 mm ID column is 0.6 ml/min.
At 80 °C, the maximum flow rate for the 3.0 × 50 mm ID column is 1 ml/min.
The column pressure should not exceed 4,000 psi in order to avoid compressing the resin bed.
5.5 What is the recommended TFA concentration for protein separation?
0.1% TFA if the column is not coupled to the mass spectrometer and 0.02% for LC/MS
experiment. While trifluoroacetic acid (TFA) as ion-pairing reagent provides excellent separation
results, TFA can suppress ionization in the LC-MS interface, causing a drop in signal. This can
be mitigated by reducing the TFA concentration to 0.02% and additional use 0.1% Formic acid
(FA).
5.6 How to mitigate carryover issue?
The system may not be clean or previous sample may not have completely eluted from the column.
Wash the system and the column with high organic eluent, such as 90% acetonitrile. If needed,
100 mM NaOH can be added to the high organic wash. In addition, a blank can be added in
between samples.

5 – Frequently Asked Questions
Thermo Scientific Product Manual for MAbPac RP Columns Page 27 of 27 065625-02 For Research Use Only. Not for use in diagnostic procedures.
5.7 How to optimize the HPLC system configuration to achieve the best separation using the 1.0 mm ID MAbPac RP column?
The recommended flow rate for the 1.0 mm ID column is between 75 µL to 150 µL. In order to
avoid excessive gradient delay, the high pressure pump Vanquish Horizon system with the default
35 µl gradient mixer (25 µL capillary mixer + 10 µL static mixer) is recommended. If Vanquish
Horizon system is not available, Vanquish Flex Binary system with 200 µL gradient mixer (50
µL capillary mixer + 150 µL static mixer) will be the alternative choice. In addition, 75 µm I.D.
connection tubing could reduce the system dead volume. Figure 16 shows that excellent
separation of the four protein standards is achieved on a 1 × 100 mm MAbPac RP using a default
configuration of Vanquish™ Horizon UHPLC system. The gradient delayed observed here is ~
2.5 min.
Figure 16 – Separation of intact proteins/mAb using 1 mm ID format column
HPLC: Thermo Scientific™ Vanquish™
Horizon UHPLC system
Column: MAbPac RP, 4 µmFormat: 1.0 × 100 mm
Mobile phase A: H2O/TFA (99.9 : 0.1 v/v)
Mobile phase B: MeCN/ H2O/TFA (90: 9.9 :0.1
v/v/v/)
Gradient:
Time (min) %A %B
0.0 80 20
1.0 80 20
11.0 50 50
13.0 50 50
13.1 80 20
25.0 80 20
Temperature: 80 ºC
Flow rate: 0.1 mL/min
Inj. volume: 0.5 µL
Detection: UV (280 nm)
Sample: 1. Ribonuclease A (0.5 mg/mL)
2. Cytochrome C (0.5 mg/mL)
3. Lysozyme (0.5 mg/mL)
4. mAb (1 mg/mL)
Retention Time (min)
1.0 2.5 5.0 7.5 10.0 12.5 15.0 16.0-20
0
100
120
1
2
3
4