ma, zheng; christensen, kristoffer; jørgensen, bo nørregaard
TRANSCRIPT
University of Southern Denmark
Business ecosystem architecture development
a case study of Electric Vehicle home chargingMa, Zheng; Christensen, Kristoffer; Jørgensen, Bo Nørregaard
Published in:Energy Informatics
DOI:10.1186/s42162-021-00142-y
Publication date:2021
Document version:Final published version
Document license:CC BY
Citation for pulished version (APA):Ma, Z., Christensen, K., & Jørgensen, B. N. (2021). Business ecosystem architecture development: a case studyof Electric Vehicle home charging. Energy Informatics, 4, [9]. https://doi.org/10.1186/s42162-021-00142-y
Go to publication entry in University of Southern Denmark's Research Portal
Terms of useThis work is brought to you by the University of Southern Denmark.Unless otherwise specified it has been shared according to the terms for self-archiving.If no other license is stated, these terms apply:
• You may download this work for personal use only. • You may not further distribute the material or use it for any profit-making activity or commercial gain • You may freely distribute the URL identifying this open access versionIf you believe that this document breaches copyright please contact us providing details and we will investigate your claim.Please direct all enquiries to [email protected]
Download date: 14. Dec. 2021
METHODOLOGY Open Access
Business ecosystem architecturedevelopment: a case study of ElectricVehicle home chargingZheng Ma1* , Kristoffer Christensen2 and Bo Nørregaard Jørgensen2
* Correspondence: [email protected] Health Informatics andTechnology, The Maersk Mc-KinneyMoller Institute, University ofSouthern Denmark, Odense,DenmarkFull list of author information isavailable at the end of the article
Abstract
Due to the complexity of business ecosystems, the architecture of businessecosystems has not been well discussed in the literature, and modeling or simulationof business ecosystems has been rarely focused. Therefore, this paper proposes abusiness ecosystem ontology and introduces a methodology for business ecosystemarchitecture design. The proposed methodology includes five stages: 1) Boundaryidentification of a business ecosystem; 2) Identification of actors and their roles in thebusiness ecosystem; 3) Identification of actors’ value propositions; 4) Identification ofinteraction between actors; 5) Verification of business ecosystem architecture design.This paper uses the Danish electricity system as an example to introduce themethodology, and use Electric Vehicle home charging as a case study todemonstrate the application of the developed methodology. The case studydemonstrates that the proposed methodology is a systematic approach and can beeasily applied to any ecosystem architecture design with the five stages, and thedesigned ecosystem architecture can represent the physical system and business.Several definitions are clarified in the paper, e.g., actor, role, interaction, ecosystemroadmap and expanded/shifted ecosystem, etc. With clear definitions, the proposedmethodology provides a visualized, clear structure of behaviors and specifications fora given business ecosystem.
Keywords: Business ecosystem, Ecosystem architecture, Architecture design,Ontology, EV charging
IntroductionBusiness ecosystem theories have discussed business ecosystem life cycle (Moore 1996),
ecosystem roles (Iansiti and Levien 2004; Levien 2004), S-D (Service-Dominant) logic and
value co-creation (Vargo and Lusch 2016). However, the architecture of the business
ecosystem has not been well discussed in the literature, although the core elements,
actors/roles, and interactions have been mentioned. Meanwhile, the modeling or simula-
tion of business ecosystems has been rarely focused due to the complexity of business
ecosystems (Ma 2019).
No systematic methodology available for the business ecosystem analysis and archi-
tecture design is one of the main challenges to simulate/model a business ecosystem.
© The Author(s). 2021 Open Access This article is licensed under a Creative Commons Attribution 4.0 International License, whichpermits use, sharing, adaptation, distribution and reproduction in any medium or format, as long as you give appropriate credit to theoriginal author(s) and the source, provide a link to the Creative Commons licence, and indicate if changes were made. The images orother third party material in this article are included in the article's Creative Commons licence, unless indicated otherwise in a creditline to the material. If material is not included in the article's Creative Commons licence and your intended use is not permitted bystatutory regulation or exceeds the permitted use, you will need to obtain permission directly from the copyright holder. To view acopy of this licence, visit http://creativecommons.org/licenses/by/4.0/.
Energy InformaticsMa et al. Energy Informatics (2021) 4:9 https://doi.org/10.1186/s42162-021-00142-y
Especially, the majority of the literature is either case-based or has only guidelines with-
out details. Meanwhile, the boundary of a given business ecosystem, the definitions of
actors and their roles, types of interactions, especially the correlations among the above
elements are missing. A business ecosystem ontology can support the business ecosys-
tem architecture investigation, modeling and simulation.
Therefore, this paper aims to follow up the paper ‘Business Ecosystem modeling- The
Hybrid of System Modeling and Ecological Modeling: An application of the smart grid’
(Ma 2019), and introduces ‘Part I- Business ecosystem architecture development’ which
aims to identify a target business ecosystem and its elements (actors, roles, and interac-
tions). A framework for business ecosystem modeling is proposed in (Ma 2019), and
the proposed framework includes three parts and nine stages that combine theories
from system engineering, ecology, and business ecosystem (shown in Table 1).
This paper firstly discusses the related works of business ecosystem architecture. In
the Methodology section, this paper uses the Danish electricity business ecosystem as
an example to introduce the five stages in the proposed methodology. The application
of State-of-the-Art techniques for investigating existing solutions and their business
model is also introduced in the Methodology section; In the Case Study section, a case
study of Electric Vehicle home charging in Denmark is introduced to demonstrate the
application of the methodology. Definitions clarified in the paper and proposed meth-
odology are summarized in the Discussion and Conclusion sections including the paper
contribution and future works.
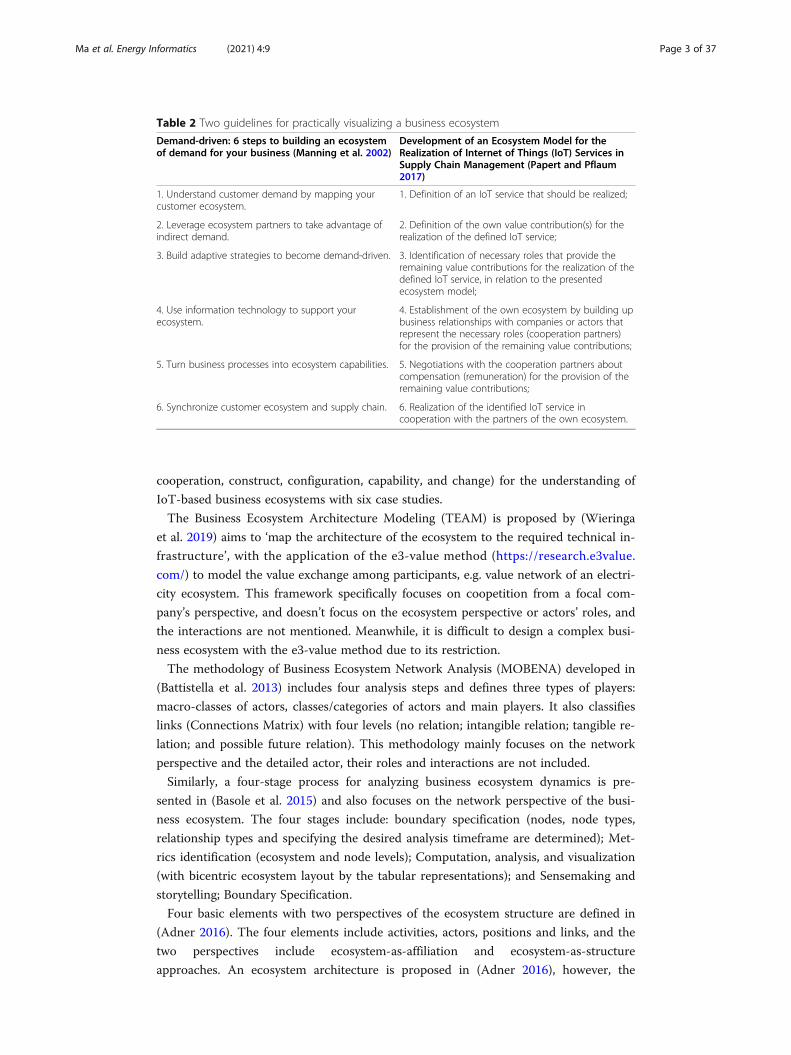
Related work of business ecosystem architectureManning et al. (2002) propose a general 6-step approach for business ecosystem build-
ing. Later, Papert and Pflaum (2017) present a general guideline on ecosystem building
for Internet of Things (IoT) Services in Supply Chain Management. However, the two
guidelines (shown in Table 2) are for practically visualizing a business ecosystem, not
for the business ecosystem architecture development.
Compared to the guidelines proposed by (Manning et al. 2002; Papert and Pflaum
2017), other business ecosystem frameworks focus more on the focal companies’ per-
spective. For instance, Rong et al. (2015) develop a 6C framework (including context,
Table 1 The framework and steps of the business ecosystem modeling (Ma 2019)
Part Stage Business ecosystem modeling
Part IBusiness ecosystemarchitecture development
1 Identify the boundary of a selected ecosystem.
2 Identify actors and their roles in the ecosystem.
3 Identify actors’ value propositions and business models.
4 Identify interaction between actors (different types of interactions)
Part IIFactor analysis
1 Investigate influential factors and their impact on the elements in theecosystem (actors, roles, and interaction)
2 Investigate potential changes in the ecosystem.
Part IIIEcosystem simulation andreconfiguration
1 Multi-agent based ecosystem modeling to identify ecosystem reactiontowards the potential changes.
2 Ecosystem reconfiguration (including reconfiguration of actors, roles,and interaction) due to changes, system dynamics modeling might beapplied at this stage.
3 Business model reconfiguration.
Ma et al. Energy Informatics (2021) 4:9 Page 2 of 37
cooperation, construct, configuration, capability, and change) for the understanding of
IoT-based business ecosystems with six case studies.
The Business Ecosystem Architecture Modeling (TEAM) is proposed by (Wieringa
et al. 2019) aims to ‘map the architecture of the ecosystem to the required technical in-
frastructure’, with the application of the e3-value method (https://research.e3value.
com/) to model the value exchange among participants, e.g. value network of an electri-
city ecosystem. This framework specifically focuses on coopetition from a focal com-
pany’s perspective, and doesn’t focus on the ecosystem perspective or actors’ roles, and
the interactions are not mentioned. Meanwhile, it is difficult to design a complex busi-
ness ecosystem with the e3-value method due to its restriction.
The methodology of Business Ecosystem Network Analysis (MOBENA) developed in
(Battistella et al. 2013) includes four analysis steps and defines three types of players:
macro-classes of actors, classes/categories of actors and main players. It also classifies
links (Connections Matrix) with four levels (no relation; intangible relation; tangible re-
lation; and possible future relation). This methodology mainly focuses on the network
perspective and the detailed actor, their roles and interactions are not included.
Similarly, a four-stage process for analyzing business ecosystem dynamics is pre-
sented in (Basole et al. 2015) and also focuses on the network perspective of the busi-
ness ecosystem. The four stages include: boundary specification (nodes, node types,
relationship types and specifying the desired analysis timeframe are determined); Met-
rics identification (ecosystem and node levels); Computation, analysis, and visualization
(with bicentric ecosystem layout by the tabular representations); and Sensemaking and
storytelling; Boundary Specification.
Four basic elements with two perspectives of the ecosystem structure are defined in
(Adner 2016). The four elements include activities, actors, positions and links, and the
two perspectives include ecosystem-as-affiliation and ecosystem-as-structure
approaches. An ecosystem architecture is proposed in (Adner 2016), however, the
Table 2 Two guidelines for practically visualizing a business ecosystem
Demand-driven: 6 steps to building an ecosystemof demand for your business (Manning et al. 2002)
Development of an Ecosystem Model for theRealization of Internet of Things (IoT) Services inSupply Chain Management (Papert and Pflaum2017)
1. Understand customer demand by mapping yourcustomer ecosystem.
1. Definition of an IoT service that should be realized;
2. Leverage ecosystem partners to take advantage ofindirect demand.
2. Definition of the own value contribution(s) for therealization of the defined IoT service;
3. Build adaptive strategies to become demand-driven. 3. Identification of necessary roles that provide theremaining value contributions for the realization of thedefined IoT service, in relation to the presentedecosystem model;
4. Use information technology to support yourecosystem.
4. Establishment of the own ecosystem by building upbusiness relationships with companies or actors thatrepresent the necessary roles (cooperation partners)for the provision of the remaining value contributions;
5. Turn business processes into ecosystem capabilities. 5. Negotiations with the cooperation partners aboutcompensation (remuneration) for the provision of theremaining value contributions;
6. Synchronize customer ecosystem and supply chain. 6. Realization of the identified IoT service incooperation with the partners of the own ecosystem.
Ma et al. Energy Informatics (2021) 4:9 Page 3 of 37
ecosystem architecture is a blueprint of a software system, not an architecture overview
of a business ecosystem.
Similarly, a decentralized business ecosystem model is discussed by (Radonjic-Simic
and Pfisterer 2019) from the perspective of complex products and the four elements of
activities, actors, positions, and links. However, it is difficult to follow the methods pro-
vided by (Adner 2016; Radonjic-Simic and Pfisterer 2019) due to the missing correl-
ation among elements, although elements and some sub-elements (e.g three types of
activities and six types of roles for actors) are introduced and defined in the ecosystem
structure.
‘Links’ are described as ‘specify transfers across actors’, and ‘need not have any direct
connection to the focal actor’ in (Adner 2016). Comparatively, ‘links’ are described as
‘how actors need to interact with each other’ in (Radonjic-Simic and Pfisterer 2019).
However, both descriptions do not include a detailed explanation of the interaction
types and contents. Some literature has used value flows to describe the interaction be-
tween actors, e.g. four types of flows (value flow, fund flow, logistics, and cooperation)
are stated in (Zhang et al. 2016), but without description.
A business ecosystem modeling with the combination of natural ecosystems and
multi-agent systems is proposed by (Marín et al. 2007). However, only two types of
agents (supplier and customer) are proposed which can not provide a holistic under-
standing of the business ecosystem architecture. Similar to (Marín et al. 2007), a service
ecosystem (consumers, service provider, and competition) with a multi-agent system is
investigated in (Tian et al. 2008). Although the interactions among entities are intro-
duced in (Tian et al. 2008), the detailed discussion on the roles’ interactions is missing.
Overall, the business ecosystem structure and analysis have been discussed in the lit-
erature, but no systematic approach has been proposed. A systematic approach should
not only provide a guideline or visualization with specific aspects, but also be used for
further ecosystem analysis and preparation of simulation and modeling. Meanwhile,
although the fundamental elements of business ecosystems have been discussed in the
literature, a clarification is missing, especially the correlation between elements, e.g.
actors and roles, types of value flows, etc.
Methodology of business ecosystem architecture developmentThe proposed methodology of business ecosystem architecture includes five stages and
three State-of-the-Art techniques are recommended to be applied at the early stages.
Stage 1- Boundary identification of a business ecosystem
Based on the business ecosystem definition, it is important to define the ‘area/a com-
munity’ at the beginning of the business ecosystem architecture design. An ecosystem
boundary is necessary to be precisely described since the related stakeholders, their in-
teractions may be different for different purposes. For example, energy flexibility and
demand response are popularly discussed in the energy field. Many countries and asso-
ciations have announced initiatives, policies, and regulations, e.g., aggregation market,
tariffs for the distributed energy resources, etc. to support the execution. However,
energy flexibility and demand response have two different definitions. For instance,
Demand response is defined by the European Commission as “voluntary changes by
Ma et al. Energy Informatics (2021) 4:9 Page 4 of 37
end-consumers of their usual electricity use patterns—in response to market signals”
(Laursen 2017). Energy flexibility in the smart grid can happen among the whole elec-
tricity system, e.g. flexibility from the production, from the market (e.g. regulating
market), from the grid (large scale battery), and from the consumption side. Therefore,
the ecosystem boundary should be defined according to the focuses.
The boundary of a selected business ecosystem can be defined with two dimensions:
� Targeted domain: is defined by the primary supply chain, main business, and
related markets. It aims to identify ‘what’ and ‘who’ of the business ecosystem. E.g.,
the electricity grid and district heating network are two different targeted domains,
the business and stakeholders are different (Ma et al. 2020).
� Cultural/geographic boundary: aims to identify ‘where’ and ‘how’ of the ecosystem.
E.g. the Danish electricity grid complies with Danish regulation.
Three elements are introduced at Stage 1 for the understanding of a selected business
ecosystem:
� Primary supply chain
� Main business
� Markets
According to the Cambridge dictionary, the definition of the value chain is: ‘the series
of companies involved in the different stages of producing a product or service that is
sold to consumers, with each stage adding to its value’ and the definition of ‘supply
chain’ is: ‘the system of people and organizations that are involved in getting a product
from the place where it is made to customers’. Meanwhile, the definitions of ‘value’ or
‘value-added’ in the dictionary are not clear compared to ‘supply’. However, business
ecosystem modeling sometimes only focuses on the in-house process, e.g. energy flexi-
bility in commercial greenhouses (Ma et al. 2018) or buildings (Ma et al. 2017a). There-
fore, this paper recommends using ‘supply chain’ instead of ‘value chain’ due to the
clear definition of the stakeholders’ roles and relations, although supply chain mainly
refers to the chain from the production to the end-users according to the definition.
Meanwhile, the supply chain in the business ecosystem modeling should represent ei-
ther a production process or a whole supply chain based on individual situations.
Quite often a selected business ecosystem includes several supply chains from a do-
main perspective, e.g., the sector coupling. Therefore, it is important to identify the pri-
mary supply chain in the selected business ecosystem. For instance, the business
ecosystem of electric vehicle-to-grid includes two supply chains: the supply chain of
electric vehicles and the supply chain of electricity. Therefore, it is important to identify
the main supply chain and the secondary supply chain at this stage based on the fo-
cuses in different cases.
Supply chains only provide a linear illustration of how a product/service is supplied,
the trading or financial aspect is missing. Therefore, the main business and markets are
essential to be considered for a holistic understanding of a business ecosystem. For in-
stance, in an unbundled electricity business ecosystem, e.g. the Nordic electricity busi-
ness ecosystem, all trading goes through markets, e.g. the wholesale market, the
Ma et al. Energy Informatics (2021) 4:9 Page 5 of 37
regulating markets, and the retail markets (Ma et al. 2016). Many stakeholders in this
business ecosystem are not shown in the supply chain and only can be illustrated from
the market perspective. For example, the electricity suppliers are the retailers that sell
electricity to consumers, however, it is the distribution system operators that deliver
electricity to consumers.
� Example of the Danish electricity system
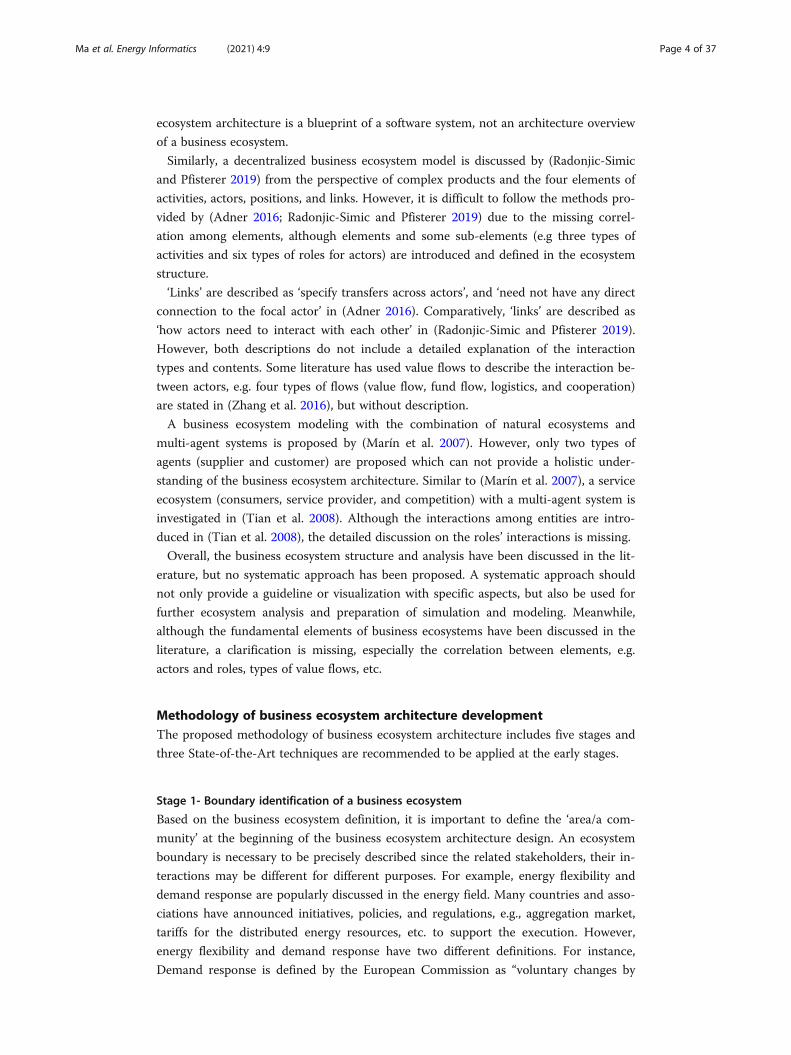
The overall supply chain of the Danish electricity system is outlined in Fig. 1 which
shows the electricity supply chain from the extraction of fuels to the end-use of electri-
city, consisting of electricity generation, transmission, distribution, and consumption.
In the past, many EU countries had a boundling market regulation that allowed utilities
to own all parts of the electricity supply chain, from the production, transmission, dis-
tribution to retail (Mlecnik et al. 2019). Today, the electricity sector in Denmark is lib-
eralized as under the EU regulation, and there is an unbundling between natural
monopolies (transmission and distribution network) and entities that are subject to the
competition (electricity production and trade) (European Comission 2012). The trans-
mission grids operate at 400 kV and 150/132 kV (150 and 132 kV is for DK-West and
DK-East, respectively), and are owned and operated by the Danish Transmission Sys-
tem Operator (TSO)- Energinet. The distribution grids operate at 60/50, 10, and 0.4 kV
are operated by the Distribution System Operators (DSOs).
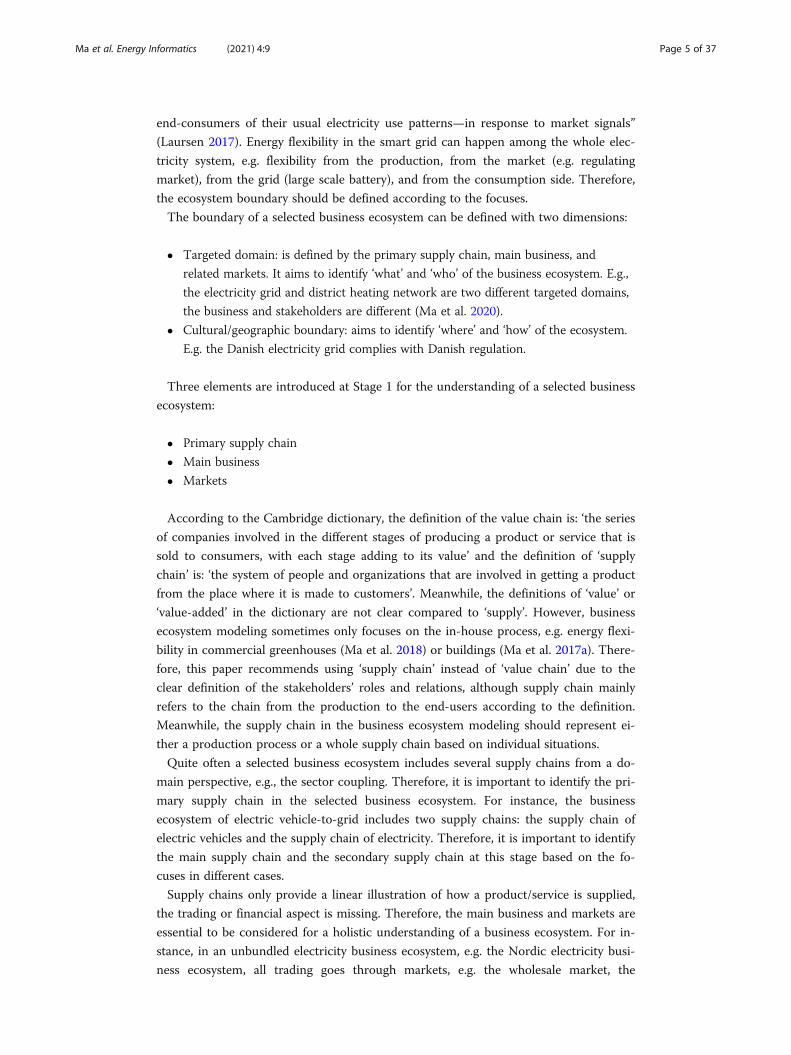
The market framework consists of electricity trading which includes different electri-
city markets, market players, and market regulations. The Danish electricity market is
comprised of a wholesale market and a retail market. The Danish wholesale market is
an integral part of the free Nordic electricity market (shown in Fig. 2). Both Danish and
EU authorities have supported liberalization to stimulate free competition in electricity
production and trade. The wholesale market trades via the Nord Pool spot market,
which facilitates trade between producers and traders (Energinet 2019a).
Stage 2- Identification of actors and their roles in the business ecosystem
Stakeholders in the business ecosystem have been discussed since the introduction of
the business ecosystem. The majority of the literature regarding stakeholders in the
business ecosystem has focused on the types of ecosystem roles, e.g. dominator, key-
stone, and niche firms (Levien 2004). However, approaches for identifying stakeholders
and their roles are rarely discussed.
Meanwhile, it is necessary to give clear definitions of ‘stakeholder’, ‘actor’, and ‘role’,
as each field, e.g., business ecosystem, system architecture, or ecology has its way to use
these terms as discussed in (Ma 2019). For clarification, this paper defines the related
terms as:
Fig. 1 The electricity supply chain
Ma et al. Energy Informatics (2021) 4:9 Page 6 of 37
� Stakeholder: any individual, company, organization, agency, or institution who has
an interest in or influence the business ecosystem, e.g., regulatory authorities.
� Actor: type of stakeholders who directly participate in the ecosystem’s value
creation process, e.g., consumers.
� Role: actor’s responsibility in the business ecosystem, e.g., transport electricity in
distribution grids.
According to these definitions, this paper uses the term ‘actor’ instead of ‘stakeholder’ in
the business ecosystem architecture design, and each actor can have multiple roles (1:n). In
some cases, one role can be assigned to multiple actors, but it rarely happens. The relation
between role and actor is defined similarly to the definition in the SGAM framework
(CEN-CENELEC-ETSI Smart Grid Coordination Group 2014), but differently from the
Harmonized electricity market role model (ENTSO-E 2018), because the definitions of ac-
tors and roles in (Smart Grid Coordination Group 2014) can better represent the relations
between actors and roles in a smart grid.
This paper recommends using: a) primary supply chain, b) main business and c) mar-
kets that are identified in Stage 1 to identify roles and their correlated actors in a busi-
ness ecosystem (e.g. shown in Tables 3 and 4). If it is necessary, the actors and their
roles involved in the secondary supply chain should be considered.
It is easier to identify roles first rather than actors because there are legal require-
ments for the responsibilities in the supply chain and markets that actors need to com-
ply with. Through regulations, roles are assigned to actors. For instance, the
responsibility for transporting electricity in and maintaining the transmission grids is
called TSO, and the required responsibility for the wholesale market operation is the
market operator. However, the actor who conducts both roles is the TSO that is
assigned through the Nordic electricity regulations. An example of the identified main
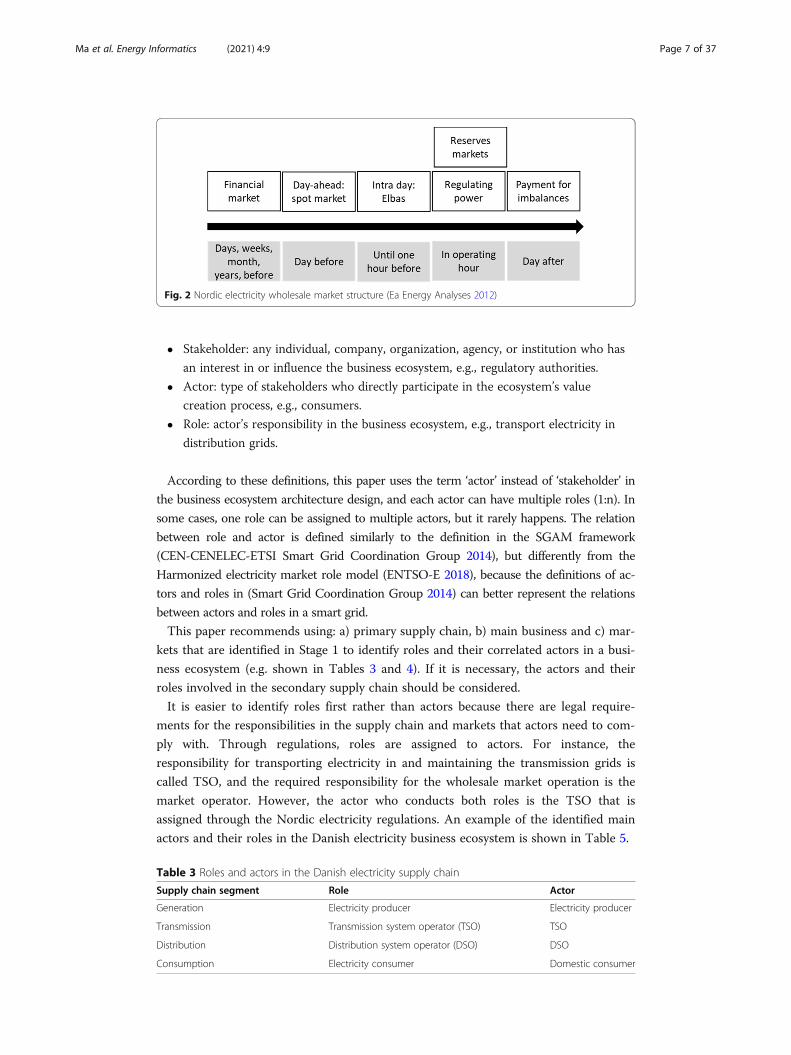
actors and their roles in the Danish electricity business ecosystem is shown in Table 5.
Fig. 2 Nordic electricity wholesale market structure (Ea Energy Analyses 2012)
Table 3 Roles and actors in the Danish electricity supply chain
Supply chain segment Role Actor
Generation Electricity producer Electricity producer
Transmission Transmission system operator (TSO) TSO
Distribution Distribution system operator (DSO) DSO
Consumption Electricity consumer Domestic consumer
Ma et al. Energy Informatics (2021) 4:9 Page 7 of 37
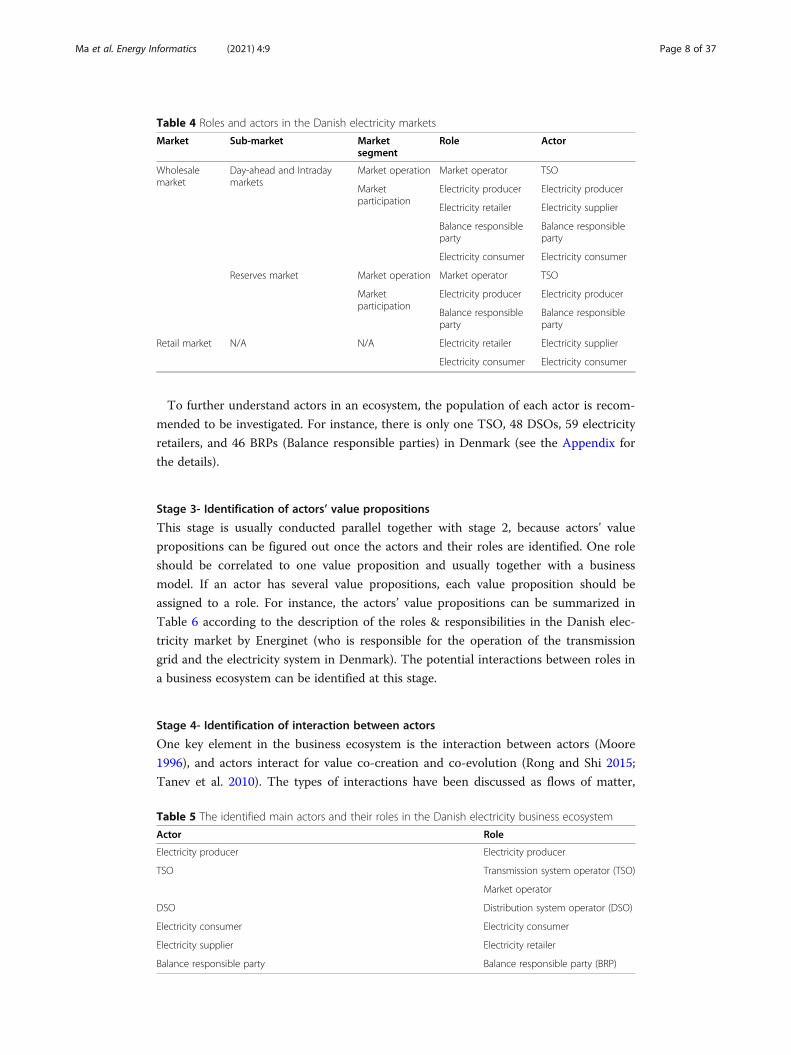
To further understand actors in an ecosystem, the population of each actor is recom-
mended to be investigated. For instance, there is only one TSO, 48 DSOs, 59 electricity
retailers, and 46 BRPs (Balance responsible parties) in Denmark (see the Appendix for
the details).
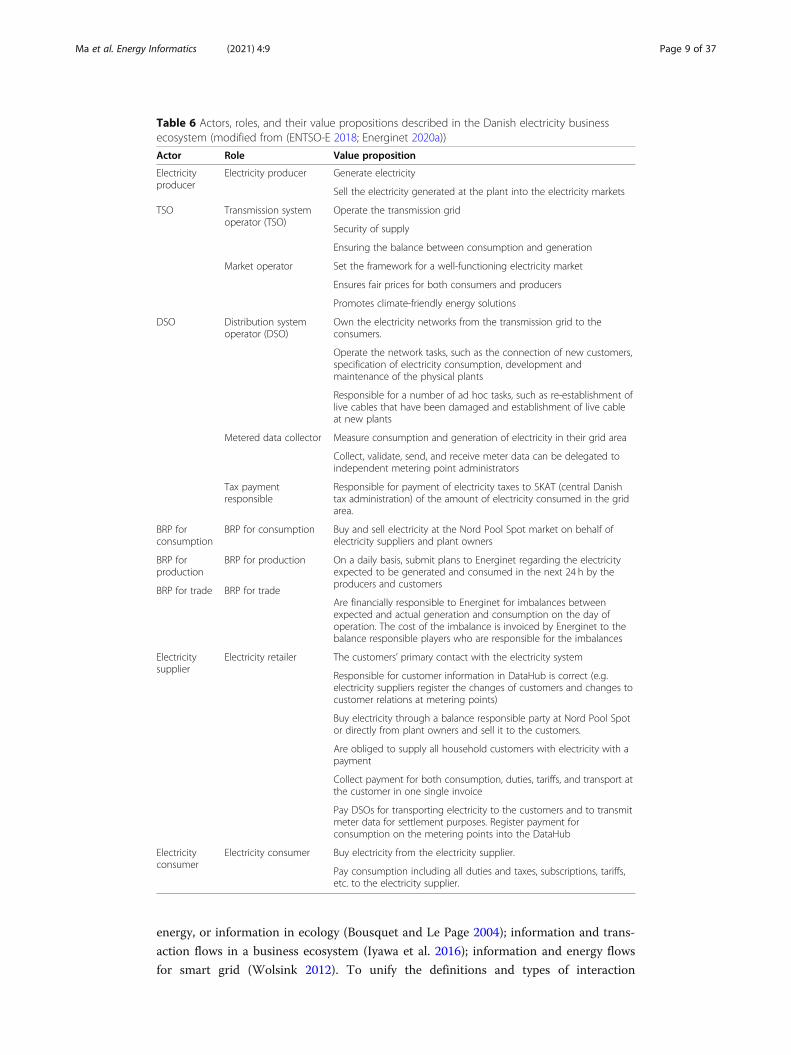
Stage 3- Identification of actors’ value propositions
This stage is usually conducted parallel together with stage 2, because actors’ value
propositions can be figured out once the actors and their roles are identified. One role
should be correlated to one value proposition and usually together with a business
model. If an actor has several value propositions, each value proposition should be
assigned to a role. For instance, the actors’ value propositions can be summarized in
Table 6 according to the description of the roles & responsibilities in the Danish elec-
tricity market by Energinet (who is responsible for the operation of the transmission
grid and the electricity system in Denmark). The potential interactions between roles in
a business ecosystem can be identified at this stage.
Stage 4- Identification of interaction between actors
One key element in the business ecosystem is the interaction between actors (Moore
1996), and actors interact for value co-creation and co-evolution (Rong and Shi 2015;
Tanev et al. 2010). The types of interactions have been discussed as flows of matter,
Table 4 Roles and actors in the Danish electricity markets
Market Sub-market Marketsegment
Role Actor
Wholesalemarket
Day-ahead and Intradaymarkets
Market operation Market operator TSO
Marketparticipation
Electricity producer Electricity producer
Electricity retailer Electricity supplier
Balance responsibleparty
Balance responsibleparty
Electricity consumer Electricity consumer
Reserves market Market operation Market operator TSO
Marketparticipation
Electricity producer Electricity producer
Balance responsibleparty
Balance responsibleparty
Retail market N/A N/A Electricity retailer Electricity supplier
Electricity consumer Electricity consumer
Table 5 The identified main actors and their roles in the Danish electricity business ecosystem
Actor Role
Electricity producer Electricity producer
TSO Transmission system operator (TSO)
Market operator
DSO Distribution system operator (DSO)
Electricity consumer Electricity consumer
Electricity supplier Electricity retailer
Balance responsible party Balance responsible party (BRP)
Ma et al. Energy Informatics (2021) 4:9 Page 8 of 37
energy, or information in ecology (Bousquet and Le Page 2004); information and trans-
action flows in a business ecosystem (Iyawa et al. 2016); information and energy flows
for smart grid (Wolsink 2012). To unify the definitions and types of interaction
Table 6 Actors, roles, and their value propositions described in the Danish electricity businessecosystem (modified from (ENTSO-E 2018; Energinet 2020a))
Actor Role Value proposition
Electricityproducer
Electricity producer Generate electricity
Sell the electricity generated at the plant into the electricity markets
TSO Transmission systemoperator (TSO)
Operate the transmission grid
Security of supply
Ensuring the balance between consumption and generation
Market operator Set the framework for a well-functioning electricity market
Ensures fair prices for both consumers and producers
Promotes climate-friendly energy solutions
DSO Distribution systemoperator (DSO)
Own the electricity networks from the transmission grid to theconsumers.
Operate the network tasks, such as the connection of new customers,specification of electricity consumption, development andmaintenance of the physical plants
Responsible for a number of ad hoc tasks, such as re-establishment oflive cables that have been damaged and establishment of live cableat new plants
Metered data collector Measure consumption and generation of electricity in their grid area
Collect, validate, send, and receive meter data can be delegated toindependent metering point administrators
Tax paymentresponsible
Responsible for payment of electricity taxes to SKAT (central Danishtax administration) of the amount of electricity consumed in the gridarea.
BRP forconsumption
BRP for consumption Buy and sell electricity at the Nord Pool Spot market on behalf ofelectricity suppliers and plant owners
BRP forproduction
BRP for production On a daily basis, submit plans to Energinet regarding the electricityexpected to be generated and consumed in the next 24 h by theproducers and customers
BRP for trade BRP for tradeAre financially responsible to Energinet for imbalances betweenexpected and actual generation and consumption on the day ofoperation. The cost of the imbalance is invoiced by Energinet to thebalance responsible players who are responsible for the imbalances
Electricitysupplier
Electricity retailer The customers’ primary contact with the electricity system
Responsible for customer information in DataHub is correct (e.g.electricity suppliers register the changes of customers and changes tocustomer relations at metering points)
Buy electricity through a balance responsible party at Nord Pool Spotor directly from plant owners and sell it to the customers.
Are obliged to supply all household customers with electricity with apayment
Collect payment for both consumption, duties, tariffs, and transport atthe customer in one single invoice
Pay DSOs for transporting electricity to the customers and to transmitmeter data for settlement purposes. Register payment forconsumption on the metering points into the DataHub
Electricityconsumer
Electricity consumer Buy electricity from the electricity supplier.
Pay consumption including all duties and taxes, subscriptions, tariffs,etc. to the electricity supplier.
Ma et al. Energy Informatics (2021) 4:9 Page 9 of 37
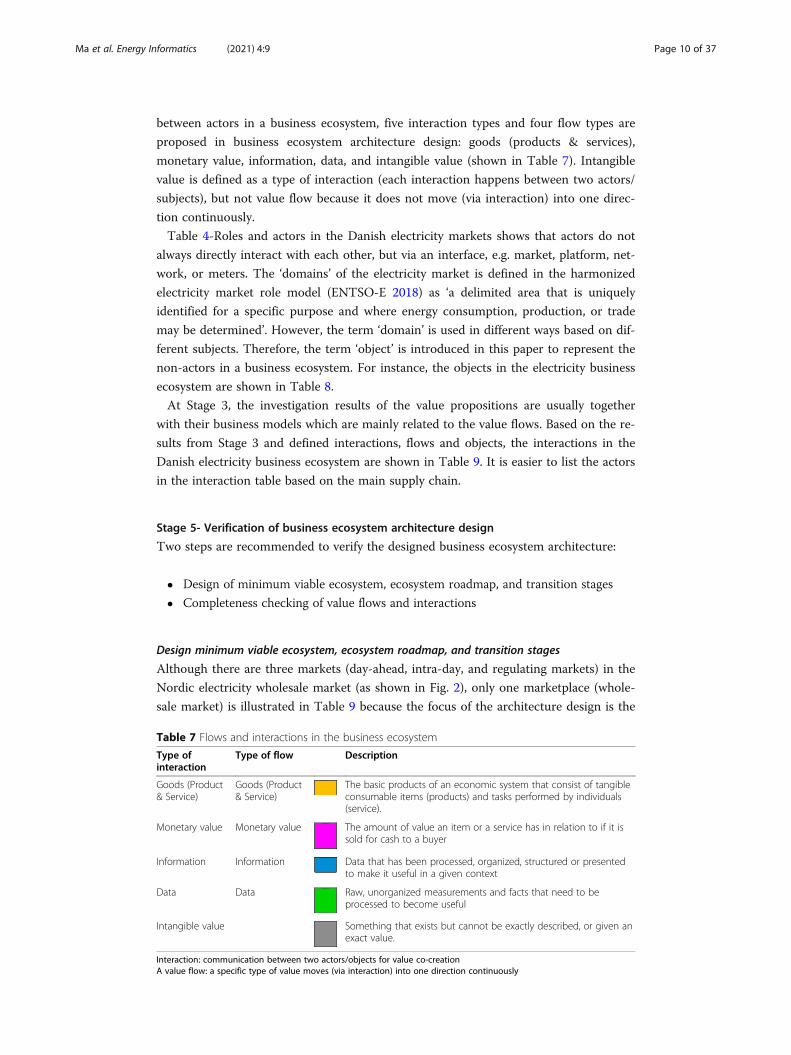
between actors in a business ecosystem, five interaction types and four flow types are
proposed in business ecosystem architecture design: goods (products & services),
monetary value, information, data, and intangible value (shown in Table 7). Intangible
value is defined as a type of interaction (each interaction happens between two actors/
subjects), but not value flow because it does not move (via interaction) into one direc-
tion continuously.
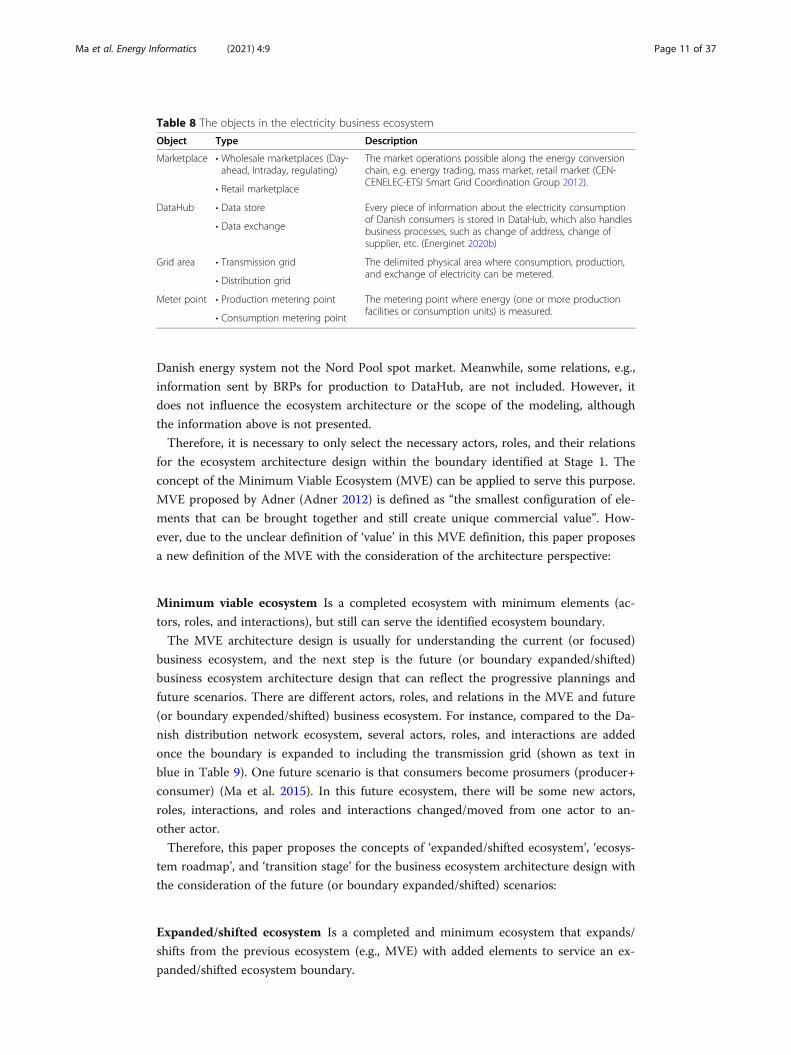
Table 4-Roles and actors in the Danish electricity markets shows that actors do not
always directly interact with each other, but via an interface, e.g. market, platform, net-
work, or meters. The ‘domains’ of the electricity market is defined in the harmonized
electricity market role model (ENTSO-E 2018) as ‘a delimited area that is uniquely
identified for a specific purpose and where energy consumption, production, or trade
may be determined’. However, the term ‘domain’ is used in different ways based on dif-
ferent subjects. Therefore, the term ‘object’ is introduced in this paper to represent the
non-actors in a business ecosystem. For instance, the objects in the electricity business
ecosystem are shown in Table 8.
At Stage 3, the investigation results of the value propositions are usually together
with their business models which are mainly related to the value flows. Based on the re-
sults from Stage 3 and defined interactions, flows and objects, the interactions in the
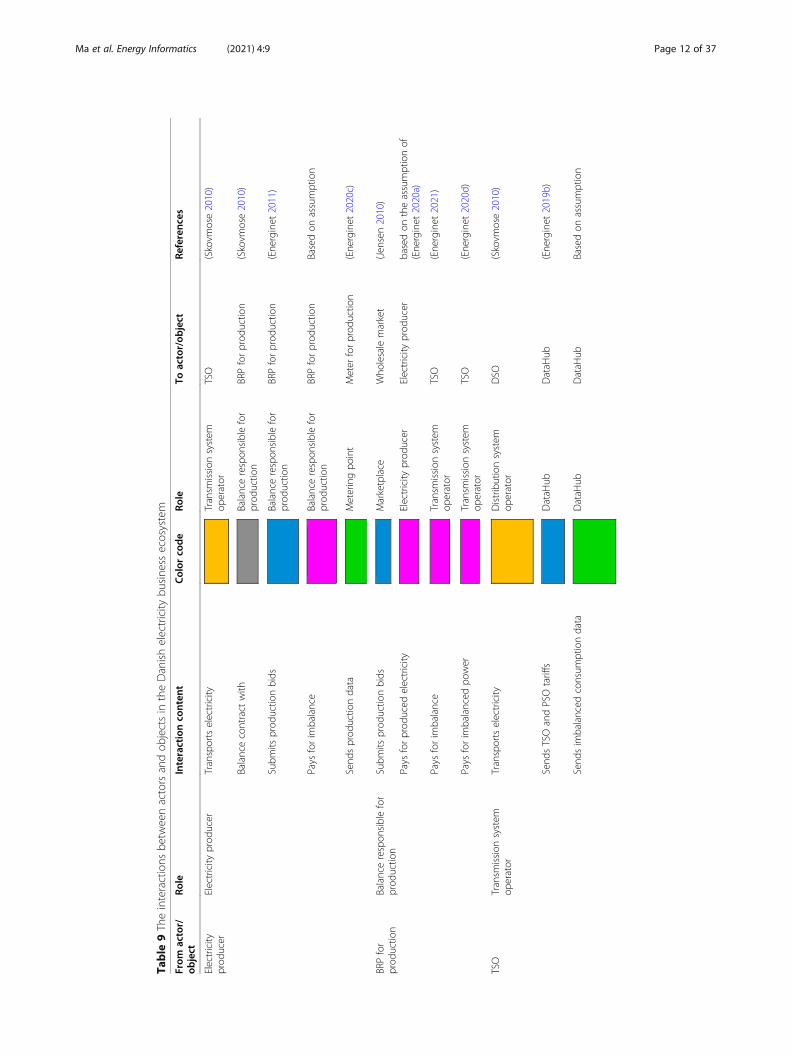
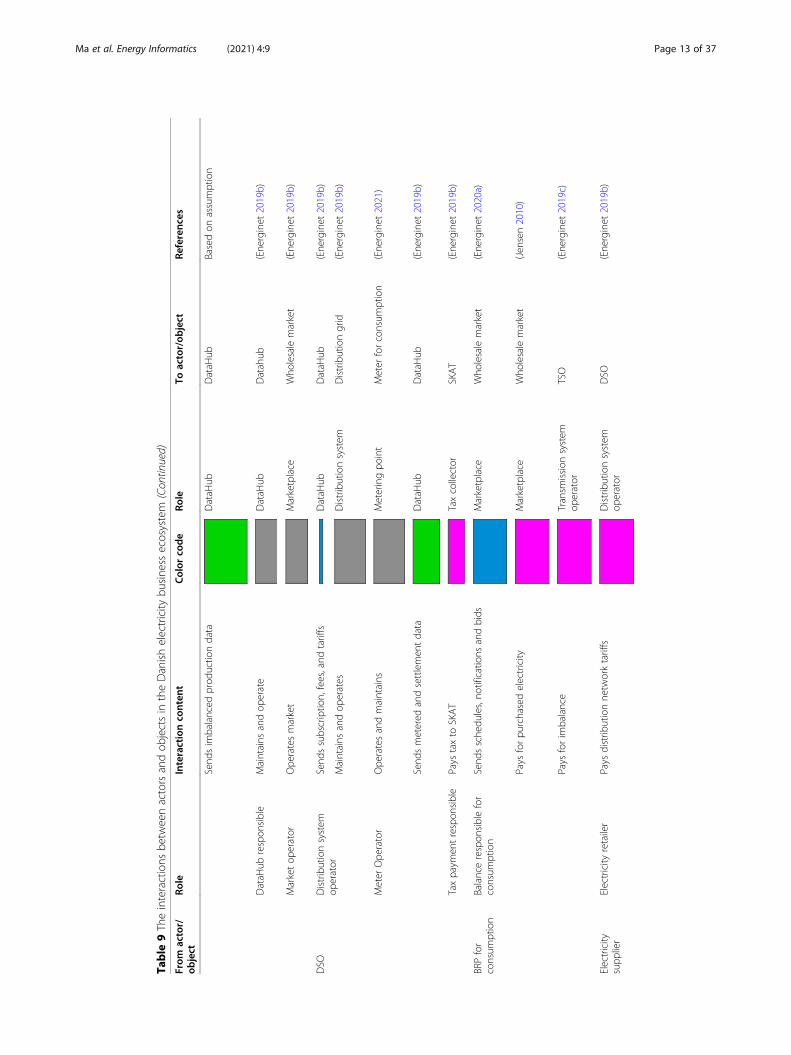
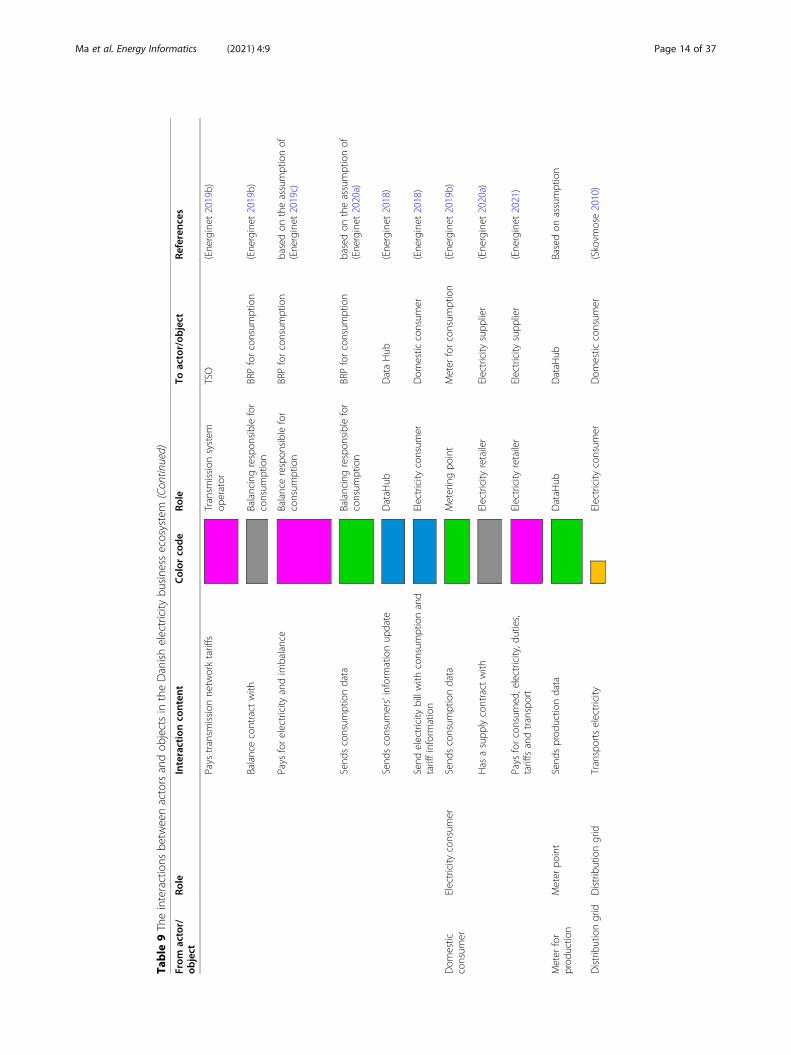
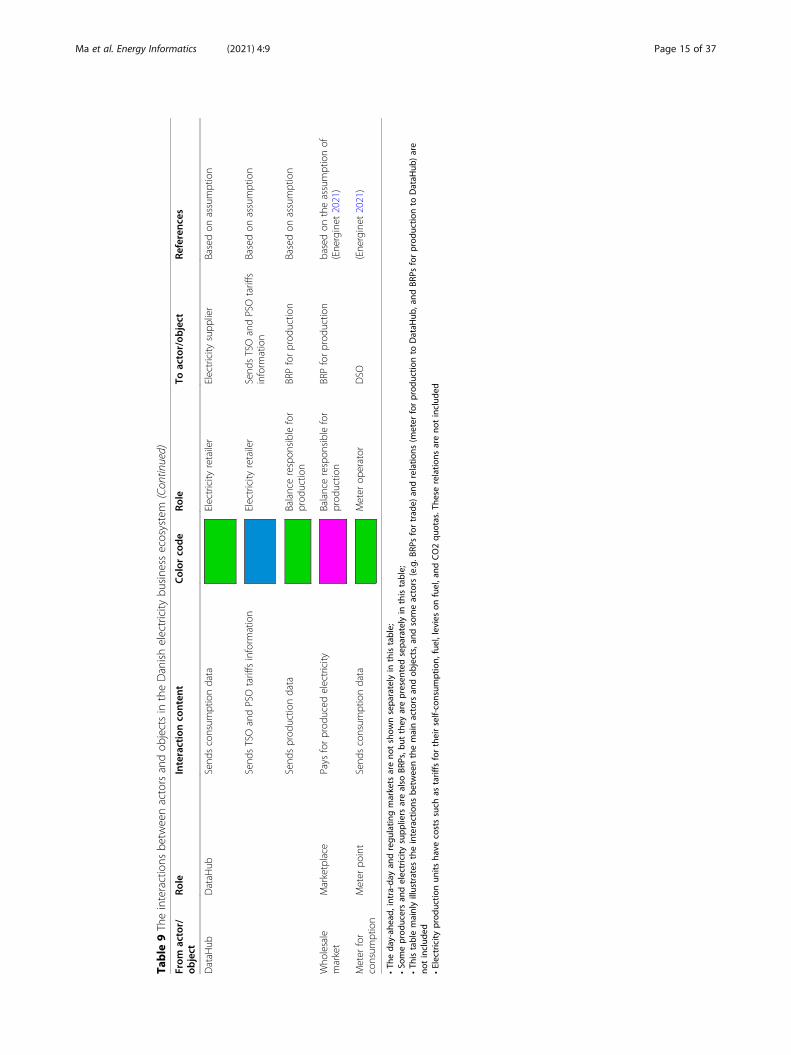
Danish electricity business ecosystem are shown in Table 9. It is easier to list the actors
in the interaction table based on the main supply chain.
Stage 5- Verification of business ecosystem architecture design
Two steps are recommended to verify the designed business ecosystem architecture:
� Design of minimum viable ecosystem, ecosystem roadmap, and transition stages
� Completeness checking of value flows and interactions
Design minimum viable ecosystem, ecosystem roadmap, and transition stages
Although there are three markets (day-ahead, intra-day, and regulating markets) in the
Nordic electricity wholesale market (as shown in Fig. 2), only one marketplace (whole-
sale market) is illustrated in Table 9 because the focus of the architecture design is the
Table 7 Flows and interactions in the business ecosystem
Type ofinteraction
Type of flow Description
Goods (Product& Service)
Goods (Product& Service)
The basic products of an economic system that consist of tangibleconsumable items (products) and tasks performed by individuals(service).
Monetary value Monetary value The amount of value an item or a service has in relation to if it issold for cash to a buyer
Information Information Data that has been processed, organized, structured or presentedto make it useful in a given context
Data Data Raw, unorganized measurements and facts that need to beprocessed to become useful
Intangible value Something that exists but cannot be exactly described, or given anexact value.
Interaction: communication between two actors/objects for value co-creationA value flow: a specific type of value moves (via interaction) into one direction continuously
Ma et al. Energy Informatics (2021) 4:9 Page 10 of 37
Danish energy system not the Nord Pool spot market. Meanwhile, some relations, e.g.,
information sent by BRPs for production to DataHub, are not included. However, it
does not influence the ecosystem architecture or the scope of the modeling, although
the information above is not presented.
Therefore, it is necessary to only select the necessary actors, roles, and their relations
for the ecosystem architecture design within the boundary identified at Stage 1. The
concept of the Minimum Viable Ecosystem (MVE) can be applied to serve this purpose.
MVE proposed by Adner (Adner 2012) is defined as “the smallest configuration of ele-
ments that can be brought together and still create unique commercial value”. How-
ever, due to the unclear definition of ‘value’ in this MVE definition, this paper proposes
a new definition of the MVE with the consideration of the architecture perspective:
Minimum viable ecosystem Is a completed ecosystem with minimum elements (ac-
tors, roles, and interactions), but still can serve the identified ecosystem boundary.
The MVE architecture design is usually for understanding the current (or focused)
business ecosystem, and the next step is the future (or boundary expanded/shifted)
business ecosystem architecture design that can reflect the progressive plannings and
future scenarios. There are different actors, roles, and relations in the MVE and future
(or boundary expended/shifted) business ecosystem. For instance, compared to the Da-
nish distribution network ecosystem, several actors, roles, and interactions are added
once the boundary is expanded to including the transmission grid (shown as text in
blue in Table 9). One future scenario is that consumers become prosumers (producer+
consumer) (Ma et al. 2015). In this future ecosystem, there will be some new actors,
roles, interactions, and roles and interactions changed/moved from one actor to an-
other actor.
Therefore, this paper proposes the concepts of ‘expanded/shifted ecosystem’, ‘ecosys-
tem roadmap’, and ‘transition stage’ for the business ecosystem architecture design with
the consideration of the future (or boundary expanded/shifted) scenarios:
Expanded/shifted ecosystem Is a completed and minimum ecosystem that expands/
shifts from the previous ecosystem (e.g., MVE) with added elements to service an ex-
panded/shifted ecosystem boundary.
Table 8 The objects in the electricity business ecosystem
Object Type Description
Marketplace • Wholesale marketplaces (Day-ahead, Intraday, regulating)
The market operations possible along the energy conversionchain, e.g. energy trading, mass market, retail market (CEN-CENELEC-ETSI Smart Grid Coordination Group 2012).
• Retail marketplace
DataHub • Data store Every piece of information about the electricity consumptionof Danish consumers is stored in DataHub, which also handlesbusiness processes, such as change of address, change ofsupplier, etc. (Energinet 2020b)
• Data exchange
Grid area • Transmission grid The delimited physical area where consumption, production,and exchange of electricity can be metered.
• Distribution grid
Meter point • Production metering point The metering point where energy (one or more productionfacilities or consumption units) is measured.
• Consumption metering point
Ma et al. Energy Informatics (2021) 4:9 Page 11 of 37
Table
9Theinteractions
betw
eenactorsandob
jectsin
theDanishelectricity
busine
ssecosystem
From
actor/
object
Role
Interactionco
nten
tColor
code
Role
Toactor/ob
ject
Referenc
es
Electricity
prod
ucer
Electricity
prod
ucer
Transportselectricity
Transm
ission
system
operator
TSO
(Skovm
ose2010)
Balancecontract
with
Balancerespon
siblefor
prod
uctio
nBRPforprod
uctio
n(Skovm
ose2010)
Subm
itsprod
uctio
nbids
Balancerespon
siblefor
prod
uctio
nBRPforprod
uctio
n(Ene
rginet
2011)
Pays
forim
balance
Balancerespon
siblefor
prod
uctio
nBRPforprod
uctio
nBasedon
assumption
Send
sprod
uctio
ndata
Meteringpo
int
Meter
forprod
uctio
n(Ene
rginet
2020c)
BRPfor
prod
uctio
nBalancerespon
siblefor
prod
uctio
nSubm
itsprod
uctio
nbids
Marketplace
Who
lesalemarket
(Jen
sen2010)
Pays
forprod
uced
electricity
Electricity
prod
ucer
Electricity
prod
ucer
basedon
theassumptionof
(Ene
rginet
2020a)
Pays
forim
balance
Transm
ission
system
operator
TSO
(Ene
rginet
2021)
Pays
forim
balanced
power
Transm
ission
system
operator
TSO
(Ene
rginet
2020d)
TSO
Transm
ission
system
operator
Transportselectricity
Distributionsystem
operator
DSO
(Skovm
ose2010)
Send
sTSOandPSOtariffs
DataH
ubDataH
ub(Ene
rginet
2019b)
Send
sim
balanced
consum
ptiondata
DataH
ubDataH
ubBasedon
assumption
Ma et al. Energy Informatics (2021) 4:9 Page 12 of 37
Table
9Theinteractions
betw
eenactorsandob
jectsin
theDanishelectricity
busine
ssecosystem
(Con
tinued)
From
actor/
object
Role
Interactionco
nten
tColor
code
Role
Toactor/ob
ject
Referenc
es
Send
sim
balanced
prod
uctio
ndata
DataH
ubDataH
ubBasedon
assumption
DataH
ubrespon
sible
Maintains
andop
erate
DataH
ubDatahub
(Ene
rginet
2019b)
Marketop
erator
Ope
ratesmarket
Marketplace
Who
lesalemarket
(Ene
rginet
2019b)
DSO
Distributionsystem
operator
Send
ssubscriptio
n,fees,and
tariffs
DataH
ubDataH
ub(Ene
rginet
2019b)
Maintains
andop
erates
Distributionsystem
Distributiongrid
(Ene
rginet
2019b)
Meter
Ope
rator
Ope
ratesandmaintains
Meteringpo
int
Meter
forconsum
ption
(Ene
rginet
2021)
Send
smetered
andsettlemen
tdata
DataH
ubDataH
ub(Ene
rginet
2019b)
Taxpaym
entrespon
sible
Pays
taxto
SKAT
Taxcollector
SKAT
(Ene
rginet
2019b)
BRPfor
consum
ption
Balancerespon
siblefor
consum
ption
Send
ssche
dules,no
tifications
andbids
Marketplace
Who
lesalemarket
(Ene
rginet
2020a)
Pays
forpu
rchasedelectricity
Marketplace
Who
lesalemarket
(Jen
sen2010)
Pays
forim
balance
Transm
ission
system
operator
TSO
(Ene
rginet
2019c)
Electricity
supp
lier
Electricity
retailer
Pays
distrib
utionne
tworktariffs
Distributionsystem
operator
DSO
(Ene
rginet
2019b)
Ma et al. Energy Informatics (2021) 4:9 Page 13 of 37
Table
9Theinteractions
betw
eenactorsandob
jectsin
theDanishelectricity
busine
ssecosystem
(Con
tinued)
From
actor/
object
Role
Interactionco
nten
tColor
code
Role
Toactor/ob
ject
Referenc
es
Pays
transm
ission
netw
orktariffs
Transm
ission
system
operator
TSO
(Ene
rginet
2019b)
Balancecontract
with
Balancingrespon
siblefor
consum
ption
BRPforconsum
ption
(Ene
rginet
2019b)
Pays
forelectricity
andim
balance
Balancerespon
siblefor
consum
ption
BRPforconsum
ption
basedon
theassumptionof
(Ene
rginet
2019c)
Send
sconsum
ptiondata
Balancingrespon
siblefor
consum
ption
BRPforconsum
ption
basedon
theassumptionof
(Ene
rginet
2020a)
Send
sconsum
ers’inform
ationup
date
DataH
ubDataHub
(Ene
rginet
2018)
Send
electricity
billwith
consum
ptionand
tariffinform
ation
Electricity
consum
erDom
estic
consum
er(Ene
rginet
2018)
Dom
estic
consum
erElectricity
consum
erSend
sconsum
ptiondata
Meteringpo
int
Meter
forconsum
ption
(Ene
rginet
2019b)
Has
asupp
lycontract
with
Electricity
retailer
Electricity
supp
lier
(Ene
rginet
2020a)
Pays
forconsum
ed,electricity,d
uties,
tariffsandtransport
Electricity
retailer
Electricity
supp
lier
(Ene
rginet
2021)
Meter
for
prod
uctio
nMeter
point
Send
sprod
uctio
ndata
DataH
ubDataH
ubBasedon
assumption
Distributiongrid
Distributiongrid
Transportselectricity
Electricity
consum
erDom
estic
consum
er(Skovm
ose2010)
Ma et al. Energy Informatics (2021) 4:9 Page 14 of 37
Table
9Theinteractions
betw
eenactorsandob
jectsin
theDanishelectricity
busine
ssecosystem
(Con
tinued)
From
actor/
object
Role
Interactionco
nten
tColor
code
Role
Toactor/ob
ject
Referenc
es
DataH
ubDataH
ubSend
sconsum
ptiondata
Electricity
retailer
Electricity
supp
lier
Basedon
assumption
Send
sTSOandPSOtariffsinform
ation
Electricity
retailer
Send
sTSOandPSOtariffs
inform
ation
Basedon
assumption
Send
sprod
uctio
ndata
Balancerespon
siblefor
prod
uctio
nBRPforprod
uctio
nBasedon
assumption
Who
lesale
market
Marketplace
Pays
forprod
uced
electricity
Balancerespon
siblefor
prod
uctio
nBRPforprod
uctio
nbasedon
theassumptionof
(Ene
rginet
2021)
Meter
for
consum
ption
Meter
point
Send
sconsum
ptiondata
Meter
operator
DSO
(Ene
rginet
2021)
•Th
eda
y-ah
ead,
intra-da
yan
dregu
latin
gmarkets
areno
tshow
nsepa
rately
inthistable;
•So
meprod
ucersan
delectricity
supp
liers
arealso
BRPs,b
utthey
arepresen
tedsepa
rately
inthistable;
•Th
istablemainlyillustrates
theinteractions
betw
eenthemainactors
andob
jects,an
dsomeactors
(e.g.B
RPsfortrad
e)an
drelatio
ns(m
eter
forprod
uctio
nto
DataH
ub,and
BRPs
forprod
uctio
nto
DataH
ub)are
notinclud
ed•Electricity
prod
uctio
nun
itsha
vecostssuch
astariffsfortheirself-consum
ption,
fuel,levieson
fuel,and
CO2qu
otas.The
serelatio
nsareno
tinclud
ed
Ma et al. Energy Informatics (2021) 4:9 Page 15 of 37
Ecosystem roadmap Is a critical path with sequenced ecosystem transition stages for
achieving the planned/future ecosystem.
Transition stage One MVE or expanded/shifted ecosystem is designed at one transi-
tion stage. The sequence of the transition stages can be either horizontal (boundary
scale) dependent on the boundary coverage or vertical (time scale) dependent on the
realization terms (short, medium, and long terms).
By designing the MVE, the minimum but completed ecosystem can match the eco-
system boundary requirement, and at the same time, reduce the complexity of the eco-
system architecture. If MVE is not the final ecosystem, an ecosystem roadmap with
transition stages and corresponded expanded/shifted ecosystems can serve the purpose.
At each transition stage, whether the ecosystem is expanded or shifted depends on the
ecosystem roadmap. The expansion is usually related to the cultural/geographic bound-
ary, and the shifting happens when the targeted domain (one dimension of the ecosys-
tem boundary) changes.
Completeness checking of value flows and interactions
Although the MVE architecture design can reduce the complexity, the completeness of
the designed ecosystem architecture should be verified. The completeness can be veri-
fied by checking the completeness of individual value flows. A value flow is defined as
‘a specific type of value moves (via interaction) into one direction continuously’ in this
paper, and the completeness of a value flow means that the value is continuous from
the start points to the endpoints.
As explained at Stage 4, the intangible value is defined as a type of interaction but
not value flow because it does not move into one direction continuously. However,
there are actors and objects in an ecosystem, and an object, e.g. the distribution net-
work can not make any decision. It is the actors who have the responsibility of the ob-
ject (e.g., operate and maintain) to take actions. Therefore, the completeness of the
intangible value interactions between objects and actors needs to be checked.
A business ecosystem mapping is recommended for visualizing and verifying the designed
ecosystem architecture. It especially supports the completeness checking of the four individual
value flows and the intangible value interactions between objects and actors.
State-of-the-art techniques
At Stage 3, actors’ roles, value propositions are identified. Actors and their responsibil-
ities in the Danish energy system (electricity and district heating) are relatively well de-
scribed due to the regulation. Actors and their responsibilities in other business
ecosystems might be not so clearly described, e.g., building automation (Ma et al.
2017b). Therefore, state-of-the-art techniques are recommended during the whole busi-
ness ecosystem architecture design, including the investigation of actors, their roles,
and value propositions, and their business models in a given market.
The state-of-the-art techniques include market research, literature review, and patent
searching. The literature review is conducted by searching databases for scientific arti-
cles and statistics & market reports. For instance, the databases of ACM (Association
for Computing Machinery) Digital Library and IEEE (Institute of Electrical and
Ma et al. Energy Informatics (2021) 4:9 Page 16 of 37
Electronics Engineers) Xplore are two popular scientific databases for searching tech-
nologies. Market research is usually conducted by desktop research including internet
search by using search engines or domain expert consultation (e.g. interviewing related
companies and market reports). Market research and literature review cover the devel-
oped solutions or the proof of concept, and patent search can identify potential solu-
tions. For instance, to investigate the patents related to the Danish electricity market, a
patent search can be conducted by searching Espacenet (the European Patent Office).
Market research is the most common state-of-the-art technique applied in the whole
business ecosystem architecture design.
Case study and results: electric vehicle home charging in DenmarkThe adoption of electric vehicles (EVs) is an important part of the Danish energy tran-
sition towards a fossil independent society. Large-scale plug-in EVs will directly impact
the distribution grids. EV charging will not only create higher electricity demand but
also high penetration to the grids. The corresponded business ecosystem architecture is
designed to investigate the impacts of EV home charging on the distribution grids.
The market research investigation regarding the electricity supply and the distribu-
tion grids in Denmark is found by the investigation of the electricity regulation and de-
scription via related authorities’ websites and reports. The market analysis for EV
charging solutions is conducted by internet searching, e.g. using the search engine Goo-
gle for EV home charging providers in Denmark. For each EV home charging provider,
its business model is identified by investigating its webpages. Based on the market re-
search investigation and the proposed methodology, the business ecosystem architec-
ture is developed through the following five stages:
Stage 1- Boundary identification of the business ecosystem
EV charging can happen at charging stations, parking spaces, and homes. The impacts
of different EV charging approaches on the electricity grids are different. To reduce the
complexity, only EV charging at home is considered in this case study. Although plenty
of literature has discussed the potentials of Viechle-to-Grid (EV as batteries to be
recharged back to the grid), the market potentials and feasibility are unclear. Therefore,
only EV charging is considered in this case.
There are two supply chains related to EV home charging: electricity supply and EV
charging. The main purpose of this case study is to investigate how the distribution
network is impacted by EV home charging. Therefore, the primary supply chain is the
electricity supply in the distribution grid, and the secondary supply chain is the EV
home charging.
There are several markets and businesses related to this business ecosystem: electri-
city retail market, business for EV sales and EV charging box sales, and EV home char-
ging. Because EV and EV charging box sales are one-time business and not strongly
related to the main purpose of the case study, these two businesses are disregarded.
Stage 2- Identification of actors and their roles in the business ecosystem
The related actors and roles for the electricity supply chain in the distribution grid are
similar to Table 9, but some actors and roles that are not directly related to the case
Ma et al. Energy Informatics (2021) 4:9 Page 17 of 37
are excluded. Related actors and their roles for the EV home charging energy ecosystem
are shown in Table 10. The list of EV suppliers (bilmagasinet.dk 2019) and charging-
box suppliers in Denmark is shown in Table 11 based on market research.
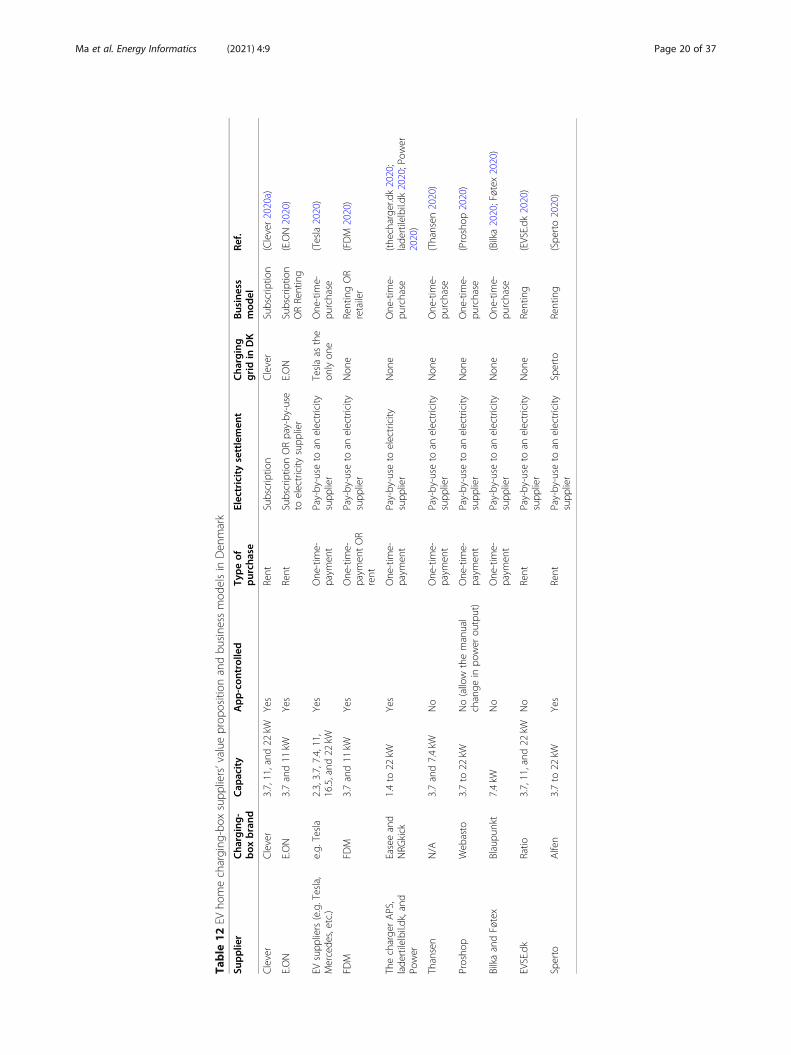
Stage 3- Identification of actors’ value propositions
This case study only focuses on EV home charging, therefore, only charging box sup-
pliers’ value propositions and business models are included (not EV suppliers). Based
on market research, the charging-box suppliers’ value propositions and business models
for EV home charging in Denmark are shown in Table 12. Meanwhile, four business
models are founded for EV home charging in Denmark:
One-time purchase
EV owners purchase charging boxes from EV suppliers or retail stores; EV owners pay
electricity suppliers the electricity bill including electricity consumed by EV charging.
In this business model, charging boxes are provided by EV suppliers such as Tesla
that can ensure charging boxes follow the specific EV standards. Tesla, for instance,
uses a different charger compared to other EVs. However, charging boxes are not usu-
ally included in EV purchases. In Denmark, the electricity consumed for EV charging is
usually paid as part of the electricity bill to electricity suppliers. A similar business
model applies to buy charging-boxes from retail stores like Power, Bilka, Thansen, etc.
Renting
EV owners rent charging boxes from charging box suppliers; EV owners pay electricity
suppliers the electricity bill including electricity consumed by EV charging; EV owners
receive a reimbursement from charging box suppliers.
To compete with the business model of one-time purchase, charging box suppliers
provide a reimbursement of 1.1 DKK/kWh to EV owners. This reimbursement is what
charging-box suppliers receive from the government. Due to Danish regulation,
Table 10 The related actors and their roles in the Danish EV home charging business ecosystem
From actor/object Role
TSO Transmission system operator
DataHub responsible
DSO Distribution system operator
Data collector
Electricity supplier Electricity retailer
Domestic consumer Electricity consumer
Electric vehicle user
Meter for consumption
Charging-box supplier Service provider
DataHub DataHub
Electric vehicle Electric vehicle
Charging-box Charging control
Sub-meter
The excluded actors are: ‘BRP for consumption; SKAT, the tax collectorThe excluded roles are: ‘Market operator’ role of actor ‘TSO’; ‘Tax payment responsible’ role of actor ‘DSO
Ma et al. Energy Informatics (2021) 4:9 Page 18 of 37
electricity used for specific business processes (EV charging is included) can receive a
reimbursement of 1.1 DKK/kWh until 2021 (skat.dk 2020). Charging box suppliers
own and maintain charging boxes, claim EV charging via them is a ‘business process’,
therefore, can receive this reimbursement.
Subscription
EV owners pay a subscription to charging box suppliers for renting charging boxes at
home, limited or unlimited EV charging at all charging boxes and stations owned by
the charging-box suppliers; EV owners pay electricity suppliers the electricity bill in-
cluding electricity consumed by EV charging; EV owners receive a refund with a fixed
rate from charging-box suppliers.
In this business model, some charging-box suppliers have a capacity limitation (the
amount of electricity that can be used for charging) but some have not. At home, char-
ging boxes are installed behind the meter points operated by DSOs, therefore, EV
owners have to pay the electricity suppliers the electricity bill including the normal
household electricity consumption and the EV charging consumption. To avoid EV
owners paying twice for EV charging, EV owners receive a fixed refund per kWh (for
the electricity consumed by EV charging) from the charging box suppliers.
V2G
EV owners can participate in frequency reserves via a V2G platform.
This business model has been demonstrated in a pilot study in Denmark. A company
called Nuvve offers charging boxes and a V2G platform, and has utilized V2G to par-
ticipate in the frequency market. Their concept has been successfully tested with some
EVs in the Parker project (Andersen et al. 2019). However, only some EVs are ready for
V2G (e.g., Nissan LEAF (2014MY and newer), Nissan e-NV200, Mitsubishi iMieV, Mit-
subishi Outlander PHEV) (Nuvve 2020). The V2G platform acts as an aggregator that
can trade in the frequency market through a BRP (Andersen et al. 2019).
Table 11 The list of EV suppliers and charging-box suppliers in Denmark
List of EV suppliers in Denmark List of charging-box suppliers in Denmark
Audi Clever
BMW E.ON
Hyundai EVSE.dk
Jaguar Sperto
Kia FDM
Mercedes EV suppliers (e.g. Tesla, Mercedes etc.)
Nissan The charger APS, ladertilelbil.dk, and Power
Porsche Thansen
Renault Proshop
Seat Bilka and Føtex
Smart Schneider Electric
Tesla
Volkswagen
Ma et al. Energy Informatics (2021) 4:9 Page 19 of 37
Table
12EV
homecharging
-box
supp
liers’value
prop
osition
andbu
sine
ssmod
elsin
Den
mark
Supplie
rCha
rging-
box
brand
Cap
acity
App-con
trolled
Typeof
purch
ase
Electricitysettlemen
tCha
rging
gridin
DK
Business
mod
elRe
f.
Clever
Clever
3.7,11,and
22kW
Yes
Rent
Subscriptio
nClever
Subscriptio
n(Clever2020a)
E.ON
E.ON
3.7and11
kWYes
Rent
Subscriptio
nORpay-by-use
toelectricity
supp
lier
E.ON
Subscriptio
nORRenting
(E.ON2020)
EVsupp
liers(e.g.Tesla,
Mercede
s,etc.)
e.g.
Tesla
2.3,3.7,7.4,11,
16.5,and
22kW
Yes
One
-tim
e-paym
ent
Pay-by-use
toan
electricity
supp
lier
Teslaas
the
onlyon
eOne
-tim
e-pu
rchase
(Tesla2020)
FDM
FDM
3.7and11
kWYes
One
-tim
e-paym
entOR
rent
Pay-by-use
toan
electricity
supp
lier
Non
eRentingOR
retailer
(FDM
2020)
Thecharge
rAPS,
lade
rtilelbil.dk,and
Power
Easeeand
NRG
kick
1.4to
22kW
Yes
One
-tim
e-paym
ent
Pay-by-use
toelectricity
supp
lier
Non
eOne
-tim
e-pu
rchase
(the
charge
r.dk2020;
lade
rtilelbil.dk
2020;Pow
er2020)
Thansen
N/A
3.7and7.4kW
No
One
-tim
e-paym
ent
Pay-by-use
toan
electricity
supp
lier
Non
eOne
-tim
e-pu
rchase
(Thansen
2020)
Prosho
pWeb
asto
3.7to
22kW
No(allow
themanual
change
inpo
wer
output)
One
-tim
e-paym
ent
Pay-by-use
toan
electricity
supp
lier
Non
eOne
-tim
e-pu
rchase
(Proshop
2020)
BilkaandFøtex
Blaupu
nkt
7.4kW
No
One
-tim
e-paym
ent
Pay-by-use
toan
electricity
supp
lier
Non
eOne
-tim
e-pu
rchase
(Bilka2020;Føtex
2020)
EVSE.dk
Ratio
3.7,11,and
22kW
No
Rent
Pay-by-use
toan
electricity
supp
lier
Non
eRenting
(EVSE.dk
2020)
Sperto
Alfen
3.7to
22kW
Yes
Rent
Pay-by-use
toan
electricity
supp
lier
Sperto
Renting
(Spe
rto2020)
Ma et al. Energy Informatics (2021) 4:9 Page 20 of 37
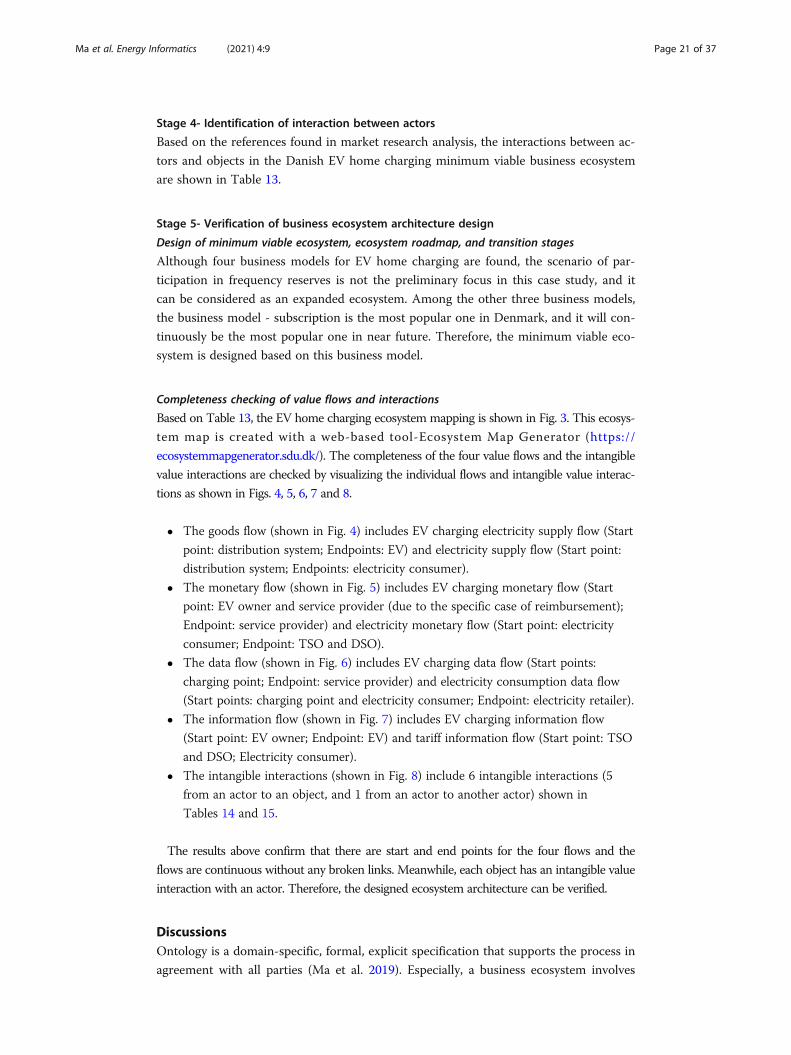
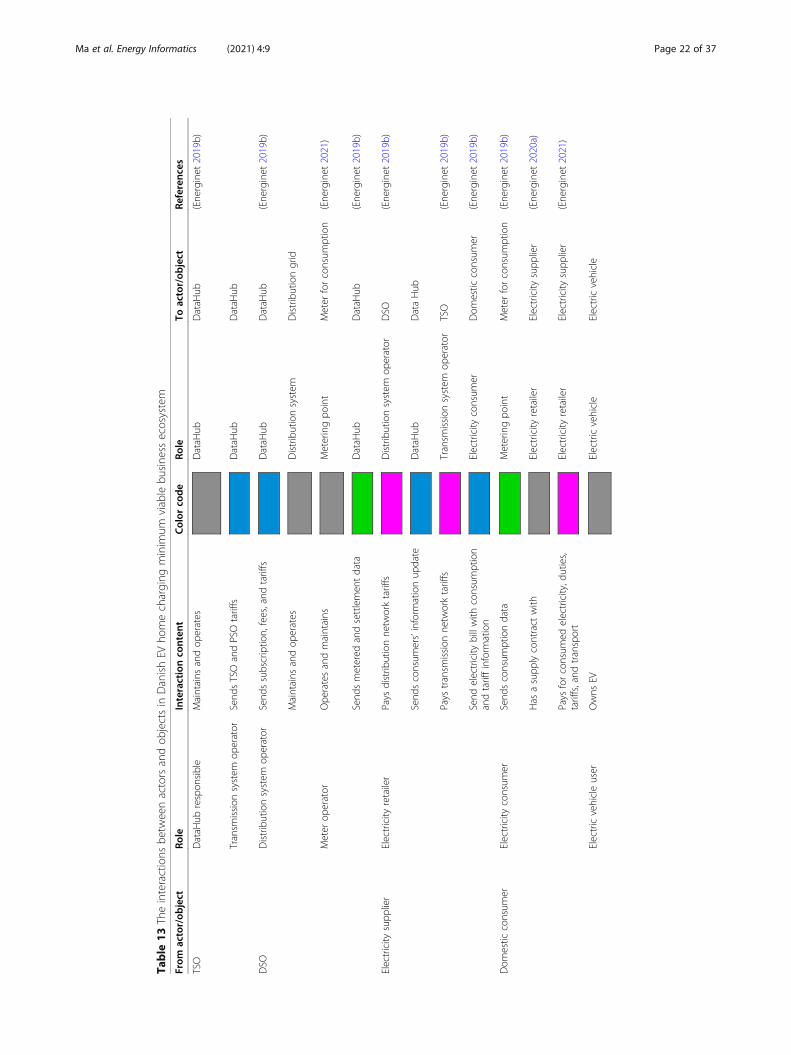
Stage 4- Identification of interaction between actors
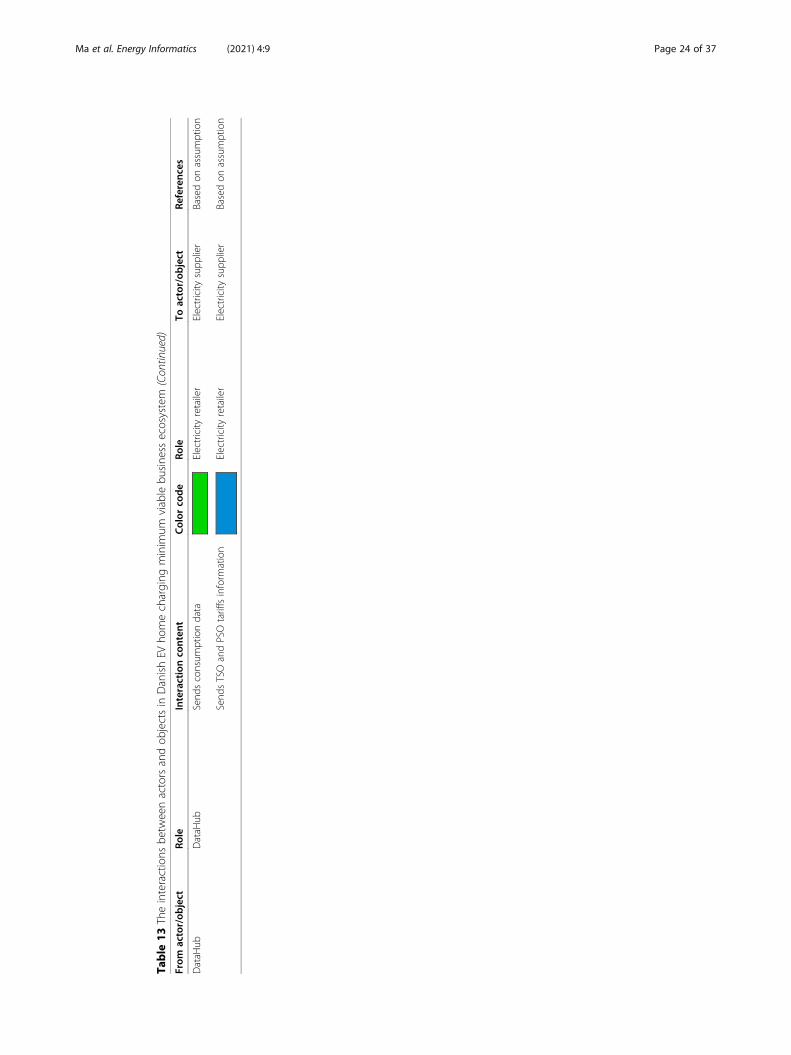
Based on the references found in market research analysis, the interactions between ac-
tors and objects in the Danish EV home charging minimum viable business ecosystem
are shown in Table 13.
Stage 5- Verification of business ecosystem architecture design
Design of minimum viable ecosystem, ecosystem roadmap, and transition stages
Although four business models for EV home charging are found, the scenario of par-
ticipation in frequency reserves is not the preliminary focus in this case study, and it
can be considered as an expanded ecosystem. Among the other three business models,
the business model - subscription is the most popular one in Denmark, and it will con-
tinuously be the most popular one in near future. Therefore, the minimum viable eco-
system is designed based on this business model.
Completeness checking of value flows and interactions
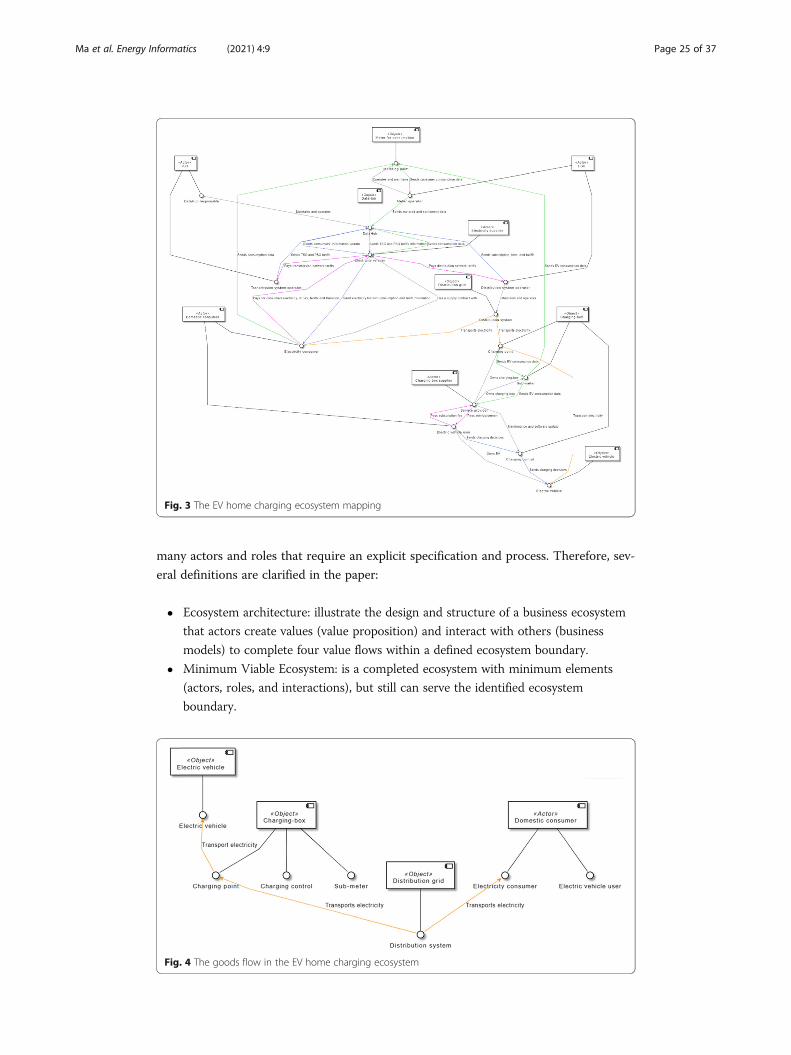
Based on Table 13, the EV home charging ecosystem mapping is shown in Fig. 3. This ecosys-
tem map is created with a web-based tool-Ecosystem Map Generator (https://
ecosystemmapgenerator.sdu.dk/). The completeness of the four value flows and the intangible
value interactions are checked by visualizing the individual flows and intangible value interac-
tions as shown in Figs. 4, 5, 6, 7 and 8.
� The goods flow (shown in Fig. 4) includes EV charging electricity supply flow (Start
point: distribution system; Endpoints: EV) and electricity supply flow (Start point:
distribution system; Endpoints: electricity consumer).
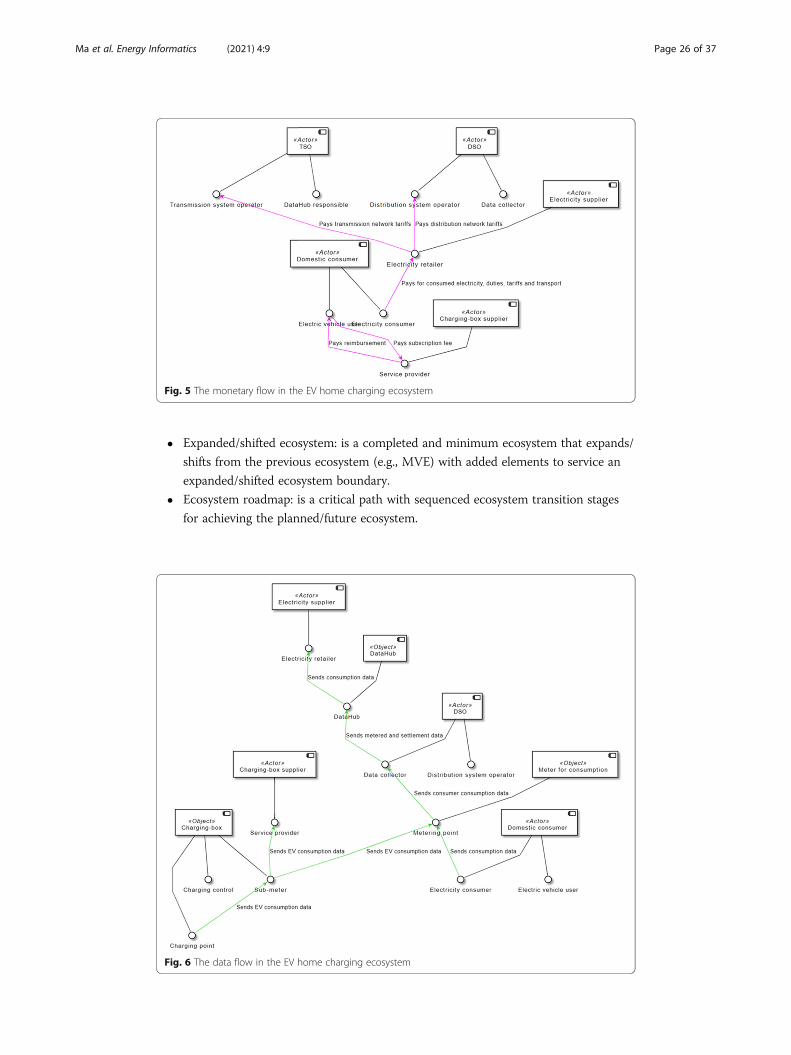
� The monetary flow (shown in Fig. 5) includes EV charging monetary flow (Start
point: EV owner and service provider (due to the specific case of reimbursement);
Endpoint: service provider) and electricity monetary flow (Start point: electricity
consumer; Endpoint: TSO and DSO).
� The data flow (shown in Fig. 6) includes EV charging data flow (Start points:
charging point; Endpoint: service provider) and electricity consumption data flow
(Start points: charging point and electricity consumer; Endpoint: electricity retailer).
� The information flow (shown in Fig. 7) includes EV charging information flow
(Start point: EV owner; Endpoint: EV) and tariff information flow (Start point: TSO
and DSO; Electricity consumer).
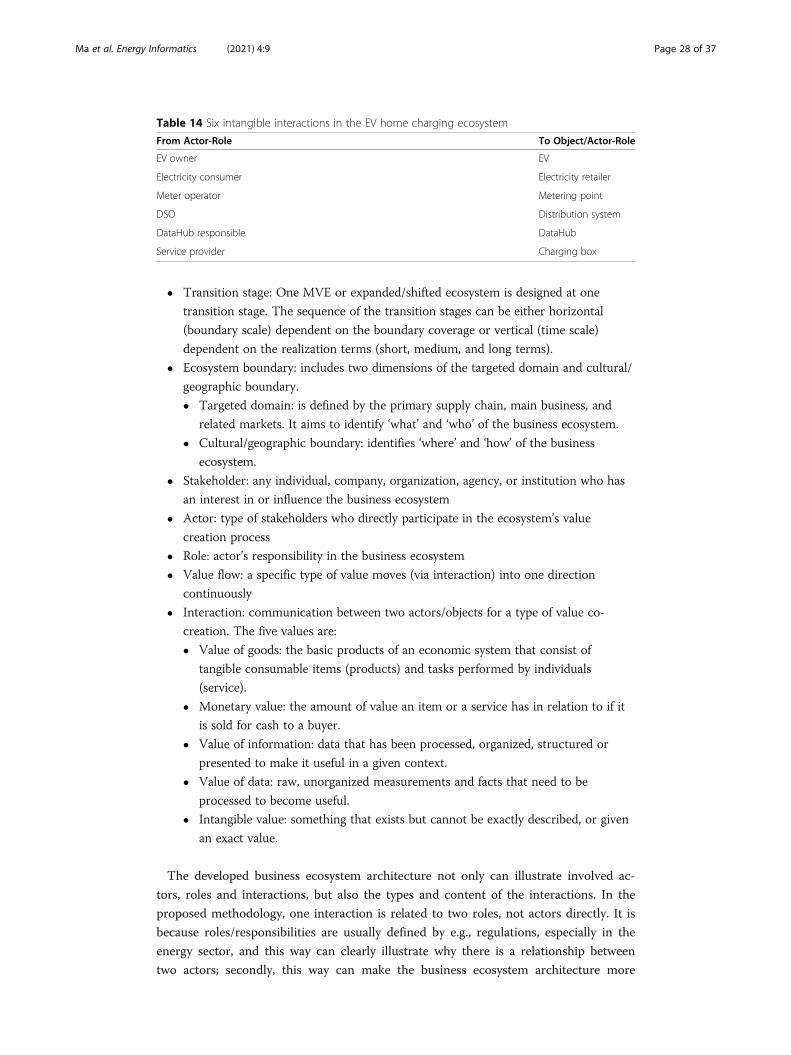
� The intangible interactions (shown in Fig. 8) include 6 intangible interactions (5
from an actor to an object, and 1 from an actor to another actor) shown in
Tables 14 and 15.
The results above confirm that there are start and end points for the four flows and the
flows are continuous without any broken links. Meanwhile, each object has an intangible value
interaction with an actor. Therefore, the designed ecosystem architecture can be verified.
DiscussionsOntology is a domain-specific, formal, explicit specification that supports the process in
agreement with all parties (Ma et al. 2019). Especially, a business ecosystem involves
Ma et al. Energy Informatics (2021) 4:9 Page 21 of 37
Table
13Theinteractions
betw
eenactorsandob
jectsin
DanishEV
homecharging
minim
umviablebu
sine
ssecosystem
From
actor/ob
ject
Role
Interactionco
nten
tColor
code
Role
Toactor/ob
ject
Referenc
es
TSO
DataH
ubrespon
sible
Maintains
andop
erates
DataH
ubDataH
ub(Ene
rginet
2019b)
Transm
ission
system
operator
Send
sTSOandPSOtariffs
DataH
ubDataH
ub
DSO
Distributionsystem
operator
Send
ssubscriptio
n,fees,and
tariffs
DataH
ubDataH
ub(Ene
rginet
2019b)
Maintains
andop
erates
Distributionsystem
Distributiongrid
Meter
operator
Ope
ratesandmaintains
Meteringpo
int
Meter
forconsum
ption
(Ene
rginet
2021)
Send
smetered
andsettlemen
tdata
DataH
ubDataH
ub(Ene
rginet
2019b)
Electricity
supp
lier
Electricity
retailer
Pays
distrib
utionne
tworktariffs
Distributionsystem
operator
DSO
(Ene
rginet
2019b)
Send
sconsum
ers’inform
ationup
date
DataH
ubDataHub
Pays
transm
ission
netw
orktariffs
Transm
ission
system
operator
TSO
(Ene
rginet
2019b)
Send
electricity
billwith
consum
ption
andtariffinform
ation
Electricity
consum
erDom
estic
consum
er(Ene
rginet
2019b)
Dom
estic
consum
erElectricity
consum
erSend
sconsum
ptiondata
Meteringpo
int
Meter
forconsum
ption
(Ene
rginet
2019b)
Has
asupp
lycontract
with
Electricity
retailer
Electricity
supp
lier
(Ene
rginet
2020a)
Pays
forconsum
edelectricity,d
uties,
tariffs,and
transport
Electricity
retailer
Electricity
supp
lier
(Ene
rginet
2021)
Electricvehicleuser
Owns
EVElectricvehicle
Electricvehicle
Ma et al. Energy Informatics (2021) 4:9 Page 22 of 37
Table
13Theinteractions
betw
eenactorsandob
jectsin
DanishEV
homecharging
minim
umviablebu
sine
ssecosystem
(Con
tinued)
From
actor/ob
ject
Role
Interactionco
nten
tColor
code
Role
Toactor/ob
ject
Referenc
es
Send
scharging
decision
sChargingcontrol
(Note:Chargingde
cision
viaappor
manualp
lug-in)
Charging-bo
x(TrueEnergy
2020)
Pays
subscriptio
nfee
Serviceprovider
Charging-bo
xsupp
lier
(Clever2020b)
Charging-bo
xChargingcontrol
Send
scharging
decision
sElectricvehicle
Electricvehicle
(Clever2020b)
Sub-meter
Send
sEV
consum
ptiondata
Serviceprovider
Charging-bo
xsupp
lier
(Clever2020b)
Send
sEV
consum
ptiondata
Meteringpo
int
Meter
forconsum
ption
Chargingpo
int
Transportselectricity
Electricvehicle
Electricvehicle
(Clever2020a)
Send
sEV
consum
ptiondata
Sub-meter
Charging-bo
x
Charging-bo
xsupp
lier
Serviceprovider
Mainten
ance
andsoftw
areup
date
Chargingcontrol
Charging-bo
x(Clever2020a)
Pays
reim
bursem
ent
Electricvehicleuser
(Note:Reim
burseelectricity
billfortheEV
charging
)
Dom
estic
consum
er(Clever2020b)
Owncharging
-box
Chargingpo
int
Charging-bo
x(EVSE.dk
2020)
Owncharging
-box
Sub-meter
Charging-bo
x(EVSE.dk
2020)
Distributiongrid
Distributionsystem
Transportselectricity
Electricity
consum
erDom
estic
consum
er(Skovm
ose2010)
Meteringforconsum
ption
Meteringpo
int
Send
sconsum
erconsum
ptiondata
Meter
operator
DSO
(Ene
rginet
2021)
Ma et al. Energy Informatics (2021) 4:9 Page 23 of 37
Table
13Theinteractions
betw
eenactorsandob
jectsin
DanishEV
homecharging
minim
umviablebu
sine
ssecosystem
(Con
tinued)
From
actor/ob
ject
Role
Interactionco
nten
tColor
code
Role
Toactor/ob
ject
Referenc
es
DataH
ubDataH
ubSend
sconsum
ptiondata
Electricity
retailer
Electricity
supp
lier
Basedon
assumption
Send
sTSOandPSOtariffsinform
ation
Electricity
retailer
Electricity
supp
lier
Basedon
assumption
Ma et al. Energy Informatics (2021) 4:9 Page 24 of 37
many actors and roles that require an explicit specification and process. Therefore, sev-
eral definitions are clarified in the paper:
� Ecosystem architecture: illustrate the design and structure of a business ecosystem
that actors create values (value proposition) and interact with others (business
models) to complete four value flows within a defined ecosystem boundary.
� Minimum Viable Ecosystem: is a completed ecosystem with minimum elements
(actors, roles, and interactions), but still can serve the identified ecosystem
boundary.
Fig. 3 The EV home charging ecosystem mapping
Fig. 4 The goods flow in the EV home charging ecosystem
Ma et al. Energy Informatics (2021) 4:9 Page 25 of 37
� Expanded/shifted ecosystem: is a completed and minimum ecosystem that expands/
shifts from the previous ecosystem (e.g., MVE) with added elements to service an
expanded/shifted ecosystem boundary.
� Ecosystem roadmap: is a critical path with sequenced ecosystem transition stages
for achieving the planned/future ecosystem.
Fig. 5 The monetary flow in the EV home charging ecosystem
Fig. 6 The data flow in the EV home charging ecosystem
Ma et al. Energy Informatics (2021) 4:9 Page 26 of 37
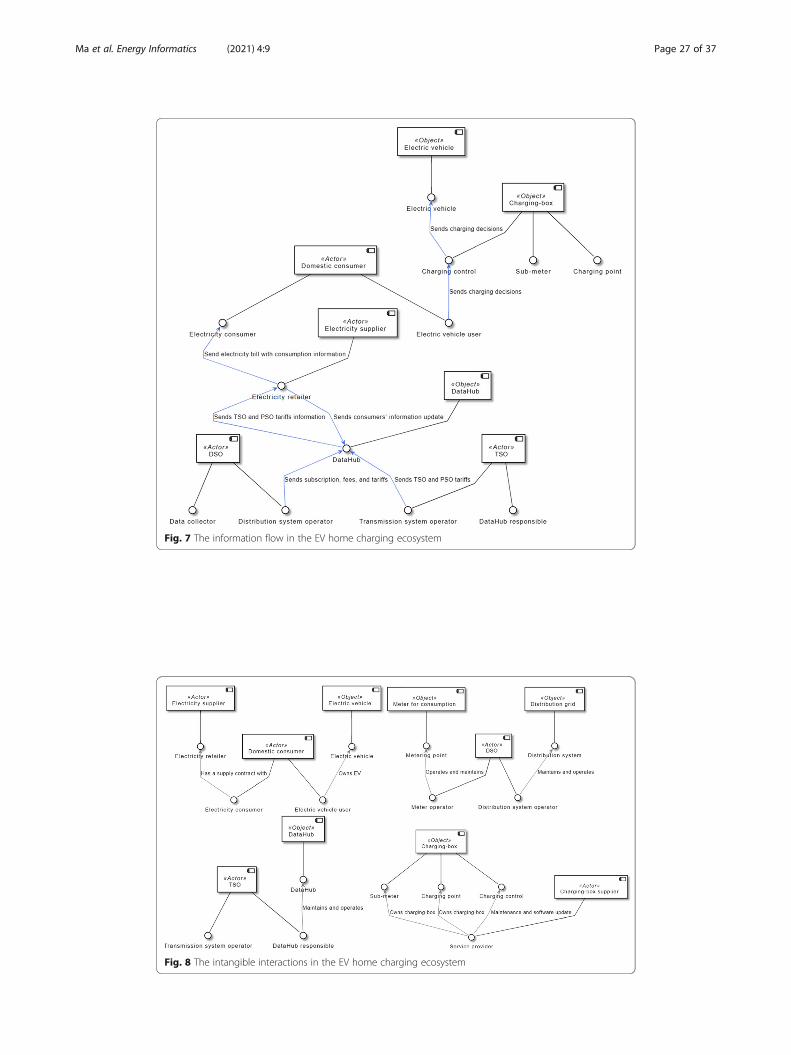
Fig. 7 The information flow in the EV home charging ecosystem
Fig. 8 The intangible interactions in the EV home charging ecosystem
Ma et al. Energy Informatics (2021) 4:9 Page 27 of 37
� Transition stage: One MVE or expanded/shifted ecosystem is designed at one
transition stage. The sequence of the transition stages can be either horizontal
(boundary scale) dependent on the boundary coverage or vertical (time scale)
dependent on the realization terms (short, medium, and long terms).
� Ecosystem boundary: includes two dimensions of the targeted domain and cultural/
geographic boundary.
� Targeted domain: is defined by the primary supply chain, main business, and
related markets. It aims to identify ‘what’ and ‘who’ of the business ecosystem.
� Cultural/geographic boundary: identifies ‘where’ and ‘how’ of the business
ecosystem.
� Stakeholder: any individual, company, organization, agency, or institution who has
an interest in or influence the business ecosystem
� Actor: type of stakeholders who directly participate in the ecosystem’s value
creation process
� Role: actor’s responsibility in the business ecosystem
� Value flow: a specific type of value moves (via interaction) into one direction
continuously
� Interaction: communication between two actors/objects for a type of value co-
creation. The five values are:
� Value of goods: the basic products of an economic system that consist of
tangible consumable items (products) and tasks performed by individuals
(service).
� Monetary value: the amount of value an item or a service has in relation to if it
is sold for cash to a buyer.
� Value of information: data that has been processed, organized, structured or
presented to make it useful in a given context.
� Value of data: raw, unorganized measurements and facts that need to be
processed to become useful.
� Intangible value: something that exists but cannot be exactly described, or given
an exact value.
The developed business ecosystem architecture not only can illustrate involved ac-
tors, roles and interactions, but also the types and content of the interactions. In the
proposed methodology, one interaction is related to two roles, not actors directly. It is
because roles/responsibilities are usually defined by e.g., regulations, especially in the
energy sector, and this way can clearly illustrate why there is a relationship between
two actors; secondly, this way can make the business ecosystem architecture more
Table 14 Six intangible interactions in the EV home charging ecosystem
From Actor-Role To Object/Actor-Role
EV owner EV
Electricity consumer Electricity retailer
Meter operator Metering point
DSO Distribution system
DataHub responsible DataHub
Service provider Charging box
Ma et al. Energy Informatics (2021) 4:9 Page 28 of 37
flexible. When actors or roles change in a business ecosystem, interactions can be
moved or changed without influence other roles for the assigned actors and other ac-
tors. Meanwhile, one interaction only has one direction (from a role to another role),
because value flows have directions, and the actor who supplies goods to consumers is
Table 15 The five-stage business ecosystem architecture design approach with a detailedexplanation
Stage of thebusinessecosystemarchitecturedevelopment
Purpose Activities Output Input/methods
Stage 1-Boundaryidentification ofa businessecosystem
Define and describe thetargeted businessecosystem boundarywith two dimensions(the targeted domainand the cultural/geographic boundary)
Investigate1) the primary andsecondary supply chain,2) main business,3) markets
The targeted businessecosystem boundaryis defined anddescribed with thetwo dimensions;The primary andsecondary supplychain, main business,and markets aredescribed
Marketresearch
Stage 2-Identification ofactors and theirroles in thebusinessecosystem
Identify actors and theirroles
• Identify roles accordingto legal requirementsfor primary and/orsecondary supplychains and markets
• Identify actors and theirroles based on theroles assigned to them
Actors and their rolesare identified
The outputfrom Stage1;Marketresearch
Stage 3-Identification ofactors’ valuepropositions
Identify valuepropositions for eachrole and identify thepotential interactionsbetween roles
Identify valuepropositions and relatedbusiness models for thecorrelated roles
Value propositionsand business modelsfor each correlatedrole are identified anddescribed
The outputfrom Stage2;Marketresearch
Stage 4-Identification ofinteractionbetween actors
Identify the types andcontent of theinteraction betweenroles
• Identify interactioncontent between tworoles
• Identify the types(among five types ofinteraction) ofinteraction betweentwo roles withcorrelated colors
An interaction table The outputfrom Stage3;Marketresearch;Assumptions
Stage 5-Verification ofbusinessecosystemarchitecturedesign
Design minimum viableecosystem andecosystem roadmapVisualize the developedbusiness ecosystemarchitectureCheck completeness
Identify the minimumelements (actors, roles,and their interaction) ofthe targeted businessecosystem;Identify ecosystemroadmap with theexpansion stages andexpanded ecosystem (ifnecessary)Convert the minimumviable businessecosystem architecture(from the Interactiontable) to the businessecosystem mapCheck completeness ofindividual value flowsand intangible valueinteractions betweenobjects and actors
An MVE table and listof actors, roles andinteractionsA business ecosystemmap diagramFive figures for thefour value flows andintangible valueinteractions
The outputfrom Stage 3and Stage 4(businessmodel);Researchaims/focuses
Ma et al. Energy Informatics (2021) 4:9 Page 29 of 37
not always the actor who gets the payment directly from consumers. It is common in
the supply chain domain, but not in the business ecosystem domain.
The Danish electricity distribution and transmission networks are used as examples
to explain the methodology, the case study of EV home charging follows the five steps
and is an expanded ecosystem from the distribution network ecosystem. It demon-
strates that the architecture design for the expanded/shifted ecosystems can be much
faster and easier once the MVE is developed.
An ecosystem map generator is used in the case study for visualizing the developed
business ecosystem architecture and investigating the four flows and intangible value
interactions. Since there are two supply chains (electricity supply and EV charging) in
the EV home charging ecosystem, each type of value flow includes two sub-flows that
represent the two supply chains. It also supports the verification of the designed ecosys-
tem architecture.
Compared to TOGAF (The Open Group Architecture Framework) (The Open Group
2020) that focuses on the focal organization perspective and has no definition or de-
scription of value types between businesses or enterprises, the proposed methodology
is a systematic approach and the designed ecosystem architectures can represent the
physical systems and businesses, and their interactions from an ecosystem perspective.
Two model frameworks in the smart grid domain that are popularly used in Europe
are the harmonized electricity market role model (ENTSO-E 2018) and the SGAM
(Smart Grids Architecture Model) framework (Smart Grid Coordination Group 2012).
The harmonized electricity market role model mainly focuses on the market and IT
perspectives to enable the common understanding among market participants from dif-
ferent countries via a common IT terminology for information exchange. The SGAM
framework presents the design of the smart grid from an architectural viewpoint. Al-
though these two model frameworks include the business aspect, the main focus is still
the technical requirements and only in the smart grid domain. Comparatively, the pro-
posed methodology provides an ontology that links business, system, modeling and
simulation.
ConclusionsThis paper introduces a five-stage methodology for design the business ecosystem
architecture with a detailed explanation and a case study of EV home charging. The
case study demonstrates that the proposed methodology is a systematic approach and
can be easily applied to any ecosystem architecture design with the five stages. Espe-
cially with the three State-of-the-Art techniques (market research, literature review,
and patent search), the designed ecosystem architecture can represent the physical sys-
tem and business.
The introduced five-stage methodology (shown in Table 15) can facilitate the design
of a business ecosystem architecture, and identify the elements (actors, roles, and inter-
action) in the targeted business ecosystem. The developed business ecosystem architec-
ture is the foundation for Part II Factor analysis (in Table 1) that investigates
influential factors and their impact on elements and potential changes in a business
ecosystem. The result will also be the input to Part III-Ecosystem simulation and re-
configuration (in Table 1). There are several types of modeling, e.g. visual, mathemat-
ical, and computational modeling. Computational agent-based modeling (e.g.,
Ma et al. Energy Informatics (2021) 4:9 Page 30 of 37
(Christensen et al. 2019) is recommended to investigate the dynamics and reconfigur-
ation of a business ecosystem.
Contributions
As stated in (Ma 2019), there is little literature on the modeling aspect of the business
ecosystem. With clear definitions, the proposed methodology for the ecosystem archi-
tecture design provides a visualized, clear structure of behaviors and specifications for a
given business ecosystem. Compared to classic system architecture development ap-
proaches that mainly aim to provide a guideline, e.g. TOGAF (The Open Group Archi-
tecture Framework) (The Open Group 2020) and DoDAF (the Department of Defence
Architecture Framework) (U.S. Department of Defense 2010), the proposed method-
ology systematically introduces how to conduct the business ecosystem architecture de-
sign step by step.
The proposed methodology not only decodes the process to configure roles and ac-
tors, but also interactions in a business ecosystem. No literature has explicitly intro-
duced how actors interact in a business ecosystem, although some literature has
introduced value flows in a business ecosystem. Five types of interactions in a business
ecosystem are defined in this paper to illustrate the value and the value direction
among actors. Interactions are assigned to roles, not actors to represent regulatory re-
sponsibilities and ecosystem reconfiguration flexibility.
As discussed in (Ma 2019), a domain ontology is important that defines various kinds
of objects, properties, and relations. Little literature has mentioned ontology design for
business ecosystem modeling, although ontologies are known to be important in intelli-
gent system development for modeling interoperability, composition, and information
exchange at the semantic level. Therefore, the proposed ontology for business ecosys-
tem modeling fills this gap.
This methodology is also highly relevant for practitioners and decision-makers, espe-
cially for reflecting on the adoption and implementation of new technologies.
Future works
This paper mainly introduces the methodology for the business ecosystem architecture
design, and the next step is to introduce Part III- Ecosystem simulation and reconfigur-
ation. A multi-agent based simulation will be developed and a methodology for trans-
forming the designed business ecosystem architecture to a business ecosystem digital
twin will be introduced. The case study of the EV home charging ecosystem will be im-
plemented to investigate the impacts of EV home charging on the distribution grids in
Denmark.
The web-based tool-Ecosystem Map Generator (https://ecosystemmapgenerator.sdu.
dk/) can facilitate the majority of the stages in the proposed methodology but except
Stage 1. Meanwhile, the visualization of the ecosystem architecture can not illustrate
the supply chains. Therefore, it is necessary to improve some functionalities in the tool.
AppendixElectricity retailers in Denmark
In the Danish electricity retail market, consumers are able to freely choose electricity
retailers in Denmark. So far, there are around 59 electricity retailers in Denmark (EL
Ma et al. Energy Informatics (2021) 4:9 Page 31 of 37
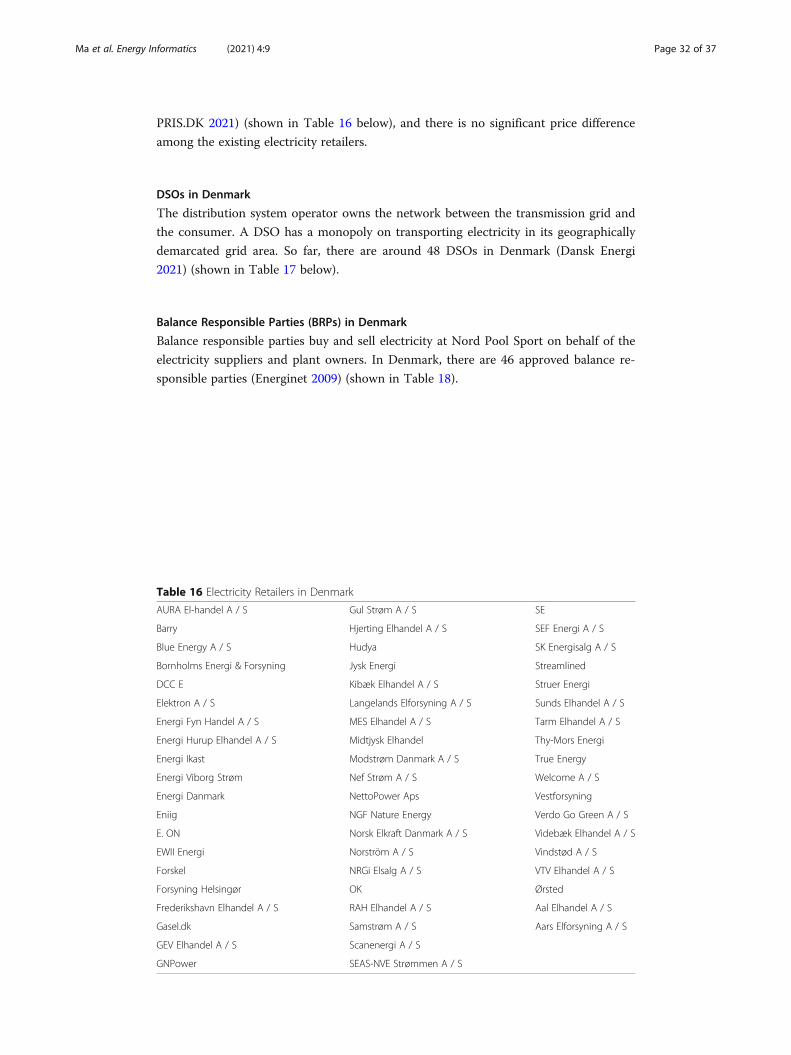
PRIS.DK 2021) (shown in Table 16 below), and there is no significant price difference
among the existing electricity retailers.
DSOs in Denmark
The distribution system operator owns the network between the transmission grid and
the consumer. A DSO has a monopoly on transporting electricity in its geographically
demarcated grid area. So far, there are around 48 DSOs in Denmark (Dansk Energi
2021) (shown in Table 17 below).
Balance Responsible Parties (BRPs) in Denmark
Balance responsible parties buy and sell electricity at Nord Pool Sport on behalf of the
electricity suppliers and plant owners. In Denmark, there are 46 approved balance re-
sponsible parties (Energinet 2009) (shown in Table 18).
Table 16 Electricity Retailers in Denmark
AURA El-handel A / S Gul Strøm A / S SE
Barry Hjerting Elhandel A / S SEF Energi A / S
Blue Energy A / S Hudya SK Energisalg A / S
Bornholms Energi & Forsyning Jysk Energi Streamlined
DCC E Kibæk Elhandel A / S Struer Energi
Elektron A / S Langelands Elforsyning A / S Sunds Elhandel A / S
Energi Fyn Handel A / S MES Elhandel A / S Tarm Elhandel A / S
Energi Hurup Elhandel A / S Midtjysk Elhandel Thy-Mors Energi
Energi Ikast Modstrøm Danmark A / S True Energy
Energi Viborg Strøm Nef Strøm A / S Welcome A / S
Energi Danmark NettoPower Aps Vestforsyning
Eniig NGF Nature Energy Verdo Go Green A / S
E. ON Norsk Elkraft Danmark A / S Videbæk Elhandel A / S
EWII Energi Norström A / S Vindstød A / S
Forskel NRGi Elsalg A / S VTV Elhandel A / S
Forsyning Helsingør OK Ørsted
Frederikshavn Elhandel A / S RAH Elhandel A / S Aal Elhandel A / S
Gasel.dk Samstrøm A / S Aars Elforsyning A / S
GEV Elhandel A / S Scanenergi A / S
GNPower SEAS-NVE Strømmen A / S
Ma et al. Energy Informatics (2021) 4:9 Page 32 of 37
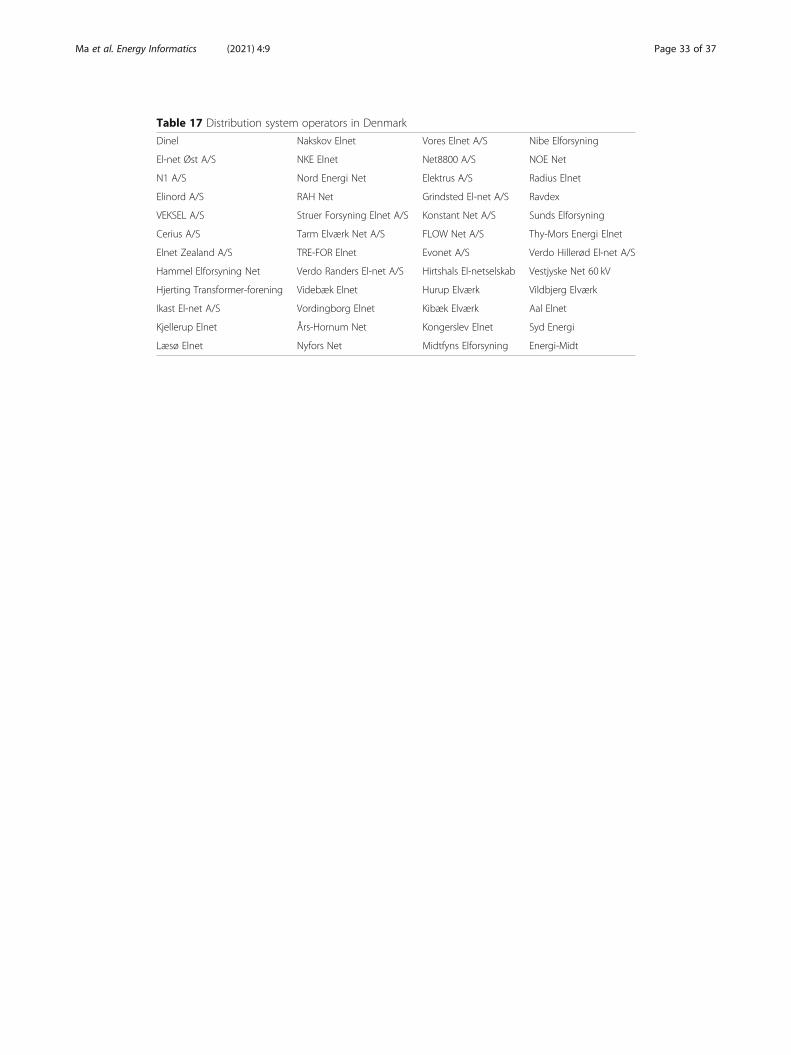
Table 17 Distribution system operators in Denmark
Dinel Nakskov Elnet Vores Elnet A/S Nibe Elforsyning
El-net Øst A/S NKE Elnet Net8800 A/S NOE Net
N1 A/S Nord Energi Net Elektrus A/S Radius Elnet
Elinord A/S RAH Net Grindsted El-net A/S Ravdex
VEKSEL A/S Struer Forsyning Elnet A/S Konstant Net A/S Sunds Elforsyning
Cerius A/S Tarm Elværk Net A/S FLOW Net A/S Thy-Mors Energi Elnet
Elnet Zealand A/S TRE-FOR Elnet Evonet A/S Verdo Hillerød El-net A/S
Hammel Elforsyning Net Verdo Randers El-net A/S Hirtshals El-netselskab Vestjyske Net 60 kV
Hjerting Transformer-forening Videbæk Elnet Hurup Elværk Vildbjerg Elværk
Ikast El-net A/S Vordingborg Elnet Kibæk Elværk Aal Elnet
Kjellerup Elnet Års-Hornum Net Kongerslev Elnet Syd Energi
Læsø Elnet Nyfors Net Midtfyns Elforsyning Energi-Midt
Ma et al. Energy Informatics (2021) 4:9 Page 33 of 37
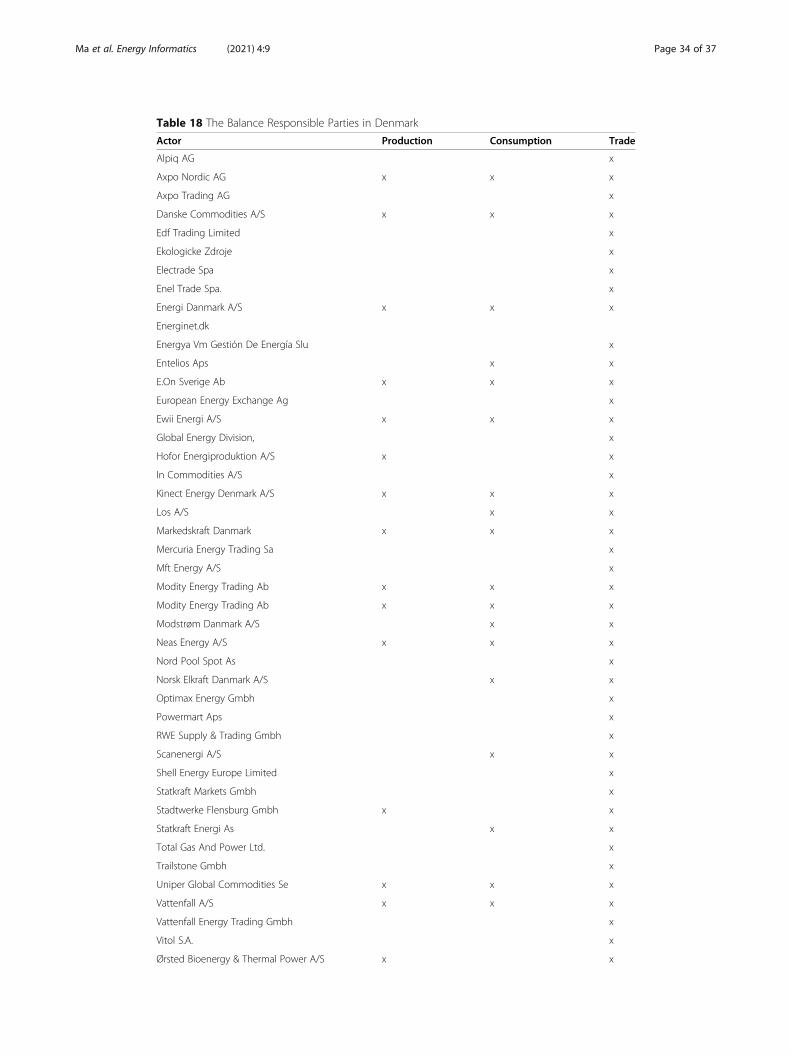
Table 18 The Balance Responsible Parties in Denmark
Actor Production Consumption Trade
Alpiq AG x
Axpo Nordic AG x x x
Axpo Trading AG x
Danske Commodities A/S x x x
Edf Trading Limited x
Ekologicke Zdroje x
Electrade Spa x
Enel Trade Spa. x
Energi Danmark A/S x x x
Energinet.dk
Energya Vm Gestión De Energía Slu x
Entelios Aps x x
E.On Sverige Ab x x x
European Energy Exchange Ag x
Ewii Energi A/S x x x
Global Energy Division, x
Hofor Energiproduktion A/S x x
In Commodities A/S x
Kinect Energy Denmark A/S x x x
Los A/S x x
Markedskraft Danmark x x x
Mercuria Energy Trading Sa x
Mft Energy A/S x
Modity Energy Trading Ab x x x
Modity Energy Trading Ab x x x
Modstrøm Danmark A/S x x
Neas Energy A/S x x x
Nord Pool Spot As x
Norsk Elkraft Danmark A/S x x
Optimax Energy Gmbh x
Powermart Aps x
RWE Supply & Trading Gmbh x
Scanenergi A/S x x
Shell Energy Europe Limited x
Statkraft Markets Gmbh x
Stadtwerke Flensburg Gmbh x x
Statkraft Energi As x x
Total Gas And Power Ltd. x
Trailstone Gmbh x
Uniper Global Commodities Se x x x
Vattenfall A/S x x x
Vattenfall Energy Trading Gmbh x
Vitol S.A. x
Ørsted Bioenergy & Thermal Power A/S x x
Ma et al. Energy Informatics (2021) 4:9 Page 34 of 37
AbbreviationsEU: European Union; DK: Denmark; TSO: Transmission System Operator; DSOs: Distribution System Operators;SKAT: Central Danish tax administration; MVE: Minimum Viable Ecosystem; BRP: Balance responsible party;ACM: Association for Computing Machinery; EV: Electric Vehicle; DKK: Danish Kroner; V2G: Vehicle-to-Grid; TOGAF: TheOpen Group Architecture Framework; DoDAF: The Department of Defence Architecture Framework)
AcknowledgmentsThis study was conducted as part of the Flexible Energy Denmark project (https://www.flexibleenergydenmark.dk/).
Authors’ contributionsZM carried out the first draft of the paper, KC contributed to the case study section, and BNJ contributed to the ideasand participated in the paper revision. All authors read and approved the final manuscript.
FundingThis study was conducted as part of the Flexible Energy Denmark project (https://www.flexibleenergydenmark.dk/).
Availability of data and materialsData sharing not applicable to this article as no datasets were generated or analyzed during the current study.
Declarations
Ethics approvalNot applicable.
Consent for publicationNot applicable.
Competing interestsThe authors declare that they have no competing interests.
Author details1SDU Health Informatics and Technology, The Maersk Mc-Kinney Moller Institute, University of Southern Denmark,Odense, Denmark. 2SDU Center for Energy Informatics, The Maersk Mc-Kinney Moller Institute, University of SouthernDenmark, Odense, Denmark.
Received: 22 February 2021 Accepted: 17 May 2021
ReferencesAdner R. The wide lens: a new strategy for innovation: 2012. Penguin.comAdner R (2016) Ecosystem as structure: an actionable construct for strategy. J Manag 43(1):39–58Andersen PB, Toghroljerdi SH, Sørensen TM, Christensen BE, JCML H, Zecchino A (2019) The parker project - final reportBasole RC, Russell MG, Huhtamäki J, Rubens N, Still K, Park H (2015) Understanding business ecosystem dynamics: a data-
driven approach. ACM Trans Manage Inf Syst 6(2):Article 6Battistella C, Colucci K, De Toni AF, Nonino F (2013) Methodology of business ecosystems network analysis: a case study in
Telecom Italia Future Centre. Technol Forecast Soc Chang 80(6):1194–1210. https://doi.org/10.1016/j.techfore.2012.11.002Bilka. Blaupunkt Ladeboks til elbiler AWB1P32AT2NC 2020 [Available from: https://www.bilka.dk/elektronik/batterier/bla
upunkt-ladeboks-til-elbiler-awb1p32at2nc/p/100491230?=https://www.bilka.dk/elektronik/batterier/blaupunkt-ladeboks-til-elbiler-awb1p32at2nc/p/100491230?]
bilmagasinet.dk. Oversigt over elbiler på det danske marked i 2019 2019 [Available from: https://bilmagasinet.dk/guides/elbiler-paa-det-danske-marked]
Bousquet F, Le Page C (2004) Multi-agent simulations and ecosystem management: a review. Ecol Model 176(3):313–332.https://doi.org/10.1016/j.ecolmodel.2004.01.011
Christensen K, Ma Z, Værbak M, Demazeau Y, Jørgensen BN (2019) Agent-based decision making for adoption of smartenergy solutions. In: IV International Congress of Research in Sciences and Humanities Science and HumanitiesInternational Research Conference (SHIRCON 2019). IEEE, Lima
Clever. Let opladning til din elbil 2020a [Available from: https://clever.dk/produkter/]Clever. Hvordan fungerer strømafregningen for ladeboksen? 2020b [Available from: https://clever.dk/opladning-hjemme-og-
paa-farten/tilbagebetaling/]Dansk Energi. Find elnetselskab 2021 [Available from: https://www.danskenergi.dk/vejledning/nettilslutning/find-netselskab]E.ON. Strøm til din elbil 2020 [Available from: https://www.eon.dk/privat/strom-til-din-elbil.html]Ea Energy Analyses. The Nordic electricity market and how it can be improved. 2012EL PRIS.DK. Elleverandører og mæglere i Danmark 2021 [Available from: https://elpris.dk/#/article/liste_elhandlere_og_elmaeglere]
Table 18 The Balance Responsible Parties in Denmark (Continued)
Actor Production Consumption Trade
Ørsted Salg & Service A/S x x x
Østkraft Produktion A/S x x
Ma et al. Energy Informatics (2021) 4:9 Page 35 of 37
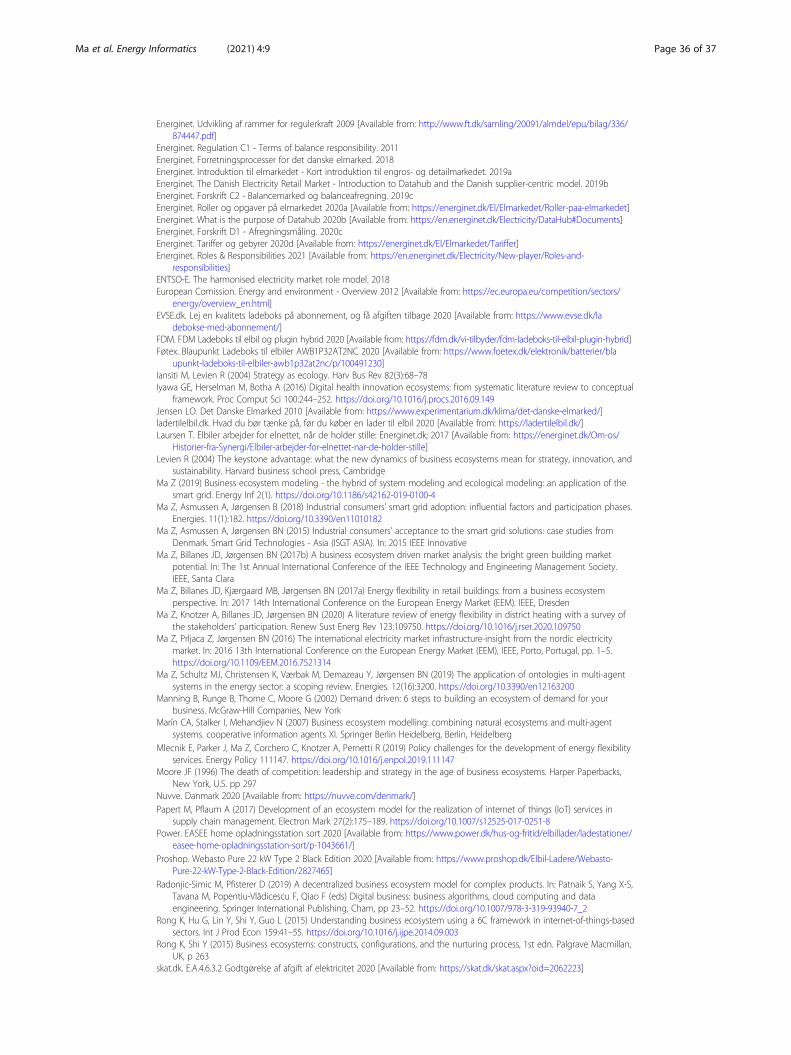
Energinet. Udvikling af rammer for regulerkraft 2009 [Available from: http://www.ft.dk/samling/20091/almdel/epu/bilag/336/874447.pdf]
Energinet. Regulation C1 - Terms of balance responsibility. 2011Energinet. Forretningsprocesser for det danske elmarked. 2018Energinet. Introduktion til elmarkedet - Kort introduktion til engros- og detailmarkedet. 2019aEnerginet. The Danish Electricity Retail Market - Introduction to Datahub and the Danish supplier-centric model. 2019bEnerginet. Forskrift C2 - Balancemarked og balanceafregning. 2019cEnerginet. Roller og opgaver på elmarkedet 2020a [Available from: https://energinet.dk/El/Elmarkedet/Roller-paa-elmarkedet]Energinet. What is the purpose of Datahub 2020b [Available from: https://en.energinet.dk/Electricity/DataHub#Documents]Energinet. Forskrift D1 - Afregningsmåling. 2020cEnerginet. Tariffer og gebyrer 2020d [Available from: https://energinet.dk/El/Elmarkedet/Tariffer]Energinet. Roles & Responsibilities 2021 [Available from: https://en.energinet.dk/Electricity/New-player/Roles-and-
responsibilities]ENTSO-E. The harmonised electricity market role model. 2018European Comission. Energy and environment - Overview 2012 [Available from: https://ec.europa.eu/competition/sectors/
energy/overview_en.html]EVSE.dk. Lej en kvalitets ladeboks på abonnement, og få afgiften tilbage 2020 [Available from: https://www.evse.dk/la
debokse-med-abonnement/]FDM. FDM Ladeboks til elbil og plugin hybrid 2020 [Available from: https://fdm.dk/vi-tilbyder/fdm-ladeboks-til-elbil-plugin-hybrid]Føtex. Blaupunkt Ladeboks til elbiler AWB1P32AT2NC 2020 [Available from: https://www.foetex.dk/elektronik/batterier/bla
upunkt-ladeboks-til-elbiler-awb1p32at2nc/p/100491230]Iansiti M, Levien R (2004) Strategy as ecology. Harv Bus Rev 82(3):68–78Iyawa GE, Herselman M, Botha A (2016) Digital health innovation ecosystems: from systematic literature review to conceptual
framework. Proc Comput Sci 100:244–252. https://doi.org/10.1016/j.procs.2016.09.149Jensen LO. Det Danske Elmarked 2010 [Available from: https://www.experimentarium.dk/klima/det-danske-elmarked/]ladertilelbil.dk. Hvad du bør tænke på, før du køber en lader til elbil 2020 [Available from: https://ladertilelbil.dk/]Laursen T. Elbiler arbejder for elnettet, når de holder stille: Energinet.dk; 2017 [Available from: https://energinet.dk/Om-os/
Historier-fra-Synergi/Elbiler-arbejder-for-elnettet-nar-de-holder-stille]Levien R (2004) The keystone advantage: what the new dynamics of business ecosystems mean for strategy, innovation, and
sustainability. Harvard business school press, CambridgeMa Z (2019) Business ecosystem modeling - the hybrid of system modeling and ecological modeling: an application of the
smart grid. Energy Inf 2(1). https://doi.org/10.1186/s42162-019-0100-4Ma Z, Asmussen A, Jørgensen B (2018) Industrial consumers’ smart grid adoption: influential factors and participation phases.
Energies. 11(1):182. https://doi.org/10.3390/en11010182Ma Z, Asmussen A, Jørgensen BN (2015) Industrial consumers' acceptance to the smart grid solutions: case studies from
Denmark. Smart Grid Technologies - Asia (ISGT ASIA). In: 2015 IEEE InnovativeMa Z, Billanes JD, Jørgensen BN (2017b) A business ecosystem driven market analysis: the bright green building market
potential. In: The 1st Annual International Conference of the IEEE Technology and Engineering Management Society.IEEE, Santa Clara
Ma Z, Billanes JD, Kjærgaard MB, Jørgensen BN (2017a) Energy flexibility in retail buildings: from a business ecosystemperspective. In: 2017 14th International Conference on the European Energy Market (EEM). IEEE, Dresden
Ma Z, Knotzer A, Billanes JD, Jørgensen BN (2020) A literature review of energy flexibility in district heating with a survey ofthe stakeholders’ participation. Renew Sust Energ Rev 123:109750. https://doi.org/10.1016/j.rser.2020.109750
Ma Z, Prljaca Z, Jørgensen BN (2016) The international electricity market infrastructure-insight from the nordic electricitymarket. In: 2016 13th International Conference on the European Energy Market (EEM), IEEE, Porto, Portugal, pp. 1–5.https://doi.org/10.1109/EEM.2016.7521314
Ma Z, Schultz MJ, Christensen K, Værbak M, Demazeau Y, Jørgensen BN (2019) The application of ontologies in multi-agentsystems in the energy sector: a scoping review. Energies. 12(16):3200. https://doi.org/10.3390/en12163200
Manning B, Runge B, Thorne C, Moore G (2002) Demand driven: 6 steps to building an ecosystem of demand for yourbusiness. McGraw-Hill Companies, New York
Marín CA, Stalker I, Mehandjiev N (2007) Business ecosystem modelling: combining natural ecosystems and multi-agentsystems. cooperative information agents XI. Springer Berlin Heidelberg, Berlin, Heidelberg
Mlecnik E, Parker J, Ma Z, Corchero C, Knotzer A, Pernetti R (2019) Policy challenges for the development of energy flexibilityservices. Energy Policy 111147. https://doi.org/10.1016/j.enpol.2019.111147
Moore JF (1996) The death of competition: leadership and strategy in the age of business ecosystems. Harper Paperbacks,New York, U.S. pp 297
Nuvve. Danmark 2020 [Available from: https://nuvve.com/denmark/]Papert M, Pflaum A (2017) Development of an ecosystem model for the realization of internet of things (IoT) services in
supply chain management. Electron Mark 27(2):175–189. https://doi.org/10.1007/s12525-017-0251-8Power. EASEE home opladningsstation sort 2020 [Available from: https://www.power.dk/hus-og-fritid/elbillader/ladestationer/
easee-home-opladningsstation-sort/p-1043661/]Proshop. Webasto Pure 22 kW Type 2 Black Edition 2020 [Available from: https://www.proshop.dk/Elbil-Ladere/Webasto-
Pure-22-kW-Type-2-Black-Edition/2827465]Radonjic-Simic M, Pfisterer D (2019) A decentralized business ecosystem model for complex products. In: Patnaik S, Yang X-S,
Tavana M, Popentiu-Vlădicescu F, Qiao F (eds) Digital business: business algorithms, cloud computing and dataengineering. Springer International Publishing, Cham, pp 23–52. https://doi.org/10.1007/978-3-319-93940-7_2
Rong K, Hu G, Lin Y, Shi Y, Guo L (2015) Understanding business ecosystem using a 6C framework in internet-of-things-basedsectors. Int J Prod Econ 159:41–55. https://doi.org/10.1016/j.ijpe.2014.09.003
Rong K, Shi Y (2015) Business ecosystems: constructs, configurations, and the nurturing process, 1st edn. Palgrave Macmillan,UK, p 263
skat.dk. E.A.4.6.3.2 Godtgørelse af afgift af elektricitet 2020 [Available from: https://skat.dk/skat.aspx?oid=2062223]
Ma et al. Energy Informatics (2021) 4:9 Page 36 of 37
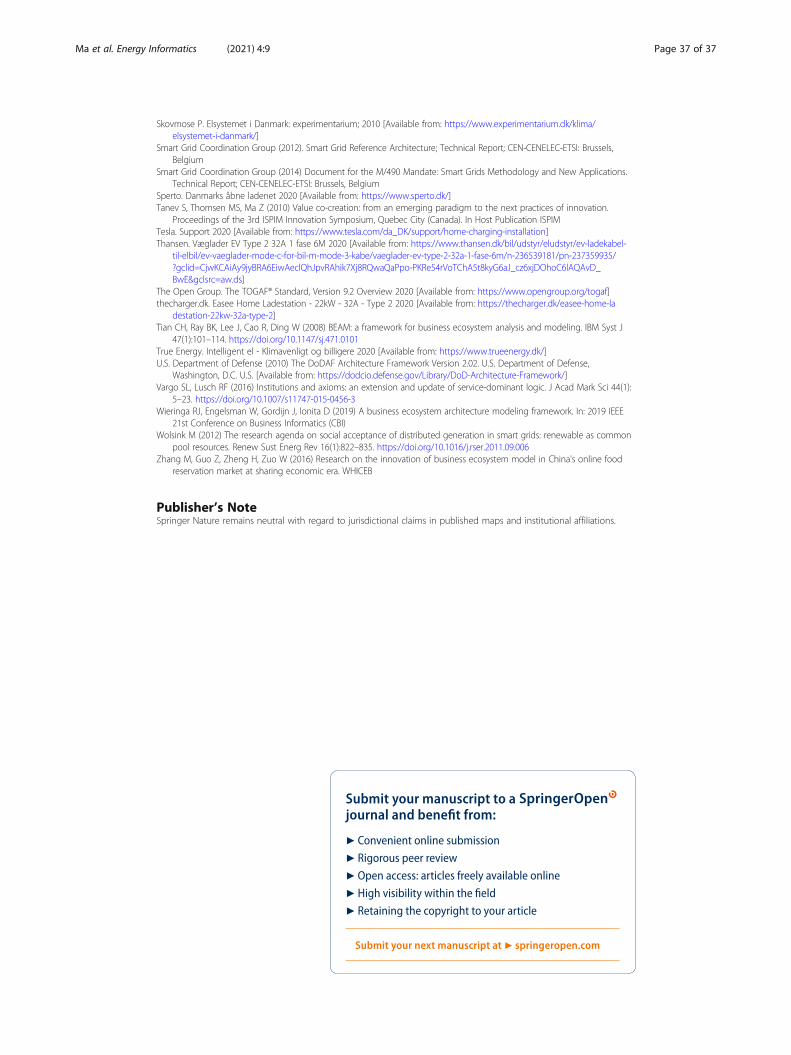
Skovmose P. Elsystemet i Danmark: experimentarium; 2010 [Available from: https://www.experimentarium.dk/klima/elsystemet-i-danmark/]
Smart Grid Coordination Group (2012). Smart Grid Reference Architecture; Technical Report; CEN-CENELEC-ETSI: Brussels,Belgium
Smart Grid Coordination Group (2014) Document for the M/490 Mandate: Smart Grids Methodology and New Applications.Technical Report; CEN-CENELEC-ETSI: Brussels, Belgium
Sperto. Danmarks åbne ladenet 2020 [Available from: https://www.sperto.dk/]Tanev S, Thomsen MS, Ma Z (2010) Value co-creation: from an emerging paradigm to the next practices of innovation.
Proceedings of the 3rd ISPIM Innovation Symposium, Quebec City (Canada). In Host Publication ISPIMTesla. Support 2020 [Available from: https://www.tesla.com/da_DK/support/home-charging-installation]Thansen. Væglader EV Type 2 32A 1 fase 6M 2020 [Available from: https://www.thansen.dk/bil/udstyr/eludstyr/ev-ladekabel-
til-elbil/ev-vaeglader-mode-c-for-bil-m-mode-3-kabe/vaeglader-ev-type-2-32a-1-fase-6m/n-236539181/pn-237359935/?gclid=CjwKCAiAy9jyBRA6EiwAeclQhJpvRAhik7Xj8RQwaQaPpo-PKRe54rVoTChA5t8kyG6aJ_cz6xjDOhoC6lAQAvD_BwE&gclsrc=aw.ds]
The Open Group. The TOGAF® Standard, Version 9.2 Overview 2020 [Available from: https://www.opengroup.org/togaf]thecharger.dk. Easee Home Ladestation - 22kW - 32A - Type 2 2020 [Available from: https://thecharger.dk/easee-home-la
destation-22kw-32a-type-2]Tian CH, Ray BK, Lee J, Cao R, Ding W (2008) BEAM: a framework for business ecosystem analysis and modeling. IBM Syst J
47(1):101–114. https://doi.org/10.1147/sj.471.0101True Energy. Intelligent el - Klimavenligt og billigere 2020 [Available from: https://www.trueenergy.dk/]U.S. Department of Defense (2010) The DoDAF Architecture Framework Version 2.02. U.S. Department of Defense,
Washington, D.C. U.S. [Available from: https://dodcio.defense.gov/Library/DoD-Architecture-Framework/]Vargo SL, Lusch RF (2016) Institutions and axioms: an extension and update of service-dominant logic. J Acad Mark Sci 44(1):
5–23. https://doi.org/10.1007/s11747-015-0456-3Wieringa RJ, Engelsman W, Gordijn J, Ionita D (2019) A business ecosystem architecture modeling framework. In: 2019 IEEE
21st Conference on Business Informatics (CBI)Wolsink M (2012) The research agenda on social acceptance of distributed generation in smart grids: renewable as common
pool resources. Renew Sust Energ Rev 16(1):822–835. https://doi.org/10.1016/j.rser.2011.09.006Zhang M, Guo Z, Zheng H, Zuo W (2016) Research on the innovation of business ecosystem model in China's online food
reservation market at sharing economic era. WHICEB
Publisher’s NoteSpringer Nature remains neutral with regard to jurisdictional claims in published maps and institutional affiliations.
Ma et al. Energy Informatics (2021) 4:9 Page 37 of 37