m resources technical marketing sample pack 2015
TRANSCRIPT
M Resources
Coal Quality and Technical Marketing
Capability Sample Pack
M Resources
2015
1www.mresources.com.au

Introduction
Coal technology, along with aspects of technical marketing support can cover a wide range of topics –including :
• Bore core programmes
• Data handling and assessment
• Coal washability
• Product specification
• Coal blending and marketing
• Value-in-use calculations to support market appraisal
• M Resources have a team of experienced coal technicians and data analysts capable of taking basic bore core, laboratory and product quality data and converting it into valuable output.
• M Resources staff are competent in the areas of geology –metallurgy – coal technology –coal marketing and data analysis.
• Due to continuous coal trading activity, an extensive in-house database of world traded coals is maintained.
M Resources 2www.mresources.com.au

Suite of services
M Resources 3www.mresources.com.au

Database Analysis
M Resources has the tools and ability to take a database with thousands of entries and compile results that are customizable to specific needs.
• Database is filterable to create specifications on any basis(e.g. excluding data with ash over 20 % and/or CV under 5,600 kcal/kg gar etc).
• Weighted average equation to more accurately model contribution from each component, even when disjointed data is presented.
• Ability to adjust specifications promptly to suit changes in mining area or marketing agenda.
M Resources
AVERAGE 1.40 31.2 17.6 11.5 37.2 33.6 0.23 4854 6853
TONNES WEIGHTED AVERAGE 1.38 30.9 19.1 10.3 37.7 33.0 0.21 4857 6871
MIN 1.29 25.6 8.9 3.7 27.9 17.1 0.13 3721 6260
MAX 1.64 37.8 29.7 29.8 53.4 43.6 0.87 5980 7390
SORT Thickness T * RD RD Moisture
holding
capacity
Moisture
%adb
Ash
(%adb)
VM
(%adb)
FC
(%adb)
TS (%adb) CV
kcal/kg
adb
CV
kcal/kg
daf1 0.89 1.21 1.36 29.5 21.0 9.0 34.1 35.9 - 4753 6790
4 4.98 6.77 1.36 30.6 26.0 10.3 35.8 27.9 0.19 4374 6867
15 5.78 7.57 1.31 29.6 27.0 8.6 46.1 18.3 0.22 4380 6801
17 5.00 6.55 1.31 28.7 26.7 7.1 35.0 31.2 0.19 4574 6909
23 1.51 2.01 1.33 30.2 28.7 8.1 37.5 25.7 0.20 4475 7081
25 0.78 1.03 1.32 28.9 27.2 7.8 34.2 30.8 0.20 4660 7169
26 0.85 1.17 1.38 27.6 25.3 14.0 31.6 29.1 0.38 4284 7058
28 2.89 3.79 1.31 29.9 28.2 5.0 41.4 25.4 0.15 4694 7027
29 0.31 0.40 1.29 25.6 23.9 4.5 41.0 30.6 0.20 5246 7327
AVERAGE 1.38 30.8 18.8 9.4 37.6 34.3 0.18 4964 6907
TONNES WEIGHTED AVERAGE 1.36 30.6 20.9 8.7 37.5 33.1 0.18 4875 6916
MIN 1.29 25.6 10.8 4.5 32.3 22.3 0.13 4367 6550
MAX 1.46 35.6 29.7 19.3 42.4 43.6 0.20 5728 7327
SORT Thickness T * RD RD Moisture
holding
capacity
Moisture
%adb
Ash
(%adb)
VM
(%adb)
FC
(%adb)
TS (%adb) CV
kcal/kg
adb
CV
kcal/kg
daf4 4.98 6.77 1.36 30.6 26.0 10.3 35.8 27.9 0.19 4374 6867
17 5.00 6.55 1.31 28.7 26.7 7.1 35.0 31.2 0.19 4574 6909
23 1.51 2.01 1.33 30.2 28.7 8.1 37.5 25.7 0.20 4475 7081
25 0.78 1.03 1.32 28.9 27.2 7.8 34.2 30.8 0.20 4660 7169
28 2.89 3.79 1.31 29.9 28.2 5.0 41.4 25.4 0.15 4694 7027
29 0.31 0.40 1.29 25.6 23.9 4.5 41.0 30.6 0.20 5246 7327
32 1.51 1.98 1.31 30.8 29.7 4.8 32.8 32.7 0.19 4550 6947
36 4.27 5.64 1.32 29.6 29.4 8.5 32.3 29.8 0.17 4367 7032
ALL RESULTS:
Filtered exclude TS greater than 0.20:
4www.mresources.com.au
Contour Plans
M Resources
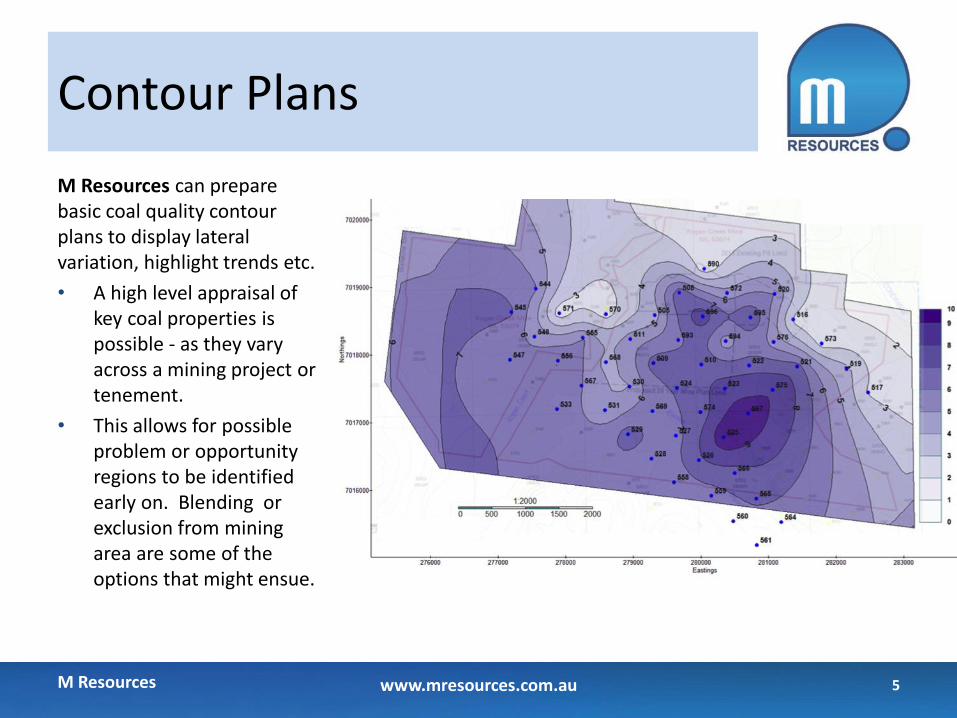
M Resources can prepare basic coal quality contour plans to display lateral variation, highlight trends etc.
• A high level appraisal of key coal properties is possible - as they vary across a mining project or tenement.
• This allows for possible problem or opportunity regions to be identified early on. Blending or exclusion from mining area are some of the options that might ensue.
5www.mresources.com.au
Data Histogram Example Raw Coal Block Quality
M Resources 6
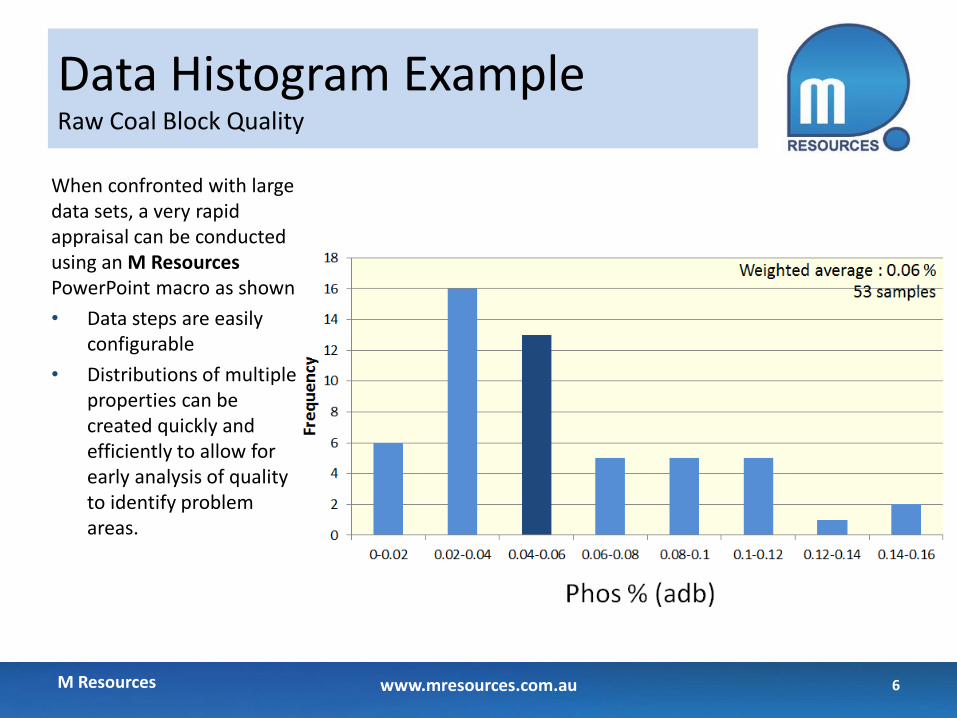
When confronted with large data sets, a very rapid appraisal can be conducted using an M Resources PowerPoint macro as shown
• Data steps are easily configurable
• Distributions of multiple properties can be created quickly and efficiently to allow for early analysis of quality to identify problem areas.
www.mresources.com.au
Ply by Ply Analysis
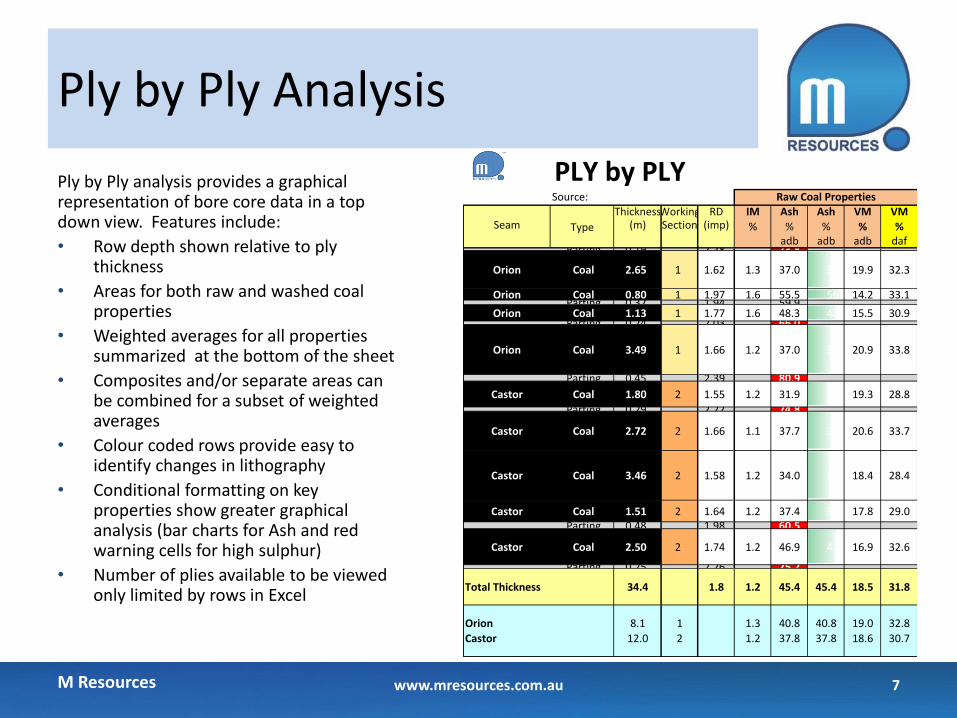
Ply by Ply analysis provides a graphical representation of bore core data in a top down view. Features include:
• Row depth shown relative to ply thickness
• Areas for both raw and washed coal properties
• Weighted averages for all properties summarized at the bottom of the sheet
• Composites and/or separate areas can be combined for a subset of weighted averages
• Colour coded rows provide easy to identify changes in lithography
• Conditional formatting on key properties show greater graphical analysis (bar charts for Ash and red warning cells for high sulphur)
• Number of plies available to be viewed only limited by rows in Excel
M Resources 7
PLY by PLYSource:
ThicknessWorking RD IM Ash Ash VM VMSeam Type (m) Section (imp) % % % % %
adb adb adb daf Parting 0.19 2.28 73.8
Orion Coal 2.65 1 1.62 1.3 37.0 37 19.9 32.3
Orion Coal 0.80 1 1.97 1.6 55.5 56 14.2 33.1 Parting 0.32 1.94 59.9
Orion Coal 1.13 1 1.77 1.6 48.3 48 15.5 30.9 Parting 0.24 2.03 66.0
Orion Coal 3.49 1 1.66 1.2 37.0 37 20.9 33.8
Parting 0.45 2.39 80.9
Castor Coal 1.80 2 1.55 1.2 31.9 32 19.3 28.8
Parting 0.29 2.22 74.8
Castor Coal 2.72 2 1.66 1.1 37.7 38 20.6 33.7
Castor Coal 3.46 2 1.58 1.2 34.0 34 18.4 28.4
Castor Coal 1.51 2 1.64 1.2 37.4 37 17.8 29.0 Parting 0.48 1.98 60.5
Castor Coal 2.50 2 1.74 1.2 46.9 47 16.9 32.6
Parting 0.25 2.26 75.2
Total Thickness 34.4 1.8 1.2 45.4 45.4 18.5 31.8
Orion 8.1 1 1.3 40.8 40.8 19.0 32.8
Castor 12.0 2 1.2 37.8 37.8 18.6 30.7
Raw Coal Properties
www.mresources.com.au
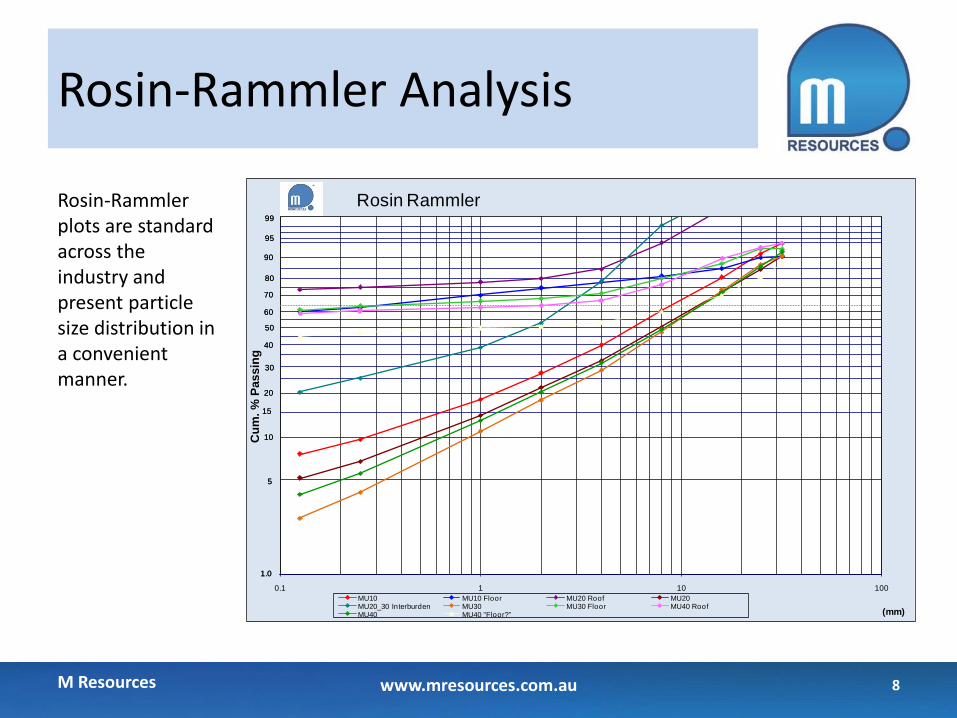
Rosin-Rammler Analysis
M Resources
Rosin-Rammler plots are standard across the industry and present particle size distribution in a convenient manner.
0.1 1 10 100
Cu
m. %
Passin
g
(mm)
Rosin Rammler
MU10 MU10 Floor MU20 Roof MU20MU20_30 Interburden MU30 MU30 Floor MU40 RoofMU40 MU40 "Floor?"
99
95
90
80
70
60
50
40
30
20
15
10
5
1.0
99
95
90
80
70
60
50
40
30
20
15
10
5
1.0
8www.mresources.com.au

Laboratory Procedures
M Resources
M Resources can create a coal testing laboratory procedure tailor-made to each project.
• Varying coal types require different procedures to test for specific properties.
• Maximum data from limited sample mass - done to a budget.
• Liaise with laboratory to ensure procedures are followed and reporting is to standards.
• Identify and implement important tests.
9www.mresources.com.au
Washability AnalysisGraphical Display 1
M Resources
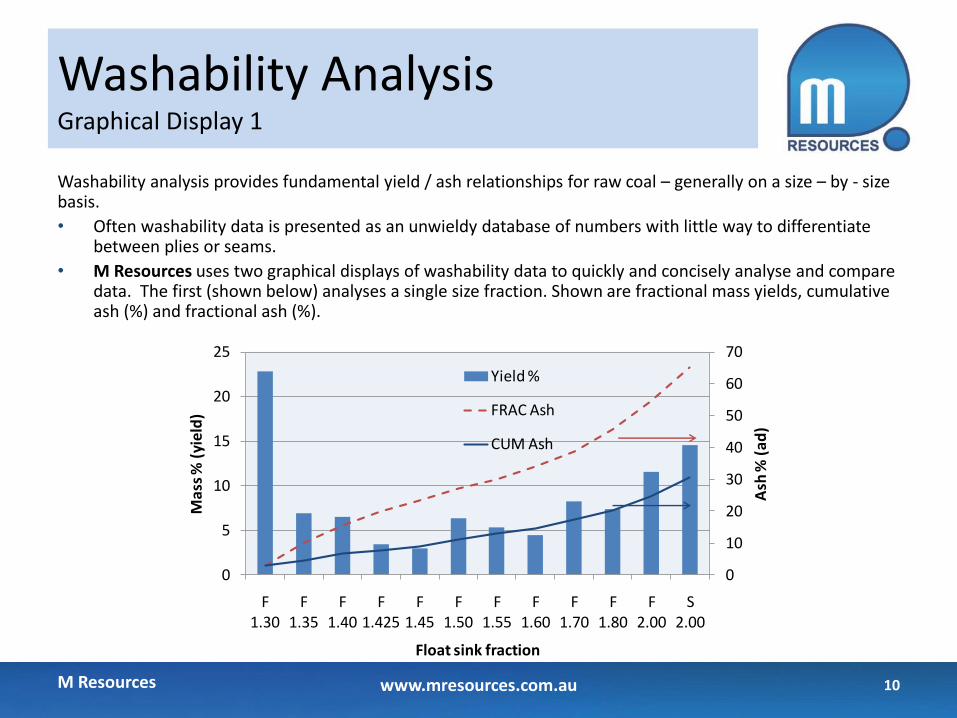
Washability analysis provides fundamental yield / ash relationships for raw coal – generally on a size – by - size basis.
• Often washability data is presented as an unwieldy database of numbers with little way to differentiate between plies or seams.
• M Resources uses two graphical displays of washability data to quickly and concisely analyse and compare data. The first (shown below) analyses a single size fraction. Shown are fractional mass yields, cumulative ash (%) and fractional ash (%).
0
10
20
30
40
50
60
70
0
5
10
15
20
25
F 1.30
F 1.35
F 1.40
F 1.425
F 1.45
F 1.50
F 1.55
F 1.60
F 1.70
F 1.80
F 2.00
S 2.00
Ash
% (
ad)
Mas
s %
(yi
eld
)
Float sink fraction
Yield %
FRAC Ash
CUM Ash
10www.mresources.com.au
Washability AnalysisGraphical Display 2
M Resources
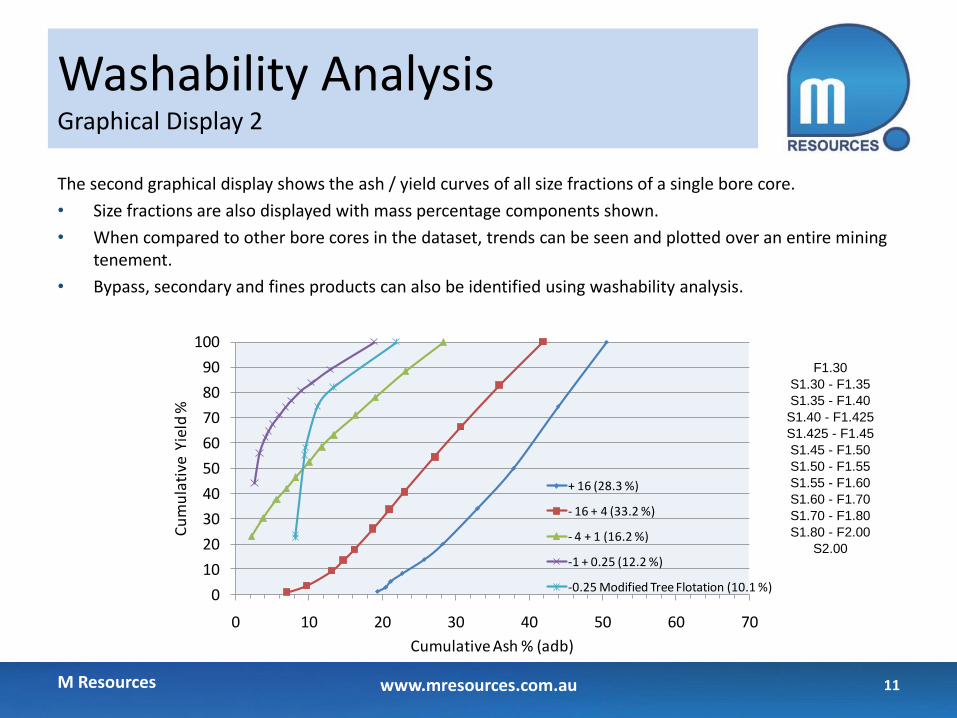
The second graphical display shows the ash / yield curves of all size fractions of a single bore core.
• Size fractions are also displayed with mass percentage components shown.
• When compared to other bore cores in the dataset, trends can be seen and plotted over an entire mining tenement.
• Bypass, secondary and fines products can also be identified using washability analysis.
F1.30
S1.30 - F1.35
S1.35 - F1.40
S1.40 - F1.425
S1.425 - F1.45
S1.45 - F1.50
S1.50 - F1.55
S1.55 - F1.60
S1.60 - F1.70
S1.70 - F1.80
S1.80 - F2.00
S2.00
0
10
20
30
40
50
60
70
80
90
100
0 10 20 30 40 50 60 70
Cu
mu
lati
ve Y
ield
%
Cumulative Ash % (adb)
+ 16 (28.3 %)
- 16 + 4 (33.2 %)
- 4 + 1 (16.2 %)
-1 + 0.25 (12.2 %)
-0.25 Modified Tree Flotation (10.1 %)
11www.mresources.com.au

Mayer Curve Example Four Different Coal Sources
12M Resources
3540455055606570
F 1.30
F 1.35
F 1.40F 1.45
F 1.50F 1.55
F 1.60
F 1.70
F 1.80 F 1.90
F 2.00
S 2.00
0
5
10
15
20
25
30
0 10 20 30 40 50 60 70 80 90 100
Ash
% (
rad
ial)
Yield %
Coal A -8 +1.4 mm
Coal B -50 +25 mm
Coal C -6 +1 mm
Coal D -4 +1 mm
www.mresources.com.au

Mayer CurveExample Single Coal Multiple Size Fractions
55606570
F 1.30F 1.40
F 1.50
F 1.60
F 1.70
F 1.80
F 1.90
F 2.00
F 2.50
0
5
10
15
20
25
30
35
40
45
50
0 10 20 30 40 50 60 70 80 90 100
Ash
% (
rad
ial)
Yield %
-100 +50 mm
-50 +25 mm
-25 +12.5 mm
-12.5 +6.3 mm
-6.3 +3.15 mm
-3.15 +1.0 mm
-1.0 +0.5 mm
-0.5 +0.15 mm
F 1.30
F 1.40
F 1.50
F 1.60
F 1.70
F 1.80
F 1.90
F 2.00
F 2.50
M Resources www.mresources.com.au 13

May-13
AS
RECEIVED
AIR
DRIED
DRY DRY ASH
FREE
Moisture (%): Total 9.0
Proximate Analysis (%) : Inherent Moisture 1.5
Ash 7.9 8.5 8.6
Volatile Matter 23.9 25.9 26.2 28.7
Fixed Carbon 59.3 64.1 65.1Total Sulphur (%): 0.65 0.70 0.71 0.78
Phosphorus (%): 0.021 0.023 0.023 0.03
Ultimate Analysis (%) : Carbon 71.8 77.7 78.9 86.3
Hydrogen 4.6 4.9 5.0 5.5
Nitrogen 1.5 1.7 1.7 1.9
Oxygen by difference 4.6 5.0 5.1 5.54
Sulphur 0.65 0.70 0.71 0.78
Ash Analysis SiO2 51.6 K2O 2.3
(% in dry ash) Al2O3 29.4 TiO2 1.6
Fe2O3 7.2 Mn3O4 0.04
CaO 2.5 SO3 1.9
MgO 1.12 P2O5 1.01
Na2O 0.65 Total 99
HGI: 79
Plastic Properties: CSN 9
Gieseler Plastometer:Plastic Range (Deg C) 89
Maximum Fluidity (ddpm) 10210
Log 10 4.01
Dilatation Max Contraction % -26
Max Dilatation % 214
Total Dilatation % 243
Petrographics (%):Vitrinite 69
Liptinite 2.7
Inertinite 25
Mineral Matter 5.0
Vitrinite Reflectance (% mean) 1.20
Topsize (mm) nominal:
Indicative Product Specification
Specification Sheet
M Resources
Preparation of accurate coal specification sheets or indicative property tables are vital.
• M Resources have prepared numerous coal property tables for coals from every major coal producing region.
• Parameters displayed depend on coal type, data availability and other factors.
14www.mresources.com.au
World Traded Histograms
M Resources
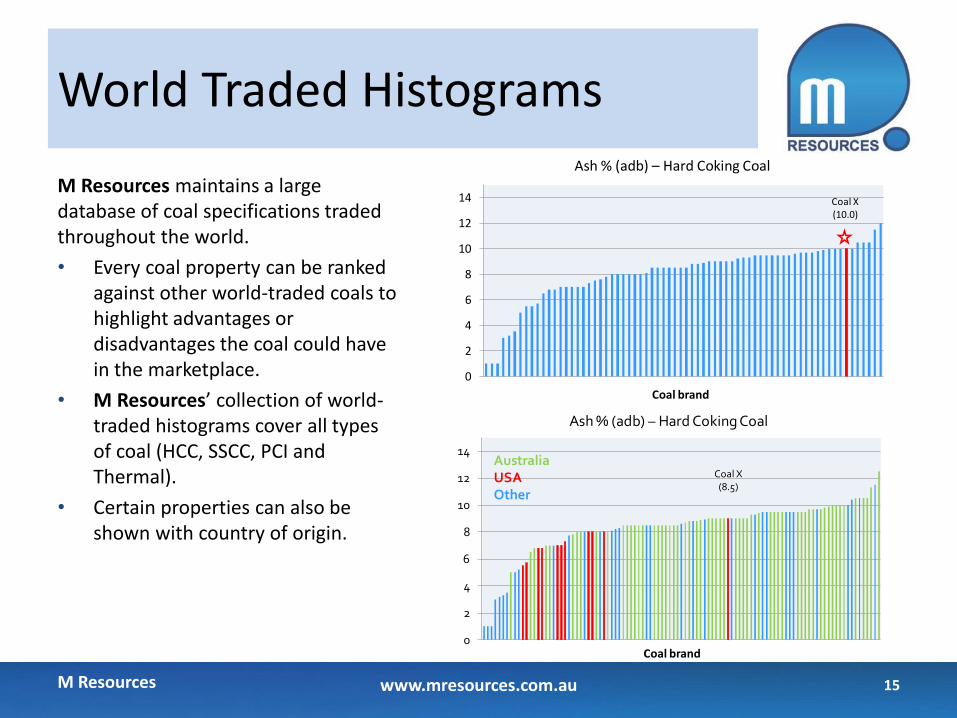
M Resources maintains a large database of coal specifications traded throughout the world.
• Every coal property can be ranked against other world-traded coals to highlight advantages or disadvantages the coal could have in the marketplace.
• M Resources’ collection of world-traded histograms cover all types of coal (HCC, SSCC, PCI and Thermal).
• Certain properties can also be shown with country of origin.
0
2
4
6
8
10
12
14
Coal brand
Coal X(10.0)
Ash % (adb) – Hard Coking Coal
0
2
4
6
8
10
12
14
Coal brand
Coal X(8.5)
AustraliaUSAOther
Ash % (adb) – Hard Coking Coal
15www.mresources.com.au

M Resources MIXMASTER allows simulated blending analysis between any number of coals.
• Unlimited amount of properties available for blending analysis.
• Customizable for thermal or metallurgical (HCC, PCI and SSCC).
• Directory of over 300 coals from around the world already available for blending opportunities.
• Cost analysis of blended coal available based on current spot and/or contract prices or client supplied forward values.
• Graphical analysis of blended coal shown by percent of coal in blend.
M Resources 16
Blending Analysis
www.mresources.com.au

Blending AnalysisGraphical Display
M Resources 17www.mresources.com.au

PCI Value In Use Analysis
M Resources
PCI Value Model - Apr 13 3 MTPA HM
150 kg/tonne PCI
Assumptions BLEND Coke blend VM %dry 26.0 Coke blend TM %ar 8Coke blend ash %dry 9PCI Rate kg/tHM 150PCI Coal Reference Test CoalReplacement Ratio 0.897 0.868All Coke Coke Rate kg/tHM 510Coking Coal Cost FOB US$/t 156.70$ PCI Coal Cost FOB US$/t 141.00$ 134.17 Anthracite Cost FOB US$/t 130.00$ Gas cost US$/MJ 0.010
Coke yield db (wharf) % 77%Coke to BF yield % 72%Coke ash % 11.7
Nil PCI Reference PCI Test CoalCASE 1 CASE 2 CASE 3All Coke PCR =150 LV PCR =150 HV
Coke required kg/tHM 510 375 380Coking Coal required dry kg/tHM 706 520 526Coking Coal required ar kg/tHM 767 565 571Cost of Coking coal US$/tHM 120.20$ 88.49$ 89.51$ Cost of PCI coal US$/tHM -$ 21.15$ 20.12$ Cost of coal US$/tHM 120.2$ 109.6$ 109.6$ $mill at 3 mtpa US$ mill 360.6$ 328.9$ 328.9$
Bennett and Fukushima (2003)1, pioneered a system to rank and evaluate PCI coals based on coke replacement ratio (RR).
• M Resources has access to a model that predicts RR and determines the relative ranking of different coals.
• Singular and blended coals can be synthesized to obtain an equivalent RR which is then fed into a pricing model.
1. Impact of PCI Coal Quality on Blast Furnace Operations , Cairns, 2003
18www.mresources.com.au
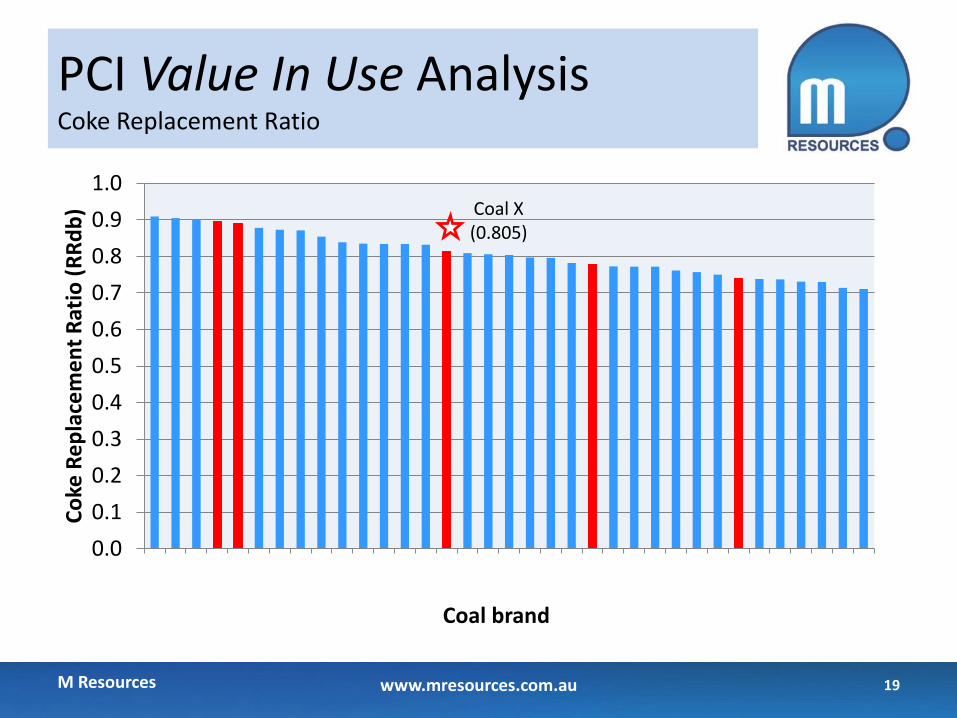
PCI Value In Use AnalysisCoke Replacement Ratio
M Resources
0.0
0.1
0.2
0.3
0.4
0.5
0.6
0.7
0.8
0.9
1.0
Fdb
W-L
Vd
b
W-L
V W
Cd
b
FoxP
_P
FoxP
_S
Co
keJ0
7
W-L
V H
Pd
b
J09d
b
J11d
b
J02d
b
AC
-hvd
b
AP
T-h
vdb
J10d
b
Cad
b
Cap
P
J33d
b
J34d
b
J01d
b
J15d
b
Cd
db
J12d
b
Daw
T
Bd
b
MN
9d
b
AN
R-h
vdb
J08d
b
MN
10
-5d
b
J16d
b
Ger
T
J32d
b
J13d
b
J31d
b
J06d
b
J14d
b
J04d
b
Co
ke R
ep
lace
me
nt
Rat
io (
RR
db
)
Coal brand
Coal X(0.805)
19www.mresources.com.au
Coke Strength (CSR) prediction
M Resources
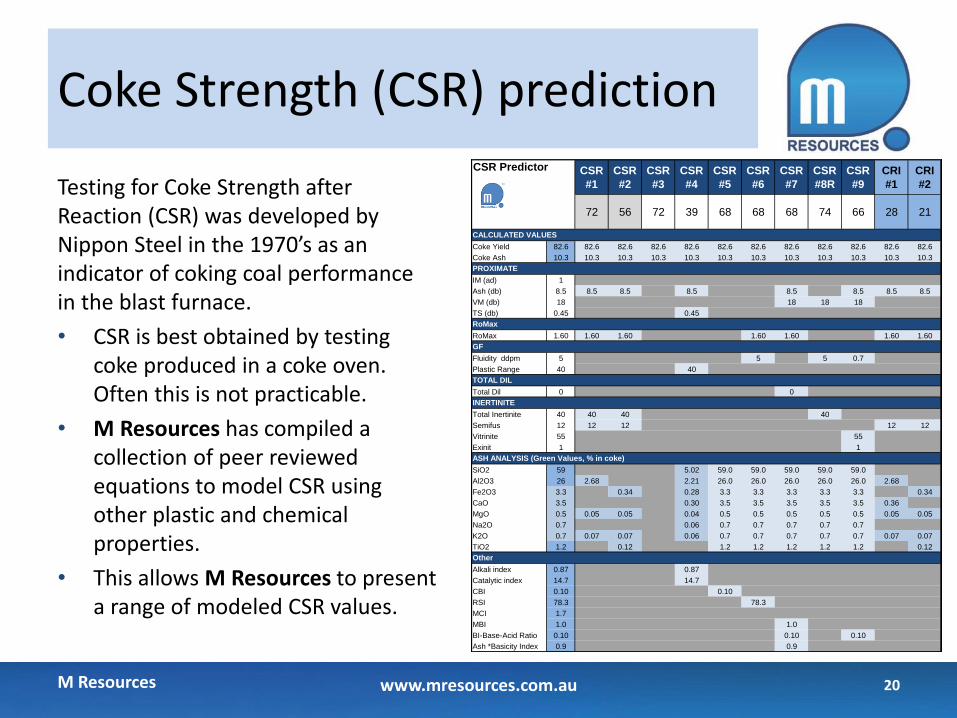
Testing for Coke Strength after Reaction (CSR) was developed by Nippon Steel in the 1970’s as an indicator of coking coal performance in the blast furnace.
• CSR is best obtained by testing coke produced in a coke oven. Often this is not practicable.
• M Resources has compiled a collection of peer reviewed equations to model CSR using other plastic and chemical properties.
• This allows M Resources to present a range of modeled CSR values.
CSR Predictor CSR
#1
CSR
#2
CSR
#3
CSR
#4
CSR
#5
CSR
#6
CSR
#7
CSR
#8R
CSR
#9
CRI
#1
CRI
#2
72 56 72 39 68 68 68 74 66 28 21
CALCULATED VALUES
Coke Yield 82.6 82.6 82.6 82.6 82.6 82.6 82.6 82.6 82.6 82.6 82.6 82.6
Coke Ash 10.3 10.3 10.3 10.3 10.3 10.3 10.3 10.3 10.3 10.3 10.3 10.3
PROXIMATE
IM (ad) 1
Ash (db) 8.5 8.5 8.5 8.5 8.5 8.5 8.5 8.5
VM (db) 18 18 18 18
TS (db) 0.45 0.45
RoMax
RoMax 1.60 1.60 1.60 1.60 1.60 1.60 1.60
GF
Fluidity ddpm 5 5 5 0.7
Plastic Range 40 40
TOTAL DIL
Total Dil 0 0
INERTINITE
Total Inertinite 40 40 40 40
Semifus 12 12 12 12 12
Vitrinite 55 55
Exinit 1 1
ASH ANALYSIS (Green Values, % in coke)
SiO2 59 5.02 59.0 59.0 59.0 59.0 59.0
Al2O3 26 2.68 2.21 26.0 26.0 26.0 26.0 26.0 2.68
Fe2O3 3.3 0.34 0.28 3.3 3.3 3.3 3.3 3.3 0.34
CaO 3.5 0.30 3.5 3.5 3.5 3.5 3.5 0.36
MgO 0.5 0.05 0.05 0.04 0.5 0.5 0.5 0.5 0.5 0.05 0.05
Na2O 0.7 0.06 0.7 0.7 0.7 0.7 0.7
K2O 0.7 0.07 0.07 0.06 0.7 0.7 0.7 0.7 0.7 0.07 0.07
TiO2 1.2 0.12 1.2 1.2 1.2 1.2 1.2 0.12
Other
Alkali index 0.87 0.87
Catalytic index 14.7 14.7
CBI 0.10 0.10
RSI 78.3 78.3
MCI 1.7
MBI 1.0 1.0
BI-Base-Acid Ratio 0.10 0.10 0.10
Ash *Basicity Index 0.9 0.9
20www.mresources.com.au
Gas Fat Coal QF (46)Fat Coal FM (26)
1/3 Coking 1/3JM (35)
Gas Coal QM (45)
Fat Coal FM (36)
Meager Coal PM (11)
Lean Coal SM (13)
WeaklySticky Coal
RN (22)Meager Coal
PS (12)
1/2 Sticky Coal1/2ZN (23)
Fat Coal FM (16)
Coking CoalJM (25)
Coking Coal JM (15)
Lean CoalSM (14)
1/2 Sticky Coal1/2ZN (33)
Coking CoalJM (24)
Gas CoalQM (34)
Gas Coal QM (44)
Gas Coal QM (43)
WeaklySticky Coal
RN (32)
Long Flame CoalCY (35)
0
10
20
30
40
50
60
70
80
90
100
110
0 5 10 15 20 25 30 35 40 45 50
G In
dex
VM (% daf)
y > 25
y < 25
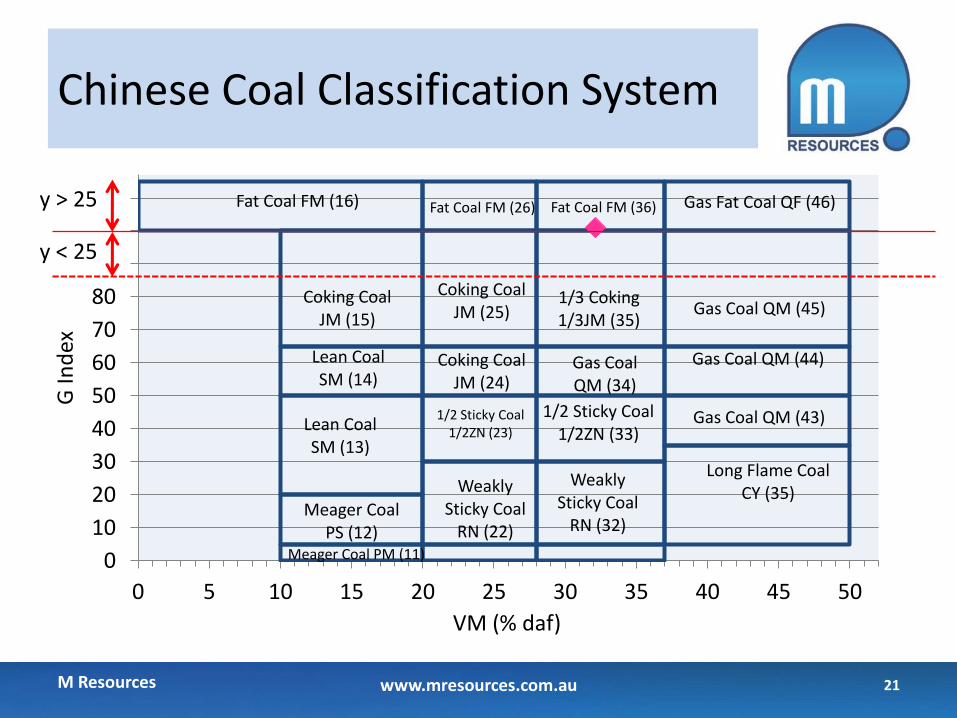
Chinese Coal Classification System
M Resources www.mresources.com.au 21
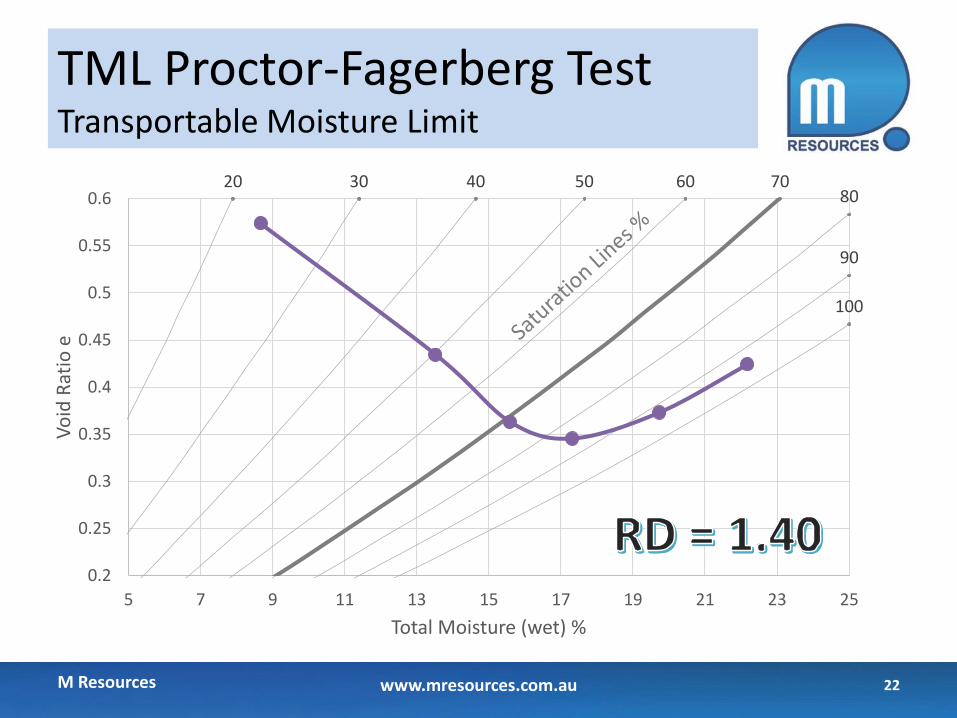
TML Proctor-Fagerberg TestTransportable Moisture Limit
20 30 40 50 60 7080
90
100
0.2
0.25
0.3
0.35
0.4
0.45
0.5
0.55
0.6
5 7 9 11 13 15 17 19 21 23 25
Vo
id R
atio
e
Total Moisture (wet) %
M Resources www.mresources.com.au 22
For additional information regarding:
M Resources 23
• Suite of services • Initial deposit evaluation • Production optimisation studies• Ranking in present market place, and• Technical advice or training
Please contact:Ross Stainlay [email protected] +61 (0) 407 152 315
or Paul Keleher +61 (0) 419 702 605.
www.mresources.com.au