luxury hire car industry amendment regulations 2013
TRANSCRIPT
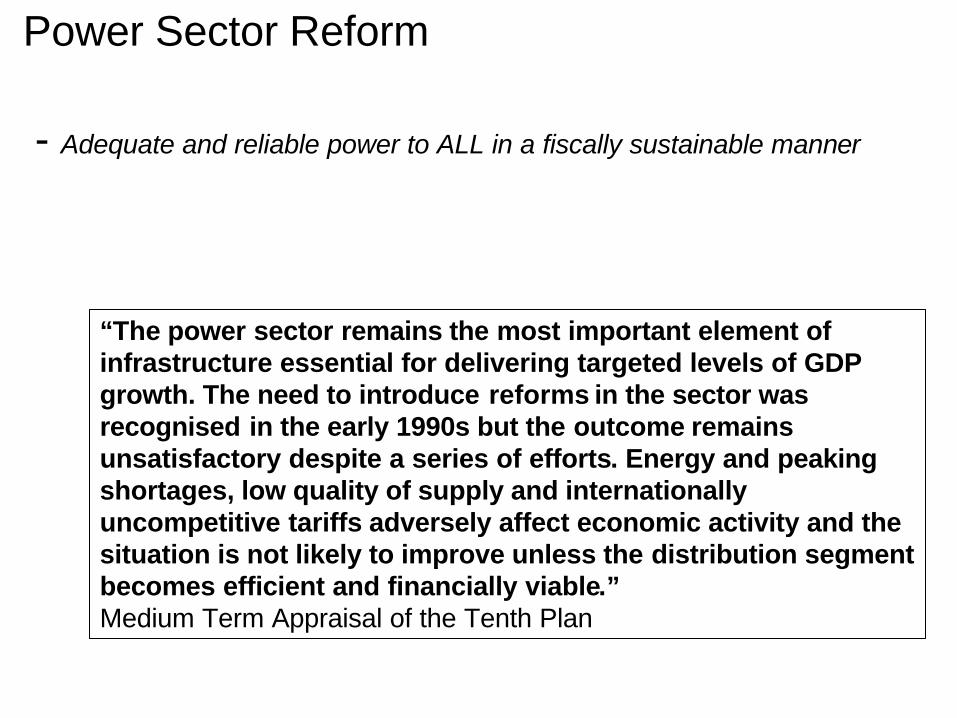
Power Sector Reform
- Adequate and reliable power to ALL in a fiscally sustainable manner
“The power sector remains the most important element of infrastructure essential for delivering targeted levels of GDPgrowth. The need to introduce reforms in the sector was recognised in the early 1990s but the outcome remains unsatisfactory despite a series of efforts. Energy and peaking shortages, low quality of supply and internationally uncompetitive tariffs adversely affect economic activity and the situation is not likely to improve unless the distribution segment becomes efficient and financially viable.”Medium Term Appraisal of the Tenth Plan

The challenge is to stimulate economic growth and promote Human Development in a fiscally sustainable manner
Impact of electricity on economic growth….• 8% increase in GDP growth would require 8.8% growth in electricity Demand• Opportunity cost of unserved power leads to loss in industrial production of Rs
5/kWh to Rs 22/kWh• Farmers lose an estimated Rs 2 to Rs 4 for every unit of power not supplied.. and Human Development• Electricity reduces household drudgery, frees up time (particularly that of women),
provides opportunities for economic entrepreneurship, supports education, health enhancing efforts through refrigeration and pumped water and enable communication with the world beyond
However electricity subsidies have put considerable stress on state fiscal..• Direct and indirect subsidies to the power sector for four large states (AP,
Karnataka, MP and UP) has increased from 6% of state’s own revenue in 1980 to in 16.6% in 2004.
…and Financial Restructuring Plans of the power sector have beeninconsistent with the state fiscal plan
• Classic examples are the UP FRP of 2000, AP 2001, Karnataka 2001

Impact of the Indian Power Sector on state fiscal- A Snapshot
Impact of Indian Power Sector on
Government Finances
Losses of State Power Utilities are 15.3% of states own tax
revenue
Potential increase of
29% in State spending on Social
Sector in absence of SEB losses
Financial losses being incurred by the state
utilities could wipe out the Annual Plan investment in the
Power sector in the country
State Utility losses are
1.0%of India’s GDP
Entire outstanding State Govt. debt can be
repaid in 28 years if financial losses of state utilities are eliminated

Context Reforming the power sector is both a developmental and fiscal imperative
Developmental• Creating income and job opportunities to improve living conditions • Outages and unreliable power supply affect productivity of industry and agriculture and reduces economy’s capacity to create jobs and increase welfare• Electricity is time-saving, it improves health and increases opportunities for education and employment•…..and it increases well being
Fiscal• After Education power subsidies are the single largest item of expenditure in most states. • Electricity subsidies contribute over half of the revenue deficit for most states• Accumulated deficit has eroded government equity many times over• Large over dues to financial institutions (typically with government guarantee) or to government itself

……We might also ask her what she would do with the hours
saved if she did not have to collect firewood. She would surely
smile and tell you that it would indeed be a gift:
“I can look after my children better.”
“ I will cough less, if there is not so much smoke in the house.”
“ I might even have a little time left – to care for myself.”
We might ask her, if electricity was the option, what would she
do? She would beam, and say:
“ My daughter could learn to read and write, so she would not
have to live like me.”
Mieko Nishimizu, Vice President, South Asian Region, World Bank
(in conversation with a woman….)
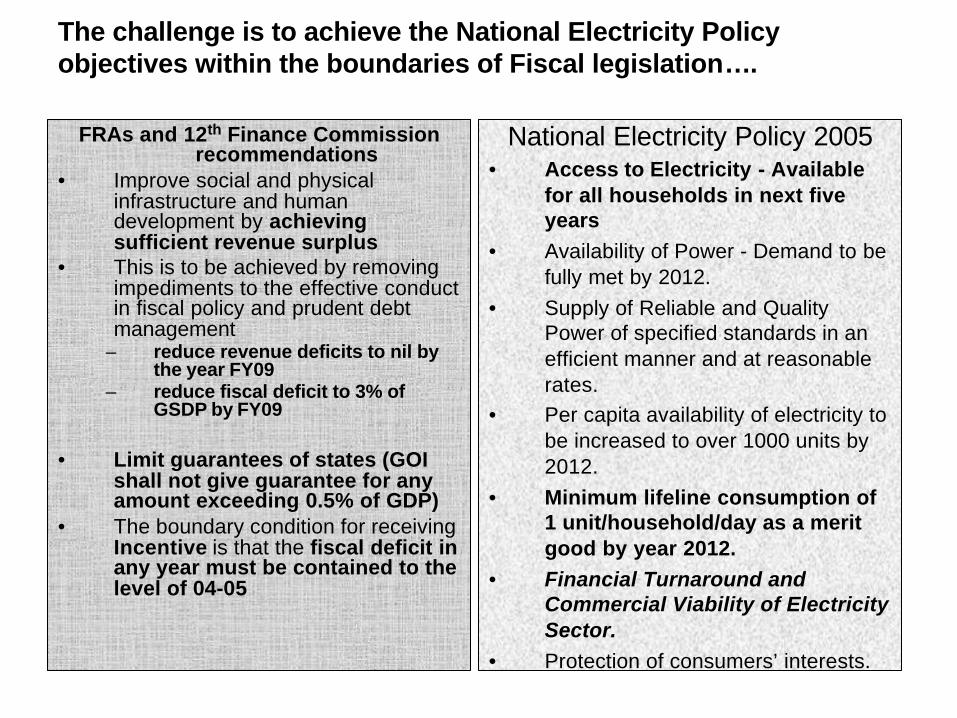
The challenge is to achieve the National Electricity Policy objectives within the boundaries of Fiscal legislation….
FRAs and 12th Finance Commission recommendations
• Improve social and physical infrastructure and human development by achieving sufficient revenue surplus
• This is to be achieved by removing impediments to the effective conduct in fiscal policy and prudent debt management
– reduce revenue deficits to nil by the year FY09
– reduce fiscal deficit to 3% of GSDP by FY09
• Limit guarantees of states (GOI shall not give guarantee for any amount exceeding 0.5% of GDP)
• The boundary condition for receiving Incentive is that the fiscal deficit in any year must be contained to the level of 04-05
National Electricity Policy 2005• Access to Electricity - Available
for all households in next five years
• Availability of Power - Demand to be fully met by 2012.
• Supply of Reliable and Quality Power of specified standards in an efficient manner and at reasonable rates.
• Per capita availability of electricity to be increased to over 1000 units by 2012.
• Minimum lifeline consumption of 1 unit/household/day as a merit good by year 2012.
• Financial Turnaround and Commercial Viability of Electricity Sector.
• Protection of consumers’ interests.

Power sector’s impact on state fiscal is considerable……
Power Sector Subsidies to Agriculture, Compared to Public Expenditure in other Sectors and as a Percentage of State Fiscal Deficit, FY 2004
-
500
1,000
1,500
2,000
2,500
Andhra Pradesh Karnataka Madhya Pradesh Uttar Pradesh0%
20%
40%
60%
80%
100%
120%
140%
160%
180%
200%
Power Subsidies to Agriculture Health Expenditure Irrigation
Education As % of State Fiscal Deficit

…so what ails the sector
Performance• The economic incentives for performance improvement and
the ownership that reacts to these incentives were absent Financial viability• Financial Restructuring Plans were delinked from state fiscal
and were inconsistent with the Regulatory process• Sub National Adjustment loans (SNAL) that incorporated
power sector reforms inter alia, were discontinued ……..and Credibility was lacking in the system in the face of
considerable energy and peak shortages and poor quality of supply
• Envisaged Private investment in generation remained elusive and stymied the state investments in generation
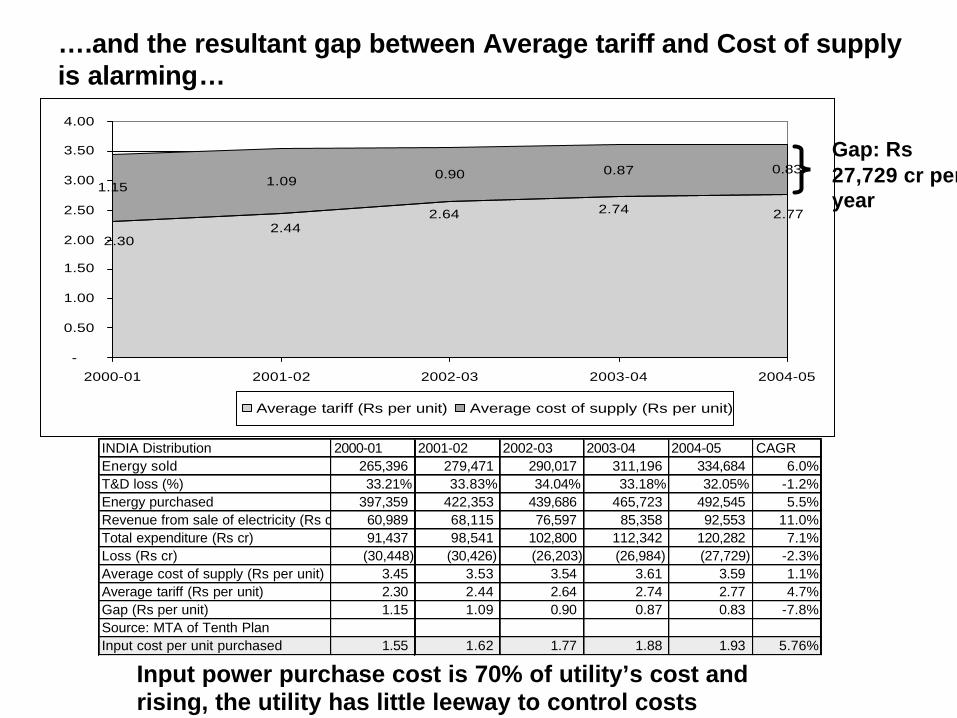
….and the resultant gap between Average tariff and Cost of supplyis alarming…
1.15 1.09 0.90 0.87 0.83
2.74 2.772.642.44
2.30
-
0.50
1.00
1.50
2.00
2.50
3.00
3.50
4.00
2000-01 2001-02 2002-03 2003-04 2004-05
Average tariff (Rs per unit) Average cost of supply (Rs per unit)
Gap: Rs27,729 cr per year
INDIA Distribution 2000-01 2001-02 2002-03 2003-04 2004-05 CAGREnergy sold 265,396 279,471 290,017 311,196 334,684 6.0%T&D loss (%) 33.21% 33.83% 34.04% 33.18% 32.05% -1.2%Energy purchased 397,359 422,353 439,686 465,723 492,545 5.5%Revenue from sale of electricity (Rs cr) 60,989 68,115 76,597 85,358 92,553 11.0%Total expenditure (Rs cr) 91,437 98,541 102,800 112,342 120,282 7.1%Loss (Rs cr) (30,448) (30,426) (26,203) (26,984) (27,729) -2.3%Average cost of supply (Rs per unit) 3.45 3.53 3.54 3.61 3.59 1.1%Average tariff (Rs per unit) 2.30 2.44 2.64 2.74 2.77 4.7%Gap (Rs per unit) 1.15 1.09 0.90 0.87 0.83 -7.8%Source: MTA of Tenth PlanInput cost per unit purchased 1.55 1.62 1.77 1.88 1.93 5.76%
Input power purchase cost is 70% of utility’s cost and rising, the utility has little leeway to control costs
Segment-1
Segment-2A
Segment-2B
Segment-3
…Performance, Financial viability and Credibility would be further stretched by the electrification program in the NEP if the necessary efficiency improvement and generation augmentation plan is not achieved
0%
10%
20%
30%
40%
50%
60%
70%
80%
90%
100%
50% 60% 70% 80% 90% 100% 110%
Village electrification
Hou
seho
ld e
lect
rifie
d in
Ele
ctri
fied
villa
ges
TN
KerelaPunjab
HaryanaKarnataka
AP
Rajasthan
Orissa
UP
WB
India
M'rastraMP
Gujarat
2012 Target
Uttaranchal
HP

…but the Cash Gap (that is the over hang of the existing inefficiency and tariff structure), and Investment to meet NEP objectives requires to be addressed in the Transition period
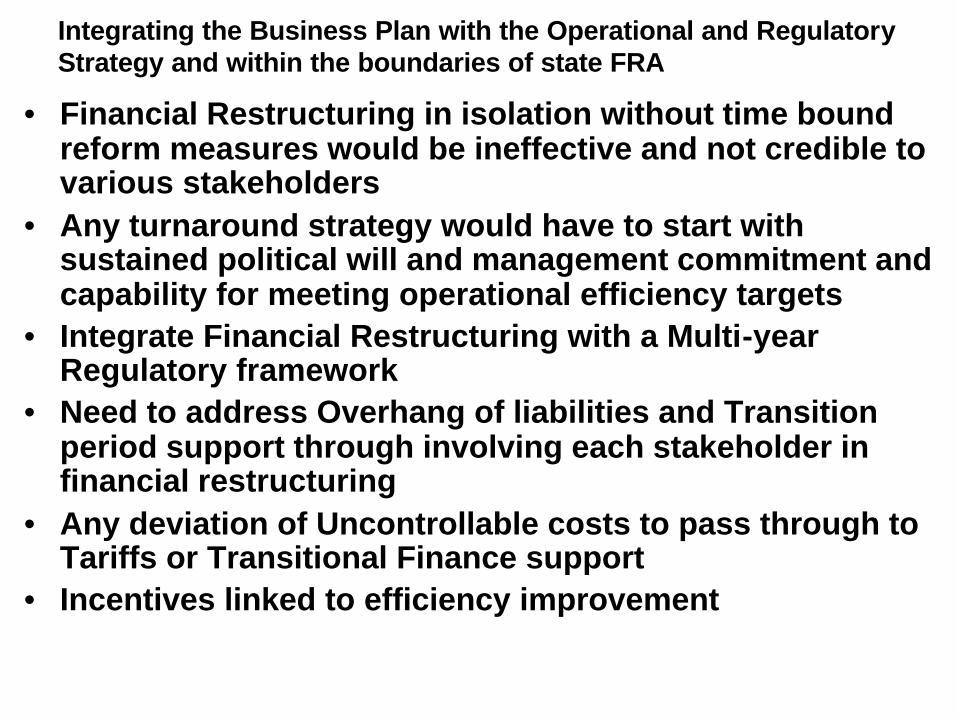
Integrating the Business Plan with the Operational and Regulatory Strategy and within the boundaries of state FRA
Business Plan
Fiscal Stabilization
Essential that the Regulator is part of the process
Integrating the Operational Strategy into the Business Plan
Any deviation on account of uncontrollable costs is pass through
A Long Term Tariff framework linked to Incentives based on Performance
Investment and financing plan to meet NEP objectives
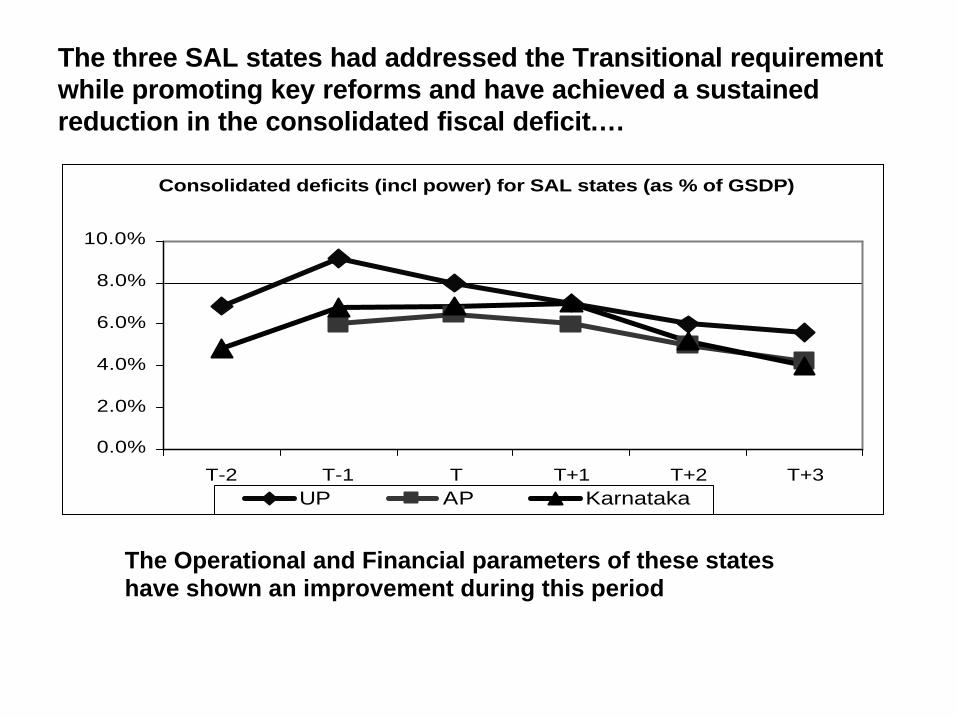
The three SAL states had addressed the Transitional requirement while promoting key reforms and have achieved a sustained reduction in the consolidated fiscal deficit….
Consolidated deficits (incl power) for SAL states (as % of GSDP)
0.0%
2.0%
4.0%
6.0%
8.0%
10.0%
T-2 T-1 T T+1 T+2 T+3UP AP Karnataka
The Operational and Financial parameters of these states have shown an improvement during this period

... Therefore the Institutional requirement and structure of Transitional finance…
• Transition finance linked to a monitorableBusiness Plan
• Routed through a Power Sector Reform Facility for Monitoring and Administering Transitional Finance
• Mitigation measures for state fiscal risk and political risk
• Risk allocation matrix for additional financial requirement due to input cost increase, demand mix change, tariffs deviating from the MYT principles
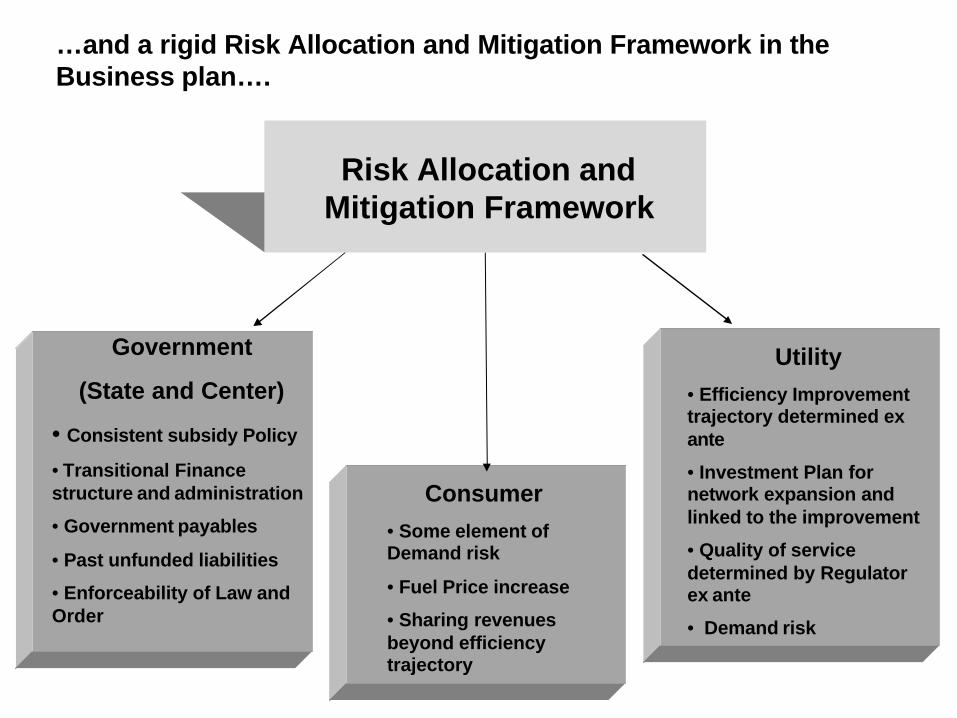
…and a rigid Risk Allocation and Mitigation Framework in the Business plan….
Consumer• Some element of Demand risk
• Fuel Price increase
• Sharing revenues beyond efficiency trajectory
Government
(State and Center)
• Consistent subsidy Policy
• Transitional Finance structure and administration
• Government payables
• Past unfunded liabilities
• Enforceability of Law and Order
Risk Allocation and Mitigation Framework
Utility• Efficiency Improvement trajectory determined ex ante
• Investment Plan for network expansion and linked to the improvement
• Quality of service determined by Regulator ex ante
• Demand risk

2.00
2.50
3.00
3.50
4.00
4.50
2005-06 2006-07 2007-08 2008-09 2009-10 2010-11 2011-12
Average Tariff Cost of supply(Rs per unit)
Therefore the imperative for state specific Business Plans and funding of Transitional finance in the interregnum ‘cause the Gap would require time to be bridged…
Rs per unit 2005-06 2006-07 2007-08 2008-09 2009-10 2010-11 2011-12Cost of supply(Rs per unit) 3.93 4.03 3.97 4.01 3.93 3.83 3.78 Average Tariff 2.66 2.83 2.99 3.16 3.34 3.55 3.78 Revenue (Rs cr) 8,120 9,053 10,044 11,132 12,399 13,838 15,476 Cost coverage 68% 70% 75% 79% 85% 92% 100%
COS: Rs 3.93 per unit
Average tariff: Rs 2.66 per unit
Transitional Finance Requirement: Rs.16,551 cr
Rs.3.78 per unit

… the scale of Performance Improvement, Investment and Transition support Requirement for Credibility (100% Access and quality supply) and Financial turnaround
Transitional Finance RequirementRs.16,551 cr
Total Support RequirementRs.50,888 cr
Investment Support RequirementRs.34,337 cr
GOUP Equity(Rs. 9,815 cr)
FI Loans(Rs. 17,343 cr)
GOI Grant(Rs. 7,179 cr)
Private investment RequirementRs.27,395 cr
Tentative Business Plan for Uttar Pradesh
State government subsidy
to meet the difference between efficient COS and
Tariff
Central government grant
to meet the difference between COS and
efficient COS till they converge
% 2005-06 2006-07 2007-08 2008-09 2009-10 2010-11 2011-12Collection Efficiency 85.3% 87.3% 89.3% 91.3% 92.8% 94.3% 95.8%T & D Loss 32.4% 30.9% 28.4% 25.9% 23.4% 20.9% 20.4%A T & C Loss 42.3% 39.7% 36.1% 32.4% 28.9% 25.4% 23.8%

Thank You

Private sector investment in generation remained elusive and hasstymied state sector investment….
MW9th Plan Target
9th Plan Achievement
10th Plan Target 2002-03 2003-04 2004-05
10th Plan Actual up to Mar 05
2006-2007 Projection
Center 11,909 4,504 22,832 1,210 3,035 3,630 7,875 9,222 State 10,747 9,450 11,157 1,114 819 1,443 3,376 7,727 Private 17,588 5,061 7,121 548 232 173 953 2,137 Total 40,244 19,015 41,110 2,872 4,086 5,246 12,204 19,086

The three SAL states have achieved a sustained reduction in the consolidated fiscal deficit….
Consolidated deficits (incl power) for SAL states (as % of GSDP)
0.0%
2.0%
4.0%
6.0%
8.0%
10.0%
T-2 T-1 T T+1 T+2 T+3UP AP Karnataka
The retrospective (by The World Bank) also argues that the SAL’s have helped promote some key reforms in the recipient states, in a wide range of areas from public enterprise reform to industrial deregulation
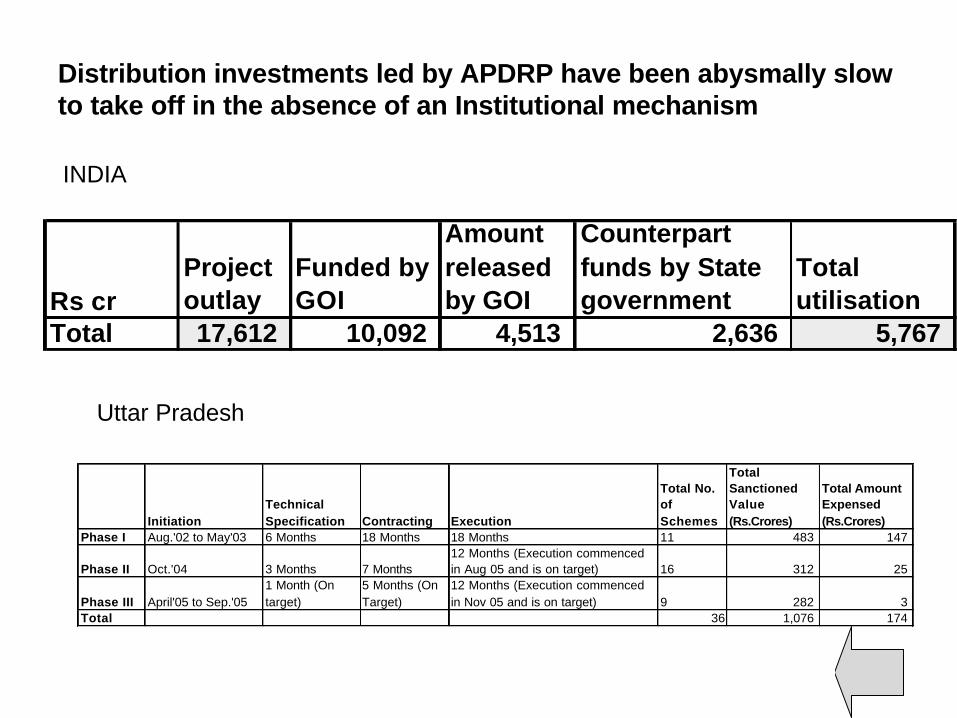
Distribution investments led by APDRP have been abysmally slow to take off in the absence of an Institutional mechanism
Rs crProject outlay
Funded by GOI
Amount released by GOI
Counterpart funds by State government
Total utilisation
Total 17,612 10,092 4,513 2,636 5,767
InitiationTechnical Specification Contracting Execution
Total No. of Schemes
Total Sanctioned Value (Rs.Crores)
Total Amount Expensed (Rs.Crores)
Phase I Aug.'02 to May'03 6 Months 18 Months 18 Months 11 483 147
Phase II Oct.'04 3 Months 7 Months12 Months (Execution commenced in Aug 05 and is on target) 16 312 25
Phase III April'05 to Sep.'051 Month (On target)
5 Months (On Target)
12 Months (Execution commenced in Nov 05 and is on target) 9 282 3
Total 36 1,076 174
INDIA
Uttar Pradesh

"Investors need confidence, consumers need protection".
“The overall experience of the past decade suggests that
independence is not enough. Independence must also be combined
with an explicit and binding regulatory contract established prior to
privatization. For most developing countries, the Anglo- American
tradition of regulatory independence must be combined with the
French tradition of detailed regulatory contracts. In other words, the
single most important lesson of the last ten years is that independence
must be “backstopped” by a regulatory agreement that goes beyond
general principles. And the key element of the regulatory contract
should be a well-specified, multi-year tariff-setting system that is
required by law and specified in concessions, licenses and other
regulatory instruments (hard law).”
Regulation by Contract: A new way to privatize Electricity
Distribution? Tonci Bakovic, Bernard Tenenbaum and Fiona Woolf. Energy
& Mining Sector Board Discussion Paper Series of the World Bank
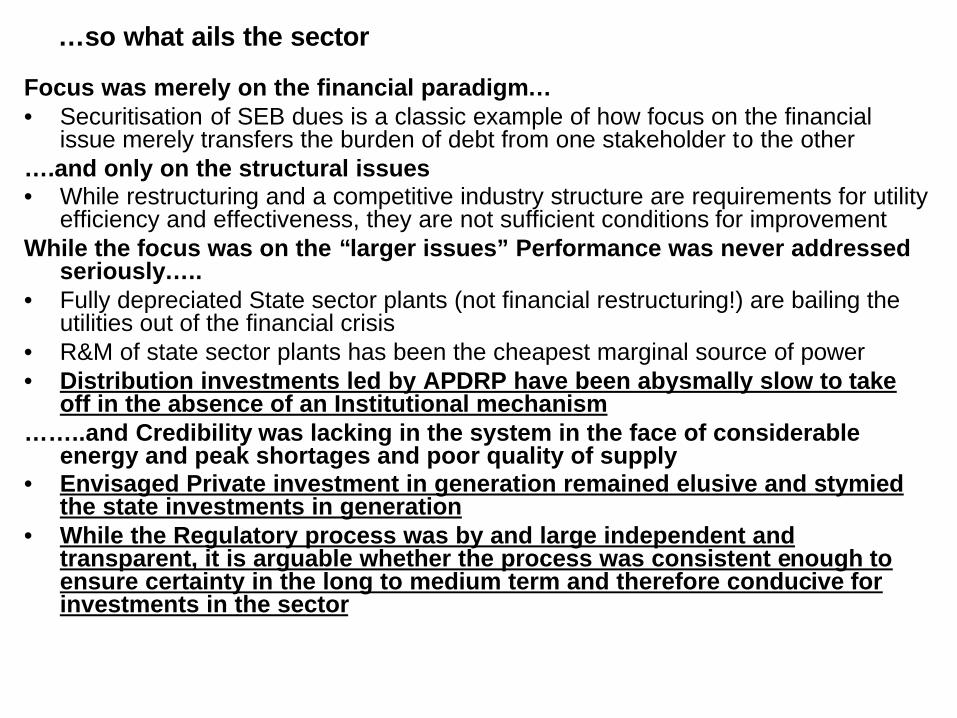
…so what ails the sector
Focus was merely on the financial paradigm…• Securitisation of SEB dues is a classic example of how focus on the financial
issue merely transfers the burden of debt from one stakeholder to the other….and only on the structural issues• While restructuring and a competitive industry structure are requirements for utility
efficiency and effectiveness, they are not sufficient conditions for improvementWhile the focus was on the “larger issues” Performance was never addressed
seriously…..• Fully depreciated State sector plants (not financial restructuring!) are bailing the
utilities out of the financial crisis• R&M of state sector plants has been the cheapest marginal source of power• Distribution investments led by APDRP have been abysmally slow to take
off in the absence of an Institutional mechanism……..and Credibility was lacking in the system in the face of considerable
energy and peak shortages and poor quality of supply• Envisaged Private investment in generation remained elusive and stymied
the state investments in generation• While the Regulatory process was by and large independent and
transparent, it is arguable whether the process was consistent enough to ensure certainty in the long to medium term and therefore conducive for investments in the sector

…therefore the imperative for state specific Business Plans that rigorously establish the interventions to improve Performance and Credibility
Cash operating costs
Working capital requirements
Interest on incremental debt
Repayments of incremental debt
Interest on existing debt
Repayments of existing debt
Equity required for capital expenditure
9,900
1300
550
500
400
500
800
Rs.
cr
To
tal C
ash
Req
uir
emen
t
13,950
Note: Example of a typical large state
Operational efficiency improvement, through reduction in system losses, working capital management and improvement in Collection efficiency
Revenue enhancement, through a combination of load growth, improvement in consumer mix and tariff increases
Rationalisation of capital expenditure to achieve the desired operational results through greater efficiency in capital spending
Integrating the Business Plan with the Operational and Regulatory Strategy and within the boundaries of state FRA
• Financial Restructuring in isolation without time bound reform measures would be ineffective and not credible to various stakeholders
• Any turnaround strategy would have to start with sustained political will and management commitment and capability for meeting operational efficiency targets
• Integrate Financial Restructuring with a Multi-year Regulatory framework
• Need to address Overhang of liabilities and Transition period support through involving each stakeholder in financial restructuring
• Any deviation of Uncontrollable costs to pass through to Tariffs or Transitional Finance support
• Incentives linked to efficiency improvement
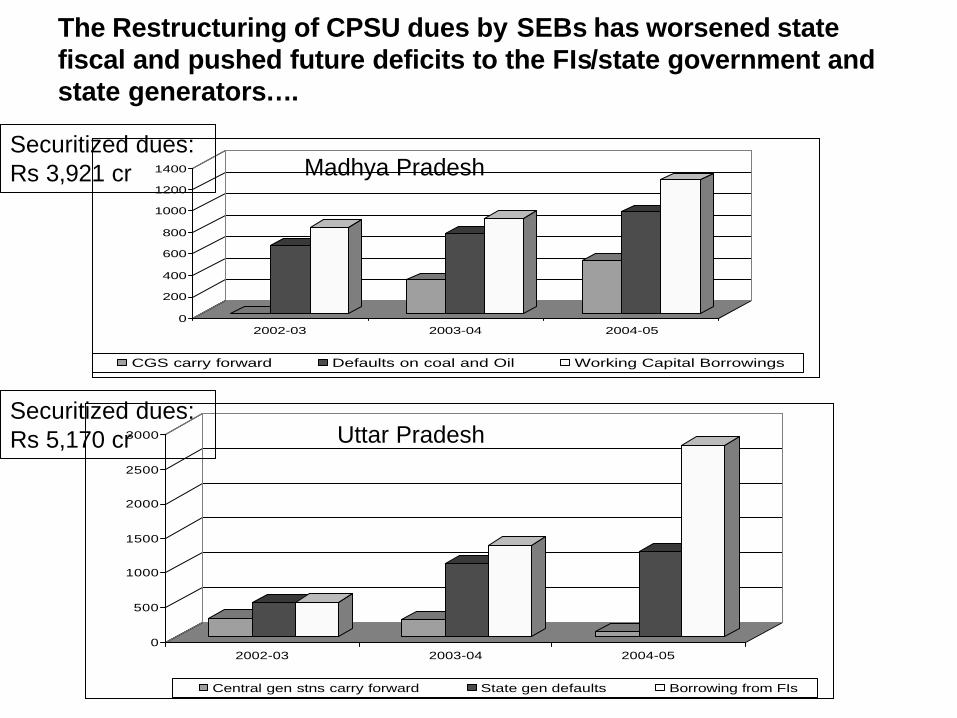
The Restructuring of CPSU dues by SEBs has worsened state fiscal and pushed future deficits to the FIs/state government and state generators….
0
500
1000
1500
2000
2500
3000
2002-03 2003-04 2004-05
Central gen stns carry forward State gen defaults Borrowing from FIs
Uttar PradeshSecuritized dues: Rs 5,170 cr
0
200
400
600
800
1000
1200
1400
2002-03 2003-04 2004-05
CGS carry forward Defaults on coal and Oil Working Capital Borrowings
Securitized dues: Rs 3,921 cr Madhya Pradesh