luth!research!whitepaper! … · microsoft word - luth research whitepaper mapping the intricate...
TRANSCRIPT
Luth Research Whitepaper
Mapping the Intricate Paths to Purchase in Big Digital Data

2
Today’s marketers and brand managers have access to a wealth of diverse digital data from partners ranging from research companies, data brokers, to advertising networks. The advent of accessible digital behavior data in recent years has meant that we no longer have to rely on recall to understand how consumers move about the web as they make their purchase decision. An important advantage of leveraging passive digital tracking data is that all of the rich nuances and variation in website visits can be readily available. How to navigate this extensive web of connections and discern relevant patterns is a critical task that both marketers and researchers are called on to solve. This whitepaper describes a use case of applying network analysis to a big data set of digital behaviors pertinent to online shopping activities in the computer category. The digital data is drawn from Luth Research’s ZQ Intelligence™, a cross-‐platform measurement technology harvesting data across computer and mobile devices from the company’s well established consumer community. The discussion of the key practices and learnings from this use case illustrates how network analysis techniques and visualization can be used to unlock the power of having access to big digital data.
Simplifying the Journey The first course of action in tackling the complexity of big digital data is to simplify. Simplification means adopting many of the tools used in network analysis to identify common patterns. This means, for example, categorizing site visits into well-‐defined groups by frequency of visits between any two sites. This can also be directional by coding the sequence of visits. For example, do individuals frequently leave site A to visit site B or vice versa.
3
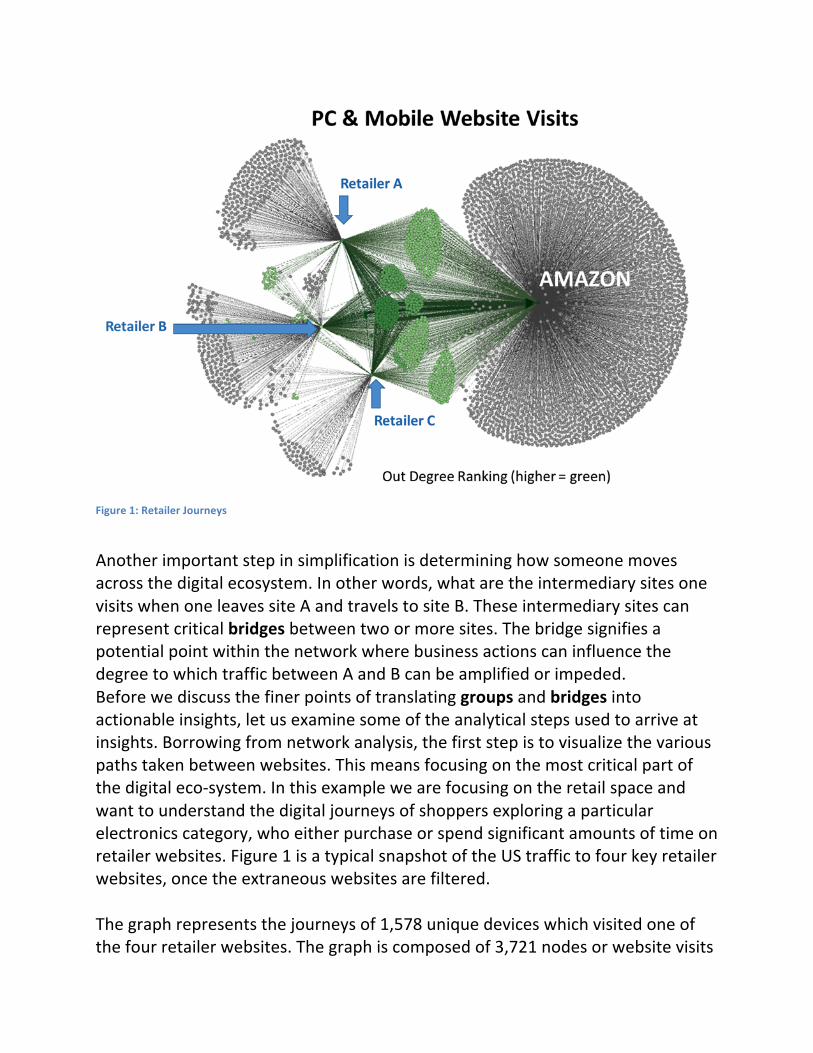
Figure 1: Retailer Journeys
Another important step in simplification is determining how someone moves across the digital ecosystem. In other words, what are the intermediary sites one visits when one leaves site A and travels to site B. These intermediary sites can represent critical bridges between two or more sites. The bridge signifies a potential point within the network where business actions can influence the degree to which traffic between A and B can be amplified or impeded. Before we discuss the finer points of translating groups and bridges into actionable insights, let us examine some of the analytical steps used to arrive at insights. Borrowing from network analysis, the first step is to visualize the various paths taken between websites. This means focusing on the most critical part of the digital eco-‐system. In this example we are focusing on the retail space and want to understand the digital journeys of shoppers exploring a particular electronics category, who either purchase or spend significant amounts of time on retailer websites. Figure 1 is a typical snapshot of the US traffic to four key retailer websites, once the extraneous websites are filtered. The graph represents the journeys of 1,578 unique devices which visited one of the four retailer websites. The graph is composed of 3,721 nodes or website visits

4
covering visits before and after a visit to one of the specified retailers. The coloration is based on outbound activity, where the green constitutes more outbound activity to multiple sites than the grey. The thickness of lines indicates the amount of traffic between any two sites, and arrows indicate the dominant direction of the traffic. Unlike the static image in Figure 1, visualization tools give the analyst the ability to zoom to specific areas in the network graph and view the graphic representation of directionality and number of visits for each individual website. Visualization can be an important first step in the analysis of digital path to purchase, but the addition of key metrics rounds out our understanding of how individual websites relate to groups and act as bridges. While listing the types of metrics available on many visualization and network analysis tools is beyond the scope of this article, the following example underscores the importance of combining both the visual and measurement tools available to the analysis. In the case of Figure 1, it is apparent that Amazon dominates the network in terms of overall visits. However, each retailer has their own group of websites that have a singular relationship with only one retailer. Conversely, there are a number of websites (colored green) that bridge multiple retailer sites. Just looking at the graph in Figure 1 suggests difficulties differentiating the relationship of non-‐Amazon retailers to the rest of the network. The non-‐Amazon sites all have unique groups feeding their website, and all have some degree of connection with the intermediary sites. It is not clear, relying solely on the graphic, how relevant the constellation of intermediary websites are to each retailer. Using metrics like the authority score (based on the HITS algorithm) or the eigenvector centrality score, it becomes apparent that retailer B is very different from retailers A and C, and shares similarities with Amazon in how key intermediary sites relate. The face validity of these metrics is substantiated when it is understood that Retailer B is a specialty store and many of the specialized brands and related information sites have a disproportionately stronger relationship with retailer B that any of the other three retailers. From an insight perspective, being able to test whether or not a specialized website is being recognized throughout the network provides important validation of both messaging and market positioning. What this type of analysis tells the owners of retailer B’s strategy is how well related information sites are helping shoppers get

5
to their site. Similarly, points within the network where the website is comparatively weak at maintaining a connection can be easily established.
Groups and Bridges Now that we have discussed how path to purchase can be analyzed, it is important to return to the question of insights. In other words, how do groups and bridges help the analyst assess marketing and positioning strategies?
Figure 2: Intermediary Groups
It is important to note that each of the nodes in Figure 2 represents a specific domain. As groups of nodes or sites, intermediaries represent important opportunities or threats in the purchase journey. The groups feeding into only one retailer on the left of Figure 2 are relatively secure. They are indicating a more direct path to a given retailer. Intermediary sites, however, denote a point of vacillation or a potential tipping point that influences a range of paths that a shopper might use. As the analyst plumbs the nature of specific websites, it becomes clearer that retailer B has a particular relationship between visits to advisory and review sites that is not shared with other retailer sites. Some of the bridging groups identified in Figure 2, groups X, Y and Z, have stronger relationships between one specific retailer and Amazon. These intermediary sites form bridges between a specific retailer and Amazon. They show little or no interaction between non-‐Amazon retailers. The fundamental role

6
they play is a stopover site or a choice point between a given retailer and Amazon. Conversely, the intermediary groups listed as W form bridges between multiple retailers and with Amazon. The sites in group W include search engines, social media (e.g., Facebook), and general communication traffic like online email platforms. For this particular example, there is considerable social media activity prior to Amazon visits. This is less pronounced for the other retailer sites. However, under closer inspection, category specific search activity is more evenly spread between all of the retailers, with a more even match between Amazon and retailer B. This is certainly implicit in metrics like the authority score, which represent the more elevated path between category specific searches and retailer B.
Drilling into Segment Journeys: Power of Filtering Filtering data depicted in the network graphic provides another important way to look at paths, and the groups and bridges that comprise that journey. As suggested in the discussion above, filtering for category specific activity in search or relevant site content, provides deeper insights into the relevance of particular journeys through the digital eco-‐system. Sometimes this outlook can change dramatically if the analyst focuses on the journey of a single demographic. The advantage we have at Luth is that the digital path of a device(s) can be tied to an individual in the data collected. This means that this same individual can be tied to demographic categories and all relevant survey data. The result is a powerful ability to recreate network graphics and website metrics based on very specific shopper segments. This is a critical tool for analysts that need to evaluate existing targeting strategies or want to understand how effectively a client has aligned their marketing and partnering strategies with the behavior of key customer segments. Setting up filters and rerunning group and bridge analysis helps isolate and identify the websites in groups and bridges that differentiate one market segment from another.

7
Generating Insights on Path to Purchase Analysis There are a number of key points to remember when using the approach outlined in this article to analyze path to purchase. First, groups of websites require close individual inspection before making generalizations. This means balancing the visualization of the relationship of groups to key websites, with metrics that give a deeper understanding of the nature of individual website relationships. Second, it is important to focus on finding the right intermediary websites. Delving into a cluster of websites that form a bridge is a critical first step. This needs to be followed up with a closer inspection of individual websites and how they connect with multiple sites – what makes them a key touchpoint on a journey. Filtering is the final point to remember when analyzing any path. While overall digital activity provides a generalized sense of a digital eco-‐system, it is the details about specific paths that are going to be the leavening used for both strategy and tactical recommendations. In other words, look at journeys from multiple perspectives. This means focusing on activity that is more easily linked to the shopping category under investigation. Using filters is also critical to ensure that variation in journeys for different customer segments can be used to identify misalignment in existing marketing and campaigns. In summary, applying network analysis and similar techniques provides unique value in decoding complex consumer behaviors along the journey to a purchase decision. Luth Research not only offers an unparalleled digital behavior data collection platform, but also leads in developing advanced analytical frameworks to enable marketers to make sense of the ever-‐changing data with ease and rigor.