lubricating and transformer oil analysis · 2018-02-25 · analytical ferrography this technique is...
TRANSCRIPT

Lubricating and
Transformer Oil Analysis By
www.oas-online.co.uk
Why oil analysis?
To save money and improve reliability
How?
As part of Condition Based (CBM) and Reliability Centred (RCM) Maintenance pro-
gramme
By maintaining oil quality and reducing lubrication related wear and failure rates
By extending oil drain intervals
By preventing ingress of contamination and maintaining cleanliness levels
By monitoring varnish potential (MPC) and extending remaining useful life through
active anti-oxidant management (RULER)
By directing limited maintenance resources effectively
By scheduling maintenance to take advantage of planned shutdowns and pre-
venting undesirable outages
By rationalising oil stocks and reducing spares inventory
By ensuring continued safe and reliable operation of critical assets
Why us?
Our aim is to help you make the most of oil analysis through
technology, training, advice and support
Proven track record of high quality analysis with 20 years’ experience in the field
Independent advice without conflicts of interest (we are not a supplier of oil or
maintenance services)
A comprehensive range of tests for evaluating oil and plant condition including in
house Varnish Potential measurement and Analytical Ferrography
Comprehensive, visual and informative multi format reports with full featured web
software and 3rd party export format support
Fast analysis turnaround
Service tailored to your requirements with multiple options on sample kits, labels,
packaging and shipping

www.oas-online.co.uk
Lubricating oil analysis Oil is the lifeblood of industrial machinery. It lubricates, coats
and protects components, removes heat, insulates and serves
a multitude of other functions. Over the years oils have
evolved into complex chemical compounds with many options
for base stocks and additives. Together these work to achieve
the desired functions.
Oil:
Forms a fluid film between surfaces
Acts as coolant in removing heat
Carries away contaminants
Acts as a hydraulic medium
Additives:
Protect against wear of highly loaded parts
Protect against rust and corrosion
Protect against accumulation of sludge and var-nish
Resist aeration and foaming
Resist or aid emulsion formation
These functions can be disrupted through
Contamination with:
solids – dirt, wear metals, rust, carbon
liquids – water and process fluids, other oils, lubricant supplements
gasses – process gases (refrigerants, hy-drocarbons) and aeration
Depletion of inhibitor and anti-wear additives (additives used up to stop oil degradation and to protect machine surfaces from rust and wear)
The fluid film can be disrupted by overloading, with common causes including improper fitting and misalignment of bearings
50 to 70% of failures are related to lubrication, contamination,
inadequate maintenance and overloading.
Oil analysis can identify the above abnormal conditions and
predict wear. When used to inform maintenance activity it can
help improve machine efficiency, minimise abnormal wear,
prevent failure and related stoppages and make the entire
maintenance process more efficient.
The following pages detail some of the typical test suites to-
gether with some of the additional tests commonly required
for a more detailed assessment of the oil’s condition and the
wear situation.
Oil analysis is a proven technology and can deliver savings
many times the cost of the programme. The best examples
show benefits of up to 10 times the programme cost. When
using an established commercial laboratory it requires no up-
front capital expenditure and can be designed to fit specific
requirements of the end user.
Here at STS/OAS we aim to deliver high quality analysis, but
also to advise on best lubrication practice and aid our custom-
ers with advice and guidance to ensure that maximum possible
value is derived from the programme. It’s not just the analysis
– it’s what you do with it that counts!

www.oas-online.co.uk
Package A analysis suite This suite is perfect for oil samples from Gearboxes, Pumps,
Compressors and Industrial Bearings.
It comprises the following tests:
Viscosity
A measure of fluids resistance to flow. Often defined as an
ISO or SAE viscosity grade (such as ISO VG 220 or SAE
15W/40). Typically measured at 40 or 100oC.
Each application will have a viscosity range suited to the
task. Too high a viscosity can lead to lubricant starvation,
wear in circulating pumps, increased temperatures and
reduced efficiency. If viscosity is too low, the components
will not be sufficiently separated resulting in excess friction
and causing wear on the machinery.
A change in viscosity could be due to:
Contamination with water/fuel/solvents/very
small particles
Oxidation or ageing of the oil
Incorrect oil
Mechanical shearing of the oil
Acidity or Total Acid Number
Oil oxidizes over time and becomes more acidic indicating
the age of the oil. If the oil is too acidic it can damage metal
components and further accelerate the ageing process.
A rapid increase in the Acid Number may be due to:
Severe oxidation (often caused by over-
heating)
Depletion of additive package
Top up with a large volume of incorrect oil
with a much higher base acidity e.g. hydraulic
oil
Contamination with process fluids; or in case
of engine oils with combustion products
Water content
Excess water in the oil reduces the lubricating effectiveness
by disrupting the oil film, accelerates corrosion (i.e. rusting
of iron and steel surfaces), depletes and/or degrades addi-
tives and accelerates the aging (oxidation) of oil. Where
large quantities of water are present oil may become emul-
sified. The emulsions can combine with insoluble oxidation
products to form sludge which impairs the operation and
reliability of equipment. In addition excessive water if pre-
sent as free water can promote bacteria growth or form
hard deposits on bearing surfaces.
An increase in water content may be due to:
Leaking covers on equipment
Leaking oil coolers
Excessive leaking turbine gland steam seals
Condensation
Using water contaminated fluid for topping
up
Particle Quantifier Index (PQ)
A measure of total magnetic ferrous debris in the sample
irrespective of particle size.
Does not detect non-magnetic ferrous debris e.g. rust.
Combine with Elemental Analysis and ISO Code for compre-
hensive assessment of the wear situation.
Elemental Analysis
Optical Emission Spectroscopy is used to measure the con-
centration of over 20 different elements in the oil. These
include wear metals, additives and contaminants.
By monitoring wear metal concentrations the wear rate and
its origin can be established. Trending additive levels en-
sures that the right oil is used and that it remains suitable
to the task, while measuring levels of contaminants helps
prevent severe wear and loss of function.

www.oas-online.co.uk

www.oas-online.co.uk
Package B analysis suite This suite comprises all of the tests present in Package A
and adds the determination of oil’s cleanliness as described
by the ISO Cleanliness Code.
This package is the routine suite for hydraulic and turbine
oils, as well as for any systems where high cleanliness levels
are required. It adds a lot of detail about the types of wear
particles and contaminants in the oil. Together with PQ In-
dex and Elemental Analysis it delivers a comprehensive
overview of the wear situation.
The ISO 4406 Cleanliness Code is a coding system relating
the quantity of particles in the different size brackets to
specific code numbers, making analysis of cleanliness levels
much more straightforward.
The first number in the code refers to particles >4µm, the
second to particles >6µm and the third to particles >14µm.
So an ISO Cleanliness Code of 18/16/13 translates to con-
tamination level of between 1300 and 2500 particles >4µm,
between 320 and 640 particles >6µm and 40 to 80 particles
>14µm per ml.
Other commonly used coding systems are NAS 1638 and
SAE AS 4059.
There are several ways of obtaining the particle count with
the most common being instrumental particle counting and
the patch test method.
Most instrumental particle counters relate a change in the
amount of light (either visible or laser) transmitted through
the fluid into a particle count using a stored calibration.
Others measure a pressure drop as the oil is passed through
a series of sieves.
Another approach is to pass the oil through a filter mem-
brane and with the aid of microscopy to either count the
deposited particles or perform a comparison with reference
slides.
The advantage of the latter approach is that, as well as ob-
taining the ISO Code, the types of wear and contamination
particles can be examined and captured, giving further in-
sight into the types of wear or contamination. This method
is also insensitive to air bubbles and water droplets, which
can interfere with the readings of the instrumental particle
counters.
We use the patch test to obtain the majority of the ISO
Code readings and the instrumental particle counters for
particularly clean fluids, where manual counting does not
offer sufficient sensitivity.
Number of particles per ml
Range Number
More than Up to and including
24 80000 160000
…
18 1300 2500
17 640 1300
16 320 640
15 160 320
14 80 160
…
6 0.32 0.64 ISO 21/19/17 ISO 16/14/11

www.oas-online.co.uk

www.oas-online.co.uk
Analytical Ferrography
Analytical Ferrography is a technique for depositing and
analysing wear particles contained in an oil or grease sam-
ple.
The sample is deposited onto a glass slide, with the parti-
cles trapped by strong magnets and the oil washed away
with a suitable solvent. Both linear and rotary particle dep-
osition systems exist. At STS preference is given to a rotary
system, which has been developed at the company. It en-
sures good separation of particles over the three rings, with
particles also being sorted by size with the larger particles
settling out on the inner ring.
Once deposited the particles are analysed by a metallurgist,
who is able to report on the relative quantities, types and
sizes of particles present. A Particle Quantifier Index of the
slide is also recorded. All of this is taken into account to
produce a comprehensive report on the wear rate and situ-
ation.
Scanning Electron Microscopy
Scanning Electron Microscopy with Energy Dispersive X-Ray
(SEM-EDX) is used to interrogate individual particles and
obtain their elemental composition. The particles can be
deposited onto a filter membrane as part of the ISO Code
determination or collected from Ferrography slides.
This technique is particularly useful for the larger particles
which cannot be processed via conventional elemental
analysis (such as ICP-OES).
Filter Debris and Magnetic Plug De-
bris Analysis
Filters perform an important function in capturing wear
debris and contaminants and preventing their spread
throughout the system. A similar function is performed by
magnetic plugs. Both can serve as important depositories of
information about the wear rate and situation. The debris
can be extracted from the filters and plugs with a detailed
examination then performed. This typically involves micros-
copy and elemental analysis, although Analytical Ferrogra-
phy and SEM-EDX analysis can also be carried out to further
enhance the report.
Fibre Count
Condition of composite bearings can be assessed through
monitoring the quantities of fibres in oil.
An example of such application is marine stern tube bear-
ings.

www.oas-online.co.uk

www.oas-online.co.uk
Oil Oxidation, Anti-oxidant Addi-
tives and Varnish Potential, Other
Tests
Oil oxidation is an inevitable part of the oil’s life cycle. How-
ever its onset can be delayed and detrimental effects miti-
gated through active oil management. The process relies on
monitoring of the oil’s oxidation stability, the levels of anti-
oxidant additives and its varnish potential. These can then
inform the maintenance activities – filtration, top ups and
oil changes.
Oxidation Stability – RPVOT
One of important properties of the oil is its oxidation stabil-
ity – that is its ability to resist oxidation. One of the stand-
ard measures of this property is the Rotating Pressure Ves-
sel Oxidation Test (RPVOT, formerly RBOT). The test pre-
sents a simulated worst case scenario, where an oil sample
is subjected to the harsh conditions of high temperature
and high pressure oxygen atmosphere in the presence of
water and a copper catalyst. As oil oxidises the pressure
drops and time taken to achieve a specific drop in pressure
is recorded.
Remaining Useful Life Estimation
Routine
Remaining Useful Life Estimation Routine (RULER) uses Lin-
ear Sweep Voltammetry to measure the levels of Amine
and Phenol anti-oxidant additives in the oil. These are typi-
cally compared with a baseline measurement obtained
from a virgin oil sample (ideally from the same batch of oil).
If anti-oxidants are allowed to deplete below a critical level
the oxidation process accelerates, leading to reduced oil
life. RULER monitoring enables management of the additive
levels through top up or partial changes, significantly ex-
tending the life of the oil.
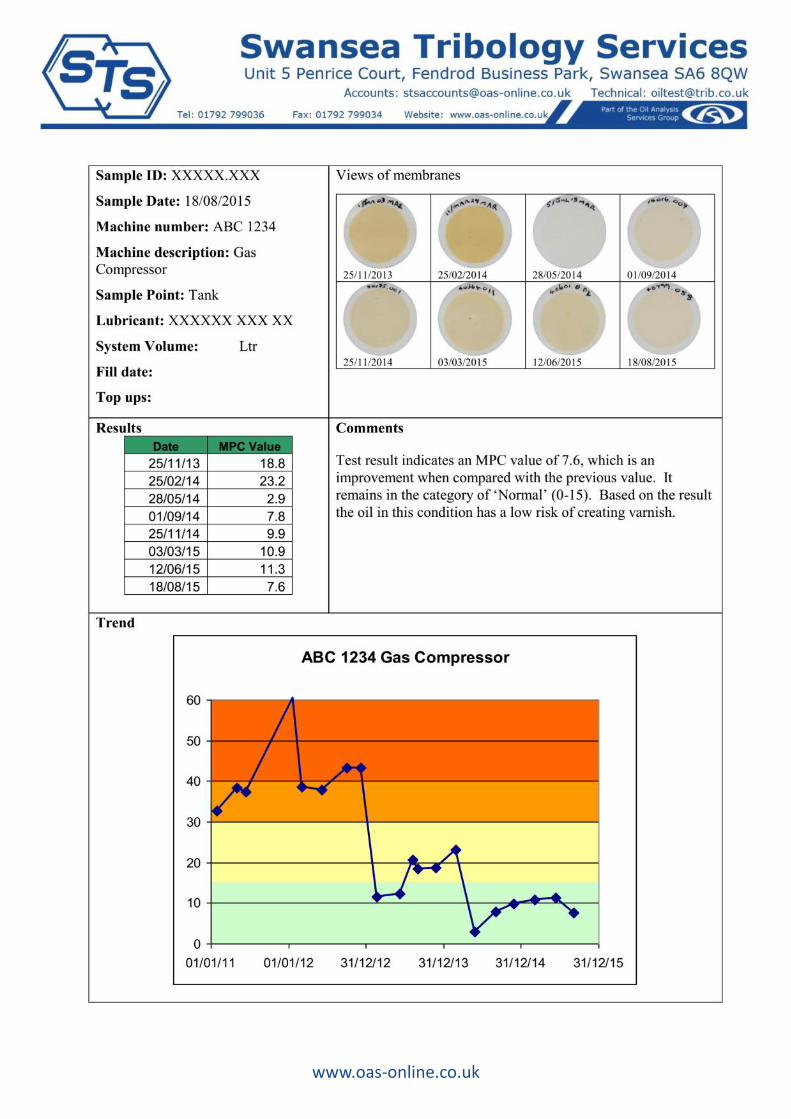
Varnish Potential Measurement via
Membrane Patch Colourimetry
Varnish is the sticky residue created by the decay of both
mineral and synthetic lubricants and can bring an entire
operation to its knees. It can cause premature failure, er-
ratic operation and can be the cause of a costly shut down.
There are many signs of varnish build up including sticky
valves, overheating bearings, decreased effectiveness of
heat exchangers, blocked filters and reduced lubricant life.
A way of detecting build-up of varnish and its precursors
early is through Membrane Patch Colourimetry. After a
heat and rest cycle to reset the oil’s solubility it’s filtered
through a fine membrane filter and the shading of the
patch is measured to obtain the varnish potential value.
This value reflects the solubility of the oil (i.e. its capacity to
keep oxidation products in solution) and the level of con-
tamination. If the measured MPC value is high varnish miti-
gation technologies can be employed to clean up the sys-
tem. Varnish precursors are very fine sub-micron agglomer-
ations of oxidation products, which can go through conven-
tional filters, although when the oil is saturated they can
cause filter blockages. Therefore special filtration technolo-
gies aimed at removing the fine sub-micron contaminants
need to be utilised. Such technologies include electrostatic
filtration, depth media filters and the electrophysical sepa-
ration process to name but a few. Each comes with its own
strengths and weaknesses and should be considered care-
fully depending on specific application.
Other Tests
Oil’s resistance to oxidation is also affected by its air release
properties and foaming characteristics. Entrained air can
lead to deterioration of control function as well as micro-
dieselling, causing localised high temperatures and acceler-
ated oxidation of the oil. Foam can act as an insulator lead-
ing to raised operating temperature, and also increase the
surface area in contact with air. For steam turbines the oil’s
ability to release water from emulsion is also important and
can be measured through its demulsification value.
www.oas-online.co.uk

www.oas-online.co.uk
Web database customizable graphs
Web database history table
Web database sample overview

www.oas-online.co.uk
Transformer Oil Analysis
Just like lube oil analysis mentioned above a lot of value can be
derived from transformer oil testing.
The tests for dissolved gases and furfuraldehyde usually indi-
cate the condition of the transformer whilst most of the other
tests e.g. acidity, electric strength, fibres reflect the quality of
the oil. Since it is not desirable to have any water present, that
test can also indicate whether the dryers are functioning cor-
rectly.
By measuring the different concentrations of dissolved gases: -
The presence of a defect can be detected long
before any Buchholz alarms.
The type of defect producing the gases can be
diagnosed.
The severity of the defect can be determined by
monitoring the increase in gas concentrations.
Furfuraldehyde is formed by thermal degradation of paper
insulation and can aid the diagnosis of defects detected by gas
analysis. It should not be used instead of gas analysis.
The benefits of gas analysis lie in knowing if a transformer is in
trouble and arranging schedules for planned outages rather
than not knowing when plant is about to fail. If surveys are
undertaken, then maintenance can be directed towards the
worst plant and if defects cannot be corrected easily, possible
capital replacement costs for the future can be budgeted. Oc-
casionally plant can be “nursed” to more convenient times for
refurbishment by reducing load and by monitoring gases.
For oil quality the control of moisture is most important
(maximum of 30mg/l or ppm). It is moisture in combination
with fibre in main tanks and selectors and carbon in divertors
that so dramatically reduces the electric strength of the oil to
very unsafe levels that can result in plant failure.
In tests conducted on a population of 100 primary transform-
ers ranging from 132kV down to 33kV all with on load tap-
changers, the loss due to failure of selectors and main tank
windings averaged about one per year. During the following
period of 8 years in which moisture was monitored on an an-
nual basis and controlled, with 30 ppm set as the value at
which units were Ilovaced, the loss was reduced by approxi-
mately 90%. Average moisture content being about 18 ppm.
Establishing the importance of moisture did not negate the use
of DGA. DGA was adopted as a very useful partner to moisture
analysis and testing was carried out on an annual basis. This
enabled fault trends in what was an ageing population of
transformers to be monitored and remedial action to be taken
before fault damage and supply loss occurred. It also allowed
capital replacement programs for the plant to be more accu-
rately determined.
The final component of an annual diagnostic testing regime is
the targeting of plant maintenance in order to produce sub-
stantial cost benefits. The following main plant items are dis-
cussed in further details elsewhere (available on request).
Divertors
To enable maintenance periods to be extended it is better to
change contacts in complete sets and to monitor oil for car-
bon/moisture and electric strength on an annual basis and use
this information to supplement and fine tune the annual pro-
gramme.
Selectors
Selector maintenance is best targeted using DGA/moisture/
electric strength/metal and fibre (fibres normally introduced
by fitters using cleaning wipes and leathers during mainte-
nance).
Main Tanks
An example of annual testing programme is available on re-
quest. Initially, when setting up a database, it would be useful
if possible to obtain both top and bottom main tank samples of
primary transformers but in subsequent years only the bottom
needs to be sampled. If a fault is suspected, the sampling fre-
quency for dissolved gas is increased and also top and bottom
samples taken at the same time may give more information

www.oas-online.co.uk
Transformer Oil Condition Tests
Water content High water content will reduce the insulating properties of the oil, which may result in dielectric breakdown. It can cause breakdown of cellulose based paper insulations in the windings, together with accelerating corrosion.
Acidity High acidity can result in corrosion and varnish deposits, together with degradation of oil and paper in the windings. Consequently, sludging can occur within the oil, thus reduc-ing heat dissipation qualities of oil and causing overheating. Reduced insulating properties and an increase in water con-tent normally go hand in hand with high acidity.
Electric Strength Low electric strength indicates oil is no longer capable of performing the vital function of insulating under high elec-trical fields. Poor electric strength is often linked with high water and fibre content.
Colour An indication of level of oxidation and degradation of oil.
Fibres Under high electric fields the behaviour of fibres can cause a dramatic reduction of insulating qualities of oil. Although invisible to the naked eye fibres are often introduced via poor maintenance techniques.
Polychlorinated Biphenyls (PCBs) PCBs are insulating liquids used for their non-flammable properties, mainly in transformers, whether a fire would be unacceptable and as the dielectric in capacitates. Unfortu-nately the mineral oil used in transformers has become
cross contaminated over the years. As PCBs are fairly non-biodegradable and tend to collect in food chains legislation was brought in to prevent wide-spread contamination. Liq-uids containing over 50 mg/kg must be classed as injurious substance and disposed of via costly high temperature in-cineration. It is therefore essential those responsible for plant know their level of contamination and have strict con-trols on oil movements to site.
Machine Condition Tests
Dissolved Gas Analysis (DGA) and Buchholz gas analysis This is the single most important test performed on trans-former oil and is used to determine the concentration of certain gases such as nitrogen, oxygen, carbon monoxide, carbon dioxide, hydrogen, methane, ethane, ethylene and acetylene. The concentration and relative ratios of these gases can be used to diagnose certain operational problems and incipient faults in transformers, which may or may not be associated with a change in physical or chemical proper-ty of the insulating oil. For example, high level of carbon monoxide relative to other gases may indicate thermal breakdown of cellulose paper while hydrogen in conjunc-tion with methane may indicate a corona discharge. Acety-lene is considered a significant gas generated as it is formed in breakdown of oil at temperatures in excess of 700oC and can indicate a serious high temperature overheating fault.
FFA (Furfuraldehyde) This is a measure of the degradation of cellulose paper in the windings i.e. as the paper ages its degree of polymerisa-tion (DP) reduces and thus so does its strength as it be-comes more brittle. The DP of paper can directly related to the concentration of furan derivatives in the oil which are formed as a direct result of the breakdown of the polymeric structure of cellulose paper. New paper has a DP rating of 1250 while at 250 the paper is sufficiently brittle to fall away from the windings. It is therefore possible to use FFA to estimate the used life of the transformer as well as which will be dependent on factors such stresses on plant, over-heating etc. FFA formation can also indicate low tempera-ture overheating.
Metals in oil
Elemental data helps to pinpoint the origins of faults for
example iron and copper can be indicative of arcing be-
tween a copper contact and iron core.

www.oas-online.co.uk

www.oas-online.co.uk
Water Analysis
As well as oil analysis STS/OAS are also able to offer a range of
water tests. These include bacteria counts, pH and total alka-
linity, hardness, levels of nitrate, nitrite, sulphate, phosphate
and ammonia, chemical oxygen demand, settleable solids and
others.
Reports, Comments, Customer En-
gagement and Software – the bits
that you see
At STS/OAS we understand that the most important outcome
of any oil analysis programme is the maintenance activity
which is informed by it. Our goal is to empower asset manag-
ers, maintenance engineers and technicians to interpret and
apply the results of the analysis to their maintenance practic-
es. We aim to engage and educate our customers, offer com-
prehensive analysis and advice as well as carefully designed
clear and informative reports. On top of a variety of individual
report formats we offer local client or web data viewing solu-
tions and are also able to export to 3rd party software packag-
es, such as vibration monitoring suites and asset management
software.
About us
Both STS and OAS were founded on expertise.
STS evolved from the Swansea University Tribology Centre
and was synonymous with research and innovation in the
fields of Tribology and Oil Analysis. Founded by Mervin H
Jones it has now been a limited company for 20 years with
analysis histories available for up to 25 years back! Whilst part
of Swansea University it hosted numerous scientific confer-
ences with Mervin involved in multiple committees develop-
ing the fields of Condition Monitoring, Tribology and Oil Analy-
sis.
The founder of OAS Ivan H Brown is a qualified electrical engi-
neer experienced on transmission systems up to and including
132kV. He was also involved in formulating oil and mainte-
nance policies for London Electricity and had years of experi-
ence in locating and correcting faults on a wide variety of
plant including cables, switchgear and transformers. Having
encountered oil analysis in his engineering days Ivan was so
impressed with the benefits that he had to start his own com-
pany, which has now been a successful business for over 25
years.
Our customers
We serve a wide range of clients both in the UK and globally,
reaching as far as Brazil and North America in the West and
South China Sea in the East. Industries served include oil & gas
exploration, power generation and distribution, renewables,
mining and steel manufacture, research and development,
hydraulic and filtration services, marine, military and aero-
space, commercial vehicles, manufacturing, building services,
utilities, food and numerous others.
Contact details Swansea Tribology Services Ltd Unit 5 Penrice Court
Fendrod Business Park
Swansea, SA6 8QW
T: 01792 799 036
F: 01792 799 034
www.oas-online.co.uk
Oil Analysis Services Ltd
6/7 Blue Chalet Industrial Park
West Kingsdown
Sevenoaks, TN15 6BQ
T: 01474 854 450
F: 01474 854 408
www.oas-online.co.uk