< maturing outside of our comfort zone >
TRANSCRIPT

< Maturing outside of our comfort zone >
Annual Report 2019


3
_Profile
ProfileThe Integrated Utility Holding N.V., doing business as Aqualectra (here-
inafter ‘Aqualectra’, ‘the Company’ or ‘the Group’), is Curaçao’s utility
company responsible for the production and distribution of power and
water as well as for the delivery of accompanying services.
As per December 31, 2019 the Group’s workforce consisted of 597 (2018:
616) dedicated employees who provide the manpower needed for the de-
livery of quality products and services to our customers. As per December
31, 2019, the Group had approximately 84,011 (2018: 82,068) electricity
connections and 86,717 (2018: 83,654) water connections.
This annual report of the Group is the consolidated report of Board
of Managing Directors and Board of Supervisory Directors to the
Shareholder and other relevant stakeholders about its financial and
non-financial performance over the year 2019. The scope of this report
comprises the Integrated Utility Holding N.V. and its subsidiaries.

Annual Report 2019
4
2019 AT A GLANCE 6
1_REPORT OF THE BOARD OF MANAGING DIRECTORS 9
1.1_2019 in review 10
1.2_Financial results 16
1.3_Corporate Governance 27
1.4_Future prospects 28
1.5_Words of appreciation 34
2_REPORT OF THE BOARD OF SUPERVISORY DIRECTORS 35
2.1_Board meetings and decisions 36
2.2_Compliance with the Corporate Governance Code 37
2.3_Composition of the BSD 38
2.4_Committees of the BSD 40
2.5_Assertions of the BSD 41
2.5_Approval and dividend proposal 43
<Table of contents>

1_Report of the Board of Managing Directors
5
3_HIGHLIGHTS OF THE YEAR 45
4_CONSOLIDATED SUMMARY FINANCIAL STATEMENTS 49
4.1_Consolidated Statement of Financial Position 50
4.2_Consolidated Statement of Comprehensive Income 51
4.3_Consolidated Statement of Changes in Shareholder’s Equity 52
4.4_Consolidated Statement of Cash Flows 53
5_NOTES TO THE CONSOLIDATED SUMMARY FINANCIAL STATEMENTS 55
5.1_General 56
5.2_Significant accounting policies 58
5.3_Summary of significant accounting policies 60
5.4_Financial Risk Management 90
5.5_Explanatory notes to the Consolidated Statement of Financial Position 99
5.6_Explanatory notes to the Consolidated Statement of Comprehensive Income 109
5.7_Subsequent Events 117
INDEPENDENT AUDITOR’S REPORT 121
COLOPHON 125

6
2019AT A GLANCE< Maturing outside
of our comfortzone >
AverageElectricity Tariff
per kWh
ang 0.5823
RevenuesElectricity
ang 399,2 M
Balance Sheet Total
ang 914,7 M
Gross Profit Margin
54%Workforce
597 employees
Numberof kWh sold
654,831
EBITDA
ang 108 M

Renewables Penetration in
Production Mix
25%
AverageWater Tariff
per M3
ang 10.4278
RevenuesWater
ang 117,6 M
CAPEX
ang 45,4 M
Numberof M3 Sold
10,473
Ratedby S&P
BBB-
SolvencyRatio
42%
Net Profit After Tax
ang 13,9 M
RoE
3%

Annual Report 2019
8

1_Report of the Board of Managing Directors
>>
1_Report of the Board of Managing Directors
9

Annual Report 2019
10
1.1 <The year at a glance>
MATURING OUTSIDE OF OUR COMFORT ZONEWhereas 2018 has been a year of many achievements and pivotal moments
that laid the foundation of the years come, 2019 is characterized as the year
Aqualectra left its comfort zone behind and started its maturity journey into its
newly digitalized environment. A year in which the various systems, process-
es and structures implemented in 2018 were put to work and embedded in
the new organization.
At the core of the journey to leave behind our comfort zones and mature into
the Company’s new digitalized environment, lies the conviction that new hori-
zons are to be conquered and that we cannot rely on past successes but must
continue to build, move, connect, inspire and deliver results. When doing that,
we put our values in motion and commit ourselves every day to fundamental-
ly contribute to the well-being of the citizens of Curaçao.
OUR VALUES IN MOTIONTo prepare our organization to reach these new horizons as set out in the stra-
tegic plan to be implemented 2020-2024, we have focused 2019 in putting
our values in motion, enforced by the pivotal changes implemented in 2018.
TeamworkHaving an ERP as the organization’s backbone forced our people to foster
teamwork and collaboration during 2019. Before the ERP, Aqualectra used to
have a ‘best-of-breed’ application infrastructure, which allowed fragmenta-
tion of teams. However, we had to change this, eliminate the silos and come
together as a team to move the organization forward. 2019 was the year in
which most of those inter-departmental walls were torn down and the people
realized the value and necessity to work together as a team. While acknowl-
edging that we still have a way to go, we can look back at 2019 with modest
satisfaction, knowing that the foundation was laid, backed by the technology
implemented in 2018.
DialogueThere were many issues that had to be solved during 2019. Some stemming
from the new ways of working implemented in 2018, others from outside the
organization. Dialoguing took a prominent space in our approach to serve our
customers, do business and communicate with the community we serve.
11
1_Report of the Board of Managing Directors
We experienced challenges that we have not experienced in a long time but
amidst it all, we continue dialoguing and communicating.
We have kept up with this value, even in difficult times. On the 4th of
November 2019, we experienced a black-out after thirteen years. It was a
difficult day as the whole island lost power and remained without electricity
for approximately fourteen hours. Despite the sense of disappointment, we felt
as a team, we still faced our community and dialogued throughout the whole
day to ensure we maintain everybody informed of what we were doing
Servant leadersAt the core of everything we do, lies the commitment that we fundamentally
contribute to the well-being of the citizens of Curaçao. This belief and the main
reason why we do what we do, is in itself a servant mindset. When asking
each and every employee of Aqualectra why they are committed to their jobs
and continue doing it in spite of the challenges or criticism, one will get the
same answer: because we know the importance of water and electricity to our
community and we want to serve our community with the best.
During 2019 we have also supported various sport and cultural activities
through sponsoring and donations. Each time that we can contribute to serve
our community by further strengthening its social, sport and cultural founda-
tions, we will surely do so.
TimelinessWhen moving outside of one’s comfort zone, some adaptation and a lot of
flexibility is needed, which sometimes can come at the cost of timeliness.
During 2019, the challenges with timely invoicing, processing of customer
requests, servicing our customers at the branches and through our contact
center, reporting to our stakeholders and solving technical issues of production
and distribution of water and electricity may not have been as timely as we
wanted it to be. However, we are committed to improving this and continued
building a solid base in 2019 to be able to meet and exceed the expectations
of our customers and stakeholders when it comes to timely complying with
the promises made.
Embrace modern technologyThere was never a year where we embraced technology more than 2019 so
far. Moving away from the challenges after implementing and changing so

Annual Report 2019
12
much during 2018 and entering into a realm of embracing these technologies
was considered eye-opening by the organization. From data analytics
through modern reporting and dashboarding tools to workflow management
and queuing systems to manage customer flows, it was all placed at the
fingertips of our workforce.
Enhanced technology was also embraced by the technical departments.
On 25th of June 2019, a new plant was commissioned at Dokweg. While
adding capacity to make sure we can continue to meet the customers’
electricity demand, we also added more efficiency through technology.
This plant, together with the most recently commissioned plant (in 2015), are
both equipped with enhanced technology, allowing them to be manned by
less personnel and still produce reliably.
Technology is also embraced in the water division, where it is already possi-
ble to run the water plant unmanned. These technologies will be broadened
and further embraced during the coming years, in line with our strategic
vision. The further improvement of our core business and the ambition to
ignite and embed innovation will both lead to increase the use of modern
technology in Aqualectra.
The proof of concept of the Advanced Metering Infrastructure-project was
also officially launched during 2019. Three areas were selected for this proof
of concept. Before installing the digital meters, we organized information ses-
sions for the inhabitants and launched an island-wide information campaign
to explain the benefits thoroughly.
Together with this project, a smart street lighting infrastructure is also being
tested. Currently, this streetlight infrastructure was installed at three neighbor-
hoods and we look forward to rolling out this smart and cost-saving infrastruc-
ture island-wide.
TransparencyBeing transparent is one of the most important values as state-owned compa-
ny. During 2019 we have continued ensuring transparency in every endeavor
we pursued. We have continuously informed our financial stakeholders and
Board of Supervisory Directors of the company’s financial performance at the
end of each quarter. We have maintained close contact with the unions and
ensured that they are abreast of developments. The press was welcomed
each time they had questions, remarks or wanted to know more about a

1_Report of the Board of Managing Directors
13
specific situation. We have invited schools and groups to our facilities and
plants, to learn more about how we operate, how water and electricity is pro-
duced and how we maintain safety rules.
We have published our annual report on the company’s website and provid-
ed the Regulator with the requested information, to ensure transparent and
independent tariff setting.
In years ahead, we look forward to continuing informing our community and
all stakeholders of the Company’s developments in the most transparent way
possible. Understanding the impact, we have on the community and our role
as a state-owned company, we also embrace transparency in our communi-
cation and outings and everything else we do.
PassionMaintaining the level of commitment that is needed to deliver power and water
to our community every minute of every day, requires passion for what we do.
The 2018 annual report was dedicated to show the amount of passion we put
at work to fulfill our duties each day.
In 2019 we decided to take it a notch further and share this passion with our
region. From 23rd to the 27th of June 2019, Aqualectra hosted the CARILEC
Engineering & Procurement Conference themed ‘Partnering for sustainable
Energy Solutions, Innovation and Resilience’. We welcomed a large number of
international guests and shared our experiences, opened up our facilities and
showed them Curaçao. The conference was commended by many after-
wards and we were grateful for the opportunity to showcase our island and its
capabilities to the world.
FROM A BROADER PERSPECTIVE Over the last few years, Curaçao has faced significant challenges. The econ-
omy has been in a recession since 2016 mainly due to continued spillovers
from the Venezuela crisis, and real GDP contracted by an estimated 2% in
2019. The unemployment rate increased to 21.2% in April 2019, among the
highest in the region. The fiscal position in Curaçao improved in the past two
years, in part due to implemented fiscal measures. On the other hand, the
external position of Curaçao worsened since 2016. The current account deficit
widened in 2019 mainly because of a significantly increase of imports due to
spillovers from Venezuela. Despite double-digit current account deficits, the
pressure on international reserves has been mild as they only declined from
4.4 to 4.0 months of imports of goods and services between 2017 and 2019.

Annual Report 2019
14
Based on all the above, recent stress in the banking sector and greater
financial support to the recently completed Curaçao Medical Center, a budget
instruction was issued by the Government of the Kingdom of the Netherlands
to Curaçao in 2019 to rectify the country’s previous fiscal deficits. Even after
this instruction, Curaçao struggled to implement the necessary reforms.
Previous to the COVID-19 pandemic, Curaçao’s growth outlook was improving
but remained fragile. After 4 years of continuous recession, Curaçao’s real
GDP was expected to remain flat in 2020 and grow by 1½ percent in 2021 as
the agreement with the Klesch Group is expected to revive the Isla refinery.
However, growth would return to substandard, around ½ percent, in the medi-
um term reflecting persistent structural challenges.
Downside risks were substantial. Curaçao’s outlook was already vulnerable
to setbacks with reviving the refinery and to possible spillovers from finan-
cial system fragilities. Delays in addressing these fragilities could heighten
uncertainty and lead to exchange rate pressures, while the country remains
vulnerable to a slowdown in main trading partners1.
The post-COVID-19 expected recession becomes therefore amplified.
The relationship with the Government of the Kingdom of The Netherlands and
Curaçao seems to be worsening as various stringent conditions were posed on
the island’s government to receive financial aid. The fiscal, economic and so-
cial challenges are worsening and to this date, the solution path is still unclear.
As a state-owned entity and the island’s utility company, Aqualectra expe-
riences the effect of all the above intensely. However, we are committed to
help the economy grow and will continue to support, invest and lead innova-
tive projects to propel the island forward. Contributing to the wellbeing of this
country is engrained in the DNA’s of the BMD, staff and personnel.
These challenges make us stronger and cause us to rise and stand up for the
good of our country and the community we serve. As one of the cornerstones
of our economy, our community must know that we will protect and defend
their wellbeing, now more than ever.
1Source: IMF Executive Board Concludes Article IV Consultation with Curaçao and St. Maarten (April 1, 2020)

1_Report of the Board of Managing Directors
15

Annual Report 2019
16
1.2 <Financial results>
Aqualectra’s financial result for the year 2019 is positive and amounts to ANG
13 million (2018: ANG 32 million). These positive results further strengthen the
Company’s equity and increases Aqualectra’s financial resiliency. However, the
under-coverage developed during the year on both the fuel and base compo-
nent is considerable and weighed heavily on the results from operating activi-
ties. Nevertheless, this profit was generated solely from Aqualectra’s operations.
There were no recoveries or large one-time transactions to be reported.
The following table details important financial performance drivers:
Amounts in ANG x 1,000
Dec 31, 2019 Dec 31, 2018 Change in ANG Change in %
Sales electricity 399,240 371,353 27,887 8%
Sales electricity in mwh 654,831 654,390 441 0%
Sales water 117,630 116,610 1,020 1%
Sales water in 1000 m3 10,473 10,677 (204) -2%
Direct cost production and other direct cost of sales (248,851) (223,971) (24,880) 11%
Gross profit 279,204 273,208 5,996 2%
Gross profit margin 54% 55%
Operating expenses 256,935 210,996 45,939 22%
Operating profit 22,270 62,212 (39,943) -64%
Interest expenses, net (13,828) (15,539) 1,711 -11%
Net result before tax 8,441 46,673 (38,232) -82%
Net result after tax 13,124 32,505 (19,381) -60%
Aqualectra budgeted a profit before tax of ANG 52.5 million for 2019. The dif-
ference between the realized net profit and the budgeted amount is significant
(ANG 43.8) and is mostly related to the under coverages developed during
the year on the fuel and the base component, respectively ANG 26.2 million
and ANG 7.6 million.
These undercoverages were developed due to the following reasons:
The norms for Non-Revenue Water and Non-Revenues Electricitywere exceeded: The difference between the norms set by the Regulator for NRW and NRE
(respectively 22.8% and 12.3%) and the actual reported ratios (respectively

1_Report of the Board of Managing Directors
17
27.6% and 13.8%) are not passed through to customers in the tariffs and
result in less return for Aqualectra.
Lowering the actual NRE and NRW levels require steep investments in a smart
grid. This investment is planned and the proof of concept was executed in 2019.
Lower sales of electricity and water:The budgeted sales for electricity and water were respectively 687,817 kWh
and 11,232 m3. The base component of the tariffs are based on these budgets.
Lower sales result in less units to divide the operating expenses among. This
is usually adjusted in the ex-post analysis of the tariffs, once these audited
financial statements are submitted to the Regulator.
The base component has not been adjusted:The base component has not been adjusted. The Regulator decided since 2018
to exclude portions of depreciation expenses, personnel expenses and repair &
maintenance expenses. The ex-post evaluation of the tariffs for 2018 has not
been concluded yet. Upon conclusion of this evaluation, it will become evident
to the Regulator whether these expenses should be re-incorporated or not.
The following table provides details of the undercoverage developed during
2019 on the fuel components of the Water and Electricity tariffs:
Amounts in ANG x 1,000
Dec 31, 2019 Dec 31, 2018
Coverage calculations fuel component
Coverage fuel component E 175,429 149,855
Coverage fuel component W 31,045 28,674
Total coverage fuel component 206,474 178,529
Expenses in the fuel component E and W (232,770) (205,522)
Total realized expenses in the fuel component E and W 232,770 205,522
Under- coverage fuel component developed during the reporting period (26,296) (26,993)
Recovery fuel component
Recovery fuel component E 131 -
Recovery fuel component W - -
Recovered during the reporting period 131 -
Outstanding balance undercoverage per the end of the period
Beginning balance (excluding regulatory account December 2010) (55,286) (28,293)
Under-coverage fuel component developed during the reporting period (26,296) (26,993)
Recovery fuel component E and W 131 -
Total balance of Coverage Fuel Component (81,451) (55,286)

Annual Report 2019
18
SALES ELECTRICITY AND WATERTotal Revenues from the sales of electricity and water combined has in-
creased in 2019 by 5.8% or ANG 27.9 million as compared to 2018. In 2019,
electricity sales in MWh’s remained at almost the same level as in 2018, while
the average tariff increased by 5.4%, solely influenced by the fuel component.
The revenues from the sales of water increased by 0.5%, driven primarily by
an increase in tariffs by 1.2%, offers by a decrease in units sold of 1.9%.
2019 2018 2017 2016 2015
600,000
500,000
400,000
300,000
200,000
100,000
0
399,240
117,630
371,353
116,610
365,109
105,922
361,093
105,156
379,907
100,938
Electricity Revenues increased by 7.3% or ANG 27.3 million compared to
2018 in spite of the decrease in the unit sold for 2019. This is the result of
increased tariffs, due to increased fuel prices on the international market and
more fuel usage.
The base component as stipulated by the Government upon recommenda-
tion of the Regulator did not change in 2019. The base component varies for
each tariff group. The variance in consumption for each specific tariff group,
influences the average base component on an annual basis, as presented in
below chart.
Sales electricityand water
Sales water Sales electricity
Amounts in ANG x 1,000

1_Report of the Board of Managing Directors
19
2019 2018 2017 2016 2015
700,000
690,000
680,000
670,000
660,000
650,000
640,000
630,000
654,831 654,390 676,231 691,548 667,622
2019 2018 2017 2016 2015
0.7000
0.6000
0.5000
0.4000
0.3000
0.2000
0.1000
0
0.3142
0.0002
0.2679
0.3237
0
0.2290
0.3240
0
0.1898
0.3301
0.0172
0.1575
0.3301
0.0172
0.1575
Sales electricityin MWh
Tariff structure electricity
Recovery component Fuel component Base component

Annual Report 2019
20
The graphs below provide insight in the sales to customers per tariff group
2019 2018
72
15
55 3
68
19
55 3Customer Composition
Electricity (kWh %)
Households Commercial Industry Hotels Sta. Barbara Resort
2018
30
70
2019
31
69
Household CustomersElectricity
Prepaid customers Postpaid customers

1_Report of the Board of Managing Directors
21
based on MWh sold and generated sales in ANG:
In 2019, water sales decreased by 1.9%, while average rate increased with 1.2%.
2019 2018 2017 2016 2015
10,800
10,700
10,600
10,500
10,400
10,300
10,200
10,100
10,000
9,900
9,800
9,700
10,473 10,677 10,693 10,492 10,078
2019 2018 2017 2016 2015
12
10
8
6
4
2
0
7.4636
2.9643
7.6236
2.6856
7.9786
1.9169
8.2047
1.5413
0.176000
7.2909
2.5053
0.495
Tariff structure water
Recovery component Fuel component Base component
Amounts in ANG x 1,000
Sales water in M3

Annual Report 2019
22
68
19
55 3
2018
72
15
55 3
2019
The graphs below provide insight in the sales to customers per tariff group
based on M3’s sold and generated sales in ANG:
Direct cost of production and other direct costsof sales
Other Purchase of electricity
from windfarms Purchase of electricity
from CUC Temporary Diesel
Power Plant Purchase of water Lubrication Chemicals Fuel usage
Amounts in ANG x 1,000
Customer Composition Water (M3 %)
Households Commercial Industry Hotels Sta. Barbara Resort
DIRECT COSTS PRODUCTION AND OTHER DIRECT COSTS OF SALES
2019 2018 2017 2016 2015
250,000
200,000
150,000
100,000
50,000
This cost category reflects the usage of fuel, chemicals, lubrication, the
purchase of electricity and water from third parties, IUH-agreement expenses,
expenses for the temporary rent of electricity production units and other direct
costs of sales. The increase in direct costs of production and other direct costs
of sales by 11.1% or ANG 24.9 million compared to 2018 is due to:
- Increase in Fuel expenses of ANG 31.8 million, primarily due to the signifi-
cant increase in fuel prices and fuel usage, offset by
- Decrease in purchase of electricity from windfarm by ANG 2.5 million
(2019: ANG 40.2 million and 2018: ANG 42.7 million) as a result of a

1_Report of the Board of Managing Directors
23
decrease in windspeed.
- Decrease in lease expenses related to temporary diesel power plant of ANG
2.6 million as this plant was decommissioned following the commissioning
of the new plant at Dokweg II B in june 2019.
- Decrease in purchase of electricity from CUC (ANG 6.8 million) as the BOO-
plant was in maintenance during most of the year.
The decrease of wind production and intake from CUC has significant im-
pact on the fuel usage, as Aqualectra’s own production units had to be used
more frequently to comply with the island’s demand. This, together with the
increase in the fuel prices on the international market, led to a steep increase
in fuel expenses.
OPERATING EXPENSES
350000
300000
250000
200000
150000
100000
50000
0
-50000
-100000
2019 2018 2017 2016 2015
The total operating expenses increased by 21.8% or ANG 45.9 million in 2019
compared to 2018. This increase is mainly attributable to the following one-
time events (credits) in 2018:
- The release of the pension provision of ANG 89.2 million due to the change
from a Defined Benefit plan to a defined Contribution plan. This release caused
a large credit in the expenses, resulting in a much lower expenses in 2018.
- The total increase in depreciation and amortization by 7.5% (ANG 4.5)
Operating expenses
Provision bad debts Depreciation General expenses Customers relations
service fees Parts, repairs &
maintenance Personnel expenses Impairment reversal
Amounts in ANG x 1,000

Annual Report 2019
24
million is mainly due the addition of a new plant in 2019 and the fact that
the amortization on the intangible assets (ERP investment) was processed
for a complete year while in 2018 it was only amortized for half the year.
- The adoption of IFRS 9 in 2018, which caused a material addition to provi-
sions bad debt of ANG 48 million.
Excluding these one-time events, operating expenses mostly decreased in
2019, compared to 2018. The following main variances can be specified:
- The decrease in Parts, Repair & Maintenance by 30% (ANG 18.9 million) is
mainly due to termination of the Long Term Service Agreement agreement.
Maintenance is currently done in-house and when support is needed, this is
specifically requested from the vendors.
- The decrease in General Expenses by 22.6% (ANG 8.2 million) is mainly
the result of cost saving efforts in the housing and car fleet, Insurances,
security and consultancy expense categories.
- Various old and time-bared other liabilities were cleared, resulting in one-
time miscellaneous gains in 2019.
FINANCIAL POSITION
Amounts in ANG x 1,000
Dec 31, 2019 Dec 31, 2018 Change in ANG Change in %
Non-current assets 708,195 698,135 10,060 1%
Current assets 206,467 213,766 (7,299) -3%
Equity 378,822 364,903 13,919 4%
Non-current liabilities 390,119 264,771 125,348 47%
Current liabilities 145,721 282,227 (136,506) -48%
Capital expenditures 46,008 77,467 (31,459) -41%
Non-current assetsNon-current assets consist of tangible and intangible fixed assets, security
deposits and deferred tax assets. The increase in the total non-current assets
when comparing its total to 2018 relates to the following:
- The adoption of IFRS 16, implying the recognition of ANG 20.4 million of
assets that are annuity based.
- Decrease in intangible assets and property, plant and equipment as depre-
ciation exceeded the capital expenditures.

1_Report of the Board of Managing Directors
25
Current assetsCurrent assets consists of inventories, trade accounts receivables, other
receivables and cash & cash equivalents. The decrease in current assets of
ANG 10.8 million or 5% is due to the decrease in cash and cash equivalents
by ANG 20.9 million and in the other receivables by ANG 5.5 million offset by
increases in trade accounts receivable by ANG 12.6 million and inventories by
2.9 million. The increase in trade receivables relates directly to the increase
in revenues. Furthermore, customers with balances that were already old at
the end of 2018, were even more difficult to collect in 2019 considering the
worsening economic conditions.
The decrease in cash and cash equivalents is mainly due to a decrease in
cash inflow from operating activities, offset by a decrease in cash outflow for
investing activities. The decrease in cash inflow from operating activities is
due to increased payment of accounts payable and other liabilities offset by
an increase in the accounts receivable. The decrease in cash outflow from
investing activities follows the completion of the Dokweg II B plant in 2019, for
which most payments were disbursed in 2018.
EquityEquity increased by ANG 14 million as result of the reported profit for the year
of ANG 13 million and other comprehensive income for the year of ANG 1.0
million. Although significant progress has been made in the replenishment of
the Accumulated losses, the total Shareholder’s equity remains ANG 204.2
million below the initial Paid-in capital and subsequent Share premium.
Non-current liabilitiesThe increase in non-current liabilities by 47% or ANG 125.3 million is due to
the following:
- ANG 109.3 million increase in financial liabilities due to the new facility
agreement closed in the last quarter of 2018 with MCB and CIBC of which
the last disbursement took place at the end of 2019.
- The adoption of IFRS 16, implying the recognition of 20.8 million of liabilities
related to leased assets.

Annual Report 2019
26
Current liabilitiesThe decrease in current liabilities of 48.4% or ANG 136.6 million is due to the
following:
- The complete repayment of the corporate bonds following the refinancing
provided by CIBC and MCB Bank.
- Decrease in trade accounts payable and other liabilities as various
expenditures accrued at the end of 2018 (a.o. final payments of the new
plant at DokwegII B) were paid during 2019
Capital expenditures
The total net capital expenditures incurred in 2019 was ANG 46 million.
The decrease compared to 2018 is mainly due to the fact that most
expenditures for the new plant at DokwegII B were incurred in 2018.
CASH FLOW DEVELOPMENTS
Amounts in ANG x 1,000
Dec 31, 2019 Dec 31, 2018 Change in ANG Change in %
Operating cash flow 14,485 77,054 (62,569) -81%
Investing cash flow (45,379) (77,467) 32,088 -41%
Financing cash flow 9,982 15,727 (5,745) -37%
Net change in cash and cash equivalents (20,912) 15,314 (36,226) -237%
Aqualectra’s cash and cash equivalents shows an decrease in 2019 com-
pared to 2018 and is mainly due to a decrease in cash inflow from operating
activities, offset by a decrease in cash outflow for investing activities.
The decrease in cash inflow from operating activities is due to increased
payment of accounts payable and other liabilities combined with an increase
in the accounts receivable. The decrease in cash outflow from investing
activities follows the completion of the Dokweg II B plant in 2019, for which
most payments were disbursed in 2018.

1_Report of the Board of Managing Directors
27
1.3 <Corporate governance>
Aqualectra’s governance structure is depicted as follows:
GeneralShareholderMeeting
75%GovernanceComplianceRating
Country of Curaçao represented by the Minister of Economic Development
Board ofSupervisoryDirectors
91%GovernanceComplianceRating
5 active members (2 vacancies)Active committee(s) during 2019: Audit committee/Recruitment Committee
Board ofManagingDirectors
92%GovernanceComplianceRating
3 statutory directors: CEO, CFO and CTO (vacant)1 Legal Counsel
TeamTotal employees: 597Average age: 47Average tenure: 15 years
Management Board: 10Head of Departments: 20Supervisors and coordinators: 76
During 2019 we have also strengthened our team and welcomed Mr. Reagan
Celestijn as General Counsel & Corporate Secretary. This position has been
vacant and after careful consideration, we have found a suitable candidate in
Mr. Celestijn.
Unfortunately, we also had to part from our Mr. Irvin Hanst, Advisor to the
CTO. Mr. Hanst had been with Aqualectra for 25 years before he left.
We thank him for his work and contribution throughout the years and wish
him all the best in his future endeavors.
The above structure and the tasks and responsibilities of the various actors
are governed by the law (the Civil Code), the Company’s bylaws and the Code
of Corporate Governance. The compliance rates indicated above relate to the
level of compliance to the code which requires the BMD and the BSD to report
on their compliance to it.
Annual Report 2019
28
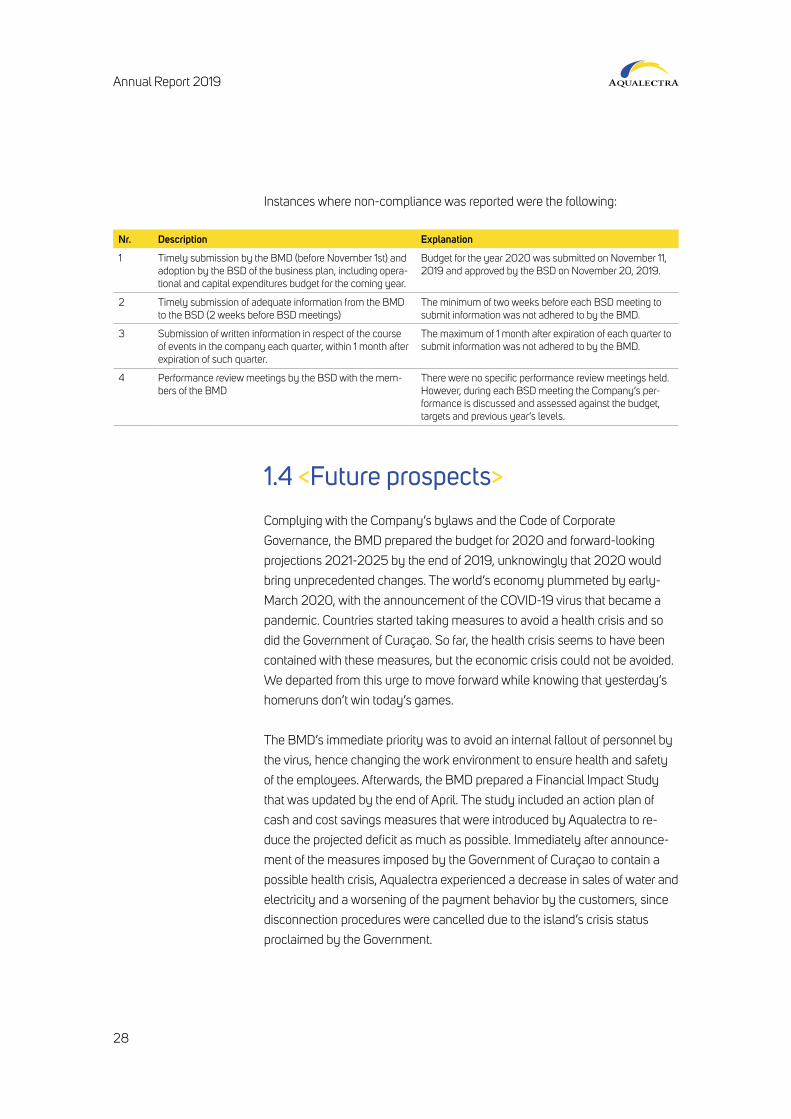
Instances where non-compliance was reported were the following:
Nr. Description Explanation
1 Timely submission by the BMD (before November 1st) and adoption by the BSD of the business plan, including opera-tional and capital expenditures budget for the coming year.
Budget for the year 2020 was submitted on November 11, 2019 and approved by the BSD on November 20, 2019.
2 Timely submission of adequate information from the BMD to the BSD (2 weeks before BSD meetings)
The minimum of two weeks before each BSD meeting to submit information was not adhered to by the BMD.
3 Submission of written information in respect of the course of events in the company each quarter, within 1 month after expiration of such quarter.
The maximum of 1 month after expiration of each quarter to submit information was not adhered to by the BMD.
4 Performance review meetings by the BSD with the mem-bers of the BMD
There were no specific performance review meetings held. However, during each BSD meeting the Company’s per-formance is discussed and assessed against the budget, targets and previous year’s levels.
1.4 <Future prospects>
Complying with the Company’s bylaws and the Code of Corporate
Governance, the BMD prepared the budget for 2020 and forward-looking
projections 2021-2025 by the end of 2019, unknowingly that 2020 would
bring unprecedented changes. The world’s economy plummeted by early-
March 2020, with the announcement of the COVID-19 virus that became a
pandemic. Countries started taking measures to avoid a health crisis and so
did the Government of Curaçao. So far, the health crisis seems to have been
contained with these measures, but the economic crisis could not be avoided.
We departed from this urge to move forward while knowing that yesterday’s
homeruns don’t win today’s games.
The BMD’s immediate priority was to avoid an internal fallout of personnel by
the virus, hence changing the work environment to ensure health and safety
of the employees. Afterwards, the BMD prepared a Financial Impact Study
that was updated by the end of April. The study included an action plan of
cash and cost savings measures that were introduced by Aqualectra to re-
duce the projected deficit as much as possible. Immediately after announce-
ment of the measures imposed by the Government of Curaçao to contain a
possible health crisis, Aqualectra experienced a decrease in sales of water and
electricity and a worsening of the payment behavior by the customers, since
disconnection procedures were cancelled due to the island’s crisis status
proclaimed by the Government.

1_Report of the Board of Managing Directors
29
Real courage is moving forward when the outcome is uncertain” - unknown

Annual Report 2019
30
In spite of the financial deficits, we are abiding by the saying we started this
paragraph with: “Real courage is moving forward when the deficit is uncer-
tain”. The situation created by the pandemic accelerated various plans that
were already being prepared to further move Aqualectra outside of our com-
fort zones and into the future.
Our customer service was completely moved to digital platforms. Two of the
three branches were closed, and service is now centralized online and through
our toll-free line. Customers visit our centralized location to validate their identi-
ty only when it’s needed, and we look forward to further facilitate and enhance
the customer’s experience by expanding our digital platform offer.
Our grid operations are being changed considerably by fundamentally
changing the framework in which we operate with contractors. This will result
in increased efficiency, better control and lower expenses. Furthermore, the
Company’s cost structure is thoroughly being scrutinized and cost saving
measures are being formulated to substantially and sustainably reduce ex-
penses, ultimately resulting in the reduction of consumer tariffs.
Whereas in previous years the future prospects paragraph contained a recap
of the plans and the challenges to ultimately attain a positive financial outlook,
this time it’s different. The future is unknown but what we do know is that
Aqualectra must be able to survive these changes and that means that the
organization must be flexible enough to ride the change waves while resilient
enough to survive a tidal wave.
That is why we focused on redefining our strategic vision during 2019. It was
process that had to be started in 2017 but was placed on hold to allow for the
various structural changes that were being prepared to be implemented in the
company, such as a new Enterprise Reporting System (ERP - SAP), the judi-
cial integration of the distribution and production divisions, the re-structuring
of the organizational structure and the refinancing of the company, to name a
few. In 2019, the strategic planning process was started. The main question to
be answered was: what actions are to be taken to win today’s games?
What is it that we must focus on to ensure that we don’t only win today’s
games but also start tomorrow’s games with an edge?
We have identified five areas to embrace and develop during the years to
come. We are convinced that these areas and strategic goals will propel
1_Report of the Board of Managing Directors
31
Aqualectra into a future-proof company, that is flexible enough to change
when needed but resilient enough to still be here for generations to come.
The following five areas and strategic goals were identified:
1. Core business: Resilient and reliable operationsAs we drive forward, we cannot lose sight of our core responsibility towards
the community to provide power and water in an effective and efficient man-
ner. We will continuously strive to do this in the best possible way. To ensure
the smooth, reliable, stable, and affordable provision of our products and ser-
vices, we must continuously seek to make ongoing technical improvements.
We will continue to invest in maintaining and upgrading our production and
distribution systems to ensure Aqualectra is adequately prepared to continue
to serve our community. The following specific projects will be pursued:
- Re-dimensioning of water production and distribution;
- Formalization and standardization of asset management practices;
- Ongoing and continuous renewal of our aging water and electrical
infrastructure;
- Enhancing of the IT infrastructure.
2. Customer Centricity: Excellent customer experience built on effortless interactionWith energy and water at the heart of how we live and all that we do, the
customer must be put at the heart of the future power and water ecosystem.
What we say, think, or do should revolve around the customer’s best interest.
Utility industry trends such as decarbonization and renewables are great
news for some customers, however, the bills still remain high.
Moreover, Aqualectra, like every other utility, is faced with the challenge
of meeting ever-changing demands amid the rise of a new generation of
customers. Going forward, our focus will be on better understanding their
needs and identifying ways to improve the customer journey. Ultimately, we
will focus on finding new ways of serving our customers, next to reinforcing
our daily commitment of providing them with reliable power and water. The
following specific projects will be pursued:
- Improve service delivery across the business;
- Improve customer interaction and response time;
- Introduce new services;
- Explore an innovative rate design;
- Shift customers to digital platforms.

Annual Report 2019
32
3. People leadership: An exemplary workforce in a thriving work environment To keep up with the pace of disruption and achieve our ambitions we must rely
on our people. We will not be able to build the Aqualectra of the future without
being backed by the workforce of the future. To increase the productivity and
the foster the commitment that will drive us forward, each employee should
have a strong understanding of their essential contribution to the wellbeing of
our community.
During the coming years, we will focus on getting the most out of the diverse
talent pool at Aqualectra. Now is the time to position our people at the forefront
as Aqualectra’s most important asset. The following specific projects will be
pursued:
- Deploy and implement a continuous learning & development program with
adequate succession planning;
- Adopt a data-driven succession planning and next-generation talent
development;
- Transform our organizational culture to align with new strategic ambitions;
- Incept proper labor policies, guidelines and conditions to meet new strategic
ambitions;
- Ensure an adequate work environment.
4. Innovation: Ignite and embed innovation to move boundariesOur personal transformation is an in-escapable prerequisite to take the leading
role in Curaçao’s utility transformation. We will embrace change in the only
fitting way; by devoting substance, importance, and focus on innovation.
Though there are innovations that have resulted from a flash of genius, most
successful innovations are the result of a structured, conscious, and purposeful
search for innovative opportunities. The following specific projects will be pursued:
- Implement a smart grid;
- Adopt artificial intelligence across the system;
- Promote and fund commercially viable innovative initiatives;
- Increase renewable energy penetration;
- Ensure stable production;
- Create a culture of innovation.
Yesterday’s homeruns don’t win today’s games” - Babe Ruth

1_Report of the Board of Managing Directors
33
5. Corporate social responsibility: Drive growth and development of our communityTo position ourselves as Curaçao’s utility transformation leader we must bring
value and benefits to the community. The greatest sustainable benefit we can
bring to the community is by leading in a socially responsible manner. In the
coming years we will undertake initiatives that will help us reduce our impact
on the environment and improve the social well-being of our community, all
while we empower our customers and people to do the same. The following
specific projects will be pursued:
- Launch a community-wide energy and water awareness program;
- Reduce the environmental impact of our operations;
- Enable direct community actions;
- Cultivate a culture of CSR (Corporate Social Responsibility).
We are convinced that with this focus, Aqualectra will continue to win games,
as the foundation is laid to become the Utility of the future: A flexible yet
resilient company.

Annual Report 2019
34
1.5 <Words of appreciation>
Leading a company like Aqualectra is an honor as we are able to serve our
community and influence its wellbeing for the better. We are grateful to this
community for this opportunity and work as a team, every day to secure
Aqualectra’s future.
We are also grateful for the team of 597 employees at Aqualectra, who ac-
cepted our leadership, moved outside their comfort zones, worked passionate-
ly to achieve the goals set and committed themselves to excellence. We are
not there yet but are moving slowly but surely into the right direction.
To our Shareholder, Board of Supervisory Directors, Unions, Lenders, suppli-
ers and other stakeholders we say thank you! We salute you and are ex-
tremely grateful for your ongoing trust and support.
We hope to continue to count on your support for the year(s) to come as
together we further move into the ‘Utility of the Future’.
We owe it to our future generations to move outside of our comfort zones,
even in moments of great crisis, and prepare tomorrow’s game, as yesterday’s
homeruns will not help us win those.
Willemstad - June 23, 2020
The Board of Managing Directors
Mr. D.P. Jonis, MSc. MBA Mrs. N. R. Isenia
CEO CFO

2_Report of the Board of Supervisory Directors
35
2_Report of the Board of Supervisory Directors
>>35

Annual Report 2019
36
Pursuant to the national decree Code Corporate Governance that is appli-
cable for all state-owned entities and/or entities that are subsidized by the
Government of Curacao, the Board of Supervisory Directors (‘BSD’) should
issue a report at the end of each year, detailing among others their compo-
sition, activities, remuneration, instances of non-compliance and activities of
committees. The BSD of Integrated Utility Holding hereby duly complies with
this requirement, by means of the following report.
2.1 <Board meetings and decisions>
The BSD is to supervise and advise the Board of Managing Directors (‘BMD’)
regarding the implementation of the policies and the strategy set forth by the
General Shareholder’s Meeting (‘GSM’) – the Legal Entity of Curacao.
In this role, the BSD is responsible for assessing whether the decisions
taken by the BMD are in compliance with the Company’s strategic, societal,
financial and technical objectives. The BSD also devotes attention during the
board meetings to adherence by the BMD to all laws, regulations and internal
procedures. Seven (7) combined BSD and BMD meetings (five for IUH N.V.
and two for AMU) were held during 2019 and the key decisions taken are
outlined below:
Projects: - Land acquisition at Domi;
- Project Kortijn;
- Start of the New Aqualectra headquarters;
- Continuous update on key projects (Advanced Meter Infrastructure,
New Headquarters, New water plant and tanks, etc.);
- Various commercial projects to be executed by Aqualectra
Multi Utility (‘AMU’).
Financial matters: - Approval of the Consolidated Financial Statements 2018;
- Approval of the Budget 2020 & Forward Looking Projections 2021-2025;
- Periodic financial performance (KPI’s);
- Progress on the corporate refinancing process (last disbursement in
December 2019).

2_Report of the Board of Supervisory Directors
37
Governance related matters: - Preparation for GSM;
- Recruitment and selection of a CTO;
- Business plan AMU and corresponding funding.
Other business: - The embargo on Venezuela and its impact on fuel supply and payments
to Refineria Isla B.V.;
- Results of the customer satisfaction survey;
- Results of the employee engagement survey;
- Periodic operational performance (KPI’s);
- Status of disputes with Refineria di Korsou N.V. (‘RdK’) and Curacao
Utility Company N.V. (‘CUC’);
- Update on discussions with unions and a new Collective Labor Agreement.
In discussing and approving these matters that the BMD presented to the BSD,
the roles and responsibilities as bestowed upon the BSD have been fulfilled.
2.2 <Compliance with the Corporate Governance Code>
The BSD strives to be compliant with the Code of Corporate Governance.
The following compliance rates were achieved during 2019 by the various
instances of governance in the Company:
Compliance to the Code of Corporate Governance by the GSM: 75%2018: 75%
Compliance to the Code of Corporate Governance by the BSD: 91%2018: 86%
Compliance to the Code of Corporate Governance by the BMD: 92%2018: 89%

Annual Report 2019
38
The following instances of non-compliance to the BSD’s tasks and responsi-
bilities have been noted:
Nr. Description Explanation
1 Timely submission by the BMD (before November 1st) and adoption by the BSD of the business plan, including opera-tional and capital expenditures budget for the coming year.
Budget for the year 2020 was submitted on November 11, 2019 and approved by the BSD on November 20, 2019.
2 Timely submission of adequate information from the BMD to the BSD (2 weeks before BSD meetings)
The minimum of two weeks before each BSD meeting to submit information was not adhered to by the BMD.
3 Supervision on timely holding of the GSM Despite of various invitations, no GSM was held during 2019
4 Supervision on whether the BMD request the external auditors yearly to provide a Management Letter, containing recommendations and suggestions to improve the financial management and/or the internal control measures of the Company
The Management Letter of 2018 was not submitted to the BSD. The BSD is aware that this has been submitted by the external auditors to the BMD, but it has not been finalized and submitted to the BSD yet.
5 BSD meeting at least twice a year making a self-assess-ment of the BSD, the BMD and its individual members and conclusion drawn on the assessment (without BMD present).
The BSD performed a self-assessment once during 2019 and not twice. A formal performance evaluation of the BMD by the BSD was not executed in 2019. However, BSD meetings pose a constant evaluation of the decisions made by the BMD and the execution of their management tasks.
6 A chairperson of the BSD appointed with specific duties with respect to the communication with external parties (e.g. auditors and appointed advisors).
The BSD’s appointed chairman resigned in 2019 and there is no other chairman appointed yet. However, the BSD ap-pointed an acting chairman to temporarily take over these duties until this vacancy is permanently filled.
The BSD will maintain its focus on its own compliance with the governance
regulations and will stimulate the BMD and the GSM to maintain and/or im-
prove the current compliance rates.
2.3 <Composition of the BSD>
The members of the BSD are appointed for a term of four years with a maxi-
mum of two terms. On December 31, 2019, the BSD consisted of the following
Supervisory Directors:

2_Report of the Board of Supervisory Directors
39
Name Function
Mrs. S. IndersonNovember 7, 2017 – 2021
Supervisory DirectorActing Chairman (July 1, 2019 up to February 2020)Member of the Recruitment Committee
Mr. R. BulbaaiSeptember 19, 2017 – 2021
Supervisory DirectorMember of the Recruitment Committee
Mr. C. MarshallOctober 12, 2018 – 2022
Supervisory DirectorActing Chairman (starting March 1, 2020)Member of the Audit Committee
Mr. R. RudolphAugust 31, 2018 – 2022
Supervisory DirectorMember of the Audit CommitteeMember of the Recruitment Committee
Mrs. J. Da Silva Goes – LacléMarch 20, 2019 – 2023
Supervisory DirectorMember of the Audit Committee
In accordance with the Code Corporate Governance, members of the BSD
are entitled to a financial compensation. During 2019, the following expenses
have been incurred to remunerate the board members:
Amounts in ANG x 1,000
Name 2019 2018
Mr. R. Bulbaai 29,458 29,359
Mr. S. Coutinho 24,459 28,781
Mr. A. Davelaar 2,201 29,359
Mrs. S. Inderson 26,447 29,359
Mr. C. Marshall 32,074 6,394
Mr. R. Rudolph 26,447 7,712
Mrs. J. Da Silva Goes - Laclé 20,775 -
Total 161,860 130,964
The net amount disbursed to the Supervisory Directors is based on a Ministerial
Decree adopted by the Government regarding remuneration of the Supervisory
Directors of government owned entities, which is ANG 1,000 per month for the
members and ANG 1,250 per month for the chairman. The difference between
mentioned net amount and the elucidated gross amounts in above table are
solely for the purpose of complying with the lawful taxes and social premiums.
In accordance with the Code Corporate Governance, all members of the BSD
are independent. The principal appointment/position and all other relevant
additional positions of each board member have been adequately document-
ed and this is retained in the BSD handbook.

Annual Report 2019
40
In 2019, the BSD held five regular combined BSD and BMD meetings for
Integrated Utility Holding N.V. and two regular meetings for Aqualectra Multi
Utility N.V.. All members of the BSD frequently attended the meetings. Most
meetings of the BSD and its committees were attended by the secretary who
was responsible for the minutes.
2.4 <Committees of the BSD>
2.4.1_Recruitment CommitteeIn connection with the recruitment and selection process of the CEO, CFO
and CTO initiated by the BSD, a recruitment committee was established.
The recruitment and selection processes of the CEO and CFO were finalized
with the appointment of both by the GSM. The recruitment and selection
process of the CTO has not been concluded yet.
The members of the Recruitment Committee are Mrs. Inderson, Mr. Bulbaai
and Mr. Rudolph.
2.4.2_Audit CommitteeThe requirement to instate an audit committee becomes valid when a board
exceeds five members. However, upon the resignation of the Chairman on
June 30, 2019 the BSD of Aqualectra remained at five members for the
remainder of 2019 but maintained its audit committee that was instated at the
beginning of 2019 active. The Audit Committee met five times during 2019,
whereas main topics discussed comprised:
- The quarterly financial reports;
- The audited financial statements for the year ended December 31, 2018, in-
cluding the choice of accounting policies, application and assessment of effects
of new regulations, insight into the treatment of significant judgement items in
the financial statements, forecasts, work of internal and external auditors;
- The budget for 2020 and forward looking projections 2021-2025;
- The functioning of the Internal Audit Department;
- The funding, capital and financing structure of the Company;
- Various other internal control, risk and tariff regulation related matters.

2_Report of the Board of Supervisory Directors
41
Furthermore, the Audit Committee functioned as first point of contact for the
external auditor and met once with the external auditor in absence of the BMD.
The Audit Committee together with the BMD thoroughly evaluated the role
and performance of the external auditor, which resulted in the extension of the
audit engagement for an additional year (audit of the financial year 2019).
The members of the Audit Committee are Mr. Rudolph, Mrs. Da Silva Goes-
Laclé and Mr. Marshall.
2.5 <Assertions of the BSD>
The BSD of Aqualectra approved the consolidated financial statements of
2019 in the board meeting held on June 23, 2020. The external auditor
issued for the year 2019 an unqualified opinion with emphasis of matter
paragraph on the consolidated financial statements. The audit findings and
the emphasis of matter that remain can be summarized as follows:
COVID-19The developments surrounding the Corona (Covid-19) virus have a profound
impact on people’s health and on our society as a whole, as well as on the
operational and financial performance of organizations and the assessment of
the ability to continue as a going concern. The consolidated financial statements
and our auditor’s report thereon reflect the conditions at the time of preparation.
The situation changes on a daily basis giving rise to inherent uncertainty.
Integrated Utility Holding N.V. is confronted with this uncertainty as well, that is
disclosed in the report of managing directors on page 19 and the disclosure about
events after the reporting period on pages 95 and 96. We draw attention to these
disclosures.
Investment in equity accounted investeesReference is also made to the consolidated financial statements 2010, where
it is disclosed that there was an ongoing discussion between the Company
and the Company’s shareholder (‘Shareholder’) regarding the valuation of
the investment in the equity accounted investee, Curaçao Utility Company
Holdings N.V. (‘CUC Holdings’). Based on the assumptions and valuation
model generally used by Management for determining the value of the invest-
ment, the Management of the Company was of the opinion that the current

Annual Report 2019
42
value of this investment at December 31, 2010 was approximately ANG 62.1
million. In January 2011, the Shareholder decided to transfer the shares of CUC
Holdings to Refineria di Kòrsou (RDK) for a nil consideration. As a consequence
of this decision of the Shareholder, as disclosed in the financial statements
2010 of January 21, 2014, Management has impaired the value of the partici-
pation in CUC Holdings to nil as per December 31, 2010.
The external auditor indicated that they were unable to obtain sufficient infor-
mation to come to an opinion with regard to the current recognition of the loss
on this investment position and whether it complied with the requirements of
IAS 24, related parties’ disclosures.
None of the undersigned members of the BSD were appointed during the fiscal
years when the various decisions were reached affecting the financial position
of the Company in particular, the transfer of CUC to RDK upon instruction of the
government and the consequences thereof on the long term bond financing of
the Company.
Based on the corporate law of Curaçao, each member of the BSD could be held
liable by a third party in the case that the consolidated financial statements
present a misleading position of the Company. On the other hand, each board
member could be liable in case the consolidated financial statements are not
prepared, signed by the BSD and consequently presented for approval to the
shareholder and published timely by the Company.
The BSD approved the financial statement of 2010 on January 21, 2014 and on
April 9, 2014 this consolidated financial statement was presented to the GSM.
The Council of Ministers accepted the qualification as to be issued by the exter-
nal auditor and instructed the Shareholder to approve the consolidated financial
statement with the proposed qualifications as issued by the external auditors.
On May 13, 2014 the Shareholder of the Group approved the 2010 consolidated
financial statements.
Furthermore, as per October 21, 2014, December 13, 2014, March 21, 2015 and
May 28, 2015, the BSD also approved the consolidated financial statements
2011, 2012, 2013 and 2014, respectively with the abovementioned qualifications
and also advised the Shareholder to do the same. The Shareholder approved
these consolidated financial statements in the GSM of December 18, 2015.
The consolidated financial statement for the year ended December 31, 2015 was also
approved by the BSD and GSM, respectively on May 17, 2016 and March 17, 2017.

2_Report of the Board of Supervisory Directors
43
The consolidated financial statements for the year ended December 31, 2016
were approved by the BSD on July 25, 2017 and are yet to be approved by
the GSM. Both the auditors’ opinions on the consolidated financial statements
for the years 2016, 2017 contained same qualification, whereas the auditors’
opinion on the financial statements for the year 2018 was an unqualified opinion
with an emphasis on abovementioned matter.
The BSD recommends the Shareholder to approve the consolidated financial
statement for the year ended December 31, 2019, 2018, 2017 and 2016 (as the
years 2018, 2017 and 2016 remain unapproved by the GSM), as it did with the
previous consolidated financial statements since 2010 with the only remaining
qualification/emphasis of matter. The BSD also recommends that the Shareholder
approves the consolidated financial statements for the year ended December
31, 2016, based on the approval given by the previous Board of Supervisory
Directors on July 25, 2017. Work is still ongoing to resolve this matter.
2.6 <Approval and dividend proposal>
The BMD submitted the Consolidated Financial Statements for the year ended
December 31, 2019 of Integrated Utility Holding N.V. (d.b.a. Aqualectra) as pre-
pared by the BMD and approved by the BSD to the GSM. EY Dutch Caribbean
audited the Consolidated Financial Statements and issued an unqualified opinion.
It is of utmost importance that the Shareholder’s Equity is further strengthened
to safeguard the Company’s financial viability and resiliency. For this reason,
and following lawful stipulations and the dividend policy, the BSD advises the
GSM not to distribute dividends, even in the event of a profitable operation, until
the negative retained earnings is eliminated.
Considering the aforementioned, the BSD advises the GSM to:
1. Accept the consolidated financial statements 2019 as included and
approved by the BSD;
2. Approve that no dividend payment will be distributed;
3. Add the positive total comprehensive result for the financial year 2019
to the balance of the accumulated losses, resulting in further improvement
of the net equity position;
4. Discharge the BMD for the management and the BSD for their supervision
during the year under report.

Annual Report 2019
44
WORDS OF APPRECIATIONDuring 2019, Mr. Steven Coutinho parted from the BSD after having served
as Chairman for almost 2 years. The term of Mr. Angelo Davelaar came to an
end on January 19, 2019. The BSD would like to thank Mr. Coutinho and
Mr. Davelaar for their commitment and dedication and wish them all the best
in their future endeavors.
The BSD worked together with the BMD through various essential themes
and projects and dealt with various challenges that presented from inside and
outside the organization during 2019. Although cognizant of many improve-
ment areas and strategic goals to conquer, the BSD commends the noticeable
growth in maturity of the organization during 2019, while embracing all the
changes implemented in 2018 and looking ahead to new horizons.
The BSD salutes the BmD and all Aqualectra employees for their contribution
to the successes achieved and looks forward to opening new windows of
opportunity for the Company and the community we serve.
Willemstad - June 23, 2020
The Board of Supervisory Directors
Mr. C. Marshall
Supervisory Director
Acting Chairman
Mrs. S. Inderson Mr. R. Bulbaai
Supervisory Director Supervisory Director
Mr. R. Rudolph Mrs. J. Da Silva Goes-Laclé
Supervisory Director Supervisory Director

2_Report of the Board of Supervisory Directors
45 >>
3_Highlights of the Year
45

Annual Report 2019
46
Financial Data Dec 31, 2019 Dec 31, 2018
Operating revenues (Amounts in ANG x 1,000)
Sales electricity 399,240 371,353
Sales water 117,630 116,610
Sales services 11,185 9,216
Operating expenses (Amounts in ANG x 1,000)
Total operating expenses Aqualectra N.V. 253,277 208,241
Total operating expenses Multi Utility 327 -
Total operating expenses Holding 3,330 2,755
Results (Amounts in ANG x 1,000)
Operating profit Aqualectra N.V. 9,691 56,308
Operating profit Holding 8,821 5,065
Operating profit Multi Utility 873 842
Consolidated net profit 13,124 32,505
Financial data (Amounts in ANG x 1,000)
Working Capital 60,746 (68,461)
EBITDA 107,990 122,378
EBIT 22,270 62,212
EBT 8,442 46,673
Equity 378,822 364,903
Non-current liabilities 390,119 266,018
Current liabilities 145,721 282,227
Financial ratio’s
Debt Service Coverage Ratio 1.24 0.66
Adjusted Debt Service Coverage Ratio 0.79 0.47
Debt/EBITDA Ratio 2.77 2.25
Solvency Ratio 42% 40%
Current Ratio 1.42 0.76
Return on equity 0.03 0.11

47
3_Highlights of the Year
Operational Data Dec 31, 2019 Dec 31, 2018
Electricity
Sales electricity in mwh (excl. RO Fuik and own usage) 654,831 654,390
Electricity intake from production in MWh 597,313 505,166
Electricity intake from CUC in mwh 42,753 113,840
Electricity intake from wind farms in MWh 208,000 233,761
Usage reverse osmosis plants 56,916 61,863
Number of postpaid connections at year end 46,786 54,739
Number of prepaid connections at year end 28,422 27,329
Average usage households per month in KWh 329 332
Average sales tariff households in ANG per KWh 0.6130 0.6268
Average sales tariff in ANG per KWh 0.5823 0.5527
Unaccounted for usage in % of MWh intake 13.89% 12.10%
Water
Sales water in 1000 m3 10,473 10,677
Water intake from production in 1000 m3 14,554 15,189
Number of postpaid connections at year end 86,717 83,654
Average usage households per month in m3 7.906 7.8999
Average sales tariff households in ANG per m3 10.0354 10.0104
Average sales tariff in ANG per m3 10.4278 10.3092
Unaccounted for usage in % of m3 intake 27.59% 25.72%
Amounts in ANG x 1,000 / % / avg

Annual Report 2019
48

4_Consolidated Summary Financial Statements
49 >>
4_Consolidated Summary Financial Statements
49

Annual Report 2019
50
4.1 <Consolidated Summary Statement of Financial Position>
Amounts in ANG x 1,000
As at Dec 31, 2019 As at Dec 31, 2018
ASSETS
Non-current assets
Intangible assets 52,854 56,682
Property, Plant and Equipment 584,426 595,210
Right-of-use Assets 20,368 -
Other non - current financial assets 34,063 34,218
Deferred tax assets 16,484 12,025
708,195 698,135
Current assets
Inventories 44,257 37,766
Trade accounts receivable 101,336 88,736
Other receivables 9,714 15,192
Cash & cash equivalents 51,160 72,072
206,467 213,766
Total assets 914,662 911,901
EQUITY AND LIABILITIES
Shareholder’s equity
Share capital 528,000 528,000
Share premium 55,000 55,000
Preferred shares 72,800 72,800
Treasury shares (72,800) (72,800)
Accumulated losses (217,302) (250,602)
Profit for the year 13,124 32,505
378,822 364,903
Non-current liabilities
Financial liabilities 272,108 162,809
Customer deposits 25,560 25,332
Lease Liabilities 20,836 -
Provisions 71,615 76,630
390,119 264,771
Current liabilities
Corporate bonds IUH N.V. - 97,079
Trade accounts payable 67,859 91,014
Other liabilities 77,862 94,134
145,721 282,227
Total Equity and Liabilities 914,662 911,901

4_Consolidated Summary Financial Statements
51
4.2 <Consolidated Summary Statement of Comprehensive Income>
Amounts in ANG x 1,000
For the year ended Dec 31, 2019
For the year ended Dec 31, 2018
CONTINUING OPERATIONS
Revenue from contracts with customers 528,055 497,179
Direct costs production (232,771) (205,522)
Other direct cost of sales (16,080) (18,449)
Cost of sales (248,851) (223,971)
Gross profit 279,204 273,208
Personnel expenses 90,885 89,579
Other (post) employment benefits (net) 4,865 (89,159)
Parts, repairs & maintenance 40,294 59,183
Customer Relations Service Fees 7,112 6,820
General expenses 28,150 36,377
Depreciation and amortization expenses 62,843 60,166
Provision bad debts 22,785 48,030
Total operating expenses 256,934 210,996
Results from operating activities 22,270 62,212
Interest expenses (net) (13,828) (15,539)
Net finance costs (13,828) (15,539)
Profit before income tax 8,442 46,673
Income tax 4,682 (14,168)
Profit for the year 13,124 32,505
Other comprehensive gains / (losses)
Actuarial gains / (losses) 1,018 6,397
Deferred tax related to the components of other comprehensive results
(223) (1,407)
Other comprehensive gain /(loss) for the year, net of income tax
795 4,990
Total comprehensive gain for the year 13,919 37,496

Annual Report 2019
52
4.3 <Consolidated Summary Statement of Changes in Shareholder’s Equity>
Share capital Share premium
Preferred shares
Treasury shares
Accumulated losses
Total Shareholder’s
equity
Balance at January 1, 2018 528,000 55,000 72,800 (72,800) (269,440) 313,560
Effect of adoption of new accounting standards (note 5.6.7)
- - - - 13,848 13,848
Adjusted balance at January 1, 2018
528,000 55,000 72,800 (72,800) (255,592) 327,408
Profit for the year 2018 - - - - 32,505 32,505
Other comprehensive income for the year 2018
- - - - 4,990 4,990
Balance at December 31, 2018
528,000 55,000 72,800 (72,800) (218,097) 364,903
Total comprehensive income
37,495
Balance at January 1, 2019 528,000 55,000 72,800 (72,800) (218,097) 364,903
Profit for the year 2019 - - - - 13,124 13,124
Other comprehensive income for the year 2019
- - - - 795 795
Balance at December 31, 2019
528,000 55,000 72,800 (72,800) (204,178) 378,822
Total comprehensive income
13,919
Amounts in ANG x 1,000

4_Consolidated Summary Financial Statements
53
4.4 <Consolidated Summary Statement of Cash Flows>
Amounts in ANG x 1,000
For the year ended Dec 31,2019
For the year ended Dec 31, 2018
Cash flow from operating activities
Profit for the year 13,124 32,505
Adjustments for non-cash items:
Effect of adoption of new accounting standards - 13,848
Depreciations and amortization expenses 62,944 60,166
Provision doubtful debts 22,785 48,030
Disposal of property, plant, equipment (net) 6 -
Change in provision slow moving inventory (3,547) 12,142
Change in deferred tax asset (4,459) 15,576
Amortization on bond 1,272 1,868
Change in provisions (4,220) (114,717)
Finance cost 12,747 13,791
Total adjustments for non-cash items 87,528 50,704
Change in non-current financial assets 155 413
Change in Right-of-assets (1,020) -
Change in inventories (2,944) (24,130)
Change in trade accounts receivable (23,731) (61,469)
Change customer deposit 228 609
Change in other receivables (6,176) (11,038)
Change in trade accounts payable (23,155) 57,581
Change in other liabilities (excluding interest paid) (29,524) 31,879
Total of operational activities (86,167) (6,155)
Total cash flow from operating activities 14,485 77,054
Cash flow from investing activities
Acquisition of property, plant, equipment (45,269) (66,067)
Investment intangible assets (110) (11,400)
Total cash used in investing activities (45,379) (77,467)
Cash flow from financing activities
Proceeds from loans 125,000 200,000
Repayments of loans (100,886) (170,586)
Payments of lease (excluding interest) (2,444) -
Interest paid (11,688) (13,687)
Total cash flow used in financing activities 9,982 15,727
Balance at start of year 72,072 56,758
Increase / (decrease) (20,912) 15,314
Balance at end of year 51,160 72,072

Annual Report 2019
54

5_Notes to the Consolidated Summary Financial Statements
55 >>
5_Notes to the Consolidated Summary Financial Statements
55
Annual Report 2019
56
5.1 <General>
CORPORATE INFORMATIONIntegrated Utility Holding N.V. (IUH N.V., hereinafter ‘The Group’) was incorpo-
rated on September 12, 1997 in Willemstad, Curaçao. The shares of Kompania
di Awa i Elektrisidat N.V. (K.A.E.), a water and electricity production company
and Kompania di Distribushon di Elektrisidat i Awa (KODELA), a water and
electricity distribution company, were transferred into IUH N.V. On January
2, 2018, Kompania di Awa i Elektrisidat N.V and Kompania di Distribushon di
Elektrisidat i Awa were legally integrated and become Aqualectra N.V. The
principal activities of the Group are described in the ‘Profile’. The headquarters
of the Group is located at Rector Zwijssenstraat 1, Curaçao.
The objectives of the Group are:
- Investing funds in shares of utility companies which have the goals of
producing and distributing water and electricity; and
- Managing, controlling and administering of other companies and
representing interests of the shareholders and financers in/of the Group;
- Generating electricity and the production of water;
- Distributing electricity and water;
- Offering management consultancy- and engineering services; and
- Bottling of drinking water.
The Group’s authorized capital amounts to ANG 600 million, consisting of
600 shares at ANG 1 million par value each. 470 shares were issued to the
Island territory of Curaçao on June 1, 1998 with an additional 58 shares
issued on January 31, 2013 to the Government of Country Curaçao who be-
came the legal successor of the Island territory of Curaçao and the shareholder
of the Group after the restructuring of the Netherlands Antilles on October 10,
2010. All 528 shares are paid up in full.
UTILITIES SECTOR IN CURAÇAOConcessions
The National Ordinance for Electricity concession (‘Landsverordening
Elektriciteitsconcessies’) states that the building, construction or usage
of equipment for the generation of power and for the transmission and/or
transformation of electricity, in order to deliver this to a third party, is restricted
to the company to which permission has been granted by the Government.

5_Notes to the Consolidated Summary Financial Statements
57
Furthermore, the ordinance states that the concession shall be given for a
maximum period of 30 years with possibilities for extension.
On July 30, 2012 concessions for the production and distribution of electricity
were adopted, granting the Group the certainty of production of power for the
coming 30 years. On June 11, 2014 the Government adopted a concession
for the production of electricity. A notable change in this concession, com-
pared to the previous concession, is the simplification of various requirements.
Another major change in the new concession is the granting to Aqualectra of a
minimum and a maximum production capacity. This granted capacity can be
applied in direct form (own production) and indirect form (contracted produc-
tion). The amended concession was issued on June 19, 2014 and formalized
on November 6, 2014.
Tariff structureThe tariff structure for water and electricity consists of a (i) base component
and (ii) a fuel component. The base component is intended to cover all the
non-direct costs for the production, distribution and supply, while the fuel
component must cover the fuel costs and other direct costs of production and
sales. This separation made the application of a rate calculation system that
could track changes in fuel costs possible.
Determination of tariffsThe Ordinance for prices (‘Prijzenverordening’) states that the authority for the
determination and the adjustment of electricity and water tariffs, lies with the
Government of the Country of Curaçao.
The electricity and water tariff-structure adopted on June 1, 2012 comprises
three components, namely:
- the fuel component, which covers the direct costs (includes fuel, chemicals,
lubricants and purchase of electricity and water from third parties);
- the recovery component, which covers shortages in the fuel component
which developed between January 2011 up to, and including, May 2012;
- the base cost component, which covers the operational costs.
On July 26, 2017, the Council of Ministers approved tariff guidelines, which
include a Weighted Average Cost of Capital (WACC) component as part of the
base component. The WACC is calculated and stipulated on an annual basis,
based on guidelines as set in the tariff guidelines.

Annual Report 2019
58
Energy policyIn 2009, the Group was notified by the Government that BTP was appointed
as the Regulator for the review, determination and approval of the tariffs for
water and electricity.
During 2017, a new Energy policy was drafted and approved by the Council of
Ministers on May 16, 2017. This policy introduces an Energy Bureau concept
as policy maker, while BTP remains with supervision tasks and is intended to
lower the tariffs, upgrade the services to the customers, provide choices for
the clients and increase the reliability and sustainability of energy.
5.2 <Significant accounting policies>
BASIS OF PREPARATION SUMMARY FINANCIAL STATEMENT The accompanying consolidated summary financial statements of the
Group are prepared in accordance with the International Financial Reporting
Standards (IFRS) as issued by the International Accounting Standards Board
(IASB) and book 2 of Curaçao Civil Code. The consolidated summary financial
statements have been prepared on a historical cost basis. The consolidated
summary financial statements are presented in Netherlands Antillean guilders
and all values are rounded to the nearest thousand (ANG’000), except when
otherwise indicated.
Management has concluded that the consolidated summary financial state-
ments fairly represent the Group’s financial position, financial performance
and cash flows. The consolidated summary financial statements comply in all
material respects with applicable IFRS.
The consolidated summary financial statements for the year ended 2019
were approved for issue by the Board of Supervisory Directors on June 23,
2020. The shareholders have the power to amend the consolidated summary
financial statements after the date of issuance.
The consolidated summary financial statements provide comparative infor-
mation in respect of the previous period.

5_Notes to the Consolidated Summary Financial Statements
59
BASIS OF CONSOLIDATION The consolidated summary financial statements comprise the financial
statements of the Group and its subsidiaries as at 31 December 2019.
Control is achieved when the Group is exposed, or has rights, to variable
returns from its involvement with the investee and has the ability to affect those
returns through its power over the investee. Specifically, the Group controls an
investee if, and only if, the Group has:
- Power over the investee (i.e., existing rights that give it the current ability to
direct the relevant activities of the investee)
- Exposure, or rights, to variable returns from its involvement with the investee
- The ability to use its power over the investee to affect its returns
Generally, there is a presumption that a majority of voting rights results in con-
trol. To support this presumption and when the Group has less than a majority
of the voting or similar rights of an investee, the Group considers all relevant
facts and circumstances in assessing whether it has power over an investee,
including:
- The contractual arrangement(s) with the other vote holders of the investee
- Rights resulting from other contractual arrangements
- The Group’s voting rights and potential voting rights
The Group re-assesses whether or not it controls an investee if facts and
circumstances indicate that there are changes to one or more of the three ele-
ments of control. Consolidation of a subsidiary begins when the Group obtains
control over the subsidiary and ceases when the Group loses control of the
subsidiary. Assets, liabilities, income and expenses of a subsidiary acquired or
disposed of during the year are included in the consolidated summary finan-
cial statements from the date the Group gains control until the date the Group
ceases to control the subsidiary.
Profit or loss and each component of Other Comprehensive Income (OCI) are
attributed to the equity holders of the parent of the Group and to the non-con-
trolling interests, even if this results in the non-controlling interests having a
deficit balance. When necessary, adjustments are made to the financial state-
ments of subsidiaries to bring their accounting policies in line with the Group’s
accounting policies. All intra-group assets and liabilities, equity, income,
expenses and cash flows relating to transactions between members of the
Group are eliminated in full on consolidation.

Annual Report 2019
60
A change in the ownership interest of a subsidiary, without a loss of control,
is accounted for as an equity transaction. If the Group loses control over a
subsidiary, it derecognizes the related assets (including goodwill), liabilities,
non-controlling interest and other components of equity, while any resultant
gain or loss is recognized in profit or loss. Any investment retained is recog-
nized at fair value.
IUH N.V. has the following subsidiaries (all are incorporated in Curaçao):
Name % equity interest 2019
Aqualectra N.V. 100%
Aqualectra Multi Utility Company N.V. (AMU) 100%
General Engineering & Utility Services N.V. (GEUS)** 100%
Aqualectra Bottling Co. N.V.** 100%
The legal structure now consists of the holding company (IUH N.V.) and
two subsidiaries, namely Aqualectra N.V. and Aqualectra Multi Utility N.V.,
hereinafter collectively referred to as ‘The Group’. The Group is responsible for
the management of the abovementioned companies (with the exception of
KUMEPE N.V.). During the year 2019 Aqualectra Bottling and GEUS did not
engage in any activities.
5.3 <Summary of significant accounting policies>
A) CURRENT VERSUS NON-CURRENT CLASSIFICATIONThe Group presents assets and liabilities in the statement of financial position
based on current/non-current classification. An asset is current when it is:
- Expected to be realized or intended to be sold or consumed in normal
operating cycle;
- Held primarily for the purpose of trading;
- Expected to be realized within twelve months after the reporting period, or;
- Cash or cash equivalent unless restricted from being exchanged or used to
settle a liability for at least twelve months after the reporting period.
All other assets are classified as non-current.
**The entities GEUS and Aqualectra Bottling
Co. N.V. are still partof the group, but they
are in liquidation.

5_Notes to the Consolidated Summary Financial Statements
61
A liability is current when:
- It is expected to be settled in normal operating cycle;
- It is held primarily for the purpose of trading;
- It is due to be settled within twelve months after the reporting period, or;
- There is no unconditional right to defer the settlement of the liability for at
least twelve months after the reporting period.
The Group classifies all other liabilities as non-current.
Deferred tax assets and liabilities are classified as non-current assets and
liabilities.
B) FAIR VALUE MEASUREMENTThe Group holds no financial assets or liabilities that are measured at fair value
at December 31, 2019 or December 31, 2018.
Fair value is the price that would be received to sell an asset or paid to transfer
a liability in an orderly transaction between market participants at the mea-
surement date. The fair value measurement is based on the presumption that
the transaction to sell the asset or transfer the liability takes place either:
- In the principal market for the asset or liability, or
- In the absence of a principal market, in the most advantageous market for
the asset or liability
The principal or the most advantageous market must be accessible for the Group.
The fair value of an asset or a liability is measured using the assumptions that
market participants would use when pricing the asset or liability, assuming
that market participants act in their economic best interest.
A fair value measurement of a non-financial asset takes into account a market
participant’s ability to generate economic benefits by using the asset in its
highest and best use or by selling it to another market participant that would
use the asset in its highest and best use.
The Group uses valuation techniques that are appropriate in the circum-
stances and for which sufficient data are available to measure fair value,
maximizing the use of relevant observable inputs and minimizing the use of
unobservable inputs.

Annual Report 2019
62
All assets and liabilities for which fair value is measured or disclosed in the
financial statements are categorized within the fair value hierarchy, described
as follows, based on the lowest level input that is significant to the fair value
measurement as a whole:
- Level 1 - Quoted (unadjusted) market prices in active markets for identical
assets or liabilities.
- Level 2 - Valuation techniques for which the lowest level input that is
significant to the fair value measurement is directly or indirectly observable.
- Level 3 - Valuation techniques for which the lowest level input that is
significant to the fair value measurement is unobservable.
For the purpose of fair value disclosures, the Group has determined classes of
assets and liabilities on the basis of the nature, characteristics and risks of the
asset or liability and the level of the fair value hierarchy as explained above.
C) FOREIGN CURRENCIESFunctional and presentation currency
The Group’s consolidated financial statements are presented in Netherlands
Antillean Guilders (ANG), which is also the parent company’s and its subsid-
iaries’ functional currency.
Transactions and balances
Transactions in foreign currencies are initially recorded by the Group’s entities
at their respective functional currency spot rates at the date the transaction
first qualifies for recognition.
Monetary assets and liabilities denominated in foreign currencies are translat-
ed at the functional currency spot rates of exchange at the reporting date.
Differences occurring on settlement or translation of monetary items are recog-
nized in profit or loss with the exception of monetary items that are designated
as part of the hedge of the Group’s net investment of a foreign operation.
These are recognized in other comprehensive income until the net investment
is disposed of, at which time, the cumulative amount is reclassified to profit or
loss. Tax charges and credits attributable to exchange differences on those
monetary items are also recorded in other comprehensive income.
Non-monetary items that are measured in terms of historical cost in a foreign
currency are translated using the exchange rates at the dates of the initial

5_Notes to the Consolidated Summary Financial Statements
63

Annual Report 2019
64
transactions. Non-monetary items measured at fair value in a foreign currency
are translated using the exchange rates at the date when the fair value is deter-
mined. The gain or loss resulting on translation of non-monetary items mea-
sured at fair value is treated in line with the recognition of gain or loss on change
in fair value of the item (i.e., translation differences on items whose fair value
gain or loss is recognized in other comprehensive income or profit or loss are
also recognized in other comprehensive income or profit or loss, respectively).
In determining the spot exchange rate to use on initial recognition of the related
asset, expense or income (or part of it) on the derecognition of a non-monetary
asset or non-monetary liability relating to advance consideration, the date of the
transaction is the date on which the Group initially recognizes the non-monetary
asset or non-monetary liability arising from the advance consideration. If there
are multiple payments or receipts in advance, the Group determines the trans-
action date for each payment or receipt of advance consideration.
Any goodwill arising on the acquisition of a foreign operation and any fair
value adjustments to the carrying amounts of assets and liabilities arising on
the acquisition are treated as assets and liabilities of the foreign operation and
translated at the spot rate of exchange at the reporting date.
D) PROPERTY, PLANT AND EQUIPMENTConstruction in progress is stated at cost, net accumulated impairment losses,
if any. Plant and equipment are stated at cost, less accumulated depreciation
and accumulated impairment losses, if any. Such cost includes the cost of
replacing part of the plant and equipment and borrowing costs for long-term
construction projects if the recognition criteria are met. When significant parts
of plant and equipment are required to be replaced at intervals, the Group
depreciates them separately based on their specific useful lives. Likewise,
when a major inspection is performed, its cost is recognized in the carrying
amount of the plant and equipment as a replacement if the recognition criteria
are satisfied. All other repair and maintenance costs are recognized in profit or
loss as incurred.
Expenses for the decommissioning of the Mundu Nobo plant are included in
property, plant and equipment. These capitalized expenses are based upon
estimations performed by an independent expert. Since commencement of
the demolition activities, the provision has been adjusted based on more accu-
rate information gathered internally regarding the expected decommission

5_Notes to the Consolidated Summary Financial Statements
65
costs. Depreciation of the capitalized decommissioning cost is calculated by
the straight-line method to write off the cost of each asset, or the recoverable
amounts, to their residual values over their estimated useful life, taking into
account the useful life of the most important components.
Major spare parts are accounted for as property, plant and equipment when
the Group expects to use them during more than one period. Similarly, if the
spare parts can be used only in connection with an item of property, plant and
equipment, they are accounted for as property, plant and equipment.
The cost of work in progress comprises materials, direct labor, service charges
and other costs.
Depreciation is calculated on the straight-line basis over their estimated useful life,
taking into account the useful life of the most important components as follows:
Buildings 10 to 50 years
Plant and equipment 5 to 33 years
Distribution network 15 to 40 years
Other assets 3 to 50 years
Major spare parts are depreciated in accordance with the category of Plant &
Equipment.
An item of property, plant and equipment and any significant part initially rec-
ognized is derecognized upon disposal or when no future economic benefits
are expected from its use or disposal. Any gain or loss resulting on derecog-
nition of the asset (calculated as the difference between the net disposal
proceeds and the carrying amount of the asset) is included in the income
statement when the asset is derecognized. The asset’s residual values, useful
lives and methods of depreciation are reviewed at each financial year-end and
adjusted prospectively, if appropriate.
E) PROPERTY, PLANT AND EQUIPMENT CONTRIBUTED BY CUSTOMERSThe Group recognizes as property, plant and equipment any contribution
received from its customers to be utilized in the construction or acquisition
of an item required for the connection to its distribution network and/or asset
transferred by its customers, also for the purpose of providing the customer
with ongoing access to supply of electricity and/or water. The corresponding
amount is credited to the cost of work in progress or is shown as deferred
credit in the case where construction has not yet started.

Annual Report 2019
66
F) LEASESThe Group assesses at contract inception whether a contract is, or contains, a
lease. That is, if the contract conveys the right to control the use of an identi-
fied asset for a period of time in exchange for consideration.
Group as a lessee The Group applies a single recognition and measurement approach for all
leases, except for short-term leases and leases of low-value assets. The
Group recognizes lease liabilities to make lease payments and right-of-use
assets representing the right to use the underlying assets.
1. Right-of-use assets
The Group recognizes right-of-use assets at the commencement date of
the lease (i.e., the date the underlying asset is available for use). Right-of-
use assets are measured at cost, less any accumulated depreciation and
impairment losses, and adjusted for any remeasurement of lease liabilities.
The cost of right-of-use assets includes the amount of lease liabilities rec-
ognized, initial direct costs incurred, and lease payments made at or before
the commencement date less any lease incentives received. Right-of-use
assets are depreciated on a straight-line basis over the shorter of the lease
term and the estimated useful lives of the assets, as follows:
- Land lease 10 to 30 years
- Car leases 1 to 6 years
- Solar panel energy 1 to 2 years
If ownership of the leased asset transfers to the Group at the end of the
lease term or the cost reflects the exercise of a purchase option, deprecia-
tion is calculated using the estimated useful life of the asset.
The right-of-use assets are also subject to impairment. Refer to the ac-
counting policies in section (s) Impairment of non-financial assets.
2. Lease liabilities
At the commencement date of the lease, the Group recognizes lease liabil-
ities measured at the present value of lease payments to be made over the
lease term. The lease payments include fixed payments (including in sub-
stance fixed payments) less any lease incentives receivable, variable lease
payments that depend on an index or a rate, and amounts expected to be

5_Notes to the Consolidated Summary Financial Statements
67
paid under residual value guarantees. The lease payments also include
the exercise price of a purchase option reasonably certain to be exercised
by the Group and payments of penalties for terminating the lease, if the
lease term reflects the Group exercising the option to terminate. Variable
lease payments that do not depend on an index or a rate are recognized as
expenses (unless they are incurred to produce inventories) in the period in
which the event or condition that triggers the payment occurs.
In calculating the present value of lease payments, the Group uses its
incremental borrowing rate at the lease commencement date because the
interest rate implicit in the lease is not readily determinable. After the com-
mencement date, the amount of lease liabilities is increased to reflect the
accretion of interest and reduced for the lease payments made. In addition,
the carrying amount of lease liabilities is remeasured if there is a modifi-
cation, a change in the lease term, a change in the lease payments (e.g.,
changes to future payments resulting from a change in an index or rate
used to determine such lease payments) or a change in the assessment of
an option to purchase the underlying asset (see Note 5.5.3).
3. Short-term leases and leases of low-value assets
The Group applies the short-term lease recognition exemption to its short-
term leases of machinery and equipment (i.e., those leases that have a
lease term of 12 months or less from the commencement date and do not
contain a purchase option). It also applies the lease of low-value assets
recognition exemption to leases of office equipment that are considered
to be low value. Lease payments on short-term leases and leases of low
value assets are recognized as expense on a straight-line basis over the
lease term.
Group as a lessorLeases in which the Group does not transfer substantially all the risks and
rewards of ownership of an asset are classified as operating leases. Rental
income arising is accounted for on a straight-line basis over the lease terms
and is included in revenue in the statement of profit or loss due to its operating
nature. Initial direct costs incurred in negotiating and arranging an operating
lease are added to the carrying amount of the leased asset and recognized
over the lease term on the same basis as rental income. Contingent rents are
recognized as revenue in the period in which they are earned.

Annual Report 2019
68
Accounting prior to January 1, 2019
Prior to 1 January 2019, the determination of whether an arrangement is
(or contains) a lease was based on the substance of the arrangement at the
inception of the lease. The arrangement is, or contains, a lease if fulfilment of
the arrangement is dependent on the use of a specific asset (or assets) and
the arrangement conveys a right to use the asset (or assets), even if that asset
is (or those assets are) not explicitly specified in an arrangement.
Group as a lessee
A lease is classified at the inception date as a finance lease or an operating
lease. A lease that transfers substantially all the risks and rewards incidental
to ownership to the Group is classified as a finance lease.
Finance leases are capitalized at the commencement of the lease at the
inception date fair value of the leased property or, if lower, at the present value
of the minimum lease payments. Lease payments are apportioned between
finance charges and reduction of the lease liability so as to achieve a constant
rate of interest on the remaining balance of the liability. Finance charges are
recognized in finance costs in the statement of profit or loss.
A leased asset is depreciated over the useful life of the asset. However, if there
is no reasonable certainty that the Group will obtain ownership by the end
of the lease term, the asset is depreciated over the shorter of the estimated
useful life of the asset and the lease term.
G) BORROWING COSTSBorrowing costs directly attributable to the acquisition, construction or produc-
tion of an asset that necessarily takes a substantial period of time to get ready
for its intended use or sale are capitalized as part of the cost of the asset.
All other borrowing costs are expensed in the period they occur. Borrowing
costs consists of interest and other costs that an entity incurs in connection
with the borrowing of funds.
H) INTANGIBLE ASSETSThe Group holds intangible assets with finite lives. Intangible assets with finite
lives are amortized over the useful economic life and assessed for impairment
whenever there is an indication that the intangible asset may be impaired.
The amortization period and the amortization method for an intangible asset
with a finite useful life are reviewed at least at the end of each reporting period.

5_Notes to the Consolidated Summary Financial Statements
69
Changes in the expected useful life or the expected pattern of consumption
of future economic benefits embodied in the asset are considered to modify
the amortization period or method, as appropriate, and are treated as changes
in accounting estimates. The amortization expense on intangible assets with
finite lives is recognized in the statement of profit or loss in the expense
category that is consistent with the function of the intangible assets.
An intangible asset is derecognized upon disposal (i.e., at the date the recipi-
ent obtains control) or when no future economic benefits are expected from
its use or disposal. Any gain or loss arising upon derecognition of the asset
(calculated as the difference between the net disposal proceeds and the
carrying amount of the asset) is included in the statement of profit or loss.
Research and development costs
Research costs are expensed as incurred. Development expenditures on an
individual project are recognized as an intangible asset when the Group can
demonstrate:
- The technical feasibility of completing the intangible asset so that the asset
will be available for use or sale
- Its intention to complete and its ability and intention to use or sell the asset
- How the asset will generate future economic benefits
- The availability of resources to complete the asset
- The ability to measure reliably the expenditure during development
Following initial recognition of the development expenditure as an asset, the
asset is carried at cost less any accumulated amortization and accumulated
impairment losses. Amortization of the asset begins when development is
complete, and the asset is available for use. It is amortized over the period of
expected future benefit. Amortization is recorded in cost of sales. During the
period of development, the asset is tested for impairment annually.
Licenses
The Group made upfront payments to purchase licenses related to the ERP
system. Separately acquired licenses are shown at historical cost. Licenses have
a finite useful life and are carried at cost less accumulated amortization and
accumulated impairment losses. Amortization is calculated using the straight-
line method to allocate the cost of licenses over their estimated useful lives.

Annual Report 2019
70
I) IMPAIRMENT OF NON-FINANCIAL ASSETSFurther disclosures relating to impairment of non-financial assets are also
provided in the following notes:
- Disclosures for significant assumptions Note 5.3
- Property, plant and equipment Note 5.5.2
- Intangible assets Note 5.5.1
- Leases Note 5.5.3
The Group assesses at each reporting date, whether there is an indication
that the asset may be impaired. If any indication exists, or when annual
impairment testing for an asset is required, the Group estimates the asset’s
recoverable amount. An asset’s recoverable amount is the higher of an asset’s
or cash-generating unit’s (CGU) fair value less costs of disposal and its value
in use. Recoverable amount is determined for an individual asset, unless the
asset does not generate cash inflows that are largely independent of those
from other assets or groups of assets. When the carrying amount of an asset
or CGU exceeds its recoverable amount, the asset is considered impaired and
is written down to its recoverable amount.
In assessing value in use, the estimated future cash flows are discounted to
their present value using a pre-tax discount rate that reflects current market
assessments of the time value of money and the risks specific to the asset.
In determining fair value less costs of disposal, recent market transactions are
taken into account. If no such transactions can be identified, an appropriate
valuation model is used. These calculations are corroborated by valuation
multiples, quoted share prices for publicly traded companies or other available
fair value indicators.
The Group bases its impairment calculation on detailed budgets and forecast
calculations, which are prepared separately for each of the Group’s CGU’s to
which the individual assets are allocated. These budget and forecast calculations
generally cover a period of five years. For longer periods, a long-term growth
rate is calculated and applied to project future cash flows after the fifth year.
Impairment losses of continuing operations, including impairment on invento-
ries, are recognized in the income statement in expense categories consistent
with the function of the impaired asset.

5_Notes to the Consolidated Summary Financial Statements
71
An assessment is made at each reporting date whether there is any indi-
cation that previously recognized impairment losses may no longer exist
or may have decreased. If such indication exists, the Group estimates the
asset’s CGU’s recoverable amount. A previously recognized impairment
loss is reversed only if there has been a change in the assumptions used to
determine the asset’s recoverable amount since the last impairment loss
was recognized.
The reversal is limited so that the carrying amount of the asset does not
exceed the lower of its recoverable amount, and the carrying amount that
would have been determined, net of depreciation, had no impairment loss
been recognized for the asset in prior years. Such reversal is recognized in the
income statement unless the asset is carried at a revaluated amount, in which
case, the reversal is treated as a revaluation increase.
Intangible assets with indefinite useful lives are tested for impairment annually
as at December 31 at the CGU level, as appropriate, and when circumstances
indicate that the carrying value may be impaired.
J) FINANCIAL INSTRUMENTSA financial instrument is any contract that gives rise to a financial asset of one
entity and a financial liability or equity instrument of another entity.
Financial assetsInitial recognition and measurement
Financial assets are classified, at initial recognition, as subsequently mea-
sured at amortized cost, fair value through other comprehensive income (OCI),
and fair value through profit or loss.
The classification of financial assets at initial recognition depends on the finan-
cial asset’s contractual cash flow characteristics and the Group’s business
model for managing them. With the exception of trade receivables that do not
contain a significant financing component or for which the Group has applied
the practical expedient, the Group initially measures a financial asset at its
fair value plus, in the case of a financial asset not at fair value through profit or
loss, transaction costs. Trade receivables that do not contain a significant fi-
nancing component or for which the Group has applied the practical expedient
are measured at the transaction price determined under IFRS 15. Refer to the
accounting policies in section (p) Revenue from contracts with customers.

Annual Report 2019
72
In order for a financial asset to be classified and measured at amortized cost
or fair value through OCI, it needs to give rise to cash flows that are ‘solely
payments of principal and interest (SPPI)’ on the principal amount outstand-
ing. This assessment is referred to as the SPPI test and is performed at an
instrument level.
The Group’s business model for managing financial assets refers to how it
manages its financial assets in order to generate cash flows. The business
model determines whether cash flows will result from collecting contractual
cash flows, selling the financial assets, or both.
Purchases or sales of financial assets that require delivery of assets within a
time frame established by regulation or convention in the marketplace (regular
way trades) are recognized on the trade date, i.e., the date that the Group
commits to purchase or sell the asset.
Subsequent measurement
For purposes of subsequent measurement, financial assets are classified in
four categories:
- Financial assets at amortized cost (debt instruments).
- Financial assets at fair value through OCI with recycling of cumulative gains
and losses (debt instruments).
- Financial assets designated at fair value through OCI with no recycling of
cumulative gains and losses upon derecognition (equity instruments).
- Financial assets at fair value through profit or loss.
As at December 31, 2019 and 2018 the group only holds financial assets
classified as financial assets at amortized cost (debt instruments).
Financial assets at amortized cost (debt instruments)
This category is the most relevant to the Group. The Group measures financial
assets at amortized cost if both of the following conditions are met:
- The financial asset is held within a business model with the objective to hold
financial assets in order to collect contractual cash flows
And
- The contractual terms of the financial asset give rise on specified dates to
cash flows that are solely payments of principal and interest on the principal
amount outstanding

5_Notes to the Consolidated Summary Financial Statements
73
Financial assets at amortized cost are subsequently measured using the effective
interest (EIR) method and are subject to impairment. Gains and losses are rec-
ognized in profit or loss when the asset is derecognized, modified or impaired.
The Group’s financial assets at amortized cost includes loans and (trade) receiv-
ables, and concession deposit included under other non-current financial assets.
Derecognition
A financial asset (or, where applicable, a part of a financial asset or part of a
group of similar financial assets) is primarily derecognized (i.e., removed from
the consolidated statement of financial position) when:
- The rights to receive cash flows from the asset have expired.
Or
- The Group has transferred its rights to receive cash flows from the asset or
has assumed an obligation to pay the received cash flows in full without
material delay to a third party under a ‘pass-through’ arrangement; and
either (a) the Group has transferred substantially all the risks and rewards of
the asset, or (b) the Group has neither transferred nor retained substantially
all the risks and rewards of the asset, but has transferred control of the asset.
When the Group has transferred its rights to receive cash flows from an asset
or has entered into a pass-through arrangement, it evaluates if, and to what
extent, it has retained the risks and rewards of ownership. When it has neither
transferred nor retained substantially all of the risks and rewards of the asset,
nor transferred control of the asset, the Group continues to recognize the
transferred asset to the extent of its continuing involvement. In that case, the
Group also recognizes an associated liability. The transferred asset and the
associated liability are measured on a basis that reflects the rights and obliga-
tions that the Group has retained.
Continuing involvement that takes the form of a guarantee over the transferred
asset is measured at the lower of the original carrying amount of the asset and
the maximum amount of consideration that the Group could be required to repay.
Impairment of financial assets
The Group recognizes an allowance for expected credit losses (ECLs) for all
debt instruments not held at fair value through profit or loss. ECLs are based
on the difference between the contractual cash flows due in accordance
with the contract and all the cash flows that the Group expects to receive,

Annual Report 2019
74
discounted at an approximation of the original effective interest rate.
The expected cash flows will include cash flows from the sale of collateral
held or other credit enhancements that are integral to the contractual terms.
ECLs are recognized in two stages. For credit exposures for which there has
not been a significant increase in credit risk since initial recognition, ECLs are
provided for credit losses that result from default events that are possible with-
in the next 12-months (a 12-month ECL). For those credit exposures for which
there has been a significant increase in credit risk since initial recognition, a
loss allowance is required for credit losses expected over the remaining life of
the exposure, irrespective of the timing of the default (a lifetime ECL).
For trade receivables and contract assets, the Group applies a simplified
approach in calculating ECLs. Therefore, the Group does not track changes
in credit risk, but instead recognizes a loss allowance based on lifetime ECLs
at each reporting date. The Group has established a provision matrix that is
based on its historical credit loss experience, adjusted for forward-looking
factors specific to the debtors and the economic environment.
Further disclosure relating to impairment of trade receivables, including con-
tract assets is also provided in Notes 5.4.2 ‘Credit Risk’.
From a financial point of view, the Group considers a financial asset in default
when contractual payments are 30 days past due. However, in certain cases,
the Group may also consider a financial asset to be in default when internal
or external information indicates that the Group is unlikely to receive the
outstanding contractual amounts in full before taking into account any credit
enhancements held by the Group. A financial asset is written off when there is
no reasonable expectation of recovering the contractual cash flows.
Financial liabilities Initial recognition and measurement
Financial liabilities are classified, at initial recognition, as financial liabilities at
fair value through profit or loss, loans and borrowings, payables, or as deriva-
tives designated as hedging instruments in an effective hedge, as appropriate.
All financial liabilities are recognized initially at fair value and, in the case of
loans and borrowings and payables, net of directly attributable transaction costs.

5_Notes to the Consolidated Summary Financial Statements
75
The Group’s financial liabilities include trade and other payables, loans and
borrowings including bank overdrafts.
Subsequent measurementLoans and borrowings
After initial recognition, interest-bearing loans and borrowings are subse-
quently measured at amortized cost using the EIR method. Gains and losses
are recognized in profit or loss when the liabilities are derecognized as well as
through the EIR amortization process. Amortized cost is calculated by taking
into account any discount or premium on acquisition and fees or costs that are
an integral part of the EIR. The EIR amortization is included as finance costs in
the statement of profit or loss.
Derecognition
A financial liability is derecognized when the obligation under the liability
is discharged or cancelled or expires. When an existing financial liability is
replaced by another from the same lender on substantially different terms,
or the terms of an existing liability are substantially modified, such an ex-
change or modification is treated as the derecognition of the original liability
and the recognition of a new liability. The difference in the respective carrying
amounts is recognized in the statement of profit or loss.
Offsetting of financial instrumentsFinancial assets and financial liabilities are offset, and the net amount is
reported in the consolidated statement of financial position if there is a cur-
rently enforceable legal right to offset the recognized amounts and there is an
intention to settle on a net basis, to realize the assets and settle the liabilities
simultaneously.
K) INVENTORIESInventories are valued at the lower of cost and net realizable value.
Costs incurred in bringing each product to its present location and condition
are accounted for, as follows:
- Raw materials (Fuel inventory): purchase cost on a first-in/first-out
(FIFO) basis.
- Finished goods (Parts inventory): cost of direct materials including
shipping and freight on a weighted average cost basis.

Annual Report 2019
76
Net realizable value is the estimated selling price in the ordinary course of
business, less estimated costs of completion and the estimated costs neces-
sary to make the sale.
L) CASH POSITION (INCLUDES ‘CASH AND CASH EQUIVALENTS’ AND ‘BANK OVERDRAFT’)Cash and cash equivalents are comprised of cash on hand, deposits held at
call with banks, other short-term highly liquid investments.
M) SHARE CAPITALCommon shares and preferred shares are classified as equity. Dividends on
common shares and preferred shares are recognized in equity in the period in
which they are declared.
N) TREASURY SHARESOwn equity instruments that are reacquired (treasury shares) are recognized
at cost and deducted from equity. No gain or loss is recognized in profit or loss
on the purchase, sale, issue or cancellation of the Group’s own equity instru-
ments. Any difference between the carrying amount and the consideration, if
reissued, is recognized in share premium.
O) PROVISIONSGeneralProvisions are recognized when the Group has a present obligation (legal or
constructive) as a result of a past event, it is probable that an outflow of re-
sources embodying economic benefits will be required to settle the obligation
and a reliable estimate can be made of the amount of the obligation.
When the Group expects some or all of a provision to be reimbursed, for
example, under an insurance contract, the reimbursement is recognized
as a separate asset, but only when the reimbursement is virtually certain.
The expense relating to a provision is presented in the statement of profit or
loss net of any reimbursement.
If the effect of the time value of money is material, provisions are discounted
using a current pre-tax rate that reflects, when appropriate, the risks specific to
the liability. When discounting is used, the increase in the provision due to the
passage of time is recognized as a finance cost.

5_Notes to the Consolidated Summary Financial Statements
77
Onerous contractsIf the Group has a contract that is onerous, the present obligation under the
contract is recognized and measured as a provision. However, before a sepa-
rate provision for an onerous contract is established, the Group recognizes any
impairment loss that has occurred on assets dedicated to that contract.
An onerous contract is a contract under which the unavoidable costs (i.e., the
costs that the Group cannot avoid because it has the contract) of meeting the
obligations under the contract exceed the economic benefits expected to be
received under it. The unavoidable costs under a contract reflect the least net
cost of exiting from the contract, which is the lower of the cost of fulfilling it and
any compensation or penalties arising from failure to fulfill it.
Provision for the decommissioning of Mundo NoboThe Group records a provision for decommissioning costs of the Mundo Nobo
plant which consists of the costs for the demolition of buildings, civil works
and installations, including the costs of removal and eventual processing of
the residuals. Decommissioning costs are provided at the expected costs to
settle the obligation and are recognized as part of the cost of particular asset.
The unwinding of the discount is expensed as incurred and recognized in the
consolidated statement of comprehensive income as finance cost. The esti-
mated future costs of decommissioning are reviewed annually and adjusted
as appropriate. In the intervening years, the value is increased with accrued
interest and any changes in the estimated future costs added to or deducted
from the cost of the asset.
P) EMPLOYMENT BENEFITSGeneralCertain employee benefits provisions, except for the provision for vacation
leave, are based on actuarial calculations. For the key actuarial assumptions
please see note 5.5.7.1. The independent and qualified actuary obtained
sufficient information in order to perform the valuations.
Post-employment benefitsAll the post-employment benefit plans within the Group are defined benefit plans.
With the exception of the pension plan which was changed to a Defined Con-
tribution plan as per January 1, 2018. The post-employment benefit account-
ing costs are assessed using the projected unit credit method. Under this
method, the cost of providing post-employment benefits is charged to the

Annual Report 2019
78

5_Notes to the Consolidated Summary Financial Statements
79
statement of comprehensive income so as to spread the regular cost over the
service lives of employees in accordance with the advice of qualified actuaries
who carried out a full valuation of the plans. The post-employment benefit ob-
ligation is measured as the present value of the estimated future cash outflows
using market yield of high quality USD denominated corporate bonds, which
have terms of approximately the terms of the related liability. Any unrecog-
nized past service costs and the fair value of any plan assets are deducted.
Actuarial gains and losses are immediately recognized in the period in which
they occur through the statement of other comprehensive income.
Below follows a description of the different post-employment plans applicable
to the Group:
APC Pension plan
Certain employees of the Group (ex-civil servants) participate in a pension plan
administered at Algemeen Pensioenfonds van Curaçao (APC). The pension
plan administered by APC is a multi-employer defined benefit plan. In 2015
certain changes were made to the pension plan effective January 1, 2017.
These changes include calculation of the pension as a fixed percentage of the
career-average salaries versus average salaries of the last two calendar years
of service, and an increase of the pension age to 65. At reporting date there
was no information available to use benefit accounting. Therefore, the plan is
accounted for as if it were a defined contribution plan where the Group’s share
in the contribution amount is recognized as an expense.
APC Supplementary pension (‘Duurtetoeslag’)
In 1943 the Government guaranteed civil servants a pension that amounts to
70% of their average salary received during 24 months before their retirement.
The supplementary pension (the so-called ‘Duurtetoeslag’) is the difference
between the guaranteed pension amount and the pension actually built-up
as per the APC pension agreement. As per National Decree of July 12, 1995
it was stipulated that the legal entity that was the last to employ the person
concerned, is responsible for payment of the supplementary pension. This
plan is unfunded.
Vidanova pension plan
The employees of the Group that do not participate in the APC pension plan,
participate in a multi-employer defined contribution plan (Vidanova) in which

Annual Report 2019
80
it is compulsory for all employees to participate if and when they comply with
all the required conditions. The pension plan is generally funded by payments
from employees and by the employers, taking into account recommendations
of independent qualified actuaries. A level premium contribution is charged as
an advance for the defined contribution plans.
The advance contributions for this plan are based on a percentage of the pen-
sion base. The funded status of the pension plan is actuarially calculated on a
periodic basis, in accordance with IAS 19.
Regarding the active members of the plan, sufficient information is available
to account for the Companies’ proportionate share of the defined contribution
obligation, plan assets and post-employment benefit costs. The obligations
towards retired staff are fully funded by the pension fund and no costs are
charged to the Group.
APC Early retirement benefit (‘VUT’)
In the National Ordinance of December 27, 1995, it is stipulated that the civil
servants have the option of filing a request with the Governor to retire from
service at the age of 55. The resulting liability due to early retirement of per-
sons for the period in which these early retired persons are between the age of
55 and 60 years will be borne by the legal entity that was the last to employ
the respective persons.
Aqualectra VUT
According to the collective labor agreements of Aqualectra Distribution
and Aqualectra Production, employees have the option of requesting early
retirement to the Board of Managing Directors (BMD). The BMD decides
whether the employee’s request will be honored. Given the changes in
Aqualectra’s pension plan, all early retirement requests were placed on hold
by Management, pending a resolution how this plan will be aligned with the
new pension age and plan.
AOV/BVZ compensation
Based on a protocol signed in 2017 and renegotiated in 2018, employees
reaching 60 years of age during coming years, up to and including 2023,
will have the choice to retire at 60 years or continue working until they
reach 65 years of age. This stems from the change of the age at which
a citizen of Curaçao is eligible for a general pension grant (Algemene

5_Notes to the Consolidated Summary Financial Statements
81
Ouderdomsvoorziening – AOV). In 2013, the lawful age at which a citizen
could apply for this grant was changed from 60 to 65 years. Given the
strategic goal of Aqualectra to increase efficiency by investing in sophisticated
applications and consequently reducing the number of FTE’s, it was negotiat-
ed with the Unions that the age of 60 will be maintained for the employees of
Aqualectra as retirement age. Up to and including 2023, employees reaching
60 years will have the choice to retire or continue working until 65 years of
age. Acknowledging the fact that those retiring at age 60, will be disadvan-
taged as they will only receive the general pension grant when they reach age
65, the BMD agreed with the Unions that the gap will be duly compensated.
The Provision AOV/BVZ compensation aims at bridging the gap caused by:
- The employee not being eligible yet for the general pension grant (AOV);
- The difference in social security premiums which are lawfully lower when
reaching age 65;
- Any tax consequences the above may cause.
Provision retirement stimulation
Based on a protocol signed with the Unions in 2017 and renegotiated in
2018, employees reaching 60 years of age during coming years, up to and
including 2023, will have the choice to retire at 60 years or continue working
until they reach 65 years of age. This stems from the change of the age at
which a citizen of Curaçao is eligible for a general pension grant (Algemene
Ouderdomsvoorziening – AOV). In 2013, the lawful age at which a citizen
could apply for this grant was changed from 60 to 65 years. Given the
strategic goal of Aqualectra to increase efficiency by investing in sophisticated
applications and consequently reducing the number of FTE’s, it was negotiat-
ed with the Unions that the age of 60 will be maintained for the employees of
Aqualectra as retirement age. Up to and including 2023, employees reaching
60 years will have the choice to retire or continue working until 65 years of
age. As an incentive to motivate this group of employees to choose to retire at
60 (based on Aqualectra’s strategic choice to lower the number of FTE’s), the
BMD negotiated a departure bonus with the Unions. The Provision Retirement
Stimulation has been recorded to account for these future expenses.
Medical costs retired employees
Through July 31, 2014 both the active employees and the Group contributed
2% of the total gross salary as compensation for the medical costs of retired
employees. Retired personnel contribute 2% of their pension. In accordance
with the collective labor agreements of Aqualectra Distribution and Aqualectra

Annual Report 2019
82
Production, retired employees would be compensated to a certain extent for
their medical costs.
Effective August 1, 2014, with the implementation of the basic health-care
insurance (Basisverzekering Ziektekosten, BVZ), changes were made to the
health coverage plan for the retired personnel. The 2% contribution is no lon-
ger applicable, and to partially compensate the employees for the additional
costs of BVZ effective retirement date, the Group contributes 3% of the retired
employee’s pension to the ‘Sociale Verzekeringsbank’ (SVB).
Other long-term employee benefitsThe Group’s net obligation in respect of other long-term employee benefits
is the amount of future benefit that employees have earned for their service
in the current and prior periods; that benefit is discounted to determine its
present value, and the fair value of any related assets is deducted. The calcu-
lation is performed using the projected unit credit method. Any actuarial gains
and losses are recognized in the consolidated statement of comprehensive
income in the period in which they occur.
Anniversary bonus
According to the collective labor agreements of Aqualectra Distribution and
Aqualectra Production, employees are entitled to an anniversary bonus linked
to the number of years of service. The employees of Integrated Utility Holding
N.V. (excluding the CEO) are also entitled to an anniversary bonus linked to the
number of years of service.
Q) REVENUE FROM CONTRACTS WITH CUSTOMERSAqualectra is Curaçao’s utility company responsible for the production and
distribution of power and water as well as for the delivery of accompanying
services. Revenue from contracts with customers is recognized when control
of the services is transferred to the customer at an amount that reflects the
consideration to which the Group expects to be entitled in exchange for those
services. The Group has generally concluded that it is the principal in its reve-
nue arrangements, because it typically controls the services before transfer-
ring them to the customer.
There are no significant accounting judgments, estimates or assumptions
relating to revenue from contracts with customers.

5_Notes to the Consolidated Summary Financial Statements
83
Water & electricity sales
Aqualectra can recognize the revenue upon usage of electricity or water by
the customer. The electricity represents one performance obligation and water
another performance obligation which are satisfied over time. The transaction
prices differ between water and electricity and are categorized by type of
customer. The transaction price is adjusted monthly and made public.
Pagatinu
The amount collected for Pagatinu is recognized as a revenue as soon as
the customers pay for the electricity. The customer pays for the electricity in
advance and Aqualectra provides the customers with electricity (performance
obligation) over time equal to the value of the amount paid. The transaction
price is charged based on the amount of kWh sold. The aforementioned is not
in line with IFRS 15, however the effect is immaterial.
Connection fees, fines charges and miscellaneous income
Aqualectra can recognize connection fees, as revenue when the correspond-
ing performance obligation is satisfied. Revenue from fines charged and
miscellaneous income can be recognized after invoicing to the customer.
The performance obligations related to these revenues is the (re)connection
of water and/or electricity and the transaction prices are fixed.
Rental of water meters, buildings and poles
The revenue recognition is through passage of time. The performance obliga-
tion for the rentals is the rights to use the water meter, buildings and poles and
the transaction prices are fixed.
KVA Allowance
Aqualectra can recognize the transaction prices as revenue when the
corresponding performance obligation is satisfied which is through passage
of time. The performance obligation is installation of the solar panels in order
to generate renewable electricity in combination with a connection to the
electricity network. A fixed fee is charged per kW(p) periodically.
Services related to streetlights, sales and distribution, Selikor and Aquadesign
Revenue for these services can be recognized after the completion of the
service. The revenue of Selikor is recognized after invoicing the customers and
of Aquadesign is recognized upon providing ADNV with electricity.

Annual Report 2019
84
The performance obligation is receiving the services to streetlights, installation
and removal of spotlights, invoicing of customers on behalf of Selikor and the
provision of electricity to Aquadesign. The transaction price is fixed.
Several/extraordinary income
Aqualectra can recognize the transaction prices as revenue after the items
and/or assets are sold and after the inspection cards are given out by
Aqualectra. The transaction prices of the fixed assets and inventory sold by
Aqualectra are determined specifically for each item. The transaction price for
the inspection cards is fixed.
Additional disclosure with regard to the group’s revenue from contracts with
customers is provided in note 5.6.1.
R) INTEREST INCOME AND EXPENSESInterest income is recognized as it accrues in profit or loss, using the effective
interest method. Dividend income is recognized in the consolidated state-
ment of comprehensive income on the date that the Group’s right to receive
payment is established.
Interest expenses consist of interest on borrowings and interest on the
bonds. The expenses are recognized in the profit and loss in the period to
which they relate.
Borrowing costs that are not directly attributable to the acquisition, construc-
tion or production of a qualifying asset are recognized in the consolidated
statement of comprehensive income as interest expenses by using the effec-
tive interest method.
S) TAXESCurrent profit tax
Current profit tax assets and liabilities for the current period are measured at
the amount expected to be recovered from or paid to the taxation authorities.
The tax rates and tax laws used to compute the amount are those that are
enacted or substantively enacted, at the reporting date. Management pe-
riodically evaluates positions taken in tax returns with respect to situations
in which applicable tax regulation is subject to interpretation. It establishes
provisions where appropriate on the basis of amounts expected to be paid to
the tax authorities.

5_Notes to the Consolidated Summary Financial Statements
85
Deferred tax
Deferred tax is provided using the liability method on temporary differences
between the tax bases of assets and liabilities and their carrying amounts for
financial reporting purposes at the reporting date.
Deferred tax liabilities are recognized for all taxable temporary differences,
except:
- When the deferred tax liability results from the initial recognition of goodwill
or an asset or liability in a transaction that is not a business combination
and, at the time of the transaction, affects neither the accounting profit nor
taxable profit or loss.
- In respect of taxable temporary differences associated with investments in
subsidiaries, associates and interests in joint arrangements, when the timing
of the reversal of the temporary differences can be controlled and it is prob-
able that the temporary differences will not reverse in the foreseeable future.
Deferred tax assets are recognized for all deductible temporary differences,
the carry forward of unused tax credits and any unused tax losses.
Deferred tax assets are recognized to the extent that it is probable that taxable
profit will be available against which the deductible temporary differences,
and the carry forward of unused tax credits and unused tax losses can be
utilized except:
- When the deferred tax asset relating to the deductible temporary difference
results from the initial recognition of an asset or liability in a transaction that
is not a business combination and, at the time of the transaction, affects
neither the accounting profit nor taxable profit or loss
- In respect of deductible temporary differences associated with investments
in subsidiaries, associates and interests in joint arrangements, deferred tax
assets are recognized only to the extent that it is probable that the tempo-
rary differences will reverse in the foreseeable future and taxable profit will
be available against which the temporary differences can be utilized.
The carrying amount of deferred tax assets is reviewed at each reporting date
and reduced to the extent that it is no longer probable that sufficient taxable
profit will be available to allow all or part of the deferred tax asset to be utilized.
Unrecognized deferred tax assets are re-assessed at each reporting date and
are recognized to the extent that it has become probable that future taxable
profits will allow the deferred tax asset to be recovered.

Annual Report 2019
86
Deferred tax assets and liabilities are measured at the tax rates that are ex-
pected to apply in the year when the asset is realized or the liability is settled,
based on tax rates (and tax laws) that have been enacted or substantially
enacted at the reporting date.
Deferred tax relating to items recognized outside profit or loss is recognized
outside profit or loss. Deferred tax items are recognized in correlation to the
underlying transaction either in OCI or directly in equity.
Deferred tax assets and deferred tax liabilities are offset if a legally enforceable
right exists to set off current tax assets against current tax liabilities and the
deferred taxes relate to the same taxable entity and the same taxation authority.
Tax benefits acquired as part of a business combination, but not satisfying the
criteria for separate recognition at that date, are recognized subsequently if
new information about facts and circumstances change. The adjustment is ei-
ther treated as a reduction in goodwill (as long as it does not exceed goodwill)
if it was incurred during the measurement period or recognized in profit or loss.
T) CHANGES IN ACCOUNTING POLICIES AND DISCLOSURESNew standards, amendments and interpretations effective in 2019
The Group applied IFRS 16 Leases for the first time. The nature and effect
of the changes as a result of adoption of this new accounting standard is
described below.
Several other amendments and interpretations apply for the first time in 2019,
but do not have an impact on the consolidated financial statements of the
Group. The Group has not early adopted any standards, interpretations or
amendments that have been issued but are not yet effective.
IFRS 16 Leases
IFRS 16 supersedes IAS 17 Leases, IFRIC 4 Determining whether an
Arrangement contains a Lease, SIC-15 Operating Leases-Incentives and SIC-
27 Evaluating the Substance of Transactions Involving the Legal Form of a
Lease. The standard sets out the principles for the recognition, measurement,
presentation and disclosure of leases and requires lessees to recognize most
leases on the balance sheet.

5_Notes to the Consolidated Summary Financial Statements
87
Lessor accounting under IFRS 16 is substantially unchanged from IAS 17.
Lessors will continue to classify leases as either operating or finance leases
using similar principles as in IAS 17. Therefore, IFRS 16 does not have an
impact for leases where the Group is the lessor.
The Group adopted IFRS 16 using the modified retrospective method of adop-
tion with the date of initial application of January 1, 2019. Under this method, the
standard is applied retrospectively with the cumulative effect of initially applying
the standard recognized at the date of initial application. The Group elected to
use the transition practical expedient to not reassess whether a contract is, or
contains, a lease at January 1, 2019. Instead, the Group applied the standard
only to contracts that were previously identified as leases applying IAS 17 and
IFRIC 4 at the date of initial application. The Group also elected to use the rec-
ognition exemptions for lease contracts that, at the commencement date, have
a lease term of 12 months or less and do not contain a purchase option (short-
term leases), and lease contracts for which the underlying asset is of low value
(low-value assets). Another practical expedient applied regards the discount rate
whereby a single discount rate is applied to a portfolio of leases with reason-
ably similar characteristics (e.g., leases with a similar remaining lease term for
a similar class of underlying asset in a similar economic environment). Finally,
the Group elected to use hindsight, such as in determining the lease term if the
contract contains options to extend or terminate the lease.
The effect of adoption IFRS 16, as at January 1, 2019 (increase/(decrease),
is as follows:
Amounts in ANG x 1,000
January 1, 2019
Assets
Right-of-use assets 22,406
Total assets 22,406
Liabilities
Interest-bearing loans and borrowings 22,406
Deferred tax liabilities -
Total liabilities 22,406
Total adjustment on equity:
Retained earnings -

Annual Report 2019
88
The Group has ground lease contracts and a lease contract for an archive
space. Before the adoption of IFRS 16, the Group classified each of its leas-
es (as lessee) at the inception date as operating leases. Refer to Note 5.3 (f)
Leases for the accounting policy prior to January 1, 2019.
Upon adoption of IFRS 16, the Group applied a single recognition and mea-
surement approach for all leases except for short-term leases and leases of
low-value assets. Refer to Note 5.3 (f) Leases for the accounting policy begin-
ning January 1, 2019. The standard provides specific transition requirements
and practical expedients, which have been applied by the Group.
Leases previously accounted for as operating leases
The Group recognized right-of-use assets and lease liabilities for those leases
previously classified as operating leases, except for short-term leases and
leases of low-value assets. The right-of-use assets for most leases were
recognized based on the carrying amount as if the standard had always been
applied, apart from the use of incremental borrowing rate at the date of initial
application. In some leases, the right-of-use assets were recognized based on
the amount equal to the lease liabilities, adjusted for any related prepaid and
accrued lease payments previously recognized. Lease liabilities were recog-
nized based on the present value of the remaining lease payments, discount-
ed using the incremental borrowing rate at the date of initial application.
The Group also applied the available practical expedients wherein it:
- Used a single discount rate to a portfolio of leases with reasonably similar
characteristics
- Relied on its assessment of whether leases are onerous immediately before
the date of initial application
- Applied the short-term leases exemptions to leases with lease term that
ends within 12 months of the date of initial application
- Excluded the initial direct costs from the measurement of the right-of-use
asset at the date of initial application
- Used hindsight in determining the lease term where the contract contained
options to extend or terminate the lease IFRS

5_Notes to the Consolidated Summary Financial Statements
89
Standards issued but not yet effectiveThe new and amended standards and interpretations that are issued, but not
yet effective, up to the date of issuance of the Group’s financial statements are
disclosed below. The Group intends to adopt these new and amended stan-
dards and interpretations, if applicable, when they become effective.
Amendments to IFRS 3: Definition of a Business (effective January 1, 2020)
In October 2018, the IASB issued amendments to the definition of a busi-
ness in IFRS 3 Business Combinations to help entities determine whether an
acquired set of activities and assets is a business or not. They clarify the mini-
mum requirements for a business, remove the assessment of whether market
participants are capable of replacing any missing elements, add guidance to
help entities assess whether an acquired process is substantive, narrow the
definitions of a business and of outputs, and introduce an optional fair value
concentration test. New illustrative examples were provided along with the
amendments.
Since the amendments apply prospectively to transactions or other events
that occur on or after the date of first application, the Group will not be affected
by these amendments on the date of transition.
Amendments to IAS 1 and IAS 8: Definition of Material (effective January 1, 2020)
In October 2018, the IASB issued amendments to IAS 1 Presentation of
Financial Statements and IAS 8 Accounting Policies, Changes in Accounting
Estimates and Errors to align the definition of ‘material’ across the standards
and to clarify certain aspects of the definition. The new definition states that,
’Information is material if omitting, misstating or obscuring it could reasonably
be expected to influence decisions that the primary users of general purpose
financial statements make on the basis of those financial statements, which
provide financial information about a specific reporting entity.’
The amendments to the definition of material is not expected to have a signifi-
cant impact on the Group’s consolidated financial statements.

Annual Report 2019
90
5.4 <Financial risk management>
The Group’s activities expose it to a variety of financial risks: market risks
(including the effects of foreign exchange risk, interest rate risk and tariff risk),
credit risk and liquidity risk. The Group’s overall risk management is aimed at
minimizing the potential adverse effects of these risks on the financial perfor-
mance of the Group.
The BSD has overall responsibility for the establishment and oversight of the
Group’s risk management framework. During 2019 the Risk Management
Committee did not engage in risk monitoring activities through the Risk
Committee but discussed risk matters in the general setting.
5.4.1_Market riskThe market risk consists of the foreign exchange risk, interest rate risk and
tariff risk.
5.4.1.1_Foreign exchange riskForeign exchange risk is the probability of loss occurring from an adverse
movement in foreign exchange rates.
The Group is exposed to foreign exchange risk resulting from purchasing
parts, services and supplies from foreign suppliers. These foreign transactions
are mainly invoiced in United States Dollars (USD) and/-or EURO (EUR).
The following table summarizes the currency risk in respect of recognized
financial assets and financial liabilities:
Monetary assets and liabilities by currency of denominationForeign currency exposures per December 31, 2019
USD EURO
Financial assets
Cash & cash equivalents - -
Financial liabilities
Trade accounts payable (5,976) (1,398)
Total currency of denomination (5,976) (1,398)
Total currency in ANG (10,876) (2,852)
Amounts x 1,000

5_Notes to the Consolidated Summary Financial Statements
91
Monetary assets and liabilities by currency of denominationForeign currency exposures per December 31, 2018
USD EURO
Financial assets
Cash & cash equivalents 110 15
Financial liabilities
Trade accounts payable (20,384) (1,027)
Total currency of denomination (20,274) (1,012)
Total currency in ANG (36,899) (2,105)
Amounts x 1,000
There is a fixed exchange rate between the Netherlands Antillean Guilder
(ANG) and the USD of ANG 1.82 to the USD, which mitigates the foreign ex-
change rate exposure of the transactions and positions of the Group in USDs.
Purchasing transactions, outstanding trade accounts payable positions and
cash positions at banks in EURO can expose the Group to a certain foreign
exchange risk. The significance of the risk is shown in the schedule below:
Amounts x 1,000
Dec 31, 2019 Dec 31, 2018
Total EURO purchase orders made in EURO 1,650 1,103
Total EURO purchase orders made in ANG 3,348 2,289
Average EURO rate 2.0294 2.0752
Foreign exchange (profit)/loss on EURO transactions in ANG (223) (519)
Outstanding EURO trade payables in EUR per year end 1,398 1,027
Outstanding EURO trade payables in ANG per year end 2,847 2,136
Exchange rate per year end 2.04 2.08
The Group’s policy is to regularly review the significant risks resulting from
foreign exchange rate exposure and when appropriate, to hedge significant
foreign currency transactions at the point the commitment is entered into,
by purchasing the foreign currency and / or limiting the period that commit-
ments in foreign exchange rates are exposed to foreign exchange risk. Cash
flow constraints combined with the immateriality of foreign exchange risk per
transaction, led to Management’s decision to put the aforementioned policies
on hold during 2019 and 2018.

Annual Report 2019
92
The sensitivity analysis below of the outstanding position of the trade ac-
counts payable in EURO as per year-end to movements against the EURO
assumes a change of +/-10% in the exchange rate as of December 31, 2019
and as of December 31, 2018.
Amounts in ANG x 1,000 (*) A -10% change means a strengthening of the ANG compared to the EUR: 1 EUR: ANG 1.833/ 1 ANG: EUR 0.5456. A +10% change means a weakening of the ANG compared to the EUR: 1 EUR: ANG 2.240/ 1 ANG: EUR 0.4464.
Carrying amount per Dec. 31, 2019 Sensitivity analysis of an exchange rate change of:
-10% change (*) +10% change (*)
Outstanding trade accounts payable EUR 1,398 ANG 2,852 (ANG 285) ANG 285 (**)
Impact on the profit and loss account (ANG 285) ANG 285 (**)
Amounts in ANG x 1,000 (*)A -10% change means a strengthening of the ANG compared to the EUR: 1 EUR: ANG 1.872/ 1 ANG: EUR 0.5342. A +10% change means a weakening of the ANG compared to the EUR: 1 EUR: ANG 2.288 / 1 ANG: EUR 0.4371 (**) Interpretation of effect: Amount in brackets ‘(...)’ means a decrease of the outstanding trade accounts payable amount in the Statement of financial position and a decrease of the foreign exchange expenses in the Statement of comprehensive income.
Carrying amount per Dec. 31, 2018 Sensitivity analysis of an exchange rate change of:
-10% change (*) +10% change (*)
Outstanding trade accounts payable EUR 1,027 ANG 2,136 (ANG 214) ANG 214 (**)
Impact on the profit and loss account (ANG 214) ANG 214 (**)
5.4.1.2_Interest rate riskThe interest rate risk of the Group can be defined as the risk of incurring extra
interest costs due to adverse movements of the interest rate of non-fixed in-
terest bearing loans of the Group. In managing interest rate risk, Management
monitors developments in the Group’s loan rates and keeps abreast of interest
rates both locally and internationally. The Group has long term and short
term loans payable with fixed interest rates. As the loan portfolio consists of
loans with a fixed interest rate, effects of development in interest rates have no
impact on the Group.

5_Notes to the Consolidated Summary Financial Statements
93
An overview of the Group’s interest bearing long term loans is presented in the
table below:
Amounts in ANG x 1,000
Dec 31, 2019 Dec 31, 2018 Interest rate Dec 31, 2019
Interest rate Dec 31, 2019
Remark
Loan Diesel power plant ISLA - 2,535 5.00% 5.00% Fixed
Loan MJP 13,885 13,885 2.50% 2.50% Fixed
Current maturities of long term loans (12,527) (13,612)
1,358 2,808
Corporate Bond - 97,079 4% 4% Fixed
Current maturities - (97,079)
- -
MCB/FCIBC Bank loan facility 285,000 160,000 3.75% 3.75 Fixed for 5 years
Current maturities (14,250) -
270,750 160,000
Total financial liabilities 272,108 162,808
5.4.1.3_Tariff risk The Group is exposed to the volatility of international fuel-price developments,
which influences the direct cost component of the electricity and water tariffs
to consumers. The chart below shows the development in average fuel price
throughout the year 2019 and 2018.
Since June 1, 2012, as described in note 5.1, the electricity and water rates
charged to customers consist of:
- A fuel component which is intended to cover fuel expenses, expenses for
purchasing water and electricity from external sources, expenses for chem-
icals and lubricants, expenses for electricity used for water production and
expenses related to non-revenue electricity and water (NRE & NRW).
- A base component which is intended to cover all expenses which are not
related to the fuel component.
- A recovery component which is a temporary component. The fuel com-
ponent was introduced as per June 1, 2012 but is deemed to have started
retrospectively on January 1, 2011. All shortfalls in the fuel component due
to the late implementation are charged via the recovery component.
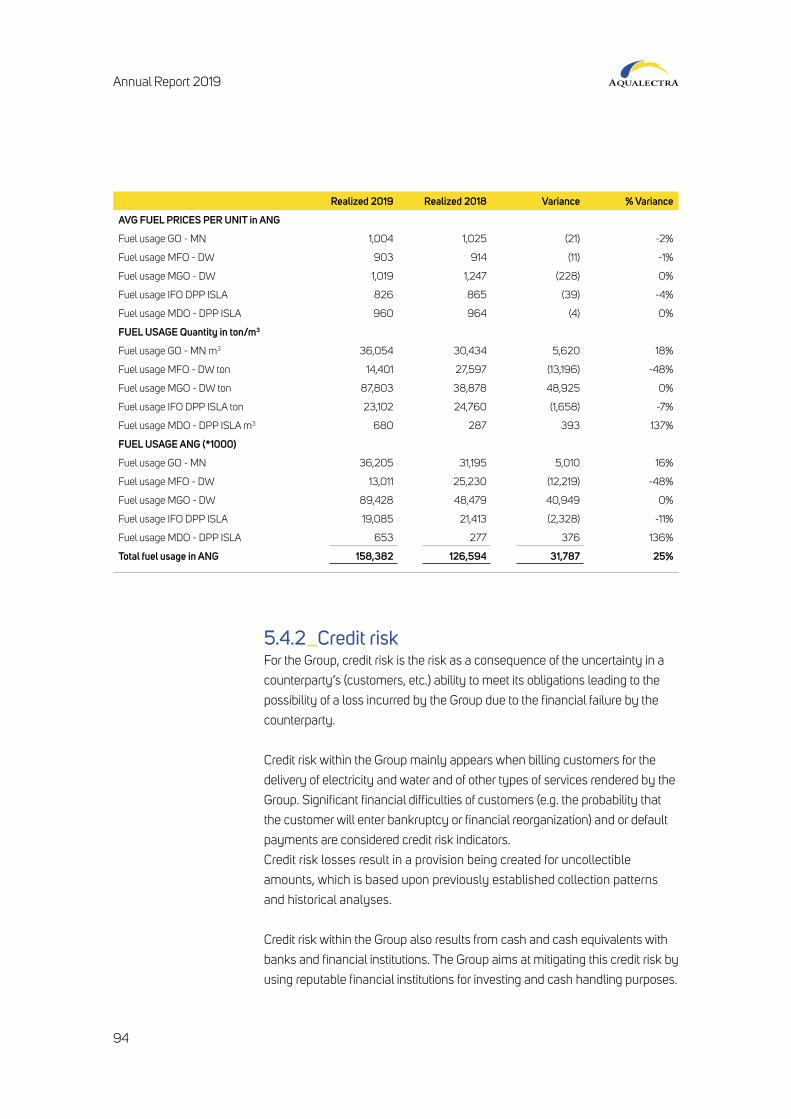
Annual Report 2019
94
Realized 2019 Realized 2018 Variance % Variance
AVG FUEL PRICES PER UNIT in ANG
Fuel usage GO - MN 1,004 1,025 (21) -2%
Fuel usage MFO - DW 903 914 (11) -1%
Fuel usage MGO - DW 1,019 1,247 (228) 0%
Fuel usage IFO DPP ISLA 826 865 (39) -4%
Fuel usage MDO - DPP ISLA 960 964 (4) 0%
FUEL USAGE Quantity in ton/m3
Fuel usage GO - MN m3 36,054 30,434 5,620 18%
Fuel usage MFO - DW ton 14,401 27,597 (13,196) -48%
Fuel usage MGO - DW ton 87,803 38,878 48,925 0%
Fuel usage IFO DPP ISLA ton 23,102 24,760 (1,658) -7%
Fuel usage MDO - DPP ISLA m3 680 287 393 137%
FUEL USAGE ANG (*1000)
Fuel usage GO - MN 36,205 31,195 5,010 16%
Fuel usage MFO - DW 13,011 25,230 (12,219) -48%
Fuel usage MGO - DW 89,428 48,479 40,949 0%
Fuel usage IFO DPP ISLA 19,085 21,413 (2,328) -11%
Fuel usage MDO - DPP ISLA 653 277 376 136%
Total fuel usage in ANG 158,382 126,594 31,787 25%
5.4.2_Credit riskFor the Group, credit risk is the risk as a consequence of the uncertainty in a
counterparty’s (customers, etc.) ability to meet its obligations leading to the
possibility of a loss incurred by the Group due to the financial failure by the
counterparty.
Credit risk within the Group mainly appears when billing customers for the
delivery of electricity and water and of other types of services rendered by the
Group. Significant financial difficulties of customers (e.g. the probability that
the customer will enter bankruptcy or financial reorganization) and or default
payments are considered credit risk indicators.
Credit risk losses result in a provision being created for uncollectible
amounts, which is based upon previously established collection patterns
and historical analyses.
Credit risk within the Group also results from cash and cash equivalents with
banks and financial institutions. The Group aims at mitigating this credit risk by
using reputable financial institutions for investing and cash handling purposes.

5_Notes to the Consolidated Summary Financial Statements
95
As per December 31, 2019 the Group has cash balances placed at 7 reputa-
ble banking institutions (2018:8).
The credit risk management within the Group entails:
- Assessment of the credit quality of retail customers by the Customer
Relations Department, taking into account the past experiences with the
customer, the customer’s financial position and other factors;
- Collection procedures for outstanding invoices to customers;
- Revenue protection program (e.g. discontinuation of the delivery of electrici-
ty and water or replacement of an electricity meter with a Pagatinu meter).
- The placing of banks under a moratorium which led to Aqualectra’s funds
being frozen.
A high risk group within the trade accounts receivable is the inactive group.
These clients have closed their accounts and the Group has procedures in
place to avoid these customers from reopening the account elsewhere or
under another name. Inactive accounts are 100% provided for. The maximum
exposure and categorization of the assets which are exposed to credit risk are
set out in the table below.
The Group’s policy for impairing outstanding amounts for trade accounts
receivable and other receivables, despite efforts to collect the outstanding
amounts, is as follows:
December 31, 2019 Trade Receivables - Days past due
0-30days
30-60 days
61-90 days
90-180 days
181-365 days
> 365 days
Total
Expected credit loss rate 6.6% 14.3% 26.9% 32.5% 41.6% 93.5% 53.4%
Expected total gross carying amount at default 60,329 11,690 5,889 17,426 21,083 100,820 217,237
Expected credit loss 3,966 1,675 1,582 5,662 8,765 94,251 115,901
December 31, 2018 Trade Receivables - Days past due
0-30days
30-60 days
61-90 days
90-180 days
181-365 days
> 365 days
Total
Expected credit loss rate 5.5% 12.9% 27.3% 37.2% 50.1% 100.0% 54.1%
Expected total gross carying amount at default 63,567 10,895 6,454 13,831 11,579 87,179 193,506
Expected credit loss 3,485 1,403 1,760 5,144 5,798 87,179 104,770

Annual Report 2019
96

5_Notes to the Consolidated Summary Financial Statements
97
5.4.3_Liquidity riskLiquidity risk is defined as the risk that the Group will encounter difficulties in
raising funds to timely meet its commitments.
Management applies prudent centralized liquidity management which implies
a cash flow matching approach in which projected cash inflows are matched
against outflows. The Group’s aim is to maintain sufficient cash and lines of
credit to be able to comply with its obligations. In this, Management takes the
necessary measures to either adapt cash inflows or cash outflows. In broad
terms, Management uses long-range projections for a maximum of five years,
which has been approved by the Group’s BSD. The Group updates the cash
flow planning for a period of 12 months, on a weekly basis and uses this cash
flow planning for control purposes.
With adequate and timely tariff adjustments and prudent reduction in operat-
ing expenses, the company is expected to continue making profit, contributing
to a positive operating cash flow. Based on the approved 2020 budget and
forward looking projection, the cash flow generated from operations together
with third party financing, will guarantee the realization of the necessary in-
vestments included in the budget, if past under coverages are duly recovered.
The liquidity status as per December 31, 2019 and as per December 31, 2018
is shown below:
Amounts in ANG x 1,000
Liquidity status Dec 31, 2019 Dec 31, 2018
Funds encumbered 1 < years < 5 720 1,473
Available cash & cash equivalents at banks 36,866 70,599
Total credit facilities 37,586 72,072
Prudent liquidity risk management implies maintaining sufficient cash and
the availability of funding through an adequate amount of committed credit
facilities. The following table analyzes the Group’s financial liabilities, being its
long term loans, other non-current liabilities and current liabilities, into relevant
maturity groupings based on the remaining period at reporting date to the
contractual maturity date. The long term loans and other non-current liabilities
amounts include the interest expenses for the remaining period at reporting date.

Annual Report 2019
98
All amounts are the undiscounted cash flows:
Amounts in ANG x 1,000
Long term loans and other non current liabilities
At December 31, 2019 At December 31, 2018
<1 year >1 and <5 years
>5 years <1 year >1 and <5 years
>5 years
Corporate bonds - - - 102,667 - -
Loan Isla Dieselcentrale - - - 2,535 - -
Loan MJP 12,527 1,358 - 7,124 7,396 -
Loan MCB/FCIB 14,250 57,000 213,750 7,098 95,769 264,443
26,777 58,358 213,750 119,423 103,165 264,443
5.4.4_Capital managementThe Group’s objectives when managing capital are to safeguard the Group’s
ability to continue as a going concern in order to provide returns for share-
holders and benefits for other stakeholders and to maintain an optimal capital
structure to effectively manage the cost of capital. Capital risk is the risk that
the Group loses its value as a result of which financiers (shareholders, lenders,
etc.) may lose all or part of the principal amount invested in the Group.
The following chart shows the ratio’s used by Management in monitoring and
measuring the development in capital and reserves:
Ratios and financial covenants Target Dec 31, 2019 Dec 31, 2018
Debt service coverage ratio (DSCR) >1.45 1.24 0.66
Adjusted debt service coverage ratio (ADSCR) >1.15 0.79 0.47
Debt/EBITDA ratio (D/E) <8.5 2.77 2.25
Current ratio (CR) >1.00 1.42 0.76
Solvency ratio (SR) >30% 42% 40%
Amounts in ANG x 1,000
The non-compliance of DSCR and ADSCR are related to the large repayments of
the CBCS bonds that were refinanced with the new MCB/CIBC loan. Neutralized
for these transactions, the DSCR and ADSCR would have been in compliance.
Compliance with the DSCR is part of the financial covenants included in the loan
agreement for the MCB/CIBC loan. However, the lenders were aware of the
effect of the non-compliance at the end of 2019 due to the one-time repayments
prior to entering into the transaction, and issued a letter confirming this.

5_Notes to the Consolidated Summary Financial Statements
99
5.5 <Explanatory notes to the statement of financial position>
5.5.1_Intangible AssetsThe schedule below reflects the acquisitions of intangible assets (licenses
and directly attributable cost of preparing the asset for its intended use) during
the period:
Dec 31, 2019 Dec 31, 2018
Intangible assets
Cost Jan 1 58,975 47,575
Accumulated amortization (2,293) -
Book value January 1 56,682 47,575
Additions 110 11,400
Amortization - current year (3,939) (2,293)
Cost December 31 59,085 58,975
Accumulated amortization (6,231) (2,293)
Balance at end of year 52,854 56,682
Amounts in ANG x 1,000
In March 2012, a Professional Service Agreement was signed with SAP
Puerto Rico GMBH LLC. (SAP) for the implementation of a new enterprise
resource planning (ERP) system. The new ERP system was implemented at
the start of 2018 at which point amortization started.

Annual Report 2019
100
5.5.2_Property, Plant and EquipmentThe table below provides an overview of the property, plant and equipment as
per December 31, 2019 and as per December 31, 2018:
Cost Accum. depr. Book value Additions Disposals
1-Jan-19 1-Jan-19 1-Jan-19 2019 2019
Communication network 19,325 18,319 1,006 656 -
Land and Buildings 222,620 145,848 76,772 3,939 -
Production Plants 289,982 161,255 128,728 16,381 -
Distribution network 732,802 466,361 266,441 12,671 -
Metering network 47,306 25,526 21,781 467 -
Industrial Equipment & Accessories 4,328 2,745 1,583 8 -
Other assets 14,871 10,851 4,020 211 -
Spare parts 10,015 7,559 2,456 - -
Work in progress 92,424 - 92,424 11,674 (6)
1,433,672 838,462 595,210 46,008 (6)
Cost Accum. depr. Book value Additions Disposals
1-Jan-18 1-Jan-18 1-Jan-18 2018 2018
Communication network 19,325 18,221 1,104 - -
Land and Buildings 221,800 137,777 84,023 545 -
Production Plants 289,070 148,411 140,659 242 -
Distribution network 702,982 434,537 268,445 6,012 -
Metering network 34,230 22,798 11,432 286 -
Industrial Equipment & Accessories 3,637 2,447 1,190 249 -
Other assets 13,101 9,887 3,214 - -
Spare parts 8,768 6,534 2,233 - -
Work in progress 74,691 - 74,691 71,445 -
1,367,605 780,613 586,992 78,778 -

5_Notes to the Consolidated Summary Financial Statements
101
Transfers Reclass/adjust Depreciation Reclass/adjust Cost Accum. depr. Book value
2019 2019 2019 2019 31-Dec-19 31-Dec-19 31-Dec-19
2,976 - (134) - 22,957 18,453 4,504
10,676 0 (7,294.58) (0) 237,236 153,142 84,093
45,916 0 (12,267.97) 15 352,280 173,508 178,772
25,046 22 (33,219.40) - 770,541 499,580 270,961
484 - (3,571.33) - 48,256 29,097 19,159
- - (329.94) - 4,336 3,075 1,261
162 285 (4,944.10) 3,707 15,529 12,088 3,441
- -1773 (15) 8,242 5,566 2,675
(85,260) 727 - - 19,559 - 19,559
- (739) (61,761) 3,707 1,478,935 894,509 584,426
Amounts in ANG x 1,000
Transfers Reclass/adjust Depreciation Reclass/adjust Cost Accum. depr. Book value
2018 2018 2018 2018 31-Dec-18 31-Dec-18 31-Dec-18
- - (98) - 19,325 18,319 1,006
336 (61) (8,070) - 222,620 145,848 76,772
2,932 (2,239) (12,867) - 289,982 161,255 128,728
26,387 (2,580) (31,823) 732,802 466,361 266,441
12,790 - (2,728) - 47,306 25,526 21,781
608 (165) (298) - 4,328 2,745 1,583
- 1,770 (964) - 14,871 10,851 4,020
- 1,247 (1,024) - 10,015 7,559 2,456
(43,053) (10,659) - - 92,424 - 92,424
- (12,687) (57,873) - 1,433,672 838,462 595,210
Amounts in ANG x 1,000

Annual Report 2019
102
5.5.3_LeasesFollowing the adoption of IFRS 16, lease Contracts and/or other contracts
that qualify as the scope of leases as determined by the new Standards had
to be capitalized. Aqualectra leases cars and land. The latter being govern-
mental land leases. Furthermore, the power purchase agreement for the solar
panels installed on the roofs of schools, qualified as a lease, when assessing
it against the IFRS 16 requirements. The Group’s obligations under its leases
are secured by the lessor’s title to the leased assets. Generally, the Group is
restricted from assigning and subleasing the leased assets.
The lease term for of solar panels is currently between 1 and 2 years.
The remaining lease terms for cars is between 1 and 6 years, while the land leases
are currently at 10 to 30 years remaining. There are several lease contracts that
include extension and termination options. There are no leases with low value.
Set out below are the carrying amounts of right-of-use assets recognized and
the movements during the period:
Amounts in ANG x 1,000
Solar panels Car lease Ground lease Total
Balance at December 31, 2018 - - - -
Adjustment opening balance 4,769 3,500 14,137 22,406
Balance at January 1, 2019 4,769 3,500 14,137 22,406
Addition - 1,020 - 1,020
Depreciation expense (337) (2,250) (471) (3,058)
Balance at December 31, 2019 4,432 2,270 13,666 20,368
Set out below are the carrying amounts of lease liabilities (included as
non-current Liabilities) and the movements during the period:
Amounts in ANG x 1,000
2019 2018
Balance at December 31, 2018 - -
Adjustment opening balance 22,406 -
Balance at January 1, 2019 22,406 -
Accretion of interest 873 -
Payments (2,444) -
Balance at December 31, 2019 20,836 -

5_Notes to the Consolidated Summary Financial Statements
103
The following are the amounts recognized in profit or loss:
2019 2018
Depreciation expense right-of-use assets 3,058 -
Interest expense on lease liabilities 873 -
Expense related to short-term leases (included in general expenses)
- -
Total amount recognized in profit or loss 3,931 -
Amounts in ANG x 1,000
The total cash outflows for leases amounted to ANG 2.4 million in 2019.
Aside from the opening balance adjustment to adopt IFRS 16, the Group had
non-cash additions to right-of-use assets or lease liabilities in 2019. The are
no future cash outflows relating to leases that have not yet commenced.
The Group has several lease contracts that include extension and termination
options. These options are negotiated by management to provide flexibility
in managing the leased-assets portfolio and align with the Group’s business
needs. Management exercises significant judgement in determining whether
these extension and termination options are reasonably certain to be exer-
cised (see Note 5.2).
All extension options were included in the lease term and termination options
were excluded from the lease terms.

Annual Report 2019
104
5.5.4_InventoriesA summary of inventories as per December 31, 2019 and as per December 31,
2018 is specified below:
Dec 31, 2019 Dec 31, 2018
Materials and spare parts (net) 37,968 29,346
Fuel and lubricants 5,728 7,937
Water 561 483
Total inventories 44,257 37,766
Amounts in ANG x 1,000
Dec 31, 2019 Dec 31, 2018
Balance at beginning of the year (12,666) (24,808)
Release 3,547 12,142
Balance at end of the year (9,119) (12,666)
Amounts in ANG x 1,000
5.5.5_Trade accounts receivableThe composition of trade accounts receivable as per December 31, 2019 and
as per December 31, 2018 is as follows:
Amounts in ANG x 1,000
Dec 31, 2019 Dec 31, 2018
Residential Customers 97,805 85,307
Commercial Customers 48,594 43,418
Industrial Customers 32,708 31,148
Street Light Customers 5,337 1,552
Government Customers 9,577 8,778
Billing cycle to be invoiced 23,069 23,154
Other 149 148
217,237 193,506
Provision for bad debts (115,901) (104,770)
(115,901) (104,770)
Total trade accounts receivable 101,336 88,736
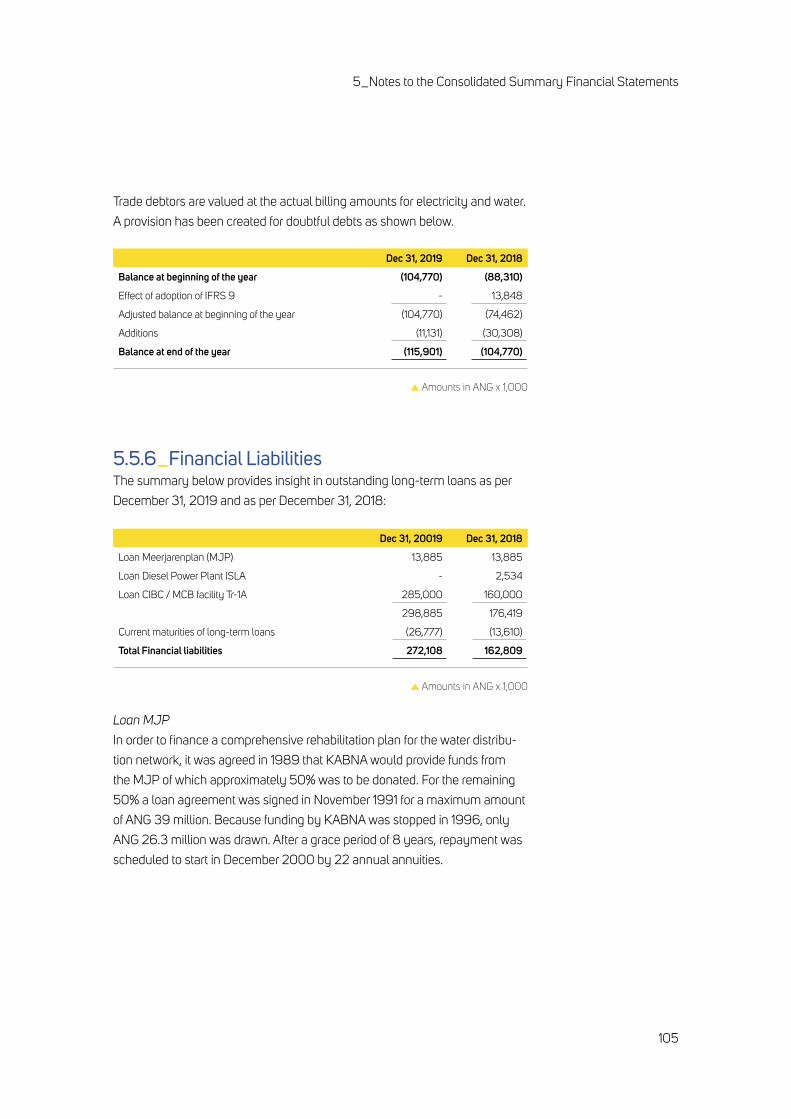
5_Notes to the Consolidated Summary Financial Statements
105
Trade debtors are valued at the actual billing amounts for electricity and water.
A provision has been created for doubtful debts as shown below.
Dec 31, 2019 Dec 31, 2018
Balance at beginning of the year (104,770) (88,310)
Effect of adoption of IFRS 9 - 13,848
Adjusted balance at beginning of the year (104,770) (74,462)
Additions (11,131) (30,308)
Balance at end of the year (115,901) (104,770)
Amounts in ANG x 1,000
5.5.6_Financial Liabilities The summary below provides insight in outstanding long-term loans as per
December 31, 2019 and as per December 31, 2018:
Amounts in ANG x 1,000
Dec 31, 20019 Dec 31, 2018
Loan Meerjarenplan (MJP) 13,885 13,885
Loan Diesel Power Plant ISLA - 2,534
Loan CIBC / MCB facility Tr-1A 285,000 160,000
298,885 176,419
Current maturities of long-term loans (26,777) (13,610)
Total Financial liabilities 272,108 162,809
Loan MJP
In order to finance a comprehensive rehabilitation plan for the water distribu-
tion network, it was agreed in 1989 that KABNA would provide funds from
the MJP of which approximately 50% was to be donated. For the remaining
50% a loan agreement was signed in November 1991 for a maximum amount
of ANG 39 million. Because funding by KABNA was stopped in 1996, only
ANG 26.3 million was drawn. After a grace period of 8 years, repayment was
scheduled to start in December 2000 by 22 annual annuities.

Annual Report 2019
106
Currently the Group is contemplating the settlement of a part of the outstand-
ing amount with receivable amount for electricity and water bills of various
governmental departments. No securities were pledged to this loan. Interest
was fixed at 2.5% per annum.
Loan Diesel Power Plant ISLA
This liability concerns the payment by ISLA for the cost of constructing the
Diesel Power Plant (USD 23,000,000). The payment has been recorded as a
liability as repayment was covered by the monthly IUH N.V. installments.
The amount was fully repaid in 2019.
Loan CIBC/MCB facility
On November 14, 2018, a facilities agreement was signed with Maduro &
Curiel’s Bank N.V. (MCB) and CIBC First Caribbean Bank (CIBC) for ANG 375
million (of which ANG 325 is committed). The first tranche of ANG 160.0
million was made available on December 28, 2018. The second tranche was
disbursed on December 13, 2019. The loan bears interest of 3.75% per annum
which is fixed for 5 years. As secured collateral, the banks have a deed of
mortgage on registered property, deed of pledge of movable assets, deed of
pledge of receivables and a declaration of non-disposal and negative pledge.
During 2019 only interest of 3.75% was paid quarterly, hereafter the annual
annuities will be paid during March 2020 through December 2028.
5.5.7_ProvisionsThe provisions as per December 31, 2019 and as per December 31, 2018 can
be divided in the following categories:
Amounts in ANG x 1,000
Dec 31, 2019 Dec 31, 2018
Provisions employee benefits 65,484 70,499
Other provisions 6,131 6,131
Total provisions 71,615 76,630

5_Notes to the Consolidated Summary Financial Statements
107
5.5.7.1_Provisions employee benefitsThe provision for employee benefits as per December 31, 2019 and as per
December 31, 2018 is specified below:
Amounts in ANG x 1,000
Dec 31, 2019 Dec 31, 2018
Provision medical costs retired employees 8,476 7,304
Provision supplementary pension APC (DT) 11,724 9,965
Provision early retirement benefit (VUT) 327 1,163
Provision anniversary bonus 16,060 14,318
Provision AOV/BVZ compensation 16,163 16,892
Provision vacation leave 3,345 3,386
Provision retirement stimulation 9,389 17,471
Total provisions 65,484 70,499
The calculations of the provisions, except vacation leave, are based upon
actuarial assumptions. The key assumptions for each plan are included in
the table below.
Actuarial assumptions
2019 2018 Applicable for
Indexation 0% 2% Medical, AOV/BVZ, VUT, DT and Early Retirement stimulation
Inflation 0% 2% Medical, AOV/BVZ, VUT, DT and Early Retirement stimulation
Turnover 1% 0% Medical, AOV/BVZ and Early Retirement stimulation
Salary increases 2% 3% Anniversary and Early retirement plan
Mortality 2019 2018
Male GBM0813 AG2014
Female GBV0813 AG2014
Retirement age for 2019 and 2018
Probability to retire at age 60 85%
Probability to retire at age 65 15%

Annual Report 2019
108
5.5.8_Corporate Bonds IUH N.V.On December 28, 2009 the Group issued through the Central Bank of
Curaçao and St. Maarten the tranche 1a of the Aqualectra Corporate Bonds
with a nominal amount of ANG 300,045,000 and a coupon rate of 4%.
The purpose of the issue of the first tranche was to refinance the existing
loans and liabilities. The remaining balance was repaid in conformity with the
repayment agreement with the CBCS on December 28, 2019.
Amounts in ANG x 1,000
Dec 31, 2019 Dec 31, 2018
Current maturity - 113,417
Amortization discount on bonds - (16,338)
Net value Corporate bonds - 97,079
5.5.9_Trade accounts payableThe Table below provides an overview of the Trade accounts payable per
Company as per December 31, 2019 and as per December 31, 2018:
Dec 31, 2019 Dec 31, 2018
Curoil 30,877 17,658
PDVSA - 6,695
Local suppliers 15,956 21,092
Foreign suppliers 6,022 35,107
Government institutions 4,659 3,395
Advanced payments received from clients 10,250 7,036
Other accounts payable 95 31
Total accounts payable 67,859 91,014
Amounts in ANG x 1,000

5_Notes to the Consolidated Summary Financial Statements
109
5.6 <Explanatory notes to the statement of comprehensive income>
5.6.1_Revenue from contract with customersThe total revenues are presented below:
Amounts in ANG x 1,000
December 31, 2019 Services
Water &electricity sales and KVA Allowance
Pagatinu Connection fees, fines charges and miscellaneous income
Rental of water meters
Rental of buildings and poles
Services related to streetlights, sales and distri-bution, Selikor and Aquadesign
Other revenue
Total
Revenue from contract with customers
459,613 55,515 1,186 512 132 9,637 1,368 527,963
Timing of revenues reciognition:
Services transferred at a point in time
- - 1,186 - - 5,027 1,374 7,587
Service transferred over time
459,613 55,515 - 512 132 4,696 - 520,468
Total revenue from contract with customers
459,613 55,515 1,186 512 132 9,723 1,374 528,055
Amounts in ANG x 1,000
December 31, 2018 Services
Water &electricity sales and KVA Allowance
Pagatinu Connection fees, fines charges and miscellaneous income
Rental of water meters
Rental of buildings and poles
Services related to streetlights, sales and distri-bution, Selikor and Aquadesign
Other revenue
Total
Revenue from contract with customers
435,362 50,051 2,051 499 207 7,896 1,113 497,179
Timing of revenues reciognition:
Services transferred at a point in time
- - 2,051 - - 3,267 1,113 6,431
Service transferred over time
435,362 50,051 - 499 207 4,629 - 490,748
Total revenue from contract with customers
435,362 50,051 2,051 499 207 7,896 1,113 497,179

Annual Report 2019
110
5.6.2_Direct costs production Direct cost production is specified below:
Amounts in ANG x 1,000
Dec 31, 2019 Dec 31, 2018
Fuel usage 158,382 126,594
Chemicals 5,623 4,001
Lubrication 6,144 3,490
Purchase of water & electricity 19,738 18,850
Other direct cost of production 885 1,326
Purchase of electricity from CUC 1,794 8,548
Purchase of electricity from wind farms 40,206 42,713
Total direct costs production 232,771 205,522
Amounts in ANG x 1,000
Dec 31, 2019 Dec 31, 2018
IUH DPP element 8,856 8,621
IUH Fuel element 4,304 4,264
IUH Extension element 54 76
Temporary Diesel Power Plant 2,866 5,467
Differences in water levels - 21
Total other direct costs of sale 16,080 18,449
Direct costs of production include an amount of ANG 13,215 million (2018:
ANG 12,961 million) being the DPP, fuel and extension component of the IUH
N.V. agreement between the Group, Refineria ISLA and RdK N.V.
According to this agreement a total fee of USD 12,000 million has to be paid
on a yearly basis until the year 2019. Since 2011 the extension element is
being paid by RdK, as result of the transfer of the CUC shares to RdK.
The amount mentioned increases yearly with the consumer index.
This agreement covers the construction costs of a Diesel Power Plant and
consists of a fuel and extension component.
The expenses for the power and water purchase agreements desalination
plant and the wind park, and temporary diesel power plant are reported as
part of the direct costs production.

5_Notes to the Consolidated Summary Financial Statements
111
5.6.3_Salaries, social securities and other personnel expensesSalaries, social securities and other personnel expenses are specified below:
Amounts in ANG x 1,000
Dec 31, 2019 Dec 31, 2018
Salaries 57,822 60,594
Overtime 3,638 6,404
Social securities 22,015 23,500
Other personnel expenses 7,410 (919)
Total salaries, social securities and other personnel expenses 90,885 89,579
The development in the labor force during 2019 and 2018 was as follows:
Labor force Aqualectra N.V. Integrated Utility Holding N.V.
Aqualectra Multi Utility N.V.
Total
12/31/2018 615 2 1 618
12/31/2019 594 2 1 597
Net Increase/decrease (21) 0 0 (21)
Dec 31, 2019 Dec 31, 2018
Release on provision pension plan - 88,276
Other (post) employment benefits (net) 4,865 883
Total salaries, social securities and other personnel expenses 4,865 89,159
Amounts in ANG x 1,000

Annual Report 2019
112
5.6.4_Parts, repairs and maintenanceParts, repair and maintenance expenses are expenses made for parts and
hired services for the operation and maintenance of the electricity and water
production units, electricity and water distribution network and other assets.
Amounts in ANG x 1,000
December 31, 2019 Parts Services Other Total
Electricity 16,272 4,745 - 21,017
Water 1,329 6,600 - 7,929
Other assets & facilities 94 744 - 838
General 954 8,953 - 9,907
Other material usage expense - - 3,994 3,994
Other service expense - - 156 156
Provision for obsolete inventory (3,547) (3,547)
Total Parts, Repair & Maintenance Expenses 18,649 21,042 603 40,294
Amounts in ANG x 1,000
December 31, 2018 Parts Services Other Total
Electricity 39,446 4,506 - 43,952
Water 1,309 4,094 - 5,403
Other assets & facilities 13 1,108 - 1,121
General 619 12,887 - 13,506
Other material usage expense - - 3,125 3,125
Other service expense - - 4,217 4,218
Provision for obsolete inventory - - (12,142) (12,142)
Total Parts, Repair & Maintenance Expenses 41,387 22,595 (4,800) 59,183

5_Notes to the Consolidated Summary Financial Statements
113
5.6.5_General expensesGeneral expenses are specified below:
Amounts in ANG x 1,000
Dec 31, 2019 Dec 31, 2018
General expenses
Housing and car fleet 5,744 7,323
Office expenses 4,979 4,417
Insurance and security 6,564 7,084
Consultancy 10,236 11,302
Communications and public relations 4,130 3,086
Regulation and compliance fees 1,250 2,500
Other expenses (4,973)* 345
Supervision expenses 221 320
Total general expenses 28,151 36,377
Supervision expense includes compensation of the BSD, travel expenses and
expenses related to consulting services on behalf of the BSD.
5.6.6_Interest expensesA breakdown of the interest expenses is as follows:
Amounts in ANG x 1,000
Dec 31, 2019 Dec 31, 2018
Loan Meerjarenplan (MJP) 89 124
MCB/FCIB loan 6,169 -
CBCS Corporate Bonds 5,945 12,481
Loan Diesel Power Plant ISLA 69 195
Lease Liability 873 -
Other interest expenses 774 2,883
Total Finance cost 13,920 15,683
Interest income (92) (144)
Total finance income (92) (144)
Total Financial costs (net) 13,828 15,539
*Various old and time-bared other liabilities were cleared, resulting in one-time miscellaneous gains in 2019.

Annual Report 2019
114
5.6.7_Commitments and Contingencies
REGULATORY ACCOUNT The basic tariff for water and electricity is fixed and is meant to cover the
operational costs (excluding fuel costs), such as cost of personnel, deprecia-
tion, costs of financing, maintenance and the costs related to the provision for
bad debts and the return on equity agreed upon with the Government of the
Country of Curaçao.
The fuel component as reflected in the fuel clause is variable and is meant
to cover costs of fuel and other direct costs. The fuel component is subject
to changes dependent on the developments of the oil prices and other direct
costs. Up until June 2005 adjustments were calculated on a quarterly basis.
The Government of the Country of Curaçao allowed the Group to allocate
the unrecovered amounts of the fuel and other direct costs in a so-called
Regulatory Account through 2005. In the table below the under coverage
of the years 2006 through 2010 has been processed anticipating that the
Government of the Island of Curaçao would approve the allocation of the re-
mainder under coverage of the years 2006 throughout 2010 to the Regulatory
Account. The table shows is a breakdown of the original amount of the under
coverage, the recovered amount through the surcharge in the tariffs and the
compensated amount by the Energy Fund referred to in the section below.
Years Original amount Recovered through tariffs
Compensated by Energy Fund
Balance to be compensated
2003-2004 41 (41) - -
2005 18 (1) (17) -
2006 26 (17) (6) 3
2007 13 - (2) 11
2008 74 - - 74
2009 7 - - 7
2010 9 - - 9
Total 188 (59) (25) 104
Amounts in ANG x million
5_Notes to the Consolidated Summary Financial Statements
115
The above mentioned balance of approximately ANG 104 million does not
include the coverage results on the fixed tariffs for the year 2005 onwards,
since the Group and the Department of Economic Affairs have not reached
an agreement on the division of the coverage results between the Group and
the Consumers.
The appropriation to the Regulatory Account is to settle the deficit against
future utility tariffs. The Government of the Country of Curaçao agreed in 2005
to include a surcharge in the tariffs to gradually settle the above mentioned
amounts of under coverage on the fuel and other direct costs.
In a resolution dated 17 November 2008, the Island Council determined that,
as from that date, the Group can recover the under coverage in the Regulatory
Account through its tariffs, up to an annual maximum of ANG 23 million.
The aforementioned resolution was cancelled by the Government on April
6, 2011 and the Regulatory Account was no longer recognized as such. The
Group has continued to inform the Regulator and the Government on the
need for the recovery of the fuel under coverage in electricity and water tariffs.
Consequently, in 2012 changes in the tariff setting structure were introduced,
one of which was the monthly adjustment of the direct cost component of the
electricity and water tariffs.
IFRS does not allow recognition of the amounts in the Regulatory Account.
Therefore, the amount in the Regulatory Account is treated as a Contingent Asset.
ENERGY FUND 2005/2006The Energy Fund 2005/2006 was approved on December 6, 2005 and was
established as a means to stabilize the water and electricity tariffs by compen-
sating the Group for insufficient coverage of tariffs incurred in 2005 and 2006
due to oil price changes and changes in the other direct costs.
The Group received a total of ANG 22,650,000 from the Energy fund in
2006. Of this amount, ANG 7,790,000 covered the period from January
through September 2005, ANG 8,950,000 covered the period from October
through December 2005 and ANG 5,910,000 covered the period from
January through March 2006. The Group also received an amount of ANG
2,200,000 from the remainder of the Energy Fund to minimize a tariff in-
crease in 2007.

Annual Report 2019
116
Due to the developments in the fuel prices during the period covered by the
Energy Fund 2005/2006, the amount originally designated to the Energy
Fund 2005/2006 was not sufficient to compensate the full amount of under
coverage in 2005 and 2006.
An uncompensated balance of ANG 21,200,000 remained of which ANG
1,600,000 regards the period of January through September 2005 ANG
19,600,000 regards the period April through December 2006.
This uncompensated balance of ANG 21,200,000 was recorded as a
receivable. However, since the funds in the Energy Fund are depleted and
the Government of the Country of Curaçao does not have the necessary
funds to compensate the Group for the under coverage, the total outstanding
amount has been provided for. In anticipation of the written approval of the
Government of the Country of Curaçao this amount has been allocated to the
Regulatory Account to be compensated through future usage of electricity
and water. Of the above mentioned receivable of ANG 21,200,000 million, an
amount of ANG 18,300,000 million has been recovered through the tariffs
in the years 2007 and 2008 reducing the uncompensated balance to ANG
2,900,000 through date.
IFRS does not allow recognition of the amounts in the Regulatory Account.
Therefore, the amount in the Regulatory Account is treated as a contingent asset.
CURAÇAO UTILITIES COMPANY N.V. (CUC N.V.) SHARESThe Minister responsible for IUH N.V. adopted a resolution in January 2011
in which was stated that IUH had to transfer the CUC Holdings shares to
Refineria di Korsou (RdK) without any compensation. The transfer of the
shares was effected on January 19, 2011. Subsequently, in a letter dated
February 14, 2013, the Group was informed by the Minister of Finance that
based on a decision reached by the Council of Ministers on October 31, 2012,
stemming from the deteriorating financial situation of the Group and its invest-
ment needs, an independent third party was engaged to determine the value
of the transferred shares. The third party concluded that a value of ANG 53.8
million is considered a reasonable estimation of the fair value of the shares
transferred as of January 19, 2011. The Council of Ministers approved this
valuation on February 20, 2013. A shareholder’s resolution remains pending
to be adopted to formalize the above mentioned. Management has been in
deliberation with both the Government and the Shareholders of both compa-
nies to accelerate the execution of the decision of the Council of Ministers of

1_Report of the Board of Managing Directors
117
February 20, 2013. The Government as the representative of both companies,
namely the Minister of Finance in charge of Aqualectra and the Minister of
General Affairs in charge of Refineria di Kòrsou has met with the representa-
tives of both companies. It was agreed that both companies will work together
to reach an agreement for settlement of the compensation for the shares
transferred. The Management of both companies has retained legal and
financial advisors to assist in the process of reaching a settlement agreement.
Management is pursuing the solution of this matter.
5.7 <Subsequent Events>
In early January 2020, a human infection originating in China since 2019
was traced to a novel strain of coronavirus. The virus has subsequently spread
to other parts of the world, including the U.S. and Europe, and has caused
unprecedented disruptions in the global economy as efforts to contain the
spread of the virus have intensified. On March 11, 2020, the World Health
Organization officially declared this coronavirus outbreak (also referred to
as COVID-19) a pandemic. Our business has been and will continue to be
adversely affected by the coronavirus pandemic. Since March 17, 2020, the
Government of Curaçao has announced various measures, including ‘shel-
ter-in place’ and curfew orders and an almost complete economic lockdown
as well as guidance in response to the pandemic and the need to contain it.
Being considered a ‘vital’ organization that provides first life necessities,
Aqualectra had to continue operations although under different circumstances.
The safety of our employees was placed first, triggering altered work proce-
dures and schedules. After safeguarding the health and safety of the employ-
ees, safeguarding the continuity of the Company became of utmost importance.
A Financial Impact Study was prepared on March 30th, projecting a material
deficit at the end of 2020, if the same course was maintained.
This projection was based on reduced sales of water and electricity, deteriorat-
ing customers’ payment behavior resulting in less cash inflow and was, offset
by a robust cost and cash outflow reduction plan. The latter included various
activities to reduce cost as well as postponement of various planned capital ex-
penditures and request for payment deferrals from creditors and financiers. The
Financial Impact Study and its consequences was presented to the Board of
Supervisory Directors the Shareholder, the Regulator and the Lenders. Strategic

Annual Report 2019
118
suppliers were approached to negotiate new payment terms while the BMD
also approached the unions to discuss a personnel cost reduction plan.
The Government of Curaçao starting its de-escalation strategy on May 8,
2020, which immediately resulted in an increase of sales. Although positive,
this increase may not be sustained when taking the negative economic condi-
tions into account and a possible outbreak once borders are opened again.
Beside the measures taken by the BMD of Aqualectra to safeguard the
Company and reduce its deficits, the Government of Curaçao also announced
various measures to reduce personnel expenses in the semi-public sector and
impose a crisis-levy to reduce the country’s deficit. As it stands now and as
analyzed by the Central Bank of Curaçao and St. Maarten, introducing these
measures will adversely impact the island’s economy. Worsening economic
conditions reflect back on Aqualectra’s ability to sell water and electricity and
collect its invoiced sales. If not included in tariffs, these developments will
have a negative impact on Aqualectra’s financial performance for 2020.
The measures announced by the Government of Curaçao to reduce per-
sonnel expenses in the semi-public sector, may also have an impact on the
provisions for (post-) employment benefits. Significantly reducing salaries
may result in less provision as most of the plans are based on the salary of
the employees. However, the exact measurements to be taken and instruc-
tions how these should be applied have not been formally communicated to
Aqualectra yet.
Currently, a cash deficit of approximately NAf 10 million and a net operating
loss of approximately NAf 5 million is projected at the end of 2020.
Although significantly reduced by the cost and cash savings measures, this
projected deficit is still not sustainable and must be further reduced. The BMD
is currently working on cost reduction escalation measures. Based on the
projections at hand, the financial ratios are expected to perform as follows:

5_Notes to the Consolidated Summary Financial Statements
119
Financial Ratio Target 2019 2020 (Budget)
2020 (Projection after COVID-19)
EBITDA 85,113 107,277 52,199
DSCR >1.45 1.24 4.43 3.61
ADSCR >1.15 0.79 0.80 1.59
DEBT/EBITDA <8.5 2.77 3.07 5.67
SOLVENCY >30% 42% 46.2% 40%
CURRENT RATIO >1 1.42 1.44 1.45
The duration of any business disruption and related financial impact cannot
be reasonably estimated at this time but may materially affect our ability to
operate our business and result in additional costs. The extent to which the
coronavirus pandemic may impact our operating results, financial condition,
and cash flows for 2020 and onwards will depend on future developments,
which are highly uncertain and cannot be predicted as of the time of this
financial statement, including new information that may emerge concerning
the severity of the coronavirus and steps taken to contain it, among others.
There are no other noteworthy subsequent events.

Annual Report 2019
120

1_Report of the Board of Managing Directors
_Independent Auditor’s Report
>>121

Annual Report 2019
122
To: the Board of Managing Directors and the Board of Supervisory Directors
of Integrated Utility Holding N.V.
OPINIONThe consolidated summary financial statements of Integrated Utility Holding
N.V., which comprise the consolidated summary statement of financial
position as at 31 December 2019, the consolidated summary statement of
comprehensive income, consolidated summary statement of changes in
shareholder’s equity and consolidated summary statement of cash flows for
the year then ended, and related notes, are derived from the audited consoli-
dated financial statements of Integrated Utility Holding N.V. for the year ended
31 December 2019.
In our opinion, the accompanying consolidated summary financial statements
are consistent, in all material respects, with the audited consolidated financial
statements 2019 of Integrated Utility Holding N.V., in accordance with the
notes to the consolidated summary financial statements.
CONSOLIDATED SUMMARY FINANCIAL STATEMENTSThe consolidated summary financial statements do not contain all the disclo-
sures required by International Financial Reporting Standards. Reading the
consolidated summary financial statements and the auditor’s report thereon,
therefore, is not a substitute for reading the audited consolidated financial state-
ments and the auditor’s report thereon. The consolidated summary financial
statements do not reflect the effects of events that occurred subsequent to the
date of our report on the audited consolidated financial statements.
THE AUDITED CONSOLIDATED FINANCIAL STATEMENTS AND OUR REPORT THEREONWe expressed an unmodified audit opinion on the consolidated financial
statements in our report dated 26 June 2020. The report also includes two
emphasis of matter paragraphs relating to contingent assets and uncertainty
about Covid-19 and going concern.
We draw attention to note 5.6.7 Contingent Assets, section ‘Curaçao Utilities
Company N.V. (CUC N.V.) shares’ where a possible settlement for transfer of
shares of Curaçao Utilities Company N.V. (CUC N.V.) is disclosed. The Minister
responsible for IUH N.V. adopted a resolution in January 2011 in which was
123
_Independent Auditor’s Report
stated that the Group had to transfer the CUC N.V. shares to Refineria di
Kòrsou N.V. (RdK N.V.) without any compensation. The transfer of the shares
was effected on 19 January 2011. The Council of Ministers engaged an inde-
pendent third party to determine the value of the transferred shares. The third
party concluded that a value of ANG 53.8 million is considered a reasonable
estimation of the fair value of the shares transferred as of 19 January 2011.
The Council of Ministers approved this valuation on 20 February 2013. A
shareholder’s resolution remains pending to be adopted to formalize the
above mentioned. Management has been in deliberation with the Government
and the Shareholders of both companies to accelerate the execution of the
decision of the Council of Ministers of 20 February 2013.
The Government as the shareholder of both companies, namely the Minister
of Finance in charge of IUH N.V. and the Minister of General Affairs in charge
of RdK N.V. has met with the representatives of both companies. It was agreed
that both companies will work together to reach an agreement for settlement
of the compensation for the shares transferred. As of date of our audit opinion
a final settlement has not been reached.
The developments surrounding the Corona (Covid-19) virus have a profound
impact on people’s health and on our society as a whole, as well as on the
operational and financial performance of organizations and the assessment
of the ability to continue as a going concern. The consolidated financial
statements and our auditor’s report thereon reflect the conditions at the time
of preparation. The situation changes on a daily basis giving rise to inherent
uncertainty. Integrated Utility Holding N.V. is confronted with this uncertainty
as well, that is disclosed in the report of managing directors on page 14 and
the disclosure about events after the reporting period on pages 114 and 115.
We draw attention to these disclosures.
MANAGEMENT’S AND SUPERVISORY BOARD’S RESPONSIBILITY FOR THE CONSOLIDATED SUMMARY FINANCIAL STATEMENTS.Management is responsible for the preparation of the consolidated summary
financial statements in accordance with the notes to the consolidated
summary financial statements.
The Board of Supervisory Directors is responsible for overseeing the financial
reporting process.

Annual Report 2019
124
AUDITOR’S RESPONSIBILITYOur responsibility is to express an opinion on whether the consolidated sum-
mary financial statements which are consistent, in all material respects, with
the audited consolidated financial statements based on our procedures, which
were conducted in accordance with International Standards on Auditing, in-
cluding the Standard on Auditing (ISA) 810 (Revised), Engagements to Report
on Summary Financial Statements.
Curaçao, 23 september 2020
61213093 120/22501
Ernst & Young Accountants
C. Smorenburg RA AA

125
_Colophon
_Colophon
GROUP COMPANIESAqualectra N.V.
Aqualectra Multi Utility Company N.V. (AMU)
General Engineering & Utility Services N.V. (GEUS)**
Aqualectra Bottling Co. N.V. **
**The entities GEUS and Aqualectra Bottling Co. N.V. are still part of the group, but they are in liquidation.
MAIN OFFICEPater Euwensweg 1
Willemstad, Curaçao
T +5999 463 2000
F +5999 462 6685
W aqualectra.com
BOARD OF MANAGING DIRECTORSMr. Darick P. Jonis MSc. MBA - Chief Executive Officer
Mrs. Neysa R. Schoop-Isenia MSc. RA - Chief Financial Officer
BOARD OF SUPERVISORY DIRECTORSMr. C. Marshall (October 12, 2018-2022) - Supervisory Director and acting Chairman*
Mrs. S. Inderson (November 7, 2017-2021) - Supervisory Director and acting Chairman**
Mr. R. Bulbaai (September 19, 2017-2021) - Supervisory Director
Mr. R. Rudolph (August 31, 2018-2022) - Supervisory Director
Mrs. J. Da Silva Goes-Laclé (March 20, 2019-2023) - Supervisory Director
*Starting March 1, 2020**July 1, 2019 to February 2020)
CONCEPT, LAYOUT & ILLUSTRATIONSPRGV 100% Creatie
GENERAL COORDINATIONB24 N.V.

Annual Report 2019
126

