lse preliminary results
DESCRIPTION
TRANSCRIPT

London Stock Exchange Group plc Preliminary results FY 2012 18th May 2012

Agenda
Introduction
Financial Review Doug Webb, Chief Financial Officer
CEO Overview Xavier Rolet, Chief Executive
Q&A

Xavier Rolet
Chief Executive

Highlights
• Excellent progress in delivering growth and diversification strategy
• Scale scope and reach of Group transformed through organic growth and
acquisitions
• Organic – Turquoise, Derivatives, ORB, technology partnerships
• Acquisitions – FTSE, LCH.Clearnet, TRS
• Strong financial performance
• Total income up 21%,
• Adjusted profit before tax up 35%; reported profit before tax up 169% -
including recognition of value of existing 50% stake in FTSE
• Growth in revenue across all four divisions
• Dynamic, highly competitive landscape continues to present good
opportunities
4

5
Doug Webb
Chief Financial Officer

6
Key financial highlights
• Strong performance - total income up 21% to £814.8m; up 16% on organic and
constant currency basis
• Active and successful management of underlying operating expenses
• Adjusted operating profit up 30% at £441.9m, up 25% at organic constant
currency
• Adjusted EPS up 36% to 100.6p; basic EPS up 243% to 193.6p
• Strong net cash flow from operations of £462m; net debt £538m
• Adjusted net debt : EBITDA 1.4x; (Pro forma 2.0x including proposed
acquisition of 60% majority stake in LCH.Clearnet)
• Total dividend up 6% at 28.3 pence per share

7
Overview of results
See notes in Appendix for basis of preparation
• Excluding amortisation of purchased intangibles (£54.9m), non-recurring items (£28.5m) and revaluation of FTSE
/ sale of Servizio Titoli (£324.3m)
• FTSE amortisation of purchased intangibles £12.6m for the period
• A €0.05 movement of the Euro versus GBP would have changed adjusted operating profit by c£12m
Organic and
constant currency
2012 2011 Change variance
£m £m % %
Revenue 679.8 615.9 10% 5%
Total income 814.8 674.9 21% 16%
Adjusted Operating expenses* (378.8) (336.9) 12% 7%
Adjusted operating profit * 441.9 341.1 30% 25%
Operating profit 358.5 283.0 27% 22%
Net finance expense (40.8) (44.8) (9%)
Adjusted profit before tax* 400.6 296.3 35%
Underlying effective tax rate 29.2% 30.3%
Basic earnings per share (p) 193.6 56.4 243%
Adjusted earnings per share (p)* 100.6 73.7 36%
Dividend per share (p) 28.3 26.8 6%
31 March
Year ended

8
Diversified Group income
FY 2012 Total income £814.8m up 21% (FY 2011 £674.9m)

9
Diversified Group income – pro forma (incl FTSE)
Pro forma FY 2012 total income £888.0m

10
Capital Markets - Primary
Highlights
Annual fees up 4%
Admission revenue up 12%
159 new issues
40 new international companies
Bond revenue £3.3m up 73%
Bond issuance strong
“BTP Italia” – strong demand
500 new issues on MOT, up 120%; Nominal value €719bn
ORB
22 bonds have raised £1.5bn since launch
April 2012 HSBC RMB bond listed
Fixed income issuance strong – equity pipeline encouraging
Revenue FY 2012 up 8%
Note: Minor rounding differences, figures may not cast down

11
Capital Markets - Secondary
Highlights
Secondary Markets:
UK value traded and Italian
trade volumes - stable
Share of trading UK & Italy – broadly unchanged
Turquoise
Equity value traded up 46%
European share 5.4% (2011 3.6%)
Derivatives volumes up 15%
Fixed income revenue up 10% MOT trades up 41%
MTS France consolidated
Equity trading levels and share of trading stable
Revenue FY 2012 up 2%
Note: Minor rounding differences, figures may not cast down

12
Post Trade Services
Growth in cleared volumes and strong treasury management income
Highlights
Total revenue up 10% on organic basis Increased Italian equities,
derivatives and MOT fixed income volumes
Clearing – Net treasury income up 147%
Increased derivatives and fixed income trading
Strong risk management continued
Settlement revenue up 4%
Custody revenue up 10% on organic basis
Increased bond issuance
Assets under custody up 2%
Total income up 52% (up 58% organically)
Note: Minor rounding differences, figures may not cast down

13
Post Trade Services
CCP Net treasury income – significant step up through active management
in volatile markets
Average total initial margin FY 2012 up 36% to €9.4bn
Average initial cash margin FY 2012 of €7.4bn (up 100% on FY 2010)
14
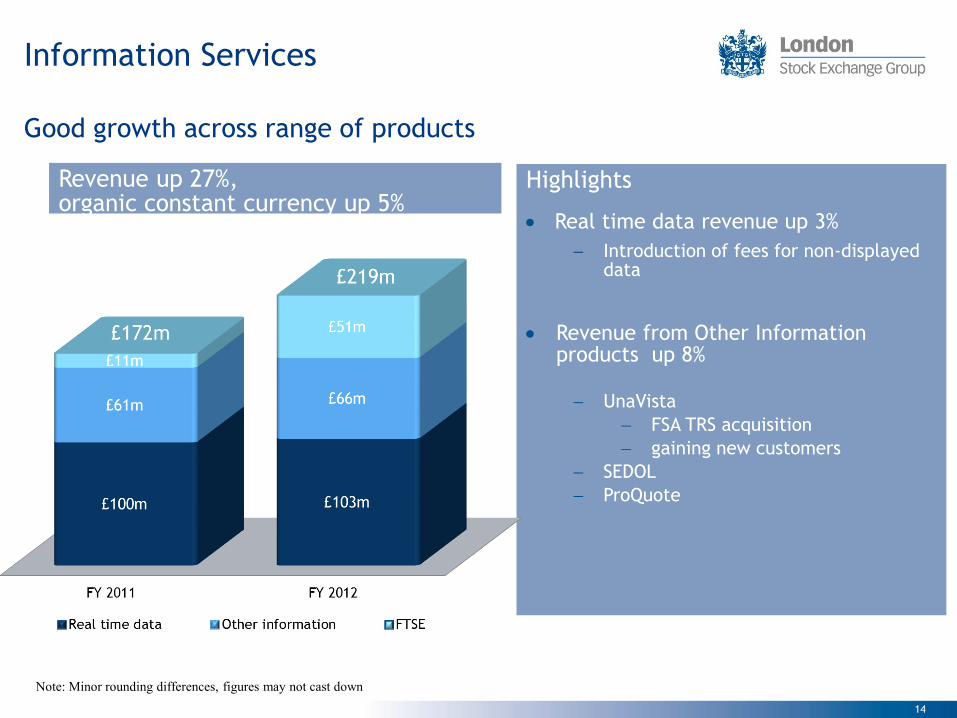
Information Services
Good growth across range of products
Revenue up 27%, organic constant currency up 5%
Highlights
Real time data revenue up 3%
Introduction of fees for non-displayed data
Revenue from Other Information products up 8% UnaVista
FSA TRS acquisition
gaining new customers
SEDOL
ProQuote
Note: Minor rounding differences, figures may not cast down
15
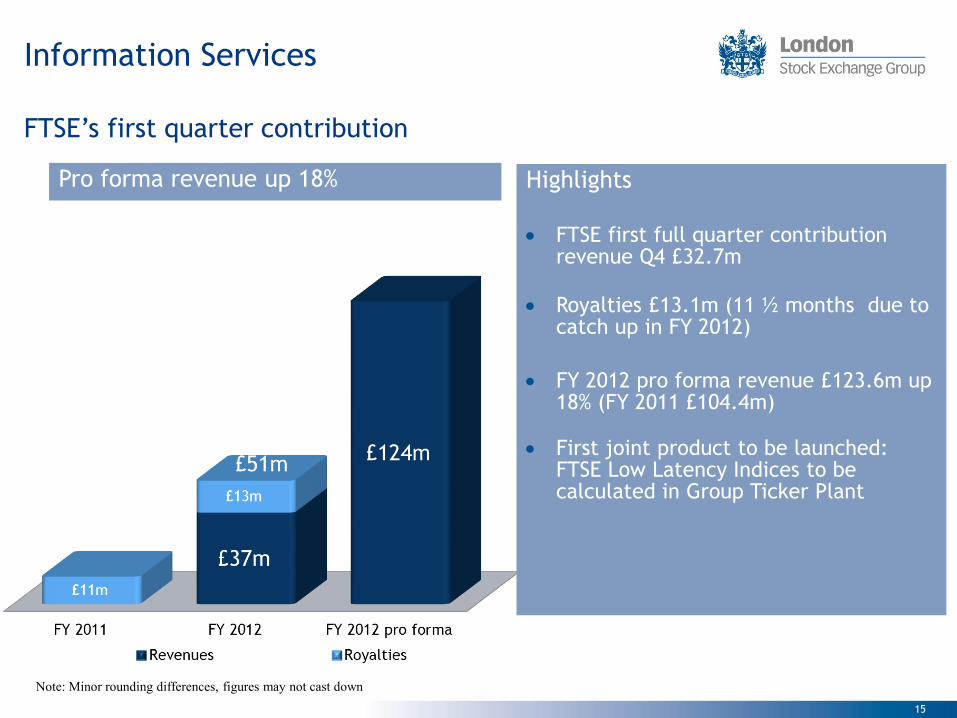
Information Services
FTSE’s first quarter contribution
Pro forma revenue up 18%
Highlights
FTSE first full quarter contribution revenue Q4 £32.7m
Royalties £13.1m (11 ½ months due to catch up in FY 2012)
FY 2012 pro forma revenue £123.6m up 18% (FY 2011 £104.4m)
First joint product to be launched: FTSE Low Latency Indices to be calculated in Group Ticker Plant
Note: Minor rounding differences, figures may not cast down

16
Technology Services
MillenniumIT technology implementation across range of customers Revenue up 8%
Highlights
MillenniumIT Revenue up 26% at constant currency
Remains focused on providing technology for Group
Live:
Chittagong Stock Exchange (trading and surveillance)
Tullett Prebon (trading)
Schedule – year ahead:
Borsa Italiana cash equity
Mongolian SE
Johannesburg SE
Oslo Børs
Delhi SE
Data centre co-location services continue to expand

17
Operating expenses
Major movements
• Excluding acquisitions and variable staff compensation costs,
reflecting share price and earnings growth, underlying operating
expenses broadly flat Note: Excluding amortisation of purchased intangibles and non-recurring items

18
Summarised cash flow
Continued strong cash generation
£ million Investment activities
• £33.4m capex – primarily IT
systems and data centre
related
• £495m spent on
acquisitions of FTSE, CC&G
stake and TRS
• £33m received from
disposals and Turquoise
minority interest
subscription
• Discretionary free cash flow
per share 103.5p (FY 2011:
80.4p)
Note: Excludes investment in acquisitions, joint ventures and subsidiary and disposals
* Investing activities includes £33.4m Capital expenditure less £1.8m Dividends received

19
Borrowings
• Operating net debt £703m
• £165m cash reserved for
regulatory and operational
purposes (FY 2011: £125m)
• £1.39bn total committed
facilities - £634m available at
31 March 2012
• Pro forma gearing including
proposed acquisition of 60%
majority stake of
LCH.Clearnet down from 2.1x
to 2.0x
Adjusted Net debt to Pro forma EBITDA excludes cash held for regulatory purposes
Facilities
Operating net debt to Pro forma EBITDA

20
Xavier Rolet
Chief Executive

21
Successful execution and delivery of strategy
• Excellent progress in delivering growth and diversification
strategy
• Strong operational and financial performance
• Getting in shape
• Costs well controlled, broadly flat on underlying basis
• Leveraging our assets
• Range of initiatives and new products launched
• Developing opportunities
• FTSE – high growth, high quality business with excellent
development prospects
• Proposed acquisition of 60% majority of LCH.Clearnet –
partnership with customers in leading global clearing and
risk management infrastructure
• Technology sales, international partnerships and joint
ventures

22
Successful execution and delivery of strategy Group transformed – scale and diversification
Enlarged Group Pro Forma Total Income
FY 2012 £1,227.6m1
1Enlarged Group pro forma total income: LSEG FY 2012, FTSE LTM 31Mar2012, LCH LTM 31Dec2011
FY 2009 £671.4m
23
• Strong focus on control of costs
• Underlying costs remain broadly flat
• Ongoing programme of technology upgrades across Group – next steps:
Borsa Italiana MTA go-live on Millennium Exchange and launch of Group
Ticker Plant
• Additional Group platforms to be upgraded to Millennium
• Talent development – selected senior expert appointments, ongoing
graduate recruitment
Strategic delivery Getting in shape

24
Strategic delivery Leveraging Assets
• Capital Markets - launch of Turquoise Derivatives; MTS new bond
services, ORB retail bond market development, MOT and BTP Italia
• Post Trade Services – CC&G providing clearing to 3 external parties; X-
Com at Monte Titoli go-live expected mid-2012; preparation for T2S
• Information Services – TRS acquired, UnaVista expanding and gaining
clients; Google data deal
• Technology Services – IT Sales and partnerships: Delhi SE, Mongolian SE,
Chittagong SE and Tullett Prebon; final stage testing before go-live of
Millennium Exchange at Johannesburg SE; Oslo Börs migration to follow
• As scale, breadth and reach of business continues to grow, opportunities
to leverage portfolio become greater

25
Strategic delivery Developing opportunities: FTSE
• High growth, high quality global index business
• 5 year CAGR of 22% for revenue and EBITDA
• Ownership will accelerate and expand scope and growth of FTSE and
LSE Group
• World-class IP
• Development of listed derivatives, ETFs and structured products
• Global reach and exposure to emerging and growth markets
• Significant cost (£10m pa end year 3) and revenue synergies
(£18m gross pa end year 3)
• Group Data Centre and Ticker Plant initiatives underway - joint
launch of FTSE “low latency”
• Index licences – basis for forming further global relationships,
together with MillenniumIT and other Group businesses
• Excellent progress since full control – confirms FTSE exceptional
quality and potential

26
Strategic delivery Developing opportunities: LCH.Clearnet
• Confirms long term leading role in international customer focused market
infrastructure
• Captures growth in clearing services with new products and geographies
• Customer partnership, horizontal model, open access and fully competitive
• Significant cost efficiencies (€59m pa by end year 3) and revenue synergies (€20m
pa by end year 3)
• Further developments
• Shareholder approvals received – April 2012; acceptances & scale-back notified
• US “one-pot” margining – LCH / NYPC / DTCC & NYSE Euronext
• LCH/NASDAQ IDCG – US interest rate swaps, expansion of one-pot margining
• NYSE Euronext cash equities – LCH negotiations for long term arrangement
• Next steps
• Antitrust filings – process underway with OFT in UK, plus CNC in Spain & PCA in
Portugal
• Regulatory filings underway
• Completion expected by Q4 2012

27
Outlook: Focus and opportunities
• Widespread structural change and dynamic market creates significant opportunities for growth
• Two key differentiating factors / competitive advantage from operational
efficiency and distribution of:
• Balance sheet and risk management services
• Intellectual property
• Regulatory trends define operating landscape:
• EMIR / Dodd-Frank - OTC derivatives mandated to use CCP services
• TARGET2-Securities (T2S) – Monte Titoli preparation as first wave
participant
• MIFID / MIFIR – opens market to efficient, competitive infrastructure
providers
• Customers need scaled, proven partners to provide trusted, highly efficient,
global capital market services and technology

28
Group in good shape
• Very good year – Increasing diversification
– Strong financial performance continues
– Good operational management
• More to come from: – FTSE
– LCH.Clearnet
– Organic drivers
• Sector will continue to be defined by opportunities in: – Balance sheet and risk management services
– Intellectual property
Transformational year, exciting opportunities ahead,
more to achieve

29
Appendices
30
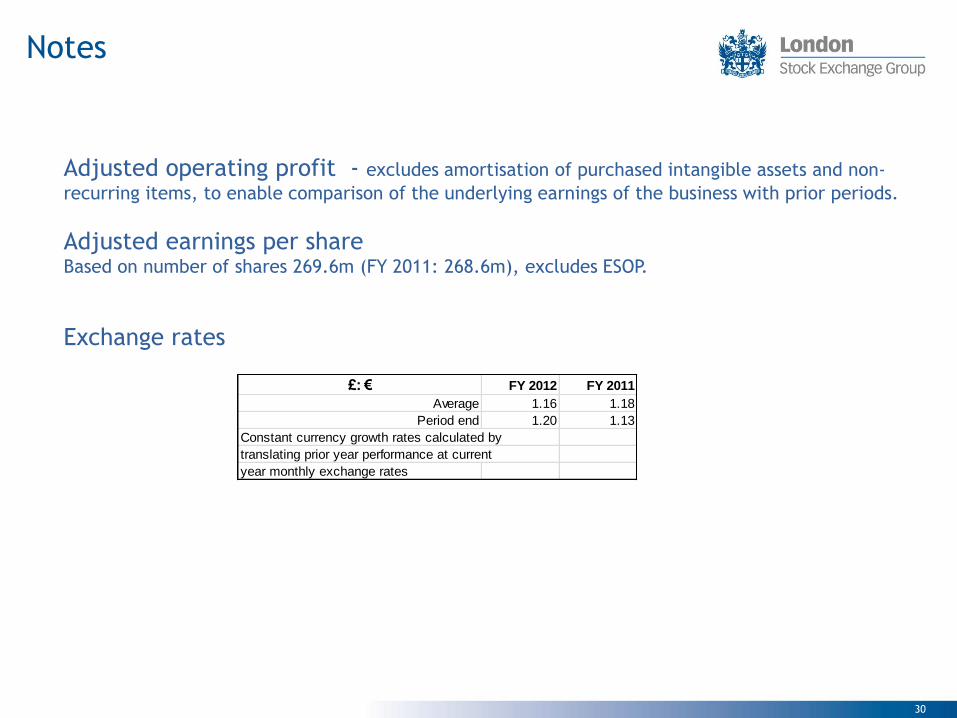
Notes
Adjusted operating profit - excludes amortisation of purchased intangible assets and non-
recurring items, to enable comparison of the underlying earnings of the business with prior periods.
Adjusted earnings per share Based on number of shares 269.6m (FY 2011: 268.6m), excludes ESOP.
Exchange rates
£: € FY 2012 FY 2011
Average 1.16 1.18
Period end 1.20 1.13
Constant currency growth rates calculated by
translating prior year performance at current
year monthly exchange rates

31
Operating expenses
Excluding amortisation of purchased intangibles and non-recurring items
Note: Minor rounding differences, figures may not cast down
Cost : Income ratio 46% (FY 2011 49%)

32
Revenues - Quarterly
Note: Minor rounding differences may mean quarterly and other segmental figures may differ slightly.
FY 2011 Capital Markets prior quarters restated to include Turquoise revenues gross of maker rebates
FY 2011 FY 2012
£ millions Q1 Q2 Q3 Q4 FY 2011 Q1 Q2 Q3 Q4 FY 2012
Annual Fees 9.3 9.4 9.6 9.4 37.8 9.9 10.2 10.0 9.4 39.5
Admission Fees 8.8 6.5 9.5 8.3 33.0 12.2 8.2 7.1 9.5 37.0
Cash equities UK & Turquoise 26.7 21.9 21.6 26.2 96.4 24.3 27.8 21.1 22.2 95.4
Cash equities Italy 8.7 6.0 6.8 9.3 30.7 7.7 8.5 7.2 8.0 31.4
Derivatives 4.9 3.5 3.8 4.5 16.8 4.3 4.7 3.9 3.8 16.7
Fixed Income 7.4 7.2 8.3 9.5 32.4 9.8 9.0 8.0 8.9 35.7
Other 10.7 10.5 11.9 11.2 44.4 11.5 11.7 11.6 11.4 46.2
Capital Markets 76.5 65.0 71.5 78.4 291.5 79.7 80.1 68.9 73.2 301.9
Clearing 9.7 7.2 8.4 10.7 35.9 9.9 11.7 10.2 9.3 41.1
Settlement 5.0 3.9 4.5 4.8 18.2 4.8 5.0 4.3 4.8 18.9
Custody & other 12.2 10.3 11.0 11.6 45.2 11.3 9.7 10.0 10.6 41.6
Post Trade Services 26.9 21.4 23.9 27.1 99.3 26.0 26.4 24.5 24.7 101.6
Real time data 24.4 23.9 24.4 27.1 99.8 25.2 25.0 25.4 27.2 102.8
Other information 15.5 15.0 15.2 15.0 60.7 16.3 15.8 16.3 17.2 65.6
FTSE royalties 2.6 2.7 2.9 3.1 11.3 3.2 3.5 6.4 0.0 13.1
FTSE revenue 4.7 32.7 37.4
Information Services 42.5 41.6 42.5 45.2 171.8 44.7 44.3 52.8 77.0 218.9
MillenniumIT 5.0 4.0 4.1 5.0 18.2 3.2 6.4 5.5 7.2 22.2
Technology 7.6 7.9 7.3 7.7 30.4 7.4 7.8 7.6 7.6 30.4
Technology Services 12.6 11.9 11.4 12.7 48.6 10.6 14.2 13.1 14.8 52.6
Other 1.5 0.7 1.3 1.2 4.7 1.4 0.7 1.5 1.2 4.8
Total Revenue 160.0 140.6 150.6 164.6 615.9 162.4 165.7 160.8 190.9 679.8
Net treasury income through CCP 5.9 10.8 14.8 19.8 51.3 25.8 28.5 33.5 39.1 126.9
Other income 1.9 1.9 2.0 1.9 7.7 2.0 2.1 2.0 2.0 8.1
Total income 167.8 153.4 167.4 186.3 674.9 190.2 196.3 196.3 232.0 814.8
33
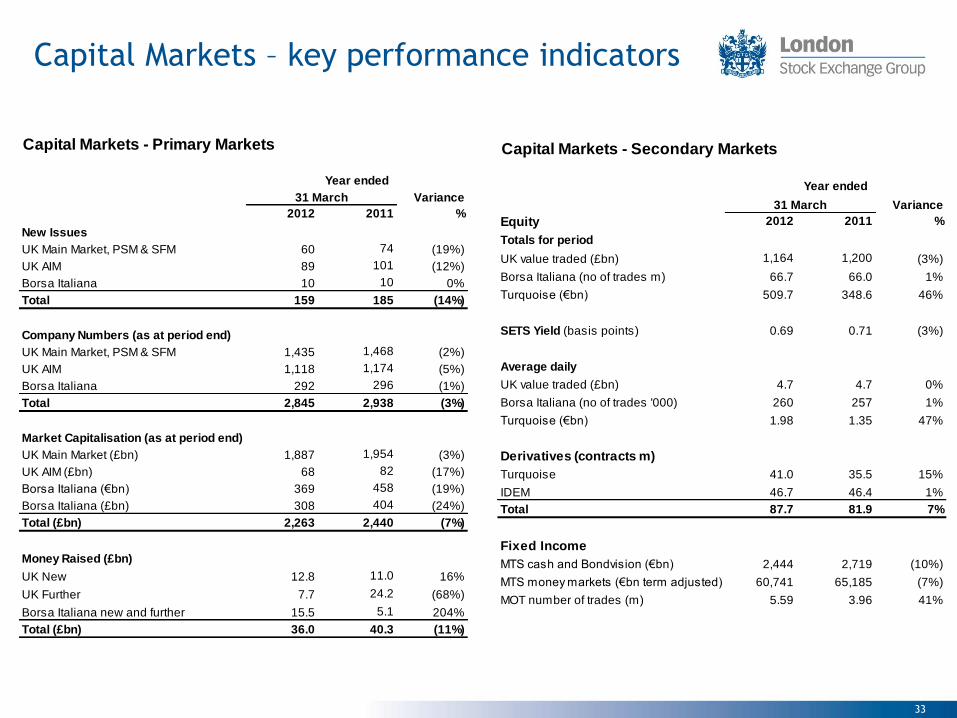
Capital Markets – key performance indicators
Capital Markets - Primary Markets
Variance
2012 2011 %
New Issues
UK Main Market, PSM & SFM 60 74 (19%)
UK AIM 89 101 (12%)
Borsa Italiana 10 10 0%
Total 159 185 (14%)
Company Numbers (as at period end)
UK Main Market, PSM & SFM 1,435 1,468 (2%)
UK AIM 1,118 1,174 (5%)
Borsa Italiana 292 296 (1%)
Total 2,845 2,938 (3%)
Market Capitalisation (as at period end)
UK Main Market (£bn) 1,887 1,954 (3%)
UK AIM (£bn) 68 82 (17%)
Borsa Italiana (€bn) 369 458 (19%)
Borsa Italiana (£bn) 308 404 (24%)
Total (£bn) 2,263 2,440 (7%)
Money Raised (£bn)
UK New 12.8 11.0 16%
UK Further 7.7 24.2 (68%)
Borsa Italiana new and further 15.5 5.1 204%
Total (£bn) 36.0 40.3 (11%)
31 March
Year ended
Capital Markets - Secondary Markets
Variance
Equity 2012 2011 %
Totals for period
UK value traded (£bn) 1,164 1,200 (3%)
Borsa Italiana (no of trades m) 66.7 66.0 1%
Turquoise (€bn) 509.7 348.6 46%
SETS Yield (basis points) 0.69 0.71 (3%)
Average daily
UK value traded (£bn) 4.7 4.7 0%
Borsa Italiana (no of trades '000) 260 257 1%
Turquoise (€bn) 1.98 1.35 47%
Derivatives (contracts m)
Turquoise 41.0 35.5 15%
IDEM 46.7 46.4 1%
Total 87.7 81.9 7%
Fixed Income
MTS cash and Bondvision (€bn) 2,444 2,719 (10%)
MTS money markets (€bn term adjusted) 60,741 65,185 (7%)
MOT number of trades (m) 5.59 3.96 41%
31 March
Year ended

34
Information Services – key performance indicators
Post Trade – key performance indicators Post Trade Services
Variance
2012 2011 %
CC&G Clearing (m)
Equity clearing (trades) 70.3 69.4 1%
Derivative clearing (contracts) 46.7 46.4 1%
Total Contracts 117.0 115.8 1%
Open interest (contracts as at period
end) 5.0 4.6 9%
Initial margin held (average €bn) 9.4 6.9 36%
Monte Titoli
Pre Settlement instructions (trades m) 33.6 31.2 8%
Settlement instructions (trades m) 34.6 38.6 (10%)
Total Settlement 68.2 69.8 (2%)
Custody assets under management
(average €tn) 3.08 3.02 2%
31 March
Year ended
Information Services
Variance
2012 2011 %
UK Terminals
Professional - UK 37,000 38,000 (3%)
Professional - International 53,000 55,000 (4%)
Total 90,000 93,000 (3%)
Borsa Italiana Professional Terminals 139,000 139,000 0%
31 March
As at

35
No representation or warranty, expressed or implied, is made or given by or on behalf of London
Stock Exchange Group plc (the “Company”) or any of its directors or any other person as to the
accuracy, completeness or fairness of the information or opinions contained in this presentation
and no responsibility or liability is accepted for any such information or opinions. This
presentation does not constitute an offer of securities by the Company and no investment decision
or transaction in the securities of the Company should be made on the basis of the information or
opinions contained in this presentation.
The content of this presentation includes statements that are, or may deemed to be, "forward-
looking statements". These forward-looking statements can be identified by the use of forward-
looking terminology, including the terms "believes", "estimates", "anticipates", "expects", "intends",
"may", "will" or "should". By their nature, forward-looking statements involve risks and
uncertainties and readers are cautioned that any such forward-looking statements are not
guarantees of future performance. The Company's actual results and performance may differ
materially from the impression created by the forward-looking statements. The Company
undertakes no obligation to update or revise any forward-looking statements, except as may be
required by applicable law and regulation (including the Listing Rules).
This presentation and its contents are confidential and should not be distributed, published or
reproduced (in whole or in part) or disclosed by recipients to any other person.