lpg injection in compression ignition engines
TRANSCRIPT

Staffordshire University, Faculty of Computing, Engineering & Sciences
LPG Injection in Compression Ignition Engines BSc Motorsport Technology, Final Year Project Submission
Rob Harvey April 2016 Project Supervisor: Debi M Roberts

pg. 1
Abstract
The depletion of conventional fossil fuel resources and concerns on the negative environmental
effect of their use has caused a need to find alternative fuel solutions for transport. A great deal of
research and development work is currently being undertaken into ultra-low and zero emissions
(ULEV & ZEV) small passenger vehicles. Including plug-in hybrid electric (PHEV) and hydrogen fuel
cell cars. However, the vast majority of vehicles in use today are fuelled by conventional liquid fossil
fuels, petroleum and diesel. The short range of electric vehicles currently in production and lack of
re-charging infrastructure makes them impractical for the majority of car users. This has prompted
the search for a transitional low emission vehicle (TLEV) solution and a solution which can be retro-
fitted to current fossil fuel powered vehicles without the need for major modification to the engine
and fuel systems.
One solution which has been identified by several researchers is the incorporation of liquid gaseous
fuels such as liquid natural gas (LNG) and liquid petroleum gas (LPG). Because gaseous fuels, when
burnt completely, produce far less SOx NOx and CO2 making them a viable alternative to address the
environmental concerns raised by the use of conventional fossil fuels. Gaseous fuels such as these
possess a high octane number and a low cetane number. This makes them suitable as an alternative
fuel in spark ignition engines. However the low cetane number makes it impossible to use them in
compression ignition engines without an amount of diesel used as an ignition source or ‘pilot fuel’.
Current light passenger car sales show diesels having a majority market share of around 51% (SMMT,
2015). To understand how diesel engines could be modified to capitalise on the preferable
combustion properties of gaseous fuels it is necessary to carry out research and testing which was
the primary objective of this project. An economical method of research and testing would be to use
simulation software such as Ricardo’s WAVE package. However, it was identified early on in the
research that the standard combustion models provided by Ricardo with their software were not
suitable for the proposed gas injection method and would provide anomalous results. This meant
that, for the purposes of the project it was more prudent to design build and test a real diesel-
gaseous fuel rig. This was then tested using an engine dynamometer to observe the variation in
power and torque curves and the exhaust emissions.

pg. 2
Acknowledgements
The project supervisor, Debi Roberts who provided support and assistance throughout the
project.
Engineering Technical Specialist at Staffordshire University, Neil Harvey. Without his
knowledge, skills and experience in component design and manufacture the project would
not have been possible.
Automotive and Motorsport Technical Specialist at Staffordshire University, Gareth
Downing. For his knowledge and assistance in running the test rig and obtaining results.
Engineering Technical Specialist at Staffordshire University, Mick Britton for his assistance in
producing prototype components.
Joost Jochems, Managing Director of DYNOSTAR BV for his help and kind assistance in the
instrumentation of the test rig and running of the Dynamometer and software.

pg. 3
Contents
Abstract ................................................................................................................................................... 1
Acknowledgements ................................................................................................................................. 2
Glossary ................................................................................................................................................... 5
1 - Introduction ....................................................................................................................................... 6
2 - Objectives .......................................................................................................................................... 8
3 - Method .............................................................................................................................................. 9
3.1 - Engine Selection & Dynamometer Frame Design ................................................................... 9
3.2 - Cooling System Design and Specification ............................................................................. 10
3.3 - Electrical & Control System Design and Specification .......................................................... 12
3.4 - Instrumentation and Data Acquisition Systems Design and Specification ........................... 14
3.5 - Dual-Fuel LPG System Design and Specification ................................................................... 15
3.6 - Drive Coupling Design and Specification .............................................................................. 16
3.7 - Assembly and Construction of Test Rig ................................................................................ 16
4 - Project Management ....................................................................................................................... 20
4.1 - Project Risk Management Table ............................................................................................... 21
5 - Results .............................................................................................................................................. 23
5.1 - Theoretical Calculations & Manufacturer Data (Power & Torque) ...................................... 23
5.2 - Obtaining Results & Running Procedures ............................................................................. 25
5.3 - Diesel Only Test Results ........................................................................................................ 25
5.4 - Dual Fuel Test Results ........................................................................................................... 27
6 - Discussion ........................................................................................................................................ 31
Conclusion ............................................................................................................................................. 32
Recommendations ................................................................................................................................ 33
References & Bibliography .................................................................................................................... 34
Appendices ............................................................................................................................................ 36
Appendix A – Farymann Technical Data ........................................................................................... 36
Appendix B – Dynostar Email Correspondence ................................................................................ 41

pg. 4
Appendix C – Dynostar ECB500 Technical Data ................................................................................ 41
Appendix D – Manual Technical Drawing of Engine Frame .............................................................. 43
Appendix E – CAD Model and Technical Drawings of Engine Frame ................................................ 44
Appendix F – Bosch Water Pump Technical Specification ................................................................ 44
Appendix G – Farymann 43W Cooling System Diagram ................................................................... 45
Appendix H – Cooling System Component Technical Drawings ....................................................... 45
Appendix I – Switch Panel Technical Drawing .................................................................................. 46
Appendix J – Inlet Spacer/Adapter Technical Drawing ..................................................................... 47
Appendix K – Bosch Temperature Technical Specification ............................................................... 48
Appendix L – Gas Analyser Calibration Certificate ............................................................................ 50
Appendix M – LPG Vaporiser Technical Specification ....................................................................... 51
Appendix N – Purchases and Suppliers ............................................................................................. 52
Appendix O – Drive Adapter Technical Drawing ............................................................................... 53
Appendix P – Radiator Frame Technical Drawing ............................................................................. 54
Appendix Q – Health & Safety Risk Assessments.............................................................................. 55
Appendix R – Emissions Data ............................................................................................................ 62
Appendix S – LPG Specification and Safety Data Sheet .................................................................... 63

pg. 5
Glossary
BMEP, brake mean effective pressure.
CNG, compressed natural gas.
CO, carbon monoxide.
CO2, carbon dioxide.
DME, dimethyl ether.
HC, hydrocarbons.
ICFN, international standard continuous fuel stop net power.
IFN, international standard fuel stop net power.
LNG, liquefied natural gas.
LPG, liquid petroleum gas.
MJ/kg, mega Joules per kilogram.
MPa, mega Pascals.
NOx, nitrogen oxides.
PHEV, plug-in hybrid electric vehicle.
PM, particulate matter.
SOx, sulphur oxides.
TLEV, transitional low emission vehicle.
ULEV, ultra-low emission vehicle.
ZEV, zero emission vehicle.

pg. 6
1 - Introduction
Environmental concerns and the depletion of conventional fossil fuel resources has brought about
an ever increasing need to find alternative fuels for motor vehicles. There is currently a great deal of
research and development of ultra-low and zero emissions (ULEV and ZEV) small passenger vehicles.
These include hydrogen fuel cell and plug-in electric hybrid (PHEV) vehicles. However, the majority
of vehicles in use today are powered by conventional liquid fossil fuels. The short range of electric
vehicles between charges and lack of charging infrastructure means they are not suitable for the vast
majority of car users and there are currently very few hydrogen refuelling stations in Europe with
only thirteen in the UK (H2Stations.org, 2016). This has prompted the search for a transitional low
emission vehicle (TLEV) solution. The incorporation of alternative gaseous fuels such as natural gas
and liquid petroleum gas (LPG) has been identified by several researchers as a possible TLEV
solution. LPG is a by-product of the petroleum refining process, its primary constituents being
propane and butane. LPG is already widely available at filling stations throughout the UK and Europe
and can be stored at low pressures between 0.7-0.8MPa. LPG has a calorific value of around
32MJ/kg compared to 42MJ/kg for diesel, it also has a high octane number and a low cetane
number. This makes it suitable as an alternative fuel in spark ignition engines. However the low
cetane number makes it impossible to use in compression ignition engines without an amount of
diesel used as an ignition source or ‘pilot fuel’. Current light passenger car sales show diesels having
a majority market share of around 51% (SMMT, 2015). Therefore an ideal TLEV solution should look
to incorporate diesel technology with a workable solution for the modification of current diesel
vehicles to reduce SOx NOx CO2 CO and PM emissions. The objective of the project was to provide
just such a solution, constructing a working diesel-LPG dual-fuel system to be tested using a
dynamometer to observe power and torque curve changes for varying mixes of diesel and LPG whilst
also observing changes in exhaust emissions using an automotive exhaust gas analyser.
Motorsport is normally at the forefront of new technologies and development in the automotive
industry. However, development of diesel engines for motorsport applications had been almost
non-existent until 2006 when Audi announced it would enter the 24 Heures Du Mans endurance
race with a diesel powered car. Diesel powered cars won the race every year between 2006 and
2014. This success led some to suggest that the construction rules and regulations for endurance
racing are biased in favour of diesel cars (Bamsey, 2008). However, diesel engine Nitrogen Oxides
(NOx) and Particulate Matter (PM) emissions are considerably higher than their gasoline
counterparts when exhaust gases are untreated. Elnajjar et al. (2013) identify a variety of methods in
current use to reduce these emissions. Including Exhaust Gas Recirculation (EGR), Diesel Particulate
Filter (DPF) and Selective Catalytic Reduction (SCR). While reducing emissions to an acceptable level
pg. 7
under current legislation, all these methods compromise power and torque performance. The
authors research investigates the feasibility of using alternative gaseous fuels including Liquefied
Petroleum Gas (LPG), Liquefied and Compressed Natural Gas (LNG and CNG) and Dimethyl Ether
(DME) as the primary fuel for combustion with diesel as the pilot fuel (ignition source). Gaseous
fuels, when burnt completely, produce far less SOx NOx and CO2 and possess a much higher octane
number than diesel meaning they can be used in modern high compression engines with
comparable efficiencies to diesel but producing higher power and torque values. Of these gaseous
fuels the authors suggest LPG as the most viable due to its availability in many countries. LPG is a
blend of two gases, propane and butane. Volume percentages vary dependant on country of
production and availability. Reported composition ratios for European countries include; Italy 25/75,
France 35/65 and Germany 90/10. However in the UK LPG is often 100% propane. This variance
creates a problem when performing experimentation which the authors overcame by mixing
propane and butane in quantified amounts and running multiple power, torque and efficiency tests
using a single cylinder Ricardo e6 variable compression research engine.
LPG dual fuel engines are also identified by Ashok et al. (2014) as being the most viable option due
to availability but also as LPG can be liquefied at lower pressures than other gaseous fuels, in a range
of 0.7-0.8 MPa. Having good thermal efficiency at high output. However at idling and part load,
performance is less than that of a diesel only engine due to incomplete combustion of the intake
charge. The authors suggest this can be overcome by optimising some engine operating and design
parameters including; idle speed, load, pilot fuel quantity, injection timing, intake manifold
conditions and composition of gaseous fuel. This is less of a concern for motorsport applications
where peak performance is required almost constantly. Emissions of hydrocarbons (HC) and CO are
also found to be higher than that of a diesel only engine at intermediate loads. A possible solution to
the emissions issues at idle and part load conditions is identified by (Korakianitis, et al., 2011), the
authors suggest that increased pilot fuel quantities and the addition of hydrogen gas can increase
combustion efficiency. However, power output will still be less than that of a diesel only engine due
to the incomplete combustion of the intake charge and reduced volumetric efficiency created by the
injection of LPG into the inlet manifold.
Research by Mohanan and Kumar (2001) identified that increases in LPG intake temperature could
help to improve combustion and negate some of the reduction in volumetric efficiencies created by
the LPG injection into the inlet manifold. However, this could only be practically achieved in existing
diesel-LPG systems by increasing engine coolant temperature beyond the operating constraints of
the engine. This is due to current systems utilising engine coolant to heat the LPG vaporiser and
therefore govern the LPG injection temperature. A proposed system to increase LPG injection

pg. 8
temperature would utilise a type of exhaust gas recirculation (EGR) similar to that seen in modern
high compression direct injection (DI) turbocharged engines. Exhaust gases would be circulated
through the LPG vaporiser in place of the engine coolant. In this case the vaporiser would act as an
exhaust gas heat-exchanger, vastly increasing the LPG injection temperature from that generated by
the engine coolant system. Another method of improving combustion and reducing the volumetric
efficiency problems associated with LPG injection was identified by Hariprasad (2013) where
research found that an increase in both diesel and LPG injection pressures gave increased
combustion, providing higher brake thermal efficiency and lower harmful emissions. This system
would be relatively easy to implement in existing vehicles with minor modifications including
recalibration of the high pressure diesel injection pump to deliver higher pressures within existing
operating limits.
Injection timing advance is another possible method of improving combustion and reducing
volumetric efficiency problems. Le & Nguyen (2011) found this solution to be flawed. In their
research they observed that advancing injection timing had little to no effect on brake power and
torque performance but reduced CO and PM emissions whilst increasing HC and NOx. A benefit of
this system however was reduced engine noise as injection of the pilot fuel early in the cycle induces
early ignition thus reducing the cylinder pressure rise rate. Sugiyama et al. (2003) tested the
addition of cetane enhancing additives to the LPG mixture. Aliphatic hydrocarbon (AH) was added to
increase the cetane number of LPG and improve auto-ignition of the fuel mix whilst also adding
lubricity improvers and therefore reducing cylinder wear when using high ratios of LPG to diesel.
The authors also suggest that this method would be suitable for diesel-DME (dimethyl ether) dual-
fuel systems. These additives made it possible to inject both diesel and LPG at a single point direct
into the cylinder meaning that only minor modification of the fuel system would be needed to
incorporate LPG into an existing diesel engine rather than a complete change of the intake system.
2 - Objectives
Critically asses existing diesel dual-fuel systems.
Investigate and specify existing dual-fuel components to generate a workable system.
Design, build, test and develop a bespoke dual-fuel system.
Evaluate performance and efficiency of the designed system.

pg. 9
3 - Method
3.1 - Engine Selection & Dynamometer Frame Design
Before testing and experimentation it was first necessary to design and
construct a diesel engine test rig and a system for converting the engine
to run on a mix of diesel and LPG. For simplicity and ease of conversion it
was decided to utilise a single cylinder diesel engine as a base. An
internet search was conducted to find suitable engines. This resulted in a
new and un-used, single cylinder, water-cooled Farymann 43W Diesel
engine (figure 1) being found. Further internet searches were conducted
to investigate the availability of manufacturer technical data for the
engine and the manufacturer was contacted and asked to provide any
technical data available. The manufacturer provided technical data including dimensions, capacities
and specifications. They also provided specific fuel consumption data and maps, all of which can be
found in appendix A. The manufacturer of the dynamometer, Dynostar were also contacted to
confirm the suitability of the University’s dynamometer to test the engine. Dynostar confirmed that
the dynamometer was suitable for testing (email correspondence in appendix B). With the wealth of
information available and the engines suitability for the project purposes the decision was made to
purchase. The engine was then collected from the supplier and delivered to the University and basic
checks and inspection carried out to confirm function and readiness for use.
The engine and proposed dual fuel system was to be tested using the University’s engine
dynamometer, Dynostar ECB500 (technical data in appendix C).
In order to mount the engine to the dynamometer a support
frame needed to be designed and manufactured. The support
frame would also need to accommodate the water-cooling
system and other ancillary
components.
Measurements were taken
from the dynamometer
frame and existing engine mounts to identify necessary
dimensions (figure 2) and an initial design for the frame was
designed with the aid of a manual technical drawing (appendix
D). The frame was then modelled using a CAD package (Creo
Parametric). This enabled the frame to be split into smaller
Figure 1 – Farymann 43W
Figure 2 – Engine frame
Figure 3 – 3D CAD model of engine and frame

pg. 10
components for manufacture and checked for compatibility with engine mounting points and
dynamometer frame and components, an image of the complete CAD assembly can be seen in figure
3 (CAD model images and technical drawings in appendix E, CAD files contained in separate file
submission).
3.2 - Cooling System Design and Specification
Although the Farymann 43W engine is of a water-cooled design it does not include a pump to
circulate the water-coolant. This is due to the engine being designed for marine applications where
the engine would be connected to a fresh/salt water system. It was therefore necessary to specify
some form of coolant pump, the coolant pump’s flow rate and pressure along with engine
manufacturer heat transfer data could then be used in theoretical calculations to determine the
volume of coolant required and also the required radiator specification. As the engine has no in-
built facility to drive a crank-driven water pump the decision was made to seek an independent
electric automotive pump. A Bosch 12 volt electric coolant-pump was specified (technical
specification in appendix F) as it was readily available from automotive suppliers and proven as
reliable from use in production vehicles.
3.2.1 - Heat Transfer Calculations
Assumptions:
Assume negligible thermal resistance across heat exchanger wall.
Cp Water = 4.2kJ/kgK
Hcw = 1000W/m2K
Hca = 10W/m2K
Air in = 20 ͦC
Air out = 25 ͦC
Engine/Pump Manufacturer Data:
Max coolant temp: 95 ͦC
Min coolant temp: 75 ͦC
Max Δ T: 10 ͦC
Coolant heat: 9.9kW
Radiation heat: 2kW
Max flow rate: 12.5 l/min
Delivery pressure: 0.1bar

pg. 11
𝑄 = 𝑈𝐴∆𝑇𝑚
Where:
1
𝑈=
1
𝐻𝑐𝑤+
1
𝐻𝑐𝑎=
0.101𝑚2𝐾
𝑊= 9.9𝑊𝑚2𝐾
∆𝑇𝑚 =(95 + 85) − (20 + 25)
2= 67.5𝐾
𝑄 = (�̇�𝐶𝑝)𝑤 𝑥 (𝑇1 − 𝑇2)
Where:
�̇�𝑤 =12.5
60= 0.2083𝑘𝑔/𝑠
𝑄 = 0.2083(4.2𝑥103)(95 − 85) − (2𝑥103) = 6749𝑊
𝑄 = 6749 = 9.9𝑥𝐴𝑥67.5 = 9.89𝑚2
From these calculations a high performance aluminium automotive radiator
(figure 4) was specified with a total surface area of 27.7m2, ensuring that
adequate cooling could be achieved when running the engine in the
dynamometer test booth. It was now necessary
to design and specify the cooling system
connections and hoses. A cooling system diagram
was provided by the engine manufacturer
(appendix G), using this and making approximations
as to hose length from the engine support frame
drawings, silicone hoses and in-line
reducers/connectors to suit the radiator, water pump
and engine connections were specified. In the event
that adequate cooling could not be achieved a 12 volt
electric cooling fan was also specified of an
appropriate diameter to suit the radiator (figure 7). A
table of cooling system components sourced from external suppliers can be
seen below (table 1). Further non-standard components including reducers
and connectors were also required. These were designed using CAD software (Creo Parametric). An
example of components produced can be seen in figures 5 and 6, technical drawings of all
Figure 4 - Radiator
Figure 5 – Hose connectors
Figure 6 – Water temp sensor housing
Figure 7 – Cooling fan

pg. 12
manufactured cooling system components can be found in appendix H with 3D CAD models included
in the separate large file submission.
DESCRIPTION SUPPLIER PART/ITEM
NUMBER
COST DELIVERY
COSTS
LINE
TOTAL
Radiator (Austin Rover
Mini, stainless steel)
X-Dream Auto (via
eBay)
121766914073 £49.00 £0.00 £49.00
Electric cooling fan
(30cm/120W/12v)
BB Classic Cars (via
eBay)
200906142879 £24.95 £6.95 £31.90
Electric water pump
(Bosch/12v)
AutoDetShop (via
eBay)
0392020034 £39.90 £0.00 £39.90
Silicone coolant hose (5
metre/10mm I/D)
Auto Silicone Hoses
Outlet (via eBay)
190893549485 £19.21 £0.00 £19.21
Silicone hose reducers
(I/D 25mm>16mm)
Auto Silicone Hoses
Outlet (via eBay)
190892513319 £5.53 £0.00 £5.53
Table 1 – Cooling system component suppliers
3.3 - Electrical & Control System Design and Specification
The Dynostar ECB500 dynamometer has its own on-board 12v
automotive battery to act as a power supply for engines to be
tested. This battery was utilised to power all systems including
the starter-motor, water pump, fuel-stop solenoid and all ancillary
electrical components. To ensure battery charge level was
maintained during engine operation the engines on-board
alternator was connected to the battery via a charging circuit. A
circuit diagram can be seen below in figure 12. A suitable wiring harness then needed to be
designed and constructed using appropriately rated cables for voltage and current. This included
wiring for safety isolation and stop switches and the design and
construction of a control panel to house all switches and gauges (figure 8).
The control panel was designed with aid of CAD
software, an engineering drawing of the panel can
be seen in appendix I. The control panel was then
manufactured from aluminium sheet and the cut-
outs for switches and gauges made with a CNC
(computer numerical control) milling machine to
Figure 8 – Control panel
Figure 9 – Wiring harness Figure 10 – Wiring harness

pg. 13
enable high accuracy. Figures 9 and 10 show the completed installation of the designed wiring
harness. The Farymann 43W is equipped with a short throttle lever to govern engine speed and to
stop fuel and therefore the engine. In the interest of safety the decision was made to specify some
form of throttle remote control. From the authors previous experience working with machinery and
plant a suitable JCB remote throttle was specified and purchased (figure 11).
Figure 12 – Wiring diagram
Figure 11 – Throttle assembly

pg. 14
3.4 - Instrumentation and Data Acquisition Systems Design and Specification
To ensure safe running of the engine test-bed and enable vital data
to be captured during test runs it was necessary to design an
instrumentation and data acquisition system. Specifying standard
automotive components, gauges and testing equipment to form a
reliable and accurate system. Essential to
ensuring safe operating and continuity of
testing is the ability to monitor coolant
temperature, oil pressure and engine speed (RPM). Standard automotive
gauges and sensors were specified and combined with the designed wiring
harness and control panel (figure 8). Although the standard coolant
temperature and oil pressure sensors were
factory calibrated, as the RPM gauge was
designed for use with multiple cylinder
engines it was necessary to calibrate it manually to suit a single
cylinder application. The RPM gauge was wired to pick up a signal
from the engines on board
alternator. This signal is then
modulated by a series of resistors inside the gauge to give the
correct RPM reading. In order to change the resistors to suit the
single cylinder engine the gauge was dis-assembled to test the
resistance and then calculate the correct figure. During this
process a variable resistor was identified in the circuit, this was
adjusted to calibrate the gauge as can be seen in figure 13. In order to enable the dynamometer to
capture coolant temperature and manifold absolute pressure (MAP) data, supplementary sensors
were added. These sensors were connected directly to the dynamometers data acquisition system
(figure 14). The MAP sensor requires some form of connection to the inlet manifold of the engine.
This was achieved by the design and manufacture of an inlet adapter with a take-off for the MAP
sensor. The inlet adapter was made to fit between the inlet manifold and air cleaner (figure 15) and
was manufactured using a Stratasys fused deposition modelling (FDM) 3D printer, an engineering
drawing of the inlet adapter can be found in appendix J. The addition of this adapter obviously
made changes to the inlet tract length which could affect volumetric efficiency and power and
torque figures. For this reason benchmark runs were completed during the testing phase of the
project with and without the adapter which can be seen in the results section of this report. An inlet
Figure 13 – Gauge calibration
Figure 14 - Instrumentation
Figure 15 – Inlet manifold adapter
Figure 16 – Inlet temperature sensor
pg. 15
air temperature sensor was also placed inside the air cleaner housing (figure 16) to enable the
temperature to be observed and test conditions to be maintained during all test runs. Technical
specification of all temperature sensors used can be found in appendix K. Finally, exhaust gas
emissions data needed to be analysed. For this purpose an automotive exhaust gas analyser was
sourced from a reputable supplier (Snap-On Tools UK). To ensure accuracy of results the analyser
was sent to the manufacturer for calibration, the calibration certificate and technical specification of
the analyser can be seen in appendix L.
3.5 - Dual-Fuel LPG System Design and Specification
For the purposes of initial testing the decision was made to design and specify a simple LPG inlet-
injection system. It was also decided that as LPG composition is normally 100% propane in the UK
the fuel source would be a standard domestic type propane cylinder connected to the fuel system
via a variable pressure gas regulator. This would enable the gas injection pressure to be easily
changed and the effects observed during the testing phase of the project. Automotive LPG injection
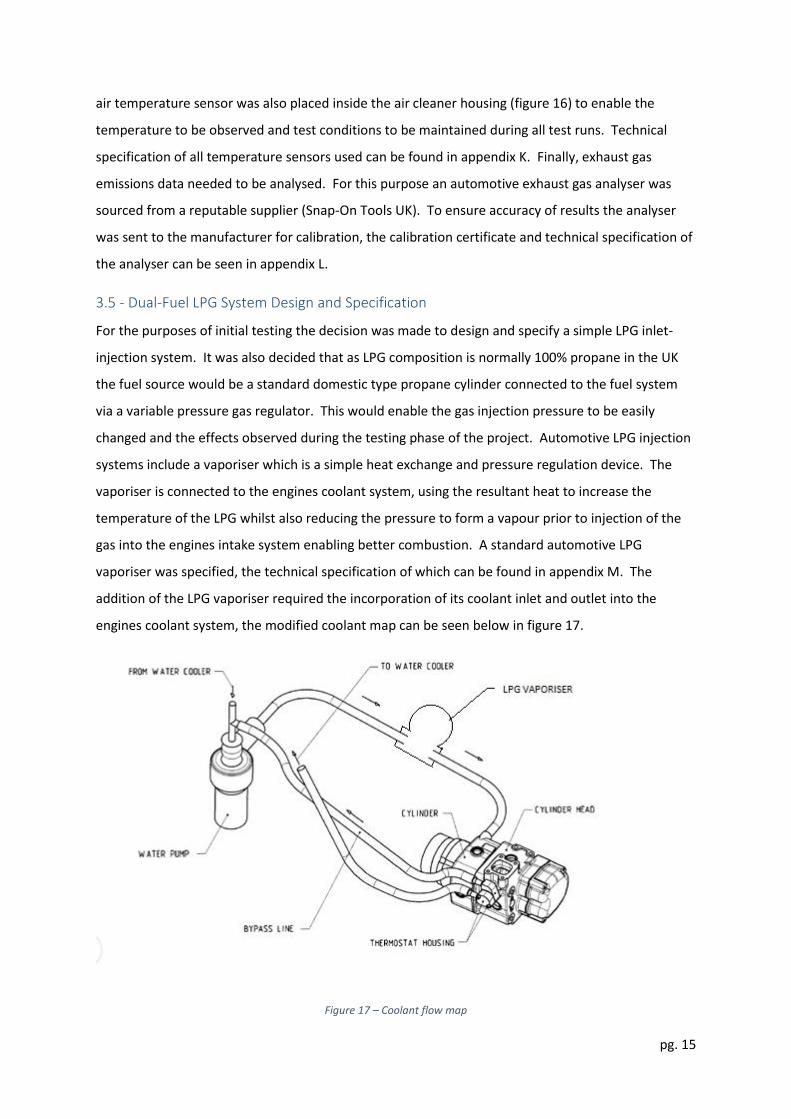
systems include a vaporiser which is a simple heat exchange and pressure regulation device. The
vaporiser is connected to the engines coolant system, using the resultant heat to increase the
temperature of the LPG whilst also reducing the pressure to form a vapour prior to injection of the
gas into the engines intake system enabling better combustion. A standard automotive LPG
vaporiser was specified, the technical specification of which can be found in appendix M. The
addition of the LPG vaporiser required the incorporation of its coolant inlet and outlet into the
engines coolant system, the modified coolant map can be seen below in figure 17.
Figure 17 – Coolant flow map

pg. 16
The inlet adapter constructed to enable fitment of the MAP sensor (figure 18) was
modified to allow injection of the LPG and standard domestic gas hose specified to
enable delivery of the fuel. Details of all purchased components and the suppliers
can be found in appendix N.
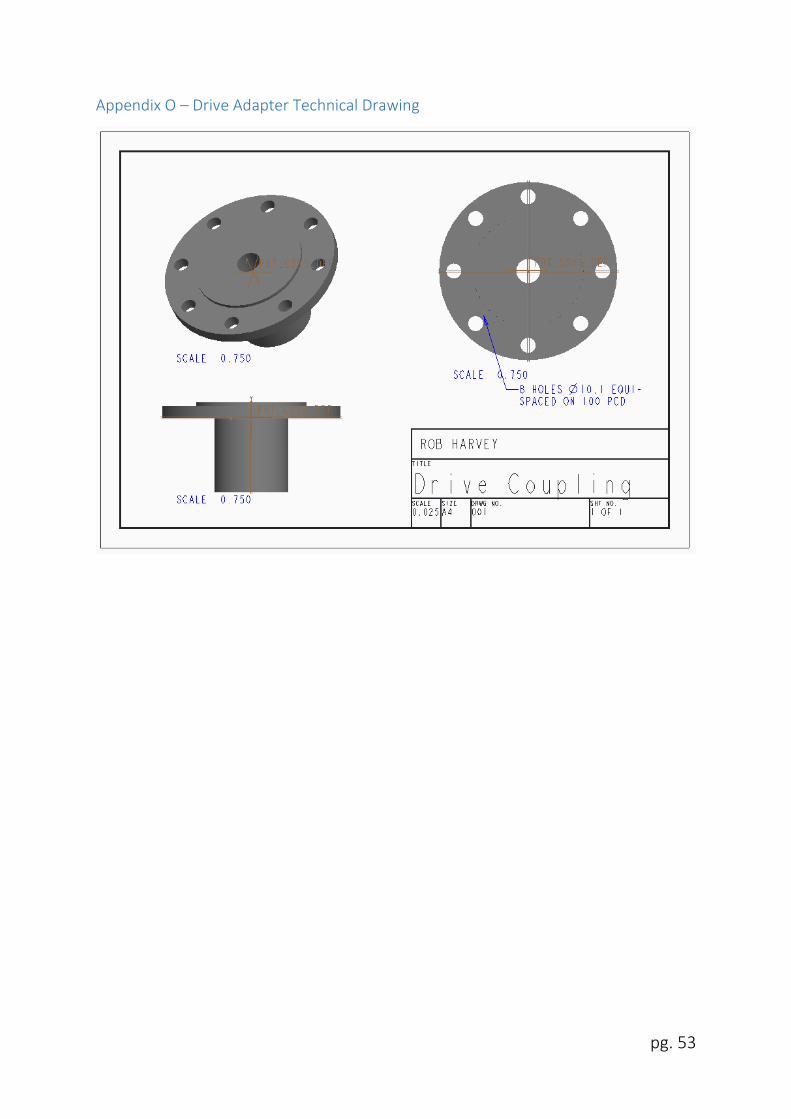
3.6 - Drive Coupling Design and Specification
The Farymann 43W test engine was supplied with a taper-shaft output
adapter, the ECB500 dynamometer is however designed to connect to an
engine via a supplied fly-wheel adapter as can be seen in figure 19. In
order to couple the Farymann test engine with the dynamometer it was
necessary to design and specify a drive
adapter. Measurements were taken from
the ECB500 drive shaft flange and the
Farymann taper shaft adapter and a drive
adapter was designed and modelled using
Creo Parametric CAD software. An image of the drive adapter can be
seen in figure 20, an engineering drawing of the adapter can be found
in appendix O. The drive adapter was then manufactured on site at the university from tool grade
steel using a manual lathe and CNC milling machine to specified tolerances.
3.7 - Assembly and Construction of Test Rig
3.7.1 - Frame Construction & Engine Mounting
The engine frame was constructed from standard square and rectangular section steel (figures 21
and 22) and welded to the design specified in appendix D. High tensile bolt fixings were utilised to
attach the frame to the dynamometer and anti-vibration engine mounts were specified to mount
the engine to the frame. The engine mounts were specified from readily available automotive parts,
namely Land Rover Series 3 metalastic engine mounts. Captive nut lifting eyes were also purchased
to enable the safe lifting of the engine when mounting to the frame (figure 26).
Figure 19 – Flywheel adapter
Figure 20 – Drive adapter
Figure 18 – Inlet adapter

pg. 17
3.7.2 - Radiator Frame & Cooling Fan Brackets
To mount the radiator a simple frame was constructed and welded from standard square section
steel. Aluminium brackets were then constructed to mount the 12 volt cooling fan to the radiator.
Images of the brackets and frame can be seen in figures 23, 24 and 25. Engineering drawings and
CAD models of the components can be found in appendix P.
Figure 21 – Engine frame Figure 22 – Engine frame Figure 23 - Radiator
Figure 27 – Engine mounting
Figure 24 - Radiator Figure 25 - Radiator
Figure 26 – Lifting eyes

pg. 18
Figure 28 – Radiator mounting
3.7.3 - Cooling System Installation
The cooling system was connected using the specified automotive silicone hoses. Some non-
standard connectors needed to be manufactured, engineering drawings of which can be seen in
appendix H. Images of the completed cooling system installation can be seen in figures 29, 30 and
31.
Figure 29 – Cooling system Figure 30 – Cooling system
Figure 31 – Water pump

pg. 19
3.7.4 - Wiring Harness & Control Panel Installation
The wiring harness was constructed from appropriately rated cable for voltage and current for the
various systems. The majority of the cabling was routed through a section of silicone cooling hose to
prevent damage and wear. The cabling was joined to the control panel via 4way connectors to
enable the cables to be disconnected simply and easily should the control panel need to be opened.
The control panel was then mounted to a simple welded frame constructed from standard square
section steel. Images of the wiring harness and control panel installation can be seen in figures 32 -
34.
3.7.5 - Final Assembly & Connection to Dynamometer
All assembled components, connections and fixings were checked to ensure safe operating. The
engine was then connected to the dynamometer using the manufactured drive coupling and high
tensile fixings. The fixings were tightened to specified torques and alignment marked to enable
checks for movement to be completed quickly. Images of the completed assembly can be seen in
figures 35 - 40.
Figure 32 – Wiring harness installation Figure 33 – Wiring harness installation Figure 34 – Wiring harness installation
Figure 38 – Completed installation Figure 39 – Completed installation Figure 40 – Completed installation
Figure 35 – Completed installation Figure 36 – Completed installation Figure 37 – Drive coupling

pg. 20
3.7.6 - Systems & Operation Check
A systems check run was attempted with no load applied to the dynamometer to ensure satisfactory
operation of the engine and ancillary systems. This highlighted an injector pump fault. A
replacement injector pump was sought and fitted and a further systems check completed. The
engine ran up to operating temperature with good oil pressure and the cooling system was proved
to be capable of maintaining a constant operating
temperature. Images of the functioning control panel and
replacement diesel injector pump can be seen in figures 41
and 42 below.
Figure 41 – System test
4 - Project Management
As the project held a large practical element there were a considerable number of risks to be
managed. Project risks and time management were accomplished by use of a Gantt chart and a risk
management table which can be seen below. Health and safety risks were managed by the use and
completion of risk assessments which can be found in appendix Q.
Figure 42 – Bosch injector pump

pg. 21
4.1 - Project Risk Management Table
No. Date
Identified Risk
Probability (L,M,H)
Impact (L,M,H)
Effect on Project
Risk Reduction Actions
Event Triggers Event Actions
1 21/09/2015 Loss of key project staff.
Low HIGH Unable to complete key tasks or whole project.
Emphasise the importance of the project from the outset both within and outside the University.
Reports of absence or diversion of staff to other projects/work.
Identify alternative resources in case of unexpected absence. Ensure complete records of work done are available at any point.
2 21/09/2015 Significant changes in project requirements.
Low HIGH Time / quality / costs
Ensure that project requirements are fully investigated and agreed with project supervisor prior to specification.
Request for changes to agreed specification.
Discuss impact of change on schedules or design, and agree if change to specification will proceed. Implement project change, if agreed.
3 21/09/2015 Major changes to university department structure or procedures.
Low HIGH Changes to process / delay
Communicate effectively with all project staff to monitor planned changes/Carry out affected project tasks prior to implementation of changes.
Information from senior University staff.
Make University management aware of effects of structure/procedure change on project schedule. Re-plan order of work to delay parts most likely to be affected by structure/procedure change.

pg. 22
4 21/09/2015 Volume of change requests/requirements following initial testing extending work.
HIGH HIGH Delay / Costs Agree specification and priorities with all project staff.
Poor initial test results / delay in specification.
Make project management decision on importance, feasibility and observe time constraints.
5 21/09/2015 Changes in priorities of project owner.
Low HIGH Removal of resource, lack of commitment, change in strategy or closure of project.
Maintain awareness of the project, its importance, and its progress.
Changes in personal circumstances.
Inform project supervisor and all project staff. Retain any parts of the work of the project that could be useful in the future. Ensure that the project is adequately documented to date.
6 21/09/2015 No suitable solution found that meets all project aims/objectives/requirements.
Low HIGH Failure / Costs Progress monitoring / adherence to schedule / identify further resource in advance of need.
Unsatisfactory final testing results.
Consult project supervisor. Identify and report on project failings.
7 21/09/2015 Loss of electrical power at production/testing of key deliverables.
Low Medium Time / quality / costs
Awareness of scheduled power outages.
Information from power companies / on-site building contractors
Inform involved parties of project importance. Re-schedule project work.
8 21/09/2015 Costs could rise beyond the scope of the financier.
Medium HIGH Failure / Costs Ensure tight control of costs. Set contingency budget within financier scope.
Vast changes in specification / General lack of funds.
Use contingency funds / seek external funding.

pg. 23
5 - Results
5.1 - Theoretical Calculations & Manufacturer Data (Power & Torque)
The manufacturers supplied technical data for the Farymann 43W test engine are as follows:
Table 2 – Farymann 43W technical data
Technical Data Farymann 43W
Cylinders 1
Max Output @ 3000rpm IFN-ISO 11kW
IFCN-
ISO
9.9kW
Maximum Engine Speed 3000rpm
Maximum Torque @ 2100rpm 40.1Nm
Bore 95mm
Stroke 100mm
Displacement 708cm3
Compression Ratio 1:19.5
Table 3 – Farymann 43W power output

pg. 24
Table 4 – Farymann 43W torque output
Table 5 – Farymann 43W fuel consumption
Using the data above calculations were performed to ascertain theoretical values for max power and
torque and brake mean effective pressure at max power and torque conditions:
Swept Volume = 𝑉𝑠 =𝜋(𝑑2)(𝑆)
4 = 708.82cm3
Torque at max power = 𝑀𝑁
9549 = 10.68kW
BMEP at max power = 1200 𝑃
𝑉𝑠 𝑁 = 6.03bar
Power at max torque = 𝑀𝑁
9549 = 8.82kW

pg. 25
BMEP at max torque = 1200 𝑃
𝑉𝑠 𝑁 = 7.14bar
All manufacturer supplied data can be found in appendix A.
5.2 - Obtaining Results & Running Procedures
The following operating procedures were observed during testing:
Activate test cell ventilation and exhaust gas extraction system to maintain air quality within
test cell.
Power on exhaust gas analyser and allow self-calibration to complete.
Start engine with partial throttle until operating temperature reached.
Disable exhaust gas extraction system to prevent interference with emissions results.
Set engine to maximum RPM (wide open throttle).
Begin automated dynamometer test program.
Manually record emissions data.
Monitor engine coolant temperature and oil pressure to ensure they remain within
operating limits.
Test program complete – save data.
Close throttle – stop engine.
Both of the test runs were completed on the same day within as short a time as possible to ensure
test cell temperature, barometric pressure and air quality were comparable for each run. However,
all power and torque results were automatically corrected to an international standard (ISO3046-
1:2002(E)) using the dynamometer software’s built-in algorithm, the reference conditions for the ISO
standard are:
Barometric pressure = 100kPa / 1000mbar
Air temperature = 25oC / 298K
Relative humidity = 30%
Charge (intake) air temperature = 25oC / 298k
5.3 - Diesel Only Test Results
A test was completed using European standard (EN 590) diesel road fuel only, delivered by the
engines standard Bosch injector pump to provide a benchmark for further tests in the dual fuel
mode and to provide a comparison to theoretical and manufacturer power and torque figures.

pg. 26
Table 6 – Diesel only test results
RPM Nm kW ISO Nm ISO kW
3000 28.80 9.10 29.00 9.10
2900 30.40 9.20 30.60 9.30
2800 29.90 8.80 30.10 8.80
2700 30.70 8.70 30.90 8.70
2600 30.10 8.20 30.40 8.30
2500 31.00 8.10 31.30 8.20
2400 30.40 7.60 30.70 7.70
2300 31.70 7.60 32.00 7.70
2200 32.30 7.40 32.60 7.50
2100 33.20 7.30 33.50 7.40
2000 31.40 6.60 31.60 6.60
1900 33.80 6.70 34.00 6.80
1800 38.70 7.30 39.00 7.40
1700 39.40 7.00 39.70 7.10
1600 40.90 6.80 41.20 6.90
1500 41.90 6.60 42.30 6.60
1400 41.60 6.10 41.90 6.10
Table 7 – Diesel only power graph
6.00
6.50
7.00
7.50
8.00
8.50
9.00
9.50
30002900280027002600250024002300220021002000190018001700160015001400
kW
RPM
Benchmark Run 1 Power
kW
ISO kW
pg. 27
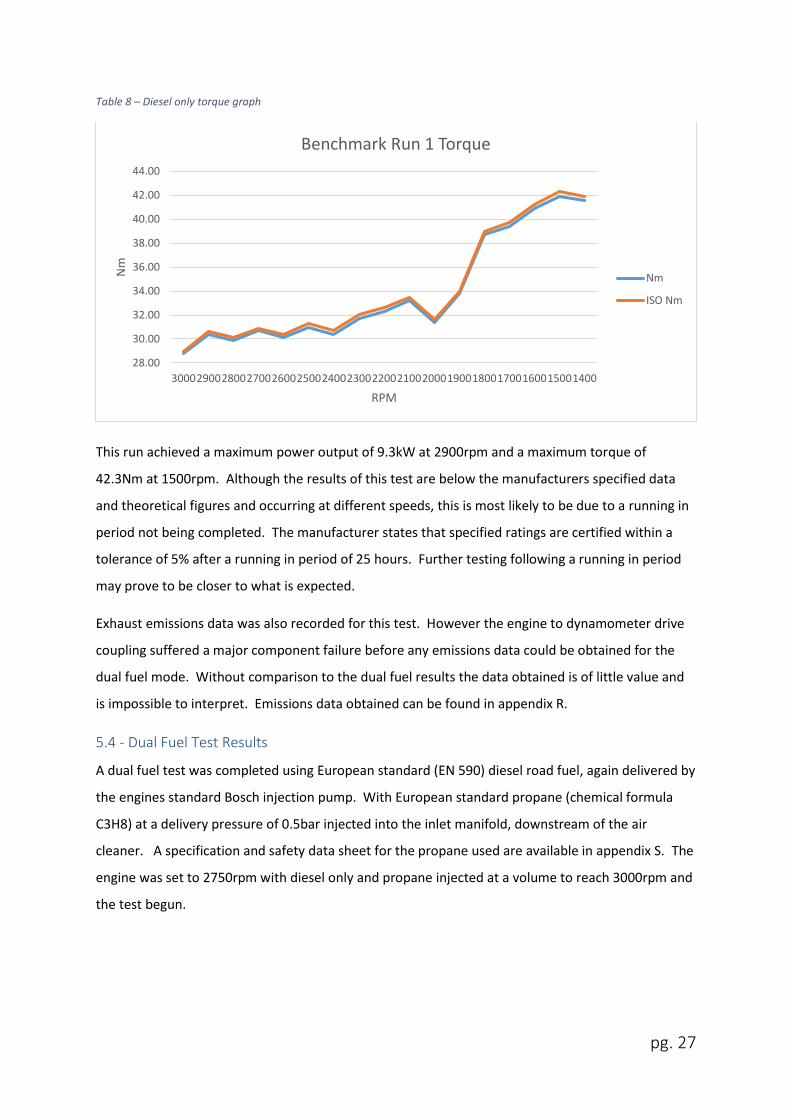
Table 8 – Diesel only torque graph
This run achieved a maximum power output of 9.3kW at 2900rpm and a maximum torque of
42.3Nm at 1500rpm. Although the results of this test are below the manufacturers specified data
and theoretical figures and occurring at different speeds, this is most likely to be due to a running in
period not being completed. The manufacturer states that specified ratings are certified within a
tolerance of 5% after a running in period of 25 hours. Further testing following a running in period
may prove to be closer to what is expected.
Exhaust emissions data was also recorded for this test. However the engine to dynamometer drive
coupling suffered a major component failure before any emissions data could be obtained for the
dual fuel mode. Without comparison to the dual fuel results the data obtained is of little value and
is impossible to interpret. Emissions data obtained can be found in appendix R.
5.4 - Dual Fuel Test Results
A dual fuel test was completed using European standard (EN 590) diesel road fuel, again delivered by
the engines standard Bosch injection pump. With European standard propane (chemical formula
C3H8) at a delivery pressure of 0.5bar injected into the inlet manifold, downstream of the air
cleaner. A specification and safety data sheet for the propane used are available in appendix S. The
engine was set to 2750rpm with diesel only and propane injected at a volume to reach 3000rpm and
the test begun.
28.00
30.00
32.00
34.00
36.00
38.00
40.00
42.00
44.00
30002900280027002600250024002300220021002000190018001700160015001400
Nm
RPM
Benchmark Run 1 Torque
Nm
ISO Nm

pg. 28
Table 9 – Dual fuel test results
RPM Nm kW ISO Nm ISO kW
3000 12.60 3.80 12.70 3.80
2900 14.70 4.50 14.80 4.50
2800 22.30 6.50 22.40 6.60
2700 28.20 8.00 28.40 8.00
2600 29.40 8.00 29.70 8.10
2500 31.10 8.10 31.30 8.20
2400 31.70 8.00 31.90 8.00
2300 31.90 7.70 32.10 7.70
2200 32.90 7.60 33.20 7.60
2100 33.50 7.30 33.70 7.40
2000 33.20 6.90 33.40 7.00
1900 32.90 6.50 33.20 6.60
1800 32.90 6.20 33.10 6.20
1700 31.80 5.70 32.10 5.70
1600 30.40 5.10 30.60 5.10
1500 31.60 4.90 31.90 5.00
1400 31.00 4.50 31.20 4.60
Table 10 – Dual fuel power graph
3.00
4.00
5.00
6.00
7.00
8.00
9.00
30002900280027002600250024002300220021002000190018001700160015001400
kW
RPM
Dual Fuel Run 1 Power
kW
ISO kW

pg. 29
Table 11 – Dual fuel torque graph
This test achieved a maximum power of 8.2kW at 2500rpm and a maximum torque of 33.7Nm at
2100rpm. The power and torque figures achieved are below that of the diesel only test. This is most
likely due to the reduction in volumetric efficiency caused by the injection of the propane into the
intake manifold. Further runs and tuning of the injection pressure and volume delivery of the
propane should have seen a significant improvement in performance. It was however impossible to
complete any further tests as the engine to dynamometer drive coupling suffered a major
component failure immediately following this test without time to source a replacement part.
Further information regarding the component failure is included in the discussion section below. A
graphical comparison of both diesel only and dual fuel runs can be seen in tables 12 and 13.
12.00
17.00
22.00
27.00
32.00
37.00
42.00
30002900280027002600250024002300220021002000190018001700160015001400
Nm
RPM
Dual Fuel Run 1 Torque
Nm
ISO Nm

pg. 30
Table 12 – Power comparison graph
Table 13 – Torque comparison graph
0.00
1.00
2.00
3.00
4.00
5.00
6.00
7.00
8.00
9.00
10.00
kW
RPM
Power Comparsion
Diesel kW (ISO)
Dual Fuel kW (ISO)
0.00
5.00
10.00
15.00
20.00
25.00
30.00
35.00
40.00
45.00
Nm
RPM
Torque Comparison
Diesel Nm (ISO)
Dual Fuel Nm (ISO)

pg. 31
6 - Discussion
The vast majority of the work within the project was completed in the design and construction of the
test bed. Practical research of this type has rarely been completed with little president for the
construction of a working, testable system. Elnajjar et al. (2013) used a Ricardo e6 research engine
to complete their practical testing with only minor modifications needed to convert the engine to
dual-fuel, diesel-LPG running. This project used an engine of very similar specification but needed to
be converted not only to run in the dual-fuel mode but also required a vast array of components to
be designed, specified and manufactured or purchased in order to mount the engine to the
dynamometer and provide a suitable cooling system. All of the preparation work was completed
within the predicted schedule with only minor delays caused by late material and equipment
deliveries from external suppliers.
The testing phase of the project proved more of a challenge with multiple delays caused by lack of
facilities and equipment. Although two tests were completed with diesel only and dual-fuel modes
further testing was impossible to complete within time constraints due to a major component failure
of the engine to dynamometer drive coupling. The engine manufacturer supplied taper-shaft output
adapter failed during the second dual-fuel test, an image of the failed component can be seen in
figures 43 and 44.
Figure 43 – Failed drive shaft Figure 44 – Failed drive shaft

pg. 32
The cause of the failure has not been investigated or identified at this stage, however a probable
cause is internal fatigue due to incorrect storage as it is known that the engine and shaft were stored
in an area open to the elements prior to purchase.
The results for the diesel only test are within what was expected from the theoretical calculations
and fall within the 5% tolerance prescribed by the manufacturer data. The results for the dual-fuel
test completed are also as expected. As previously stated this test was a preliminary test with the
intention of completing further runs with changes to propane injection pressure and delivery volume
to fine tune the fuel mix and optimise the engines performance. This was impossible to complete
within the time constraints due to component failure. Of the published works available to the
author no preliminary testing results are provided, it is therefore impossible to make a comparison.
However, should further testing be carried out in the future it is possible with the developed system
to obtain the necessary data to make comparison and contrast to published works.
On the whole the project has been a success and has achieved the objective of producing a
functioning diesel-LPG dual-fuel system. Further refinement of the system will be considerably
easier and much less time consuming making further experimentation and advancement of the work
a viable possibility.
Conclusion
Over the course of the project it has become clear that practical experimentation can be extremely
time consuming and costly. Computer software such as Ricardo WAVE could, with the appropriate
combustion model, provide a faster and less costly alternative to practical experimentation.
However, for the injection method used in this project Ricardo WAVE does not provide an
appropriate combustion model in its standard form. An attempt was made to obtain a suitable
combustion model from the software developer but was unsuccessful. The development of an
independent combustion model was beyond the scope of the author.
The project objective of producing a functioning diesel-LPG, dual-fuel system has been achieved and
a limited amount of testing completed. This has proved that it is possible to develop a system using
readily available components with a limited amount of specialist parts needing to be manufactured.
The preliminary testing completed gave satisfactory results and could improve vastly with the
completion of further testing and fine tuning of the fuel system. Further testing could not be
completed within the time constraints of the project due to a major component failure in the engine
to dynamometer drive coupling. Should a replacement component be sourced and further testing
carried out changes to diesel and LPG injection pressure and volume delivery should enable the

pg. 33
system to be optimised and data obtained for performance and emissions and comparisons made to
published works.
Recommendations
With the drive coupling system component failure the final stages of the testing phase were not
completed. Further testing and optimisation of the fuel system, changing diesel and LPG injection
pressure and delivery volume to achieve maximum performance needs to be completed. Emissions
data also remains to be obtained for operation in the dual-fuel mode.
The work could be furthered by the addition of some form of timed injection system for the LPG,
possibly by the addition of a simple electromagnetic crank position sensor and use of a
programmable logic controller (PLC) to advance and retard injection timing to achieve optimum
combustion and observe the effects of changes in injection pulse width and timing. The addition of
additives could also be explored such as aliphatic hydrocarbon added to the LPG mixture to enhance
cetane number as was explored by Sugiyama et al. (2003). Experimentation could also be carried
out with the use of other alternative fuels such as dimethyl ether (DME) and varying grades of
conventional diesel and bio-diesel.
Further instrumentation of the engine and test rig could also be performed including the addition of
further sensors to monitor exhaust temperatures and cylinder pressure.

pg. 34
References & Bibliography
Asad, U., Kumar, R., Han, X. & Zheng, M., 2011. Precise instrumentation of a single-cylinder research
engine. Measurement, 44(7), pp. 1261-1278.
Ashok, B., Denis Ashok, S. & Ramesh Kumar, C., 2015. LPG diesel dual fuel engine - A critical review.
Alexandria Engineering Journal, 2(54), pp. 105-126.
Elnajjar, E., Selim, M. Y. & Hamdan, M. O., 2013. Experimental study of dual fuel engine performance
using variable LPG composition and engine parameters. Energy Conversion and Management, Issue
76, pp. 32-42.
Ergenc, A. T. & Koca, D. O., 2014. PLC controlled single cylinder diesel-LPG engine. Fuel, Issue 130,
pp. 273-278.
H2Stations.org, 2016. Hydrogen Filling Stations Worldwide. [Online]
Available at: http://www.netinform.net/H2/H2Stations/H2Stations.aspx?Continent=EU&StationID=-
1
[Accessed 5 January 2016].
Jemni, M. A., Kantchev, G. & Abid, M. S., 2012. On the optimisation of the air-LPG mixing system of a
Diesel bus engine converted to gas. Hammamet Nabeul, Tunisia, The Institute of Electrical and
Electronics Engineers (IEEE).
Kalghatgi, G. T., 2014. The outlook for fuels for internal combustion engines. International Journal of
Engine Research, 15(4), pp. 383-398.
Korakianitis, T., Namasivayam, A. & Crookes, R., 2011. Natural-gas fueled spark-ignition (SI) and
compression-ignition (CI) engine performance and emissions. Progress in Energy and Combustion
Science, 37(1), pp. 89-112.
Kumaraswamy, A. & Durga Prasad, B., 2012. Performance Analysis of a Dual Fuel Engine Using LPG
and Diesel with EGR System. Procedia Engineering, Issue 38, pp. 2784-2792.
Morganti, K. J. et al., 2013. The Resarch of Motor octane numbers of Liquified Petroleum Gas (LPG).
Fuel, Issue 108, pp. 797-811.
Papagiannakis, R., Rakopoulos, C., Hountalas, D. & Rakopoulos, D., 2010. Emission characteristics of
high speed, dual fuel, compression ignition engine operating in a wide range of natural gas/diesel
fuel proportions. Fuel, 89(7), pp. 1397-1406.

pg. 35
Raslavicius, L. et al., 2014. Liquified petroleum gas (LPG) as a medium term option in the transition to
sustainable fuels and transport. Renewable and Sustainable Energy Reviews, Issue 32, pp. 513-525.
Wood, B. M., Kirwan, K., Meredith, J. & Coles, S. R., 2015. Study of combustion performance of
biodiesel for potential application in motorsport. Journal of Cleaner Production, Issue 93, pp. 167-
173.
Dong Jian, Gao Xiaohong, Li Gesheng and Zhang Xintang. (2001). Study on Diesel-LPG Dual Fuel
Engines. SAE TECHNICAL PAPER SERIES. 3 (2), 36-79.
M. Alam and S. Goto, K. Sugiyama, M. Kajiwara and M. Mori. (2001). Performance and Emissions of a
DI Diesel Engine Operated with LPG and Ignition Improving Additives. SAE TECHNICAL PAPER SERIES.
16 (2), 36-80.
P. Mohanan and Suresh Kumar .Y. (2001). Effect of L PG Intake Temperature, Pilot Fuel and Injection
Timing on the Combustion Characteristics and Emission of a LPG - Diesel Dual Fuel Engine. SAE
TECHNICAL PAPER SERIES. 16 (4), 01-28.
Kohtaro Hashimoto, Haruya Ohta, Tomoko Hirasawa, Mitsuru Arai and Masamitsu Tamura. (2002).
Evaluation of Ignition Quality of LPG with Cetane Number Improver. SAE TECHNICAL PAPER SERIES.
01 (1), 08-70.

pg. 36
Appendices
Appendix A – Farymann Technical Data

pg. 37

pg. 38

pg. 39

pg. 40

pg. 41
Appendix B – Dynostar Email Correspondence
From: Joost Jochems <[email protected]> Date: 24 September 2015 at 14:36:46 BST To: HARVEY Robert <[email protected]> Subject: RE: ECB500 Suitability/Accuracy at low power
Hello Robert, It should be possible. Maybe starting up and the low idle might be a point to keep a close eye on. The dyno inertia is 0.5 kgm². Also be aware of the fact that the retarder is having magnetic braking problems if axle rpm is too (s)low. Good luck! Best regards, Joost Jochems Managing Director Dutch Dynamometers & Engineering Solutions BV Dynostar / DDES Hogerwerf 15 4704 RV Roosendaal The Netherlands Tel: +31 (0) 165 391 969 Fax: +31 (0) 165 521 366 E-mail: [email protected] Web: www.dynostar.com
Appendix C – Dynostar ECB500 Technical Data
DYNOSTAR ECB500
Product information
With the Dynostar Model ECB500 engine block dynamometer, test programs can be run on engine blocks quickly
and efficiently. The engine block is attached directly to the machine in a wear-resistant manner by connecting the
cardan shaft directly to the dynamometer. This manner of testing avoids drive line losses. This means that
different tests can be reproduced easily.
The Dynostar Model ECB500 has an integral air-cooled retarder. The maximum power to be absorbed is 275 kW
and the maximum rotation speed of the dynamometer is 7000 rpm. This makes the dynamometer ideal for testing
high revving engines.

pg. 42
Thanks to its mobile nature, this dynamometer is ideal for applications in training.
Standard hardware features:
DAS Data Acquisition System
Dyno Software Package
Junction Box inc. 37-pin cable (length 7.5 m)
12-pin cable (length 2 m)
Linear motor to control throttle valve
Calibration weight
Remote control
Operating instructions
CE marking
Universal coupling
Standard software features:
Static power measurement
Weather station
Power correction to DIN standard
Real time display of engine speed, power and torque
Automatic and semi-automatic test cycles
Long-term test
Datalogging system, read-out facilities for several sensors
Option of entering original power graph manually as reference
Technical specifications ECB500:
Weight: 275 [kg]
Dimensions (lxwxh): 0,9 x 1,0 x 1,0 [m]
Power requirements: 230 [V]
12 [A]
Air requirements: N/A
Max. rpm: 7000
Total inertia: 0,5 [kg/m2]
Max. power cold: 275 [kW]
Max. power 3 min: 165 [kW]
Max. power continuously: 125 [kW]

pg. 43
Appendix D – Manual Technical Drawing of Engine Frame

pg. 44
Appendix E – CAD Model and Technical Drawings of Engine Frame
Appendix F – Bosch Water Pump Technical Specification
Description: Bosch Water Pump (0-392-020-034)
Nominal voltage: 12 V
Delivery: 750 dm3/h (750 litres in 1 hour)
Delivery pressure: 0.1 bar
Direction of rotation: R
Weight: 0.4 kg
Length: 150 mm
Diameter of metal housing: 41 mm
Diameter of plastic housing: 48.5 mm
Diameter of plastic housing with bolts: 61 mm
Intel diameter: 20 mm
Outlet diameter: 20 mm

pg. 45
Appendix G – Farymann 43W Cooling System Diagram
Appendix H – Cooling System Component Technical Drawings

pg. 46
Appendix I – Switch Panel Technical Drawing

pg. 47
Appendix J – Inlet Spacer/Adapter Technical Drawing

pg. 48
Appendix K – Bosch Temperature Technical Specification

pg. 49

pg. 50
Appendix L – Gas Analyser Calibration Certificate

pg. 51
Appendix M – LPG Vaporiser Technical Specification
Technical Specifications:
R67-01 & CSA homologated
Compact design: Ø125*95mm
Solid design: tested with 60 bar burst pressure
Black anodised aluminium
Adjustable pressure: 1,7 –2,6 Bar
System pressure control with single stage valve.
Optional MAP connection. (for turbo charged engines).
Very Stable dynamic pressure behaviour compared to other single stage reducers.
Flexible lock off valve both standard as BFC as well.
Integrated temperature sensor.

pg. 52
Appendix N – Purchases and Suppliers
DESC
RIP
TION
SUP
PLIER
PA
RT/ITEM
NU
MB
ERC
OST
DELIV
ERY
CO
STS
LINE
TOTA
L
PU
RC
HA
SE
DA
TE
Single
cylind
er d
iese
l en
gine
(Faryman
n 437/43w
708cc wate
r coo
led
)D
urh
am p
lant e
ngin
ee
ring
PR
0T08004£300.00
£0.00£300.00
27/09/2015
Rad
iator (A
ustin
Ro
ver M
ini, stain
less ste
el)
X-D
ream
Au
to (via e
Bay)
121766914073£49.00
£0.00£49.00
18/01/2016
Electric co
olin
g fan (30cm
/120W/12v)
BB
Classic C
ars (via eB
ay)200906142879
£24.95£6.95
£31.9018/01/2016
Electric w
ater p
um
p (B
osch
/12v)A
uto
De
tSho
p (via e
Bay)
0392020034/28177
5713604£39.90
£0.00£39.90
18/01/2016
Silicon
e co
olan
t ho
se (5 m
etre
/10mm
I/D)
Au
to Silico
ne
Ho
ses O
utle
t (via eB
ay)190893549485
£19.21£0.00
£19.2118/01/2016
Alu
min
ium
alloy p
ipe
con
ne
ctors (90° 16m
m O
/D)
Au
to Silico
ne
Ho
ses O
utle
t (via eB
ay)190886048856
£10.13£0.00
£10.1318/01/2016
Alu
min
ium
alloy p
ipe
con
ne
ctors (Straigh
t 16mm
O/D
)A
uto
Silicon
e H
ose
s Ou
tlet (via e
Bay)
190884993451£3.25
£0.00£3.25
18/01/2016
Silicon
e h
ose
red
uce
rs (I/D 25m
m>16m
m)
Au
to Silico
ne
Ho
ses O
utle
t (via eB
ay)190892513319
£5.53£0.00
£5.5318/01/2016
Silicon
e b
lankin
g cap (I/D
12mm
)A
uto
Silicon
e H
ose
s Ou
tlet (via e
Bay)
190892513049£1.98
£0.00£1.98
Thro
ttle asse
mb
lyEn
field
Co
un
ty (via eB
ay)251996518380
£35.99£0.00
£35.9918/01/2016
Allo
y switch
pan
el (Ign
ition
and
accesso
ry switch
es)
Au
to M
ech
Parts (via e
Bay)
281799158441£12.75
£2.99£15.74
18/01/2016
Wate
r tem
pe
rature
gauge
and
sen
sor (52m
m / 40~120°C
)A
lFancy (via e
Bay)
131541518121£6.99
£0.00£6.99
18/01/2016
Tacho
me
ter (52m
m / 0-8000 R
PM
)Yo
o P
arts (via eB
ay)360649794427
£12.85£0.00
£12.8518/01/2016
Batte
ry maste
r isolato
r switch
(40mm
/21v/200Am
p)
BB
Classic C
ars (via eB
ay)170876170070
£6.95£0.00
£6.9518/01/2016
Batte
ry cable
(4 me
tres/110am
p/16m
m)
alm Ele
ctrical Solu
tion
s (via eB
ay)321223833839
£10.76£1.50
£12.26
Ho
ur m
ete
rTo
mTo
pM
all (via eB
ay)201279565216
£5.86£0.79
£6.6518/01/2016
Oil p
ressu
re gau
ge an
d se
nso
r (52mm
/ 0-100PSI)
Yoo
Parts (via e
Bay)
361306743387£10.44
£0.00£10.44
18/01/2016
An
ti-vibratio
n e
ngin
e m
ou
nts (Lan
d R
ove
r Serie
s III) x4Lan
dran
ger Se
rvices Sto
keSTC
434£9.36
£0.00£9.36
30/09/2015
Stee
l bo
x sectio
n (d
ime
nsio
ns to
be
spe
cified
)M
ellard
s Stee
l Stockh
old
ers Sto
keN
/A£65.00
£0.00£65.00
LPG
regu
lator
Too
lstation
.com
64558£11.78
£0.00£11.78
LPG
vapo
riser (G
urtn
er M
idje
t 8mm
Inle
t/75HP
/1~1.5bar)
lpgsh
op
.co.u
k131-100
£41.99£0.00
£41.99
LPG
ho
se (8m
m I/D
x 2me
tre)
lpgsh
op
.co.u
k151-001
£4.98£0.00
£4.98
£701.88
pg. 53
Appendix O – Drive Adapter Technical Drawing

pg. 54
Appendix P – Radiator Frame Technical Drawing

pg. 55
Appendix Q – Health & Safety Risk Assessments
Risk Assessment FormFaculty of Computing, Engineering & TechnologyEngineering & Sciences
To be completed by Risk Assessor:
Location of activity K038 Member of staff responsible for activity Competently trained member of technical staff
Activity being assessed Use of Centre Lathe (M400) Other contributors to assessment Graham Preece
Assessors name Haydn Richardson Assessor contact tel 3291
Date of Assessment 01/08/2012 Assessors signature
Review required Yes / No Review Date Due 03/08/2016
All completed Risk Assessments MUST be returned to either Steve Marsh (Faculty H&S Advisor) or Claire Booth (Faculty H&S Administrator).
No Risk Area Hazard Persons at Risk Control Measures
Severity
(1-10)
Likelihood
(1-10)
Risk Rating
(S x L)
Level of
Risk
Result
(T,A,N,U)
1 K038
Entanglement/Trapping - During
machine operation and from
moving machine parts under
power feed
Staff, Students,
Visitors &
Trespassers
1. Lathe to be operated by authorised persons only,
or student under close supervision.
2. Loose clothing, long hair to be secured/tied back.
3. Dangling jewellery to be removed when operating
Lathe.
4. Mushroom-headed (or similar) emergency stop
button to be fitted.
5. All guards to be in place during lathe operations.
6. Lathe should be stopped before measuring or
gauging, and the cutting tool positioned to minimize
possible contact.
7. The use of lose abrasive tapes (Emery Cloth) are
to be avoided. If polishing is to be employed, a
backing board, tool post, nutcracker or hand-held
abrasive-impregnated wire brush is to be used.
8. Machine locked off and isolated when not-in-use.
Key access controlled locally by resident technical
skills specialist.
6 6 36 High A
2 K038Tripping/Slipping - During
machine operation
Staff, Students,
Visitors &
Trespassers
1. Sufficient space around the machine is to be
maintained to avoid the operator being accidentally
pushed by passers-by.
2. Manual Handling techniques to be adopted when
moving machine accessories and material in and
around Lathe.
5. Area around machine to be kept clear of waste
material at all times.
4 6 24 Low A
3 K038Cutting or Severing - During
machine operation
Staff, Students,
Visitors &
Trespassers
1. Swarf is not to be removed during machine
operation.
2. Waste material/swarf to be removed with suitable
implement and not by hand.
6 6 36 High A
4 K038Metalwork coolant fluid - During
machine operation
Staff, Students,
Visitors &
Trespassers
1. Coolant/Lubrication to be used as and when
required.
2. Only properly marked CoSHH container to be
used for coolant/lubrication
2 2 4 Very Low A
5 K038Electrocution - During machine
use
Staff, Students,
Visitors &
Trespassers
1. Machinery subject to annual maintenance
inspection.
2. Machine subject to 5 yearly electrical inspection
and tests.
3. Additional emergency stop/electrical isolation
buttons located within lab.
8 4 32 Medium A
6 K038Flying Debris/Objects - During
machine operation
Staff, Students,
Visitors &
Trespassers
1. PPE (Goggles) to be worn at all times when
operating Centre Lathe.
2. Quick release spring to be used in conjunction
with lathe chuck key to prevent key being
inadvertently left in chuck.
6 6 36 High A
Control measures highlighted in bold indicate recommended improvements needed to reduce the level of risk associated with the hazard
Summary of any key comments to note (general recommendations for improvements, areas of concern, items for review or further action etc)
Results are graded as follows: T (trivial risk), A (adequately controlled), N (not adequately controlled), U (unable to decide and further information required)

pg. 56
Risk Assessment FormFaculty of Computing, Engineering & Technology
To be completed by Risk Assessor:
Location of activity K036 Member of staff responsible for activity Gareth Downing,
Activity being assessed General Workshop Activities Other contributors to assessment
Assessors name Graham Preece Assessor contact tel 3602
Date of Assessment 14/10/2014 Assessors signature
Review required Yes / No Review Date Due 31/10/2016
All completed Risk Assessments MUST be returned to either Steve Marsh (Faculty H&S Advisor) or Claire Booth (Faculty H&S Administrator).
No Risk Area Hazard Persons at Risk Control Measures
Severity
(1-10)
Likelihood
(1-10)
Risk Rating
(S x L)
Level of
Risk
Result
(T,A,N,U)
1Automotive Unit
K036
Slips/Trips and Falls - Workshop
activities
Staff, Students,
Visitors &
Trespassers
1. Working area to be kept clean & tidy at all times.
2. Trailing cables should not be used where
practicable.
3. Work systems organised to minimize the
likelihood of oil and fluids spilling in to floor.
4. All spillages of fluids to be removed using spill-kit
equipment or Absorbent Granules.
5. Appropriate PPE (Apron/Coveralls, appropriate
footwear etc) to be worn at all times when working in
lab area.
6 2 12 Low A
2Automotive Unit
K036
Noise/Vehicle Fumes - During
Engine running
Staff, Students,
Visitors &
Trespassers
1. PPE (Ear Defenders) to be used at all times.
2. Local Exhaust Ventilation (LEV) unit to be
connected to vehicle exhaust pipe and vented to
outside of automotive unit, via rear Fire Exit door.
6 2 12 Low A
3Automotive Unit
K036
Moving Parts/Entanglement -
During setting/Fault diagnostics
during work in engine
compartment
Staff, Students,
Visitors &
Trespassers
1. Long hair to be secured.
2. Loose clothing should be secured and suitable
protective clothing should be worn.
3. Dangling jewellery should be removed, rings
should be taped or removed.
6 1 6 Very Low A
4Automotive Unit
K036
Oils/Fluids/Cleaning Fluids/Anti-
Freeze/Hydraulic Fluids -
Contact with fluids
Staff, Students,
Visitors &
Trespassers
1. Barrier Cream to be used at the start of work.
2. Disposable latex/vinyl gloves to be worn when
practicable.
3. PPE (Rubber Apron/Gauntlets) to be used at all
times when using engine parts wash.
1 4 4 Very Low A
5Automotive Unit
K036
Electrocution - High-tension
ignition systems
Staff, Students,
Visitors &
Trespassers
1. Work should not be carried out on or near to
ignition systems while engine is running.
2. Individuals fitted with pacemaker are not to work
on or near ignition systems.
8 1 8 Very Low A
6Automotive Unit
K036
Burns/Scalds - From engine
cooling system
Staff, Students,
Visitors &
Trespassers
1. Radiator or expansion tank caps should not be
removed while the engine is hot.
2. Care should be taken to avoid contact with hot
engine oil, exhaust system or brake drums or discs.
3. Contact with burnt or overheated synthetic rubber
components should be avoided at all times.
Protective gloves should be worn.
4. If contact is made with skin the area should be
immediately washed and medical attention sought.
6 4 24 Low A
7Automotive Unit
K036
Pneumatic Air - Using Air power
tools and associated
compressed air equipment
Staff, Students,
Visitors &
Trespassers
1. All workers trained in safe working procedures and
dangers of horseplay.
2. Airline has deadman’s handle.
3. System inspected and serviced annually under
contract.
6 1 6 Very Low A
8Automotive Unit
K036
Oils/Fluids/Cleaning Fluids/Anti-
Freeze/Hydraulic Fluids - Use of
Engine Oil Drainer
Staff, Students,
Visitors &
Trespassers
1. Barrier Cream to be used at the start of work.
2. Disposable latex/vinyl gloves to be worn when
practicable.
3. PPE (Rubber Apron/Gauntlets) to be used at all
times when using engine parts wash.
4. Oil pan to be adjusted to beneath drain area.
5. Engine Oil Drainer contents should be monitored
closely to avoid overfilling collection drum.
6. All waste oils to be disposed of in designated
area.
7. During transportation of drum care should be
taken to avoid spillage.
8. Manual handling techniques should be adopted
when attempting to lift drum, assistance should be
sought where applicable.
9. Engine oil should be allowed to cool before
draining.
10. Technical Instruction on safe working in
workshop environment.
1 4 4 Very Low A
Control measures highlighted in bold indicate recommended improvements needed to reduce the level of risk associated with the hazard
Summary of any key comments to note (general recommendations for improvements, areas of concern, items for review or further action etc)
Results are graded as follows: T (trivial risk), A (adequately controlled), N (not adequately controlled), U (unable to decide and further information required)

pg. 57
Risk Assessment FormFaculty of Computing, Engineering & Technology
To be completed by Risk Assessor:
Location of activity K036 Member of staff responsible for activity Gareth Downing,
Activity being assessed Use Of Engine Hoist Other contributors to assessment Neil Harvey
Assessors name Graham Preece Assessor contact tel 3602
Date of Assessment 01/08/2011 Assessors signature
Review required Yes / No Review Date Due 31/10/2016
All completed Risk Assessments MUST be returned to either Steve Marsh (Faculty H&S Advisor) or Claire Booth (Faculty H&S Administrator).
No Risk Area Hazard Persons at Risk Control Measures
Severity
(1-10)
Likelihood
(1-10)
Risk Rating
(S x L)
Level of
Risk
Result
(T,A,N,U)
1 Automotive Unit
Crushing/Impact/Falling
Objects/Slipping/Falling - During
engine lifting activities
Staff, Students,
Visitors &
Trespassers
1. Only competent member of staff permitted to
operate and use engine hoist.
2. Engine Hoist marked with the safe working load.
3. The safe working load shall not be exceeded.
4. The weight centre of gravity should be assessed
prior to lift.
5. Persons should not ride on the hoist platform.
6. Hoist included in planned maintenance
programme by contractor.
7. When not in-use, hoist beam to be lowered to
lowest point.
8. Technical Instruction on correct and safe use of
engine hoist.
9. Lifting tackle subject to inspection by insurers.
10. Extendable arms to be used in conjunction with
locking pins.
11. Extendable arms to be retracted when not in-
use.
4 6 24 Low A
Control measures highlighted in bold indicate recommended improvements needed to reduce the level of risk associated with the hazard
Summary of any key comments to note (general recommendations for improvements, areas of concern, items for review or further action etc)
Results are graded as follows: T (trivial risk), A (adequately controlled), N (not adequately controlled), U (unable to decide and further information required)

pg. 58
Risk Assessment FormFaculty of Computing, Engineering & TechnologyEngineering & Sciences
To be completed by Risk Assessor:
Location of activity K038 Member of staff responsible for activity Competently trained member of staff
Activity being assessed Use of Milling Machine (Cincinatti) Other contributors to assessment Graham Preece
Assessors name Haydn Richardson Assessor contact tel 3291
Date of Assessment 01/08/2012 Assessors signature
Review required Yes / No Review Date Due 03/08/2016
All completed Risk Assessments MUST be returned to either Steve Marsh (Faculty H&S Advisor) or Claire Booth (Faculty H&S Administrator).
No Risk Area Hazard Persons at Risk Control Measures
Severity
(1-10)
Likelihood
(1-10)
Risk Rating
(S x L)
Level of
Risk
Result
(T,A,N,U)
1 K038Entanglement -
During machine operation
Staff, Students,
Visitors &
Trespassers
1. Milling Machine to be operated by a competent,
trained person.
2. Loose clothing, long hair to be secured/tied back.
3. Dangling jewellery to be removed when operating
milling machine.
4. All appropriate guarding to be in place at all times
during use.
5. Machine must be stopped and tooling come to
rest prior to any measuring or gauging.
6. Mushroom-headed (or similar) emergency stop
button to be fitted.
7. Handles or hand wheels to operate table
mechanism to be set so they do not rotate when
power drive is engaged.
8. Milling Machine fitted with dynamic breaking
system to stop cutting head within specific
timescale.
9. Machine locked off and isolated when not-in-use.
Key access controlled locally by resident technical
skills specialist.
6 6 36 High A
2 K038Cutting/Severing -
During removal of swarf material
Staff, Students,
Visitors &
Trespassers
1. Swarf is to be removed when machine has come
to a complete stop.
2. Any swarf is to be removed with a suitable
implement so as to avoid direct hand contact with
waste material.
3. Care must be taken when handling cutters and
work piece.
6 6 36 High A
3 K038Crushing/Impact -
During machine use
Staff, Students,
Visitors &
Trespassers
1. 500mm space maintained between machine table
at the extreme ends of travel and any fixed object.
2. Substantial protective footwear to be worn.
6 4 24 Low A
4 K038
Crushing/Impact/Manual
Handling -
During process changeover of
machine attachments
Staff, Students,
Visitors &
Trespassers
1. Overhead gantry and lifting hoist to used when
changing machine tool attachments.
2. Safety footwear to be used.
3. Where 1 is not practicable, 2-man lifting should be
employed to transfer attachments.
6 6 36 High A
5 K038Coolant Fluids -
Contact with skin
Staff, Students,
Visitors &
Trespassers
1. Contact with skin to be kept to a minimum.
2. Barrier Creams or appropriate close fitting
disposable gloves may be used.
3. Coolant/Lubrication to be used as and when
required.
4. Only properly marked CoSHH container to be
used for coolant/lubrication"
4 6 24 Low A
6 K038Electrocution -
During machine use
Staff, Students,
Visitors &
Trespassers
1. Machinery subject to annual maintenance
inspection.
2. Machine subject to 5 yearly electrical inspection
and tests.
3. Additional emergency stop/electrical isolation
buttons located within lab.
6 4 24 Low A
7 K038Flying Debris -
Ejected material
Staff, Students,
Visitors &
Trespassers
1. PPE (Goggles) to be worn at all times when
operating drilling machine. 6 6 36 High A
Control measures highlighted in bold indicate recommended improvements needed to reduce the level of risk associated with the hazard
Summary of any key comments to note (general recommendations for improvements, areas of concern, items for review or further action etc)
Results are graded as follows: T (trivial risk), A (adequately controlled), N (not adequately controlled), U (unable to decide and further information required)

pg. 59
Risk Assessment FormFaculty of Computing, Engineering & TechnologyEngineering & Sciences
To be completed by Risk Assessor:
Location of activity K038 Member of staff responsible for activity Neil Harvey
Activity being assessed General Workshop Activities Other contributors to assessment Graham Preece
Assessors name Haydn Richardson Assessor contact tel 3291
Date of Assessment 10/08/2013 Assessors signature
Review required Yes / No Review Date Due 11/08/2016
All completed Risk Assessments MUST be returned to either Steve Marsh (Faculty H&S Advisor) or Claire Booth (Faculty H&S Administrator).
No Risk Area Hazard Persons at Risk Control Measures
Severity
(1-10)
Likelihood
(1-10)
Risk Rating
(S x L)
Level of
Risk
Result
(T,A,N,U)
1 K038Slips/Trips and Falls - Workshop
activities
Staff, Students,
Visitors &
Trespassers
1. Working area to be kept clean & tidy at all times.
2. Trailing cables should not be used where
practicable.
3. Work systems organised to minimize the
likelihood of oil and fluids spilling in to floor.
4. All spillages of fluids to be removed using spill-kit
equipment or Absorbent Granules.
5. Appropriate PPE (Apron/Coveralls, Steel toe
safety footwear etc) to be worn at all times when
working in designated machining lab areas.
6 2 12 Low A
2 K038 Noise - During equipment use
Staff, Students,
Visitors &
Trespassers
1. PPE (Ear Defenders).
6 2 12 Low A
3 K038
Moving Parts/Entanglement -
During use of workshop
equipment
Staff, Students,
Visitors &
Trespassers
1. Long hair to be secured.
2. Loose clothing should be secured and suitable
protective clothing should be worn.
3. Dangling jewellery should be removed, rings
should be taped or removed.
6 1 6 Very Low A
4 K038Oils/Fluids/Cleaning Fluids -
Contact with fluids
Staff, Students,
Visitors &
Trespassers
1. Barrier Cream to be used at the start of work.
2. Disposable latex/vinyl gloves to be worn
when/where applicable and practicable.
1 4 4 Very Low A
5 K038
Pneumatic Air - Using Air power
tools and associated
compressed air equipment
Staff, Students,
Visitors &
Trespassers
1. All workers instructed/trained in safe working
procedures and dangers of horseplay in the workshop
area.
2. Airline has deadman’s handle.
3. System inspected and serviced every year by
insurers.
6 1 6 Very Low N
6 K038Oils/Fluids/Cleaning Fluids -
General Use
Staff, Students,
Visitors &
Trespassers
1. Barrier Cream to be used at the start of work.
2. Disposable latex/vinyl gloves to be worn when
practicable.
3. Appropriate PPE (Gloves, Goggle etc) to be worn
when handling products.
4. All waste CoSHH products to be disposed of in
designated area.
5. During transportation of waste care should be
taken to avoid spillage.
6. Manual handling techniques should be adopted
when attempting to transport bulky waste containers.
7. Spillages to be cleaned using appropriate spill kit
equipment.
8. Technical Instruction on safe working in a
workshop environment.
1 4 4 Very Low U
Control measures highlighted in bold indicate recommended improvements needed to reduce the level of risk associated with the hazard
Summary of any key comments to note (general recommendations for improvements, areas of concern, items for review or further action etc)
Results are graded as follows: T (trivial risk), A (adequately controlled), N (not adequately controlled), U (unable to decide and further information required)

pg. 60
Risk Assessment FormFaculty of Computing, Engineering & Technology
To be completed by Risk Assessor:
Location of activity S107 Member of staff responsible for activity Haydn Richardson
Graham Preece
Dave Cheshire
Mick Britton
Activity being assessed Use of Dimension FDM Other contributors to assessment As above
Assessors name Mick Britton Assessor contact tel 3256
Date of Assessment 22-Oct-15 Assessors signature
Review required Yes Review Date Due 24-Oct-16
All completed risk assessments MUST be available to persons undertaking the activity. A copy should also be filed with Claire Booth (Faculty H&S Administrator) if appropriate.
No Risk Area Hazard/Process Persons at Risk Control Measures
Severity
(1-10) Likelihood (1-10)
Risk Rating
(S x L)
Level of
Risk
Result
(T,A,N,U)
1 S107Fume and particulates - When
handling materials
Staff,Students,
Visitors &
Trespassers
1. Referal to COSHH risk assessmemt and MSDSS
should be made when handling COSHH products
associated with this equipment. 3 4 12 Low A
2 S107
Heat/Burns - When handling RP
model and when carrying out
maintenance of the unit head
Staff,Students,
Visitors &
Trespassers
1. Only technical members of staff are permitted to
carry out 1st line maintenance to the head.
2. When practical use supplied heat resistant gloves
when handling the head unit in machine maintenance
mode.
3 4 12 Low A
3 S107Fire - When machine is in use
overnight.
Staff,Students,
Visitors &
Trespassers
1. Where practical, remove all combustable materials
from surrounding area.
2. Only print overnight where necessary.
3. Fire Fighting appliances provided.
4. All windows and doors closed.
3 4 12 Low A
4 S107Electric shock - During machine
use.
Staff,Students,
Visitors &
Trespassers
1. Equipment subject to annual protable appliace
testing ( PAT) inspection.
2. Quick safety inspection, cables etc carried prior to
use.
3. Any damaged equipment reported to a responsible
member of staff and MUST NOT be used.
8 3 24 Low A
Control measures highlighted in bold indicate recommended improvements needed to reduce the level of risk associated with the hazard
Summary of any key comments to note (general recommendations for improvements, areas of concern, items for review or further action etc)
The resultant risk level is graded as follows: T (trivial risk), A (adequately controlled), N (not adequately controlled), U (unable to decide and further information required)
Risk Assessment FormFaculty of Computing, Engineering & Technology
To be completed by Risk Assessor:
Location of activity K036 DWIGHT BUILDING Member of staff responsible for activity Gareth Downing,
Activity being assessed Refuelling of cars, engine dyno Other contributors to assessment
Assessors name Graham Preece Assessor contact tel 3602
Date of Assessment 16-Oct-14 Assessors signature
Review required Yes Review Date Due 31-Oct-16
All completed risk assessments MUST be available to persons undertaking the activity. A copy should also be filed with Claire Booth (Faculty H&S Administrator) if appropriate.
No Risk Area Hazard/Process Persons at Risk Control Measures
Severity
(1-10)
Likelihood
(1-10)
Risk Rating
(S x L)
Level of
Risk
Result
(T,A,N,U)
K036 HANDLING Staff, Students 1. Wear appropriate PPE, Glasses with side
protection.
2. Avoid breathing mists of vapour.
3. Avoid contact with skin.
4 3 12 Low A
K036 Fuel Leakage Staff, Students 1. Have appropriate fire safety equipement in place.
(Foam extinguisher)
10 2 20 Low A
K036 Fuel Leakage Splash Staff, Students 1. Refuel in open air.
2. All spillages of fluids to be removed using spill-kit
equipment or absorbent granuals
5 2 10 Low A
K036 Storage of Equipement after re-
fueling
Staff, Students 1. Ensure Area is Clean and all excess fuel is
removed.
2. Secure lids on Petrol containers.
10 1 10 Low A
Control measures highlighted in bold indicate recommended improvements needed to reduce the level of risk associated with the hazard
Summary of any key comments to note (general recommendations for improvements, areas of concern, items for review or further action etc)
The resultant risk level is graded as follows: T (trivial risk), A (adequately controlled), N (not adequately controlled), U (unable to decide and further information required)

pg. 61
Risk Assessment FormFaculty of Computing, Engineering & Technology
To be completed by Risk Assessor:
Location of activity K036 Member of staff responsible for activity Gareth Downing,
Activity being assessed Use of Dynostar Rolling Road Other contributors to assessment Dynostar
Assessors name Graham Preece Assessor contact tel 3602
Date of Assessment 01/09/2014 Assessors signature
Review required Yes / No Review Date Due 31/10/2016
All completed Risk Assessments MUST be returned to either Steve Marsh (Faculty H&S Advisor) or Claire Booth (Faculty H&S Administrator).
No Risk Area Hazard Persons at Risk Control Measures
Severity
(1-10)
Likelihood
(1-10)
Risk Rating
(S x L)
Level of
Risk
Result
(T,A,N,U)
1Automotive Unit
K036Slips/Trips and Falls
Staff, Students,
Visitors &
Trespassers
1. Dyno area to be kept clean & tidy at all times.
2. Trailing cables should not be used where
practicable.
3. Work systems organised to minimize the
likelihood of oil and fluids spilling on to floor.
4. All spillages of fluids to be removed using spill-kit
equipment or Absorbent Granules.
5. Appropriate PPE (Ear defenders, appropriate
footwear etc) to be worn at all times when working in
dyno area.
6 2 12 Low A
2Automotive Unit
K036
Noise/Vehicle Fumes - During
Engine running
Staff, Students,
Visitors &
Trespassers
1. PPE (Ear Defenders) to be used at all times.
2. Local Exhaust Ventilation (LEV) unit to be
connected to vehicle exhaust pipe.
3. Room ventilation to be used during process.
6 2 12 Low A
3Automotive Unit
K036
Moving Parts/Entanglement -
During setting/Fault diagnostics
during work in engine
compartment
Staff, Students,
Visitors &
Trespassers
1. Long hair to be secured.
2. Loose clothing should be secured and suitable
protective clothing should be worn.
3. Dangling jewellery should be removed, rings
should be taped or removed.
6 1 6 Very Low A
4Automotive Unit
K036
Oils/Fluids/Cleaning Fluids/Anti-
Freeze/Hydraulic Fluids -
Contact with fluids
Staff, Students,
Visitors &
Trespassers
1. Barrier Cream to be used at the start of work.
2. Disposable latex/vinyl gloves to be worn when
practicable. 1 4 4 Very Low A
5Automotive Unit
K036
Electrocution - High-tension
ignition systems
Staff, Students,
Visitors &
Trespassers
1. Work should not be carried out on or near to
ignition systems while engine is running.
2. Individuals fitted with pacemaker are not to work
on or near ignition systems.
8 1 8 Very Low A
6Automotive Unit
K036
Burns/Scalds - From engine
cooling system
Staff, Students,
Visitors &
Trespassers
1. Radiator or expansion tank caps should not be
removed while the engine is hot.
2. Care should be taken to avoid contact with hot
engine oil, exhaust system or brake drums or discs.
3. Contact with burnt or overheated synthetic rubber
components should be avoided at all times.
Protective gloves should be worn.
4. If contact is made with skin the area should be
immediately washed and medical attention sought.
6 3 18 Low A
7Automotive Unit
K036Genral Safety
Staff, Students,
Visitors &
Trespassers
1. All workers trained in safe working procedures and
dangers.
2. System inspected and serviced annually under
contract.
6 1 6 Very Low A
Control measures highlighted in bold indicate recommended improvements needed to reduce the level of risk associated with the hazard
Summary of any key comments to note (general recommendations for improvements, areas of concern, items for review or further action etc)
Results are graded as follows: T (trivial risk), A (adequately controlled), N (not adequately controlled), U (unable to decide and further information required)

pg. 62
Appendix R – Emissions Data
RPM Nm kW ISO Nm ISO kW Coolant Temp
Coolant Temp
Corrected O2 CO2 CO HC
3000 28.80 9.10 29.00 9.10 47.10 94.20 12.53 7.70 0.05 1.00
2900 30.40 9.20 30.60 9.30 47.10 94.20 12.30 8.00 0.06 1.00
2800 29.90 8.80 30.10 8.80 46.90 93.80 10.45 8.20 0.06 1.00
2700 30.70 8.70 30.90 8.70 46.70 93.40 10.28 8.60 0.06 1.00
2600 30.10 8.20 30.40 8.30 46.80 93.60 10.01 8.70 0.06 1.00
2500 31.00 8.10 31.30 8.20 46.90 93.80 9.00 8.80 0.06 1.00
2400 30.40 7.60 30.70 7.70 47.10 94.20 9.94 8.80 0.06 1.00
2300 31.70 7.60 32.00 7.70 47.10 94.20 9.61 8.90 0.06 1.00
2200 32.30 7.40 32.60 7.50 47.10 94.20 9.35 8.90 0.06 1.00
2100 33.20 7.30 33.50 7.40 47.10 94.20 9.26 8.90 0.06 1.00
2000 31.40 6.60 31.60 6.60 47.20 94.40 9.32 9.00 0.06 1.00
1900 33.80 6.70 34.00 6.80 47.50 95.00 9.27 9.10 0.06 1.00
1800 38.70 7.30 39.00 7.40 47.60 95.20 9.11 9.10 0.06 1.00
1700 39.40 7.00 39.70 7.10 47.60 95.20 8.95 9.50 0.06 1.00
1600 40.90 6.80 41.20 6.90 47.80 95.60 8.58 10.20 0.06 1.00
1500 41.90 6.60 42.30 6.60 48.10 96.20 7.54 10.70 0.06 1.00
1400 41.60 6.10 41.90 6.10 48.10 96.20 7.28 10.90 0.06 0.00

pg. 63
Appendix S – LPG Specification and Safety Data Sheet

pg. 64

pg. 65

pg. 66

pg. 67
pg. 68