lowered cutoff points of obesity indicators are better predictors of hypertension and diabetes...
TRANSCRIPT
O
O
O
Lihp
F
a
b
Tc
d
M
R
h1
ARTICLE IN PRESSRCP-384; No. of Pages 8
besity Research & Clinical Practice (2014) xxx, xxx—xxx
RIGINAL ARTICLE
owered cutoff points of obesityndicators are better predictors ofypertension and diabetes mellitus inremenopausal Taiwanese women
u-Ling Chua,b, Chung-Huei Hsuc,d, Chii Jengb,∗
Chang Gung University of Science and Technology, Taoyuan, TaiwanGraduate Institute of Nursing, College of Nursing, Taipei Medical University, Taipei,aiwanSchool of Medicine, College of Medicine, Taipei Medical University, Taipei, TaiwanDivision of Endocrinology and Metabolism, Department of Internal Medicine, Taipeiedical University Hospital, Taipei, Taiwan
eceived 17 January 2014; received in revised form 1 May 2014; accepted 1 August 2014
KEYWORDSObesity indicators;Women;Hypertension;Diabetes
SummaryIntroduction: In previous study, we found that in order to prevent MS in women aged<65 years, the cutoff points of obesity indicators should be lowered.Objective: To investigate whether our proposed cutoff points of obesity indicatorspredict the occurrence of hypertension (HT), diabetes mellitus (DM), and hyperlipi-demia in premenopausal women with greater sensitivity and specificity comparedto reference cutoff points of obesity that are currently being used.Methods: Using the database of the ‘‘2002 Survey on the Prevalence of Hypertension,Hyperglycemia and Hyperlipidemia in Taiwan’’ provided by the Bureau of HealthPromotion, Taiwan as research material, data from 2270 premenopausal womenaged 20—65 years were used for the analyses. The receiver-operating characteristic
curves (ROC) of the body-mass index (BMI), waist circumference (WC), waist-to-hipratio (WHR), and waist-to-height ratio (WHtR) were used to predict HT, DM, andhyperlipidemia.Results: Obesity is not a good predictor of the occurrence of hyperlipidemia in pre-menopausal women aged <65 years. However, our proposed cutoff points had greaterPlease cite this article in press as: Chu F-L, et al. Lowered cutoff points of obesity indicators are better pre-dictors of hypertension and diabetes mellitus in premenopausal Taiwanese women. Obes Res Clin Pract (2014),http://dx.doi.org/10.1016/j.orcp.2014.08.001
sensitivity and specificity than did the reference cutoff points. To prevent the risk of
∗ Corresponding author at: 250 Wu-Hsing Street, Taipei 110, Taiwan. Tel.: +886 2 23777438.E-mail address: [email protected] (C. Jeng).
ttp://dx.doi.org/10.1016/j.orcp.2014.08.001871-403X/© 2014 Published by Elsevier Ltd on behalf of Asia Oceania Association for the Study of Obesity.
ARTICLE IN PRESSORCP-384; No. of Pages 8
2 F.-L. Chu et al.
HT and DM in premenopausal women, the cutoff points of obesity indicators shouldbe reduced. The proposed values are as follows: a WHR of 0.79; a WC of 74.7 cm; aWHtR of 0.49; and a BMI of 22.3 kg/m2.© 2014 Published by Elsevier Ltd on behalf of Asia Oceania Association for the Study
(eiireiocwotrooehmcHltWu
pbodtaBoaf
cIn our previous study [17], we found that obe-sity was not a good predictor of MS in womenaged ≥65 years; however in order to prevent MS
of Obesity.
Introduction
According to the Nutrition and Health Survey(2005—2008) in Taiwan [1], respective prevalenceof being overweight (24 kg/m2 ≤ body-mass index(BMI) < 27 kg/m2) in Taiwanese women of young(19—30 years), prime (31—44 years), middle (45—64years), and old age (>65 years) are 9.8%, 12.1%,27.6%, and 32%, the percentage of mildly obesewomen (27 kg/m2 ≤ BMI < 30 kg/m2) increased from7.6% in 1993—1996 to 10.5%. According to a surveyby the Bureau of Health Promotion, the preva-lence of abdominal obesity (waist circumference(WC) ≥ 80 cm) in Taiwanese women increases withage [2].
Because they are protected by ovarian hor-mones, premenopausal women have lower preva-lences of chronic diseases. It has been demon-strated that, the risks of hypertension (HT),diabetes mellitus (DM), and hyperlipidemia in Tai-wanese women aged below 50 years were lowerthan those of men. However, for women aged >50years, the risks for HT, DM, and hyperlipidemiawere greater than that those for men [2]. Eventhough premenopausal women are protected byestrogen and since obesity has a significant cor-relation with chronic diseases, the ever-increasingobesity rate in women may increase the risks for HT,DM, and hyperlipidemia in younger premenopausalwomen.
It was established that different obesity patternshave different physiological effects. In particular,central obesity is correlated with the occurrenceof chronic diseases [3]. Studies showed that thedegree of central obesity is inversely correlatedwith the high-density lipoprotein cholesterol (HDL-C) level, and positively correlated with levels oftriglyceride (TG) and insulin resistance, and centralobesity leads to a higher degree of hyperlipidemia
Please cite this article in press as: Chu F-L, et al. Lowerdictors of hypertension and diabetes mellitus in premenophttp://dx.doi.org/10.1016/j.orcp.2014.08.001
and insulin resistance [4,5], and each MS compo-nents [6]. Since obesity is correlated with chronicdiseases, obesity indicators, including the BMI, WC,waist-to-hip ratio (WHR), and waist-to-height ratio
iotm
WHtR), are commonly used as predictive mark-rs of chronic diseases. Compared to WC, the BMIs a stronger predictor for the occurrence of CVDn middle-aged women [7], and is an importantisk factor of MS in menopausal women [8]. Kuliet al. [9] suggested that if the BMI is >24 kg/m2
n women, a WHR of >0.76 will increase the riskf DM. Furthermore, the WHR was significantlyorrelated with the risk of mortality in old-agedomen [10]. A study by Esteghamati et al. [11]n 4615 individuals aged >18 years showed thathe WHR is the best predictor of cardiovascularisk. The Chinese Taipei Association for the Studyf Obesity [12] suggested that women with a WHRf >0.85 were more susceptible to chronic dis-ases, including CVD, HT, atherosclerosis, DM, andyperlipidemia. In addition, the WHtR is a betterarker for screening cardiometabolic risk factors
ompared to the WC and BMI [13]. Ashwell andsieh [14] suggested that the WHtR has an ear-
ier sensitivity to health indicators compared tohe BMI, and that a cutoff point of 0.5 for theHtR is applicable to different genders and pop-
lations.Currently, every country uses different cutoff
oints for obesity indicators. The International Dia-etes Federation [15] defines obesity dependingn ethnicity. For Asian women, central obesity isefined as a WC of ≥80 cm, which is the same ashe definition given by the Chinese Taipei Associ-tion for the Study of Obesity [12]. However, theureau of Health Promotion, Taiwan [16] definesbesity as a WC of >80 cm, and being overweights a BMI of not less than 24 kg/m2 and <27 kg/m2
or women.The currently used cutoff points for obesity indi-
ators are not tailored for specific age groups.
ed cutoff points of obesity indicators are better pre-ausal Taiwanese women. Obes Res Clin Pract (2014),
n women aged <65 years, the cutoff points ofbesity indicators should be lowered. We proposedhat to avoid two or more MS components in pre-enopausal women aged <65 years, their WHtR
INORCP-384; No. of Pages 8
C
sMT<<tdpaootoip
M
D
IdHiPwNItPsw
S
Tmnayvms
V
AmhtoTmLw
docarotAdot≥riTwwcTieb
S
DCauvtWDtHiipciedsatciiAp8
ARTICLEutoff points of obesity indicators
hould be kept below 0.47. To avoid three or moreS components, the ratio has to be below 0.49.he other cutoff points are a WC of <74.4 cm and78.0 cm, WHR of <0.78 and <0.79, and BMI of22.3 and <24.0 kg/m2. The aim of this study waso examine the ability of obesity indicators to pre-ict the risks of HT, DM, and hyperlipidemia inremenopausal women aged <65 years. Addition-lly, we compared our suggested cutoff points ofbesity indicators against references cutoff pointsf obesity currently in use. It was hypothesizedhat, in predicting HT, DM, and hyperlipidemia,ur cutoff point of obesity had better sensitiv-ty and specificity than did the reference cutoffoints.
aterials and methods
atabase
n this study, we obtained materials from theatabase of the Survey on the Prevalence ofypertension, Hyperglycemia and Hyperlipidemia
n Taiwan 2002 provided by the Bureau of Healthromotion, Taiwan. Participants of this databaseere selected from individuals enrolled in theational Health Interview Survey in Taiwan 2001.
n order to obtain information of the chosen par-icipants, we requested the Bureau of Healthromotion to link the two databases, and weelected and analyzed information of participantsho fulfilled our selection criteria.
tudy sample
he selection criteria of participants were pre-enopausal women (menopause defined by the
on-occurrence of menses for more than 12 months)ged >20 (born after January 1982) and <65ears (born before January 1937). After indi-iduals who did not disclose their status ofenopause were excluded, 2270 individuals were
elected.
ariables of interest
ccording to the aim of our study, the infor-ation obtained from participants included age,
eight, weight, WC, hip circumference, and his-ory of HT, DM, and hyperlipidemia. The definitionsf HT, DM, and hyperlipidemia were as follows.
Please cite this article in press as: Chu F-L, et al. Lowerdictors of hypertension and diabetes mellitus in premenophttp://dx.doi.org/10.1016/j.orcp.2014.08.001
he definition of HT by the Joint National Com-ittee (JNC) 7 guidelines by the National Heart,
ung, and Blood Institute, USA [18] was used. HTas defined as systolic pressure of ≥140 mmHg,
tOo[
PRESS3
iastolic pressure of ≥90 mmHg, or regular intakef an antihypertensive. According to the Ameri-an Diabetes Association [19], DM was defined as
fasting blood sugar level of ≥126 mg/dl, cur-ent regular intake of oral hypoglycemic agents,r injection of insulin. According to the defini-ion of The National Cholesterol Education Programdult Treatment Panel III, USA [20], hyperlipi-emia was defined as fasting total cholesterol (TC)f ≥240 mg/dl, fasting HDL-C of ≤40 mg/dl, fas-ing low-density lipoprotein cholesterol (LDL-C) of160 mg/dl, fasting TG of ≥200 mg/dl, or current
egular intake of a hypolipidemic agent. Obesityndicators included the BMI, WC, WHR, and WHtR.he BMI was calculated on the basis of height andeight; the WHR was calculated on the basis ofaist and hip circumferences, and the WHtR wasalculated on the basis of the WC and height.he WC was measured between the lowest rib and
liac crest in standing position, and hip circumfer-nce was measured over the widest part of theuttocks.
tatistical analysis
ata were analyzed using SPSS/PC 15.0 (SPSS,hicago, IL, USA). In the receiver-operating char-cteristic (ROC) analysis, we calculated the areander the curve (AUC) and its 95% confidence inter-al (CI) for each anthropometric measurement. Inhe analysis, ROC curves of the BMI, WC, WHR, andHtR were used to predict the occurrence of HT,M, and hyperlipidemia. An AUC of >0.7 suggestshat the indicator has good capability of predictingT, DM, and hyperlipidemia [21]. After determining
f the obesity indicator was a good tool for predict-ng HT, DM, and hyperlipidemia, we referred to ourreviously published cutoff points of obesity indi-ators to predict the occurrence of two or threetems of the MS components [17], compared to ref-rence cutoff points that are currently used, andetermined which ones had better sensitivity andpecificity. In order to take into account sensitivitynd specificity, those with a higher sum of sensi-ivity and specificity were considered to be betterutoff points. Reference cutoff points of obesityndicator are as follows: a WHR of 0.85 (accord-ng to the recommendation of the Chinese Taipeissociation for the Study of Obesity [12] for therevention of chronic diseases in women); a WC of0 cm, a BMI of 24 kg/m2 (according to the defini-
ed cutoff points of obesity indicators are better pre-ausal Taiwanese women. Obes Res Clin Pract (2014),
ion of obesity and excess weight by The BureauF Health Promotion Taiwan) [16], and a WHtR cut-ff point of 0.5, as recommended in the literature14].

Please cite this article in press as: Chu F-L, et al. Lowered cutoff points of obesity indicators are better pre-dictors of hypertension and diabetes mellitus in premenopausal Taiwanese women. Obes Res Clin Pract (2014),http://dx.doi.org/10.1016/j.orcp.2014.08.001
ARTICLE IN PRESSORCP-384; No. of Pages 8
4 F.-L. Chu et al.
Table 1 Area under the curve (AUC) for indicators of obesity with hypertension (HT), diabetes mellitus (DM), andhyperlipidemia.
AUC and 95% confidence interval (CI)
HT LR X2 DM LR X2 Hyperlipidemia LR X2
(n = 114) (n = 38) (n = 296)
WHR 0.78 (0.74—0.80) 106.47*** 0.86 (0.80—0.92) 58.41*** 0.68 (0.65—0.71) 87.27***
WC 0.80 (0.77—0.84) 121.67*** 0.81 (0.74—0.87) 47.25*** 0.67 (0.64—0.71) 86.41***
WHtR 0.81 (0.77—0.85) 124.59*** 0.82 (0.76—0.88) 49.75*** 0.68 (0.65—0.72) 93.47***
BMI 0.78 (0.73—0.82) 101.71*** 0.73 (0.64—0.82) 26.99*** 0.66 (0.63—0.70) 75.19***
WHR, waist-to-hip ratio; WC, waist circumference; WHtR, waist-to-height ratio; BMI, body-mass index; LR X2, likelihood ratio chisquare.
*** P < 0.001.
Results
Participant characteristics
After individuals who did not disclose their statusof menopause were excluded, 2270 premenopausalwomen were studied. They were aged 20—57 (mean35.5; standard deviation (SD), 9.1) years, with amean WC of 73.1 (SD, 8.8) cm, a mean WHtR of 0.46(SD, 0.06), a mean BMI of 22.0 (SD, 3.4) kg/m2, anda mean WHR of 0.77 (SD, 0.06). Prevalence of HT,DM, and hyperlipidemia were 114 (5.0%), 38 (1.7%),and 296 individuals (13.0%).
AUC, sensitivity, and specificity for theanthropometric parameters of obesity withHT, DM, and hyperlipidemia
Table 1 and Figs. 1 and 2 show the capability of thefour obesity indicators to predict the occurrenceof HT, DM, and hyperlipidemia in premenopausalwomen. Results showed that the four obesity
1.00.80.60.40.20.0
1 - Specificity
1.0
0.8
0.6
0.4
0.2
0.0
Se
nsi
tivity
Reference Line
WHtR
BMI
WC
WHRSource of the Curve
Figure 1 Area under the curve (AUC) of obesity indica-tors associated with hypertension (HT).
indicators had great capability in predicting HT andDM (AUC > 0.7). The WHtR was the best predictorof HT (AUC, 0.81), whereas the WHR was the bestpredictor of DM (AUC, 0.86). The four obesity indi-cators were all inferior predictors of hyperlipidemia(AUC, 0.66—0.68), suggesting that obesity is not agood predictor of hyperlipidemia of premenopausalwomen aged <65 years.
Sensitivity and specificity of the cutoffpoints for obesity indicators of HT and DM
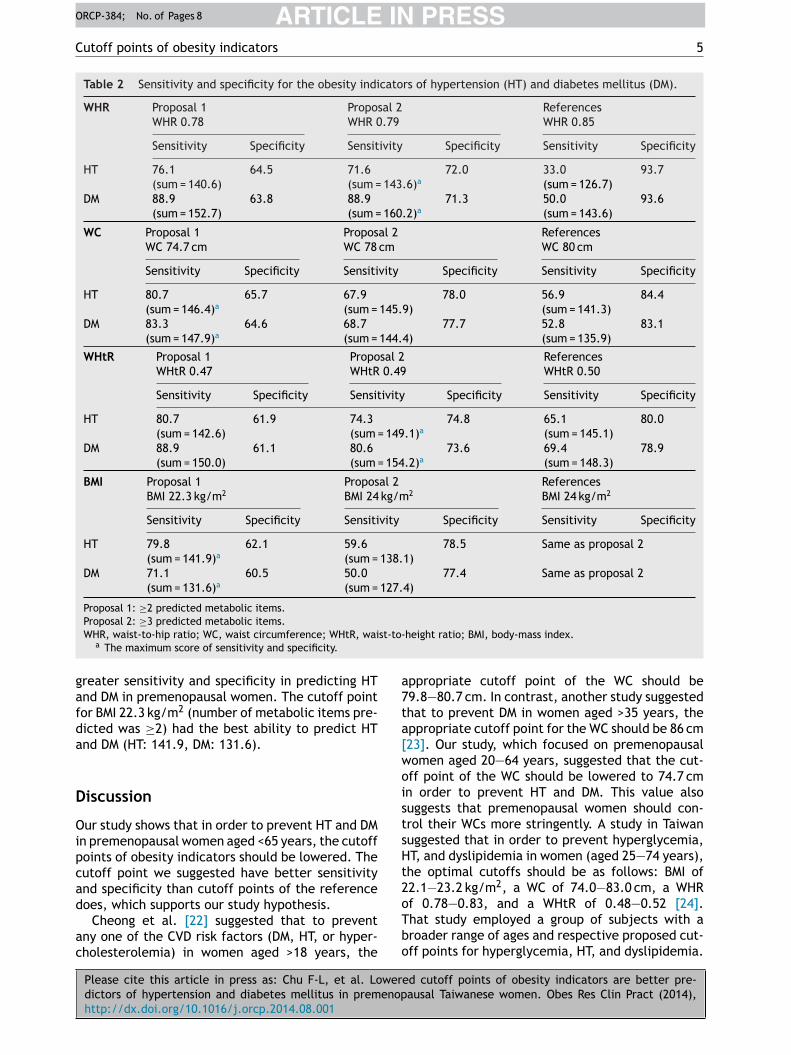
Table 2 reveals that our proposed cutoff pointsof obesity indicators were better predictors ofHT and DM compared to reference cutoff pointsof obesity indicators. Our proposed cutoff pointfor WHR of 0.79 (number of metabolic itemspredicted was ≥3) had the highest score of sen-sitivity and specificity for HT and DM (HT: 143.6,DM: 160.2). On the other hand, our proposed cutoffpoint for the WC of 74.7 cm (number of metabolicitems predicted was ≥2) and for the WHtR of 0.49(number of metabolic items predicted was ≥3) had
1.00.80.60.40.20.0
1 - Specificity
1.0
0.8
0.6
0.4
0.2
0.0
Sen
sitiv
ity
Reference Line
WHtR
BMI
WC
WHRSource of the Curve
Figure 2 Area under the curve (AUC) of obesity indica-tors associated with diabetes mellitus.
ARTICLE IN PRESSORCP-384; No. of Pages 8
Cutoff points of obesity indicators 5
Table 2 Sensitivity and specificity for the obesity indicators of hypertension (HT) and diabetes mellitus (DM).
WHR Proposal 1 Proposal 2 ReferencesWHR 0.78 WHR 0.79 WHR 0.85
Sensitivity Specificity Sensitivity Specificity Sensitivity Specificity
HT 76.1 64.5 71.6 72.0 33.0 93.7(sum = 140.6) (sum = 143.6)a (sum = 126.7)
DM 88.9 63.8 88.9 71.3 50.0 93.6(sum = 152.7) (sum = 160.2)a (sum = 143.6)
WC Proposal 1 Proposal 2 ReferencesWC 74.7 cm WC 78 cm WC 80 cm
Sensitivity Specificity Sensitivity Specificity Sensitivity Specificity
HT 80.7 65.7 67.9 78.0 56.9 84.4(sum = 146.4)a (sum = 145.9) (sum = 141.3)
DM 83.3 64.6 68.7 77.7 52.8 83.1(sum = 147.9)a (sum = 144.4) (sum = 135.9)
WHtR Proposal 1 Proposal 2 ReferencesWHtR 0.47 WHtR 0.49 WHtR 0.50
Sensitivity Specificity Sensitivity Specificity Sensitivity Specificity
HT 80.7 61.9 74.3 74.8 65.1 80.0(sum = 142.6) (sum = 149.1)a (sum = 145.1)
DM 88.9 61.1 80.6 73.6 69.4 78.9(sum = 150.0) (sum = 154.2)a (sum = 148.3)
BMI Proposal 1 Proposal 2 ReferencesBMI 22.3 kg/m2 BMI 24 kg/m2 BMI 24 kg/m2
Sensitivity Specificity Sensitivity Specificity Sensitivity Specificity
HT 79.8 62.1 59.6 78.5 Same as proposal 2(sum = 141.9)a (sum = 138.1)
DM 71.1 60.5 50.0 77.4 Same as proposal 2(sum = 131.6)a (sum = 127.4)
Proposal 1: ≥2 predicted metabolic items.
st-to-
gafda
D
Oipcad
ac
a7ta[woistsHt2
Proposal 2: ≥3 predicted metabolic items.WHR, waist-to-hip ratio; WC, waist circumference; WHtR, wai
a The maximum score of sensitivity and specificity.
reater sensitivity and specificity in predicting HTnd DM in premenopausal women. The cutoff pointor BMI 22.3 kg/m2 (number of metabolic items pre-icted was ≥2) had the best ability to predict HTnd DM (HT: 141.9, DM: 131.6).
iscussion
ur study shows that in order to prevent HT and DMn premenopausal women aged <65 years, the cutoffoints of obesity indicators should be lowered. Theutoff point we suggested have better sensitivitynd specificity than cutoff points of the reference
Please cite this article in press as: Chu F-L, et al. Lowerdictors of hypertension and diabetes mellitus in premenophttp://dx.doi.org/10.1016/j.orcp.2014.08.001
oes, which supports our study hypothesis.Cheong et al. [22] suggested that to prevent
ny one of the CVD risk factors (DM, HT, or hyper-holesterolemia) in women aged >18 years, the
oTbo
height ratio; BMI, body-mass index.
ppropriate cutoff point of the WC should be9.8—80.7 cm. In contrast, another study suggestedhat to prevent DM in women aged >35 years, theppropriate cutoff point for the WC should be 86 cm23]. Our study, which focused on premenopausalomen aged 20—64 years, suggested that the cut-ff point of the WC should be lowered to 74.7 cmn order to prevent HT and DM. This value alsouggests that premenopausal women should con-rol their WCs more stringently. A study in Taiwanuggested that in order to prevent hyperglycemia,T, and dyslipidemia in women (aged 25—74 years),he optimal cutoffs should be as follows: BMI of2.1—23.2 kg/m2, a WC of 74.0—83.0 cm, a WHR
ed cutoff points of obesity indicators are better pre-ausal Taiwanese women. Obes Res Clin Pract (2014),
f 0.78—0.83, and a WHtR of 0.48—0.52 [24].hat study employed a group of subjects with aroader range of ages and respective proposed cut-ff points for hyperglycemia, HT, and dyslipidemia.
INORCP-384; No. of Pages 8
mrtHeitiwgtbwcpsbio
ih[lreyas(brwdasr[HppPPtl[efdbwp
ARTICLE6
Our study focused on premenopausal women, andprovides appropriate cutoff point of obesity indi-cators for preventing HT and DM to provide aclearer health standard for this particular popula-tion group. Another study showed that to predictcardiovascular risk factors for healthy Taiwanesewomen (with a mean age of 37.0 ± 11.1 years),the cutoff points should be as follows: a BMI of22.1 kg/m2, a WC of 71.5 cm, a WHR of 0.76, and aWHtR of 0.45 [25], which are all lower than thosesuggested by our study. This difference is probablybecause that study was designed to predict at leastone of the risk factors (HT, DM, or dyslipidemia);therefore, the conditions were more stringent,and the cutoff points were lower. Concludingfrom that study and our results, we suggest thatTaiwanese women should control their obesity con-dition more stringently in order to prevent HT andDM.
A study by Deng et al. [26] found that a highBMI (≥30 kg/m2) had a greater odds ratio (OR; 7.73vs. 4.08) compared to a high WC (≥88 cm) in pre-dicting HT in women aged >45 years. However, inyounger women (aged 18—44 years), a high WC hada greater OR than did a high BMI (9.10 vs. 7.39). Astudy on Egyptian adults over 18 years revealed thatthere was a significant relationship between WC andrisk of diabetes or hypertension, but no significantrelationship between WHR and BMI. However, therewas a significant relationship between WHR and dia-betes in Saudis population [27]. The results showeddifferent obesity indicators applies to different eth-nic and age groups.
Our results also showed that the WC was bet-ter than the BMI in predicting HT in premenopausalwomen (an AUC of 0.80 vs. 0.78); however, whenpredicting HT with the four obesity indicators, itwas found that the WHtR and WC had similar per-formances (AUC of 0.81 vs. 0.80). A recent studyon healthy Taiwanese people (aged >18 years) alsoshowed that the WHtR is a better indicator forpredicting cardiovascular risk factors (DM, HT, anddyslipidemia) [28]. Therefore, it is suggested that inthe future, the WHtR should be included as an obe-sity indicator for preventing HT in adults. Due to theslight difference between our proposed cutoff pointof WHtR, 0.49, and reference cutoff point, 0.5, westill suggest that WHtR less than 0.5 is the indica-tor for predicting MS, HT and DM for premenopausalwomen in clinical practice, though our proposedcutoff point has better sensitivity and specificitythan reference cutoff point does.
Please cite this article in press as: Chu F-L, et al. Lowerdictors of hypertension and diabetes mellitus in premenophttp://dx.doi.org/10.1016/j.orcp.2014.08.001
In predicting DM, the WHR had the best per-formance (an AUC of 0.88). A study with subjectsaged 35—64 years showed similar results, revea-ling that the WHR was the best predictor of women
cfmT
PRESSF.-L. Chu et al.
etabolic disorders [29]. On the other hand, ouresults showed that among the four obesity indica-ors, the BMI had lower performance of predictingT, DM, and hyperlipidemia compared to the oth-rs. A study by Xin et al. [23] had similar findings,n which the WC, WHR, and WHtR were betterhan the BMI in predicting type 2 DM. Recent stud-es showed that visceral adipose tissues of obeseomen were related to �-cell dysfunction and dys-lycemia. In terms of measuring visceral adiposeissue, the sagittal abdominal diameter (SAD) is aetter tool compared to the WC [30]. Another studyith participants aged >30 years discovered that aombination of the BMI and SAD was a new tool forredicting the occurrence of DM [31]. This findinguggests that in future studies, the SAD can alsoe included as an obesity indicator to investigatets ability in predicting DM in women compared tother obesity indicators.
As shown by our results, the four obesityndicators had poor performances in predictingyperlipidemia. A study by Wietlisbach et al.32] showed that the WC had a strong corre-ation with dyslipidemia in women (total/HDL-Catio of >5). Different from our study, their studymployed 27 groups of participants aged 35—64ears, with a higher average age (49—50.8 years),nd did not observe the menopausal status. Ourtudy employed premenopausal women aged 20—64mean, 35.5) years. Therefore, obesity might note an important factor contributing to the occur-ence of hyperlipidemia in younger premenopausalomen. There are many factors contributing toyslipidemia in women. A study with participantsged 18—76 years with normal glucose tolerancehowed that pancreatic �-cell dysfunction waselated to dyslipidemia (elevated TC and LDL-C)33]. On the other hand, dyslipidemia (reducedDL-C) also occurs in young women suffering fromolycystic ovary syndrome (PCOS) [34]. A high pro-ortion of Taiwanese young women suffer fromCOS. Research showed that women suffering fromCOS have lower blood adiponectin levels, andhat hypoadiponectinemia is significantly corre-ated with low blood HDL-C and high blood TG levels35]. A lower proportion of women protected bystrogen are suffering from dyslipidemia. There-ore, age and menopause are major factors causingyslipidemia and MS in women [36,37]. A studyy Zhou et al. [38] divided 593 healthy Chineseomen (aged 35—64 years) into groups ranging fromremenopausal to postmenopausal, and observed
ed cutoff points of obesity indicators are better pre-ausal Taiwanese women. Obes Res Clin Pract (2014),
hanges in blood lipid levels in these groups. Theyound that in the late perimenopause stage (2—12onths of amenorrhea once during a year), bloodC and TG levels in women were significantly
INORCP-384; No. of Pages 8
C
hlasaTccdmcm
tBcaip
C
Ols<soa2
A
WT
R
[
[
[
[
[
[
[
[
[
[
[
[
[
ARTICLEutoff points of obesity indicators
igher. Völler et al. [39] showed that during theast 5 years before menopause in women, BMInd TG levels significantly increase. The BMI washown to be a predictor of dyslipidemia (low HDL-Cnd high TG) during the transition to menopause.he aforementioned study showed that the pro-ess of menopause in women is an important stageausing obesity and dyslipidemia. Since our studyid not differentiate between different stages ofenopause, the relationship between obesity and
hanges in blood lipid levels in different stages ofenopause should be further studied.The source of subjects, who volunteered to par-
icipate in this study, is from the databank of theureau of Health Promotion, Taiwan. The subjectsould be more aware of their health conditionsnd the study results could thus be limited andnsufficient to draw inference from all Taiwaneseremenopausal women.
onclusions
besity indicators are not good predictors of hyper-ipidemia in premenopausal women. Our findingsuggest that to prevent HT and DM in women aged65 years, the cutoff points of obesity indicatorshould be lowered. The proposed cutoff points ofbesity indicators are as follows: a WHR of 0.79,
WC of 74.7 cm, a WHtR of 0.49, and a BMI of2.3 kg/m2.
cknowledgment
e are grateful to the Bureau of Health Promotion,aiwan who provided the database.
eferences
[1] The National Health Research Institutes. Nutrition andhealth survey in Taiwan; 2009. Taipei. Available from:http://www.nahsit.nhri.org.tw [accessed 21.02.13].
[2] Bureau of Health Promotion. 2007 survey on theprevalence of hypertension, hyperglycemia and hyper-lipidemia in Taiwan; 2007. Taipei. Available from: www.bhp.doh.gov.tw/BHPNet/Portal/File/ [accessed 23.05.13].
[3] Vanhala MJ, Pitkäjärvi TK, Kumpusalo EA, Takala JK. Obesitytype and clustering of insulin resistance-associated cardio-vascular risk factors in middle-aged men and women. Int JObes 1998;22(4):369—74.
[4] Cikim AS, Ozbey N, Orhan Y. Relationship betweencardiovascular risk indicators and types of obesity in over-
Please cite this article in press as: Chu F-L, et al. Lowerdictors of hypertension and diabetes mellitus in premenophttp://dx.doi.org/10.1016/j.orcp.2014.08.001
weight and obese women. J Int Med Res 2004;32(3):268—73.
[5] Thomas GN, Ho SY, Lam KSL, Janus ED, Hedley AJ,Tai HL. Impact of obesity and body fat distribution on
[
PRESS7
cardiovascular risk factors in Hong Kong Chinese. Obes Res2004;12(11):1805—13.
[6] Abolfotouh MA, Al-alwan IA, Al-rowaily MA. Prevalenceof metabolic abnormalities and association with obesityamong Saudi college students. J Hypertens 2012 [online].
[7] Ying X, Song ZY, Zhao CJ, Jiang Y. Body mass index, waistcircumference, and cardiometabolic risk factors in youngand middle-aged Chinese women. J Zhejiang Univ Sci B2010;11(9):639—46.
[8] Lin WY, Liu CS, Chen CY, Lee LT, Huang KC. Metabolicsyndrome in post-menopausal women. Taiwan J GeriatrGerontol 2005;1(1):26—33.
[9] Kulie T, Slattengren A, Redmer J, Counts H, Eglash A,Schrager S. Obesity and women’s health: an evidence-basedreview. J Am Board Fam Med 2011;24(1):75—85.
10] Srikanthan P, Seeman TE, Karlamangla AS. Waist—hip-ratioas a predictor of all-cause mortality in high-functioningolder adults. Ann Epidemiol 2009;19(10):724—31.
11] Esteghamati A, Mousavizadeh M, Noshad S, Shoar S,Khalilzadeh O, Nakhjavani M. Accuracy of anthropometricparameters in identification of high-risk patients pre-dicted with cardiovascular risk models. N Am J Med Sci2012;36(1):26—31.
12] Chinese Taipei Association for the Study of Obesity. Avail-able from: http://www.ctaso.org.tw/dietmethod a2.html[accessed 21.02.13].
13] Ashwell M, Gunn P, Gibson S. Waist-to-height ratio is a bet-ter screening tool than waist circumference and BMI foradult cardiometabolic risk factors: systematic review andmeta-analysis. Obes Rev 2012;13(3):275—86.
14] Ashwell M, Hsieh SD. Six reasons why the waist-to-heightratio is a rapid and effective global indicator for healthrisks of obesity and how its use could simplify the interna-tional public health message on obesity. Int J Food Sci Nutr2005;56(5):303—7.
15] International Diabetes Federation. Diabetes atlas; 2006.Available from: http://da3.diabetesatlas.org/indexe3ea.tml [accessed 23.05.13].
16] Bureau of Health Promotion. Taipei: Definition of obesity ofTaiwanese people; 2002. Available from: http://health99.doh.gov.tw/onlinkhealth/BMI.html [accessed 21.02.13].
17] Chu FL, Hsu CH, Jeng C. Low predictability of anthro-pometric indicators of obesity in metabolic syndrome(MS) risks among elderly women. Arch Gerontol Geriatr2012;55(3):718—23.
18] National Heart, Lung, and Blood Institute. The seventhreport of the Joint National Committee on Prevention,Detection, Evaluation, and Treatment of High Blood Pres-sure (JNC 7). Available from: http://www.nhlbi.nih.gov/guidelines/ypertension [accessed 21.05.13].
19] American Diabetes Association. Diagnosing diabetes andprediabetes. Available from: http://www.diabetes.org/diabetes-basics/diagnosis [accessed 21.05.13].
20] Executive Summary of the Third Report of the NationalCholesterol Education Program (NCEP). Expert panel ondetection, evaluation, and treatment of high blood choles-terol in adults (Adult Treatment Panel III). J Am Med Assoc2001;285(19):2486—97.
21] Hosmer DW, Lemeshow S. Applied logistic regression. 2nded. Canada: John Wiley & Sons Inc.; 2001.
22] Cheong KC, Ghazali SM, Hock LK, Yusoff AF, SelvarajahS, Haniff J, et al. Optimal waist circumference cut-offvalues for predicting cardiovascular risk factors in a multi-
ed cutoff points of obesity indicators are better pre-ausal Taiwanese women. Obes Res Clin Pract (2014),
ethnic Malaysian population. Obes Res Clin Pract 2013,http://dx.doi.org/10.1016/j.orcp.2013.03.004 [in press].
23] Xin Z, Liu C, Niu WY, Feng JP, Zhao L, Ma YH, et al. Iden-tifying obesity indicators which best correlate with type
INORCP-384; No. of Pages 8
[
[
[
[
[
[
[
ARTICLE8
2 diabetes in a Chinese population. BMC Public Health2012;12:732.
[24] Tseng CH, Chong CK, Chan TT, Bai CH, You SL, Chiou HY,et al. Optimal anthropometric factor cutoffs for hyper-glycemia, hypertension and dyslipidemia for the Taiwanesepopulation. Atherosclerosis 2010;210(2):585—9.
[25] Lin WY, Lee LT, Chen CY, Lo H, Hsia HH, Liu IL, et al. Opti-mal cut-off values for obesity: using simple anthropometricindices to predict cardiovascular risk factors in Taiwan. IntJ Obes 2002;26(9):1232—8.
[26] Deng WW, Wang J, Liu MM, Wang D, Zhao Y, Liu YQ,et al. Body mass index compared with abdominal obesityindicators in relation to prehypertension and hyper-tension in adults: the CHPSNE study. Am J Hypertens2013;26(1):58—67.
[27] Abolfotouh MA. Validity of indicators of central obesity inthe prediction of diabetes and hypertension. J Diabetes2009;1(s1):25—6.
[28] Li WC, Chen IC, Chang YC, Loke SS, Wang SH, Hsiao KY.Waist-to-height ratio, waist circumference, and body massindex as indices of cardiometabolic risk among 36,642 Tai-wanese adults. Eur J Nutr 2013;52(1):57—65.
[29] Chen CC, Wang WS, Chang HY, Liu JS, Chen YJ. Hetero-geneity of body mass index, waist circumference, andwaist-to-hip ratio in predicting obesity-related metabolicdisorders for Taiwanese aged 35—64 y. Clin Nutr Res2009;28(5):543—8.
[30] Gletsu-Miller N, Kahn HS, Gasevic D, Liang Z, Frediani JK,Torres WE, et al. Sagittal abdominal diameter and visceraladiposity: correlates of beta-cell function and dysglycemiain severely obese women. Obes Surg 2013;23(7):874—81.
Please cite this article in press as: Chu F-L, et al. Lowerdictors of hypertension and diabetes mellitus in premenophttp://dx.doi.org/10.1016/j.orcp.2014.08.001
[31] Pajunen P, Rissanen H, Laaksonen MA, Heliövaara M,Reunanen A, Knekt P. Sagittal abdominal diameter asa new predictor for incident diabetes. Diabetes Care2013;36(2):283—8.
[
Available online at www
ScienceD
PRESSF.-L. Chu et al.
32] Wietlisbach V, Marques-Vidal P, Kuulasmaa K, Karvanen J,Paccaud F. The relation of body mass index and abdomi-nal adiposity with dyslipidemia in 27 general populationsof the WHO MONICA Project. Nutr Metab Cardiovasc Dis2013;23(5):432—42.
33] Zheng T, Gao Y, Tian H. Relationship between bloodlipid profiles and pancreatic islet � cell function inChinese men and women with normal glucose toler-ance: a cross-sectional study. BMC Public Health 2012;12:634.
34] Rajkhowa M, Neary RH, Kumpatla P, Game FL, JonesPW, Obhrai MS, et al. Altered composition of high den-sity lipoproteins in women with the polycystic ovarysyndrome. J Clin Endocrinol Metab 1997;82(10):3389—94.
35] Chang CY, Chen MJ, Yang WS, Yeh CY, Ho HN, Chen SU, et al.Hypoadiponectinemia: a useful marker of dyslipidemia inwomen with polycystic ovary syndrome. Taiwan J ObstetGynecol 2012;51(4):583—90.
36] Berg G, Mesch V, Boero L, Sayegh F, Prada M, Royer M,et al. Lipid and lipoprotein profile in menopausal transi-tion. Effects of hormones, age and fat distribution. HormMetab Res 2004;36(4):215—20.
37] Mesch VR, Boero LE, Siseles NO, Royer M, Prada M, Sayegh F,et al. Metabolic syndrome throughout the menopausal tran-sition: influence of age and menopausal status. Climacteric2006;9(1):40—8.
38] Zhou JL, Lin SQ, Shen Y, Chen Y, Zhang Y, Chen FL.Serum lipid profile changes during the menopausal transi-tion in Chinese women: a community-based cohort study.Menopause 2010;17(5):997—1003.
39] Völler H, Schmailzl KJG, Bjarnason-Wehrens B. Obesity
ed cutoff points of obesity indicators are better pre-ausal Taiwanese women. Obes Res Clin Pract (2014),
and cardiovascular diseases — theoretical backgroundand therapeutic consequences. Z Kardiol 2004;93(7):503—13.
.sciencedirect.com
irect