low carbon building design advice report -...
TRANSCRIPT

Low Carbon Building Design Advice Report for Valleys Church
19/7/2013 by Carbon Management Consultants Ltd
Page 1
Customer Advice Line 0800 085 2005 www.carbontrust.com/energy
RESTRICTED – COMMERCIAL
Low Carbon Building Design Advice Report
Assessment Of Energy Saving Opportunities For
Valleys Church
Prepared for
Phillip Wood
Tabor Baptist Church
Davies Street
Brynmawr
Blaenau Gwent
NP23 4AD
Prepared by
David Thomas
Carbon Management Consultants Ltd
Castle House
Market Street
Laugharne
SA33 4SA
Tel
07548951592 Tel
07939133560
Account manager
Russell Davey Tel
0800 085 2005
CT Ref.
PO Reference
Country
Date
Version
OPP-100667
6030145
Wales
19/7/2013
0.1 Draft
Low Carbon Building Design Advice Report for Valleys Church
19/7/2013 by Carbon Management Consultants Ltd
Page 2
CONTENTS
EXECUTIVE SUMMARY 3
1. INTRODUCTION & BACKGROUND 4
2. RECOMMENDATIONS 5
3. WHERE NEXT AFTER YOUR SURVEY 17
APPENDIX 1 REPORT DETAILS ERROR! BOOKMARK NOT DEFINED.
Low Carbon Building Design Advice Report for Valleys Church
19/7/2013 by Carbon Management Consultants Ltd
Page 3
EXECUTIVE SUMMARY
This report presents the results of a Design Review consultation by phone and email. This survey
and report are provided by the Carbon Trust. The Carbon Trust receives funding from the Welsh
Government.
The agreed scope of work was to provide energy saving advice and savings calculations for the
refurbishment of the Church and attached Café area.
Estimated Carbon Savings
Implementing all of the measures will reduce emissions associated with this building by XXX Tonnes
CO2.
IMPORTANT NOTICE
All costs and savings stated in this report are based on the data available at the time of the report.
For further liability information, see the Important Notice section.

Low Carbon Building Design Advice Report for Valleys Church
19/7/2013 by Carbon Management Consultants Ltd
Page 4
1. INTRODUCTION & BACKGROUND
IMPORTANT NOTICE: Whilst reasonable steps have been taken to ensure that the information contained within this Report
is correct, you should be aware that the information contained within it may be incomplete, inaccurate or may have become
out of date. Accordingly, Carbon Management Consultants Ltd, the Carbon Trust, its agents, contractors and sub-contractors
and the Government make no warranties or representations of any kind as to the content of this Report or its accuracy and,
to the maximum extent permitted by law, accept no liability whatsoever for the same including without limit, for direct,
indirect or consequential loss, business interruption, loss of profits, production, contracts, goodwill or anticipated savings.
Any person making use of this Report does so at their own risk. © Queen’s Printer and Controller of HMSO. Any trademarks,
service marks or logos used in this publication are the property of the Carbon Trust, and copyright is licensed to the Carbon
Trust. Nothing in this publication shall be construed as granting any licence or right to use or reproduce any of the
trademarks, service marks, logos, copyright or any proprietary information in any way without the Carbon Trust prior written
permission. The Carbon Trust enforces infringements of its intellectual property rights to the full extent permitted by law.
The Carbon Trust is a company limited by guarantee and registered in England and Wales under Company Number 04190230
with its Registered Office at: 4th Floor, Dorset House, 27-45 Stamford Street, London SE1 9PY.
1.1. General
This consultation was carried out on 26th June 2013 by David Thomas of Carbon Management
Consultants Ltd. Our main site contact was Philip Wood and Stuart Wheatman.
This report presents the results of a Design Review, which is a single intervention, typically at
detailed design stage, whereby the client will receive consultancy support from a Design Advice
consultant.
1.2. Organisation Background
Situated in Davies Street in the centre of Brynmawr, the Chapel was built in 1835 and was one of
the first to be built in this area. Surprisingly, it is not listed, therefore there are few limitations on
what can be undertaken at the Chapel. The owners have had a full survey performed on the building
and there are various areas which need attention in order to make the building practical for it’s
continued use as a Church building. The main issue is that of damp penetration due to damaged
external render and broken down rainwater goods. The good news is that the roof on the main
building and also the roof on the Sunday School extension have quite recently been replaced, so
there are no problems here.
Internally there are some areas which need attention. The boiler and heating system needs updating
in line with modern heating requirements. There is carpentry repair work to be done where damp
has caused damage, as well as internal plastering and decoration.
1.3. Objectives
To work out the energy saving calculations for
1. Lighting in the main areas
2. Provide Energy savings Calculations on loft insulation
3. Undertake Heat loss Calculations for the Church and Café and estimate the required boiler
size
4. Assess the viability of under floor heating
5. Provide savings on Solar water heating
6. Provide Calculations on PV panels

Low Carbon Building Design Advice Report for Valleys Church
19/7/2013 by Carbon Management Consultants Ltd
Page 5
2. RECOMMENDATIONS
Measure Estimated Identified Annual Savings* Estimated
Cost of
Measure*
Payback
Energy
Savings*
tCO2e
Savings*
Financial
Savings*
kWh tonnes £ £
Lighting in the main areas 2,748 1.44 £329.76 £6,600.00 20.01
The installation of the insulation
above the roof
32,816 6.03 £1,148.56 £3,628.08 3.16
Solar water heating 3,884 0.71 £881.76 £6,000.00 6.80
PV panels 42,100 22.09 £9,586.17 £60,000.00 6.26
Total 81,548 30.27 £11,946.25 £76,228.08 6.38
2.1. Lighting in the main areas
3 main lighting assessments have been undertaken, which are presented in the attached PDF files.
The assessments have been undertaken using Philips LED light fittings, although other fittings can
be substituted, subject to the replacement fittings having a similar Luminous flux (amount of light
from the lamp) and Luminaire efficiency (% of light that actually usefully leaves the fitting). Note
the Cost of measure and therefore the payback is the marginal cost of the LEDs over conventional
T5 or high frequency fittings.
The Chartered Institution of Building Services Engineers (CIBSE) has produced a “Code for Internal
Lighting”. The values below are abstracted from this code to indicate the level of lighting intensity to
be provided in various areas of the Church:
Body of Church (Nave etc) 100 – 200 lux
Pulpit/Lectern 300 lux
Choir Stalls 200 lux
Religiously significant areas (eg Altars etc) 300 lux
Chancel, Sanctuary, Platform 200 lux
Vestries 150 lux
Organ (Music reading facility) 300 lux
General purpose rooms 500 Lux
In the main hall a grid of 5 x 6 suspended 27W LED fittings would supply an average of 195 lux.

Low Carbon Building Design Advice Report for Valleys Church
19/7/2013 by Carbon Management Consultants Ltd
Page 6
In the Café more visually appealing LEDs were chosen, it was found that a grid of 2x 3 of these twin
31W fittings would give an average of 444 lux, which is thought to be sufficient.
In the lower hall, a 3 x 3 grid of 42W suspended tray fittings would give an average light level of
500 lux
Low Carbon Building Design Advice Report for Valleys Church
19/7/2013 by Carbon Management Consultants Ltd
Page 7
Relevant
Publications
CTL027 – How to implement office lighting refurbishment.

Low Carbon Building Design Advice Report for Valleys Church
19/7/2013 by Carbon Management Consultants Ltd
Page 8
2.2. The installation of the insulation above the roof
Currently the building has a suspended ceiling in both areas, (The Café area has a standard
“commercial” type suspended tile ceiling and the Church has an ornate wooden celling. There is no
insulation between this and the un-insulated roof. It is therefore considered that the installation of
insulation will both improve energy efficiency.
The ceiling area was measured off the plans as 86.7 m2 in the café and the church roof of 190m2.
Building Main Church has a roof area of 190m2 suitable for insulating. It was calculated using EN
ISO 6946:2007 and EN ISO 13370:2007, that the existing roof has an insulation U value of 1.5
adding further 300mm of rock wool insulation to improve the insulation U value to 0.14, saving
21,059kWh, and £737 with a payback of 3.09 years.
Building Café has a roof area of 112.34m2 suitable for insulating. It was calculated using EN ISO
6946:2007 and EN ISO 13370:2007, that the existing roof has an insulation U value of 1.5 adding
further 300mm of rock wool insulation to improve the insulation U value to 0.14, saving 11,757kWh,
and £411 with a payback of 3.28 years.
Alternatively, you could install solid board insulation, although you would need about 150mm for an
equivalent amount.
U-value
(W/m²C)
Total
insulation
Thickness(mm)
0.14 305
0.15 285
0.16 265
0.18 235
0.25 170
0.28 150
0.30 140
0.35 120
0.45 90
Relevant
Publications
CTL064 – How to implement roof insulation

Low Carbon Building Design Advice Report for Valleys Church
19/7/2013 by Carbon Management Consultants Ltd
Page 9
2.3. Undertake Heat loss Calculations for the Church and Café and estimate the required boiler size
An estimated heat load assessment has been undertaken and it is thought that 120kW is the
required heat load. Boilers of this size are available, although, due to the likelihood of different
occupancy of the café and main church areas, it might be prudent to have 2 x 60kW boilers, rather
than one 120kW boiler, although this option is £1365 (inc VAT) more than a single boiler there is
likely to be a marginal payback, although it does give some resilience to boiler failure.
Example prices are shown below.
Ideal Evomax 120kw Commercial Wall Hung Condensing Regular Boiler - 205962
Product Code: 113675
Manufacturer Code: 205962
£2,887.53 (£3,465.04 inc VAT)
Ideal Evomax 60kw Commercial Wall Hung Condensing Regular Boiler - 205959
Product Code: 113672
Manufacturer Code: 205959
£2,012.50 (£2,415.00 inc VAT)
The heating Controls should be an optimizer / compensator type, such as a DC1100, which provides
a simple user interface.
Whatever the controller chosen, the new thermostats should be an electronic type that has a heat
differential (i.e. sensing ability) of less than 0.5⁰C, as this will reduce the amount of heating
overshoot and therefore reduce energy consumption. The thermostat should be positioned in a site
that is representative of the temperature of the building or area to be controlled, about 1.5m (5ft)
off the floor, in a position out of direct sunlight and in an area that is not affected by process heat
gains or draughts. With the DC100, there is the ability to connect two sensors in parallel effectively
averaging out the reading across both of them.
An optimum start controller can be incorporated into the suggested controller, which adjusts start
times automatically for each of the areas of the building controlled and gives typical fuel savings of
10%. It can be set to provide a night-time setback temperature and then will optimise the preheat
time necessary to the required daytime temperature. The suggested controller can also be set up to
provide features such as optimum stop, day economy (reducing the heating when the outside air
temperature reaches a certain level) and automatic frost protection. Additionally it is recommended
that compensator controls are set up on the controller (which varies the water temperature flowing
in the radiators relative to outside air temperatures) this helps reduce over heating in areas not
directly controlled by a thermostat.
With an optimiser controller, you programme in the occupancy hours and the occupancy
temperature required and it then calculates how quickly the building will be able to heat up to that
temperature, rather than you having to guess.

Low Carbon Building Design Advice Report for Valleys Church
19/7/2013 by Carbon Management Consultants Ltd
Page 10
It is suggested that the radiators in the areas not directly controlled by a thermostat, have a TRV
fitted to them, to allow for both independent temperature control of the areas, and to reduce
overheating potential.
If it is deemed that the Café has the longest occupancy place the main controller and thermostats in
this area, then in the main upper and lower halls, it is suggested that the heating to this areas are
controlled by two port valves, connected to a standard electronic thermostat with built in 7 day
timer, this will allow you to vary the times that these areas are heated. However, ensure that the
“start” times on these will have to have guessed “warm up” periods as they are not going to be
optimizers. This will however, give you the best overall control, reducing costs.
Alternatively, as the smaller, less well occupied rooms will have, radiators with TRVs fitted, you
could fit the new electronic TRVs with built in timer programmers, which will allow you to specify a
occupancy and setback temperature and time for each radiator, therefore ensuring that each
radiator or room will be its own individually controlled zone! Each electronic TRV costs from £25(on
top of the cost of the TRV valve itself).
Relevant
Publications
CTL035 – How to implement optimum start control
CTL040 – How to implement thermostatic radiator valves
CTL043 – How to implement heating zone controls

Low Carbon Building Design Advice Report for Valleys Church
19/7/2013 by Carbon Management Consultants Ltd
Page 11
2.4. Assess the viability of under floor heating
The building is not suitable for underfloor heating. The problem is that there is the simple fact that
there is too much heat loss in the building per unit floor area.
Put simply, the heat loss is 120kW or 120,000W, the floor area is in total 466.9m2.Therefore the
average heat loss per meter squared is 257W/m2. Underfloor heating gives a maximum output of
100W/m2, realistically only 80W/m2 therefore, you will get less than half of the required heat output
from underfloor heating.
It is therefore suggested that you install a wet radiator based system.
For the same reason, and due to lack of space in the rear courtyard, an Air source heat pump
system is discounted.
Low Carbon Building Design Advice Report for Valleys Church
19/7/2013 by Carbon Management Consultants Ltd
Page 12
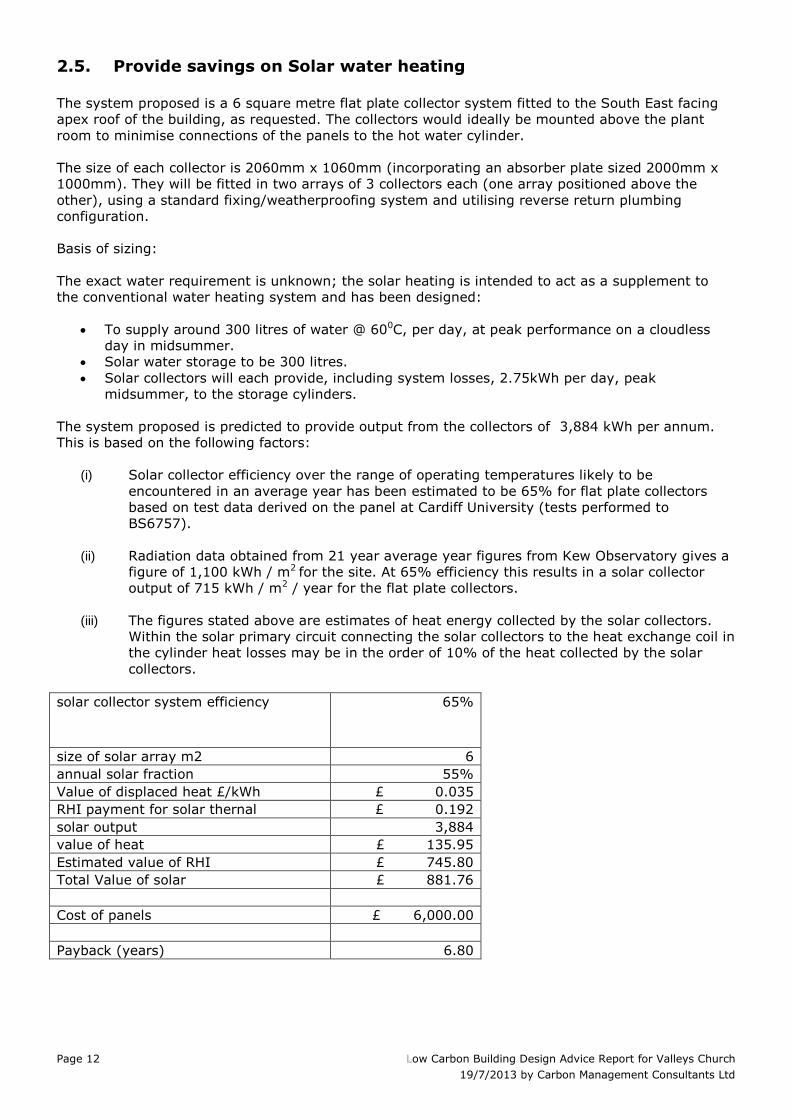
2.5. Provide savings on Solar water heating
The system proposed is a 6 square metre flat plate collector system fitted to the South East facing
apex roof of the building, as requested. The collectors would ideally be mounted above the plant
room to minimise connections of the panels to the hot water cylinder.
The size of each collector is 2060mm x 1060mm (incorporating an absorber plate sized 2000mm x
1000mm). They will be fitted in two arrays of 3 collectors each (one array positioned above the
other), using a standard fixing/weatherproofing system and utilising reverse return plumbing
configuration.
Basis of sizing:
The exact water requirement is unknown; the solar heating is intended to act as a supplement to
the conventional water heating system and has been designed:
To supply around 300 litres of water @ 600C, per day, at peak performance on a cloudless
day in midsummer.
Solar water storage to be 300 litres.
Solar collectors will each provide, including system losses, 2.75kWh per day, peak
midsummer, to the storage cylinders.
The system proposed is predicted to provide output from the collectors of 3,884 kWh per annum.
This is based on the following factors:
(i) Solar collector efficiency over the range of operating temperatures likely to be
encountered in an average year has been estimated to be 65% for flat plate collectors
based on test data derived on the panel at Cardiff University (tests performed to
BS6757).
(ii) Radiation data obtained from 21 year average year figures from Kew Observatory gives a
figure of 1,100 kWh / m2 for the site. At 65% efficiency this results in a solar collector
output of 715 kWh / m2 / year for the flat plate collectors.
(iii) The figures stated above are estimates of heat energy collected by the solar collectors.
Within the solar primary circuit connecting the solar collectors to the heat exchange coil in
the cylinder heat losses may be in the order of 10% of the heat collected by the solar
collectors.
solar collector system efficiency 65%
size of solar array m2 6
annual solar fraction 55%
Value of displaced heat £/kWh £ 0.035
RHI payment for solar thernal £ 0.192
solar output 3,884
value of heat £ 135.95
Estimated value of RHI £ 745.80
Total Value of solar £ 881.76
Cost of panels £ 6,000.00
Payback (years) 6.80

Low Carbon Building Design Advice Report for Valleys Church
19/7/2013 by Carbon Management Consultants Ltd
Page 13
Variation of performance with orientation and tilt

Low Carbon Building Design Advice Report for Valleys Church
19/7/2013 by Carbon Management Consultants Ltd
Page 14
2.6. Provide Calculations on PV panels
Solar cells convert energy from sun light (direct and to a lesser extent diffuse) into direct current
(DC) electricity via the photovoltaic effect. Photovoltaic modules (also called solar or PV panels), are
made of multiple interconnected solar cells; these modules are linked together to form an array.
Most PV arrays use an inverter to convert the DC power produced by the modules into alternating
current (AC) that can connect into the existing infrastructure to power lights, motors, and other
loads.
The Department of Energy and Climate Change (DECC) has used powers in the Energy Act 2008 to
introduce a system of feed-in tariffs (FIT) to incentivise small scale, low carbon electricity
generation. The FIT scheme went live on 1 April 2010. Through the use of FITs DECC hope to
encourage deployment of additional low carbon electricity generation, particularly by organisations,
businesses, communities and individuals who are not traditionally engaged in the electricity market.
This “clean energy cash back” will allow many people to invest in small-scale low carbon electricity,
in return for a guaranteed payment both for the electricity they generate and export.
The Feed-in Tariff scheme is based on a few key elements:
The contract term is 20 years for solar photovoltaic projects: this means that, on
commissioning the tariff rate you receive is guaranteed for the 25 years for Solar PV
generators (reduced to 20 years from the 1st August 2012).
The tariff made available to generators will be subject to digression. That is, the tariff level
available for new generators will decrease with each review. The rate of digression will vary
by renewable energy technology. The price for individual renewable energy generating plants
is fixed once the plant becomes operational.
Costs for the programme will be borne by all British electricity consumers proportionally: all
consumers will bear a slight increase in their annual bill, thus allowing electricity utilities to
buy renewable energy generated from green sources at above-market rates set by the
government.
The new UK's Feed-in Tariff Programme review is scheduled for 2013.
When the government review the current Feed-in Tariff in 2012/2013 they are expected to
reduce the amount paid out and continue to reduce it every quarter.
Solar PV is a very visible indication of an organisations commitment to reducing its carbon footprint.
Whilst other energy saving measures such as pipe insulation give much quicker paybacks and
require lower levels of investment, they are often not noticed by employees and others.
The economics for solar PV rely heavily on the support given under the Government’s feed in tariff.
3 options have been considered, and it is recommended to go with a 50kW system for the following
reasons.
It provides for the best balance between reduced capital cost of installation and value of
resultant power (both from FITs and offsetting current grid electrical load).
It is the only solution where you can optimise the output of the panels with regards to
orientation and location.
At level of investment you can arrange for specialist “Green” investment banks to fully fund
the investment.

Low Carbon Building Design Advice Report for Valleys Church
19/7/2013 by Carbon Management Consultants Ltd
Page 15
4kW costs approx. £5,500 (ex VAT), is 16x 250W panels, the size of which is approx. 1640mm x
992mm,
so 4kW covers approx. 26m2
10kW costs approx. £12,500 (Ex VAT) 40 x 250w panels, the size of which is approx. 1640mm x
992mm,
so 10kW covers 65m2
50kW costs approx. £60k (ex VAT) 200 x 250W panels, the size of which is approx. 1640mm x
992mm, so 50kw covers 325m2, likely to be say 2 rows 50m long, each row 2 panels high, the
panels can be mounted off the ground.
Estimated area 15m deep by 30m long on main SW facing roof
This can accommodate a 50kW PV system
PVGIS estimates of solar electricity generation
Location: 51°47'56" North, 3°10'28" West, Elevation: 354 m a.s.l.,
Solar radiation database used: PVGIS-CMSAF
Nominal power of the PV system: 1.0 kW (crystalline silicon)
Estimated losses due to temperature and low irradiance: 7.5% (using local ambient temperature)
Estimated loss due to angular reflectance effects: 3.3%
Other losses (cables, inverter etc.): 14.0%
Combined PV system losses: 23.1%
Fixed system: inclination=35°,
orientation=45° (SW)
Month Ed Em Hd Hm
Jan 0.80 24.9 0.99 30.6
Feb 1.37 38.3 1.69 47.3
Mar 2.45 75.8 3.08 95.4
Apr 3.39 102 4.38 131

Low Carbon Building Design Advice Report for Valleys Church
19/7/2013 by Carbon Management Consultants Ltd
Page 16
May 3.63 113 4.78 148
Jun 3.73 112 4.97 149
Jul 3.46 107 4.66 144
Aug 3.06 94.8 4.10 127
Sep 2.53 75.8 3.32 99.6
Oct 1.57 48.8 2.01 62.4
Nov 1.00 29.9 1.24 37.3
Dec 0.66 20.5 0.81 25.2
Yearly
average 2.31 70.2 3.01 91.5
Total
for year 842 1100
Ed: Average daily electricity production from the given system (kWh)
Em: Average monthly electricity production from the given system (kWh)
Hd: Average daily sum of global irradiation per square meter received by the modules of the given
system (kWh/m2)
Hm: Average sum of global irradiation per square meter received by the modules of the given system
(kWh/m2)
PVGIS © European Communities, 2001-2012
Reproduction is authorised, provided the source is acknowledged
See the disclaimer here
Therefore, the output of the panels for your building are estimated to be 42,100.00kWh, with a
payback of 6.26 years. Although it is to be noted that the income from the Feed in Tariff, is subject
to the current FIT rate. Ofgem has confirmed the feed-in tariff rates (FiT) for solar photovoltaic
technology for the period starting 1 July 2013 until 1 October 2013. The rate used is the current one
and is stated below.
PV size Estimated
Cost Ex VAT
kWh
Generated
FIT Income Elec Offset Total Income Payback
50kW £60,000 42,100.00 £ 5,291.97 £ 4,294.20 £ 9,586.17 6.26
Energy
Source
Scale Type / Rate Tariff
(p/kWh)
Solar PV >10 - 50kW Higher rate 12.57

Low Carbon Building Design Advice Report for Valleys Church
19/7/2013 by Carbon Management Consultants Ltd
Page 17
3. WHERE NEXT AFTER YOUR SURVEY
As part of the survey delivery process you will receive a supplement containing additional generic
information. This is intended to complement your survey report and provide further information to
enable you to implement the opportunities identified.
The supplement is divided into four sections;
Preparation for your Survey
The survey Process
Implementation: advice and support
Implementation: financial Support
Please contact your account manager if you do not receive your site survey supplement.