louisiana public postsecondary education tuition and state aid policies overview august 19, 2011
TRANSCRIPT

Louisiana Public Postsecondary Education
Tuition and State Aid Policies
Overview
August 19, 2011

Tuition

Tuition Policy
• 1974 Constitution/Act 313 of 1975 – authority to system management boards
• 1995 Constitutional amendment – 2/3 vote of legislature
• Act 1105 of 2003 – Regents to study/formulate tuition/fee policy

Tuition Policy
• 2005 Tuition Policy – adopted by Regents, not approved by Legislature– Six-year plan to yield adequate revenue,
predictable/reasonable charges– Included a financial aid component
• Act 918 of 2008 – Regents 3,4,5 Plan, JLCB approval
• Act 741 of 2010 (GRAD Act) – six-year plan to grant tuition authority to institutions in return for performance

2011-12 Tuition Rates 4-yearCompared to Peer Rates
LSU ULL
UNO
LaTech
SUBR
ULM SLU
GSUM
SU NSULS
US
Nicholls
SUNO
LSUA
$0.00$1,000.00$2,000.00$3,000.00$4,000.00$5,000.00$6,000.00$7,000.00$8,000.00$9,000.00
$10,000.00
La InstPeers
Gaps range from -13.5% to -40.0%
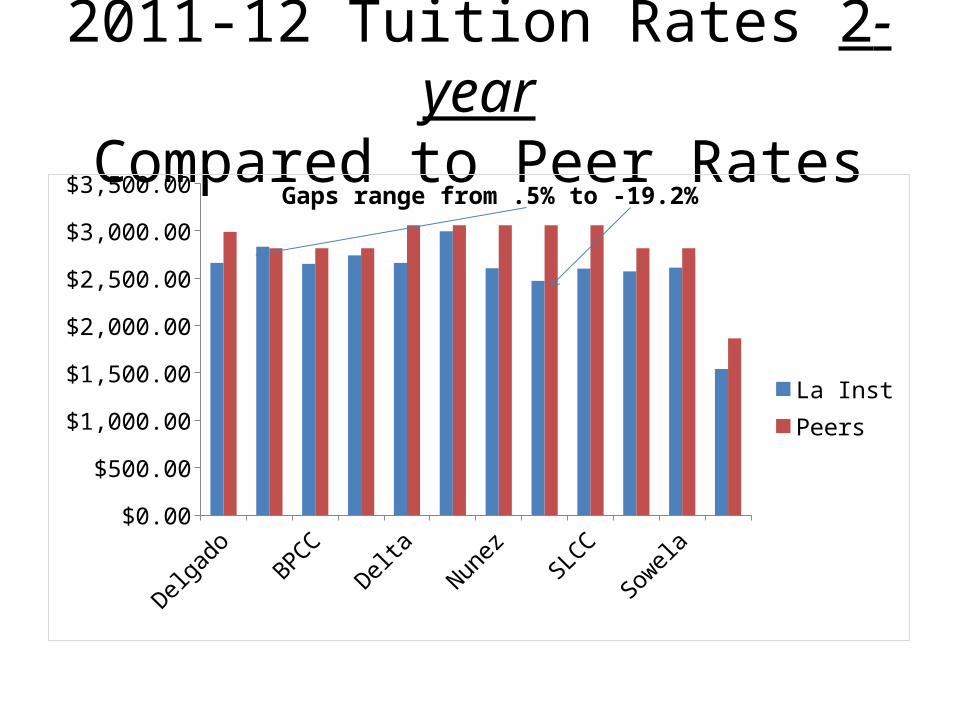
2011-12 Tuition Rates 2-yearCompared to Peer Rates
Delgado
BRCCBPCC
LSUE
Delta SUS
NunezRPCC
SLCC
Fletch
er
Sowela LT
C$0.00
$500.00
$1,000.00
$1,500.00
$2,000.00
$2,500.00
$3,000.00
$3,500.00
La InstPeers
Gaps range from .5% to -19.2%

Student Financial Assistance
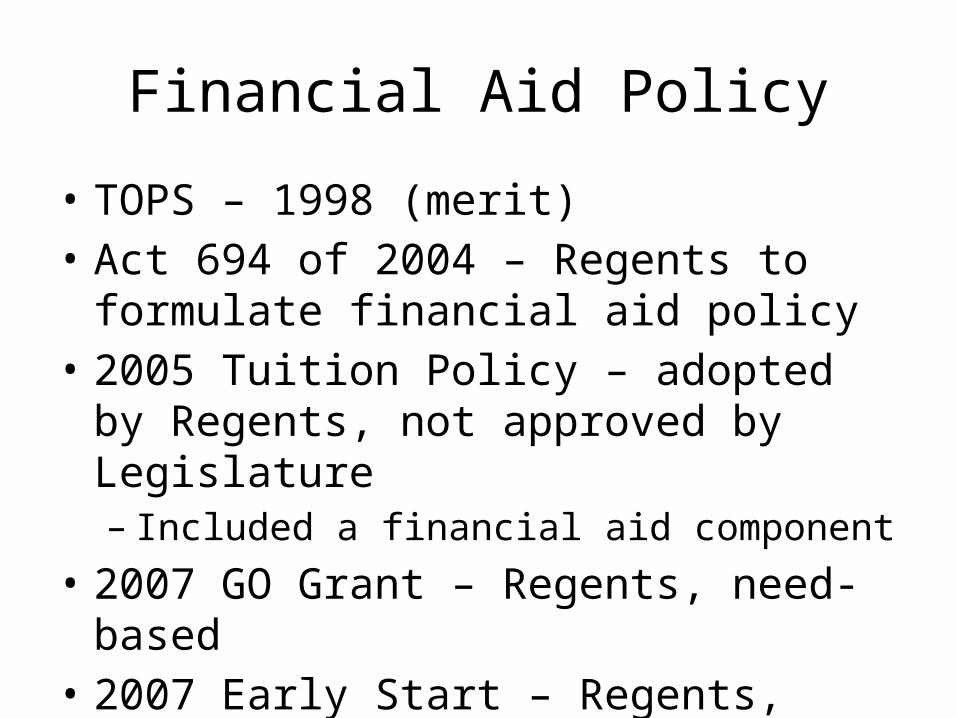
Financial Aid Policy
• TOPS – 1998 (merit)• Act 694 of 2004 – Regents to formulate
financial aid policy• 2005 Tuition Policy – adopted by Regents, not
approved by Legislature– Included a financial aid component
• 2007 GO Grant – Regents, need-based• 2007 Early Start – Regents, dual enrollment

2011-2012 Appropriation
TOPS, $154,375,000
85%
LEAP, $1,000,000
1%
Go Grant, $26,429,108
14%
TOPS LEAP Go Grant
Need Based AidMerit Based Aid
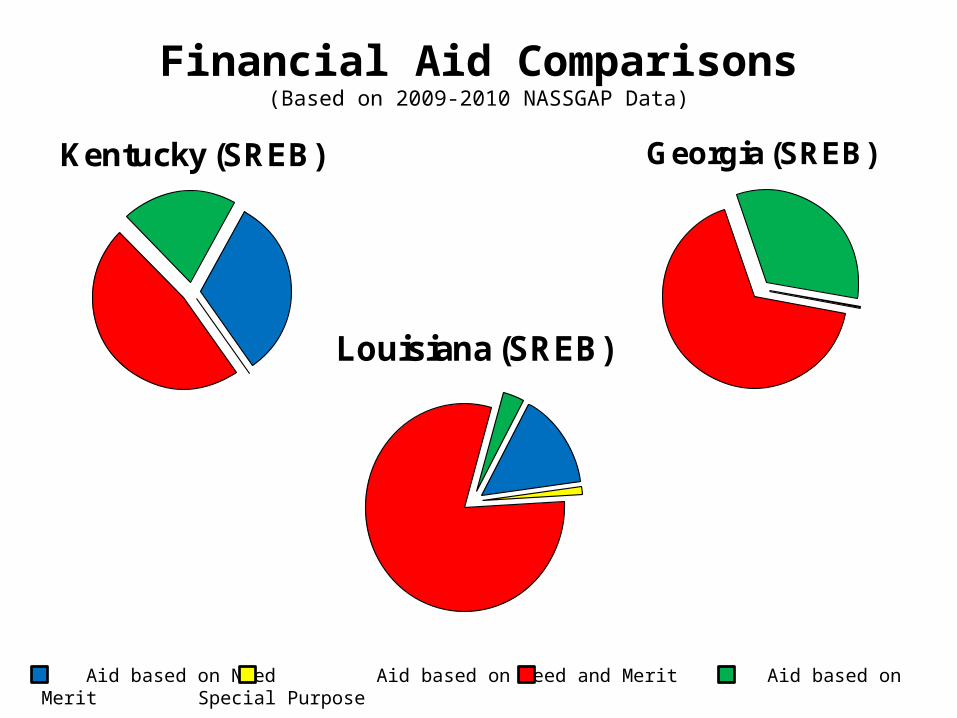
Aid based on Need Aid based on Need and Merit Aid based on Merit Special Purpose
Georgia (SREB)
Financial Aid Comparisons(Based on 2009-2010 NASSGAP Data)
Louisiana (SREB)
Kentucky (SREB)

Student Aid Sources
• Federal
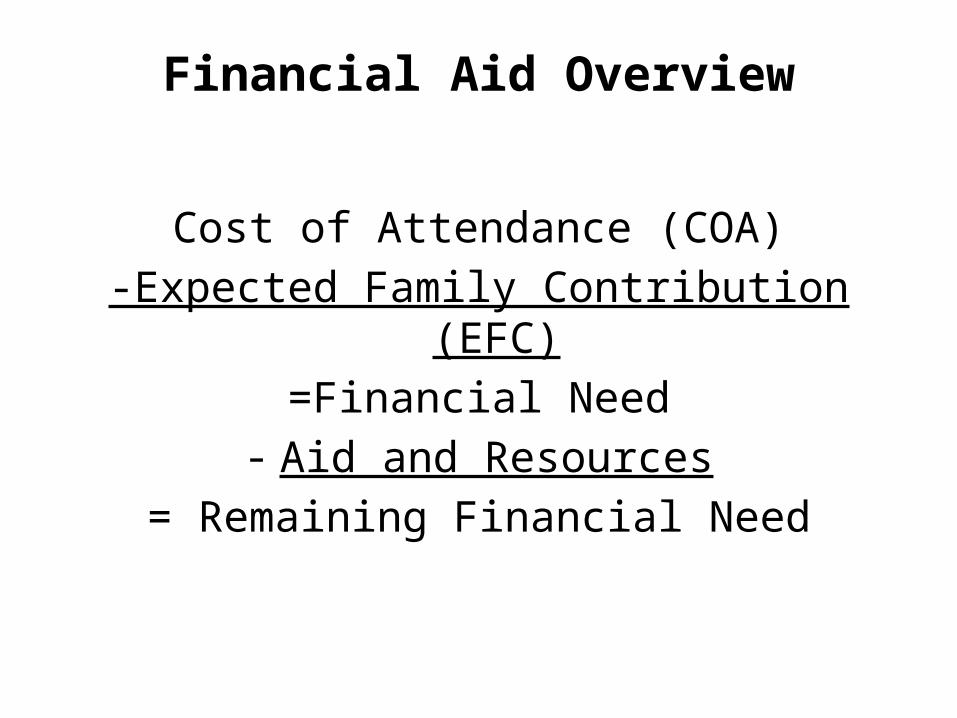
Financial Aid Overview
Cost of Attendance (COA)
-Expected Family Contribution (EFC)
=Financial Need- Aid and Resources
= Remaining Financial Need

• Cost of Attendance (COA) – set by school– Tuition and Fees– Books and Supplies– Room and Board– Transportation – Personal Expenses
National Average for 4 year public = $17,417
Louisiana Public 4-Year Average = $15,514
National Average for 2 year public = $13,126
Louisiana Public 2-Year Average = $ 9,160
Financial Aid Overview
1998
-99
1999
-00
2000
-01
2001
-02
2002
-03
2003
-04
2004
-05
2005
-06
2006
-07
2007
-08
2008
-09
2009
-10
2010
-11
2011
-12
$2,000
$2,500
$3,000
$3,500
$4,000
$4,500
$5,000
$5,500
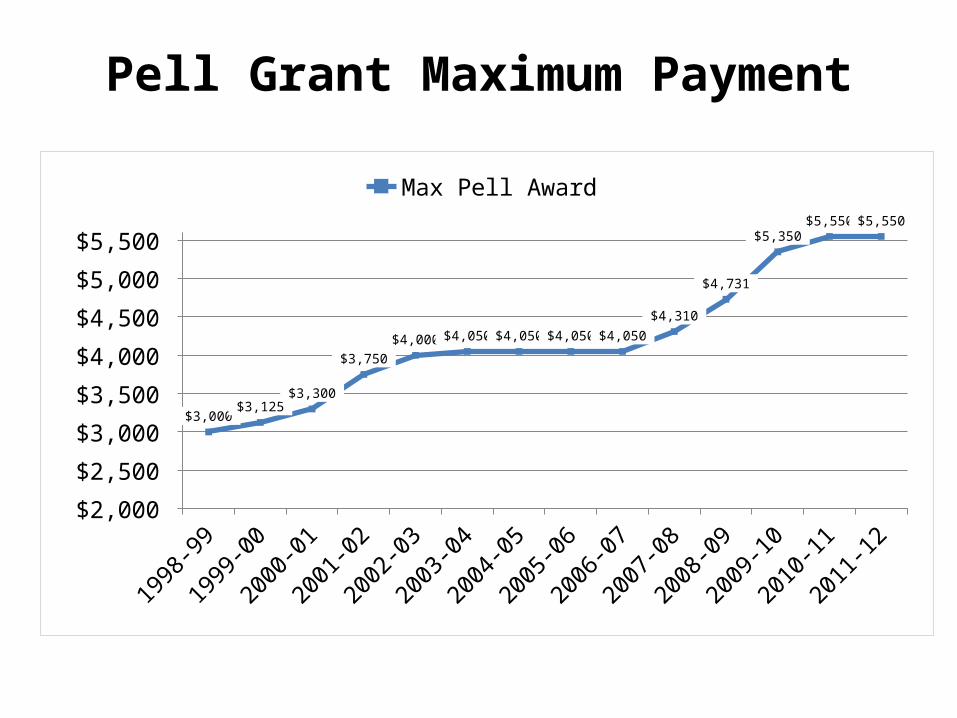
$3,000 $3,125
$3,300
$3,750
$4,000 $4,050 $4,050 $4,050 $4,050
$4,310
$4,731
$5,350 $5,550 $5,550
Max Pell Award
Pell Grant Maximum Payment

Pell Grant Maximum Payment and Tuition and Fees Comparison
1998-99
1999-00
2000-01
2001-02
2002-03
2003-04
2004-05
2005-06
2006-07
2007-08
2008-09
2009-10
2010-11
$2,000
$3,000
$4,000
$5,000
$6,000
$7,000
$8,000
The data is enrollment weighted, current dollars tuition and fees for public four-year schools for the nation, Louisiana and College Board southern region respectively. The source of the data is The College Board Annual Survey of Colleges.
Max Pell Award Nation South Louisiana 4-year Public

104,346 Louisiana Undergraduates Received
Pell Grant Awards Totaling $406,082,677 2009-2010 Academic Year
Less than $1,200
$1,200 to $2,999
$3,000 to $4,199
$4,200-$5,349
$5,350 Over Award
0
5,000
10,000
15,000
20,000
25,000
30,000
35,000
6,792
34,368
14,972
9,798
24,917
13,499
Maximum Pell Grant for the 2009-2010 Award Year was $5,350.
7% 33% 14% 9% 24% 13%

Student Aid Sources
• State

TOPS Expenditures and Recipients
$54.0
$67.5
$90.3
$104.0 $104.6$110.5
$117.1 $116.9 $120.6 $116.7$123.0
$130.7
$144.4$154.4
23,661
29,265
35,83340,983 40,199 41,464 42,573 42,621 43,716 42,254 42,282 43,048 43,288 43,341
0
10,000
20,000
30,000
40,000
50,000
60,000
70,000
80,000
90,000
$0
$20
$40
$60
$80
$100
$120
$140
$160
$180
1998-99 1999-00 2000-01 2001-02 2002-03 2003-04 2004-05 2005-06 2006-07 2007-08 2008-09 2009-10 2010-11 2011-12
TOPS Awards TOPS Recipients
Academic Year
As of October 30, 2009
Note: The 2011-12 Academic Year data shows the amount appropriated and projected to be expended for the year and the projected number of recipients.
$ in Millions Students

Go Grant Expenditures and Recipients
$17.0
$25.8 $24.5 $25.1 $26.4
10,46115,973
22,440
30,774 27,924
0
10,000
20,000
30,000
40,000
50,000
$0
$5
$10
$15
$20
$25
$30
2007-08 2008-09 2009-10 2010-11 2011-12
Go Grant Awards Go Grant Recipients
Academic Year
As of August 4, 2011
Note: The 2011-12 Academic Year data shows the amount appropriated and projected to be expended for the year and the projected number of recipients.
$ in Millions Students
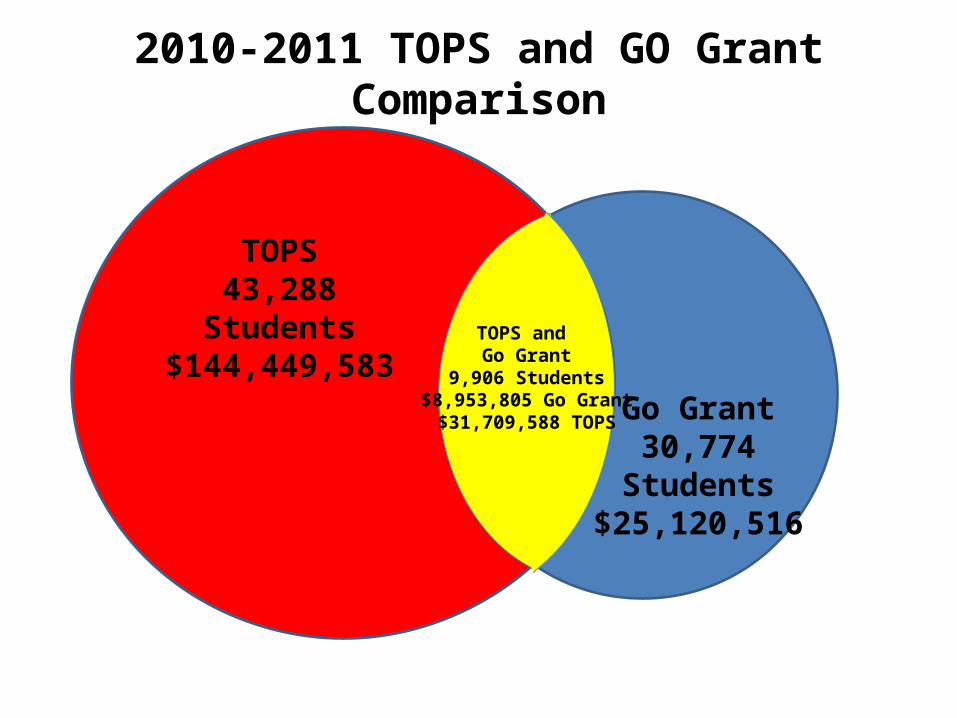
2010-2011 TOPS and GO Grant Comparison
TOPS43,288
Students$144,449,583
Go Grant30,774
Students$25,120,516
TOPS and Go Grant
9,906 Students$8,953,805 Go Grant$31,709,588 TOPS
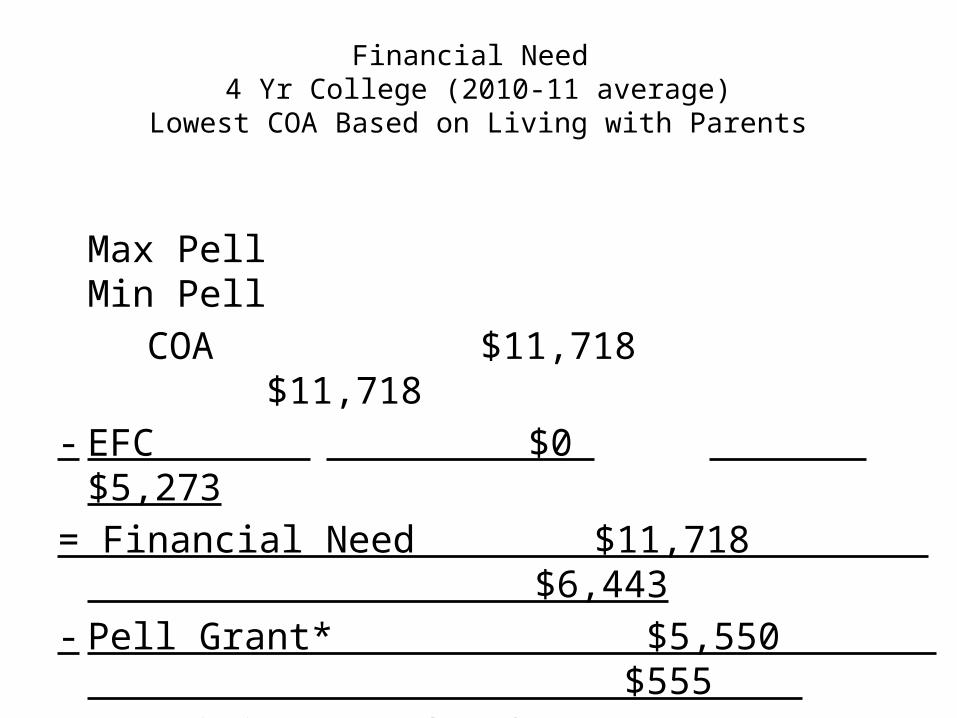
Financial Need 4 Yr College (2010-11 average)
Lowest COA Based on Living with Parents
Max Pell Min Pell COA $11,718 $11,718- EFC $0 $5,273= Financial Need $11,718 $6,443- Pell Grant* $5,550 $555 = Remaining Need $6,168 ** $5,890**
*EFC = 0 – 5273, student qualifies for Pell Grant of $5550 - $555**$2000 GO Grant funds approximately 1/3 of unmet need , on
average , at a 4 year public institution.

Financial Need 2 Yr Community College (2010-11 average)
Lowest Cost COA Based on Living with Parents
Max Pell Min Pell COA $9,647 $9,647- EFC $0 $5,273= Financial Need $9,647 $4,374- Pell Grant* $5,550 $555 = Remaining Need $4,097** $3,819**
*EFC = 0 – 5273, student qualifies for Pell Grant of $5550 - $555**$2000 GO Grant funds approximately ½ of unmet need, on
average, at a 2 year community college.

Financial Need LA Technical College (2010-2011)
Lowest Cost COA Based on Living with Parents
Max Pell Min Pell
COA $8,414 $8,414- EFC $0 $5,273= Financial Need $8,414 $3,141 - Pell Grant* $,550 $555 = Remaining Need $2,864 $2,586 *EFC = 0 – 5273, student qualifies for Pell Grant of $5550 - $555**$2000 GO Grant funds approximately ¾ of unmet need, on
average, at the Louisiana Technical College.

Early Start Expenditures and Recipients
$3.6$4.0
$5.6$6.0
$5.5
7,163
9,729
13,841
16,030
9,166
02,0004,0006,0008,00010,00012,00014,00016,00018,00020,000
$0
$1
$2
$3
$4
$5
$6
$7
2007-08 2008-09 2009-10 2010-11 2011-12
Early Start Awards Early Start Recipients
Academic Year
As of August 4, 2011
Notes: (1) The 2008-2009 data only includes state funding for the first half of the year and does not include the cost of the program for the second half of the year that was assumed by the participating colleges and universities. (2) The 2011-12 Academic Year data shows the amount appropriated and projected to be expended for the year and the projected number of recipients.
$ in Millions Students

Financial Aid Research Project