postsecondary education review commission impact of shifting enrollments on resources in louisiana...
TRANSCRIPT

Postsecondary Education Review Commission
Impact of Shifting Enrollments on Resources in Louisiana
September 29, 2009
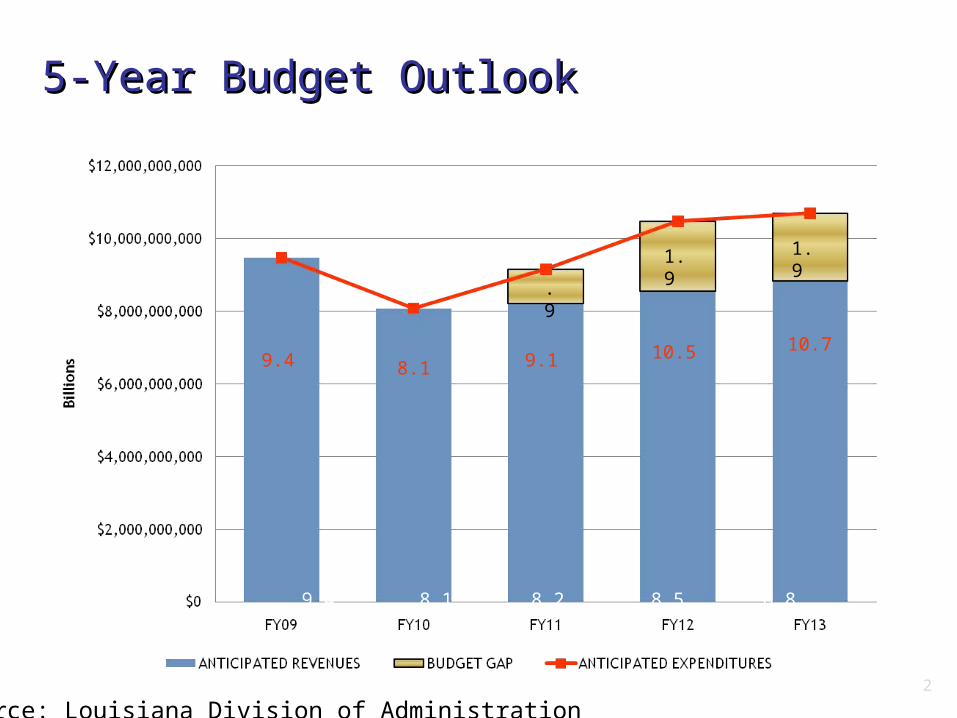
5-Year Budget Outlook5-Year Budget Outlook
2
9.4 8.1 8.2 8.5 8.8
9.4 8.1 9.1 10.5 10.7
.9
1.9
1.9
Source: Louisiana Division of Administration

Postsecondary Education “Budget” Outlook and Issues
• FY2009-10, the current year
– Effective reduction of $120+ million in direct operational funding between State fund reductions and federal stimulus replacement, an 8.7% effective reduction in “State” support but only a 3.3% reduction in overall support
• FY2010-11, next fiscal year
– Uncertainty of outlook
– Recent communication from the Administration to the Postsecondary Education Review Commission projecting a minimum $146 million additional funding reduction
• FY2011-12, the following fiscal year
– Projected “big budget problem”, a State budget shortfall projected at almost $2 billion
– Federal stimulus funding ends

Louisiana Postsecondary Education FundingFY2009-10
By Means of Financing, in Millions of $
State General Fund $1,266.0
ARRA Funds $189.7
Statutory Dedicated Funds $158.7
Self Generated Revenue $820.4
Interagency Transfers $435.9
Federal Funds $177.6
Total $3,048.3

Louisiana Postsecondary Education FundingFY2009-10
By Means of Financing, in Millions of $
State General Fund $1,266.0
ARRA Funds $189.7Statutory Dedicated Funds $158.7Self Generated Revenue $820.4Interagency Transfers $435.9Federal Funds $177.6
Total $3,048.3
LOSFA (TOPS, Go Grant and Dual Enrollment)State General Fund $154.3ARRA Funds $0.0Statutory Dedicated Funds $22.0Self Generated Revenue $0.1Interagency Transfers $2.0Federal Funds $81.5
Total $259.9
Postsecondary Education without LOSFA & Student AssistanceState General Fund $1,111.7ARRA Funds $189.7Statutory Dedicated Funds $136.7Self Generated Revenue $820.3Interagency Transfers $435.8Federal Funds $96.1
Total $2,788.4

Louisiana Office of Student Financial Assistance
and Student Financial Assistance
• TOPS - $130 million
• Go Grant - $34 million
• Dual Enrollment - $5.5 million

Source: Louisiana Board of Regents
Louisiana Postsecondary Education FundingFY2008-09 and FY2009-10
By Means of Financing, in Millions of $
Postsecondary Education Without LOSFA (TOPS, Go Grant & Dual Enrollment)
FY2008-09 After Mid-Yr Reductions FY2009-10 $ Change % Change
State General Fund $1,425.0 $1,111.7 -$313.3 -22.0%ARRA Funds $0.0 $189.7 $189.7"Net" State General Fund Reduction with Stimulus -$123.6 -8.7%Statutory Dedicated Funds $138.1 $136.7 -$1.4 -1.0%Self Generated Revenue $771.5 $820.3 $48.8 6.3%Interagency Transfers $425.6 $433.9 $8.3 2.0%Federal Funds $103.0 $96.1 -$6.9 -6.7%
Total $2,863.2 $2,788.4 -$74.8 -2.6%

Louisiana Postsecondary Education State Funds
Final Budget, FY2008-09
1,040.9
1,263.7
66.2 49.0
122.8 127.7 126.8 128.4 128.1 157.9 155.2 138.1
1,433.3 1,425.0
1,043.6 1,044.0
843.9866.5
927.0961.5
$0
$200
$400
$600
$800
$1,000
$1,200
$1,400
$1,600
99-00 00-01 01-02 02-03 03-04 04-05 05-06 06-07 07-08 08-09
State General Fund Statutory Dedicated
Prior to mid-yr cut 1,476

Louisiana Postsecondary Education State Funds
Final Adopted Budget, FY2009-10
1,040.9
1,263.7
66.2 49.0
122.8 127.7 126.8 128.4 128.1 157.9 155.2 138.1 136.7
961.5927.0
866.5843.9
1,044.01,043.61,111.7
1,425.01,433.3
$0
$200
$400
$600
$800
$1,000
$1,200
$1,400
$1,600
99-00 00-01 01-02 02-03 03-04 04-05 05-06 06-07 07-08 08-09 09-10
State General Fund Statutory Dedicated
Prior to mid-yr cut 1,476
$313.4M General Fund Reduction
after 08-09 mid-yr reduction

Louisiana Postsecondary Education State Funds
Final Adopted Budget, FY2009-10
1,040.9
1,263.7
66.2 49.0
122.8 127.7 126.8 128.4 128.1 157.9 155.2 138.1 136.7
961.5927.0
866.5843.9
1,044.01,043.61,111.7
1,425.01,433.3
$0
$200
$400
$600
$800
$1,000
$1,200
$1,400
$1,600
99-00 00-01 01-02 02-03 03-04 04-05 05-06 06-07 07-08 08-09 09-10
State General Fund Statutory Dedicated
Prior to mid-yr cut 1,476
Federal Stimulus $189.7M
Stimulus Supported
Base $1.3 B

Louisiana Postsecondary Education State FundsFinal FY2009-10 Budget Status and Projected for FY2010-11
965.7M
840.9M
865.1M 934.5M
963.1M 1.04B 1.06B 1.03B
1.12B
1.42B 1.41B
1.11B
130.2M 89.0M 76.8M
146.5M 142.6 137.9M 147.5M 137.0M 171.4M 163.8M 138.2M 136.7M
$0
$200,000,000
$400,000,000
$600,000,000
$800,000,000
$1,000,000,000
$1,200,000,000
$1,400,000,000
$1,600,000,000
99-00 00-01 01-02 02-03 03-04 04-05 05-06 06-07 07-08 08-09 09-10 10-11
General Funds Stat Ded Funds
Minimum $146M SGF Reduction projected for FY10-11

Louisiana Postsecondary Education State FundsFinal FY2009-10 Budget Status and Projected for FY2010-11
965.7M
840.9M
865.1M 934.5M
963.1M 1.04B 1.06B 1.03B
1.12B
1.42B 1.41B
1.11B
130.2M 89.0M 76.8M
146.5M 142.6 137.9M 147.5M 137.0M 171.4M 163.8M 138.2M 136.7M
$0
$200,000,000
$400,000,000
$600,000,000
$800,000,000
$1,000,000,000
$1,200,000,000
$1,400,000,000
$1,600,000,000
99-00 00-01 01-02 02-03 03-04 04-05 05-06 06-07 07-08 08-09 09-10 10-11
General Funds Stat Ded Funds
Federal Stimulus $189.7M
Stimulus Supported
Base$1.155B
Minimum $146M SGF Reduction projected for FY10-11

Louisiana Postsecondary Education State FundsFinal FY2009-10 Budget Status and Projected through 2010-11
1,040.9
1,263.7
961.5927.0
866.5843.9
1,044.01,043.6 965.7
1,111.7
1,425.01,433.3
$0
$200
$400
$600
$800
$1,000
$1,200
$1,400
$1,600
99-00 00-01 01-02 02-03 03-04 04-05 05-06 06-07 07-08 08-09 09-10 10-11
State General Fund Statutory Dedicated
1,301 with Stimulus
1,155 with Stimulus
146M SGF Reduction

Louisiana Postsecondary Education State FundsFinal FY2009-10 Budget Status and Projected for FY2010-11
965.7M
840.9M
865.1M 934.5M
963.1M 1.04B 1.06B 1.03B
1.12B
1.42B 1.41B
1.11B
130.2M 89.0M 76.8M
146.5M 142.6 137.9M 147.5M 137.0M 171.4M 163.8M 138.2M 136.7M
$0
$200,000,000
$400,000,000
$600,000,000
$800,000,000
$1,000,000,000
$1,200,000,000
$1,400,000,000
$1,600,000,000
99-00 00-01 01-02 02-03 03-04 04-05 05-06 06-07 07-08 08-09 09-10 10-11
General Funds Stat Ded Funds
$459.3M General Fund Reduction from 08-09 Level (after $55M mid-year cut)
$146M SGF Reduction

Louisiana Postsecondary Education FundingFY2009-10
By Means of Financing, in Millions of $
FY2009-10State General Fund $1,111.7ARRA Funds $189.7Statutory Dedicated Funds $136.7Self Generated Revenue $820.3Interagency Transfers $433.9Federal Funds $96.1
Total $2,788.4
Specialized Units & Boards
State General Fund $334.8
ARRA Funds $35.6
Statutory Dedicated Funds $91.7
Self Generated Revenue $107.8
Interagency Transfers $425.0
Federal Funds $96.1
Total $1,090.9
4-Year and 2-Year Institution Funding Only
State General Fund $776.9
ARRA Funds $154.1
Statutory Dedicated Funds $45.0
Self Generated Revenue $712.5
Interagency Transfers $8.9
Federal Funds $0.0
Total $1,697.5
With Stimulus Without Stimulus $976.0 $821.9
Institutions Health sciences centersAgricultural centersLaw centersStand-alone research centersBoards and system offices

Four Year/Two Year Institution Enrollment Mix Analysis
FY2008-2009 Full-Time Equivalent (FTE) Enrollment:
Existing Mix of Enrollment FY2008-09
FY2009-10 Final Adopted Budget - "State & Stimulus
Funds"
State and Stimulus Funding
Rates
FY2009-10 Final Adopted Budget -
"State Funds"
State Funding
Rates Only
Four Year Institutions Enrollment 122,608 72.9% 781,159,593$ 6,371$ 656,078,087$ 5,351$
Two Year Institutions Enrollment * 45,582 27.1% 194,877,887$ 4,275$ 165,852,687$ 3,639$
Total FY 2008-2009 FTE Enrollment 168,190 100.0% 976,037,480$ 5,803$ 821,930,774$ 4,887$
Stimulus Funding Loss (154,106,706)$
Difference between 4-Yr and 2-Yr Rates 1,712$
* "Two Year" Institution enrollment and funding include the LTC.

Four Year/Two Year Institution Enrollment Mix Analysis
FY2008-2009 Full-Time Equivalent (FTE) Enrollment:
Existing Mix of Enrollment
FY2008-09
FY2009-10 Final Adopted Budget
- "State & Stimulus Funds"
State and Stimulus Funding
Rates
FY2009-10 Final Adopted Budget -
"State Funds"
State Funding
Rates Only
FY2007-08 SREB
Average State
Funding Rates
Four Year Institutions Enrollment 122,608 72.9% 781,159,593$ 6,371$ 656,078,087$ 5,351$ 7,184$
Two Year Institutions Enrollment * 45,582 27.1% 194,877,887$ 4,275$ 165,852,687$ 3,639$ 4,751$
Total FY 2008-2009 FTE Enrollment 168,190 100.0% 976,037,480$ 5,803$ 821,930,774$ 4,887$
Loss of Stimulus (154,106,706)$
Difference between 4-Yr and 2-Yr Rates 1,712$ 2,433$
* "Two Year" Institution enrollment and funding include the LTC.

Four Year/Two Year Institution Enrollment Mix Analysis
Two Year Institution Enrollment Share:
44.0%
FY2008-2009 Full-Time Equivalent (FTE) Enrollment:
Existing Mix of Enrollment
FY2008-09
FY2009-10 Final Adopted Budget - "State Funds"
State Funding
Rates Only
FY2007-08 SREB
Average State
Funding Rates
Alternative Mix
Resulting Enrollment
Adjusted Enrollment
SREB Average Mix Funded at FY09-10 State
Fund Rates
Four Year Institutions Enrollment 122,608 72.9% 656,078,087$ 5,351$ 7,184$ 56.0% 94,187 -28,421 503,994,734$
Two Year Institutions Enrollment * 45,582 27.1% 165,852,687$ 3,639$ 4,751$ 44.0% 74,004 28,421 269,264,491$
Total FY 2008-2009 FTE Enrollment 168,190 100.0% 821,930,774$ 4,887$ 100.0% 168,190 0 773,259,225$
Loss of Stimulus (154,106,706)$ (48,671,549)$
Difference between 4-Yr and 2-Yr Rates 1,712$ 2,433$
* "Two Year" Institution enrollment and funding include the LTC.

Four Year/Two Year Institution Enrollment Mix Analysis
Two Year Institution Enrollment Share:
44.0%
FY2008-2009 Full-Time Equivalent (FTE) Enrollment:
Existing Mix of Enrollment
FY2008-09Alternative
MixResulting
EnrollmentAdjusted
Enrollment
SREB Average Mix Funded at FY09-10 State
Fund Rates
FY2007-08 SREB
Average State
Funding Rates
SREB Average Mix Funded at SREB Funding
Rates
Four Year Institutions Enrollment 122,608 72.9% 56.0% 94,187 -28,421 503,994,734$ 7,184$ $676,636,224
Two Year Institutions Enrollment * 45,582 27.1% 44.0% 74,004 28,421 269,264,491$ 4,751$ $351,591,689
Total FY 2008-2009 FTE Enrollment 168,190 100.0% 100.0% 168,190 0 773,259,225$ $1,028,227,913
(48,671,549)$ 206,297,139
* "Two Year" Institution enrollment and funding include the LTC.

• Differences in funding approaches between “old” and “new” formulas are significant
• New formula sets values for student credit hour production specifically for each institution, by level of student and discipline of the student credit hour
• Differentials remain in values based upon “type” of institution and its specific costs (SREB category)
• State/student shares of cost are function of “type” of institution (generally 60% or higher share for State @ 4-Yr vs. 70%+ State share @ 2-Yr.)
Analysis of Shifting Enrollment

Analysis of Shifting Enrollment• Analysis is based upon overall enrollment, not just entering freshmen
cohort
• Time will be required to “shift” enrollment in substantial amounts
• Nature of “shift” in mix will depend upon:– Overall growth in enrollment
– Degree of stability in 4-year enrollment
– Degree of growth in 2-year enrollment
• Possible Causes of “shift”– Admissions standards
– Growth in additional students to 2-year institutions
– Enrollment caps at 4-year institutions
– Significant change in “pricing” of respective types of institutions
• “Savings” potential from shifting enrollments:– SREB rates vs. Actual funding rates
– Impact of new formula approach
– Lowest funded 4-year institutions are likely to yield the most significant areas for potential shifts of enrollment, thus less “savings” potential