lou mitton paola morrone - mcmaster.ca · collaboration/joint programs to support student ... how...
TRANSCRIPT

Lou Mitton Paola Morrone

Changes to budget Submission Drivers Strategic Mandate Agreement Funding Formula Review Budget Model Revenue Challenges Hyperion Planning Hyperion Reports
2
What’s driving the change ◦ Provincial initiatives Strategic Mandate Agreement Funding formula review ◦ Budget model ◦ Revenue challenges
Changes to the narrative templates ◦ Activity unit/support unit/ancillary ◦ NASM (space) and budget model drivers ◦ Variance template ◦ Budgeted positions ◦ Organization chart
3

Challenge of directing limited funding to the greatest priorities
What is Driving the Change?
4

Alignment with provincial objectives Promote differentiation between universities Support accountability and sustainability Improve quality and outcomes for students
Strategic Mandate Agreement
5

McMaster’s areas of institutional strength Research and innovation with high societal impact Experiential and/or technology-enabled learning Access, retention and success for underrepresented
groups (Aboriginal, first generation, students with disabilities)
Programs in growth areas (Health Sciences and the broad determinants of health, fostering robust societies, Business and Economics, Science and Engineering, Communications and Culture)
Collaboration/joint programs to support student mobility
Enrolment growth In effect until March 31, 2017
Strategic Mandate Agreement
6

Implications ◦ Future funding will be guided by provincial
priorities and dependent on fulfilling commitments ◦ Increased reporting requirements
Budget Committee decisions will be based on what each envelope is doing to contribute to achievement of SMA objectives
Strategic Mandate Agreement
7

MTCU principles ◦ Enhance quality and improve student experience May replace current performance funding ◦ Support the existing differentiation process Potentially multiple formulas for different universities ◦ Financial sustainability Address concern about demographic decline ◦ Increased transparency and accountability Greater data requirements
Funding Formula Review
8
Timelines ◦ Review announced in March 2015 ◦ Consultation with stakeholders is complete ◦ Report to the province is underway ◦ New Deputy Minister Sheldon Levy starts December
1 ◦ Detailed design phase expected to start early in
2016 ◦ Implementation may coincide with expiry of SMA in
2017
Funding Formula Review
9

Implications ◦ Uncertain and possibly disruptive outcome if there
are winners and losers Budget Committee will be evaluating budget
submissions on sustainability in the event of an unfavourable impact on revenue
Funding Formula Review
10

Overview ◦ All central revenue is allocated to activity units
(Faculties) ◦ Support unit allocations are deducted from the
activity unit revenue based on drivers, which reflect usage
Principles include: ◦ Promote transparency, trust and engagement ◦ Assure financial responsibility, accountability and
fairness ◦ Advance the efficient use of physical and human
resources
Budget Model
11

Implications ◦ All changes in revenue impact Faculty allocations ◦ Greater effort to control costs, especially space ◦ Faculties want to ensure they get value for their
contribution to support units Budget Committee will look at cost drivers,
service levels, and fees for service to determine impacts across the University
Budget Model
12

Demographic decline ◦ Expected to reach 89% of 2013 level in 2021 ◦ Will not recover until 2034
89
60.0
65.0
70.0
75.0
80.0
85.0
90.0
95.0
100.0
105.0
2013
2014
2015
2016
2017
2018
2019
2020
2021
2022
2023
2024
2025
2026
2027
2028
2029
2030
2031
2032
2033
2034
2035
2036
Projected population decline:18-20 year old Ontarians, Indexed: 2013=100
Ministry of Finance Population Projections
Revenue Challenges
13
Implications ◦ Total revenue available will drop with enrolment ◦ Greater competition amongst universities for a
shrinking pool of students Budget Committee will monitor trends in
enrolment, staffing and other benchmarks to make informed decisions about allocations
Revenue Challenges
14

Objective ◦ To provide information about each envelope’s
operations related to current strategic challenges outlined above
Changes to the narrative templates
15
Provides information specific to each type of envelope ◦ Activity units (Faculties) Faculty and student ratios Enrolment trends ◦ Support units Base services and internal fees Cost drivers ◦ Ancillaries Competitive position
Different Narrative Templates
16
Provides information on trends ◦ NASM (net assignable square meters) Utilization of limited resource Potential source of efficiencies ◦ Budget model drivers (support units only) Indicator of cost pressures
NASM and budget model drivers
17

Provides a high-level summary of major changes to each envelope’s operation ◦ Standardized ◦ Focuses on significant items (> $100K and 10%)
Variance Template
Variance Template
18

Provides the trend in steady state employee levels ◦ Shows the impact of decisions made to cope with
changes in demand and revenue constraints ◦ Impact of holding positions vacant is removed
Budgeted Positions
19

Provides an understanding of the scope of the envelope’s operations
Organization Chart
20


PeopleSoft GL
PeopleSoft Pay Roll
PeopleSoft HR
Hyperion
How does Hyperion Planning fit within MOSAIC?
Hyperion Receives Salary
Expense Actuals from GL Monthly
Hyperion Receives Employee
Master Data from HR twice
a year Hyperion Receives
Salaries from Payroll
When GL & PR don’t match
there’s a HEDGE
Hyperion Sends FINAL 8 Month review & Budget to GL

•8 Month Review
•Enter Budget
•Finalize Budget
•Year End
•5 Month Review
•Budget is Finalized
May – June September – October
November – April April – May
How does Hyperion Planning fit within the Budgeting Process?

•8 Month Review
•Enter Budget
•Finalize Budget
•Year End
•5 Month Review
•Budget is Finalized
May – June September – October
November – April
April – May

Gen
erat
e Ex
pens
e Fo
reca
st
Load Actual by Account
Operating Expense
Original Budget / Projection
Surplus/Deficit Appropriations
Revenues Expenses
FOR
ECA
ST

Gen
erat
e Sa
lary
For
ecas
t
DETERMINE INCREASES
LOAD ACTUALS
FORECAST HOURS
SALARIES
HEDGE ACTUALS TO MATCH THE GL
BENEFITS FTE
Salaries Benefits
Stipends
Grade Emp. Group
Step
FOR
ECA
ST

COPY
EDIT ADJUST
BUDGET TO A NEW ACCOUNT Subm
it fo
r App
rova
l
Sa
ve
co
py
to
Ex
cel Fi
le
COMPARE
Adjust at Year or Month Levels
Spread monthly values equally or proportionally
Compare with Actuals
Add Supporting Details
Upda
te B
udge
t & F
orec
ast i
n H
yper
ion

The BIG Picture
The BOTTOM Line Dri
ll D
own
Hav
e a
ques
tion?
– W
e ha
ve a
re
port
for t
hat!

Web Based Report: ◦ YTD Actuals Balance
SmartView: ◦ 5 Month Review form ◦ Actuals By Employee by Account

Automatically Emailed at month end.
Dept Fund Program

5 Month Projection for Current Year
Original Budget for Current Year
YTD Actuals for Current Year

Fund Department Fiscal Year

VariAnce To Budget
Web Based Report: ◦ Monthly Variance
SmartView: ◦ Variance Drill Down Reports: Ancillaries Operating

Provides in‐month and year‐to‐date revenues and expenses with variances to budget and prior year actuals to allow monthly tracking.
Shows the YTD Actual and Budget balances for the current years, as well as variance columns.
Similar to old AM090 report

Double Click for Account Details
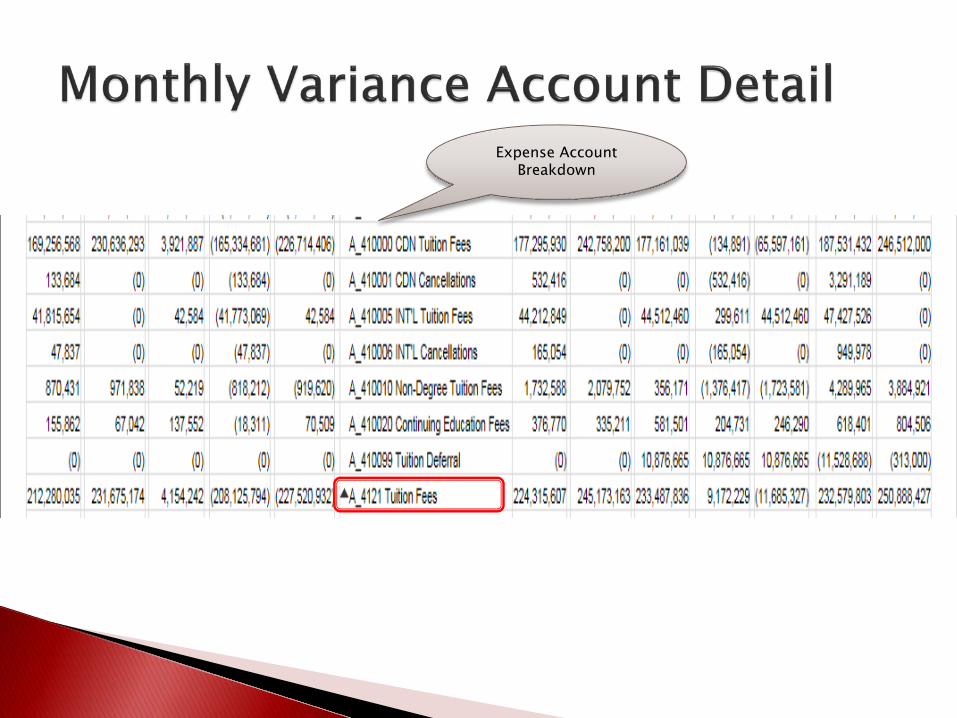
Expense Account Breakdown

Provides Previous year’s actuals, current year’s Original Budget, current Year’s projection and Variances.
Can view at high or detailed levels

Original Budget for Current Year
Current Year Projection
Variance

The BIG Picture The BOTTOM Line
Web Based: ◦ Statement of Operations
SmartView: ◦ J. 8 Month and Budget Review Report

Shows actual revenues and expenses by month, fund and program.
Can run for current or previous years. The budget for the year is shown and the balance
available in the remaining months to meet the budget.
Users can drill into the revenue or expense category down to the individual account level.

By Envelope or Individual Department BIG PICTURE: All Funds, All Programs, All Departments
BOTTOM LINE: Net Income

BOTTOM LINE: Net Income
BOTTOM LINE: FTE

Drill Down SmartView: ◦ Operating and Ancillary Drilldowns ◦ All Funds: Drilldown by Department Drilldown by Account Drilldown by Program

Drill Down to view the Distribution of Expenses amongst Departments

Budgeting Services Website: ◦ http://mcmaster.ca/bms/BMS_FS_Budgeting.htm
Hyperion Reports Catalogue and Guide: ◦ http://mcmaster.ca/bms/pdf/hyp_cat.pdf
Budgeting Services & Hyperion Team
Francois Joubert Chris Sylvester Iain Clarkson Lou Mitton Paola Morrone
joubert sylvest iclarks mittonl morronep
24316 24766 21960 20821 23934