lottery industry updates : pdj - asia pacific lottery .... french... · lottery industry updates :...
TRANSCRIPT

APLA - Annual Regional Conference 19-23rd October 2015
LOTTERY INDUSTRY
UPDATES : PDJ

APLA - Annual Regional Conference 19-23rd October 2015
SAIL WITH KOREA WAVE !

APLA - Annual Regional Conference 19-23rd October 2015
SURF WITH POLYNESIA WAVE !

PRESENTATION
1. THE LOCAL CONTEXT (POLYNESIA & POLYNESIANS)
2. THE COMPANY (SALES, NETWORK & GAMING MODEL)
3. OUR CHALLENGES (SPORTS BETTING & INTERNET)
Thierry GABARRET
Chief Executive Officer - La Pacifique des Jeux, French Polynesia International Relations Director - La Française des Jeux, France Executive Board Member of Internationale des Jeux, France Vice-President of Beijing Zhongcai Printing, China
APLA - Annual Regional Conference 19-23rd October 2015
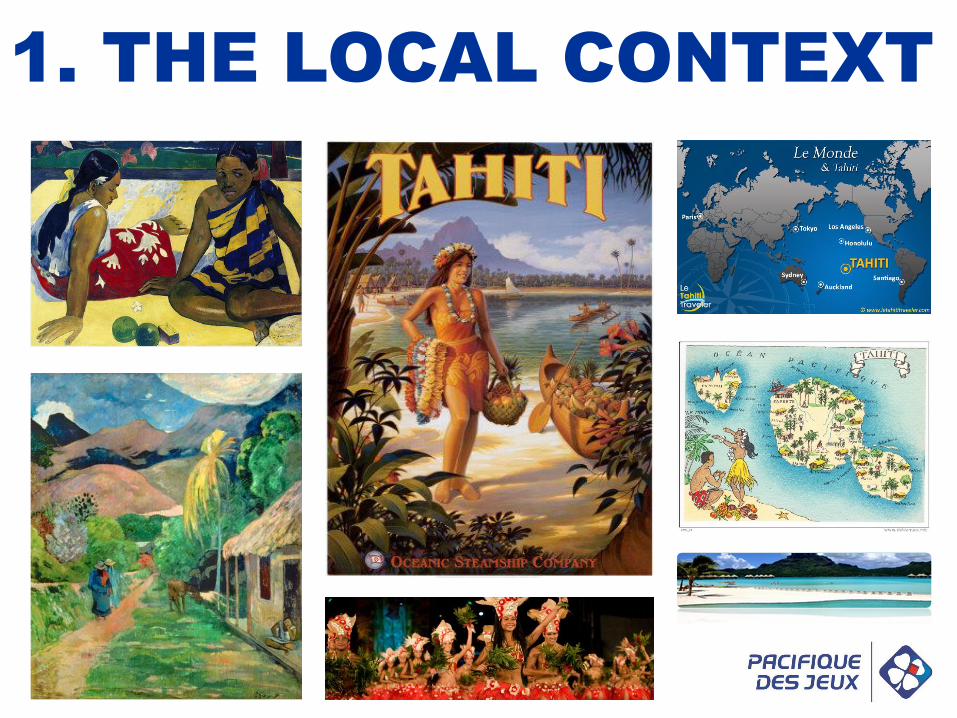
1. THE LOCAL CONTEXT

WHAT IS FRENCH POLYNESIA ?
Society Islands
Marquesas Islands
Tuamotu Archipelago
Austral Islands
Gambier Islands 9,763 miles from Paris
6,606 miles from Seoul
5,897 miles from Tokyo
4,104 miles from L.A.
3,808 miles from Sydney
1767 : descovered by Captain Samuel Wallis
1959 : became a « French Overseas Territory »
1984 : Status of « Internal Autonomy »
Which history ?
Where is it ?
What geography ?
2014 : A long-lasting crisis (since 2008)
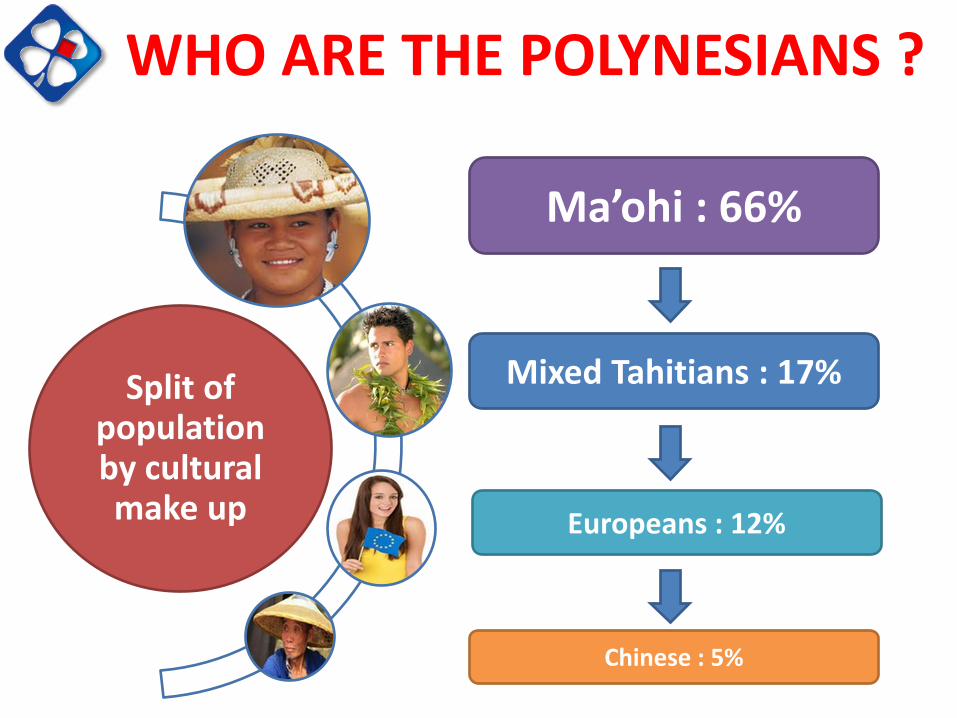
WHO ARE THE POLYNESIANS ?
Split of population by cultural make up
Ma’ohi : 66%
Chinese : 5%
Europeans : 12%
Mixed Tahitians : 17%
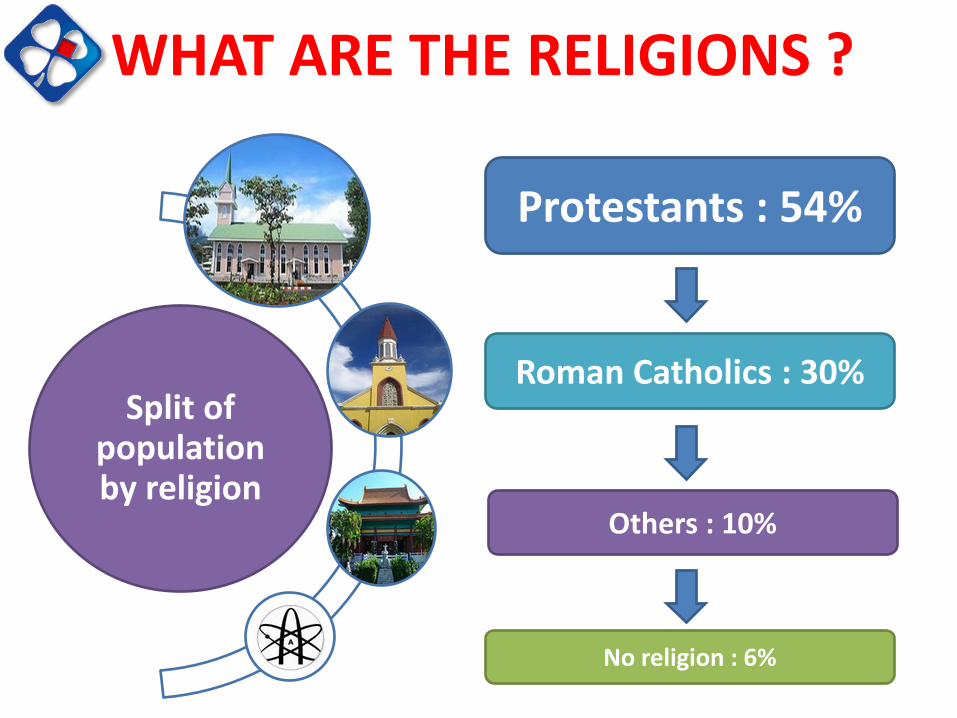
WHAT ARE THE RELIGIONS ?
Split of population by religion
Protestants : 54%
No religion : 6%
Others : 10%
Roman Catholics : 30%

DEMOGRAPHIC DISTRIBUTION
0%
5%
10%
15%
20%
25%
30%
35%
Cambodia Asia F. Polynesia World France Europe
0 - 14 yo
65+ yo
42% of the population is under 20 yo
10% of the population is above 60 yo
Korea
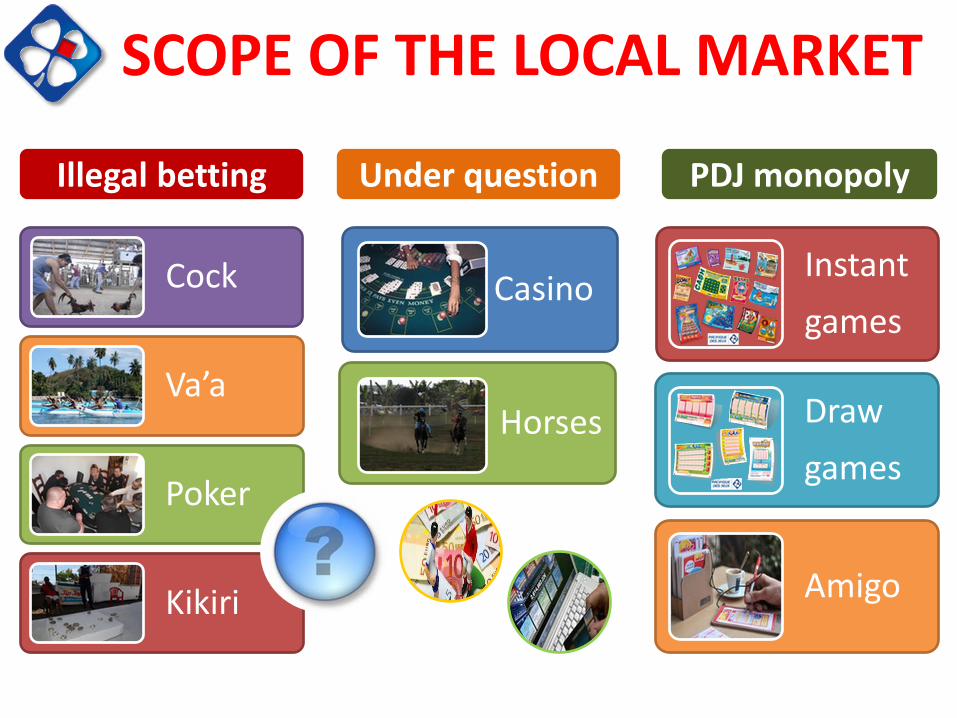
SCOPE OF THE LOCAL MARKET
Cock
Va’a
Poker
Kikiri
Casino
Horses
Instant
games
Draw
games
Amigo
Sport betting
Illegal betting Under question PDJ monopoly

SPECIFIC CULTURAL MAKE UP
Weight of religion Weight of tradition Role of superstition
Necessity to deal with these issues

2. THE COMPANY

Total sales 2014 : €42 M i.e. 0.3% of FDJ total sales (€12.99 bn)
5 draw based games 15 scratch games
KEY FIGURES
100% subsidiary of FDJ (under specific agreement with Polynesian government)
No sports betting
No digital lottery
140 POS over a territory as wide as Europe (0,4% FDJ)
165,000 players (88% of adult pop.)
20 direct employees (137 indirect)

Hinano FREDRIKSEN
Finance & Accounting Manager
Vaiana CONAN
Retail Accounting
Magali TIHONI
General Accounting
Thomas SONNENTRUCKER
Logistics Manager
Caroline PEREZ Mereana VANAA Hinano MANA Thérèse AHINI
Sales Assistants
Patrick GASSION
IT & Security Manager
Orama MONFOUGA Vanessa BISIAUX Manolios CHANG Chantal RERE
Sales Promoters
Myrna LY Noémi TUAIRAU
Control
Thierry GABARRET
Chief Executive Officer
Didier PAUTRAT
Deputy General Manager
Valérie VEDEL
Executive Assistant
Guillaume REYNAUD
Commercial & Marketing Manager
Nastasia LAW
Product Manager
ORGANIZATION CHART

PDJ SALES AND NETWORK Points of sale
TAHITI = 73%
ISLV + BORA = 13%
MOOREA = 7%
TUAMOTU = 4%
AUSTRALES = 2%
MARQUESAS = 1%
1991-1995 1996-2000 2001-2005 2006-2010 31/12/2012
23.5
27.7
37.7
42.7 43,7
Average sales per period of time
In M€
FDJ
PDJ
POS
1991-1995 1996-2000 2001-2005 2006-2010 2011-2014
140 POS compared to 32,700 retailers for FDJ (0.4%)
Sales 2014 : € 42 M compared to € 13 bn for FDJ (0.3%)
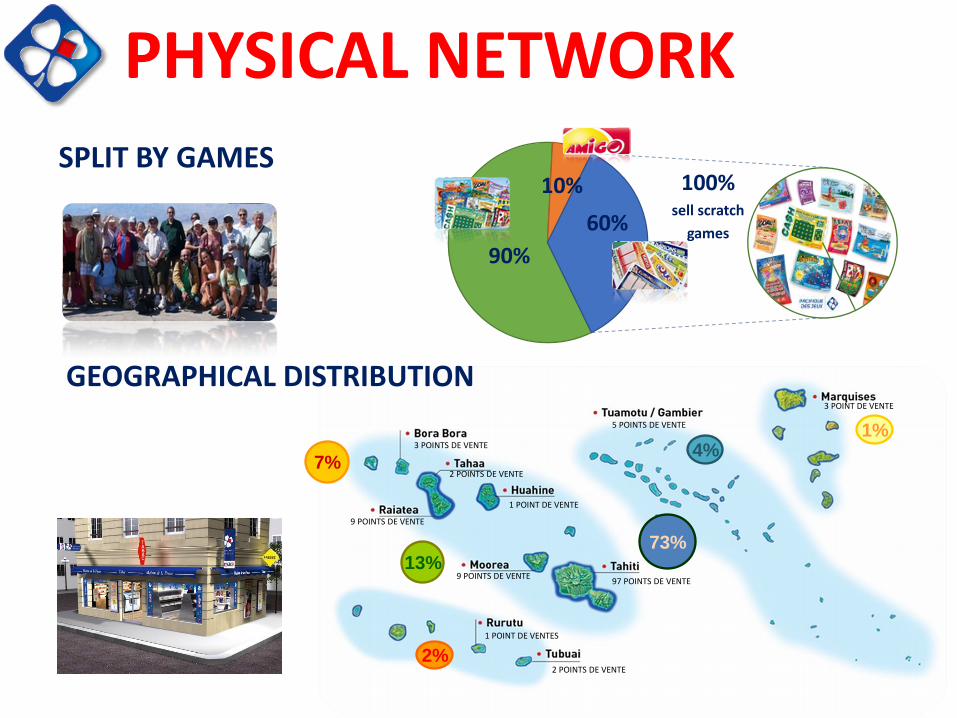
PHYSICAL NETWORK
3 POINTS DE VENTE
2 POINTS DE VENTE
9 POINTS DE VENTE
1 POINT DE VENTE
9 POINTS DE VENTE 97 POINTS DE VENTE
3 POINT DE VENTE
2 POINTS DE VENTE
1 POINT DE VENTES
5 POINTS DE VENTE
73% 13%
4% 1%
2%
7%
10%
60%
90%
100% sell scratch
games
SPLIT BY GAMES
GEOGRAPHICAL DISTRIBUTION

Lottery signs
OUTDOOR SIGNAGE
Signage material
Jackpot display Promotional posters

INSIDE EQUIPMENT
Dedicated counter
Dedicated Gaming Modulo
player’s space
Promotional posters
Winners’ promotion

2000 2001 2002 2003 2004 2005 2006 2007 2008 2009 2010 2011 2012 2013 2014
46 914 K€
39 846 K€ 42 006 K€
EVOLUTION OF SALES
SCRATCH GAMES
LOTO + SUPER LOTO JOKER+
RAPIDO KENO
EURO MILLIONS OXO
AMIGO
Draw based games : 86% Scratch Games 14%

STAKES PER TYPE OF GAME
16%
2%
25%
16%
27%
14%
REPARTITION DU C.A. TOTALau 31/03/2015
LOTO
JOKER +
KENO
AMIGO
EURO MILLIONS
GRATTAGE
TOTAL SALES 2015 half-year
5 draw based games (all FDJ’s games) 15 scratch games (5 launching a year)
23%
47%
30%
DETAIL GAMME GRATTAGE au 31/03/15
100 F
200 F
500 F
SCRATCH GAMES 2015 half-year
Out of scope 1 Out of scope 2
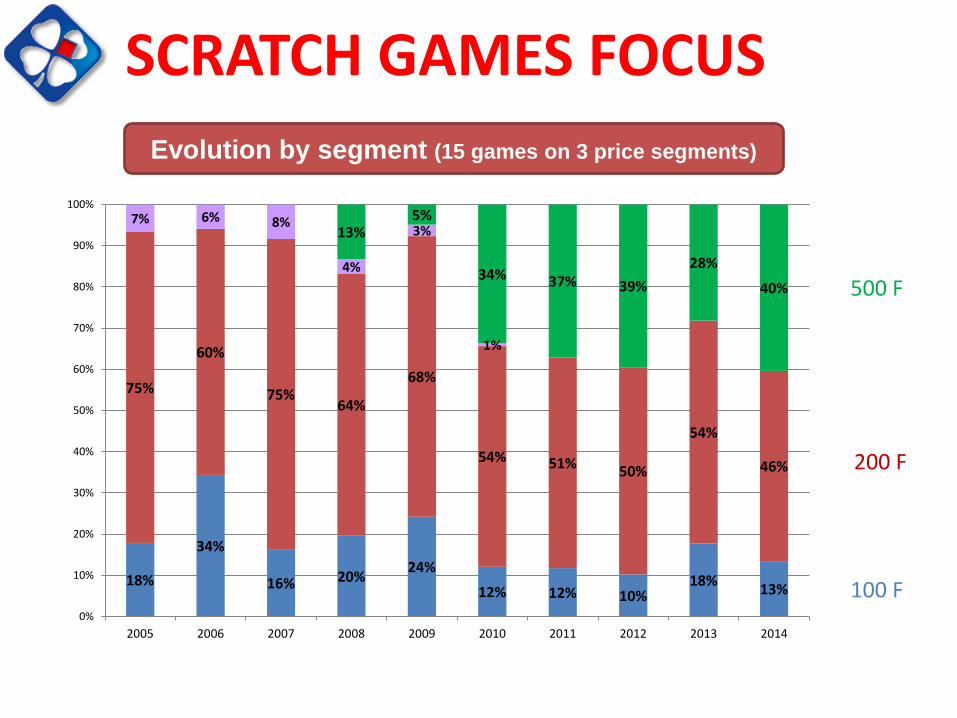
18%
34%
16% 20% 24%
12% 12% 10% 18%
13%
75%
60%
75% 64%
68%
54% 51% 50%
54%
46%
7% 6% 8%
4%
3%
1%
13% 5%
34% 37% 39%
28%
40%
0%
10%
20%
30%
40%
50%
60%
70%
80%
90%
100%
2005 2006 2007 2008 2009 2010 2011 2012 2013 2014
SCRATCH GAMES FOCUS
100 F
200 F
500 F
Evolution by segment (15 games on 3 price segments)
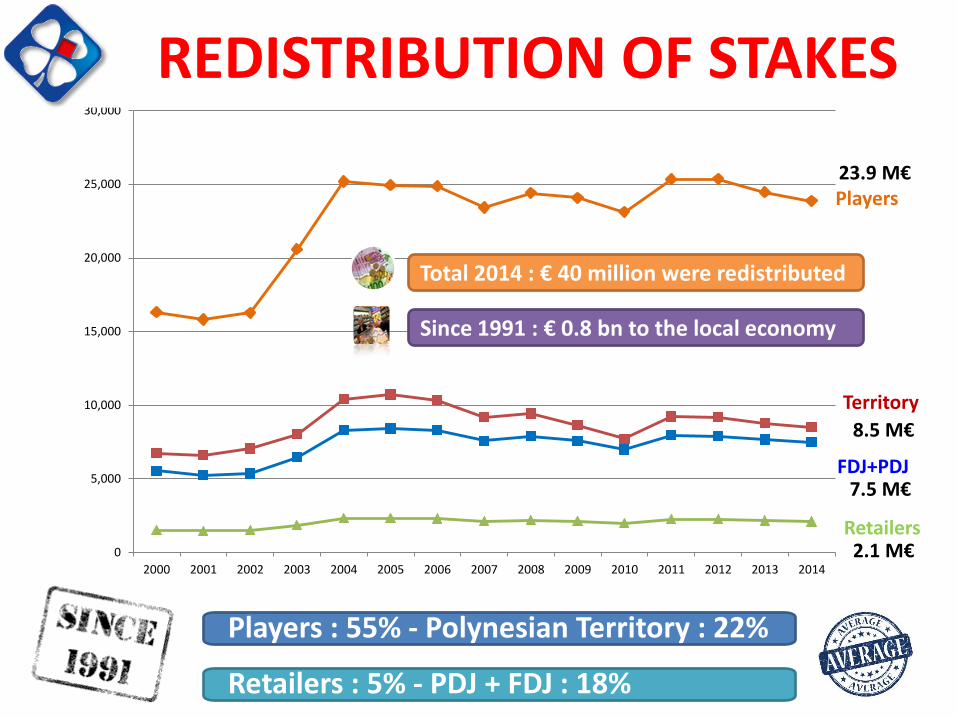
Players
Territory
FDJ+PDJ
Retailers 0
5,000
10,000
15,000
20,000
25,000
30,000
2000 2001 2002 2003 2004 2005 2006 2007 2008 2009 2010 2011 2012 2013 2014
REDISTRIBUTION OF STAKES
Players : 55% - Polynesian Territory : 22%
Retailers : 5% - PDJ + FDJ : 18%
8.5 M€
7.5 M€
2.1 M€
23.9 M€
Total 2014 : € 40 million were redistributed
Since 1991 : € 0.8 bn to the local economy

FDJ REDISTRIBUTION
Total 2014 : € 12.3 bn (+5,8% vs 2013)
Equivalent jobs : 29,250 (current min wage)
95% of stakes redistributed to the players, the distribution network and the community
The network (physical or not)
The community
The players
Winners
65%
Public Finance
24%
Distribution network 6%
FDJ’s operations
5%
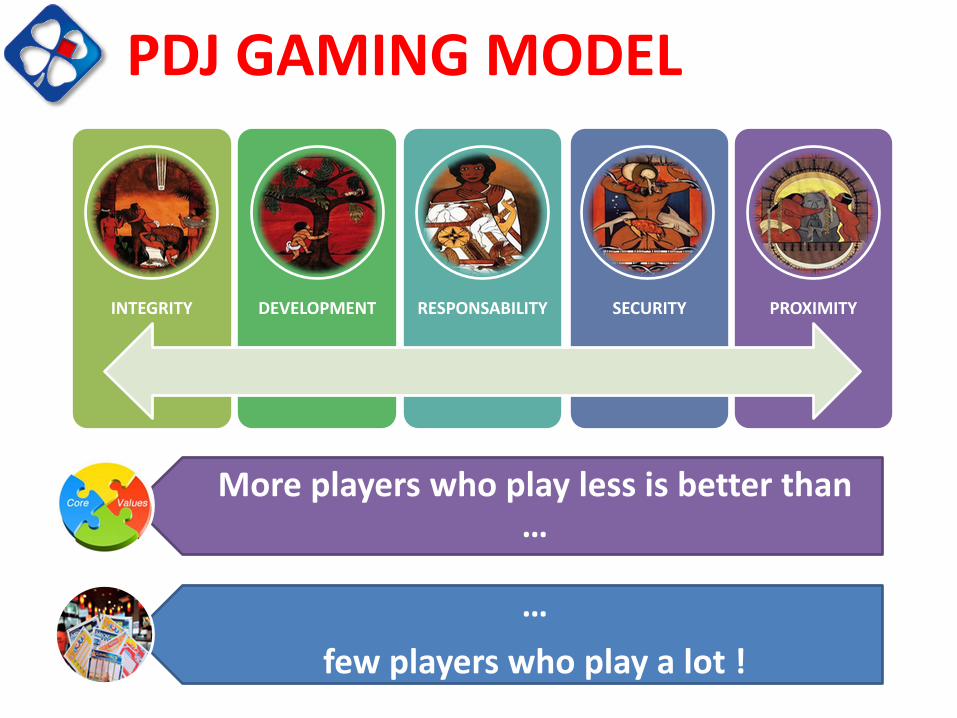
INTEGRITY DEVELOPMENT RESPONSABILITY SECURITY PROXIMITY
…
few players who play a lot !
More players who play less is better than …
PDJ GAMING MODEL

PLAYER’S PROFILE
Social Solitary
Interactive
Ambitious
Opportunist
Ordinary people
SUPERSTITIOUS

Gender Age
BY GENDER & AGE RANGE
Players’ profile is similar to that of the population

Socio-Professional category Monthly Revenue
BY SOCIO-DEMO & REVENUE
Players’ profile is similar to that of the population

SPENDING PER INHABITANT
86,941
74,002
59,695
36,562 34,432
32,814 30,831 30,802
25,544 24,860 22,995
19,910 19,720 19,455 18,667 17,661
In F.CFP per year
Moderate level of annual spending
High penetration rate : 88%

MAIN TASKS
Legal
Regulatory
Contractual Ethical
Procedural
“Ensure the integrity and the security of game operations …”
AC
CES
S TO
GA
MES
PR
IZE PAIY
MEN
TS
RULES
IMPLEMENT CONTROL
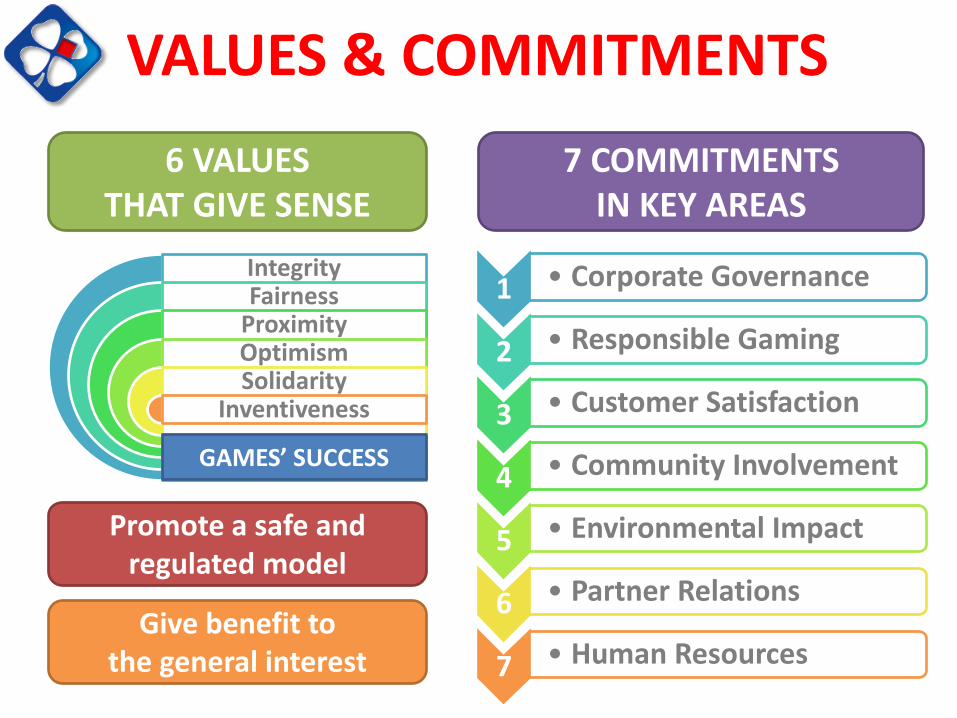
1 • Corporate Governance
2 • Responsible Gaming
3 • Customer Satisfaction
4 • Community Involvement
5 • Environmental Impact
6 • Partner Relations
7 • Human Resources
7 COMMITMENTS IN KEY AREAS
6 VALUES THAT GIVE SENSE
Integrity Fairness
Proximity Optimism Solidarity
Inventiveness
GAMES’ SUCCESS
Promote a safe and regulated model
Give benefit to the general interest
VALUES & COMMITMENTS

CERTIFICATIONS
PDJ has been a member of APLA since 2005
Certified ISO 27001 in June 2015 Certified WLA SCS in Sept 2015

3. THE CHALLENGES

0
10
5
15
Bets (Billions €)
2005 2006 2007
13.0
9.5
12.1
10.0 9.2 9.3
8.9 Express games
2010 2008
1.1
1.1
1.7
1.5 0.6 1.6
0.8
1.4
1.4
1.6
1.4
2.0
1.4
3.5 3.4 3.4 3.3 3.9 4.3 5.0 5.4
3.8 3.9 3.7 3.8
+3.4%/year
2011 2012 2013 2014
Scratch games
2.1
Sports betting
2.2
2009
+5.4%/year
Draw games 1.8
10.6
11.4
12.4
5.8
0.4 0.3
5.6
0.4
3.5 3.6 3.5 3.3 3.5 3.0
2.2
Strong growth over the last few years,
primarily attributed to successful, innovative products
€13 billion in sales revenue in 2014
FDJ GLOBAL SALES EVOLUTION

FDJ SALES PER RANGE
15,2%
44,8%
29,4%
10,6%
+20%
+1,7%
+4,8%
-1% GLOBAL GROWTH
DUE TO :
- New option EUML
- Soccer World Cup
- Instant tickets

FDJ SPORTS BETTING
23 different sports
available
Paris Mutuel since 1985 :Loto Foot
Oddset betting since 2003 : “ParionsSport”
Internet betting since 2009 : “ParionsSport”
Mobile app launched in 2013 on iOS (250,000 downloads)
15.2% of total sales for Sports betting (+20% vs 2013)
N°1 IN EUROPE FOR SPORTS BETTING

49%
79%
51%
21%
0%
10%
20%
30%
40%
50%
60%
70%
80%
90%
Population 18-65 Sports Betting
ManWomen
Gender Age
13%
20% 22%
33%
12%
25%
28% 26%
8%
0%
5%
10%
15%
20%
25%
30%
35%
18-24 25-34 35-44 45-59 60-65
Population 18-65
Sports Betting
SPORTS BETTING PLAYERS
Mainly male and much more age cluster 25-44

7,540
6,070
2,357
1,978
1,511
868 597
0
1000
2000
3000
4000
5000
6000
7000
8000
9000
1ChinaSportsChine
2HKJC
Hong Kong
3Sports Toto
Corée du Sud
4FDJ
France
5OPAPGrèce
6Lottomatica
Italie
7Svenska Spel
Suède
2014 ranking Sales in M€
FDJ remains n°1 in Europe. All the lotteries take benefit from the Soccer World Cup : China Sports (+82%), HKJC (+24%), FDJ (+20%), OPAP (+20%)
N°1
N°4
SPORTS BETTING WORLDWIDE

0.00%
1.00%
2.00%
3.00%
4.00%
0
100
200
300
400
500
600
2007 2008 2009 2010 2011 2012 2013 2014
Online sales
% of total sales
FDJ DIGITAL OPERATIONS
+ 45% for online sports betting (€ 109 M i.e. Rmb 782M) + 10.3% for online lottery games (€ 368 M i.e. Rmb 2.6 bn)
7.1 million visitors per month
118 million online bets a year
2014 digital sales up 16.7%

SOCIAL NETWORKS TOTAL FDJ
CHALLENGES
Increase the audience and the coverage of the brands
Participate in chats and develop proximity
Listen, moderate and watch the e-reputation
Groupe
Fondation
Eté FDJ
Equipe FDJ
Parions Sport
Parions Web
Illiko
LOTO
EUML
2 434 3 782 5 432
143 620
127 942
131 247
341 278
5 760 9 151 26 526
3 538
33 638
62 746
571
31 707
133
45 401 followers
874 217 fans

FACEBOOK PAGES

DRAW GAMES ARE CRUCIAL
To ensure a large base of players among population
To develop the base with the most regular players
To inspire dreams and hopes for everybody
To give the tempo & rhythm for the players’ life

INSTANTS ARE ESSENTIAL
To give access to gaming to the largest population
To grant a winning experience to players (pay outs)
To bring permanent novelties to the market
To enable to recruit new players (1st price segment)

OTHERS AS OPPORTUNITIES
● satisfy much lower players base than the core range ● create a niche or a complement to attract new players
ENRICH THE PORTFOLIO IN ORDER TO :
● enable new practices and recruit new players ● reach the motivations, needs & hopes of the players
● permanent entries and departures create a need to recruit permanently to ensure a consistent development ● trust and confidence of people are fragile

Present moves
Products
Retail
Digital
International
CSR
Security
Integrity
STRENGHTEN THE MODEL
1 • Recruit new players
2 • Enhance proximity
3 • Responsible Gaming
4 • Security and Integrity
5 • Higher performance
6 • Corporate image
Coming challenges
… RUN THE BUSINESS SMARTER SELL BETTER = SELL MORE !

APLA - Annual Regional Conference 19-23rd October 2015
« SELL WITH KOREA WAVE ! »
APLA - Annual Regional Conference 19-23rd October 2015