lonworks protocol analyzer user’s guide
TRANSCRIPT

LONWORKS®
Protocol Analyzer User’s Guide
Revision 1.0
@ E C H E L O N®
C o r p o r a t i o n
078-0121-01B

Echelon, LON, LonTalk, LonBuilder, Neuron, LonManager, LONWORKS, and 3150 are registered trademarks of Echelon Corporation. LONMARK, 3120, LonMaker, LonSupport, LonUsers, and LonLink are trademarks of Echelon Corporation.
Other brand and product names are trademarks or registered trademarks of their respective holders.
Neuron Chips, LonManager Protocol Analyzers, and other OEM Products were not designed for use in equipment or systems which involve danger to human health or safety or a risk of property damage and Echelon assumes no responsibility or liability for use of the Neuron Chips or LonManager Protocol Analyzers in such applications.
Parts manufactured by vendors other than Echelon and referenced in this document have been described for illustrative purposes only, and may not have been tested by Echelon. It is the responsibility of the customer to determine the suitability of these parts for each application.
ECHELON MAKES AND YOU RECEIVE NO WARRANTIES OR CONDITIONS, EXPRESS, IMPLIED, STATUTORY OR IN ANY COMMUNICATION WITH YOU, AND ECHELON SPECIFICALLY DISCLAIMS ANY IMPLIED WARRANTY OF MERCHANTABILITY OR FITNESS FOR A PARTICULAR PURPOSE.
No part of this publication may be reproduced, stored in a retrieval system, or transmitted, in any form or by any means, electronic, mechanical, photocopying, recording, or otherwise, without the prior written permission of Echelon Corporation.
Document No. 39600
Printed in the United States of America. Copyright ©1994 by Echelon Corporation.
Echelon Corporation 4015 Miranda Avenue Palo Alto, CA 94304, USA

DECLARATION OF CONFORMITY
LonManager® Protocol Analyzer
Application of: 73/23/EEC; 89/336/EEC; 93/68/EEC Council Directive Manufacturer’s Name: Echelon Corporation Manufacturer’s Address: 4015 Miranda Avenue Palo Alto, CA 94304 USA Manufacturer’s Address: Echelon Europe LTD. in Europe Elsinore House, 77 Fulham Palace Road London, Hammersmith W6 8JA United Kingdom Product Model Number: 33100 Type of Equipment: Information Technology Equipment Standards to which: EN 60950:1992; EN 50082-1:1992 Conformity is EN 55022:1987 Declared IEC 801-2:1984/1991 IEC 801-3:1984 IEC 801-4:1988 IEC 801-5:Draft 1993 IEC 1000-4-8:1993
I, Paul Smith, hereby declare that the equipment specified above conforms to the above
Directives and Standards. Place: London, England Date: October, 1995 Position: Controller, Echelon Europe


Preface
The LonManager® Protocol Analyzer provides LONWORKS® manufacturers, system integrators, and end-users with a rich set of Microsoft Windows-based tools and a high performance PC interface card to allow users to observe, analyze, and diagnose the behavior of installed LONWORKS networks. This guide describes how to install and use the LonManager Protocol Analyzer tools.
LonManager Protocol Analyzer User’s Guide i

Purpose This guide serves primarily as a brief tutorial on how to get started with the LonManager Protocol Analyzer. Reference and detailed usage aspects of the product are contained in the on-line Windows help.
Audience The LonManager Protocol Analyzer User’s Guide is intended for LONWORKS manufacturers, system-integrators, and end-users using the LonManager Protocol Analyzer. It is also intended for software developers creating custom extensions to the LonManager Protocol Analyzer.
Related Reading Neuron® 3150® and 3120™ Data Book (Motorola part number MC143150/D, Toshiba part number 462-2462 (U.S.), control number 5205
Provides a detailed description of the Neuron Chip and the LonTalk network management and network diagnostic messages.
LonTalk® Protocol Engineering Bulletin (Echelon part # 005-0017-01)
Summarizes the services available at each of the seven layers of the LonTalk Protocol.
Optimizing LonTalk Response Time Engineering Bulletin (Echelon part # 005-0011-01)
Discusses the optional features and tunable parameters of the LonTalk protocol and their influence on the performance of a LONWORKS network.
The SNVT Master List and Programmer's Guide (Echelon part # 005-0027-01)
Lists and describes the Standard Network Variable Types that should be used to create interoperable LONWORKS nodes.
LONMARK™ Layers 1-6 Interoperability Guidelines (Echelon part # 078-0014-01)
Provides the guidelines that are the basis for obtaining the LONMARK logo, which indicates a product is LONWORKS interoperable. Describes the Layer 1-6 design guidelines, and the requirements for compatibility at Layer 1 (the physical layer).
LONMARK Application Layer Interoperability Guidelines (Echelon part # 078-0120-01)
Provide guidelines for the application layer, including the handling of configuration information, product documentation, SNVTs, SCPTs, and guidelines for network installation and maintenance.
Windows 3.1 Programming for Mere Mortals (Woody Leonhard, Copyright © 1993, Addison-Wesley Publishing)
Along with many other topics, provides a very good non-technical overview of DDE and how to use it with many popular applications, including Visual Basic, Microsoft Word, and Microsoft Excel.
ii Preface

Windows Programmer’s Guide to OLE/DDE (Jeffrey D. Clark, Copyright © 1992, Sams)
Provides a detailed description of the architecture of DDE and information on how to use DDE, including how to write applications that act as DDE clients and DDE servers.
Content The LonManager Protocol Analyzer User’s Guide contains nine chapters, one appendix, and an index.
• Chapter 1, Installing the LonManager Protocol Analyzer, provides instructions for installing the protocol analyzer hardware and software.
• Chapter 2, Overview, provides a brief overview of the various software tools that make up the LonManager Protocol Analyzer.
• Chapter 3, Using the Channel Interface Maker Utility, discusses the role of channel interfaces and how to use the channel interface maker utility to create and manage them.
• Chapter 4, Working with Database, Names, Type, and Format Files, discusses the benefits of these files and how to use them.
• Chapter 5, Using the LonManager Protocol Analyzer Application, discusses basic operation of the application used to collect and analyze LonTalk packets.
• Chapter 6, Using Advanced Protocol Analyzer Features, discusses advanced operation of the application used to collect and analyze LonTalk packets.
• Chapter 7, Using the LonManager Traffic Statistics Application, discusses basic operation of the application used to collect and characterize network traffic.
• Chapter 8, Exchanging Statistical Data Using DDE, discusses how to exchange traffic statistics with other Windows applications using dynamic data exchange (DDE).
• Chapter 9, Using the LonManager Diagnostics Application, discusses operation of the application used to diagnose network nodes.
• Appendix A, Specifying the Format of User-Defined Types, explains how to create user type, enumeration, and format files.
LonManager Protocol Analyzer User’s Guide iii

iv Preface

Contents
1 Installing the LonManager Protocol Analyzer 1-1 Installing the LonManager Protocol Analyzer Card 1-2
Hardware Description 1-2 Installation 1-2 Configuring the LonManager Protocol Analyzer Card 1-3 Installing SMX-Compatible Transceivers 1-4 Installing the LonManager Protocol Analyzer Software 1-5 Disk and Memory Requirements 1-5 Software Setup 1-5 Program Manager Group 1-9
2 Overview 2-1
Introduction 2-2 Utilities 2-2 Channel Interface Maker 2-2 User Type File Generation Utilities 2-2 LonBuilder Database Conversion Utility 2-3 LonManager Protocol Analyzer Application 2-3 LonManager Statistics Application 2-3 LonManager Diagnostic Application 2-4 Relationship with other Echelon Products 2-4
3 Using the Channel Interface Maker Utility 3-1 Introduction 3-2
Using the LMCIMKR Utility 3-2 Starting the Utility 3-2 Creating a New Channel Interface Definition 3-3 Editing a Channel Interface Definition 3-6 Deleting a Channel Interface Definition 3-6
4 Working with Database, Names, Type, and Format Files 4-1 Introduction 4-2
The Advantages of Using a LonManager Database 4-2 Selecting a Database 4-2 Using a LonMaker Database 4-2 Using a LonManager API Database 4-3 Using a LonManager NSS-10 Database 4-3 Using a LonBuilder Database 4-3 Working with Names Files 4-4 Message Code Names 4-4 Group Names 4-5 Node Names 4-5 The Advantages of User Type, Enumeration, and Format Files 4-5 Specifying User-defined Types 4-6
LonManager Protocol Analyzer User’s Guide v

5 Using the LonManager Protocol Analyzer Application 5-1 Introduction 5-2
Starting the Application 5-3 Selecting a Channel Interface 5-3 Command Line Options 5-4 The Protocol Analyzer Window 5-4 Title Bar 5-5 Menu Bar 5-5 Tool Bar 5-6 Work Area 5-7 Status Bar 5-7 Working with Packet Logs 5-8 Packet Log Contents 5-8 Summary Form 5-8 Display of Symbolic Addresses 5-9 Detailed Form 5-10 Starting a New Log 5-11 Saving a Packet 5-11 Opening an Existing Log 5-11 Changing the Display Mode 5-11 Pausing an Active Log 5-12 Using the Match Feature to Simplify Log Analysis 5-12 Stopping and Restarting the Active Log 5-13 Clearing the Active Log 5-13 Printing a Log 5-13 Viewing Different Parts of the Same Log 5-13 Setting Display Options 5-14 Selecting Visible Fields and Field Order 5-14 Adjusting Field Formats 5-14 Adjusting Field Widths 5-15 Setting the Display Font 5-15
6 Using Advanced Protocol Analyzer Features 6-1 Packet Capture Filters 6-2
The Advantages of Packet Capture Filters 6-2 How Packet Capture Filters Work 6-2 Defining a Packet Capture Filter 6-3 Saving and Loading Filter Files 6-7 Creating Custom Filter Types 6-7 Exporting Packet Logs to Other Applications 6-7
7 Using the LonManager Traffic Statistics Application 7-1 Introduction 7-2
Starting the Application 7-2 Selecting a Channel Interface 7-3 Command Line Options 7-3
The Summary Statistics Windows 7-4
vi Preface

Menu Bar 7-4 The Detailed Statistics Windows 7-5 The Tool Bar 7-5 The Statistics 7-6 Working with the Traffic Statistics Applications 7-8 Controlling the Display 7-8 Cumulative versus Snapshot Mode 7-9 Using the Application in Iconic Mode 7-9 8 Exchanging Statistical Data Using DDE 8-1 Introduction 8-2
Overview of DDE 8-2 Addressing a DDE Message 8-3 Types of DDE Services 8-3 The Traffic Statistics DDE Server 8-4 Using Copy and Paste Link to Create DDE Links 8-4 Manually Creating DDE Links 8-4 The System Topic 8-5 Command Execution 8-6
9 Using the LonManager Network Diagnostic Application 9-1 Introduction 9-2
Starting the Application 9-2 Selecting a Channel Interface 9-3 Command Line Options 9-3 The Main Window 9-4 Menu Bar 9-4 Tool Bar 9-5 Status Area 9-6 Performing Operations 9-6 Selecting Nodes 9-6 Setting Intervals and Counts 9-7 Running the Operation 9-7 Using the Results 9-8
Appendix A Specifying the Format of User-Defined Types A-1 Introduction A-2
Type File A-2 Enumeration File A-3 Format File A-3 Overview of the Process A-4 Creating User Type and User Enumeration Files A-5 Using the LMUSRNV Utility A-5 Limitations of LMUSRNV A-6 Editing Type Definition Files A-7 Using the LMUSRTYP Utility A-9 LMUSRNV Error Messages A-10
LonManager Protocol Analyzer User’s Guide vii
viii Preface
LMUSRTYP Status and Error Messages A-12 Creating a User Format File A-14 Overview of Format Specifiers A-15 Real Format Specifier A-15 Int Format Specifier A-15 Discrete Format Specifier A-16 Text Format Specifier A-16 Characters A-17 Enumerations A-17 Decimal and Hexadecimal Integers A-17 Strings A-18 Floating Point Numbers A-18 Structures, Unions, and Conditional Text A-18

1 Installing the LonManager
Protocol Analyzer
This chapter discusses installation of the LonManager Protocol Analyzer hardware and software. Note: After installing the LonManager Protocol Analyzer software,
read the README.TXT file that the setup program puts on your hard disk in the \LM_PA directory. This file describes changes to the LonManager Protocol Analyzer software since completion of this guide.
LonManager Protocol Analyzer User's Guide 1-1

Installing the LonManager Protocol Analyzer Card
Hardware Description The LonManager Protocol Analyzer card is a full-length IBM PC/AT ISA bus card (334mm x 108mm x 18mm, or 13.13” x 4.25” x 0.69”). The card is equipped with a PC mounting bracket which allows SMX-compatible transceivers to be attached. Figure 1.1 shows the layout of the connectors and user-accessible switches and indicators for the card.
Figure 1.1 The LonManager Protocol Analyzer Card Mechanical Layout and Interfaces
The P1 and P2 connectors provide a standard ISA bus pinout. Normally, the LonManager Protocol Analyzer card should be used in a 16-bit slot, which has a mating connector for P1 and P2. However, if the extended interrupts are not used, the LonManager Protocol Analyzer card may be used in an 8-bit slot which has a mating connector for P1 only.
Installation Use the following steps to install the LonManager Protocol Analyzer card in your computer:
ESD Warning
This product contains devices which are sensitive to static electricity. Before installing or removing the LonManager Protocol Analyzer card or the network
cables, touch earth ground with your hand to discharge any static electricity which may have accumulated.
1-2 Installing the LonManager Protocol Analyzer

1 Configure the LonManager Protocol Analyzer card hardware. See the discussion below for more details.
2 Attach two SMX-compatible transceivers to the card. To attach an SMX-compatible transceiver, make sure that the transceiver face-plate is aligned properly with the hole in the LonManager Protocol Analyzer card rear panel, and press the connector down firmly in place. If mounting screws are provided with the transceiver, use them for additional mechanical stability.
3 Identify a 16-bit slot in your PC with room for a full length card. Remove the corresponding blank panel from the rear of your PC, saving the screw. Insert the LonManager Protocol Analyzer card in the slot, making sure that the card is in the card guides, the edge connectors are fully mated, and the slot in the mounting bracket of the LonManager Protocol Analyzer card is lined up with the threaded hole in the PC chassis. Replace the screw to hold the LonManager Protocol Analyzer card firmly in place.
4 Physically attach the transceivers to a LONWORKS network. The network connectors are transceiver-specific. See the instruction manual that came with your SMX-compatible transceivers for more details.
Configuring the LonManager Protocol Analyzer Card The LonManager Protocol Analyzer card occupies a block of 8 addresses in the I/O space of the host PC. The factory default assignment for the LonManager Protocol Analyzer card is a block of addresses from 320 to 327 hex, as shown in figure 1.2.
0
1
8 7 6 5 4 3 X9 X X
1 01 0 1 0 0 X
I/O ADDRESS
Figure 1.2 The Default LonManager Protocol Analyzer Card Address
If another device is using an address in the range of the LonManager Protocol Analyzer card addresses, neither device will work properly. You can change the base address used by the LonManager Protocol Analyzer card with the DIP switches located at S1. To set the base address of the LonManager Protocol Analyzer card, set the switches at S1 to a free address as shown in figure 1.3. Setting a switch to the upper position programs a one, and the lower position programs a zero for the corresponding address bit.
I/O ADDRESS
01
8 7 6 5 4 3 X9 X X
Figure 1.3 Setting the Base LonManager Protocol Analyzer Card Address
LonManager Protocol Analyzer User's Guide 1-3

As an aid in selecting an appropriate I/O address for the LonManager Protocol Analyzer card, table 1.1 lists commonly used I/O addresses for various PC peripheral devices.
Table 1.1 Typical I/O Address Usage in PC-compatibles
I/O Address Range Typical Use 0000 - 01FF Reserved for PC motherboard use 0200 - 0207 Joystick input 0220 - 022F Sound controller 0278 - 027B LPT3 Parallel Port (if LPT1 and LPT2 are installed) 02F8 - 02FF COM2 Serial Port 0310 - 0317 LonBuilder Interface Adapter 0320 - 0327 LonManager Protocol Analyzer Card 0330 - 033F MIDI Controller 0340 - 0347 PC LonTalk Adapter 0360 - 036B PC Network 0378 - 037B LPT2 Parallel Port (if LPT1 is installed) 0388 - 038F Sound Controller 03B4 - 03BA Video Subsystem 03BC - 03BF LPT1 Parallel Port 03C0 - 03DA Video Subsystem and DAC 03F0 - 03F7 Floppy Disk Controller 03F8 - 03FF COM1 Serial Port
Installing SMX-Compatible Transceivers Transceiver daughter cards conforming to the SMX specification may be attached at connectors P3 and P4. Even if both LonManager Protocol Analyzer card ports are to be connected to the same LONWORKS channel, two transceivers are required. The LonManager Protocol Analyzer card should not be operated without modular transceivers attached, as this configuration may violate radiated emission standards.
Table 1.2 lists the SMX-compatible transceivers available from Echelon. All of these transceivers are suitable for use with the LonManager Protocol Analyzer card. Transceivers for other media may be available from other suppliers. Consult the LONWORKS Products Resource Guide for more information on third-party transceivers. If you want to build your own SMX-compatible transceivers, see the LONWORKS SMX Modular Transceiver Developer's Guide.
1-4 Installing the LonManager Protocol Analyzer

Table 1.2 SMX-Compatible Transceivers Available from Echelon
Product Name Echelon Model Number TPM/XF-78 SMX Transceiver 77010 TPM/XF-1250 SMX Transceiver 77030 FTM-10 SMX Transceiver 77040 PLM-10 FCC Band Power Line SMX Transceiver1,3 77090
PLM-20 CENELEC C Band Power Line SMX Transceiver2,3 77160
PLM-30 CENELEC A Band Power Line SMX Transceiver2,3 77180 1 Available 1995 2 Available Q4 94 3 Requires an external coupling circuit to connect to the power line medium. Packaged coupling circuits for some AC mains power lines are available from Echelon. Even if both channels are to be connected to the same power line, two coupling circuits are required.
Installing the LonManager Protocol Analyzer Software
Disk and Memory Requirements The LonManager Protocol Analyzer requires a 386, 486, or Pentium-based PC with a VGA or better display and Windows 3.1. A 486 or better is recommended for use with TP/XF-1250 channels. The PC must have at least 8Mbytes of memory (12 Mbytes recommended) and 5 Mbytes of disk space available (9 Mbytes recommended) for the Protocol Analyzer, its related files, packet logs and the LonManager database. A mouse and software disk cache (such as SMARTDRV) are recommended. When using the LonManager Protocol Analyzer, you should have FILES in your CONFIG.SYS file set to 30, or more if your normal configuration requires more files. If you plan to use other LonManager API for Windows applications (such as the LonManager DDE Server) along with the LonManager Protocol Analyzer and you will be opening more than one LonManager database, you should increase the number of files by eight for each additional database. For example, if your CONFIG.SYS file has FILES=30 normally and you want to open three LonManager databases, use FILES=46.
Software Setup The LonManager Protocol Analyzer comes with an automated, Windows-based installation program called SETUP. Because the LonManager Protocol Analyzer distribution disk contains compressed files, you cannot install the software by copying the files directly to your hard disk. Follow these steps to install the software:
LonManager Protocol Analyzer User's Guide 1-5

1 Insert the first LonManager Protocol Analyzer distribution diskette into a floppy disk drive and start the setup program. You can start the setup program like any other Windows program, for example by selecting the Run... item from the File menu in the Program Manager or the File Manager and entering the full path and file name for the setup program, for example A:\SETUP. You will be prompted when it is necessary to insert the second diskette.
2 After the copyright notice, you will see a welcome screen. At any time, you can click on the Exit button to abandon the installation procedure. Click the Continue button to continue.
3 The setup program next requests that you register this copy of the software. Enter your name and company affiliation, if any, and click the Continue button to continue. You will be given the opportunity to correct any mistakes by pressing the Edit button. If the information is correct, click the Continue button to continue.
4 The setup program next displays the custom installation screen. An example of the custom installation screen is shown in figure 1.4.
Figure 1.4 Custom Installation Screen
The next step is to specify the directory into which the software will be installed. To do this, set the directories in the Install Target Directories: section of the custom installation screen to the desired settings. By default, the LonManager Protocol Analyzer software is installed into C:\LM_PA and the tools shared across various Echelon products are installed into C:\ECHELON. If you want to change either directory, click the Set Location button next to the directory name, type in the new directory name, and click the OK button to continue.
If the LonManager Protocol Analyzer has already been installed in the specified directory, you will be given an opportunity to overwrite it, or change the install directory. The installation process will also install two initialization files
1-6 Installing the LonManager Protocol Analyzer

(LMPA.INI and ECHELON.INI) in your Windows directory. If you are re-installing the LonManager Protocol Analyzer, the existing entries in your LMPA.INI and ECHELON.INI files are preserved and new items are added as needed.
5 Next, specify which parts of the software should be installed by checking the appropriate boxes in the Installation Options: section of the custom installation screen. The default is to install all parts. If you would like, you can install a subset of the software by selecting the appropriate check boxes. You can select any or all of the following:
LonManager Protocol Analyzer
Select this to install the tools that make up the LonManager Protocol Analyzer.
Echelon Tools and Utilities
Select this if you wish to use Standard Network Variable Types (SNVTs), if you wish to specify formats for user types, or if you wish to export a database from LonBuilder for use with the LonManager Protocol Analyzer.
Protocol Analyzer Examples
Select this to install sample user type and format files.
Protocol Analyzer Help Select this to install the on-line help files.
For each part of the software, the screen shows the estimated disk space requirements, together with the available space on the relevant drives. Click the Install button to continue.
6 The setup program copies a number of compressed files from the distribution disks to the hard disk, expands these files, and creates a Program Manager group for the of the LonManager Protocol Analyzer tools and utilities. See the section Program Manager Group later in this chapter for more details.
7 The setup program next gives you the option to search your computer for old version of the files shared with other Echelon products. If you wish to skip the search, click No. If you click Yes, the setup program scans your computer for earlier versions of the files VISTA.DLL, WLON.DLL, WLDB.DLL, WLXT.DLL, WLDV.DDL, SNVT.TYP, SNVT.FMT, SNVT.ENM, STDXCVR.TYP, LDBIMP.EXE, LDBIMP2.EXE, LB2LM.BAT, LB2LMW.EXE, LBINIT.EXE, LDBCD.COM, DBCHECK.EXE, DBEXP.EXE, DBIMP.EXE, INITDB.EXE, WLMUTIL.EXE, LDB.IMP, LB210.DBD, LB220.DBD, LONALT.DBD, LONDB.DBD, LMUSRNV.EXE, LMUSRTYP.EXE, TYPEDB.DBD, LDVLB.SYS, LDVSLTA.SYS, and LDVPCLTA.SYS and allows you to replace, retain, or delete them. Unless you have a specific need for an older version, you should always select replace.
8 The setup program will optionally modify CONFIG.SYS to install network drivers for both ports of the LonManager Protocol Analyzer card. You should always answer yes to this question; if you do not allow setup to modify your CONFIG.SYS file, you will need to do so manually before you can use the LonManager Protocol Analyzer tools. The protocol analysis and traffic statistics applications use this card to communicate with a LONWORKS network. The network diagnostics application can also use this card, or any other network interface that conforms to the LONWORKS network interface protocol.
LonManager Protocol Analyzer User's Guide 1-7

The setup program next asks if you wish to accept the default values for the driver names, ports, and interrupts. The defaults for each network driver are shown in table 1.3. Click No if you have changed the hardware address of the LonManager Protocol Analyzer card (see Configuring the LonManager Protocol Analyzer Card earlier in this chapter) or have another device in your computer that uses interrupts 10 or 11.
Table 1.3 Default Driver Names, Ports, and Interrupts
Driver Driver Name Port Number Interrupt (IRQ) Instance 1 LMPA1 320 hex 10 Instance 2 LMPA2 324 hex 11
If you click No, a driver attributes screen like the one shown in figure 1.5 will appear to allow you to set the attributes for the first driver.
Figure 1.5 Driver Attributes Screen
For each driver you can set these attributes:
Driver Name Set the driver name by supplying a number from 1 to 9. This number will be used to form the driver name of LMPAx, where x is the number you supply.
Port Number For the first driver, enter the number (in hexadecimal) that you have set on your LonManager Protocol Analyzer card, or leave it at 320 hexadecimal if you have not changed the card’s address. See Configuring the LonManager Protocol Analyzer Card earlier in this chapter for details on how to set the card’s address.
For the second driver, the number is supplied automatically and is always 4 greater than the number used for the first driver.
Interrupt (IRQ) Select an interrupt to be used by this port. The interrupt can be one of 5, 9, 10, 11, 12, or 15. Both drivers cannot be set to the IRQ same value. As an aid in selecting an appropriate IRQ for the LonManager Protocol Analyzer card, Table 1.4 lists commonly used IRQs for various PC peripheral devices.
1-8 Installing the LonManager Protocol Analyzer

Table 1.4 Typical Interrupt Request Usage in PC-compatibles
Interrupt Request Typical Use IRQ5 LPT2 Parallel Port, Sound Cards IRQ9 Redirected from IRQ2, LAN Adapter 1 IRQ10 Available, LonManager Protocol Analyzer Card Driver
Default (port 1) IRQ11 Available, LonManager Protocol Analyzer Card Driver
Default (port 2) IRQ12 PS/2-style Mouse IRQ15 Available, PC LonTalk Adapter Driver Default
When you have finished setting the attributes for the first driver, click OK. Another driver attributes screen will appear to let you configure the second driver. Click OK when done.
9 At the end of the installation process, you will be given the choice of viewing the README.TXT file distributed with the LonManager Protocol Analyzer, returning to Windows, or rebooting your PC. The README.TXT file contains updates to the documentation since this manual was printed. You should reboot your PC if you made any changes to CONFIG.SYS or AUTOEXEC.BAT.
Note: Some PCs may not reboot properly. If you choose reboot and it fails, use CTRL + ALT + DEL to reboot or turn your computer off and on again.
Program Manager Group The setup program creates a program manager group named LonManager Protocol Analyzer, shown in figure 1.6, that contains the LonManager Protocol Analyzer tools and utilities.
Figure 1.6 The LonManager Protocol Analyzer Program Group
This group contains the following items:
Read Me Opens the README.TXT file that the setup program puts on your hard disk. This file describes changes to the LonManager Protocol Analyzer software since completion of this guide.
LonManager Protocol Analyzer User's Guide 1-9

1-10 Installing the LonManager Protocol Analyzer
LM Protocol Analyzer
The LonManager Protocol Analyzer application, used to capture and analyze LonTalk packets on a LONWORKS channel. See Chapters 5 and 6 for instructions on how to use this tool.
LM Stat & DDE The LonManager Traffic Statistics application configured as a DDE server, used to share traffic statistics with other Windows applications via DDE. See Chapter 8 for instructions on how to use this tool.
LM Diag The LonManager Diagnostics application, used to test the nodes in a LONWORKS network. See Chapter 9 for instructions on how to use this tool.
LM Stat Meter The LonManager Traffic Statistics application with the icon configured as a meter, used to collect traffic statistics for a LONWORKS channel. See Chapter 7 for instructions on how to use this tool.
LM Stat LED The LonManager Traffic Statistics application with the icon configured as a simulation of a light emitting diode (LED).
LMCIMKR The Channel Interface Maker application, used to create channel interfaces. This is the first application you must run to use the protocol analyzer tools. See Chapter 3 for instructions on how to use this tool.
LMUSRNV A utility that performs the first step in creating user type files. See Chapter 4 and Appendix A for instructions on how to use this tool.
LMUSRTYP A utility that performs the second step in creating user type files. See Chapter 4 and Appendix A for instructions on how to use this tool.
LB2LM A utility that converts LonBuilder databases into the form used by the protocol analyzer tools. See Chapter 4 for instructions on how to use this tool.

2 Overview
This chapter provides a brief overview of each of the software tools included with the LonManager Protocol Analyzer.
LonManager Protocol Analyzer User's Guide 2-1

Introduction The LonManager Protocol Analyzer provides LONWORKS manufacturers, system integrators, and end-users with a rich set of Microsoft Windows-based tools and a high performance PC interface card to allow users to observe, analyze, and diagnose the behavior of installed LONWORKS networks. The tool’s open architecture allows manufacturers to customize it to their unique needs.
The LonManager Protocol Analyzer includes three tools for network analysis and diagnostics:
• Protocol analyzer tool • Network traffic statistics tool • Network diagnostics tool
Each of these applications offers many of the advanced productivity features common in data network analyzers, adapted to the unique needs of control networks.
The LonManager Protocol Analyzer also includes several utilities to allow you to customize the tools to your networks and to use the tools with networks that were installed by the LonBuilder Developer’s Workbench.
Utilities
Channel Interface Maker All of the LonManager Protocol Analyzer tools use a channel interface to define the characteristics of the network to which they are attached. The channel interface provides a shorthand method of specifying all of the global network properties, local channel properties, and PC interface card properties at once rather than having to specify them all each time a tool is run. The channel interface maker utility is used to create, edit, and delete channel interface definitions. See Chapter 3 for instructions on how to use this utility.
User Type File Generation Utilities The protocol analyzer tool uses type, enumeration, and format files to determine how to translate the application portion of a LonTalk packet into a human-readable form. The LonManager Protocol Analyzer includes type, enumeration, and format files for network variable messages that use a Standard Network Variable Type (SNVT).
To enable the LonManager Protocol Analyzer to decode application messages and non-SNVT network variable messages, you must create your own versions of each of these files. The versions you create are referred to in this manual as the user type file, the user enumeration file, and the user format file. See Appendix A for instructions on how to use the utilities included with the LonManager Protocol Analyzer to create these files.
2-2 Overview

LonBuilder Database Conversion Utility If a LonManager database is available, the protocol analyzer and network diagnostic tools use it as the source for naming information, network addressing information, and network topology information. The LB2LM utility converts LonBuilder databases to the LonManager database format used by the LonManager Protocol Analyzer. See Chapter 4 for instructions on how to use this utility.
LonManager Protocol Analyzer Application The protocol analyzer tool simplifies network maintenance by collecting, time-stamping, and saving all network communications into log files that can be later viewed and analyzed. Multiple copies of the tool can run at the same time, for example to collect packets from multiple channels in a multi-channel network.
A sophisticated transaction analysis system examines each packet as it arrives and associates related packets to aid the user in understanding and interpreting traffic patterns in their network. The tool uses a high-performance ISA bus PC card to ensure reliable diagnostics and accurate time-stamping — even when the network is saturated.
Logs can be displayed in summary form (one packet per line) for quick analysis, or in expanded form (one packet in a window) for more detailed analysis. Using a LonManager database from any LonManager network management tool or from the LonBuilder Developer's Workbench, the protocol analyzer decodes and displays packet data using the node and network variable names assigned during installation. It also provides text descriptions of each message and a description of the LonTalk protocol services used to transmit it. Eliminating the need for the user to manually interpret the ones and zeros of the LonTalk protocol reduces the time and effort needed to diagnose network problems.
The user can specify capture filters, including custom filters that they develop, to limit the packets collected. Standard filters are provided for packets to or from specific nodes or network variables, and for packets using selected LonTalk protocol services. Filtering further simplifies network analysis by limiting the packet log files to relevant packets only. To simplify interpretation and analysis, the user can specify match criteria when viewing logs. Matching can be used to display related packets in the same color or to extract packets. Matching can be done based on node names, network variable names, message codes, or transactions.
For more information on the protocol analyzer tool, see Chapters 5 and 6.
LonManager Statistics Application The traffic statistics tool provides access to detailed statistics related to the network's behavior. The statistics include total packet counts, error packet counts, and network loading. The statistics display provides the user with an easy-to-read summary of network activity.
All statistical data is available via Dynamic Data Exchange (DDE), simplifying the creation of custom analysis and display modules using off-the-shelf applications such as Excel and InTouch.
LonManager Protocol Analyzer User's Guide 2-3

2-4 Overview
Statistics can be tracked relative to the last time cleared or over a user-configurable time interval. Multiple copies of the tool can run at the same time, for example to collect cumulative and instantaneous traffic level data simultaneously.
When iconized, the tool displays either a bar graph summary of the bandwidth utilization and the error rate or a simple red light/green light view of current network activity. Bar graphs include user-configurable alarm thresholds — green for normal, yellow for warning, and red for danger. For more information on the traffic statistics tool, see Chapters 7 and 8.
LonManager Diagnostic Application The network diagnostics tool lets you perform network diagnostic and maintenance operations. These operations include:
• Ping and proxy ping — verifies that nodes are alive and responding to messages • Status and proxy status — gathers the internal error counts recorded by nodes • Wink — locates and identifies nodes • Clear status — resets the internal error counts recorded by nodes • Control (reset, offline, and online) — allows isolation and management of
problem nodes
Testing can be done on a one-time basis or repetitively at a user-configurable interval. A database navigator lets you quickly walk through the network and select the nodes on which to operate. Test reports can be saved to a text file to allow further editing and analysis with other Windows tools. For more information on the network diagnostics tool, see Chapter 9.
Relationship with other Echelon Products If available, the LonManager Protocol Analyzer uses a LonManager database to provide addressing and naming information. The LonManager database can be generated by any of the following tools:
• The LonManager LonMaker™ Installation Tool • Any tool based on the LonManager API for Windows • Any tool based on the LonManager API for DOS • Any tool based on the LonManager NSS-10 Module (must be reconstructed; see
Chapter 4 for details) • The LonBuilder Developer’s Workbench (must be converted; see Chapter 4 for details)
If available, the LonManager Protocol Analyzer uses user type, enumeration, and format files to interpret the contents of application messages and non-SNVT network variable messages. The user type and format files used by the LonManager Protocol Analyzer are compatible with those used by the LonManager DDE Server. For more information on using databases, type, enumeration, and format files, see Chapter 4.

3 Using the Channel Interface
Maker Utility
This chapter discusses how to use the Channel Interface Maker (LMCIMKR) utility to create new channel interfaces. Except for viewing saved logs and creating packet capture filters, you must create a channel interface before you can use any of the LonManager Protocol Analyzer tools.
LonManager Protocol Analyzer User's Guide 3-1

Introduction All of the LonManager Protocol Analyzer tools use a channel interface to define the characteristics of the network to which they are attached. The channel interface provides a shorthand method of specifying all the characteristics at once rather than having to specify them all each time a tool is run.
A channel interface specifies:
• Global network properties. This tells the tools the format files to use to interpret network messages and, optionally, the LonManager database that contains network naming information. See Chapter 4, Working with Database, Names, Type, and Format Files, for a list of the benefits of using a LonManager database and format files with the protocol analyzer tools.
• Local channel properties. This tells the tools the characteristics of the specific channel with the network to which they are attached. In a multi-channel network, if you wish to physically move the tools from one channel to another, you must create a unique channel interface definition for each channel to which the tools will be attached.
• PC interface card properties. This tells the tools the name of the network driver to use to access the network. The driver specifies the I/O port address and interrupt to use on the protocol analyzer card. See Chapter 1, Installing the LonManager Protocol Analyzer, for information on how to configure and install network drivers.
The LonManager Channel Interface Maker utility, LMCIMKR, is used to create, edit, and delete channel interface definitions.
Using the LMCIMKR Utility
Starting the Utility To start the channel interface maker utility, double click on the LMCIMKR icon in the LonManager Protocol Analyzer program manager group. To exit LMCIMKR, click CLOSE from the Channel Interface Definitions window.
The LonManager Channel Interface Maker Figure 3.1 The LMCIMKR icon
3-2 Using the Channel Interface Maker

Creating a New Channel Interface Definition If you have not yet defined any channel interfaces, LMCIMKR starts at the Create a New Channel Interface window, shown in figure 3.2.
Figure 3.2 The Create a New Channel Interface Window, Using Standard Transceiver Types
If you have previously created channel interface definitions, LMCIMKR starts at the Channel Interface Definitions window, shown in figure 3.3. To define a new channel interface from this windows, click the New button. This brings you to the Create a New Channel Interface window.
Figure 3.3 The Channel Interface Definitions window
From the Create a New Channel Interface window, follow these steps to create a new channel interface:
1 Select one or two drivers. The list shows the LONWORKS drivers on your computer. For use with the LonManager Protocol Analyzer or Statistics applications, you should select a driver whose name is LMPAx. The driver name is defined when the driver is loaded; see Chapter 1 for information on how to define the driver names at software setup time. For use with the diagnostics application, you may select a driver whose name is LMPAx or LONx.
If you define two device drivers for the channel interface, you will be able to run all three LonManager Protocol Analyzer tools at the same time. If you define
LonManager Protocol Analyzer User's Guide 3-3

only one device driver, you will not be able to run the diagnostics application when the channel interface is in use by either the protocol analyzer or statistics application.
2 Select a transceiver type or channel name. If you will not be using a LonManager database, select a transceiver type from the Standard Transceiver list. This list is read from the standard transceiver type file STDXCVR.TYP, which the setup program copies into the Echelon tools and utilities directory (by default C:\ECHELON\TYPES). If you are not using a standard transceiver type, you must use a LonManager database to supply the transceiver parameters.
If you will be using a LonManager database, either enter the full database path into the LonManager Database text box at the bottom of the Window or click the Browse... button to select the database path using a standard file open dialog box. In this context, a LonManager database is represented by the file LONDB.DBD, but all the other files that comprise the database need to be present in the same directory. See Chapter 4 for more information about the benefits of using a LonManager database. After you have selected a database, you are returned to the Create a New Channel Interface window and the Standard Transceiver list is replaced by a list of channels defined in the selected database. An example is shown in figure 3.4. Select a channel name from the Channel list. If the database you have selected cannot be opened, then the window indicates that the database you supplied is invalid.
Figure 3.4 The Create a New Channel Interface Window, Using a LonManager Database
3 Name the channel interface, up to 32 characters, including embedded spaces. The first 8 alphanumeric characters of each channel interface name must be unique. This short name is used to with the DDE server function of the traffic statistics application to specify the DDE application name. See Chapter 8 for more information on using the DDE server function of the statistics application.
3-4 Using the Channel Interface Maker

4 Specify the type and format files that are to be used to interpret the packets on the channel. Click Formatting... to display the Formatting dialog box, shown in figure 3.5.
Figure 3.5 The Formatting Dialog Box
For each item, either type in the full path and file name or click the Browse button to select the file using a standard file open dialog box. See Chapter 4 for information on the role of type and format files; see Appendix A for instructions on how to create your own user type and format files.
5 You will need to specify the network interface clock rate if you will be using the diagnostics application with a network interface other than the LonManager Protocol Analyzer card and the clock rate of the network interface is lower than the theoretical maximum for the channel. For example, if you are going to use a TP/XF-78K SLTA as a network interface for the diagnostics application, you will need to specify the clock rate as 5MHz. Click Timing... to display the Timing dialog box, shown in figure 3.6.
Figure 3.6 The Timing Dialog Box
You also can set messaging options used by the diagnostics application in the Transaction Control area of the dialog box.
6 Save the channel interface definition. Click OK to save the new definition. You will be returned to the Channel Interface Definitions window and the new channel interface will appear in the list.
LonManager Protocol Analyzer User's Guide 3-5

3-6 Using the Channel Interface Maker
Editing a Channel Interface Definition To edit an existing channel interface definition you must be in the Channel Interface Definitions window. Click on the definition that you wish to edit to select it and then click the Edit button to bring up the Create a New Channel Interface window. Now follow the steps for creating a channel interface to edit fields, as desired. Click OK when done to return to the Channel Interface Definitions window.
Deleting a Channel Interface Definition To delete a channel interface definition you must be in the Channel Interface Definitions window. Click on the definition that you wish to delete to select it and click the Delete button to remove the definition.

4 Working with Database,
Names, Type, and Format Files
This chapter discusses the benefits of using a LonManager database, the benefits of type and format files, and how to use them with the LonManager Protocol Analyzer tools.
LonManager Protocol Analyzer User's Guide 4-1
Introduction This chapter discusses how you can use a LonManager database and user type, enumeration, and format files to make the LonManager Protocol Analyzer tools easier to use. The LonManager database can come from any LonManager installation tool. The user type, enumeration, and format files are compatible with those used by the LonManager DDE Server.
The Advantages of Using a LonManager Database When a channel interface definition includes a LonManager database, it makes the LonManager Protocol Analyzer tools easier to use. In particular, a database lets the tools do the following:
• The protocol analyzer tool translates network addresses to node names • The protocol analyzer tool translates group member IDs to node names • The protocol analyzer tool translates network variable selectors to network
variable names • The protocol analyzer tool translates network variable indices to network
variable names • The protocol analyzer tool determines network variable type information for
SNVTs (and user types if available in the database) • The network diagnostics tool displays the network topology (domains, channels,
and, for LonMaker databases, locations) and allows you to navigate through the network to select nodes to test
• The network diagnostics tool determines timing parameters to communicate with nodes based on the network topology
• The network diagnostics tool uses authentication keys as specified in the database
Selecting a Database This section discusses the various databases that can be used and any special steps required to use the databases with the LonManager Protocol Analyzer. In general, a database is associated with a channel interface when the channel interface is created; see Chapter 3 for instructions.
Using a LonMaker Database There is no conversion process required to use a LonMaker database. LonMaker stores the database describing a network in the project's DB_INST subdirectory. For example, if the project you are installing is in the C:\FACTORY directory, you would specify C:\FACTORY\DB_INST as the directory when creating the channel interface.
4-2 Working with Database, Names, Type, and Format Files

Using a LonManager API Database There is no conversion process required to use a LonManager API database. Just specify the database path when creating the channel interface.
Using a LonManager NSS-10 Database To use naming information from a system installed by a LonManager NSS-10 module, you must first construct a LonManager database using the utility NSS2LM (available on the LonLink™ Bulletin Board System). To include node and network variable names in the database, you must retrieve them from the host attached to the NSS-10 module, using whatever mechanism it provides. In an NSS-10 system, the host stores the names of nodes and network variables; the NSS-10 module only stores network-related information.
Using a LonBuilder Database LonBuilder databases must be converted to the LonManager database format before they can be used by the LonManager Protocol Analyzer. LonBuilder lets you develop LONWORKS application nodes and create small prototype networks.
To convert a LonBuilder database, use the utility LB2LM supplied with the LonManager Protocol Analyzer (by default in C:\ECHELON\BIN). To start the utility, double-click on the LB2LM icon. The program will prompt you for the following information.
LonBuilder project directory
This specifies the name of the drive and directory containing the LonBuilder project.
LonBuilder revision
This supplies the release number of the LonBuilder software that created the database. This must be a 3-digit number, 210 for release 2.1 or 220 for release 2.2. The default is 220.
LonManager database directory
This specifies the drive and directory for the new LonManager database. If this directory does not exist, it will be created.
Because of differences between the LonBuilder and LonManager databases, you cannot convert these LonBuilder database constructions:
• LonBuilder connections that are not yet built. Run a successful build before exporting the LonBuilder database.
• LonBuilder application nodes without hardware. The LonManager database does not separate the logical and physical aspects of a node. All imported LonBuilder nodes must be assigned to hardware.
• LonBuilder nodes without associated application images. You may create these incomplete nodes in LonBuilder, but no system build can succeed with this configuration.
• LonBuilder application image records without unique program IDs. LonBuilder allows these, but the LonManager database uses the program ID as a unique identifier.
LonManager Protocol Analyzer User's Guide 4-3

The conversion process exports all database records in the LonBuilder database, even if they are not currently being used by any of the application nodes. Delete unused application images from the database before converting to help avoid any problem with non-unique IDs. The App Node/App Images button in the LonBuilder Navigator lists all the application images in the database.
Working with Names Files The protocol analyzer tool can use a LonManager database to provide names for domains, channels, subnets, nodes and network variables. The protocol analyzer tool also includes a user naming facility that can be used to modify the names taken from an imported database or to assign names when a database is not used.
The easiest way to assign or modify a name is to click the right mouse button on an entry in the packet log display. This may be used for node names and group names. A dialog box appears that asks for appropriate naming information. Names can also be changed using the Edit menu item of the Names menu. Domain names and message code names can only be assigned using the menu. There is no provision to assign names to subnets.
Names are saved in a names file. If the names have changed during a session, you will be given the option to save the names file when you save the associated log file.
Message Code Names For most network objects, names are supplied by a LonManager database. The exceptions are message codes and groups, which must be named manually. Most nodes use LonMark objects and network variables for sharing data, so you will not need to bother naming message codes. If, however, some nodes in your network share data using application messages and you wish to filter messages based on these codes (see Chapter 6), you must manually create names for the message codes.
To create a name for a message code, select the Edit Message Code item from the Names menu. This displays a dialog box like the one shown in figure 4.1.
Figure 4.1 The Edit Message Code Dialog Box
This dialog box contains three fields:
Name The name to be assigned to the message code.
Code byte The message code, in decimal. For application messages, the code byte should be between 0 and 62. For foreign frame messages, the code byte should be between 64 and 78.
4-4 Working with Database, Names, Type, and Format Files

Format type The name of the format specifier used to interpret messages with this code. See Appendix A for details on how to create format specifiers for messages and user-defined network variable types.
After you have filled in the fields, click OK to close the dialog box and save the changes or Cancel to close the dialog box without saving the changes.
Group Names A group of nodes may be assigned a symbolic name with using the Edit Groups item of the Names menu. A group is identified by its decimal group ID in a specified domain. LonManager databases do not contain names for groups, so this option provides a convenient mechanism to assign a name to a group. You can also create group records by right-clicking on the destination address field of a multicast message.
Node Names A node may be assigned a symbolic name using the Edit Nodes item of the Names menu. Enter a name for the node. The Edit Node Data dialog box contains fields that specify the decimal subnet and node IDs in one or both of the node's domains, as well as the hexadecimal Neuron ID of the node. If you create a node record by right-clicking on a service pin message, the Neuron ID is automatically filled in. You can also create node records by right-clicking on either the source address field, or the destination address field of a unicast message.
If you wish to associate the node with one or more groups, click on the group button, and enter the decimal values for the group ID and the member ID within the group. This is used for decoding reminder packets for group-addressed messages.
You may also define symbolic names for network variables on the node. Click on the Net Vars Edit button, and you can edit the descriptions of network variables. Each network variable has an associated direction (in or out), an index, which is the ordinal position of its declaration in the node's Neuron C program, and a selector, which is assigned by the binder. You can also assign a format for displaying values of this network variable. The format may be derived from a SNVT ID, in which case the format is defined in the SNVT.FMT file. The format may be derived from a user type ID or a user type tag, in which case the format is defined in the USER.FMT file. See Appendix A for more details on user formats.
The Advantages of User Type, Enumeration, and Format Files For network management messages, network diagnostic messages, and network variable messages that use a SNVT (if used with a database), the protocol analyzer tool displays each packet’s contents in human readable form as a formatted text string, rather than as a series of numbers. For application messages, foreign frame messages, and network variable messages that use a non-SNVT, by default the protocol analyzer displays the data as a series of decimal or hexadecimal bytes.
LonManager Protocol Analyzer User's Guide 4-5

4-6 Working with Database, Names, Type, and Format Files
By providing your own, user-defined type, enumeration, and format files, the protocol analyzer can interpret and display application messages, foreign frame messages, and network variable messages that use a non-SNVT as formatted text strings.
Specifying User-defined Types See Appendix A for details on the role of type, enumeration, and format files and for instructions on how to create them. User and SNVT type and format are associated with each channel interface definition when the channel interface is created; see Chapter 3 for details.

5 Using the LonManager Protocol
Analyzer Application
This chapter discusses how to use the protocol analyzer tool to capture and analyze the LonTalk packets on a LONWORKS channel. For greater detail on each topic, see the on-line Windows help. To use this tool you must first create a channel interface; see Chapter 3 for details on using the Channel Interface Maker tool (LMCIMKR).
LonManager Protocol Analyzer User's Guide 5-1

Introduction The protocol analyzer tool simplifies network maintenance and diagnostics by collecting, time-stamping, and saving all network communications into log files that can be later viewed and analyzed. Multiple copies of the tool can run at the same time, for example to collect packets from multiple channels in a multi-channel network.
The protocol analyzer is a multiple document interface (MDI) application. This means that multiple documents (logs) can be open at the same time. The following terms are used to describe logs:
Active log
The active log is used to save incoming LonTalk packets. Active logs are created using the button at left or the Create New Log... menu item in the File menu. The initial active log name is CI.ACT where CI is the short name of the channel interface.
There can be only one active log per copy of the protocol analyzer tool at a time. You can run multiple copies of the protocol analyzer tool to create multiple active logs or you can use the Duplicate menu item in the Window menu to create multiple views of an active log; see Viewing Different Parts Of The Same Log later in this chapter for details. If you will only be viewing saved logs, there is no need to create an active log.
The active log may have monitor mode enabled or disabled. When monitor mode is enabled, the log display is refreshed and shows newly arrived packets at a user-defined interval. By default, this interval is every 1/4 second; it can be changed using the Preferences... menu item of the File menu. When monitor mode is disabled, you must manually refresh the log display (using either the button at left, the Refresh Display menu item in the View menu, or the Ctrl+R key) to show newly arrived packets.
Saved log
A saved log is a log file from a previous session that was saved to disk. Saved logs are opened using the button at left or the Open Saved Log... menu item in the File menu. You can view and analyze the contents of a saved log, but you cannot make it active again. You can open as many saved logs as you wish.
Current log The current log is the log that you are working on; all actions apply to the current log. Only one log can be current at a time. The current log has a solid title bar and its name appears in the protocol analyzer’s title bar.
5-2 Using the Protocol Analyzer Application

Minimized log Log files can be minimized (turned into an icon) to save space on the display. The name of each minimized log is shown in the caption below the log icon. You can minimize as many log files as you wish, including the active log.
To simplify interpretation and analysis, you can specify match criteria when viewing logs. Matching can be used to display related packets in the same color, or to extract packets. See Using the Match Feature to Simplify Log Analysis later in this chapter for details.
To limit the number and types of packets that are saved in the active log, you can specify a capture filter. See Chapter 6 for details on how to create and use filters.
Starting the Application To start the protocol analyzer application, double click on the LM Protocol Analyzer icon in the LonManager Protocol Analyzer program manager group.
The LonManager Protocol Analyzer
Figure 5.1 The Protocol Analyzer Icon
You also can start the protocol analyzer from the Tools menu of the statistics or diagnostics application.
Selecting a Channel Interface After the startup copyright screen, the select channel interface dialog box, as shown in figure 5.2 appears. This dialog box contains a list box of all the channel interfaces that you have created. For example, in figure 5.2 there are two channel interfaces listed, Corporate Headquarters and New Jersey Plant, that were created as described in Chapter 3. You must select a channel interface to be able to capture and log packets. If you will only be viewing saved logs, you can click None. The channel interface you select must not be in use by another copy of the protocol analyzer application or, if the channel interface definition only contains one driver, the network diagnostics application; it can be a channel interface that is being used by a traffic statistics application.
LonManager Protocol Analyzer User's Guide 5-3

,
Figure 5.2 The Select a Channel Interface Dialog Box
If you have not defined any channel interfaces, you will be asked if you would like to create one. If you answer yes, the channel interface maker utility will be started. If you select a channel interface that is already in use, you will see an error message. After clicking OK to clear the error message, the protocol analyzer application will start. In this case, you can view saved logs, but you cannot capture and log packets. If you wish to capture and log packets, you must exit and restart the protocol analyzer application and select a different channel interface.
Command Line Options Instead of having to select a channel interface after the application starts, you can instead specify a channel interface name when starting the application by including a command line option. For example, you could modify the protocol analyzer icon in the program manager to add a command line using the Properties... item in the program manager’s File menu. To specify a channel interface name on the command line, add a switch to the command line as:
-CI<ciname>
where <ciname> is the name of the channel interface to use. For example: C:\LM_PA\LMPA.EXE -CI bottom_port
starts the protocol analyzer with a channel interface named bottom_port. If the channel interface name contains spaces, it must be surrounded by double quotes, e.g., “bottom port”. To start the protocol analyzer without a channel interface, use the command line with -NCI.
The Protocol Analyzer Window A sample of the main protocol analyzer window is shown in figure 5.3. Each area of the window is discussed in the following sections.
5-4 Using the Protocol Analyzer Application

Tool bar
Title bar
Work area
Current log
Menu bar
Minimized log
Status bar Figure 5.3 The Protocol Analyzer Application
Title Bar At the very top of the protocol analyzer window is a title bar, shown in figure 5.4, which contains the standard Windows window controls (control button, minimize button and maximize button) along with the name of the application (LonManager Protocol Analyzer abbreviated as LMPA) and the name of the current log, if any.
Minimize button
Maximize buttonControl button
Current log
Figure 5.4 The Protocol Analyzer Title Bar
Menu Bar Below the title bar are a number of menus, shown in figure 5.5, that contain a number of items. Some menus and menu items are only visible when a log is open. Some menu items are dimmed unless there is an active log.
Figure 5.5 The Protocol Analyzer Menu Bar
LonManager Protocol Analyzer User's Guide 5-5

The following conventions are used within the menu bar:
Underline Each menu has one character that is underlined. To activate the menu from the keyboard, hold down the ALT key and press the underlined character.
For most menu items, one character in the item is underlined. To active the item from the keyboard, press the underlined character after you have selected the menu.
Dimmed text The menu item is not available in the current context.
Check mark A check mark next to the item indicates that it is turned on.
Ellipsis Three dots after the item (...) indicate that the item displays a dialog box when selected.
Arrow A right arrow (∅) next to a item indicates that the item contains sub-items. To display the sub-items, move the mouse to the right, over the arrow.
Short cut If the item has a keyboard equivalent (a short cut), it is shown next to the item. For example if the short cut Ctrl+S appears next to an item, it means that you can activate the same function by holding down the CONTROL key and pressing S.
For more information on the contents of the various menus, see the online help.
Tool Bar Below the menu is a toolbar, shown in figure 5.6, which contains a number of buttons. These buttons provide a quick and easy way to access common functions. Some buttons are dimmed (inactive) if you did not select a channel interface when starting the protocol analyzer application. By default the toolbar is visible; you can hide the toolbar by selecting the Toolbar item in the View menu and removing the check mark next to its name.
Figure 5.6 The Protocol Analyzer Tool Bar
The toolbar contains these buttons:
Starts a new active packet log. This is the same as selecting the New Log File... item from the File menu.
Opens an existing packet log. This is the same as selecting the Open Log File... item from the File menu.
Saves the active log (making it inactive) and, if logging was on, starts a new active log.
5-6 Using the Protocol Analyzer Application
Toggles the active packet log on or off.
Updates the packet log display with recently collected packets. This is the same as selecting the Refresh Display item from the View menu.
Adjusts each column’s width to the minimum width needed to display the column’s contents. This is the same as selecting the Adjust Columns item from the View menu.
Clears the contents of the active packet log. You are not prompted to save the log, even if new packets have arrived since you last saved the log.
Prints the current packet log. This is the same as selecting the Print item from the File menu.
Displays the About dialog box that shows version and copyright information. This is the same as selecting the About... item from the Help menu.
Displays help about a particular topic. When this button is clicked, the cursor changes to a question mark. Click on an area of the window or on a menu item to open the help file to related information.
Work Area Below the toolbar is the work area. The work area contains all the packet logs that you are working with (both the active and saved logs). Figure 5.3 shows one minimized log and one saved log. The Window menu contains the standard Windows options to cascade or tile the open logs and to arrange the icons of minimized logs at the bottom of the work area.
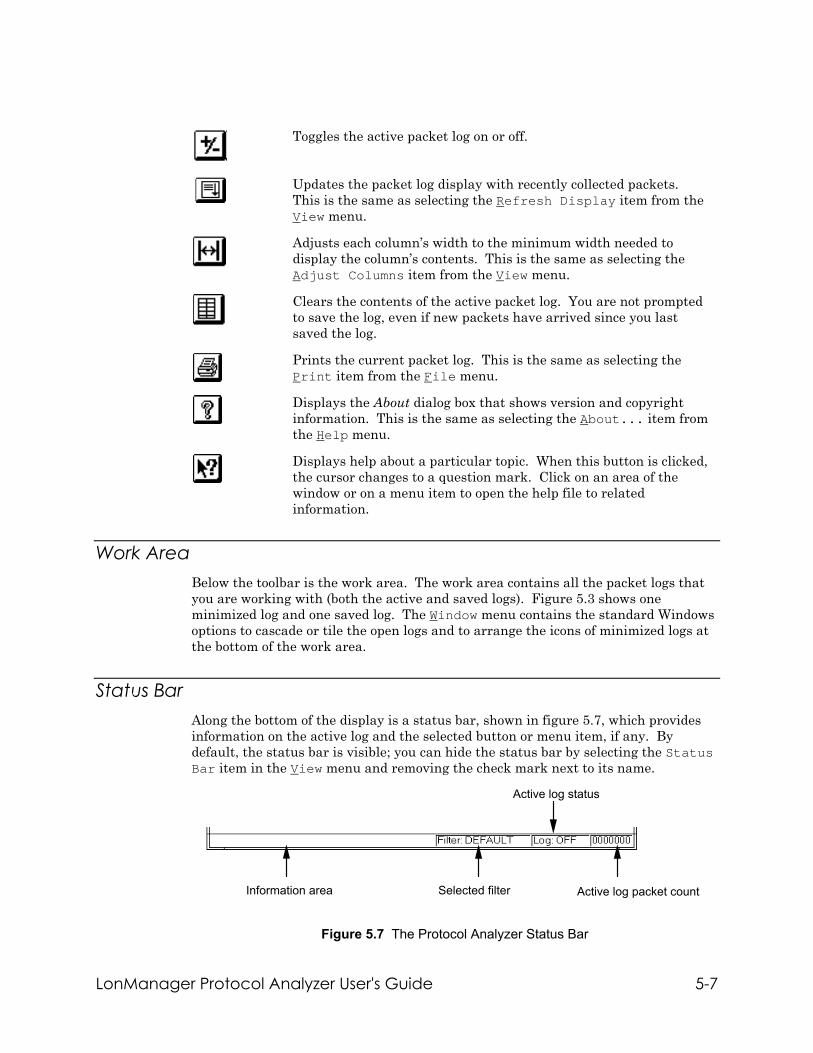
Status Bar Along the bottom of the display is a status bar, shown in figure 5.7, which provides information on the active log and the selected button or menu item, if any. By default, the status bar is visible; you can hide the status bar by selecting the Status Bar item in the View menu and removing the check mark next to its name.
Information area Selected filter Active log packet count
Active log status
Figure 5.7 The Protocol Analyzer Status Bar
LonManager Protocol Analyzer User's Guide 5-7

The status bar contains these fields:
Information area Displays a brief description of the selected button or menu item.
Selected filter Shows the name of the currently active filter.
Active log status Shows the status of the active log: LOG: ON Capturing packets, screen not updated (monitor mode
disabled) LOG: OFF Not capturing packets LOG: MON Capturing packets, screen updated (monitor mode
enabled) LOG: FULL Size of packet log has reached specified number of bytes DISK ERROR Disk is full or a disk write error occurred
Packet count Shows the number of packets contained in the active log.
Working with Packet Logs
Packet Log Contents This section discusses the meaning of each of the packet fields displayed by the protocol analyzer. Packets can be viewed in summary form (one packet per line) or in detailed form (a packet in a window). In addition to good packets, the protocol analyzer can also log these errors: • Bad CRC. This could be due to a collision or noise on the line. • Timeout. A preamble was detected but there was no data. This could be due to
false carrier detection. • Packet too short for the LonTalk protocol. • Packet too long, exceeding the 249 byte limit of the LonTalk protocol. • Preamble too short. This could be due to noise on the line. • Preamble too long. This could be due to false carrier detection.
Summary Form A packet log shows packets in summary view, one packet per line. See the section Selecting Visible Fields and Field Order later in this chapter for details on how to change the fields that are shown in the summary log. See the section Adjusting Field Formats later in this chapter for how to change the display format of each field. This section describes all the fields that are available and the formatting options for each field.
5-8 Using the Protocol Analyzer Application

Num Either the packet’s position in the packet log, or the packet’s order of arrival. When using position order numbering, the packets in the log are numbered sequentially starting with zero. When using arrival order numbering, packets are numbered based on their order of arrival from the network before any filtering is applied. With this numbering scheme, packets will not be numbered sequentially if the filtering process causes some packets not to be logged.
Time An absolute or relative time reference for the packet. The absolute time shows the date and time that the packet was received. The relative time reference shows the packet’s time relative to either the previous packet or to a reference packet. The time stamp is accurate to within 2 milliseconds 90% of the time and to within 50 milliseconds 99% of the time.
Attr The LonTalk messaging attributes of the packet, if any, in either long or abbreviated form. The possible attributes are:
• Priority (indicated by a “P” in abbreviated form). The sender requested that the packet be delivered using a LonTalk priority slot.
• Authenticated (indicated by a “A” in abbreviated form). The packet was sent as part of an authenticated LonTalk transaction.
• Idempotent (indicated by a “I” in abbreviated form). A response message with a data field (beyond the code field).
• Alternate path (indicated by a “L” in abbreviated form). The sender requested that the packet be delivered using the transceiver’s alternate path, if any.
Type The LonTalk protocol service used to deliver the packet.
Source The node name or network address of the node that sent the message.
Dest The name or network address (node, group, or subnet) of the destination of the message.
Data The contents of the data field, if any, in raw or interpreted form.
Msg Class The class of message, either network variable, application, foreign frame, network management, or network diagnostic.
TX The transaction number transmitted with the packet, or the unique transaction ID number assigned by the protocol analyzer’s transaction analysis subsystem.
Length The number of bytes in the entire packet or in the data field.
Display of Symbolic Addresses To display address information (domain, group, node or network variable), the protocol analyzer consults the LonManager database (if any) associated with the
LonManager Protocol Analyzer User's Guide 5-9

packet log. Alternatively, a names file may be created to define symbolic names for these addresses. If a symbolic name is found for the address, the name is used in the corresponding field of the display. If no name is available, the address is displayed in decimal as a domain, group or node ID, or network variable selector. LonManager databases do not contain symbolic names for groups; an arbitrary destination node name is used instead. However groups may be assigned symbolic names with the database naming utility. Subnet names are not displayed; subnets are always identified as decimal IDs.
Detailed Form To view a packet in detailed form, double click on the packet in the summary display. The selected packet is displayed in a window like the one shown in figure 5.8.
Figure 5.8 The Detailed Packet Display Window
In addition to the fields available in summary form, the detailed form shows these fields:
Domain The domain on which the message was delivered.
CRC The value of the cyclic redundancy (CRC) code bytes in the message.
Reminder nodes For reminder type messages, the names or group member numbers of the nodes that have already responded to the message and those that have not already responded. To see this list, click the NodeList button.
To move to the previous packet in the log, click the << button. To move to the next packet in the log, click the >> button. To close the detailed packet display, click the OK button.
5-10 Using the Protocol Analyzer Application

Starting a New Log
To start a new active log, click the button or select Create New Log... from the File menu. The initial active log name is CI.ACT where CI is the short name of channel interface. The log starts in the same mode as the previously active log (monitor mode or view mode) or in view mode if this is the first active log created.
The log file size and behavior are user-configurable. The default maximum log file size is 5,000,000 bytes. The default log behavior is to stop logging packets when the maximum log size is reached. When monitor mode is enabled, the default display update interval is 1/4 second. You can change the maximum log size, the use of a circular log (which causes older packets to be replaced by newer packets when the log limit is reached), and the monitor mode update interval using the Preferences... item of the File menu, which brings up a dialog box such as the one shown in figure 5.9.
Figure 5.9 The LMPA Preferences Dialog Box
This dialog box also lets you select whether or not you will be asked for confirmation before object names (for example the name of a node) are deleted. If the Confirm Deletions item is checked, each time you delete a name, a dialog box will appear asking your to click OK to continue or Cancel to not delete the name.
Saving a Packet Log To save a log, click on the button, or select Save... from the File menu. Saving the active log makes it inactive. If you save the active log while logging on, a new active log is started.
Opening an Existing Log
To open a saved log, click the button or select Open Saved Log... from the File menu. You can then select the desired log file using a standard Windows file open dialog box. Packet log files use an extension of .PAL.
Changing the Display Mode To enable or disable monitor mode, select Monitor Mode from the View menu or use the Ctrl+M keyboard short cut. When monitor mode is enabled, the log display refreshes and shows newly arrived packets at a user-defined interval. By default, this interval is every 1/4 second; it can be changed using the Preferences... menu
LonManager Protocol Analyzer User's Guide 5-11

item of the File menu. When monitor mode is disabled, you can manually refresh the log display (using the button or the Refresh Display menu item in the View menu) to show newly arrived packets.
Pausing an Active Log To pause the updates to the active log, disable monitor mode. See Changing the Display Mode above. To restart the display, re-enable monitor mode. Packets continue to be captured while monitor mode is disabled.
Using the Match Feature to Simplify Log Analysis To simplify analysis by grouping related network traffic, select the Color Cycle Tx item in the View menu. When this option is enabled, related packets are shown in the same color. For example, acknowledgments are shown in the same color as the acknowledged message to which they are responding.
To perform more detailed matching, use the Match... item in the View menu. The match feature makes analysis easier by showing related packets in the same color or by copying packets to a new, extracted, log file. This option cannot be used when monitor mode is enabled or color cycling of transactions is enabled. You can match packets based on any of the following:
• Source node • Destination node • Network variable • Message code • Transaction
To match packets, select a source packet in the packet log (by single clicking on it) and choose Match... in the View menu. This brings up the match dialog box, as shown in figure 5.10.
Figure 5.10 The Select Match Options Dialog Box
5-12 Using the Protocol Analyzer Application

Click OK to start the match search. Packets with matching attributes in the selected category are then colored the same color or, if desired, extracted into a new log.
Starting a new match does not clear the old match. This lets you perform multiple matching operations in series. For example, you might color all the messages from a particular node in red and all the messages to the same node in green to quickly see all the messages involving the node. To clear all attributes associated with previous matches, press CLEAR.
You can also search for a packet in the log which matches a given source node, destination or message data string using the Find... item in the View menu. Unlike match, this search is based on a text string that you supply rather than on an attribute of a packet. Find searches from the beginning of the log. This option cannot be used when monitor mode is enabled or when color cycling of transactions is enabled
To find the next packet in the log that matches the find criteria, select the Find Next item in the View menu.
Stopping and Restarting the Active Log
If packets are being collected and saved in a log, click the button, select Logging from the View menu, or use the Ctrl+L keyboard short cut stops the active log. If the log is off (i.e., packets are not being captured), any of these options will restart the log and start saving packets.
Clearing the Active Log
To clear the active log, click the button, select Clear Active Log from the View menu, or use the Ctrl+C keyboard short cut.
Printing a Log
To print all or part of a log, click the button, select Print from the File menu, or use the Ctrl+P keyboard short cut. You can print either the entire log, the currently displayed packets, or a selected range of packets.
Viewing Different Parts Of The Same Log To view different parts of the same log, select the Duplicate item from the Window menu. Using this feature, you can, for example, have the active log in monitor mode, updating as packets arrive. A second window can show a duplicate copy of the active log in view mode, allowing you to browse back and forth and use the packet matching features to simplify analysis.
LonManager Protocol Analyzer User's Guide 5-13

Setting Display Options This section discusses how to change the look of the summary packet log display.
Selecting Visible Fields and Field Order Choose the Select Fields... item in the View menu to select which fields are displayed in the summary packet log and the order in which they appear. This brings up a dialog box like the one shown in figure 5.11.
Figure 5.11 The Select Fields Dialog Box
The right box, labeled Visible Fields, lists the items that are in the summary display; the left box, labeled Hidden Fields, lists those that are not. To add an item to the summary display, select the item in the Hidden Fields list and click the >> button. To remove an item from the summary display, select the item in the Visible Fields list and click the << button. To change the order in which fields are displayed, select a field in the Visible Fields list and click Up or Down to move the field up or down in the list.
Adjusting Field Formats To change the format of an individual column of data, left-click once on the column header or select the desired column using the Format Fields item in the View menu. This will display a dialog box that lets you select a format appropriate for the selected column. You can change the format for all columns except Type and Msg Class. For all fields, you may specify whether the change is applied only to the current window, or if it is to become the default for all new windows.
For the packet number field, you can display the log sequence number (after filtering) or the arrival sequence number (before filtering). The numeric radix may be decimal or hexadecimal.
For the time field, you can select the format to be one of:
• MM/DD HH:MM:SS:mmm. The packet arrival time is displayed showing the date (month and day) and time (hour, minute, second, and millisecond).
5-14 Using the Protocol Analyzer Application

• HH:MM:SS.mmm. The packet arrival time is displayed showing only the time (hour, minute, second, and millisecond).
• MM:SS.mmm. The packet arrival time is displayed without the date or hour (minute, second, and millisecond only).
• SS.mmm. The packet arrival time is displayed without the date, hour, or minute (second, and millisecond only).
• Relative to previous packet. The packet arrival time is displayed in milliseconds relative to the previous packet in the log.
• Relative to anchor packet. The packet arrival time is displayed in milliseconds relative to a selected packet (the anchor packet).
For the attributes field, you can select which attributes should be displayed, and whether they should be displayed as single-character codes, or as words.
For the transaction number field, you can specify whether to display the LonTalk protocol transaction number (which cycles from 1 to 15), or the unique transaction ID assigned by the protocol analyzer software. The numeric radix may be decimal or hexadecimal.
For the source and destination address fields you can specify that a symbolic name be used if available. The numeric radix for subnet and node IDs may be decimal or hexadecimal.
For the length field, you can specify whether to display the total length of the packet at layer 2, or the length of the user data field. The user data field length does not include the message code or the network variable selector, if present. The numeric radix may be decimal or hexadecimal.
For the data field, you can specify whether data that cannot otherwise be formatted is displayed as a string, as an array of hexadecimal bytes, or not at all, as well as the number of bytes to be displayed. For network variable messages, you can specify whether the name is displayed using the name of the network variable on the source node, or the name of the network variable on the destination node. The numeric radix may be decimal or hexadecimal.
Adjusting Field Widths To adjust the width of a particular column, place the mouse on the right side of the column header where it touches the left side of the next column. Hold down the left mouse button; the cursor will change to a <+>; drag the mouse to the left or right and release the mouse button when the column is the desired width.
To have the column widths automatically adjusted to the minimum needed to display the contents, click the button or select Adjust Columns from the View menu.
Setting the Display Font To change the font used in the summary packet display, select Fonts from the View menu. This displays a standard Windows font selection dialog box. The selected font will be used for all current open and all future packet logs.
LonManager Protocol Analyzer User's Guide 5-15

5-16 Using the Protocol Analyzer Application

6 Using Advanced Protocol
Analyzer Features
This chapter discusses how to use the packet filter and log export features of the protocol analyzer tool. For greater detail on each topic, see the on-line Windows help.
LonManager Protocol Analyzer User’s Guide 6-1
Packet Capture Filters
The Advantages of Packet Capture Filters In active networks with heavy traffic, the amount of data being logged to the log file can be overwhelming. To limit the amount of data being logged to disk and also to limit the amount of data being displayed, you can use a packet filter. This filter limits the amount of information by limiting logged packets to those matching or not matching the criterion specified by the filter.
How Packet Capture Filters Work At any given time, exactly one filter is active per channel. Initially, a default filter is defined which filters out timeout errors but allows everything else through. Like any filter, you can modify the default filter. For example, if you want the default condition to be that all packets be logged, including timeouts, this can easily be achieved by modifying the default filter explicitly. Normally though, new filters should be created rather than modifying the default filter.
As each packet is captured, it is passed through the active packet capture filter, as shown in figure 6.10 at the end of this chapter.
First the packet is analyzed using the global filter. The global filter allows filtering based on the type of packet (for example, an acknowledged message) and the type of addressing used to send the packet (for example, subnet/node ID). If the packet passes the global filter, it is next analyzed using the node filter.
The node filter allows filtering on a node basis. The node filter specifies a list of source and destination nodes. For each source and destination, the filter can be further narrowed to only include certain network variables or message codes. The node filter can also be restricted so that packets only pass if both the source and destination match an entry in the filter list or if either the source or the destination match an entry in the filter list . If the packet passes the node filter, it is next analyzed using the custom filter.
The custom filter is a filter that you create by writing a C program that uses the LonManager Protocol Analyzer API. See Creating Custom Filter Types later in this chapter for more details. If the packet passes the custom filter, it is stored in the active log if you have specified that packets that pass the filter should be logged. If the packet does not pass the filter, it is logged if you have specified that packets that do not match the filter should be logged. For good packet types, the packet type and address filters are in series with the node filter. In other words, good packets are passed only if they pass the packet type filter, the address mode filter, and the node filter. Bad packets are passed if they pass the packet type filter; the address mode filter and the node filter are ignored for bad packet types. By default, a packet passes the node filter if its source address or its destination address are specified by the filter. However, by checking the appropriate box in the node filter screen, you can specify that packets be passed only if the source and destination addresses are specified by the filter.
6-2 Using Advanced Protocol Analyzer Features

Defining a Packet Capture Filter To create a new capture filter, click in the active log window, or bring it to the front using the Window menu. Select the New Filter File item from the Filter menu. This displays the Edit Filter dialog box as shown in figure 6.1.
Figure 6.1 The Edit Filter Dialog Box
To create a new filter, follows these steps:
1 Set global packet-type options. To do this, click on the Global button from the Edit Filter dialog box. This displays the Set Global Filter Options dialog box as shown in figure 6.2.
Figure 6.2 The Set Global Filter Options Dialog Box
From this dialog box, you select the types of packets to filter, whether both the source and the destination must match to pass the filter, and whether to log all packets that pass the filter, or all packets that fail to pass the filter.
LonManager Protocol Analyzer User’s Guide 6-3

The good packet types that can be filtered are: Ackd Acknowledged message or network variable update ACK Acknowledgment Unackd Unacknowledged message or network variable update UnackdRpt Unacknowledged repeated message or network variable
update Request Request message or network variable poll Response Response message or network variable poll response Reminder Multicast message or network variable reminder Challenge Authentication challenge Reply Authentication reply Unknown Invalid PDU type
The bad packet type filter specifies which error types to filter. The error conditions that can be filtered are: • Bad CRC • Timeout • Packet too short • Packet too long • Preamble too short • Preamble too long
The dialog box also includes an ALL button which selects all types and a NONE button which deselects everything.
2 Set global address type options. To do this, click on the Addr Modes button of the Set Global Filter Options dialog box. This displays the Select Address Modes dialog box as shown in figure 6.3.
Figure 6.3 The Select Address Modes Dialog Box
This filter allows filtering on the following destination address modes:
• Neuron ID • Subnet + node identifiers • Group identifiers • Broadcast (subnet or domain)
3 Select the node or nodes to filter messages to and/or from. To do this, click on the Add button from the Edit Filter dialog box. This displays the Select Node to Add dialog box as shown in figure 6.4.
6-4 Using Advanced Protocol Analyzer Features

Figure 6.4 The Select Node To Add Dialog Box
The Domains list box shows all of the domains in your network. To select a domain, click on the name with the left mouse button. The Nodes list box shows all of the nodes within the selected domain. If the first entry in the Domains list box, labeled all, is selected, the Nodes list box shows all nodes in all domains. To select a node, click on its name with the left mouse button and then click the Add button. To close the dialog box without selecting a node, click Cancel.
After you select a node, it appears in the Edit Filter node list. For example, if you select the node named Fan in the Select Node to Add dialog box, the Fan node will appear in the Edit Filter dialog box as shown in figure 6.6.
To remove a node from the list, select a node in the Edit Filter dialog box and click the Delete button.
If no nodes are added, then packets from all nodes pass the filter.
4 For each node, select specific network variables or message codes to filter messages to and/or from. To do this, click on the appropriate cell in the node list of the Edit Filter dialog box as shown in figure 6.5.
Click here to change input options
Click here to change output options
Click here to change the list of filtered network variables Click here to change
the list of filtered message codes
Figure 6.5 Setting Specific Node Filter Options
LonManager Protocol Analyzer User’s Guide 6-5

Based upon the cell in which you click, an appropriate dialog box will appear to let you set specific options. If you click on either the input or output cell, a dialog box like the one shown in figure 6.6 appears.
Figure 6.6 The Input Mode Dialog Box
From this dialog box you can select one of three options for how message to or from this node are filtered:
Pass all packets <TO|FROM> this node
In the case of the input cell, all packets to this node pass the filter. In the case of the output cell, all packets from this node pass the filter.
Don’t pass packets <TO|FROM> this node
In the case of the input cell, no packets to this node pass the filter. In the case of the output cell, all packets from this node do not pass the filter.
Pass only packets qualified by a NV or Msg Code
In the case of the input cell, all packets to the node to the specified network variable(s) or with the specified message codes pass the filter. In the case of the output cell, all packets from this node from the specified network variable(s) or with the specified message codes pass the filter.
If you click on the network variables cell, a dialog box like the one shown in figure 6.7 appears.
Figure 6.7 The Select Network Variables Dialog Box
This dialog box contains two lists. The Input NVs list shows all of the node’s input network variables. The Output NVs list shows all of the node’s output network variables. Clicking the left mouse button on a network variable name adds or removes the network variable from the filter. When the input mode is set to Pass only packets qualified by a NV or Msg Code, only messages directed to a selected network variable pass the filter. When the output mode is set to Pass only packets qualified by a NV or Msg Code, only messages sent from a selected network variable pass the filter.
6-6 Using Advanced Protocol Analyzer Features

If you click on the message codes cell, a dialog box like the one shown in figure 6.8 appears.
Figure 6.8 The Select Messages Dialog Box
This dialog box contains two lists, both show all the message code names that you have defined. See Chapter 4 for information on how to define message code names. When the input mode is set to Pass only packets qualified by a NV or Msg Code, only messages with a selected message code pass the filter. When the output options is set to Pass only packets qualified by a NV or Msg Code, only messages sent with a specified message code pass the filter.
Saving and Loading Filter Files Any number of filters can be defined and a different filter can be associated with each log file. Filters are saved to filter files and can be re-invoked as desired. From the active packet log window, pull down the Filter menu to create a new filter, save the current filter, or open a previously defined filter. A filter is saved as a file with the default extension .PAF.
Creating Custom Filter Types You can develop you own custom filter types using the LonManager Protocol Analyzer API. After checking the global and node filters, the protocol analyzer calls the custom filter function cmFilterPacket() in the dynamic link library LMPAFILT.DLL and passes the contents of the packet. The custom filter function must either return TRUE, to pass the packet, or FALSE, to block it.
By default, the protocol analyzer uses a “stub” custom filter (C source in \LM_PA\EXAMPLES) that returns TRUE for all packets. You can modify this example source if you wish to create your own custom filter. See the file LMPAFILT.C in the \LM_PA\EXAMPLES directory and the include files in the \LM_PA\INCLUDE directory.
Exporting Packet Logs To Other Applications The export function lets you use the data from a packet log in another Windows or DOS application. The export function saves the packet log in a text file, each packet on a separate line, and the fields within each packet separated by a character that you choose (a comma, tab, or space). To export all or part of a packet log, select the Export item from the File menu; a dialog box like the one shown in figure 6.9 appears.
LonManager Protocol Analyzer User’s Guide 6-7

Figure 6.9 The Export What? Dialog Box
From this dialog box you can specify whether to export all packets in the log, all the packets shown on the screen, or a selected range of packets. You can also specify the delimiter character (comma, tab, or space) used to separate the fields within the packet record in the text file. The choice of field delimiter depends on your intended use. For example, some programs, such as Microsoft Excel, treat fields separated by commas as a special type of file known as a comma separated value (CSV) file. These programs can read CSV files and make formatting decisions based on the comma separators. For example, Excel places each field in a unique spreadsheet cell; one record per row and each field in a different column. For the output file name, specify a full file name including drive and path information, just a file name to save to the current working directory, or click the Browse button to display a standard File Save As dialog box.
Click OK to start the export. While the export operation is executing, a progress window shows the total number of records to be exported, the number of records that have been exported, and the percentage of the process that is complete. To stop the export process, click Cancel.
6-8 Using Advanced Protocol Analyzer Features

No
No
No
No
No
No
No
No
Yes
Yes
Yes
Yes
Yes
Yes
Yes
Log
the
pack
et
Log
the
pack
et
Dis
card
the
pack
et
Dis
card
the
pack
et
Pac
ket p
asse
s th
e cu
stom
filte
r?
Pack
et d
estin
atio
n (a
nd n
etw
ork
varia
ble
or m
essa
ge c
ode)
m
atch
es a
n en
try in
node
filte
r lis
t?
Pack
et s
ourc
e no
de
(and
net
wor
k va
riabl
e or
mes
-sag
e co
de)
mat
ches
an
entry
in
n
ode
filte
r lis
t?
Both
sou
rce
and
dest
inat
ion
mus
t m
atch
?
Pac
ket m
atch
es
the
type
and
ad
dres
sing
mod
e sp
ecifi
ed b
y th
e
g
loba
l filt
er?
New
pac
ket
capt
ured
?
Bot
h m
ust m
atch
?
Save
pac
kets
that
pa
ss th
e fil
ter?
Sav
e pa
cket
s th
at
pass
the
filte
r?
Figure 6.10 The Packet Filtering Process
LonManager Protocol Analyzer User’s Guide 6-9

6-10 Using Advanced Protocol Analyzer Features

7 Using the LonManager Traffic
Statistics Application
This chapter discusses how to use the traffic statistics application to observe detailed statistics related to the network's behavior. For greater detail on each topic, see the on-line Windows help.
LonManager Protocol Analyzer User's Guide 7-1

Introduction The traffic statistics tool provides access to detailed statistics related to the network's behavior. The statistics include total packet counts, error packet counts, and network loading. The statistics display provides the user with an easy-to-read summary of network activity.
Starting the Application To start the traffic statistics application, double click on one of the LM Stat icons in the LonManager Protocol Analyzer program manager group.
The LonManager Traffic Statistics Application (DDE enabled, meter icon)
The LonManager Traffic Statistics Application (meter icon)
The LonManager Traffic Statistics Application (LED icon)
Figure 7.1 The LM Stat Icons
There are three icons for the traffic statistics tool in the LonManager Protocol Analyzer program group:
LM Stat & DDE The LonManager Traffic Statistics application in DDE Server mode, with the icon configured as a meter, operating in cumulative mode, with a 1 second interval. In DDE Server mode the application can send traffic statistics to other Windows applications via DDE. See Chapter 8 for instructions on how to use the DDE features of the tool.
LM Stat Meter The LonManager Traffic Statistics application, with the icon configured as a meter, operating in snapshot mode, with a 1/2 second update interval.
LM Stat LED The LonManager Traffic Statistics application, with the icon configured as a light emitting diode (LED), operating in snapshot mode, with a 1/2 second update interval.
You also can start the traffic statistics application from the Tools menu of the protocol analyzer or diagnostics applications.
7-2 Using the Traffic Statistics Application

Selecting a Channel Interface After the startup copyright screen, the Select Channel Interface dialog box, as shown in figure 7.2 appears. This dialog box contains a list box of all the channel interfaces that you have created. For example, in figure 7.2. there are two channel interfaces listed, Corporate Headquarters and New Jersey Plant, that were created as described in Chapter 3. You must select a channel interface to use the traffic statistics application. If the channel interface definition contains only a single device driver, then the channel interface you select must not be in use by the network diagnostics application; it can, however, be a channel interface that is being used by the protocol analyzer application or another instance of the statistics application.
Figure 7.2 The Select a Channel Interface Dialog Box
If you have not defined any channel interfaces, you will be asked if you would like to create one. If you answer yes, the channel interface maker utility will be started. If you select a channel interface that is already in use, you will see an error message. After clicking OK to clear the error message, the statistics application will exit. If you wish to use the statistics application, you must restart it and select a different channel interface.
Command Line Options Instead of having to select a channel interface after the application starts, you can instead specify a channel interface name when starting the application by passing a switch in the command line. For example, you could modify the statistics application icon in the program manager to add a command line using the Preferences... item in the program manager’s File menu. You can set other options via the command line as well. These are the options:
-CI<ciname> Uses <ciname> as the channel interface name and skips the select channel interface dialog box at startup. If the channel interface name contains spaces, it must be surrounded by double quotes, e.g., “bottom port”.
-M Sets the application to use a meter for its icon. See Using the Application in Icon Mode later in this chapter for details.
-L Sets the application to use an LED for its icon. See Using the Application in Icon Mode later in this chapter for details.
-I<n> Sets the display update interval to <n> milliseconds. The default is 1000 milliseconds (one second). See Controlling the Display later in this chapter for the use of this interval.
LonManager Protocol Analyzer User's Guide 7-3

-C Starts the application in cumulative mode. See Cumulative versus Snapshot Mode later in this chapter for details.
-S Starts the application in snapshot mode. See Cumulative versus Snapshot Mode later in this chapter for details.
-DDE Starts the application in DDE server mode.
The default command lines for the three statistics application icons in the Protocol Analyzer program group are as follows:
LM Stat & DDE C:\LM_PA\LMSTAT.EXE -DDE
LM Stat Meter C:\LM_PA\LMSTAT.EXE -M -I 500 -S
LM Stat LED C:\LM_PA\LMSTAT.EXE -L -I 500 -S
The Summary Statistics Windows The statistics application opens to a summary window, as shown in figure 7.3. This window provides a quick view of the network’s operation (bandwidth utilization and error rate) and provides an overview of the configuration of the statistics application (DDE Server active or not, cumulative or snapshot update mode, auto or manual update of statistics, and the update interval).
Figure 7.3 TheTraffic Statistics Summary Display Window
Menu Bar Below the title bar are a number of menus, shown in figure 7.4. The DDE menu items are dimmed unless the application is in DDE server mode.
Figure 7.4 The Traffic Statistics Menu Bar
The following conventions are used within the menu bar:
Underline Each menu has one character that is underlined. To activate the menu from the keyboard, hold down the ALT key and press the underlined character.
For most menu items, one character in the item is underlined. To active the item from the keyboard, press the underlined character.
Dimmed text The menu item is not available in this context.
7-4 Using the Traffic Statistics Application

Check mark A check mark next to the item indicates that it is turned on.
Ellipsis Three dots after the item (...) indicate that the item displays a dialog box when selected.
Arrow A right arrow (>) next to a item indicates that the item contains sub-items. To display the sub-items, move the mouse to the right, over the arrow.
Short cut If the item has a keyboard equivalent (a short cut), it is shown next to the item. For example if the short cut Ctrl+S appears next to an item, it means that you can activate the same function by holding down the CONTROL key and pressing S.
For more information on the contents of the various menus, see the on-line help.
The Detailed Statistics Windows To see a detailed display of all the traffic statistics, click the Details menu item. This pops up the detailed display window. The title bar of the window displays the channel interface name and the display mode (cumulative or snapshot).
Figure 7.5 The Traffic Statistics Detailed Display Window
The Tool Bar The tool bar contains these buttons:
Pause/Resume Controls the display update mode. When the button’s name is Pause, the statistics are updated at the defined update interval; clicking this button pauses the display update, and the button name changes to Resume. Note that the statistics continue to be calculated; only the display is paused. Clicking the button again causes the display to begin updating again.
LonManager Protocol Analyzer User's Guide 7-5
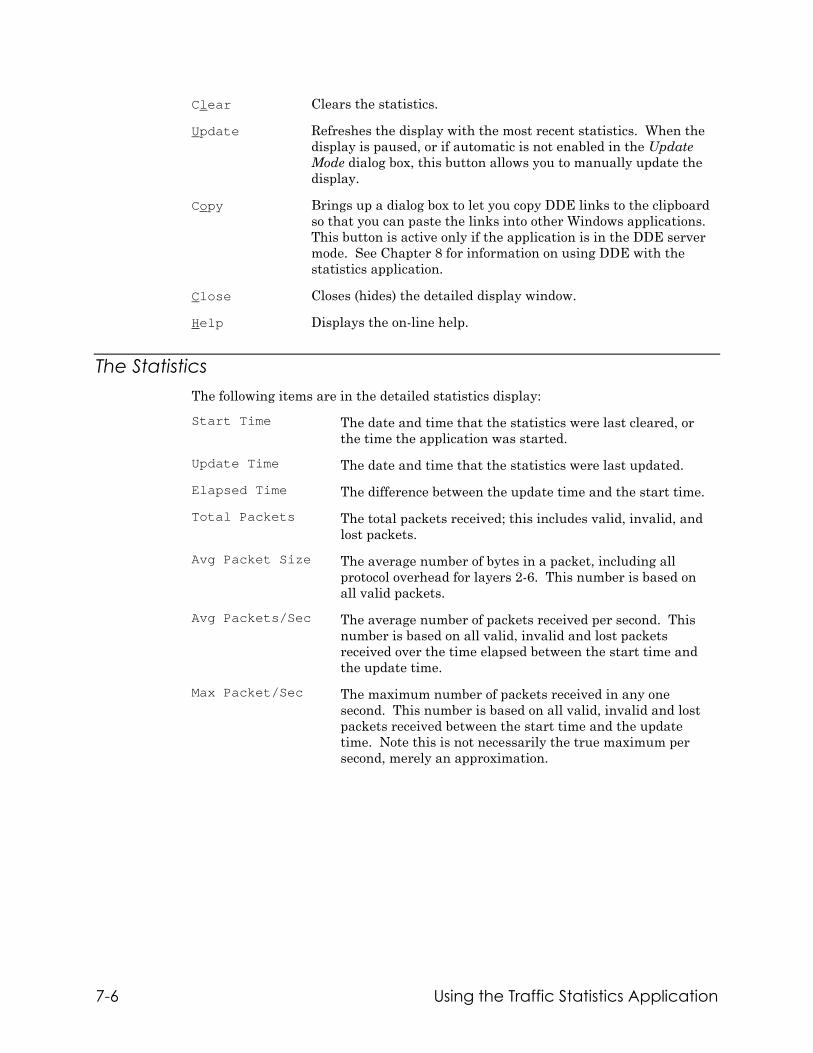
Clear Clears the statistics.
Update Refreshes the display with the most recent statistics. When the display is paused, or if automatic is not enabled in the Update Mode dialog box, this button allows you to manually update the display.
Copy Brings up a dialog box to let you copy DDE links to the clipboard so that you can paste the links into other Windows applications. This button is active only if the application is in the DDE server mode. See Chapter 8 for information on using DDE with the statistics application.
Close Closes (hides) the detailed display window.
Help Displays the on-line help.
The Statistics The following items are in the detailed statistics display:
Start Time The date and time that the statistics were last cleared, or the time the application was started.
Update Time The date and time that the statistics were last updated.
Elapsed Time The difference between the update time and the start time.
Total Packets The total packets received; this includes valid, invalid, and lost packets.
Avg Packet Size The average number of bytes in a packet, including all protocol overhead for layers 2-6. This number is based on all valid packets.
Avg Packets/Sec The average number of packets received per second. This number is based on all valid, invalid and lost packets received over the time elapsed between the start time and the update time.
Max Packet/Sec The maximum number of packets received in any one second. This number is based on all valid, invalid and lost packets received between the start time and the update time. Note this is not necessarily the true maximum per second, merely an approximation.
7-6 Using the Traffic Statistics Application

Good Packets A count of each type of valid packet. Counts are kept of the following valid packet types: • Ackd — Acknowledged message or network variable
update • Ack — Acknowledgment • Ackd/Reminder — Acknowledged message or network
variable update reminder • Challenge — Authentication challenge • Reply — Authentication reply • Request — Request message or network variable poll • Request/Reminder — Request message or network
variable poll reminder • Response — Response message or network variable
poll response • Unackd — Unacknowledged message or network
variable update • UnackdRepeat — Unacknowledged repeated message
or network variable update • Unknown — An unknown message type
Bad Packets A count of each type of error. Counts are kept of the following error types: • CRC error. This could be due to a collision or noise on
the line. • Timeout error. A preamble was detected but there was
no data. This could be due to false carrier detection or a collision on the line.
• Packet too short for the LonTalk protocol. This could be due to a collision on the line.
• Packet too long, exceeding the 249 byte limit of the LonTalk protocol. This could be due to a collision on the line.
• Preamble too short. This could be due to a collision or noise on the line or improper communications parameters in a node.
• Preamble too long. This could be due to false carrier detection.
Lost packets The number of packets lost in the LonManager Protocol Analyzer device or in the network driver. These are packets that were discarded because the protocol analyzer RAM buffers overflowed, or the driver buffers overflowed. This could be due to insufficient CPU time available on the host PC during data capture.
Bandwidth Utilization
The percentage of total available bandwidth consumed by LonTalk packets. This computation includes Layer 1 and media access control protocol overhead in the packet time computation. Invalid and lost packets are assumed to consume an average packet cycle. Beta2 slots are assumed to be Dmean (8) slots for non-priority packets and Prioritymax/2 for priority packets.
LonManager Protocol Analyzer User's Guide 7-7

Error rate The percentage of packets received that represent a network error, in other words
(Bad Packets)*100 (Good Packets) + (Bad Packets)
Lost packets are not included in this calculation.
Working with the Traffic Statistics Application
Controlling the Display The statistics display shows the key network statistics. The application begins collecting statistics immediately. To pause the display, click the Pause button in the detailed display window; the button name changes from Pause to Resume. Click the Resume button to restart the display. Note that statistics are gathered even while the display is paused. To manually clear the statistics click the Clear button.
By default, the display is automatically updated once a second unless you have specified another rate on the command line when starting the application; see Command Line Options earlier in this chapter for details on how to specify the default update rate. You can change the update rate by selecting the Set Update Mode item from the Options menu of the summary display window. This displays the dialog box shown in figure 7.6.
Figure 7.6 The Statistics Update Mode Dialog Box
By default all statistical data is shown in standard notation. To use scientific notation, select the Set Display Fmt item from the Options menu of the summary display window. This displays the dialog box shown in figure 7.7.
Figure 7.7 The Statistics Display Format Dialog Box
7-8 Using the Traffic Statistics Application

Cumulative versus Snapshot Mode The traffic statistics application operates in one of two modes. In cumulative mode (the default), the statistics are not cleared until you manually clear them. In snapshot mode, the statistics are cleared each time the display is (manually or automatically) updated. It is possible to open multiple instances of the statistics application at the same time, for example to display cumulative data and snapshot data simultaneously. You can change the mode by selecting the Set Update Mode item from the Options menu of the summary display window. This displays the dialog box shown in figure 7.6.
Using the Application in Iconic Mode When minimized, the tool’s icon either displays two bar graphs or a LED pair. The icon provides the most useful information when the application is running in snapshot mode with a frequent update interval. The icon is updated at the same rate as the opened application. The iconic mode is specified when the application is started; see Command Line Options earlier in this chapter for instructions. It can also be changed by selecting the Set Icon Mode item from the Options menu of the summary display window, which displays the dialog box shown in figure 7.8.
Figure 7.8 The Select Icon Display Dialog Box
When using the bar graphs icon, one graph displays the current bandwidth utilization (BWU) and the other the current error rate (ERR). The scale for bandwidth utilization is linear, 0 to 100. The error rate scale is logarithmic from 0 to 100. Each graph is one of three colors, green, yellow or red. To change the thresholds, select the Set Meter Limits item from the Options menu of the summary display window. This displays the dialog box shown in figure 7.9.
LonManager Protocol Analyzer User's Guide 7-9

Figure 7.9 The Meter Display Settings Dialog Box
The default thresholds for bandwidth utilization are 40 and 64%. The default thresholds for error rate are 4 and 8%. The graphs are labeled BWU (for bandwidth utilization) and ERR (for error rate).
When using the LED icon, the green LED is on when a valid packet is received and the red LED when an invalid packet is received or a packet is lost.
7-10 Using the Traffic Statistics Application

8 Exchanging Statistical Data
Using DDE
This chapter provides a brief overview of Dynamic Data Exchange (DDE) and describes how to use it to transfer data from the traffic statistics application to other DDE-compliant Windows applications.
LonManager Protocol Analyzer User's Guide 8-1

Introduction The traffic statistics tool can share its data with other Windows applications using the DDE protocol. This allows tools such as spreadsheets to be tied into the statistics tool for plotting, trending, etc. Note that the traffic statistics DDE server only provides data on the current state of the network channel being monitored. Trending of traffic statistics generally requires applications with powers beyond that of the typical spreadsheet program. Operator interface programs such as InTouch from Wonderware often provide the capability to create trend graphs from DDE server data such as the traffic statistics.
Overview of DDE Dynamic Data Exchange (DDE) defines a standard way for Microsoft Windows applications to share information with one another. The following sections provide a very brief overview of DDE; for a more detailed discussion, refer to any of the technical material mentioned in the Related Reading section of the Preface.
When applications share information with each other using DDE, they are said to be holding a DDE conversation. Each conversation has a well-defined beginning, middle, and end. To begin a conversation, one application, known as the client, or destination application, asks another application, known as the server, or source application, to open a communications channel.
Once a conversation is established, the client can send and receive data from the server on the DDE channel. The traffic statistics DDE server only holds one-way conversations; it sends client statistical data, but does not receive data from clients. For example, an InTouch operator interface (the client, or destination) may ask the traffic statistics DDE server (the server, or source) for the current bandwidth utilization statistic for use in a trend graph of utilization over time.
This chapter uses the following DDE terminology: DDE Dynamic Data Exchange. A standard protocol that Windows
applications can use to exchange information. Conversation An exchange of information between two applications using
DDE. Channel When a DDE conversation is established, it is often referred
to as a communication channel between the two applications. This is not to be confused with a LONWORKS channel, which is a physical medium of communications in a network. Nor is it to be confused with the two ports of the LonManager Protocol Analyzer hardware card, which may or may not be attached to the same LONWORKS channel.
Client or Destination
The originator of the DDE conversation. The destination (client) application sends requests for information to the source (server).
Server or Source The application that responds to the requests of the destination (client) application.
Transaction The destination's request and the resulting response.
8-2 Exchanging Statistical Data Using DDE

Addressing a DDE Message When a client sends out a request to begin a DDE conversation, all DDE servers running on the PC see the message. In order to direct the message to a particular server, the client addresses the message using a two-part hierarchy of application and topic. Once the conversation is established, the client can read or write the value of items within the topic. Application The name of the server to which the message is directed. Topic For the specified application, the type of information that the
client is interested in receiving. A server categorizes the services it provides by topic.
Item Within the context of the specified topic, the name of the specific piece of information that the client wants to receive.
Types of DDE Services A client uses different DDE services during the course of a DDE conversation. The DDE services discussed in this manual are: Initiate A request to start a new DDE conversation. Terminate A request to end a DDE conversation. Request A one-time request by the client for a specific piece of data
from the server. This is also referred to as a Cold or Manual Link. The server does not notify the client of changes; the source only sends the item's value when requested by the destination.
Advise A request by the client for on-going updates for a specific piece of data from the server. There are two types of Advise requests.
Hot or Automatic
Whenever the value of the item changes, the server automatically sends the client the new value.
Warm or Notify
Whenever the value of the item changes, the server sends the client notification that the value has changed. If interested, the destination requests the new value from the source. Note: The traffic statistics DDE server does
not support warm (notify) links. Poke A request from the client to the server to change the
value of a specific piece of data. Note: The traffic statistics DDE server does not
support poke. Execute A request by the client for the server to execute a command.
LonManager Protocol Analyzer User's Guide 8-3

The Traffic Statistics DDE Server All of the statistics kept by the traffic statistics application are available to other Windows applications using DDE. A given statistical item can be monitored simultaneously by up to 8 clients. To establish DDE links, you can either copy an item from the traffic statistic application and paste it into your client application, or you can explicitly establish the link in your client application. Each option is discussed in the following sections.
Some statistics change very frequently, even on a packet by packet basis. To limit the amount of DDE traffic within the computer, the traffic statistics application updates DDE links at a regular interval rather than after each change. For links established using cut and paste link, the DDE update interval is the same as that of the display update interval for the window from which the statistics were copied. For explicitly established links, you specify the update interval (and collection mode) as part of the topic name.
Using Copy and Paste Link to Create DDE Links The detailed statistics window contains a copy option that lets you copy the statistics headings or the statistics themselves to the clipboard. Selecting the copy option displays the dialog box shown in figure 8.1.
Figure 8.1 The Select DDE Links Dialog Box
The headings are simply copied as text and can then be pasted into your client application. The statistics are copied as either data or as a DDE link. You can paste or paste link the statistics into your client application (using cold or hot links) as you wish.
Manually Creating DDE Links If your client application does not contain a paste link option, or if you wish to establish DDE links programmatically, your client application can explicitly specify DDE links by supplying the appropriate DDE application, topic, item syntax. The method used to specify these pieces of information vary by client application; consult your client application’s user’s guide or on-line help for information on how to establish DDE links.
To access the traffic statistics DDE server, you must specify the following names:
8-4 Exchanging Statistical Data Using DDE

Application The application server name is the short name of the channel interface. The first 8 alphanumeric characters of each channel interface name form the short name. When Copy/Paste is used from a statistics window, the server name is LMPAL<x>, where <x> is a unique window handle.
Topic One of: System Used to access the system topics. See the following
section for more details. StatC<I> Used to access cumulative statistics. The update
interval is set to <I> milliseconds. If <I> is not specified, a one second update rate is used. <I> must be between 1 and 32,000. Note that there must not be any spaces before <I>.
StatS<I> Used to access snapshot statistics. The update interval is set to <I> milliseconds. If <I> is not specified, a one second update rate is used. <I> must be between 1 and 32,000. Note that there must not be any spaces before <I>.
StatL Used to link to the statistics application. The update interval and data collection mode is specified by the statistics application.
Item The name of the system item or statistics item that you wish to receive. The items supported in the System topic are shown below in table 8.1. The following session-related items are available in the StatC, StatS, and StatL topics: StartTime UpdateTime TotalPackets AvgPacketSize AvgPackets/Sec MaxPackets/Sec BWUtilization ErrorRate ElapsedTime
The following packet-type-related items are available in the StatC, StatS, and StatL topics: Ackd Ack Ackd/Reminder Request Req/Reminder Response Unackd UnackdRepeat Unknown Challenge Reply CRCError LongPacket LongPreamble Timeout ShortPacket ShortPreamble
The following tool-related items are available in the StatC, StatS, and StatL topics: DeviceLost DriverLost TopicItemList
All application, topic and item names are case insensitive.
The System Topic The System topic is a standard topic supported by almost all Windows DDE servers. The System topic is generally used to find out information about each particular DDE server, such as the server version number and the list of topics the server supports. Table 8.1 lists the items provided by traffic statistics DDE server under the System topic.
LonManager Protocol Analyzer User's Guide 8-5

8-6 Exchanging Statistical Data Using DDE
Table 8.1. The System Topics
Item Name Returned String Formats A list of data transfer formats supported by the server. The statistics
application DDE server returns CF_TEXT. Help A short description of the purpose and use of the statistics application
DDE server mode. Status A list of data transfer formats supported by the server. The statistics
application DDE server returns Ready. SysItems A tab-separated list of the system items supported by the server. The
statistics application DDE server returns Topics SysItems Status Formats Help.
Topics A tab-separated list of the topics supported by the server. The statistics application DDE server returns System StatC StatS StatL.
Command Execution Client applications can use the DDE execute service to control the traffic statistics application. The list of commands available via DDE execute are listed in table 8.2.
Table 8.2 DDE Execute Commands
Command Action Clear Clears the statistics. Pause Pauses the display update. Note that the statistics continue to be
calculated; only the display is paused. Resume Resumes display update after a pause.

9 Using the LonManager Network
Diagnostic Application
This chapter discusses how to use the LonManager Diagnostic Application to test the health of nodes on a LONWORKS network and to perform basic maintenance operations.
LonManager Protocol Analyzer User's Guide 9-1

Introduction The network diagnostic tool lets you perform network diagnostic and maintenance operations. These operations include:
• Ping and proxy ping — verifies that nodes and routers are alive and can communicate with the diagnostics tool
• Status and proxy status — reports the internal error counts and statistics recorded by any node or router
• Wink — locates and identifies nodes programmed to respond to the wink message
• Clear status — resets the internal error and statistics counts recorded by nodes and routers
• Control (reset, offline, and online) — allows isolation and management of nodes and routers
The diagnostic tool provides useful information for locating network communications problems without the need to physically connect the protocol analyzer hardware to the channel being diagnosed. Some examples are described below.
• Any node on the channel may be queried to determine if excessive CRC errors or retries are occurring. It may be possible to determine the location of a problem by observing which nodes are experiencing the greatest number of errors.
• A malfunctioning channel may be completely isolated from the rest of the network by putting the associated router(s) in the off-line mode, thus blocking all traffic from passing through the router.
• Network connectivity problems may be determined by successively pinging nodes, starting with nodes that are close to the protocol analyzer, until the location of a possible break is found. The proxy commands are useful on media such as power line, where communications may not always be possible between the protocol analyzer and a specific node on the network, but there is some intermediate node or router that can communicate with both the protocol analyzer and the subject node. Both the near and far side of any router may be pinged; a router half cannot be used as the agent for a proxy command.
• Application nodes that are in some erroneous state may be reset remotely from the diagnostic application, or disabled by putting them in the offline mode.
Starting the Application To start the network diagnostic application, double click on the LM Diag icon in the LonManager Protocol Analyzer program manager group.
9-2 Using the Network Diagnostics Application

The LonManager Diagnostics Application Figure 9.1 The LM Diag Icon
You also can start the diagnostics application from the tools menu of the protocol analyzer or statistics application.
Selecting a Channel Interface After the startup copyright screen, the select channel interface screen, as shown in figure 9.2 appears. This screen contains a list of all the channel interfaces that you have created. For example, in figure 9.2, there are two channel interfaces listed, Corporate Headquarters and New Jersey Plant, that were created as described in Chapter 3. You must select a channel interface to use the network diagnostic application. The channel interface you select must not be in use by another instance of the network diagnostic tool, a traffic statistics tool, or a protocol analyzer tool.
Figure 9.2 The Select Channel Interface Dialog Box
If you have not defined any channel interfaces, you will be asked if you would like to create one. If you answer yes, the channel interface maker utility will be started. If you select a channel interface that is already in use, you will see an error message. After clicking OK to clear the error message, the network diagnostic tool will exit. If you wish to use the diagnostic tool, you must restart it and select a different channel interface.
Command Line Options Instead of having to select a channel interface after the application starts, you can instead specify a channel interface name when starting the application by passing a switch on the command line. For example, you could modify the network diagnostic
LonManager Protocol Analyzer User's Guide 9-3

tool’s icon in the program manager to add a command line using the Preferences... item in the program manager’s File menu. To specify a channel interface name on the command line, specify the switch as: -CI<ciname>
where <ciname> is the name of the channel interface to use. For example: \LM_PA\BIN\LMDIAG.EXE -CI bottom_port
starts the network diagnostic tool with a channel interface named bottom_port. If the channel interface name contains spaces, it must be surrounded by double quotes, e.g., “bottom port”.
The Main Window
Toolbar
Menu bar
Log area
Status bar
Figure 9.3 The Diagnostics Tool Main Window
Menu Bar Below the title bar are a number of menus, shown in figure 9.4, that contain a number of items. Some menus and menu items are only visible when a log is open. Some menu items are dimmed unless there is an active log.
Figure 9.4 The Diagnostics Application Menu Bar
The following conventions are used within the menu bar:
Underline Each menu has one character that is underlined. To activate the menu from the keyboard, hold down the ALT key and press the underlined character.
For most menu items, one character in the item is underlined. To active the item from the keyboard, press the underlined character after you have selected the menu.
9-4 Using the Network Diagnostics Application

Dimmed text The menu item is not available in the current context.
Check mark A check mark next to the item indicates that it is turned on.
Ellipsis Three dots after the item (...) indicate that the item displays a dialog box when selected.
Arrow A right arrow (∅) next to a item indicates that the item contains sub-items. To display the sub-items, move the mouse to the right, over the arrow.
Short cut If the item has a keyboard equivalent (a short cut), it is shown next to the item. For example if the short cut Ctrl+S appears next to an item, it means that you can activate the same function by holding down the CONTROL key and pressing S.
For more information on the contents of the various menus, see the online help.
Tool Bar Below the menu is a toolbar, shown in figure 9.5, that contains a number of buttons. These buttons provide a quick and easy way to access common functions. Some buttons are dimmed (inactive) if you did not select a channel interface when starting the diagnostics application. By default the toolbar is visible; you can hide the toolbar by selecting the Toolbar item in the View menu and removing the check mark next to its name.
Figure 9.5 The Diagnostics Application Tool Bar
The toolbar contains these buttons:
Clears the log area.
Saves the contents of the log area to disk.
Displays the control panel. The control panel is used to initiate and observe the status operations. This is the same as enabling the Control Panel item from the Window menu.
Cuts the selected text from the log area to the clipboard.
Copies the selected text from the log area to the clipboard.
Prints the contents of the log area. This is the same as selecting the Print item from the File menu.
Displays the About dialog box.
LonManager Protocol Analyzer User's Guide 9-5

Displays help about a particular topic. When this button is clicked, the cursor changes to a question mark. Click on an area of the window or on a menu item to open the help file to related information.
Status Area Below the tool bar is the log area. Progress and results messages from operations are written to this area. By default, all messages are a single line. To receive more detailed messages, enable the Multi-Line Status item from the View menu. You can print the contents of the status area by clicking on the button on the tool bar or by selecting the Print item from the File menu. You can copy text from the status area to the Windows clipboard by clicking on the button on the tool bar or by selecting the Copy item from the Edit menu.
Performing Operations
Selecting Nodes All operations are performed from the control panel, shown in Figure 9.6. To display the control panel, click the button in the tool bar or enable the Control Panel item from the Window menu.
Figure 9.6 The Control Panel
Before running operations, you must first select the nodes on which to operate. This is done by clicking on the Select Nodes button of the control panel or by selecting the Node Selection item from the Window menu. This displays the Select Nodes dialog box, shown in figure 9.7.
9-6 Using the Network Diagnostics Application

Figure 9.7 The Select Nodes Dialog Box
This dialog box displays the contents of the network in one of several different views. The first list shows all of the domains in the network. The second list shows all of the subnets in the selected domain, all of the locations in the network (LonMaker databases only), or all of the channels in the network. You select the view option using the radio buttons at the bottom of the dialog box. The third list shows all of the nodes in the selected subnet, location, or channel. All entries contain an appropriate address or identifier (e.g., domain ID or subnet/node) and, if available, a name. Routers listed as part of a channel or subnet list are operated on based on which half or halves belong to the list.
To select a domain, subnet, location, channel, or node, single click on the item name with the left mouse button. Each list has an <all> entry as the first item in the list. Click on <all> to select all items in the list. Once you have selected a set of nodes, you can hide the node list by clicking on the Close button.
For a proxy operation, you must select an additional node which will serve as the proxy agent for the operation. To do this, click the Use Query Node box on the Diagnostics Control Panel.
Setting Intervals and Counts You can set a repeat count for the number of operations to perform, from 1 to over 4,000,000,000 (232-1). The default is to perform the operation once. You can also select a pause interval between operations, from 0 to over 10,000,000,000 seconds. The default pause interval is 0.25 seconds. Both options are set in the Repetition Control area of the Diagnostics Control Panel.
Running the Operation Once a set of nodes has been selected, you start an operation by clicking on the appropriate action button from the control panel. These are the options:
Ping Verifies that nodes and routers are alive and can communicate with the diagnostics tool (or the proxy node).
Status Reports the internal error counts and statistics recorded by the selected nodes.
Off Line Takes the selected nodes offline.
LonManager Protocol Analyzer User's Guide 9-7

On Line Places the selected nodes online.
Reset Resets the selected nodes.
Clear Resets the internal error and statistics counts of the selected nodes.
Wink Locates and identifies the selected nodes programmed to respond to the wink message.
When interactive mode is used, a communications failure causes a dialog box to appear containing the error information. Click the OK button to continue or the Cancel button to stop the operations.
While an operation is in progress, counters on a status line indicate the progress through the requested number of repetitions, and the name of the node currently being operated on. You can click the Cancel button in the control panel at any time to halt the operation and get a report on that part of the operation that completed.
After each operation completes, a report is displayed in the status area showing the number of operations that succeeded and the number that failed. For each node, the node name (or address) is displayed along with the results.
Using the Results For the status commands in interactive mode, a user window pops up which displays this information:
• Neuron Chip firmware version. A decimal number from 1 to 255. Neuron 3120 Chips may have version 3 or version 4 firmware. Neuron 3120E1 Chips have version 6 firmware. Neuron 3150 Chips may have version 3, 4 or 6 for standard firmware images, and version numbers greater than 127 for custom firmware images.
• Most recent error. The most recently logged firmware error. See the Neuron Chip Data Book, Appendix B for the list of firmware errors and their meanings. The Clear Status command clears this error code. This code is preserved across a Neuron Chip reset.
• Cause of most recent reset . The cause of the most recent Neuron Chip reset is displayed. The reset cause may be Power-up, Watchdog (due to malfunctioning hardware or firmware), External (due to the reset pin being pulled low, for example by a low voltage indicator (LVI) circuit), or Software, due to an application, firmware, or network management command to reset the Neuron Chip. The Clear Status command clears this information.
• Statistics A tally for each of the Neuron Chip error statistics. Transmission errors The number of times the node received packet with
invalid CRC, packet too long for the network input buffer, packet too short, or a timeout
Lost messages The number of times the node received a packet for which no application input buffer was available
Missed messages The number of times the node received a packet for which no network input buffer was available
Transaction timeouts The number of times an acknowledged or request/response message failed after all retries
9-8 Using the Network Diagnostics Application

Receive transactions full
The number of times the node received a packet for which there was no more room in the node’s transaction database
Additionally, for the non-proxy status command, seven traffic statistics are displayed as follows: Messages transmitted The number of packets sent by this node. This
includes retried and repeated packets, but not retransmissions due to detected collisions.
Messages received The number of packets received with a valid CRC. That is, all packets received at layer 3.
Messages for this node The number valid packets addressed to this node. That is, all packets received at layer 4.
Retries The number of retries initiated at layer 4 for acknowledged and request/response service.
Backlog overflows The number of times the estimated channel backlog was capped at its maximum value.
Late acknowledgments The number of times an acknowledgment or response was received with no corresponding active transmit transaction.
Collisions The number of collisions detected. Only available if the node’s transceiver supports collision detection or collision resolution.
These statistics are cleared by the Clear test command or if the node resets.
Status results are sent to the log area of the main window. You can save or print the results from the main window. You can also export the report to a file by selecting the Export item from the File menu. The report is a plain ASCII file using comma separated values (CSV format) so that the data can easily be fed into other programs, such as spreadsheets, that accept CSV format.
LonManager Protocol Analyzer User's Guide 9-9

9-10 Using the Network Diagnostics Application

Appendix A Specifying the Format of User-Defined
Types
This appendix discusses how to use the utilities supplied with the LonManager Protocol Analyzer to specify how to format user-defined variable and message types.
LonManager Protocol Analyzer User's Guide A-1

Introduction The LonManager Protocol Analyzer has the capability to display packets in human readable form as formatted text string, rather than a raw array of numbers. The LonManager Protocol Analyzer does this using type files, enumeration files, and format files. This appendix shows you how to produce the files that the LonManager Protocol Analyzer uses to describe explicit messages and user-defined network variables.
For SNVTs, the LonManager Protocol Analyzer automatically determines the type from the LonManager database. For non-SNVT network variables, the LonManager Protocol Analyzer automatically determines the type from the database if the database specifies user types.
The LonManager Protocol Analyzer includes type, enumeration, and format files for all of the SNVTs. To enable the LonManager Protocol Analyzer to format non-SNVT network variables and explicit messages, you will need to understand and create your own versions of each of these files. The versions you create are referred to in this manual as the user type file, the user enumeration file, and the user format file. The next three sections give a brief overview of how these files work together to make the LonManager Protocol Analyzer more useful.
Type File The devices on the network report the values of their network variables and send and receive explicit messages in “raw” form, as a stream of numbers. Type files define information about the structure of network variables and explicit messages. The LonManager Protocol Analyzer uses the information in the type files to convert the raw data to a scaled display. For example, type definition files may convert a time-of-day reading to hours, minutes, and seconds. For SNVTs, the LonManager Protocol Analyzer uses the type definition file SNVT.TYP (by default located in C:\ECHELON\TYPES) For non-SNVT network variable and explicit messages (user-defined types), you must supply your own user type file. User and SNVT type and format are associated with each channel interface definition when the channel interface is created; see Chapter 3 for details.
For each network variable and explicit message type, the definition file supplies this information:
• The name of the type and the names for any fields within the type. • The units for each field in the type. • The range of values for each field in the type. • The scaling factors that convert raw data into formatted data. By default, this
transformation is a multiplication by one, and an addition of zero. When creating the type file, you can change the scaling factor and offset to convert the fixed point data to appropriate engineering units which will be used to display the data in the packet log.
A-2 Specifying the Format of User-defined Types

Example Assume that one of your network variables is a 16-bit unsigned integer representing the price of a supermarket item in cents, from 0 to 65,535 cents. Define a type for this variable, for example:
typedef unsigned long price_type;
network input price_type product_price;
You might want to scale this number by dividing it by 100 to yield a result in dollars, from $0.00 to $655.35. You do this by defining the scaling factor to be 0.01 in the file that is used to create the type file. See Creating User Type and User Enumeration Files later in this appendix for details.
Enumeration File The user type file also indicates when a type is an enumeration. An enumerated type is a Neuron C feature that allows you to use strings to represent numbers rather than the numbers themselves (e.g., ON instead of 4). In this case, the LonManager Protocol Analyzer uses the user enumeration file to map numeric values into literal strings.
The user enumeration file is read by the LonManager Protocol Analyzer when it starts. For enumerated types, the LonManager Protocol Analyzer translates raw integer data from the network to strings according to the information in the user enumeration file.
Example A node Neuron C program used in a supermarket point-of-sale application has the declarations: typedef enum { NON_TAXABLE, TAXABLE, DISCOUNTED } category; network input category product_code;
Using the enumeration names in conjunction with a format file, the LonManager Protocol Analyzer will display a string for the value of product_code instead of a number, eliminating the need for the user to know what strings map to each numeric value. For example, the Protocol Analyzer will show the value of the variable as DISCOUNTED instead of 2.
Format File The user format files define how the various fields in the data should be arranged to form a meaningful representation to the end-user. The format file uses the information in the type and enumeration files. User and SNVT type and format are associated with each channel interface definition when the channel interface is created; see Chapter 3 for details.
For integer, floating point and enumeration types, the formatting is almost always a simple conversion to ASCII, although you may want to decide otherwise. For structured types (for example, time-of-day expressed in hours, minutes, and seconds), you can specify how the data is to be formatted. Each data type present in the user type file should have a corresponding format defined in the user format file. You
LonManager Protocol Analyzer User's Guide A-3

create this file with a text editor, and the file is processed by the LonManager Protocol Analyzer when it starts up.
Example To display supermarket prices with a dollar sign in the packet log, specify the format
text( "$ %f" )
to be associated with the type price_type.
Overview of the Process Creating user type, user enumeration, and user format files is a multi-step process. Each step is covered in detail in the following sections. An overview of the entire process is show in figure A.1.
User type definitions in Neuron C source
USER.H
LMUSRNV
Binary definitions of user enumerations USER.ENM
ASCII intermediate user type definitions
USER.DEF
Text Editor (optional)
LMUSRTYP
Binary definitions of user types USER.TYP
LonManager Protocol Analyzer
Binary definitions of standard enumerations
SNVT.ENM
Binary definitions of standard types
SNVT.TYP
ASCII definition of standard formats
SNVT.FMT
Text Editor
ASCII definition of user formats USER.FMT
Text Editor (optional)
Text Editor
Figure A.1 Type and Format Definition Processing
A-4 Specifying the Format of User-defined Types

Creating User Type and User Enumeration Files The first step in the process is to create user type and enumeration files. Two utilities are supplied with the LonManager Protocol Analyzer to facilitate the definitions of user-defined types and formats. They are LMUSRNV and LMUSRTYP. Refer to Figure A.1 for a flow chart of the process when using these utilities.
A brief list of the procedures follows. Detailed descriptions of each step can be found in later sections. These procedures assume that you have access to the Neuron C source code of the nodes that you wish to monitor or control. If the nodes are host application nodes (using the a PCLTA, SLTA, or the MIP), you will need to create the equivalent Neuron C declarations as an input to this process.
1 Write the Neuron C application program. All structure, union, and typedef declarations for user-defined network variables should be in one or more separate header files.
2 Check the program for syntactic correctness, using the Neuron C compiler, if available.
3 Use the LMUSRNV utility (see the next section) to process network variable and explicit message type definitions (typedefs) from a C header file into an ASCII intermediate file. You can edit the intermediate file if necessary. LMUSRNV also produces a binary file containing the enumeration literals for user-defined enumerations.
4 Use the LMUSRTYP utility to convert the intermediate file into the binary format user type file that the LonManager Protocol Analyzer requires. No additional processing is required for the enumeration file.
Using the LMUSRNV Utility LMUSRNV, the network variable definition utility supplied with the LonManager Protocol Analyzer, converts one or more header files that define the structures, unions, and typedefs—used in defining network variables and messages—into two files: USER.DEF and USER.ENM. USER.DEF is an intermediate file that you can edit before you convert it to a binary form. USER.ENM is a binary file that the LonManager Protocol Analyzer can use directly.
To use the LMUSRNV utility, double-click on the LMUSRNV icon in the LonManager Protocol Analyzer program group. You will be prompted for the output directory. Next LMUSRNV will prompt you for the files to process (full path and file name). Enter one file name per line. These include files should only contain relevant typedef, structure, union, and enumeration definitions. Once all of the file names have been entered, press the ENTER key to continue.
As LMUSRNV executes, it reports its progress, including the number of structure or typedef definitions created and the number of enumeration definitions created. It also reports any errors as they occur. This utility produces two files, the intermediate file (named USER.DEF) and the user enumeration file (named USER.ENM); they are placed in the directory you specify. If you wish, you can rename these files.
LonManager Protocol Analyzer User's Guide A-5

Limitations of LMUSRNV The LMUSRNV utility has limitations in handling the code from input files. Notice these cases: 1 LMUSRNV does not support nested structure or union declarations; you must
manually expand the definitions.
LMUSRNV does not support LMUSRNV does support struct a { struct b { int f1; int f3; int f2; int f4; struct b { }; int f3; int f4; struct a { } f5; int f1; }; int f2; struct b f5; };
2 LMUSRNV does not support compiler preprocessor commands. If a C pre-processor
is available, run the include files through the C pre-processor and then through LMUSRNV. If a preprocessor is not available, you must manually edit the files.
LMUSRNV does not support LMUSRNV does support
#define uint unsigned int
typedef unsigned int uint;
struct a { struct a { uint f1; uint f1; uint f2; uint f2; #ifdef TEST }; int f3; #endif };
3 LMUSRNV does not support comma-separated typedef declarations; you must
manually expand the definitions.
Note: Pointer types are not valid for network variables. Remove them from the include file or the intermediate file.
LMUSRNV does not support LMUSRNV does support
typedef unsigned int uint, typedef unsigned int uint;
*uint_p; typedef unsigned int *uint_p;
4 LMUSRNV does not support multiple definitions for the same literal or type name.
An example of such a case is when two files declare a type with the same name but different definitions. If a redefinition is encountered, LMUSRNV displays an appropriate error message, but continues to completion, producing intermediate and enumeration files. When this occurs, inspect the intermediate file to ensure that it contains the correct definitions. If one name requires more than one definition, then either re-name a definition before running LMUSRNV, or run
A-6 Specifying the Format of User-defined Types

LMUSRNV several times and merge the resulting intermediate files. You cannot merge enumeration files.
5 LMUSRNV does not check the syntax or legality of Neuron C code; it assumes that
all input files are syntactically correct Neuron C code.
Editing Type Definition Files When LMUSRNV runs, one of the files it produces in an intermediate file which you later process with LMUSRTYP to produce the user type file. You can, if desired, change the information in the intermediate file. Here is an example showing the contents of this intermediate file:
line 1 # Calendar struct 3 ! TIEDECL.H line 2 Type description line 3 Reserved
0 65535 1 0 0 * 0 255 1 0 0 * 0 255 1 0 0 *
field 1
field 2
field 3
Year ! Range ! Scaling Factors ! Units Month ! Range ! Scaling Factors ! Units Day ! Range ! Scaling Units ! Units
long unsigned
short unsigned
short unsigned
These are parts of a type definition file: line 1 The index of the type (a number or the # sign), the name of this type (in
this case Calendar), its data type (in this case structure), the number of fields in the data type (in this case 3), and a comment (in this case
! TIEDECL.H).
The first field in the line is the index. Indices must be sequential, starting with 1, or # to instruct the LMUSRTYP utility to use the next
LonManager Protocol Analyzer User's Guide A-7

available index number. The comment in this example gives the name of the file that defines the data structure.
line 2 An optional description of the type.
line 3 A reserved line; not for use.
fields Each field consists of four lines that define each field in the variable or
message; structures and unions consist of multiple fields. If you edit the intermediate file, most of the changes will be to the fields. A description of each field line, along with guidelines for making changes follows.
Field Line 1 Field Name The name of the field. Type description
A description of the type and its use. You can replace the default statement Type description. The description can be up to 120 characters in one line, with at least one non-blank character.
Field Line 2
Range
The range for each field. You may want to restrict the range from the default, which is the maximum range for the data type. Minimum and maximum values are for raw data, not scaled data (see below). Both values must be of the declared Neuron C data type. For example, if the data type is short unsigned, the values must be greater than or equal to 0 and less than or equal to 255.
A-8 Specifying the Format of User-defined Types

Field Line 3 Scaling Factors
These factors convert raw values into values that the LonManager Protocol Analyzer displays. The initial factors are 1 0 0, producing no scaling. You may want to change the scaling factor to reflect a change in units. For example, if the raw data is in inches you can multiply by a factor of 12 to change from feet to inches. Note: All scaling factors must be signed integers. If the three values are a, b, and c, then the scaling relationship is:
scaled value = ((raw value +c) * a) * 10b For example, if the range of data for a short int is –100 to 127 and the factors are 5 –1 100, scaling gives these values:
((–100 + 100) * 5) * 10 (– 1) = 0 ((127 + 100) * 5) * 10 (– 1) = 113.5
Field Line 4
Units
This is a character string representing the units of a value, for example, feet or watts. The initial string is “*”, for no units. You can replace * with a description of the actual units. The string must contain at least one character, with a maximum of 16 characters. The LonManager Protocol Analyzer does not use the Units information.
! Comments
Any text following a ! is a comment that the LMUSRTYP utility ignores. It cannot exceed the length of one line.
Using the LMUSRTYP Utility Once all changes have been made to the intermediate file, the next step is to convert the ASCII intermediate file into the binary type file used by the LonManager Protocol Analyzer. This is done using the LMUSRTYP utility.
To use the LMUSRTYP utility, double-click on the LMUSRTYP icon in the LonManager Protocol Analyzer program group. You will be prompted for the output directory and the input file name (full path and file name). As it works, LMUSRTYP reports the number and name of each user-defined network variable type that it adds to the file USER.TYP. It also reports any errors as they occur.
LonManager Protocol Analyzer User's Guide A-9

Note: The type and enumeration files must both have the same name (with the extensions .TYP and .ENM respectively) and reside in the same directory. If you rename one file, be sure to rename the other one as well.
LMUSRNV Error Messages LMUSRNV reports errors while it is working. A list of error messages you might see and what to do about them follows.
Copy error <#> copying file <file name> to <file name>. Verify that there is sufficient disk space on destination drive. Cannot create the specified file. There may not be enough space on the hard disk to store the file.
Error - Insufficient disk space. Cannot create the intermediate definition file. There may not be enough space on the hard disk to store this file.
Error - No input files found. The utility could not find the input files that you named. Check the file and path names and try again.
Error - Too many entries <enum literal> <expected # of entries>. Internal error while creating the user enumeration file. Found more enum literal definitions than expected. Examine the enumerated type definitions to see that they are correct.
Error - Unable to create database, error code=<#>. Unexpected error while creating the TYPEDB database. This is a temporary file that LMUSRNV creates and later deletes. Check that the file TYPEDB.DBD is in the \ECHELON\BIN directory.
Error - Unable to initiate database transaction, error=<#>. Unexpected error while updating the TYPEDB database. This is a temporary file that LMUSRNV creates and later deletes. Check that there is enough disk space.
Error - Unable to locate TYPEDB.DBD. Unable to locate intermediate database definition file (TYPEDB.DBD). LMUSRNV creates and later deletes a temporary database using this file. It should be in the \ECHELON\BIN directory. Locate the file, move it to the correct directory if necessary, and try this utility again.
Error - Unable to open ENUM output file (USER.ENM;). Cannot create the user enumeration file. There may not be enough space on the hard disk to store this file, or the existing user enumeration file is read-only. Check the available storage, or change the attribute for this file to read and write.
Error - Unable to update database, error=<#>. Out of disk space. Cannot update the TYPEDB database. This is a temporary database that LMUSRNV creates and later deletes. There may not be enough space on the hard disk to store this file.
A-10 Specifying the Format of User-defined Types

Error: <input file> (<line #>) Unable to add enum definition for <enum name>/<literal name> (<reason>). Unable to add the specified enum literal definition to the TYPEDB database. This is a temporary database that LMUSRNV creates and later deletes.
<input file> specifies file containing the enumerated type definition.
(<line #>) specifies the line in the input file containing the <literal name>.
<reason> is one of these:
Duplicate key Duplicate literal name. Write error Out of disk space. Err code: <#> Unexpected error <#>.
Error: <input file> (<line #>) Unable to add field definition for <type name>/<field name> (<reason>). Unable to add the specified field definition to the TYPEDB database. This is a temporary database that LMUSRNV creates and later deletes.
<input file> specifies file containing the field definition.
(<line #>) specifies the line in the input file containing the <field name>.
<reason> is one of these: Duplicate key Duplicate field name. Write error Out of disk space. Err code: <#> Unexpected error <#>.
Error: <input file> (<line #>) Unable to add literal definition for <literal name> (<reason>). Unable to add the specified literal definition to the TYPEDB database. This is a temporary database that LMUSRNV creates and later deletes.
<input file> specifies file containing the literal definition.
(<line #>) specifies the line in the input file containing the <literal name>.
<reason> is one of these: Duplicate key Duplicate literal name. Write error Out of disk space. Err code: <#> Unexpected error <#>.
Error: <input file> (<line #>) Unable to add type definition for <type name> (<reason>). Unable to add the specified type definition to the TYPEDB database. This is a temporary database that LMUSRNV creates and later deletes.
<input file> specifies file containing the type definition.
(<line #>) specifies the line in the input file containing the <type name>.
<reason> is one of these: Duplicate key Duplicate literal name. Write error/Out of disk space Out of disk space. Err code: <#> Unexpected error <#>.
LonManager Protocol Analyzer User's Guide A-11

Error: Unable to add file definition for <file name> (<reason>). Unable to add the specified file definition to the TYPEDB database. This is a temporary database that LMUSRNV creates and later deletes.
<file name> specifies file being parsed, and which could not be added to the database.
<reason> is one of these: Duplicate key Duplicate file name. Write error Out of disk space. Err code: <#> Unexpected error <#>.
I/O error copying file <file name> to <file name>. Verify that there is sufficient disk space on destination drive. Cannot copy a file. There may not be enough space on the hard disk to store this file.
Unable to create file. Cannot create a new file. There may not be enough space on the hard disk to store this file, the file name already exists, or the file is read-only.
Unable to open file <file name>. Cannot find the file that you specified. Check the file name and path.
LMUSRTYP Status and Error Messages LMUSRTYP reports error and status messages while it is working. A list of the messages you might see and what to do about them follows.
A total of <#> user types were defined The total number of type definitions found and written in the USER.TYP file.
Could not open '<file name>' for output Unable to open the file required for writing. There may not be sufficient disk space or the file is read-only.
Could not open '<file name>' for input Unable to open the required file for reading. Check that the file exists.
Failure in write to file 'USER.TYP' Cannot update the user type file. Check that there is sufficient disk space.
Internal error while displaying text message Internal error. Notify customer support.
Invalid input file format (line <#>): Bad range line Error at line <#>: the field/type range information is invalid. It must be two decimal numbers between –32768 and 32767.
Invalid input file format (line <#>): Bad scale line Error at line <#>: field/type scaling information is invalid. It must be three integers, each between –32768 and 32767 decimal.
A-12 Specifying the Format of User-defined Types

Invalid input file format (line <#>): Bad struct field name Error at line <#>: invalid structure type field name. The first character must be alphabetic.
Invalid input file format (line <#>): Bad user type number Error at line <#>: user type index is invalid. The indices must be sequential and start with 1, or use # to indicate the next available type index.
Invalid input file format (line <#>): Bitfields not permitted Error at line <#>: a bitfield type is invalid in the current context.
Invalid input file format (line <#>): Could not read type names Error at line <#>: unable to read the type definition.
Invalid input file format (line <#>): First user type info line missing Error at line <#>: type description text not found.
Invalid input file format (line <#>): First line must be 'R<rev#>' Error at line <#>: the first line in the file, which is not a comment, must specify the file revision number for the user type definitions.
Invalid input file format (line <#>): Incomplete array type Error at line <#>: missing type information for the array type.
Invalid input file format (line <#>): Incomplete struct field list Error at line <#>: missing structure type field definitions.
Invalid input file format (line <#>): Invalid 1st type keyword Error at line <#>: first keyword of type definition is invalid. It must be one of these: char short long struct bitfield enum array union
Invalid input file format (line <#>): Invalid 2nd type keyword Error at line <#>: second keyword of the type definition is invalid. It must be either unsigned or signed.
Invalid input file format (line <#>): Invalid array bound Error at line <#>: invalid bound for the array type. It must be a decimal number a decimal numbers between 1 and 31.
Invalid input file format (line <#>): Invalid field count Error at line <#>: invalid field count for the structure type. It must be a decimal number a decimal numbers between 1 and 255.
Invalid input file format (line <#>): Missing array bound Error at line <#>: missing bound for the array type. It must be a decimal number a decimal numbers between 1 and 31.
Invalid input file format (line <#>): Missing bitfield information Error at line <#>: missing offset and size for the bitfield type.
Invalid input file format (line <#>): Missing enum include file name Error at line <#>: missing include file name for the enumerated type.
LonManager Protocol Analyzer User's Guide A-13

Invalid input file format (line <#>): Missing enum type name Error at line <#>: missing name for the enumerated type.
Invalid input file format (line <#>): Missing range line Error at line <#>: field/type range information is not specified.
Invalid input file format (line <#>): Missing scale line Error at line <#>: field/type scaling information is not specified.
Invalid input file format (line <#>): Missing struct field count Error at line <#>: missing field count for the structure type.
Invalid input file format (line <#>): Missing units line Error at line <#>: field/type unit is not specified.
Invalid input file format (line <#>): Missing user type number or definition Error at line <#>: user type index or definition is not found.
Invalid input file format (line <#>): Second user type info line missing Error at line <#>: reserved line not found.
Invalid input file format (line <#>): Struct field def problem Error at line <#>:error in type definitions for structure field.
Invalid input file format (line <#>): The <name> name is too long Error at line <#>: field or type name is too long. The maximum is 16 characters.
Invalid input file format (line <#>): Too many user type definitions Error at line <#>: maximum number of type definitions is 255.
Maximum internal table 1 size exceeded Cannot create a user type file of this size. Reduce the length of the type or field names, or eliminate some type definitions.
Maximum internal table 2 size exceeded Cannot create a user type file of this size. Reduce the length of the type or field descriptions, or eliminate some type definitions.
Creating a User Format File This section describes the mechanism for creating and editing format files. A default format file that defines the formatting for all SNVT types, SNVT.FMT, is included with the LonManager Protocol Analyzer. You should not normally need to modify SNVT.FMT, although you can edit this file if you wish to customize the formats for your application. For non-SNVTs and explicit messages, you must create your own format file.
A format file consists of a series of records, one for each type whose format is being defined. A format record can span several lines and contain spaces. Only spaces within the quotes of a text format type are significant; all other spaces are ignored. Each record starts with the type name (as defined in the type file), followed by a colon. This is followed by a format specifier and a semicolon. The type names used
A-14 Specifying the Format of User-defined Types

in the user format file must match the type names in the user type file created by LMUSRTYP.
Note : Type names are case-sensitive.
User and SNVT type and format are associated with each channel interface definition when the channel interface is created; see Chapter 3 for details.
Overview of Format Specifiers The format specifier determines how the LonManager Protocol Analyzer formats the data. A format specifier is one of: real A single precision, 32-bit, IEEE floating point number int A signed 32-bit integer number discrete An 8-bit value that contains 0 or 1 text(...) Anything else
Example To define formats for the types price_type, count_type, and boolean, these records could be in a user format file: price_type: real; count_type: int; boolean: discrete;
Real Format Specifier The real format specifier indicates a non-integer number. For all formats using the real specification, the following rules apply:
• If it can be determined that the type is a Neuron C int or long, the LonManager Protocol Analyzer converts the data to real.
• If the type is a structure or array and is four bytes or more in length, the LonManager Protocol Analyzer assumes that the data is a floating point number, compatible with the Neuron C extended arithmetic float_type and the floating point SNVTs SNVT_xxx_f. There is no standard information in the type file indicating an IEEE754 32-bit floating point type.
Int Format Specifier The int format specifier indicates a signed or unsigned integer number. For all formats using the int specification, the following rules apply:
• If it can be determined that the type is a Neuron C int or long, the LonManager Protocol Analyzer converts the data to a 32-bit signed integer.
• If the type is a structure or array and is four bytes or more in length, the LonManager Protocol Analyzer assumes that the data is a signed 32-bit integer number, compatible with the Neuron C extended arithmetic s32_type. There is no standard information in the type file indicating a signed 32-bit type.
LonManager Protocol Analyzer User's Guide A-15

Discrete Format Specifier The discrete format specifier indicates an 8-bit value that contains 0 or 1. For all formats using the discrete specification, the data is a single byte containing a 0 or a 1. Only single-byte types or fields are valid.
Text Format Specifier The text format specifier is used for data that is not a simple number. This includes enumerations, strings, characters, and structures. Although the text format could also be used to represent the real, int, and discrete formats, it should not be used in these cases. The purpose of the text format is to represent structured data types where the other formats cannot be used.
Specifying a format string using the text format is similar to specifying a formatting string to the C printf() function, with some simplifications. A format is a quoted string which is displayed in the packet log with certain substitutions. If the format string contains a type code (a percent sign followed by one of the letters c, d, f, m, s, or x), the next item is formatted accordingly. The following table summarizes the type codes that are processed.
Type Code Data Type %c A single character. %d A signed or unsigned decimal number (based on the signedness
defined in the type file). %f A floating point number. %m An enumeration. %s A NULL terminated string. %x An unsigned hexadecimal integer.
Additional text formatting characters are also processed in a format string as follows: \ is used as an escape character to allow inclusion of formatting
characters as text, for example: \% The % character. \\ The \ character. \" The " character.
For all formats using the text specification, the following rules apply: %c Signedness and size are determined from the type file. The base type in
Neuron C must be char, int, or enum. %d Signedness and size are determined from the type file. The base type must
be a Neuron C char, int, or long or a structure or array. If it is a structure or an array of at least four bytes in length, it is assumed to be a Neuron C signed 32-bit number of s32_type.
%f The base type must be a structure, an array, or a fixed point Neuron C int or long. If it is a structure or array of at least four bytes in length, it is assumed to be a Neuron C floating point number of float_type or SNVT_xxx_f type.
%m The base type must be an enumerated list. If an enumeration does not exist for the value, the format string is processed as if it were %d.
A-16 Specifying the Format of User-defined Types

%s The base type must be an array of 8-bit data. String data must be NULL terminated.
%x Size is determined from the type file. The data is always treated as unsigned. The base type in Neuron C must be char, int, or long. If it is a structure or an array of at least four bytes in length, it is assumed to be a Neuron C signed 32-bit number of s32_type.
The following sections provide examples of using the text format specifier in various situations.
Characters If the data is a single ASCII character, then the %c format specifier can be used to convert it to a character. For example, if the format file entry for the type my_char contains the record: my_char: text("%c"); then the LonManager Protocol Analyzer might show the following item value in the log for a variable of this type: "X"
Enumerations If the data represents an enumerated value, then the %m format specifier can be used to convert it to a character string. For example, if there is an enumeration defined in the type and enumeration files such as: typedef enum {NON_TAXABLE, TAXABLE} category;
and the format file entry for the type category contains the record: category: text("%m"); then the LonManager Protocol Analyzer might show the following item value in the log for a variable of this type: "NON_TAXABLE"
Decimal and Hexadecimal Integers If the data is an integer, then the %d or %x format specifiers can be used to convert it to an integer. %d treats the data as signed or unsigned decimal (based on the signedness defined in the type file), and %x treats it as unsigned hexadecimal. If the format file entry for the type numbers contains the record: numbers: text("Number = %d"); then the LonManager Protocol Analyzer might show the following item value in the log for a variable of this type: "Number = -123"
If the format file entry for the type address contains the record: address: text( "Address = 0x%x" );
LonManager Protocol Analyzer User's Guide A-17

then the LonManager Protocol Analyzer might show the following item value in the log for a variable of this type: "Address = 0x1234"
Strings If the data contains an array of ASCII characters which is null terminated, then the %s format specifier can be used to convert it to a string. For example, if the format file for the type my_string contains the record: my_string: text("%s");
then the LonManager Protocol Analyzer might show the following item value in the log for a variable of this type: "Hello World"
Floating Point Numbers If the data contains an IEEE754 floating point number, then the %f format specifier can be used to convert it to a real number. This is suitable for data conforming to the Neuron extended arithmetic data type float_type. For more details, see the LONWORKS Extended Arithmetic Support Engineering Bulletin. For example, if the format file for the type volt_reading contains the record: volt_reading: text("Volts = %f"); then the LonManager Protocol Analyzer might show the following item value in the log for a variable of this type: "Volts = 34.4"
Structures, Unions, and Conditional Text The text format specifier is most commonly used with structures and unions. In this case, fields must be specified. The fields are substituted in the order they appear for the % type codes. The fields are substituted in the order they appear for the When formatting a union or structure, the string to use sometimes depends on the data. The text format supports conditional text formats using the C language syntax for the conditional (ternary) operator '?:'. This syntax is especially useful for specifying the presentation for variable types which contain unions. The general syntax is: field <op> constant ? ( "format_if_true", item list ) : ( "format_if_false", item list ) Where the terms have the following meaning: field field is a field name as specified in the type file. The field name
cannot be an enumeration, array, structure, or union. That is, the field must be a char, int, or long.
<op> <op> is the operation to perform. It is either == to check if field is equal to constant or != to check if field is not equal to constant.
constant constant is a decimal number.
The first format string (the one to the left of the :) is used if the conditional operation (field <op> constant) is true, the second format string (the one to the right of the :) is used if the conditional operation is false.
A-18 Specifying the Format of User-defined Types

For example, if the type definition file used to produce the type file is: typedef enum {NON_TAXABLE, TAXABLE} category; typedef struct { unsigned int tax_rate; unsigned long amount; } taxable; typedef union { taxable taxable_sale; unsigned int amount; } sale_type; typedef struct { category sale_code; sale_type sale_item; } unit_sale;
and the format file for the type unit_sale contains the record: unit_sale: text(("%m sale. ", sale_code), ((sale_code == 0)?
("Amount = $%d", sale_item.amount) : ("Tax rate = %d\%, amount = $%d", sale_item.taxable_sale.tax_rate, sale_item.taxable_sale.amount)));
then the LonManager Protocol Analyzer might show the following item value in the log for a variable of this type:
"TAXABLE sale. Tax rate = 5%, amount = $100"
LonManager Protocol Analyzer User's Guide A-19

A-20 Specifying the Format of User-defined Types