long term monitoring of arroyo toads: multi-year trend
TRANSCRIPT
Long Term Monitoring of Arroyo Toads: Multi-Year Trend Analysis and Program Evaluation
C. Brehme, G. Turschak,S. Schuster, R. Fisher
U.S. Department of the InteriorU.S. Geological Survey

Arroyo Toad (Anaxyrus californicus)
Federally Endangered Monterey County to northern Baja Occupies 25% of former habitat
Habitat Specialist Low gradient streams/rivers Sandy substrates Breeding- low flow shallow pools

MCBCP Arroyo Toad Monitoring: Camp Pendleton
• Coastal southern California-northern San Diego County
• 125,000 acres• 3 major watersheds• 3 major watersheds• 87 km arroyo toad
habitat
Holland 1 km transects 1996-2000

MCBCP Arroyo Toad Monitoring: Program Goals 2003Program Goals 2003Track trends in breeding populations within 3 occupiedTrack trends in breeding populations within 3 occupied drainages (87 km)
Long term monitoring metric least affected by short term fl ifluctuations
Recommend management actions & evaluate effectiveness of actionsactions
Cost effective
Scientifically rigorousScientifically rigorous
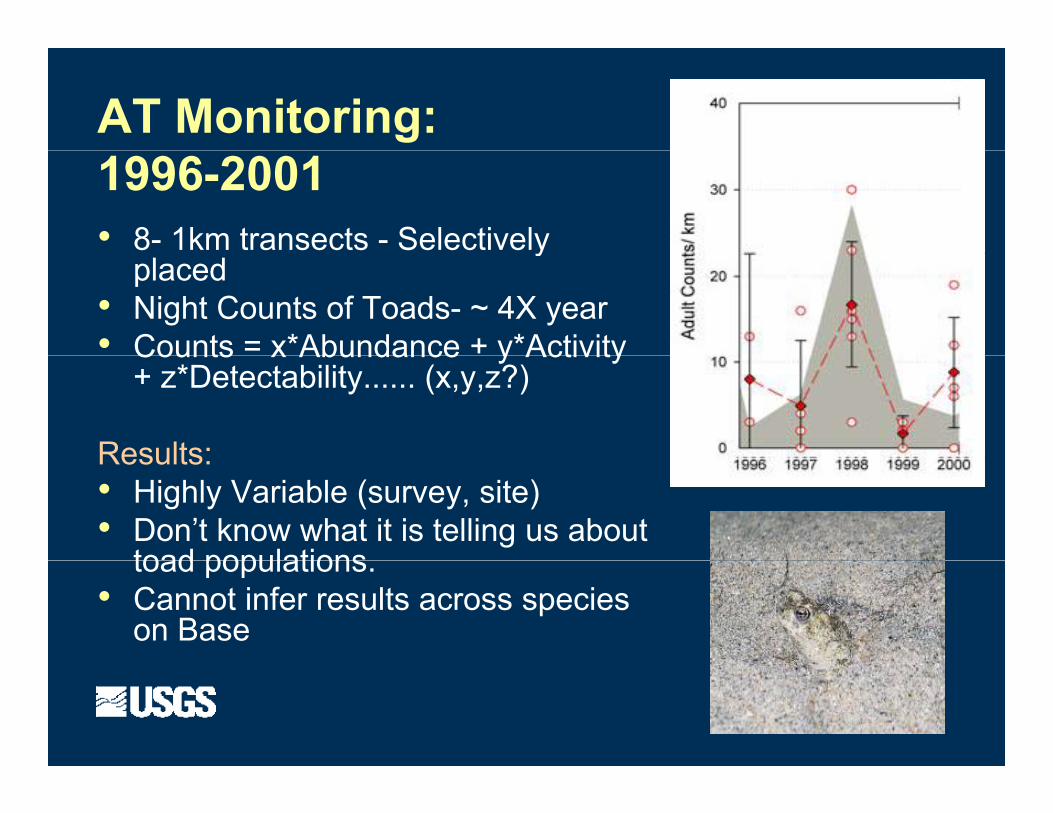
AT Monitoring: 1996-2001• 8- 1km transects - Selectively y
placed• Night Counts of Toads- ~ 4X year• Counts = x*Abundance + y*ActivityCounts x Abundance y Activity
+ z*Detectability...... (x,y,z?)
Results:Results:• Highly Variable (survey, site)• Don’t know what it is telling us about
toad populationstoad populations.• Cannot infer results across species
on Base

Amphibian Research and Monitoring Initiative
MCBCP Arroyo Toad Monitoring: Multi-agency task force
U S Geological Survey U.S. Geological Survey Fish and Wildlife Service
MCB C P dl t MCB Camp Pendleton U.S. Forest Service Outside Independent scientists Brad Shaffer Ted Case, UCSD Norm Scott

Breeding Adult Stage CharacteristicsBreeding is nocturnal in spring after water temperatures reach at least 14 oC and water levels (<30 cm deep) and speed (<5 cm/sec) are appropriate for breeding; females assumed to lay only one egg mass, males may mate with multiple females; prefer darker nightsHabitat ConditionsClear still to slow-moving water with shallow, exposed clean, sandy bottom and open canopy [see influencing factors]Risk Factors (Stressors)Breeding habitat loss due to urbanization; lack of flushing flows and sediment supply causes habitat loss due to natural plant plant succession • Breeding habitat quality degradation and loss due to exotic plants (arundo tamarisk) or to native plants (water cress) • Lack of water in poolsPossible Management Actions
Figure 6. Arroyo Toad Conceptual Model*
Breeding habitat quality degradation and loss due to exotic plants (arundo, tamarisk) or to native plants (water cress) Lack of water in pools due to low annual rainfall, excessive water diversions and/or groundwater pumping • roadkill / crushing by vehicles, people, livestock • predation by raccoons,crows,bullfrogs, bass, crayfish, fire ants, Argentine ants? • light pollution • noise pollution does not appear to affect calling males but may have an effect on female response • aquatic contaminants (sewage effluent, pesticides) • aerial contaminants? fire retardant? • disease?Influencing FactorsEpisodic flushing flows & floods are needed to naturally disturb riparian habitat, clear vegetation on sandy terraces and maintain toad habitat; •Variability in climate, amount of rainfall, and timing of rainfall strongly affect available habitat and breeding. Breeding is limited or may not occur at all in drier years • Water diversions and groundwater pumping can reduce flows • Dams alter the amount and timing of flushing flows
Possible Management Actions•Protect and maintain breeding habitat and connectivity with upland habitats. Maintain sandy soil next to rivers.•Manage natural hydrology and sediment supply to extent possible to allow natural creation and maintenance of toad habitat. Maintain flushing flows during winter and avoid unseasonal floods during spring•Control invasive predators such as bullfrogs, African clawed frogs, non-native fish in and around breeding areas. Control invasive
BREEDING
occur at all in drier years Water diversions, and groundwater pumping can reduce flows Dams alter the amount and timing of flushing flows and sediment supply • Beaver dams block sediment supply and alter river and stream hydrology • Excessive urban runoff can increase peak flows and contain contaminants • Weeds like arundo can slow flows and increase siltation • Ephemeral water habitats that are occasionally dry have lower concentrations of non-native fish and bullfrogs and perennial habitats have higher concentration • Erosion after fires can cause siltation of breeding habitat
Adult Life Stage Characteristics (limited knowledge)Lifespan about 5 years (?); Favor nights for activity
Egg Life Stage CharacteristicsStrings of 2,000-10,000 eggs on sand, gravel, cobble
Females mature: 2-3 yearsMales: 1 2 years
gplants in and around breeding areas (arundo, tamarisk, water cress). Control beavers.•Avoid disturbance, crushing, & siltation of breeding areas by vehicles/humans/livestock during breeding season•Minimize contaminants
ADULTSUplands
BREEDINGJan – Early July**
EGGSFeb-Early July**
Lifespan about 5 years (?); Favor nights for activity, burrow in sand during day; typically do not go more than 0.5-0.75 miles from breeding pools but may travel over 1 mile, distance influenced by topgraphy and microclimate; very dispersed; feed on native ants and other invertebratesHabitat ConditionsCoastal Sage Scrub, Chapparal, oak woodland, but not grasslands (may travel thru grasslands); Require friable
g , , gg , g ,or mud along pool margins away from vegetationHabitat ConditionsSame as breeding habitat; require lack of sediment/turbidity (but can tolerate it for a few days)Risk Factors (stressors)Desiccation due to lack of rainfall, ground water pumping, and water diversions • Disturbance/Siltationdue to humans, vehicles, livestock, floods, run-off,
Males: 1-2 years
12-20 days
JUVENILESUplands
TADPOLESMarch-July**
METAMORPHS (10 17mm)
grasslands (may travel thru grasslands); Require friable soils & permeable plant understory for burrowing.Risk Factors (Stressors)Habitat loss • Lack of connectivity between breeding habitat and uplands • Roadkill / crushing by vehicles •Non-native ants (argentine & fire ants) • Predation-native and house cats • Fire • Pesticides • drought (starvation)
T d l Lif S Ch i i (65 85 d )
, , , , ,fires • Unseasonal flooding can wash eggs downstream • Predation: exotic fishes, crayfish, invertebrates •disease? • Contaminants: pesticides, heavy metals, treated effluent
y
(10-17mm)May-August**Juvenile Life Stage Characteristics (limited
knowledge)Assume moving into upland but may remain by pools for up to 6 months, more dispersed than metamorphs, nocturnal, assume eat native ants & beetles; upland movement is close and parallel to stream and influenced by topography and availability of suitable microhabitat
Metamorph Life Stage CharacteristicsActive during day on sandy benches; still fairly clustered together; feed on native ants and possibly other invertebrates;Habitat Conditions
Tadpole Life Stage Characteristics (65-85 days)Active during day; very cryptic; can disperse downstreamHabitat ConditionsSimilar to breeding habitat, also need detritus, moss, periphytonRisk Factors (stressors)Predation: exotic fishes, garter
k bi d b llf t C hi di t b &
65-85 days
Habitat Conditions & Risk FactorsSimilar to adults
Soft, exposed, sand and moist sandy benches with partial shading adjacent to poolsRisk Factors (stressors)Crushing from vehicles and humans (when still clustered they are especially vulnerable) • Fire ants and Argentina ant displacing native ants • Predation from garter snakes, bullfrogs, birds (killdeer, herons) • Contaminants: pesticides, heavy metals, urban runoff, etc. • Habitat loss (arundo) • compaction of sand prevents metamorph burrowing
snakes,birds,bullfrogs,etc. • Crushing, disturbance, & siltation from humans vehicles, livestock (bison)•Poorly timed flushing events can wash tadpoles downstream into poor habitats • Desiccation due to lack of rainfall, ground water pumping, and water diversions • Disease? • Contaminants: pesticides, heavy metals, treated effluent, urban runoff, etc.
* For details see arroyo toad recovery plan (USFWS, 1999)
** These dates may shift in some years depending on rainfall. Dates also shift in montane or inland desert areas.

MCBCP Arroyo Toad Monitoring: Design Spatial Approach (Proportion Area Occupied Spatial Approach (Proportion Area Occupied-
MacKenzie et al. 2002, 2003) 357 survey transects (250m each) 357 survey transects (250m each) Rotating Panel Design
Atkinson et al. 2003

MCBCP Arroyo Toad Monitoring: Design Spatial Approach (Proportion Area Occupied Spatial Approach (Proportion Area Occupied-
MacKenzie et al. 2002, 2003) 357 survey transects (250m each) 357 survey transects (250m each) Rotating Panel Design S f AT t d l Survey for AT tadpoles
DP: 0.85 vs. 0.45(2003 USGS data)

Intro to Occupancy Monitoringp y gSpatial P ti A Proportion Area
Occupied/Used Detection probability < 1Detection probability 1 Relationship to Abundance
Questions that can be asked (single season): Are perceived differences in occupancy due toAre perceived differences in occupancy due to
differences in ability to detect species? What makes habitat suitable?

Intro to Occupancy MonitoringTemporal Colonization and Extinction **
() & (ε) **
***
*
Questions that can be asked (multiple seasons).....( p ) What factors cause populations to increase/decrease over
time?-- covariates
Are military activities contributing to population increases/declines?
Is my management working?Is my management working?

MCBCP Arroyo Toad Monitoring:y g
E t h t ti ( )
Parameters Covariates
Initial occupancy ()
Entrenchment ratio (, , ε) Sand cover (, , ε) Aquatic veg. cover (, ,, )
Di t b l l ( ) Probability of
detection ()
Disturbance level (, , ε) Artillery, troops, heavy equipment
Hydroperiod (, , ε) Ephemeral/ perennial
Colonization/ extinction (, ε)
Ephemeral/ perennial Pres. of predators/competitors (, , ) Bullfrog, crayfish, mosquitofish, lg pred fish Non native Index (0 4): Total 1st four above Non-native Index (0-4): Total 1st four above
Pres. of low flow shallow water () Index (0-5): [0, 1-10%], 11-25%, 26-50%,
51-75% >75%51-75%, >75%

MCBCP Arroyo Toad Monitoring:Multi-year OccupancyTop Model- 100% AIC weight
γ ε (t ephemeral/perennial)γ, ε (t, ephemeral/perennial)ρ (low flow index, non-native index)
Model AIC ΔAICAIC wgt No.Par. (-2*LogLike)Model AIC ΔAIC wgt No.Par. ( 2 LogLike)
psi,gamma(Year*Hydroperiod),eps(Year*Hydroperiod),p(LowFlow, Year*NNI) 697.04 0.00 0.99 19 659.04 best modelpsi,gamma(Year),eps(Year),p(LowFlow, Year*NNI) 707.1 10.06 0.01 14 679.1psi,gamma(Year),eps(Year),p(LowFlow) 721.81 24.77 0.00 8 705.81psi,gamma(Year),eps(Year),p(Year*NNI) 761.88 64.84 0.00 13 735.88psi,gamma(Year),eps(Year),p(Year) 763.55 66.51 0.00 12 739.55psi gamma(Year) eps(Year) p(NNI) 767 42 70 38 0 00 8 751 42psi,gamma(Year),eps(Year),p(NNI) 767.42 70.38 0.00 8 751.42psi,gamma(Year),eps(Year),p(AqVeg) 774.67 77.63 0.00 8 758.67psi,gamma(.),eps(.),p(LowFlowWater) 778.16 81.12 0.00 5 768.16psi,gamma(Year),eps(Year),p(.) 783.92 86.88 0.00 7 769.92psi,gamma(Year),eps(Year),p(RACA) 784.29 87.25 0.00 8 768.29psi,gamma(.),eps(.),p(Year) 788.2 91.16 0.00 9 770.2psi,gamma(Hydroperiod),eps(Hydroperiod),p(Year) 796.78 99.74 0.00 11 774.78psi,gamma(.),eps(.),p(NNI) 833.62 136.58 0.00 5 823.62psi,gam(.),eps=1-gam,p() 855.53 158.49 0.00 3 849.53psi,gamma(.),eps(.),p(.) 857.09 160.05 0.00 4 849.09 null modelpsi (NNI),gamma(Year*NNI),eps(Year*NNI),p(LowFlow) 86494.18 85797.14 0.00 11 86472.18psi (sand),gamma(Year*Sand),eps(Year*Sand),p(LowFlow*NNI) 87634.78 86937.74 0.00 17 87600.78p ( ),g ( ), p ( ),p( )
Note: Covariates tested for psi included Aquatic Emergent Vegetation Index (AEV), Bullfrog presence (RACA), Crayfish presence (PRCL), Hydroperiod (Ephem/Peren), Low Flow Shallow Water Index (LowFlow), Non-Native Index (NNI), Predatory fish presence (PredFish), and Sand Cover Index (SandCover). (*) denotes an interactive effect was tested between two variables and model parameter estimate. Models are not shown when there is evidence of poor fit (convergence <5 significant digits, no covariance matrix, standard errors>parameter estimates).

Colonization, Extinction (γ,ε) Hydrology Year
Perennial Watershed
0 < ε < 0.40 < γ < 0.9
0 < ε < 0.90 < γ < 0.8
Ephemeral Watersheds
ScouringScouring Event
N N N ND D

Probability of detecting arroyo toads () ↑ Low Flow Shallow water Index 1.9X more likely to detect AT for each level of index C m lati e 13X Cumulative 13X
↓ Non-native index (0-4) : Association varied by year - Peak 2007 Mosquitofish bullfrogs crayfish predatory fish Mosquitofish, bullfrogs, crayfish, predatory fish 4.1X less likely per species/group Cumulative 71X
Multistate models (David Miller, Jim Nichols, Jim Hines)

Non-native species- Direct effects: 2008 Bullfrog Study
2008 Estimate: 125 arroyo toads consumed/ km /month

Feedback Loop to ManagementRemoval of Invasive Aquatic SpeciesRemoval of Invasive Aquatic Species

Feedback Loop to ManagementRemoval of Invasive Aquatic SpeciesRemoval of Invasive Aquatic Species
NNI 2004 NNI 2005 NNI 2006 NNI 2007 NNI 2008 NNI 20090
1
2 L952
3
4
tio- N
egat
ive L-SE
Odds Ratio
U-SE
U95
5
6
Odd
s R
at
Elevated non-native aquatic removal efforts in 2009
7
8
USGS bullfrog removal and study 2008- SMR

Non-native Species ManagementRemoval vs. Hydrologyy gy
Mgmt of non-natives Perennial: many ε = 0Perennial: many ε = 0 Ephemeral: few ε = 1 in dry years(Miller et al. in review)
Santa Margarita River:Santa Margarita River: Upper basin- Discharge of 3cfs
guaranteed Cooperative Water Resources
Management Agreement (CWRMA 2002).
Aseasonal flow from agriculture
Natural drying cycles or NNAq removal in perpetuity

Ephemeral Creeks: AT P l ti D iAT Population Dynamics
•Drought- Stochastic
•Climate Change Concerns
0.8
1.0
Pro
porti
on (+
1 se
)
0.2
0.4
0.6
0.0

MCBCP Arroyo Toad Monitoring:Program Review

MCBCP Arroyo Toad Monitoring:Program ReviewTarget Detect 20% declineTarget- Detect 20% decline
Evaluate 4 sampling scenariosEvaluate 4 sampling scenarios Current Design: 60 permanent + 60 5-yr rotation
Alternate 1: same effort: 120 permanent sites
Alternate 2: reduced effort: 60 permanent sites
Alternate 3: reduced effort: Current design-
sampled every other year

Power AnalysisData simulated: 20% decline over 6 years Perennial: Constant slow decline Ephemeral sites: Variable declines/ increases (good & bad years)
Simulated Decline of 20% over 6 Years1.0
ea O
ccup
ied
0.6
0.7
0.8
0.9
Pro
porti
on W
et A
re
0 2
0.3
0.4
0.5
Constant (γ=0.01, ε =0.05).
G B B G B:
Year
1 2 3 4 5 6
P
0.0
0.1
0.2 G-B-B-G-B: G (γ=0.85, ε =0.01), B (γ=0.01, ε =0.16).

Power Analysis“Power is probability a study will find a significant effect if it
exists”exists
Model Comparisons• Likelihood Ratio Tests (True model vs. Null hypothesis)
• Power from non-central chi-square distribution (α= 0.05)
(Burnham et al. 1987, Bailey et al., 2007, Mattfeldt et al. 2009)
Bias, Precision, Power t-test (Year 1 vs. Year 6)

Data simulated: 20% decline over 6 yearsPower to Distinguish GroupsPower to Distinguish Groups
ed 0.8
0.9
1.0
ed 0.8
0.9
1.0
Ψ, γ (t), ε (t), ρ (.)
on W
et A
rea
Occ
upie
0.4
0.5
0.6
0.7
on W
et A
rea
Occ
upie
0.4
0.5
0.6
0.7 Ψ, γ (t*eph, per), ε (t*eph, per), ρ (.) “true”
1 2 3 4 5 6
Pro
porti
o
0.0
0.1
0.2
0.3
1 2 3 4 5 6
Prop
ortio
0.0
0.1
0.2
0.3
YearYear

Data simulated: 20% decline over 6 yearsPerennial system: decline vs no declinePerennial system: decline vs. no decline
Ψ ( ) ε ( ) ρ ( )
%
ed 0.8
0.9
1.0
Ψ (.), ε (.), ρ (.)tio
n W
et A
rea
Occ
upi
0.4
0.5
0.6
0.7 Ψ, γ (.), ε (.), ρ (.) “true”
Y
1 2 3 4 5 6
Pro
port
0.0
0.1
0.2
0.3
Year

Data simulated: 20% decline over 6 yearsEphemeral system: variable decline vs constant declineEphemeral system: variable decline vs. constant decline
ed 0.8
0.9
1.0
Ψ, γ (.), ε (.), ρ (.)
tion
Wet
Are
a O
ccup
ie
0.4
0.5
0.6
0.7 Ψ, γ (t), ε (t), ρ (.) “true”
Y
1 2 3 4 5 6
Pro
port
0.0
0.1
0.2
0.3
Year

MCBCP Arroyo Toad Monitoring Program Review :Conclusions & RecommendationsConclusions & Recommendations
Current and alternate sampling strategies evaluated all have high power to detect:to detect:Differing patterns of decline among watershedsAnnual fluctuationsLong term gradual declineLong-term gradual decline
R d d St t iRecommended Strategies:Trends over time = 120 permanent sites Coverage of entire Base over time = current program (60 perm+60 rotation)R d d ff t 60 t itReduced effort = 60 permanent sites
Sampling every other year not recommended due to importance of wet year for assessing status of populations in ephemeral systems.

Current/ Recent Arroyo Toad Studiesy
•Monitoring in San Diego County- Post-fire•Life Span/ Age distributions: Skeletochronology•Life Span/ Age distributions: Skeletochronology •Upland Movement- MCBCP Telemetry Studies

Acknowledgments Dr Robert Fisher P Ig Dr. Robert Fisher, P.I.Dr. Andrea AtkinsonSara SchusterG t V SGreta VanScoyTritia MatsudaCarlton RochesterLiz GallegosAdam Backlin Sherri SullivanSherri SullivanRob LovichNancy MittonMike RouseFunding support provided by MCB Mike RouseBrian ZittTodd Chapman
Funding support provided by MCB Camp Pendleton and Commander Navy Region Southwest
Contact: [email protected]