long term grazing capacity norms for south...
TRANSCRIPT

Long Term Grazing Capacity norms for South Africa
(Data, mapping and application)
Paul [email protected]
Land Use & Soil Management
OUR MANDATE
• Department of Agriculture, Forestry & Fisheries
• Directorate: Land Use & Soil Management
• Sub‐directorate: Resource Audit
• Act 43 of 1983 (CONSERVATION OF AGRICULTURAL RESOURCES ACT)
• Regulation 9. (1)
• Every land user shall by means of as many of the following measures as are
necessary in his situation, protect the veld on his farm unit effectively
against deterioration and destruction:

OUR MANDATE• Regulation 10. (1)
• The grazing capacity of veld, expressed as a specified number of hectares per large stock unit, shall be as indicated on a topo‐cadastral map that is kept at the office of the executive officer for this purpose.
• Regulation 11. (1)• Every land user shall restrict the number of animals, expressed as large
stock units, kept on the veld of his farm unit to not more than the number that is obtained by dividing the area of the veld of the farm unit concerned, expressed in hectares, by the applicable grazing capacity referred to in regulation 10, in respect of that farm unit: Provided that such number may on occasion be exceeded on condition that the veld shall under all circumstances effectively be protected against deterioration and destruction.
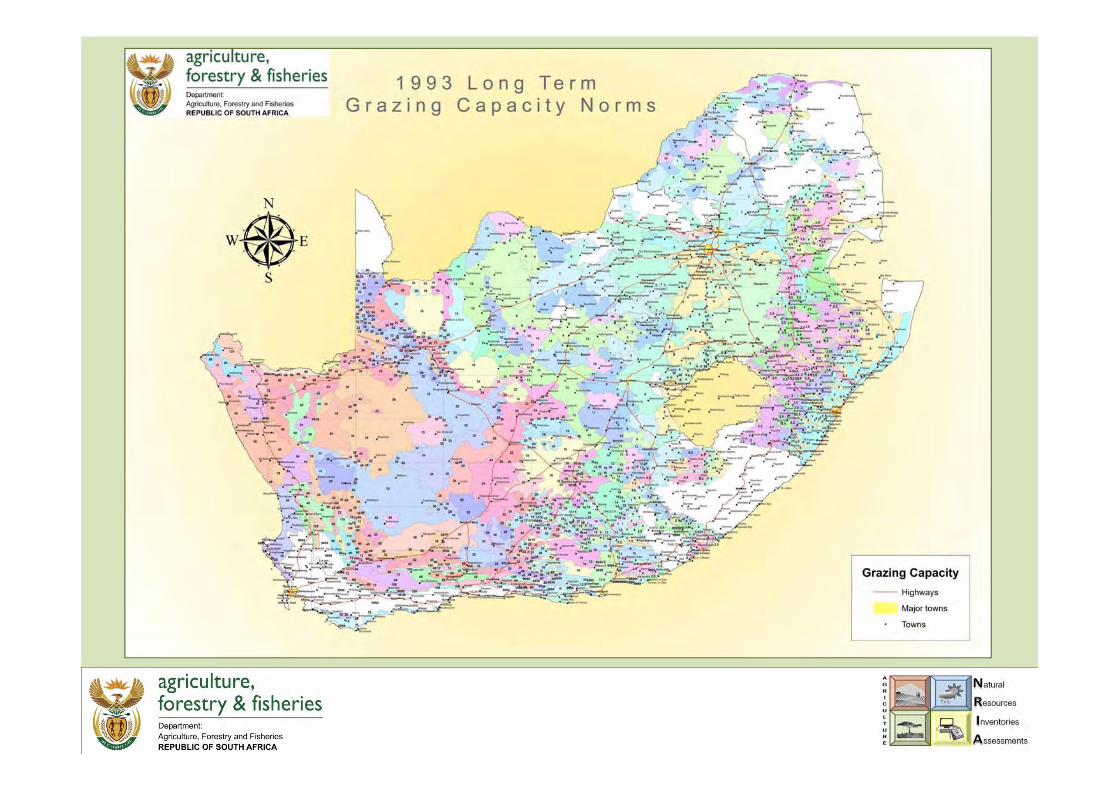
• The last spatial product (map) was developed in 1993.
PURPOSE OF A LONG TERM NORM MAP• An ecological safety net
• Sustain veld condition without degradation over time
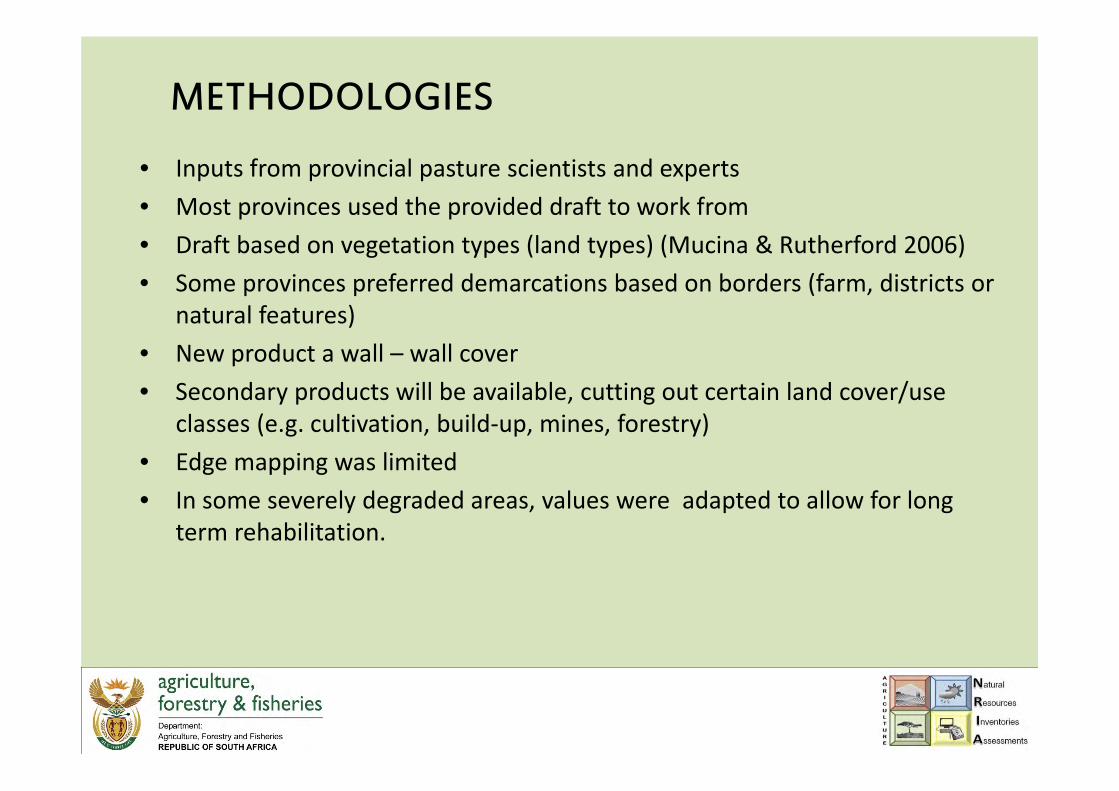
METHODOLOGIES
• Inputs from provincial pasture scientists and experts• Most provinces used the provided draft to work from• Draft based on vegetation types (land types) (Mucina & Rutherford 2006)• Some provinces preferred demarcations based on borders (farm, districts or
natural features)• New product a wall – wall cover• Secondary products will be available, cutting out certain land cover/use
classes (e.g. cultivation, build‐up, mines, forestry)• Edge mapping was limited• In some severely degraded areas, values were adapted to allow for long
term rehabilitation.

ProvinceLong term grazing capacity (ha/LSU) Available (ha)
Highest Lowest Mean *Natural veld % of Province
Eastern Cape 1.5 130 10.8 10 818 640 82.03
Free State 2.5 24 7.5 6 530 962 66.78
Gauteng 4 20 6.8 698 179 52.14
KwaZulu‐Natal 2 23 6.4 4 493 616 63.16
Limpopo 3 17 9.3 7 657 939 84.20
Mpumalanga 2.5 11 6 3 684 679 65.51
Northern Cape 7 140 33.3 27 894 251 98.49
North‐West 5 25 9.6 5 845 092 75.54
Western Cape 12 140 49.7 8 322 170 81.59
* Extracted from National Land Cover data set 2013/14
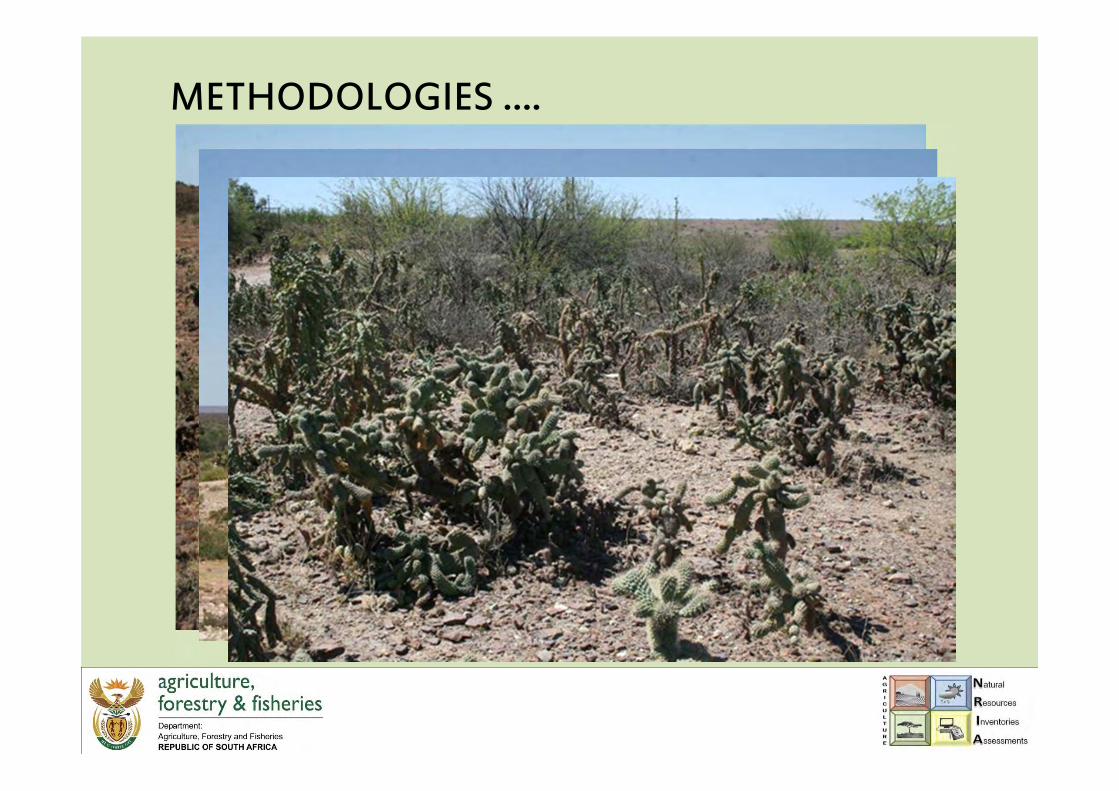
METHODOLOGIES ….
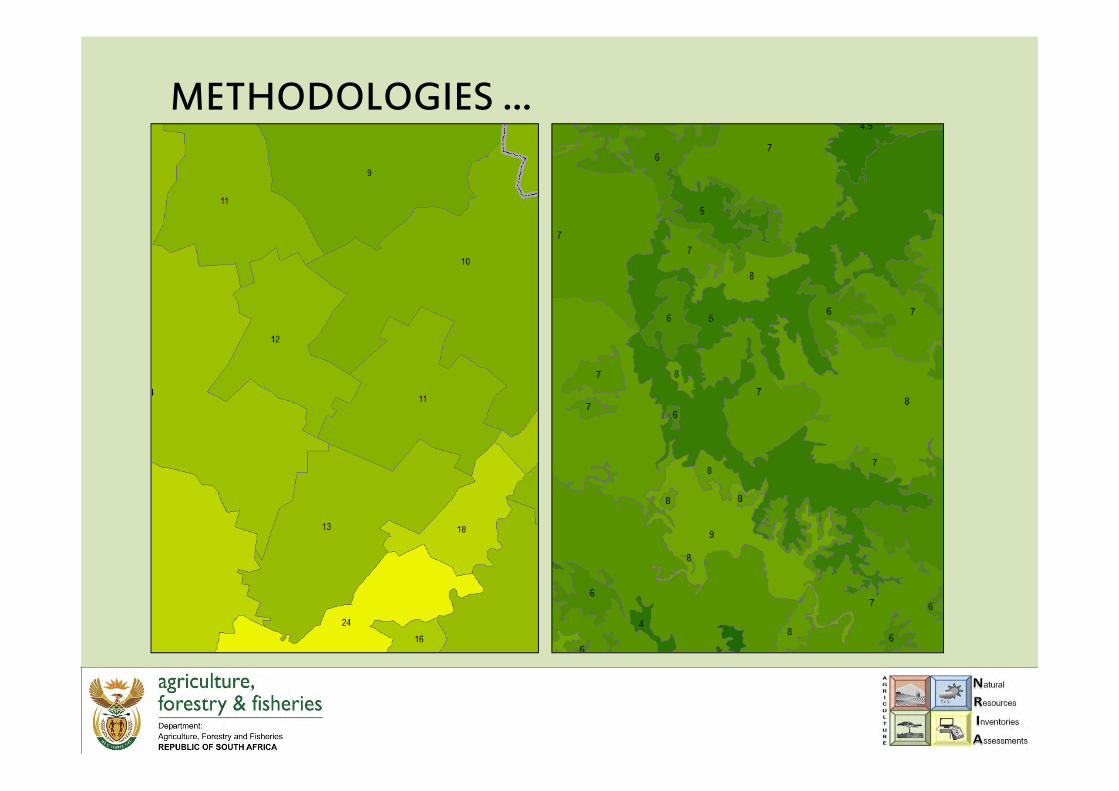
METHODOLOGIES …

Unit of measurement
• The values indicated on the map are ha/LSU (hectares per Large Stock Unit)
• This unit indicates the area (in ha) needed to maintain an animal of 450kg
for a period of a year without degrading the natural resource. Utilize ±50%
of the available biomass with an intake of 10kg DM per day.
• Average grazing capacity per biome:
• Grassland biome 4‐6 ha/LSU
• Savanna biome 10‐15 ha/LSU
• Nama‐karoo biome 25‐35 ha/LSU
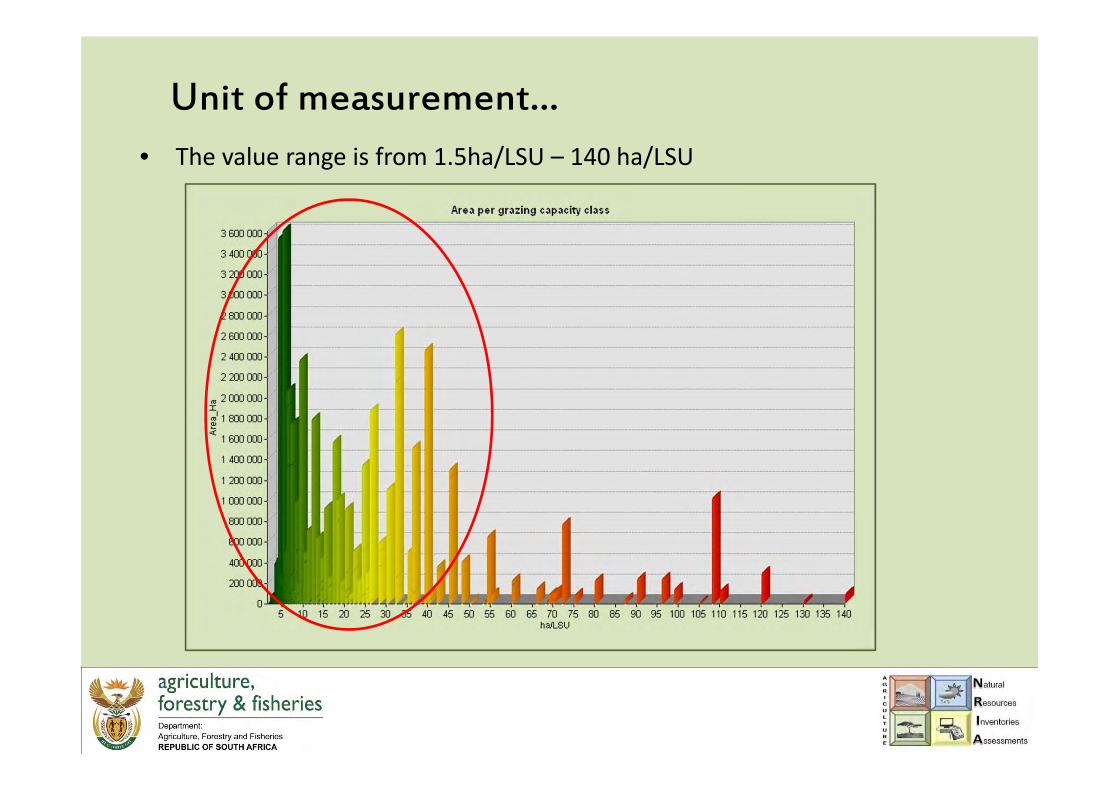
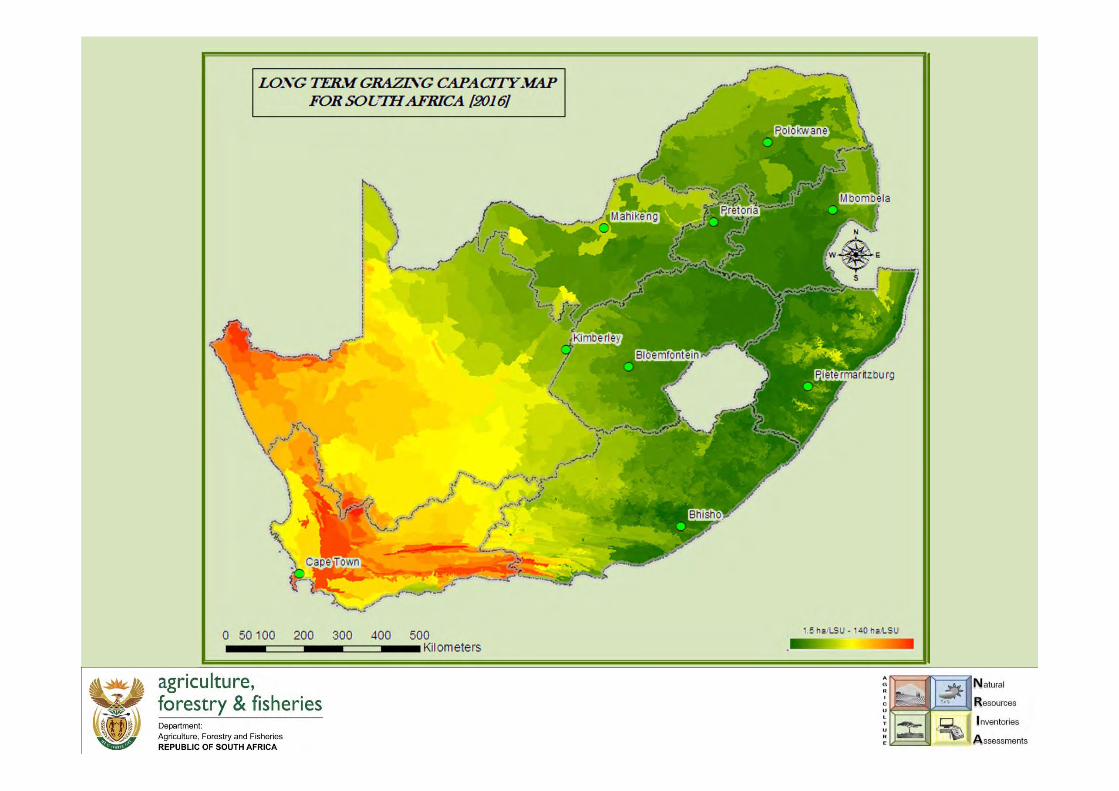
Unit of measurement…• The value range is from 1.5ha/LSU – 140 ha/LSU
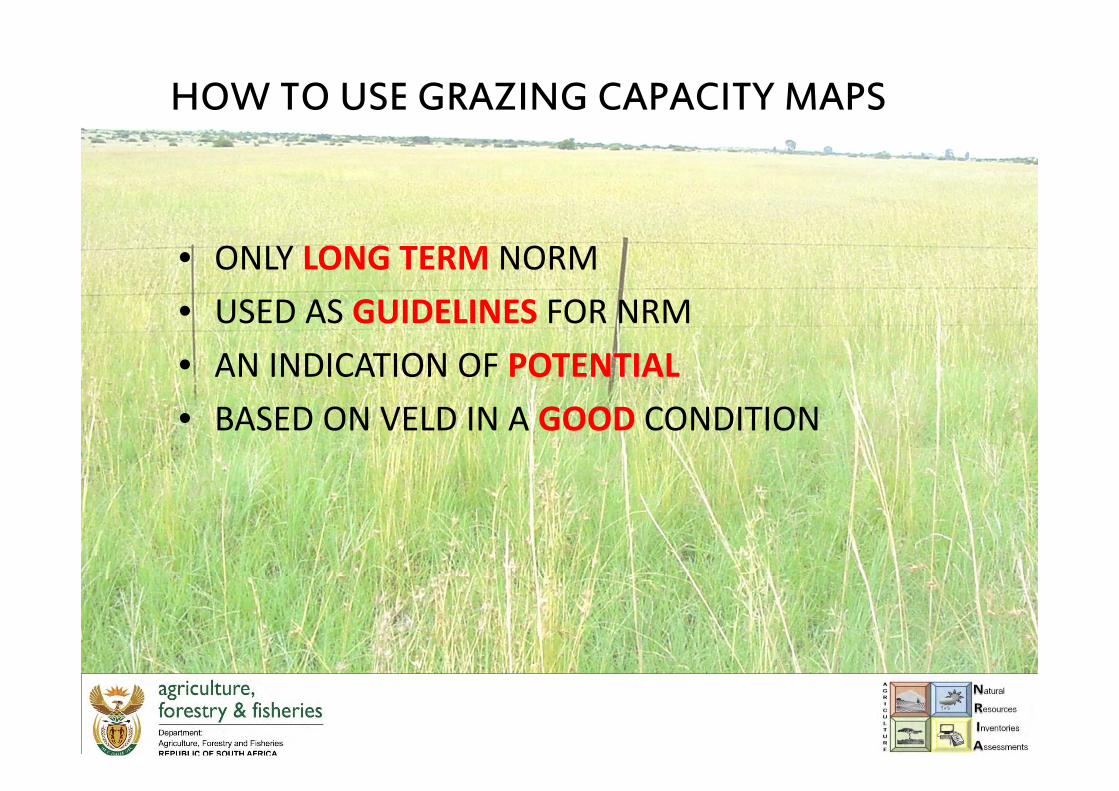
HOW TO USE GRAZING CAPACITY MAPS
• ONLY LONG TERM NORM• USED AS GUIDELINES FOR NRM• AN INDICATION OF POTENTIAL• BASED ON VELD IN A GOOD CONDITION

WHAT IS VELD IN A GOOD CONDITION
• SPECIES COMPOSITION– Need to be representative of the benchmark site.– Need to consist of optimal species diversity– Need to be free of alien invasive plants– Need to have an acceptable distribution and density of woody plants
where applicable. (no encroachment)
• COVER– Optimum cover as depicted by the specific vegetation type– In line with the rainfall regime for that specific season
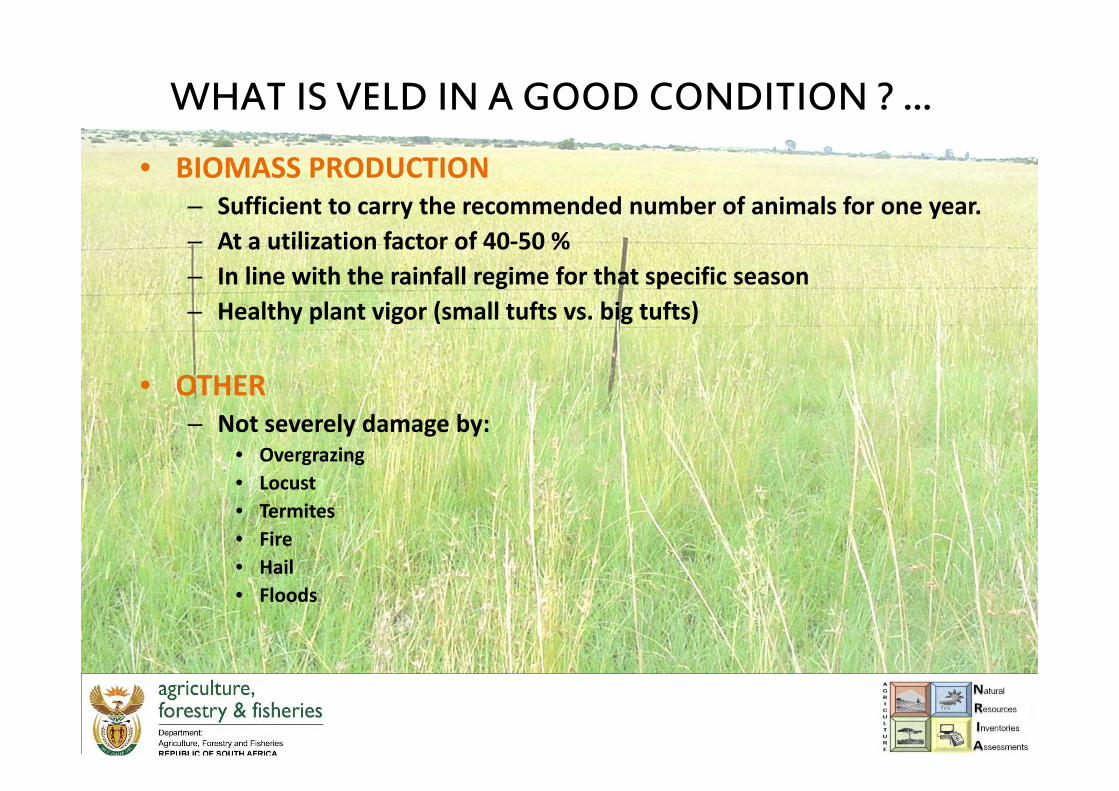
WHAT IS VELD IN A GOOD CONDITION ? …
• BIOMASS PRODUCTION– Sufficient to carry the recommended number of animals for one year.– At a utilization factor of 40‐50 %– In line with the rainfall regime for that specific season– Healthy plant vigor (small tufts vs. big tufts)
• OTHER– Not severely damage by:
• Overgrazing• Locust• Termites• Fire• Hail• Floods

WHAT GRAZING CAPACITY MAPS ARE NOT
• DOES NOT INDICATE CURRENT VELD CONDITION• DOES NOT INDICATE CURRENT BIOMASS
• CAN NOT BE USE ON FARM LEVEL
• WILL NEVER REPLACE ACTUAL SURVEYS
• DON’T BE RESPONSIBLE FOR FURTHER DEGREDATION OF VELD !!!
• Build‐up
• Cultivated
• Plantations
• Mining
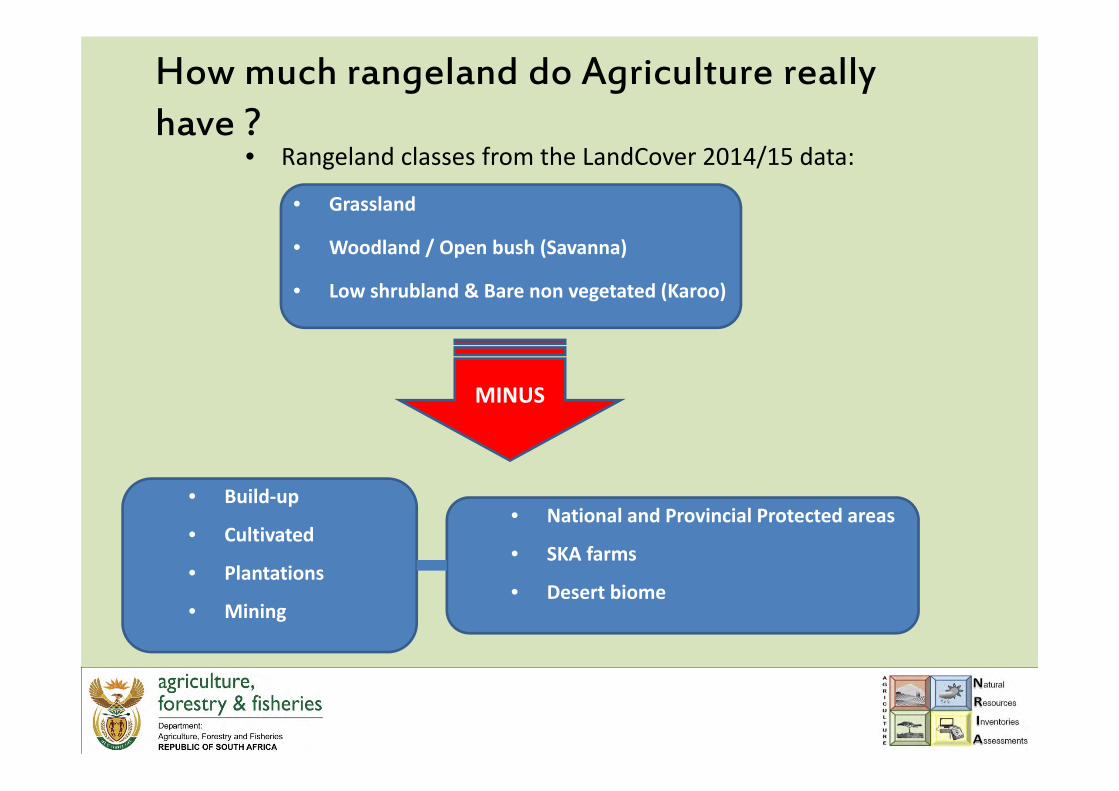
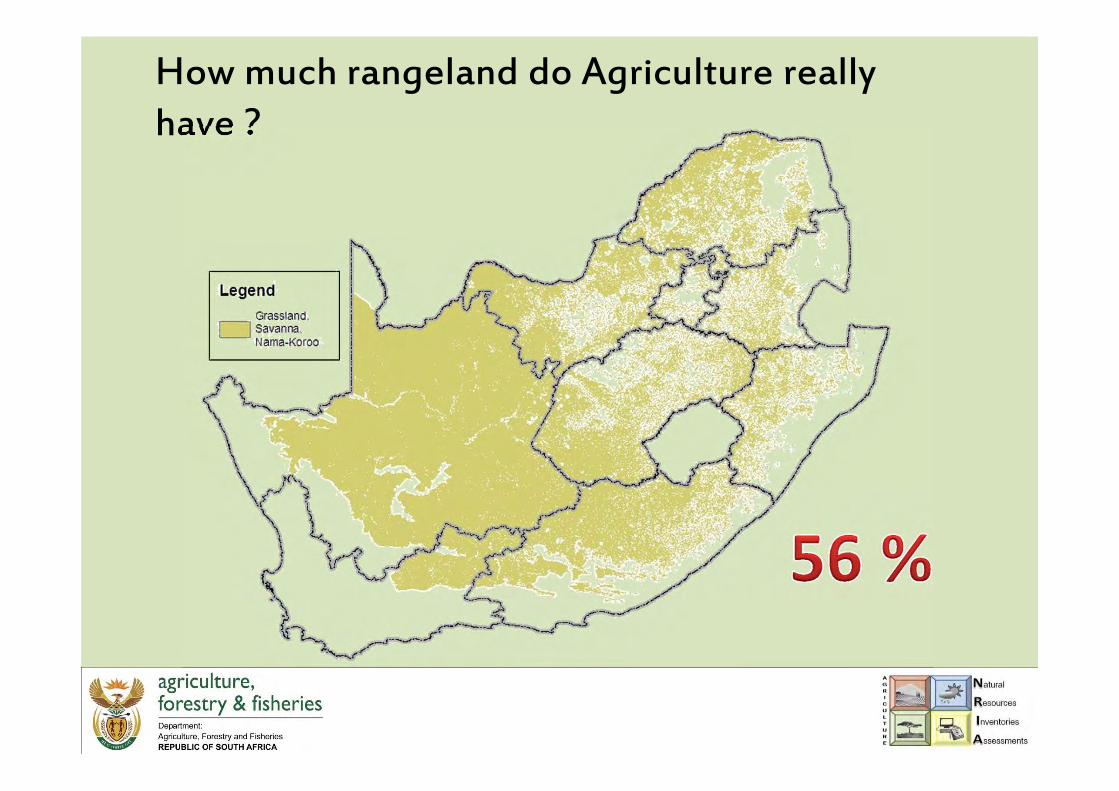
How much rangeland do Agriculture really have ?
• Rangeland classes from the LandCover 2014/15 data:
• Grassland
• Woodland / Open bush (Savanna)
• Low shrubland & Bare non vegetated (Karoo)
MINUS
• National and Provincial Protected areas
• SKA farms
• Desert biome
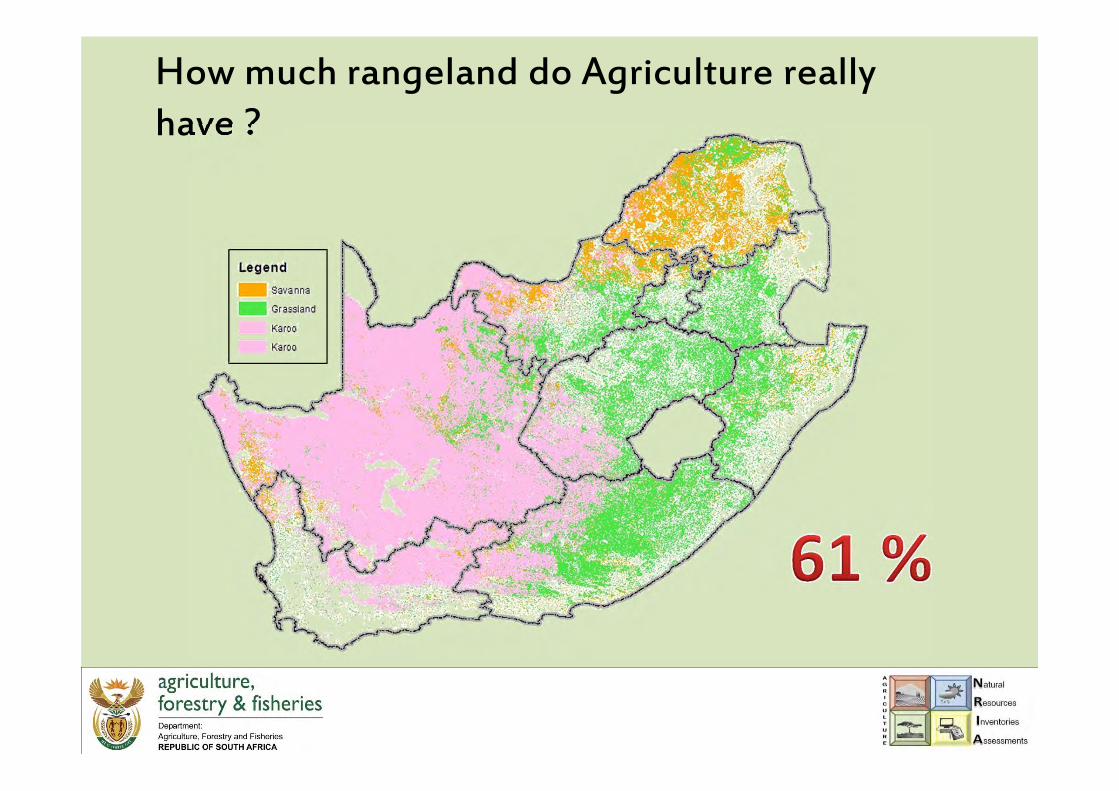
How much rangeland do Agriculture really have ?
How much rangeland do Agriculture really have ?

How much rangeland do Agriculture really have ?
1 ha/LSU
96 ha/LSU
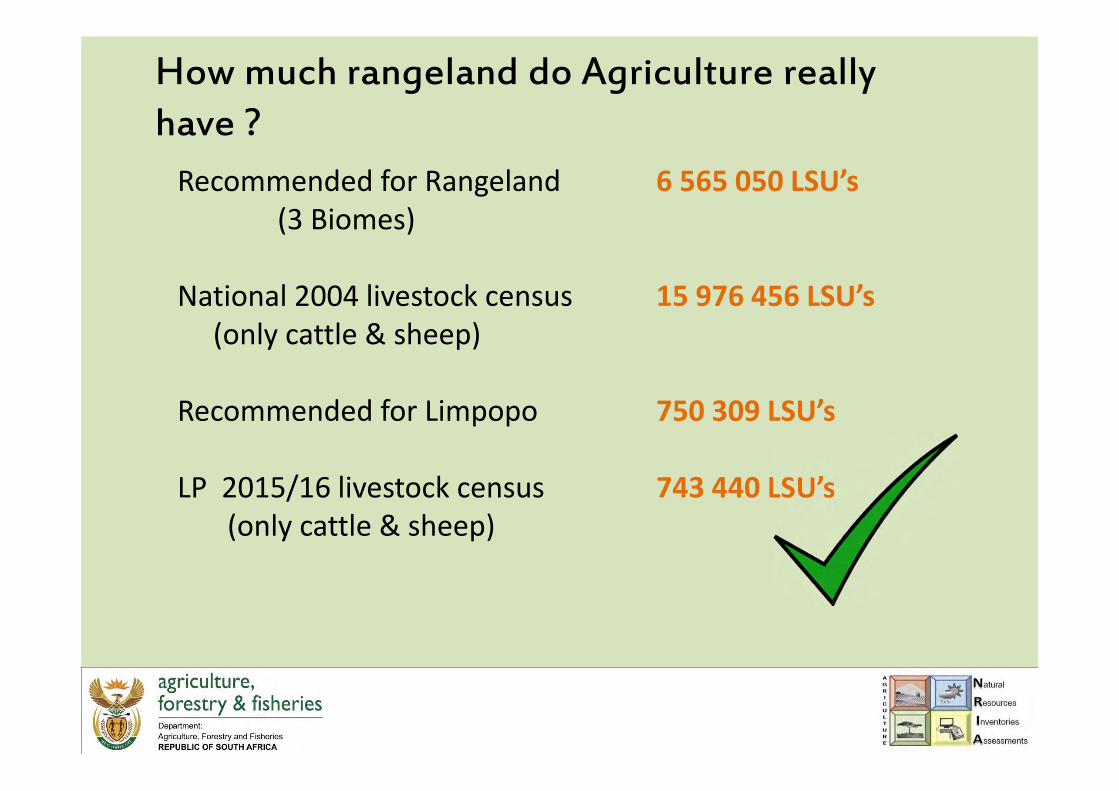
How much rangeland do Agriculture really have ?Recommended for Rangeland 6 565 050 LSU’s
(3 Biomes)
National 2004 livestock census 15 976 456 LSU’s(only cattle & sheep)
Recommended for Limpopo 750 309 LSU’s
LP 2015/16 livestock census 743 440 LSU’s(only cattle & sheep)
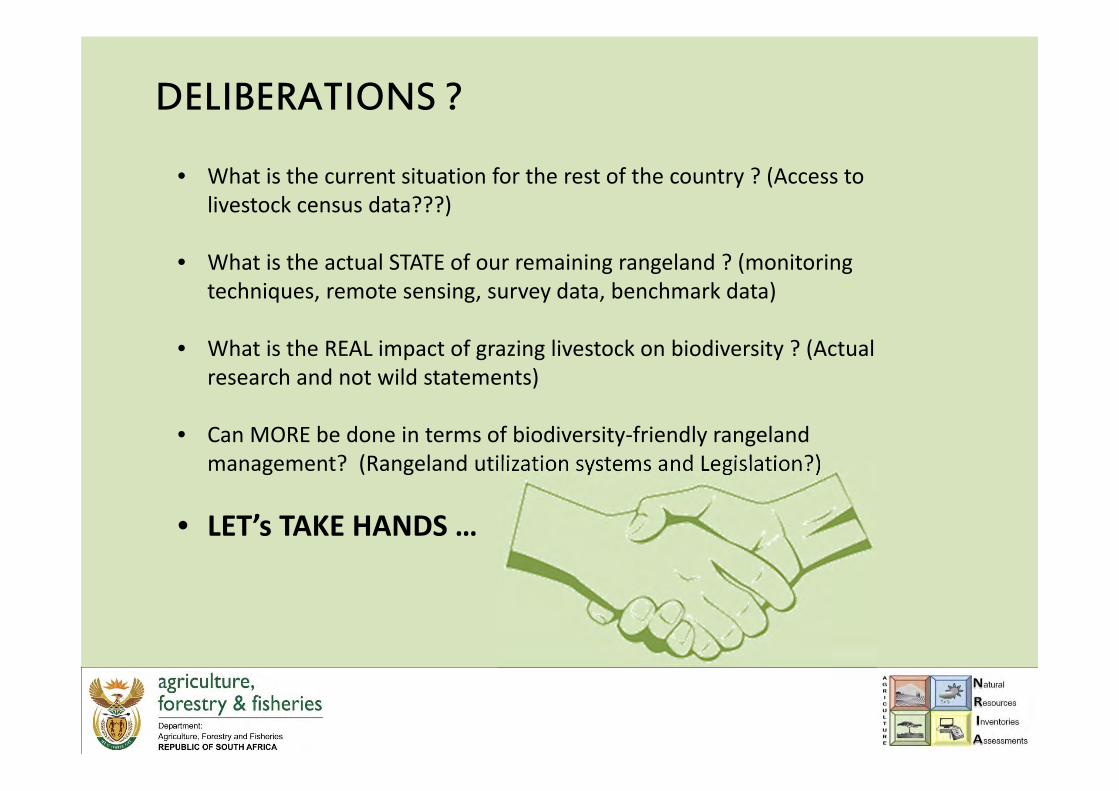
DELIBERATIONS ?
• What is the current situation for the rest of the country ? (Access to livestock census data???)
• What is the actual STATE of our remaining rangeland ? (monitoring techniques, remote sensing, survey data, benchmark data)
• What is the REAL impact of grazing livestock on biodiversity ? (Actual research and not wild statements)
• Can MORE be done in terms of biodiversity‐friendly rangeland management? (Rangeland utilization systems and Legislation?)
• LET’s TAKE HANDS …
“Once you learn to read the land,I have no fear of what you will
do to it ...
and I know many pleasant thingsthat it will do to you”
Aldo Leopold