long-term global oil scenarios: looking beyond...
TRANSCRIPT

Long-term Global Oil Scenarios:Looking Beyond 2030
2008 EPRI Climate Change Seminar
Howard GruenspechtEnergy Information Administration

Long term Global Oil Scenarios: May 22, 20082
EIA’s view to 2030
• Reference Case:– Liquid fuels consumption grows to 113 MMB/D– 29 MMB/D increase from 2006 – Conventional crude oil and lease condensate up only 12
MMB/D
• Higher oil prices slow consumption growth– Liquid fuels grow to 98 MMB/D in the high price case– Conventional crude and lease condensate down 11 MMB/D
from 2006
• Important difference between conventional crude oil and total liquids

Long term Global Oil Scenarios: May 22, 20083
Unconventional liquids become more important over time(MMB/D) Reference
CaseHigh Price
Case2006 2030 2030
Conventional Subtotal 81.9 99.3 76.1
Unconventional Subtotal 2.8 14.0 21.6
Conventional Crude* 71.5 83.4 60.3Natural Gas Plant Liquids 8.0 13.0 13.7Refinery Gain 2.4 2.9 2.1
Unconventional Crude** 1.8 5.2 6.6CTL and GTL 0.2 4.8 9.0Biofuels (oil equivalent) 0.8 4.0 6.1
Total Liquids 84.7 113.3 97.7
* Crude oil and lease condensates. ** Oil sands, extra-heavy crude, and shale oil
Source: Annual Energy Outlook 2008. Published Reference Case; preliminary High Price Case.

Long term Global Oil Scenarios: May 22, 20084
Looking beyond 2030 – work in progress
• Our approach
• Preliminary results and findings
• Next steps

Long term Global Oil Scenarios: May 22, 20085
?
Global Oil Scenarios: Our Approach
• Proved developed reserves for different oil streams (conventional crude+condensate, NGPLs, bitumen, extra heavy oil, shale, and other source rock) are generated through investment, constrained by both above ground and below ground factors
• The availability of production from proved developed reserves is used to assess the viability of “candidate” oil demand paths drawn from the recent U.S. Climate Change Science Program scenarios report.
Below Ground
Above Ground
“Candidate”Demand
Scenarios
Production Scheduling:
Invest to createProved Developed
Reserves

Long term Global Oil Scenarios: May 22, 20086
Our Approach: Key Drivers
• Future Oil Demand– Transportation demand growth, availability of efficiency
improvements, and alternative fuels (biofuels, grid electricity, hydrogen)
– Policy and economics both matter
• “Below Ground” Supply Potential– Initial-in-Place quantities (IIP)– Rock and fluid properties
• Maximum Long-term Recovery Factors (RF)– Rock and fluid properties of specific streams– Technological improvements and costs
• “Above Ground” Supply Factors– Resource owner economic and non-economic objectives– Access to resources (conventional and unconventional)– Local and global policies (environmental and other)

0 5000 10000 15000 20000 25000 30000 35000 40000
GDP per capita (dollars)
0
100
200
300
400
500
600
700
800
900ve
hicl
es p
er 1
,000
peo
ple
Italy
UKJapan
USA
Germany
France Canada
IsraelKorea
Poland
MalaysiaMexico
Brazil
Russia
ThailandIndonesia
ChinaIndia
Future Demand: Vehicle Ownership, 2003
SOURCE: OECD/IEA (2006) ©
The potential for increased vehicle use in emerging markets is enormous

Primary Energy Use by Fuel and Sector, 2006. (quadrillion Btu)
Oil is used mainly in transportation, where it is the dominant fuel. Over time, transport’s share of global oil use is expected to grow, but oil’s share of transport energy is expected to fall.

Long term Global Oil Scenarios: May 22, 20089
U.S. Petroleum Gasoline Use Declines Due to Increased Biofuels, Diesel, & Efficiency
8.85 8.24
0.0
2.0
4.0
6.0
8.0
10.0
12.0
14.0
2007 2022
Mill
ion
Bar
rels
Per
Day
Gas
olin
e Eq
uiva
lent
MPG SavingsOver 2007
LDV DieselIncrease
Ethanol (GasolineEquivalent)
Petroleum-BasedGasoline
Gasoline Demand 2007 and 2022
9.15 9.38
Source: AEO 2008 Reference Case

Long term Global Oil Scenarios: May 22, 200810
Shifting Vehicle Mix Needed to Meet Both Increased Efficiency & Ethanol Use
0123456789
10
2007Cars
2007Trucks
2022Cars
2022Trucks
Mill
ions
Electric-Gasoline Hybrid
Ethanol-FlexFuel
Diesel ICE
Gasoline ICE
Light-Duty Vehicle Sales
Note: ICE – Internal Combustion Engine Source: AEO 2008 Reference Case

Long term Global Oil Scenarios: May 22, 200811
Future World Oil Demand: Three Candidate Paths
0
50
100
150
200
1900 1950 2000 2050 2100
MM
B/D
56
195
125
High
3,375
4,864
6,277
MMB/D Consumed in 2100
Billion Barrels Consumed by 2100
Low
Intermediate
Note: Biofuels, gas-to-liquids, coal-to-liquids, and refinery gain are excluded Source: U.S. Climate Change Science Program (July 2007), EIA analysis

Long term Global Oil Scenarios: May 22, 200812
Below the Ground: Initial-in-Place estimates vary widely
(trillion barrels) Mid. EastOPEC
OtherOPEC
UnitedStates
OtherNon-OPEC
Conv. Crude and Condensate 2.60.30.00.00.00.93.8
2.6 0.9 2.9Natural Gas Plant Liquids 0.3 0.2 0.4Extra Heavy Crude (<10º API) 2.3 0.0 0.0Bitumen 0.0 0.0 2.4Shale Oil 0.0 2.1 0.7Source Rock 0.9 0.3 1.0Total Liquids 6.0 3.4 7.4
Sources: I.H.S. Energy, World Energy Council, USGS, Nehring Associates, EIA analysis
• Estimates of global IIP for petroleum liquids vary from 14 to 24 trillion barrels. Our preliminary base case uses 20.6 trillion barrels.
Long term Global Oil Scenarios: May 22, 200813
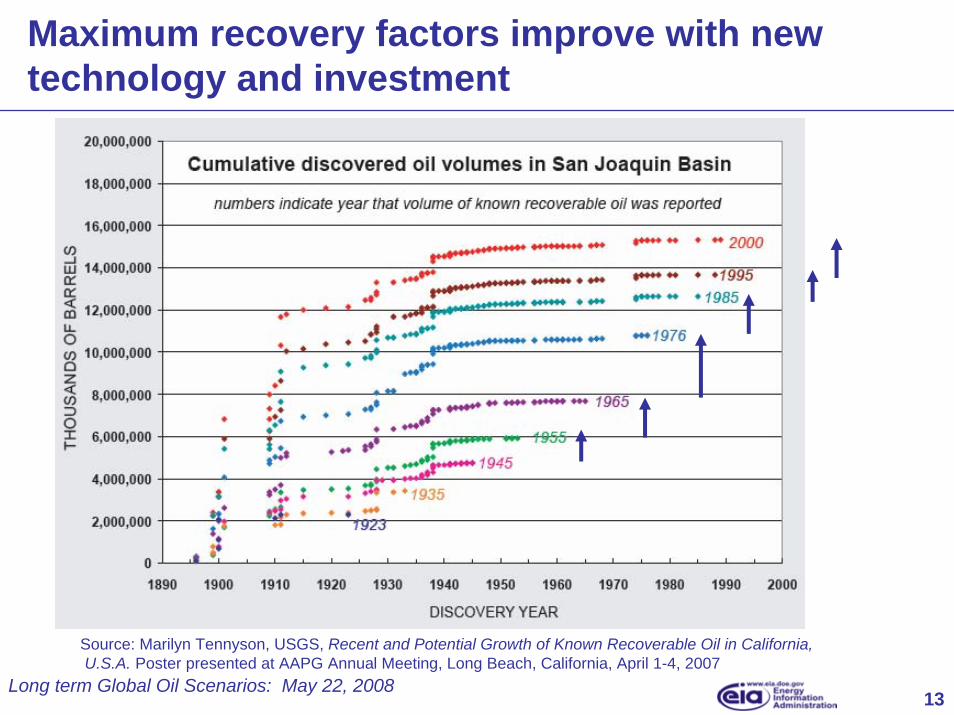
Maximum recovery factors improve with new technology and investment
Source: Marilyn Tennyson, USGS, Recent and Potential Growth of Known Recoverable Oil in California,U.S.A. Poster presented at AAPG Annual Meeting, Long Beach, California, April 1-4, 2007

Long term Global Oil Scenarios: May 22, 200814
Scheduling: Investment In Incremental Production Capacity (Proved Developed Reserves)
F &
D C
ost (
$/B
)
F &
D C
ost (
$/B
)
Potential Incremental Reserve Additions
Resource 1 Resource 2
Cumulative Production plus Proved Developed Reserves
Max RF1 * IIP1 Max RF2 * IIP2
Proved Developed Reserves (B) Proved Developed Reserves (B)

Long term Global Oil Scenarios: May 22, 200815
“Above Ground” factors also affect investment scheduling
• Improving Technology– Horizontal drilling– Enhanced completion techniques
• National Oil Company Investment Decisions– Saudi Arabia– Venezuela
• Unfavorable Fiscal Regimes– Russia– Iran
• Environmental or other societal concerns– United States: ANWR, East and West Coast OCS, shale in future?– Canada: oil sands in future?– Global: interaction with future greenhouse gas mitigation efforts?
Note: Short-term above ground factors like civil unrest and cyclical increases infactor costs are generally excluded

Long term Global Oil Scenarios: May 22, 200816
New technology lowers finding and development costs and improves maximum recovery factors
Max RF * IIP
Technology improvements shift the curve to the right.
0
5
10
15
20
25
30
F &
D C
ost (
$/B
)

Long term Global Oil Scenarios: May 22, 200817
Different streams have different production profiles
Production Profiles(Share of Total 25 Year Production Schedule)
0%
1%
2%
3%
4%
5%
6%
7%
8%
9%
1 6 11 16 21
Years after first prodution
Conventional Petroleum
Extra-Heavy Crude Oil
Bitumen, Shale, Source Rock

Long term Global Oil Scenarios: May 22, 200818
Four Scenarios using the Intermediate Demand Case
Max RF IIP OPEC DecisionPreliminary Base Case 10 - 50%
0 - 35%
10 - 50%
10 - 50%
21 constant market share*
Lower Recovery Factors 21 constant market share*
Lower Initial-In-Place 16 constant market share*
Unfavorable “above ground” 21 Max = 35 MMBD **
* Conventional petroleum as a share of total petroleum liquids
** Max = 35 MMBD includes all OPEC production (conventional and unconventional)

Long term Global Oil Scenarios: May 22, 200819
Preliminary Base Case, Intermediate Demand
• This supply scenario satisfies the candidate demand path through 2090
0
50
100
150
200
1900 1920 1940 1960 1980 2000 2020 2040 2060 2080 2100
Mill
ion
Barr
els
per D
ay
0
18
37
55
73
Billi
on B
arre
ls p
er Y
ear
Non-OPEC Other (Unconv)US (Unconv)OPEC Other (Unconv)OPEC ME (Unconv)Non-OPEC OtherUnited StatesOPEC OtherOPEC Middle EastTotal Consumption
Total Petroleum Production
Long term Global Oil Scenarios: May 22, 200820
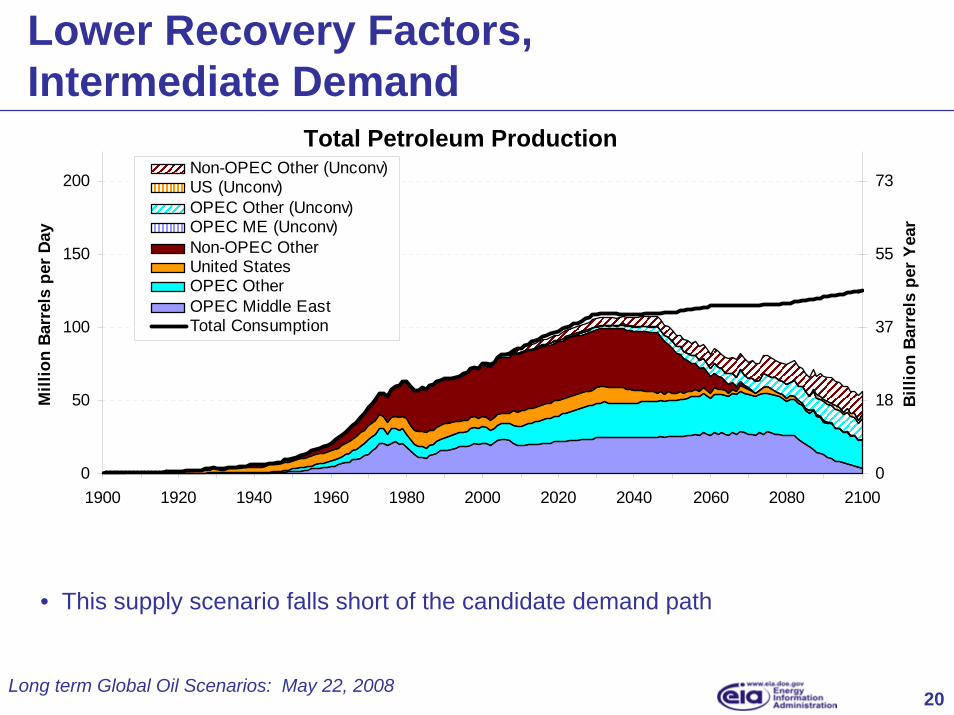
Lower Recovery Factors, Intermediate Demand
0
50
100
150
200
1900 1920 1940 1960 1980 2000 2020 2040 2060 2080 2100
Mill
ion
Barr
els
per D
ay
0
18
37
55
73
Billi
on B
arre
ls p
er Y
ear
Non-OPEC Other (Unconv)US (Unconv)OPEC Other (Unconv)OPEC ME (Unconv)Non-OPEC OtherUnited StatesOPEC OtherOPEC Middle EastTotal Consumption
Total Petroleum Production
• This supply scenario falls short of the candidate demand path

Long term Global Oil Scenarios: May 22, 200821
Lower Initial-in-Place Estimates, Intermediate Demand
0
50
100
150
200
1900 1920 1940 1960 1980 2000 2020 2040 2060 2080 2100
Mill
ion
Barr
els
per D
ay
0
18
37
55
73
Billi
on B
arre
ls p
er Y
ear
Non-OPEC Other (Unconv)US (Unconv)OPEC Other (Unconv)OPEC ME (Unconv)Non-OPEC OtherUnited StatesOPEC OtherOPEC Middle EastTotal Consumption
Total Petroleum Production
• This supply scenario falls short of the candidate demand path

Long term Global Oil Scenarios: May 22, 200822
More Unfavorable Above Ground Factors, Intermediate Demand
0
50
100
150
200
1900 1920 1940 1960 1980 2000 2020 2040 2060 2080 2100
Mill
ion
Barr
els
per D
ay
0
18
37
55
73
Billi
on B
arre
ls p
er Y
ear
Non-OPEC Other (Unconv)US (Unconv)OPEC Other (Unconv)OPEC ME (Unconv)Non-OPEC OtherUnited StatesOPEC OtherOPEC Middle EastTotal Consumption
Total Petroleum Production
• This supply scenario falls short of the candidate demand path

Long term Global Oil Scenarios: May 22, 200823
Results to Date - Preliminary
• The high demand path may be difficult to meet even with favorable supply assumptions
• The low demand path can be satisfied even with relatively unfavorable supply assumptions
• The viability of the intermediate demand path is sensitive to “below ground” and “above ground” assumptions– Initial-in-place– Recovery factors– Government decisions affecting investments in incremental oil
production capacity

Long term Global Oil Scenarios: May 22, 200824
Key Findings - Preliminary
• Only a small fraction, 4 - 7%, of estimated IIP resource has been produced
• Either demand or supply can cause global oil to peak and decline
• The extent and nature of access concerns may evolve over time
• Results are very sensitive to recovery factors; more study is needed
• Unconventional liquids play an important role, especially in higher demand cases

Long term Global Oil Scenarios: May 22, 200825
Next Steps (for EIA and others)
• Develop an agreed common terminology to more clearly distinguishsubstantive issues from those arising from inconsistent use of terms
• Improve understanding of long-term oil demand drivers
• Provide Initial-in-Place (IIP) resource estimates, together with, or instead of, estimates by resource assessors that present only a combined view of both IIP and potential recovery
• Improve understanding of future technology on costs and maximum recovery factors
• Explicitly consider impact of “above ground” behavior and policies on oil production capacity investment decisions