long-term exposure to malaria and violence in africa · long-term exposure to malaria and violence...
TRANSCRIPT

Economic Policy 66th Panel Meeting
Hosted by the European Commission
Brussels, 19-20 October 2017
The organisers would like to thank the European Commission for their support. The views expressed in this paper are those of the author(s) and not those of the supporting
organization.
Long-term Exposure to Malaria and Violence in Africa
Matteo Cervellati (University of Bologna)
Elena Esposito (HEC Lausanne) Uwe Sunde (Ludwig-Maximilian University of Munich)
Simona Valmori (University of Bologna)

Long-Term Exposure to Malariaand Violence in Africa.∗
Matteo CervellatiUniversity of Bologna
IZA, Bonn
CESIfo, Munich
Elena EspositoHEC, Lausanne
Uwe SundeLMU Munich
ifo, Munich
CEPR London
Simona ValmoriUniversity of Bologna
Paper Prepared for Economic Policy Special Issue“What economics can do for peace”
September 15, 2017
Abstract
This paper explores the existence of a link between the long-term exposure to malaria andthe frequency of civil conflict in Africa. Using geographically disaggregated data at the level ofgrid cells the analysis provides empirical evidence for a hump-shaped relationship between thelong-run stability and force of malaria transmission and the incidence of civil violence. In linewith predictions from epidemiology regarding resistance due to protective acquired immunities,cells that are characterized by intermediate malaria exposure exhibit higher conflict incidencethan cells with very low or very high malaria exposure. The attenuating effect of resistance isconfirmed using data on the prevalence of genetic immunity. We end by exploring the influenceof anti-malaria policy.
JEL-classification: D74, J1
Keywords: Malaria; Civil Violence; Economic Policies, Cell-level Data; Africa; Immunities.
∗We are very grateful to the editor Nicola Fuchs-Schndeln and four anonymous referee for the detailed and con-structive comments and the valuable guidance in revising the draft. Contact: Matteo Cervellati [email protected],Elena Esposito [email protected], Uwe Sunde [email protected], Simona Valmori [email protected]
1 Introduction
Diseases and civil violence are regarded major impediments for development, particularly in the
poorest regions of the world. Surveys for several African countries document that the fear of dis-
eases (with malaria being the most frequently cited disease) is the main risk factor as perceived by
individuals, followed by shortages of food and, crucially, by insecurity in terms of exposure to vio-
lence.1 Civil violence constitutes the most common type of conflict events over the past fifty years,
accounting for the largest number of conflict-related casualties. More than a third of countries in
Sub-Saharan Africa have experienced medium and large scale civil conflicts in the last twenty years.
Some of these conflicts, which also involved massive population displacements and refugee flows, have
called the attention of mass media also in the Western world. Most African countries are plagued
by recurrent violence at a smaller scale, involving predation and looting of local communities. While
rarely making it to the international news and passing largely unnoticed, these violent events in fact
involve a substantial death toll and entail poverty and underdevelopment.2
A small but growing literature discussed in Section 2 exploits disaggregated data to explore
the long-term empirical determinants of localized violence in Africa. In this paper we explore the
complementary role of long-term exposure to malaria. Malaria represents the greatest threat for
human health in Africa over the last millennia.3 Labelled “Humanity’s Burden” by epidemiological
historian Webb (2009), malaria has been estimated to have killed half of the humans that ever
lived (Whitfield, 2002)). Still today, malaria is responsible for a large death toll in Africa, with
recent estimates by Murray et al. (2012) suggesting that malaria mortality is larger than previously
estimated, especially among adults. Their evidence documents a steady increase in malaria deaths
from 1980 in Africa, with a peak of about 1.5 million deaths in 2004.4 Since the “Roll Back Malaria”
1See, for instance, the Parima-Study, Doss et al. (2008) and McPeak et al. (2012).2According to the Armed Conflict Location and Event Data Project, which constitutes the main data source in
this paper as described in Section 4, small scale localized violence has been estimated to be responsible for the death
of at least 50-70,000 people per year.3Evolutionary geneticists have recently claimed that malaria affect Africans since 100,000 years in its mild form
vivax and since at least 10,000 years in the deadly variant falciparum. As Webb (2009) puts it “[Malaria is] a primordial
companion of our distant protohuman ancestors and an even earlier companion of the chimpanzees from which we
branched off six or seven million years ago”.4Malaria is estimated to have caused 200 million clinical cases worldwide in 2013. See also
http://www.who.int/mediacentre/factsheets/fs094/en and http://www.cdc.gov/malaria/about/facts.
1

program launched by the WHO at the end of the 1990s, the effort and economic resources devoted
to malaria control has been increased substantially, and private donors joined in this endeavour in
the second part of last decade. Since 2005 substantial interventions in terms of prevention (like
mosquito nets), control (insecticide spraying) and treatment (particularly with artartemisinin) have
been considered responsible for a change in the trend of malaria mortality and for a sizable reduction
in the number of deaths particularly among adults, see Murray et. al. (2012) and Bhatt et. al.
(2015) among others (see also the discussion in Section 3).
In this paper we provide a first empirical assessment of the unexplored role of long-term exposure
to malaria for the likelihood of civil violence at a disaggregated level in Africa. Long term exposure
to malaria can potentially affect civil violence through several channels. A first channel relates
to the effect of malaria on the settlement patterns of European colonizers during the so called
“scamble for Africa” and its consequences for the emergence of more or less extractive institutions
and the organization of states. A second, less explored, channel links malaria to the location and
migration patterns in the African population even prior to European colonization. Some recent
evidence suggests that malaria might have had a first order effect on the emergence and persistence
of African ethnicities and ethnic enmities. Finally, malaria might influence violence through its long
run affect on population density, urbanization and, more generally local economic development.
Typically, (male) adults rather than children are the most relevant demographic group involved
in civil conflicts, violence and predation. As discussed in further detail below, a higher exposure to
malaria has a sizable, although hump-shaped, effect on health conditions and mortality of adults.
Malaria can therefore affect the likelihood of civil violence by directly affecting the opportunity cost
of violence and/or the ability to fight and the risk of being predated. Increasing evidence supports the
view that individuals facing higher mortality and poor health tend to be less future oriented and less
risk averse.5 Falk et al. (2017) provide cross-country evidence for the existence of a robust negative
5See, e.g., Becker and Mulligan (1997) for theoretical foundations of the link between health and time preference.
Empirically, poor health has been associated with riskier behavior and increased involvement in activities that pay-off
in the short run. The link between future orientation and health and mortality has been pointed out in specific
empirical studies. For instance, exposure to the accident at the nuclear plant in Chernobyl in 1986 have been related
to increased death rates for other risky behaviors like increased smoking, drinking and car speeding, the unsafe sex
and the spread of HIV, see Lorentzen, McMillan, and Wacziarg (2008). Scattered experimental evidence confirm this
patterns. Lammers and van Wijnbergen (2008) find that HIV positive South Africans are less risk-averse and display
larger discount rates.
2

correlation between life expectancy and individual risk aversion and patience. A cursory exploration
of the link between long term malaria exposure and long-term orientation across countries delivers an
even more intricate relationship. While on average, individuals living in countries with low exposure
to malaria, proxied by an index of the stability of malaria transmission described below, appear to
be more oriented towards the future than individuals in countries with high malaria exposure, the
lowest levels of long-term orientation are observed for intermediate levels.6
In theory, lower long-term orientation and risk aversion reduces the opportunity cost of getting
involved in activities with high short-run gains but high risk, such as predation and conflict, as
compared to activities that pay off in the long run, such as investment and production. In this
respect poor health and high mortality can tilt the trade-off faced by individuals in a standard
production-predation model a la Skaperdas (1992), Hirshleifer (1995) or Grossman (2001). In a
dynamic perspective, a lower future orientation increases defection in repeated strategic interactions,
thereby reducing the likelihood of cooperation and the peaceful resolution of conflicts of interests, see,
e.g., Dal Bo and Frechette (2017). Poor health can also weaken or kill individuals, however, thereby
curbing the ability of the affected groups to fight and predate. At the same time, this increases the
exposure to predation by others. In spite of these arguments fairly little is known empirically about
the role of exposure to human diseases for conflicts. Moreover, the predicted direct effect of malaria
on violence is therefore a priori ambiguous and whether and in which direction malaria affects civil
violence is an open empirical question.
Our empirical strategy to study these issues closely builds on evidence in malaria epidemiology.
A well studied feature of malaria that is important for the design of the empirical analysis is that
malaria incidence and mortality of adults is associated in a non-monotonic, in fact hump-shaped, way
to long term exposure to the pathogen. While we postpone the presentation of the epidemiological
details and of the stylized facts to Section 3 it is useful to summarize here the basic reasons for
this relevant fact. Malaria is a disease caused by infections with plasmodium parasites, which can be
transmitted only through a non-human vector: females anopheles mosquitos. Epidemiologists classify
malarial areas in terms of the stability of transmission of the pathogen which crucially depends on the
characteristics of the vectors resident in the area and on the local bio-climatological conditions. Areas
characterized by higher stability of malaria transmission imply less interrupted cycles of infections
between humans and mosquitos and, therefore, higher inoculation rates (in terms of unconditional
6See Figure A1 in the Appendix.
3

probability of being bitten by an infected mosquito).7 A specific feature of the human physiological
response to malaria is the development of protective immunities that are only acquired over the years
after intense and uninterrupted exposure to the parasite. As a result, individuals that face repeating
infections and manage to survive to adulthood only experience mild malaria symptoms and low
mortality risk in the face of new infections. This leads to the so-called “age peak shift” phenomenon,
which implies that in areas with highly stable malaria transmission the burden of exposure to malaria
is predominantly borne by children whereas in areas with low transmission stability also adults are
heavily affected. As a result, the malaria incidence, and mortality, of adults displays a hump-shaped
relationship with the stability of malaria transmission.8
In the empirical analysis we explore the effect of long-term exposure to malaria on conflict in
an intention-to-treat framework that exploits information on the “predicted”, rather than actual,
stability of malaria transmission. This measure, proposed by epidemiologists is constructed based on
information about the dominant mosquito vectors in a given location and about on local variation
in temperatures and precipitation thresholds. This index of predicted malaria stability has two
relevant advantages for our purposes. First, contrary to incidence or inoculation rates, the index
is not directly affected by population density, economic activities and conflicts. Second, since the
index exploits geographical and bio-climatological features of a given location without relying on
spatial interpolation, it displays substantial variation across close locations in Africa. This also
allows exploiting within country variation. In contrast, no systematic data on the malaria incidence,
or inoculation rates, for adults is available at disaggregated level for the whole of Africa.9 A main
caveat is that the analysis is in reduced form and exploits cross-sectional variation, such that the
main empirical threat comes from omitted variables. In this respect the specific non-monotonic
relationship between malaria transmission and incidence in adults can be exploited to disentangle
the role of malaria from alternative determinants.
7At one extreme infections are infrequent, transmission intensity changes from year to year and infections take the
form of epidemics (that is in terms of abnormal spikes in infections). At the opposite extreme the cycle of infection is
uninterrupted and stable across years and infections are endemic.8Section 3 discusses the epidemiological literature and the stylized facts in further detail.9A large effort has been recently devoted to a systematic quantification of malaria incidence in adults but lack of
data and problems of measurement errors remain serious challenges. As discussed in Sections 3 and 4 recent estimates
of malaria incidence for adults are obtained from scatter survey data and meta analysis that are aggregated (sometimes
using epidemiological models) to get country level estimates.
4

In Section 5, we provide a first attempt to explore the link between long-term exposure to malaria
and the occurrence of localized civil violence using grid-cell data for the whole of Africa. The results
provide evidence for a hump-shaped association between predicted malaria stability and the likelihood
of violent events. The effect peaks for intermediate levels of malaria stability, consistent with the
notion that malaria risk for adults is highest in these areas. These results are robust to the inclusion
of a large set of location-specific covariates, including geo-climatological conditions, information on
location and distances, natural resources, ethnic composition of the population, population density
and proxies for economic development and urbanization, as well as to the inclusion of country fixed
effects that subsume the role of country level institutions and colonial history. This is compatible
with the possibility that part of the long term effect of malaria on conflicts works through its long
term effect on these channels. Malaria transmission stability has substantial explanatory power above
and beyond the inclusion of these covariates.
The baseline findings are confirmed when using information on the endemicity of malaria in the
population around the year 1900. We also exploit variation in the recorded degree of innate (genetic)
immunities to malaria and find that they attenuate the effect of malaria transmission on conflicts.
The non-linearity of the effect is documented using both parametric and non-parametric estimates
including flexible specifications. The patterns are confirmed also when using binary indicators to
check whether the effect is indeed lower for high malaria transmission areas. The patterns also con-
sistently emerge for different measures of civil violence from different sources and different measures
and types of violent conflicts at the extensive and intensive margin. Most of the action appears to
take place in terms of battles (violent confrontations) and violence against civilians while no robust
patterns is detected in terms of riots and protests. Overall, the findings provide robust evidence of a
non-monotonic effect of the malaria transmission on conflicts that is in line with the epidemiological
facts and compatible with the view that high malaria risk for adults increase the likelihood of violence
and predation.
To explore the scope of anti-malarial interventions in this context, we exploit novel disaggregated
data on the intensity of these policies. However, information on the extent of policy implementation
at the local level may be subject to measurement error which is possibly related to civil conflicts.
Moreover, the implementation of such policies might be related to outbreaks of civil violence.10
10As discussed in Section 2, the epidemiological literature finds no evidence that policy implementation significantly
related measures of local violence and conflicts. Still the possibility that policies are affected by conflicts cannot be
5

To deal with these issues we implement a very conservative and exploit information about policy
coverage at the country level rather than on the cell level. Moreover, we exploit time variation in
policy implementation, which was negligible before 2005 and then sharply increased. The results of
several exercises, including a diff-in-diff strategy provide suggestive evidence that increases in policy
coverage after 2005 reduced civil violence, but only in the (low transmission stability) areas with
high malaria risk for adults.
The remainder of the paper is structured as follows. Section 2 gives an overview of the state of
the literature and locates the contribution of this paper. Section 3 reports basic concepts of malaria
epidemiology and discusses some specific features of malaria transmission that are highly relevant for
the design of the empirical strategy. Section 4 discusses the empirical strategy, the data and their
sources. Section 5 presents the empirical strategy and the results while Section 6 concludes.
2 Literature
The project contributes to several strands of a rapidly growing literature in economics and political
science that studies the geo-political, ethnic and economic determinants of civil conflicts. Substantial
progress has been made during the last decade for a better understanding of the determinants of civil
wars at the country level, mainly by exploring the role of country specific characteristics for the like-
lihood of civil wars. The existing findings document the relevance of variation in income and poverty,
weak or non-democratic institutions, political instability and ethnic divisions across countries, see,
e.g., Fearon and Laitin (2003), Collier and Hoeffler (2004), Montalvo and Reynal-Querol (2005), as
well as Collier and Rohner (2008), and Collier, Hoeffler, and Rohner (2009), among others. Ethnic
polarization and genetic diversity have also been suggested as robust country specific determinants of
civil conflicts, see Esteban, Mayoral, and Ray (2012) and Arbatli, Ashraf, and Galor (2013), respec-
tively.11 In spite of the theoretical predictions about the potential impact of mortality and health and
the recurrent warnings issued by development practitioners and international organizations, there is
little empirical evidence for the role of the exposure to pathogens for civil conflicts. The only existing
ruled out.11Another strand of the literature has explored the role of short-term variation in weather conditions within countries
to study the role of income shocks, see, e.g., Miguel, Satyanath, and Sergenti (2004), Ciccone (2011), Couttenier and
Soubeyran (2014) and Berman and Couttenier (2015) and the extensive surveys by Blattman and Miguel (2010) and
Couttenier and Soubeyran (2015).
6

systematic evidence for the relationship between the exposure to human pathogens and conflicts is
presented by Cervellati, Sunde, and Valmori (2016) who exploit cross-country variation in the expo-
sure to multi-host vector-transmitted, MHV, pathogens as empirical determinant of the likelihood of
large scale civil wars.12 The literature has pointed out several limitations of cross-country analyses of
civil violence, both in terms of empirical strategies available for identification and inference and for
the exploration of the respective mechanisms. Exploiting disaggregated data allows us to implement
a substantially refined empirical identification approach and for the exploration of the underlying
channels and the existence of spatial spillovers in this paper.
The paper thereby contributes to a recent literature that has investigates the determinants of
violence at the sub-national level. The literature that exploits disaggregate conflict data for the
whole of Africa is still in its infancy but grows rapidly. Most of this work uses data from the
Armed Conflict Location and Event Data Project, which offer a full coverage of violent events for the
whole of Africa. Besley and Reynal-Querol (2014) document the persistence of historical conflicts
across locations in Africa. Harari and La Ferrara (2016) investigate the role of weather in rain-fed
agriculture. As discussed in further detail in Section 4, in terms of empirical set up the closest paper
to ours is by Michalopoulos and Papaioannou (2016), who exploit cross-sectional variation in (post-
colonial) country borders to identify the role of the “scramble” for Africa by the European colonial
powers.
Some recent works have explored the short-term, rather than the long-term, determinants of
civil violence by exploiting exogenous within-cell variation over time. Berman, Couttenier, Rohner
and Thoenig (2015) exploit yearly variation in commodity prices in mining areas and document a
causal increase in struggles for the control of territories. Cervellati, Esposito, Sunde and Valmori
(2016) use panel data to study the short run effects of variation in malaria exposure by exploiting
exogenous within-cell variation in short-term weather conditions that are suitable for temporary
spikes in malaria transmission. The empirical strategies in in this strand of the literature exploit
within cell variation over time by including cell specific fixed effects (that absorb time invariant
12As consequence of their specific features, the presence (or endemicity) of MHV pathogens in a country is crucially
related to country-specific characteristics. Their global distribution is influenced little by trade, economic activities,
and the lack of vaccines. In addition, their reliance on multiple non-human hosts makes these pathogens highly
resistant to health campaigns and eradication policies, which provides a possibility to study the relation between
disease exposure and civil war.
7

cell-specific characteristics, including long term malaria stability and population immunities). The
approach developed in the current paper takes a complementary approach as it is not based on short
term weather shocks but on variation in the long-term exposure to the malaria pathogen. The current
project also provides novel evidence on the largely unexplored role of resistance of the population in
terms of acquired and genetic immunity, and its interaction with anti-malarial policies.
Most of the existing epidemiological and economic literature has concentrated attention on the
opposite question of the effect of armed conflict on the prevalence of malaria in the population.
Available studies that exploit a variety of techniques and data report mixed findings. A positive
association between large scale civil conflicts and malaria has been documented for the case of
Afghanistan, where the pathogen was reintroduced by the massive, war-related relocation of about
100,000 people (see Kolaczinski, 2005 and Gayer et al., 2007). Evidence by Montalvo and Reynal-
Querol (2007) for a large panel of countries further documents that large scale civil wars tend to
increase the spread of malaria when they are associated with the displacement of large masses of
people and the establishment of refugee camps. Available studies by epidemiologists that look at
localized conflicts using disaggregate data and geo-statistical models find mixed effects of violent
events on malaria parasitization (as measured by health surveys) and on the implementation of
anti-malarial policies (see Messina et al., 2011 and Sedda et al. 2015). Large scale conflicts and, in
particular, the displacement of large numbers of individuals tend to increase the prevalence of malaria,
while the relationship between localized civil violence and the prevalence of malaria is unclear.
The project also indirectly relates to the literature on the role of health and mortality for com-
parative development. A number of studies has investigated the implications of the overall exposure
to human diseases and measures of health for human capital accumulation and development across
countries.13 The role of malaria for cross country development is still a matter of intense debate.14 In
the attempt to improve upon cross-country studies, some recent works explore the role of diseases for
African development by exploiting disaggregate data as we do in this paper. Alsan (2015) studies the
13See, e.g., Acemoglu and Johnson (2007), Lorentzen, McMillan, and Wacziarg (2008) or Cervellati and Sunde
(2015) among others. Other studies have investigated the role of mortality and demographic dynamics for long-term
development. African countries are still mostly pre-transitional in terms of the demographic transition and some works
have documented the role of exposure to pathogens and mortality for long run growth during the different phases of
the demographic transition, see Cervellati and Sunde (2011).14Early works by Gallup et al. (1999), Gallup and Sachs (2001) and Sachs (2003) attributed a major role to malaria.
Their conclusions have been qualified and questioned subsequently, see Weil (2010, 2011, and 2014).
8

role of exposure to trypanosomiasis for the pre-colonial organization of economic activity in Africa.
Esposito (2015) documents the role of group-specific genetic immunities to malaria for shaping the
patterns of the African slave trade. Cervellati, Chiovelli and Esposito (2016) document the role of
ancestral exposure to malaria for the emergence and persistence of African ethnicities. They find that
long term exposure to malaria increases the number of ethnic groups in a given cell. Depetris-Chauvin
and Weil (2017) explore the role of long-term exposure to malaria for pre-colonial development in
Africa. Their estimates suggest that the effect of malaria on adult mortality in the past was larger
than today. In terms of pre-colonial outcomes they find no significant effect of malaria on historical
population density and development. Finally, Cervellati, Esposito and Sunde (2017) document a
non monotonic effect of long-term exposure to malaria on local development as measured by night
lights per capita at the cell level in Africa today. The results in this paper indirectly contribute
to this literature by providing evidence for a potentially relevant but largely unexplored channel
that the long-term exposure to malaria and the associated emergence of immunities to Africa’s poor
development performance.
3 Malaria Epidemiology: Background, Facts and Implica-
tions
From an epidemiological perspective malaria is a peculiar disease in many dimensions. Some of the
specificities of the malaria epidemiology are very important for the implementation of the empirical
analysis in this paper. In this section we provide a brief description of some relevant basics features
malaria epidemiology.
Background. Malaria is caused by several types of plasmodium parasites of which falciparum is the
most deadly and most common in Africa. Malaria is a vector-transmitted disease. The transmission
occurs through the female Anopheles mosquito, which requires blood meals for ovary development.
Anopheles reproduction requires water reservoirs, where the eggs are laid the larvae develop and
eventually emerge as adult mosquito. The reproduction cycle and its length crucially depend on the
weather conditions.15 The life cycle of Plasmodium falciparum parasites is complex and takes place
15See, e.g., Bayoh and Lindsay (2003) Christiansen-Jucht et al. (2014) and Lyons et al. (2013) for details on the
requirements for reproduction and Section 4 for details on the construction of the measure of predicted malaria stability.
9

both within humans and within the mosquito (that serves as both reservoir host and vector). Biting
an infected human and absorbing the parasite as gametocytes (i.e., in sexual forms) from the human
blood, starts a cycle of growth and sexual multiplication of the parasite inside the mosquito. The
cycle continues upon transmission of infection through an injection directly in the blood of a new
human host where the parasites develop and multiply asexually, first in liver and later in the the red
blood cells.
Stability of Malaria Transmission and Acquired Immunities. Following the seminal work by
MacDonald (1956), malaria epidemiologists classify the exposure to malaria along a stable-unstable
gradient (see also Hay et al., 2008, for a discussion of the evolution of the modeling and measurement
of malaria stability). At the two extremes, the literature conceptually differentiates between areas
with stable malaria transmission, which are characterized by uninterrupted cycles of transmission
between humans and infected mosquitos, and areas where the transmission of malaria is unstable.
As will be discussed below in Section 4, the degree of stability of malaria transmission is crucially
related to the local bio-climatological environment.
Areas with higher malaria stability are characterized by higher inoculation levels (that is a higher
probability of being bitten by an infected mosquito) and higher endemicity of the pathogen in the
population. In high malaria stability areas the mortality rates in children are large but individuals
surviving repeated infections develop effective immunities. Doolan et al. (2009) points out that
“Naturally acquired immunity to falciparum malaria protects millions of people routinely exposed
to Plasmodium falciparum infection from severe disease and death. (...) Across sub-Saharan Africa
where the disease is holoendemic, most people are almost continuously infected by P. falciparum,
and the majority of infected adults rarely experience overt disease. They go about their daily
routines of school, work, and household chores feeling essentially healthy despite a population of
parasites in their blood that would almost universally prove lethal to a malaria-naive visitor.” A
long term uninterrupted exposure to the pathogen is the primary driver of acquired immunities. In
the words of Hay et. al. (2001) “when extrinsic development of the parasite is short (...) and when
the vectors have a low mortality rate and bite humans frequently. Where such conditions are met
and Plasmodium falciparum malaria transmission is stable, the prevalence of infection is high and
endemicity is relatively insensitive to climatic changes. The constant high challenge to the local
population stimulates strong immunity and a consequent decrease of clinical disease episodes among
10

adults.” The consequence is a greater resistance against malaria infections of adults.16
Areas with unstable malaria are, on the contrary, characterized by interrupted or even infrequent
exposure to the pathogen. A specificity of these areas is that infections take the form of epidemics.
An important point is that outbreaks of the disease in unstable transmission areas affect population
at large, including adults and can have devastating effects. According to the classic description of
MacDonald (1957), “An epidemic is an acute exacerbation of disease out of proportion to the normal
to which the community is subject. (...) Epidemics are common only in zones of unstable malaria,
where very slight modification in any of the transmission factors may completely upset equilibrium,
and where the restraining influence of immunity may be negligible or absent.”
Age Patterns and Malaria Incidence in Adults. A key point for the purposes of our analysis is
that the development of acquired immunities among the adult population crucially imply a changing
age composition of clinical cases as a function of the stability of malaria transmission. MacDonald
(1956) also studied the age distribution of malaria cases under varying transmission intensities. He
emphasized that that the age peak of affected cases decreases with the level of malaria stability,
subsequently also called the “peak shift” phenomenon. Recent research has provided empirical
quantifications of the shift in the age of the affected population as a function of malaria stability.
Murray et al. (2012) find that “the proportion of malaria deaths in adults is almost always more
than 40 percent (...) exceptions are sub-Saharan African countries with high malaria transmission.”
Recent evidence documents that the age peak shift pattern is particularly visible for cases of severe
malaria. For instance, Griffin et. al. (2013) document that the share of severe cases in children under
5 of age ranges from 60% to around 10% when passing from high to low stability of transmission. The
opposite is true for the share of cases in individuals aged 15 or above, who account for a negligible
fraction of cases in high stability areas and up to 60% in low transmission areas (with areas with
intermediate stability of transmission displaying more balanced cases at all ages).
These specific features of malaria epidemiology have an important implication: the relationship
between the level of malaria stability and the incidence of severe malaria in adults (and, in the limit,
16Figure A2 in the Appendix reproduces a figure from Langhorne et. al. 2008), which illustrates this in terms of the
decline in the severity of infections with age due as a result of repeated infections and acquired immunity in endemic
malaria areas. For individuals surviving to the age of 15, the probability of developing severe malaria is negligible and
infections involve light symptoms or are even asymptomatic.
11

death) is hump-shaped. The reason is that while the inoculation rates of the pathogen increases
with malaria stability, the likelihood that adult develop serious symptoms, or die, is decreasing with
malaria stability. As a result, mortality and morbidity of infected adults exhibits a hump-shaped
pattern and peaks for intermediate malaria stability. Figure 1 illustrates the typical patterns by de-
picting the relationship between the baseline measure of predicted malaria stability (labelled “Malaria
Stability” in short), from Kiszewski et al. (2004) and two measures of mortality for individuals above
age 5 across countries in Africa.17
Figure 1: Malaria Stability and Adult Mortality (Aged 5 or above)
050
100
150
200
250
Mal
aria
Mor
talit
y (a
ge>
5 ye
ars)
0 5 10 15 20 25 30Malaria Stability
4050
6070
Life
Exp
ecta
ncy
at A
ge 5
(bot
h se
xes,
UN
)
0 10 20 30Malaria Stability
The left Panel depicts the relationship between the stability of malaria transmission and the estimated mortality
for individuals age 5 or above in the year 2000 across countries in Africa. The right panel depicts the relationship
between malaria stability and life expectancy at age 5 in year 2000 in Africa. Both Figures plot local polynomial
fits (with 95 percent confidence intervals) and a quadratic fit. Data sources: Kiszewski et al. (2004), Murray
et al. (2012), and United Nations, World Population Prospects (2015 Revision). See also Section 4 for details
on the data.
The left panel depicts the relationship between the predicted stability of malaria transmission
with the recent estimates of adult mortality provided by Murray et. al. (2012).18 The graphs
include a local polynomial that allows a non-parametric fit of the data (with 95 percent confidence
intervals) as well as a quadratic fit. In spite of the data limitation and the few observations available,
the patterns are suggestive of the role of the “age peak shift” in creating the hump-shape effect of
17See section 4 for details of the construction of predicted malaria stability index.18The estimates by Murray et al. (2012), are the result of a large effort to provide systematic and comparable
estimates of the evolution of malaria incidence among adults across countries.
12

malaria on mortality of adults. Malaria is far from the only important source of mortality in Africa
but it still represent an important burden and an important determinant of life expectancy in Africa.
The right panel illustrates the same underlying pattern in terms of the link between malaria stability
and life expectancy at age 5 (i.e., excluding child mortality).
It is noteworthy that a reversal in malaria deaths and life expectancy occurs when malaria stability
gets larger than 15 or 20. This is in line with the classification of areas in terms of the historical
presence of the pathogen in the African population since all areas with a predicted malaria stability
index above 15 are classified as endemic.19 The high selective pressure from malaria also favored
the distribution of several types of genetic diseases that are malaria protective (examples include
the sickle-cell disease, the Duffy-Antigen negative genotype, thalassemia, and glucose-6-phosphatase
deficiency, among others). Differently from acquired immunities (that emerge over time and mostly
protect adults) these innate immunities are transmitted from parents to children and tend to protect
all age groups alike and therefore do not induce the age peak shift but do offer protection in the face
of increasing malaria stability and inoculation rates.20
Time Patterns, Treatment and Control. The specificities of malaria in terms of transmission
and reproduction have shaped attempts to contain and eradicate malaria since the end of WWII.
Eradication policies historically focused on preventing the vector from reproducing, by eliminating
lentic water reservoirs by ways of draining swamps or eradicating the vector, e.g., by spraying in-
secticides like DDT. In the most developed countries, like Europe, these policies were successful and
malaria is declared eradicated (although the vectors are still present and new warnings has been
recently issues on the prospects of a reintroduction of the pathogen through globalization and migra-
tion). The early wave of policies for malaria control and the attempt of eradication have been less
successful in developing countries for a variety of well studied reasons (which include reduced policy
19As discussed below, we use the alternative data from Lysenko and Semashko (1968), that classify categorial levels
of endemicity in the African population around 1900, as robustness check. The areas with a predicted malaria stability
index by Kiszewski et. al. (2004) above 15 are classified as mesoendemic, hyperendemic or holoendemic. Areas with
malaria stability around 25-30 tends to be classified as hyperndemic and holoendemic. See also the bin scatter plot
reported in Figure A3 in the Appendix. The malaria endemicity variable is categorial with: 1 epidemic; 2 hypoendemic;
3 mesoendemic; 4 hyperendemic; and 5 holoendemic.20For robustness we also exploit information on genetic immunities to explore whether the effect of increases in
malaria stability is moderated by higher genetic immunities.
13

effort starting from the 1980’s, the increase in the size of population at risk of malaria inoculation
and the increasing resistance of the plasmodia pathogens to the drugs traditionally administered in
the last decades in Africa).
The end of the 1990’s have nonetheless witnessed a renewed effort to fight the disease under the
Malaria Roll Back program of the WHO that, being supported by private donors and international
organizations lead to a rapid scaling up of malaria control policies in Africa in mid 2000’s. These
attempts to control malaria involved a combination of several measures, including the spraying of
habitations with insecticides, distributing bed nets that have been treated with insecticides, or the
administration of anti-malarial drugs to treat malaria infections. No successful eradication of Malaria
has been achieved yet in Sub Saharan Africa where, in spite of the large recent efforts for treatment
and control, the prospects of eradiction are still considered limited even over the medium and long
term. Currently, no licensed vaccine is available.21
According to estimates by Murray et al. (2012) malaria deaths at the global level have steadily
increases from below a million in 1980 to a peak of about 1.9 millions in the early 2000 and eventually
display a 30 percent decrease after 2005 due to the systematic interventions campaigns in Africa after
that year.22 An interesting finding of their study, that is relevant for our analysis, is that the change
in trend in mortality for adults, that display a decrease after 2005, is particularly strong in areas with
intermediate and low malaria stability.The role of policies and the reversal in the mortality trends is
confirmed also by Bhatt et al. (2015) that provide a first attempt of mapping the implementation of
anti-malarial policies for the whole of Africa.
4 Empirical Strategy and Data
4.1 Empirical Strategy
We closely follow the insights and stylized facts from the malaria epidemiology briefly presented
in Section 3, both in terms of data and in terms of design of the empirical specification. It has
21See http://www.who.int/mediacentre/factsheets/fs094/en/ for an overview of anti-malarial policies, their
effectiveness, and limitations. The most recent overview on the spread of malaria can be found in the WHO’s World
Malaria Report 2016 (http://www.who.int/malaria/publications/world-malaria-report-2016/report/en/).22According to the authors, private funding specifically dedicated to malaria control, that passed from around 150
million in 2000 to more than 1.2 billion in 2008, was particularly important in explaining the change in trend.
14

been argued repeatedly that countries might not represent the appropriate unit of observation when
investigating the reasons for civil violence and predation, which are typically local events. The
concern about the inappropriateness of country-level data has in fact been one of the issues motivating
the construction of the ACLED database. Given the role of local geo-climatological conditions and
the the prevalence of immunity in the local population, the role of exposure to malaria can also be
expected to be confined to small geographical areas, rather than entire countries.
Consequently, the analysis is based on data at the grid-cell level as primary units of observation.
Compared to a cross country analysis, the use of disaggregate data has the additional advantage
of being able to study the role of long-term exposure to malaria while controlling for factors that
are common to countries, including the political situation, the institutional framework, and the
composition of the population. The data sources discussed above are suited for this purpose as they
provide disaggregate information on the cell level for different measures of long-term exposure to
malaria, genetic immunities, and proxies for the implementation of anti-malarial policies. Thereby,
the analysis makes use of a valuable and still under-exploited source of information that allows us to
investigate the possible link between disease exposure and civil violence, to explore the mechanism
behind this link and to evaluate the effectiveness of public policies.
The analysis uses disaggregate data for the entire African continent at the grid-cell level. As
discussed above the relationship between malaria stability and incidence and mortality in adults is
hump-shaped. To account for this predicted non-monotonicity we implement the following empirical
framework,
Conflictic = f(Malaria Stabilityic) +X ′icβ + ζc + uic
where Conflictic represents a measure of incidence of conflict in cell i in country c. The question of
interest for the purpose of this paper is the link of conflicts to malaria exposure, measured by the
predicted stability of malaria transmission, labelled Malaria Stability in short and non linear shape
of this relationship, captured by the function f(·). A relevant contribution of the empirical analysis
is the investigation of the shape of the link between malaria exposure and conflict, represented by the
functional form of f(·). Other, cell-specific factors related to geography, climate, natural resources,
location and distances, population, development and urbanization that might influence conflict, are
accounted for by the inclusion of corresponding control variables, reflected in the vector Xic.
The use of sub-national data allows to account for all (observable and unobservable) country-
specific features that affect the likelihood of conflicts above and beyond the exposure to pathogens,
15

subsumed in the vector ζc. This permits, in particular, to account for the role of country specific
institutions, policies and national or colonial history, which are confounders that are difficult to
account for in cross-country studies, thereby allowing for a substantial improvement in terms of
econometric identification. This approach is along the lines of Michalopoulos and Papaioannou
(2016). To insure external validity, we also follow the spirit of large cross-country studies and
consider all locations (grid-cells) on the entire continent of Africa. Compared to cross-country data
this empirical strategy provides a balance between the external and internal validity.
Disaggregate data also have limitations that need to be addressed in the empirical analysis. The
first issue concerns the definition of the appropriate unit of observation. We will deal with this issue
following the common practice of checking the robustness of the results by replicating the analysis
with grid cells of different size. The baseline analysis is conducted with 2.5×2.5 degrees cells, where
one degree corresponds to about 110 kilometers at the equator. The use of the coarser grid has the
advantage of minimizing overlap and dependencies. On the other hand, averaging on a coarser grid
implies a loss of information and potentially influences the empirical estimates.23 A related issue
is about the existence of spatial dependencies in the data. To account for this issue, the empirical
estimates report standard errors that are robust for spatial dependencies (Conley standard errors). To
account more explicitly for spatial spillovers, the robustness analysis also explicitly estimates models
that allow for spatial autoregressive elements in the dependent or explanatory variables (estimated
with maximum likelihood).
4.2 Data
This Section presents the main variable of interest. The variables, their coding as well as their
respective data sources are described in detail in Tables 9, 10 and 11.
Civil Violence. As a measure of civil violence, we use data from the Armed Conflict Location
and Event Data Project (ACLED, Version 7 1997-2016), which represents the most comprehensive
public collection of disaggregated data on violent events available for developing states. The data
set is particularly suited for the purpose of this analysis as it provides detailed information on the
geographic location of a violent event in terms of latitude and longitude. As baseline outcome variable
23The sensitivity of empirical results with respect to the choice of geographic coarseness is known as the “Modifiable
Area Unit Problem”, see, e.g., Briant, Combes, and Lafourcade (2010).
16
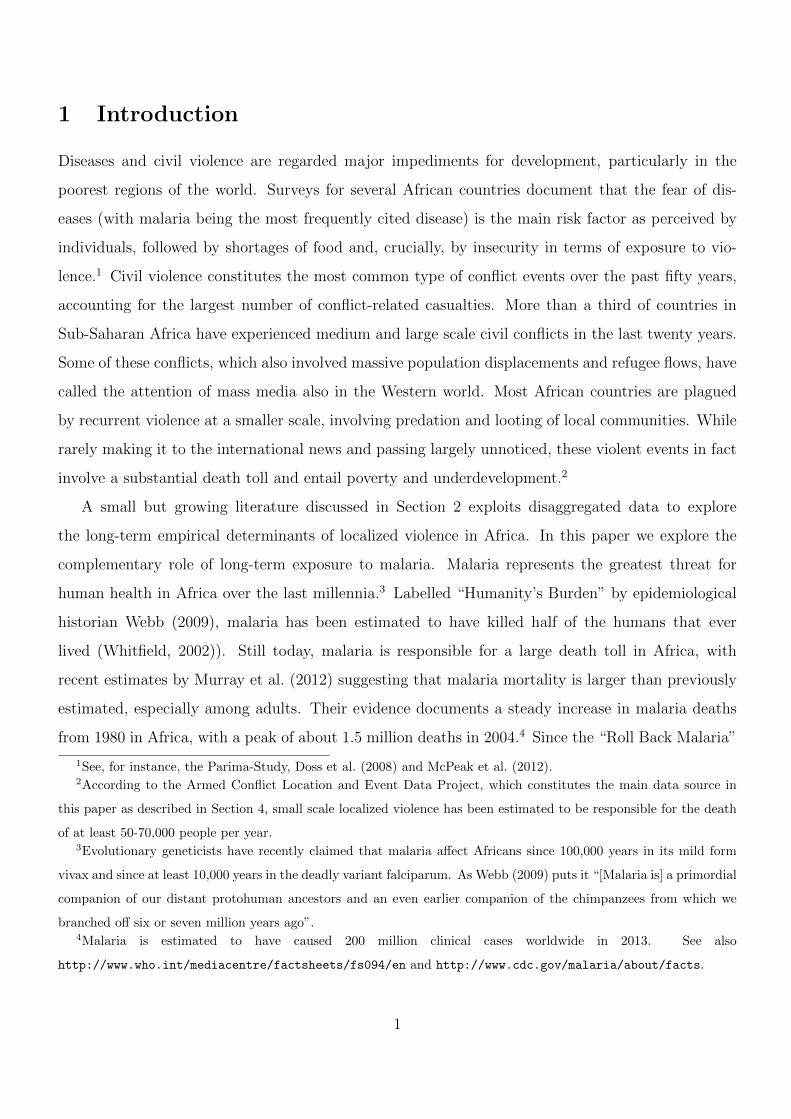
of interest, we look at the fraction of years over the period 1997-2016 where at least one violent event
took place in a given cell. Figure 2 depicts the spatial distribution of violent events in Africa.
Figure 2: Violent Events
LegendFraction of Years w Conflict
0.00 - 0.050.06 - 0.200.21 - 0.350.36 - 0.500.51 - 0.600.61 - 0.750.76 - 0.900.91 - 1.00
Spatial distribution of fractions of years with at least one violent conflicts over the period 1997-2016 (in 2.5o×2.5o
cells). Data source: Armed Conflict Location and Event Data Project, ACLED (version 7, 2016).
We also explore the sensitivity of the results with respect to different coding of conflicts, including
the total number of events and the intensity of violence in terms of fatalities, as well as different
types of conflicts in terms of open confrontations between armed groups, violence against civilians and
riots and protests. As robustness we also use alternative conflict data from the UCDP Georeferenced
Event Dataset (2016) for which we code the fractions of years in conflicts and the total number of
conflicts as conflict measures.
Predicted Malaria Stability. The analysis relies on the availability of a measure of the long-
term exposure to malaria that is rooted in the specific features of the epidemiology of malaria. As
baseline information on long-term malaria exposure we use the force of malaria transmission and
stability index, which has been constructed by Kiszewski et al. (2004). This index henceforth
labelled “Malaria Stability” provides a measure of “predicted” malaria stability derived from vector
based models (following the seminal work by MacDonald, 1957) rather than actual malaria stability
as proxied by estimated inoculation rates or prevalence of the pathogen in the population.
An important advantage of the using measures of predicted malaria transmission stability is that
17

the measure does not exploit information on the distribution of pathogens in the human population
or other relevant covariates (like population density) that are potentially directly related to human
activity and conflicts. In fact the index does not even exploit information on whether the pathogen
is present or endemic in each location but rather on the potential for transmission. The index is built
using information on the type of mosquito vectors that are prevalent in each location as well as their
biological characteristics (like the typical share of blood meals from humans, the longevity of the
mosquito, etc). Information on the vectors is used together with information average climatological
conditions that favor the spread and infection of the vector according to vector based epidemiological
models.24 The index offers fine grained disaggregate information on the predicted stability of trans-
mission in a geographic location. Since the data underlying this index are available with a high level
of precision and geographic disaggregation the resulting index provides full coverage of all locations
without the need for spatial interpolation.
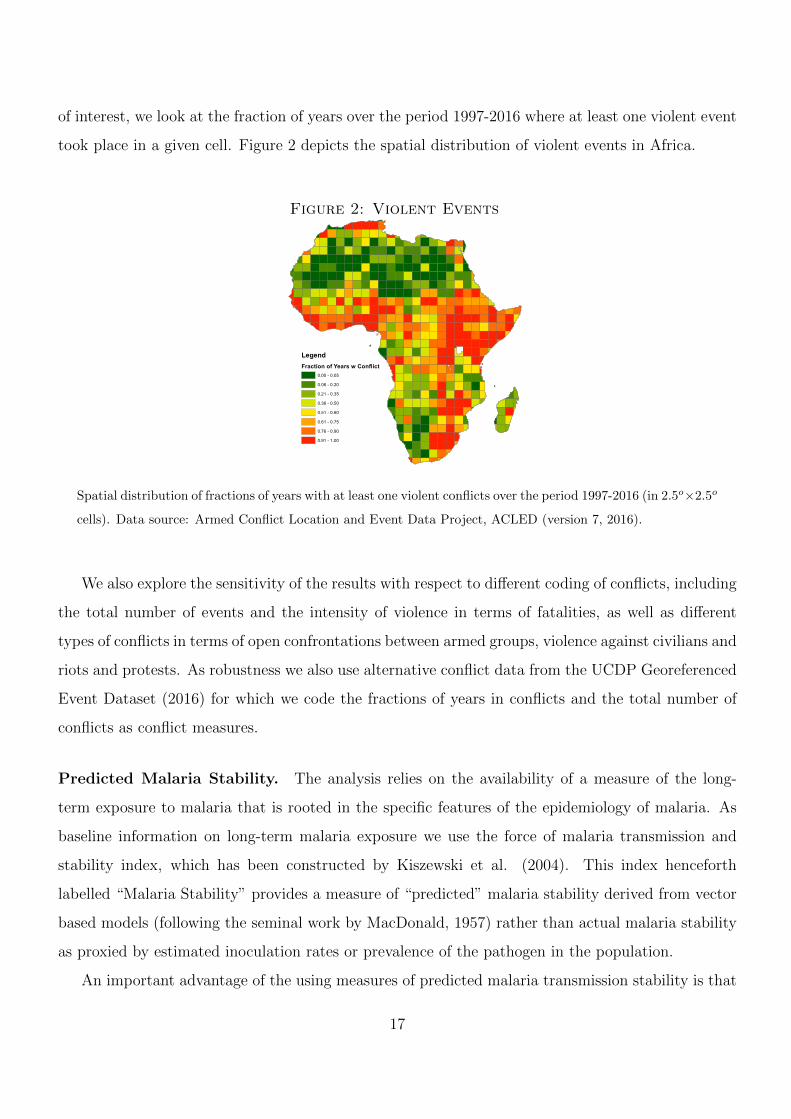
Figure 3 provides a graphical illustration of the distribution of the long-term exposure to malaria
in Africa. To check the robustness of the findings and the persistence of the effect we make use
of several alternative data sources. In particular, we use information on the spatial distribution
of historical malaria endemicity around 1900 constructed by Lysenko and Semashko (1968) and
digitalized by Hay et al. (2004). A corresponding map is presented in Figure A4 in the Appendix.
As alternative measure of resistance of the population, we explore the role of genetic immunity
to malaria infections, using information on the spatial distribution of the population prevalence of
traits that imply genetic resistance to malaria. In particular, we look at the average prevalence (in
terms of population shares) of three genetic traits: the sickle-cell trait, the glucose-6-phosphatase
deficiency (G6PD), and the individuals with a Duffy antigen-negative red blood cells. The average
distribution of genetic resistance is plotted in Figure A5 in the Appendix.
24When constructing this index, Kiszewski et al. (2004) assigned to each region a dominant vector of Anopheles
mosquitoes (for countries with different dominant vectors, mosquitoes were associated to sub-regions), and used
this information together with the respective biting rates of humans of the prevalent vectors and the specific bio-
climatological conditions in each location to measure the force of malaria transmission and stability. This involves a
positive (although non linear role) of temperature in the previous month and a threshold level of precipitations. The
climatic data employed are averages of monthly observations between 1901 and 1990. The final index is indirectly
informative on the number of months that are predicted to be compatible with malaria transmission in each location.
In our sample the Malaria Stability index ranges from 0 (absence of a sustainable environment for malaria transmission)
to about 34 (high potential for malaria transmission).
18
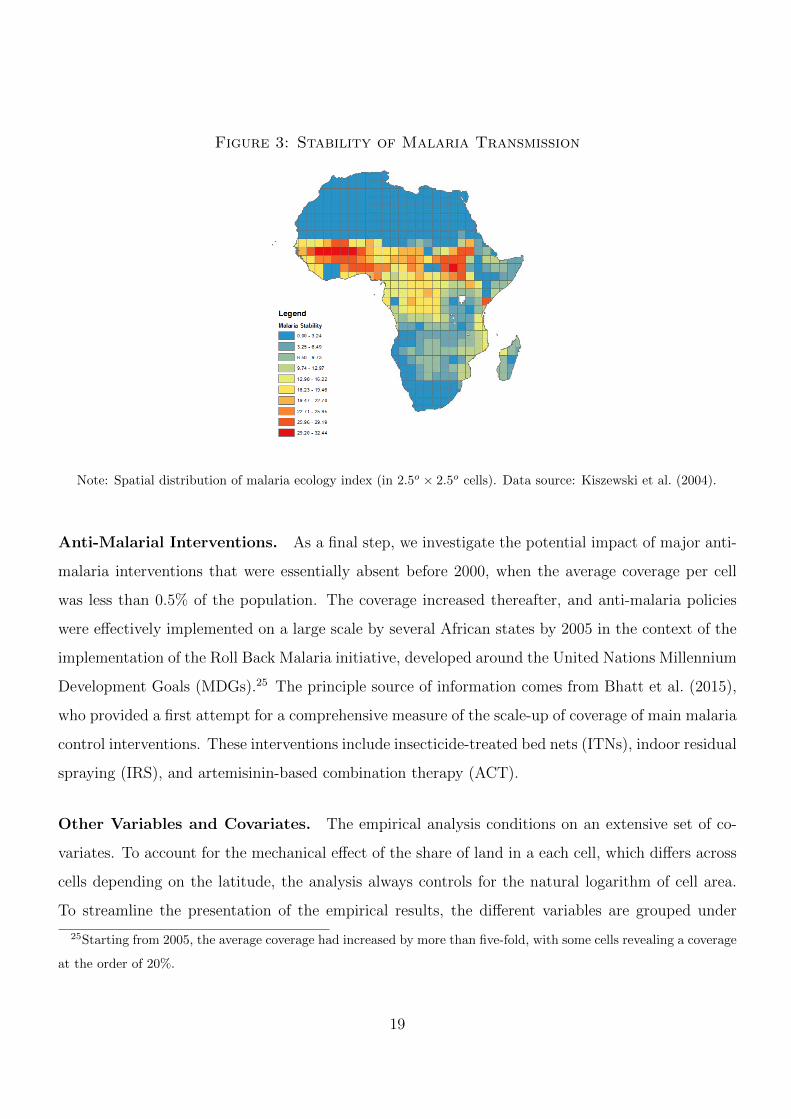
Figure 3: Stability of Malaria Transmission
Note: Spatial distribution of malaria ecology index (in 2.5o × 2.5o cells). Data source: Kiszewski et al. (2004).
Anti-Malarial Interventions. As a final step, we investigate the potential impact of major anti-
malaria interventions that were essentially absent before 2000, when the average coverage per cell
was less than 0.5% of the population. The coverage increased thereafter, and anti-malaria policies
were effectively implemented on a large scale by several African states by 2005 in the context of the
implementation of the Roll Back Malaria initiative, developed around the United Nations Millennium
Development Goals (MDGs).25 The principle source of information comes from Bhatt et al. (2015),
who provided a first attempt for a comprehensive measure of the scale-up of coverage of main malaria
control interventions. These interventions include insecticide-treated bed nets (ITNs), indoor residual
spraying (IRS), and artemisinin-based combination therapy (ACT).
Other Variables and Covariates. The empirical analysis conditions on an extensive set of co-
variates. To account for the mechanical effect of the share of land in a each cell, which differs across
cells depending on the latitude, the analysis always controls for the natural logarithm of cell area.
To streamline the presentation of the empirical results, the different variables are grouped under
25Starting from 2005, the average coverage had increased by more than five-fold, with some cells revealing a coverage
at the order of 20%.
19

Figure 4: Anti-Malaria Policy Interventions
Note: Spatial distribution of the coverage of Anti-malarial Policies in the population in 2.5o × 2.5o grid-cells.
The picture depicts the average coverage of anti-malaria policy interventions (in terms of insecticide-treated
bed nets, indoor residual spraying and artemisinin-based combination therapy) in the population (in 2.5o×2.5o
cells) in 2005 (see text for details). Data source: Bhatt et al. (2015).
different headings in the results tables.
Geography/Climate. For a given cell area, the actual land area varies across location depending
on total area occupied by water. We control for the (log of) area occupied by seas, oceans, lakes and
rivers. To isolate the role of predicted malaria above and beyond the long term effect of climate we
control for average temperature and average precipitation. To account for the possible long run role
of climate variability we also include the standard deviation of temperature and precipitation (over
the period 1901-2000) following Buggle and Durante (2017). We also control for mean elevation and
ruggedness of the terrain, which are geographic features that can affect predicted malaria stability
and that have been linked to conflicts in the existing literature. Finally, we control for the local
vegetation environment by including the NDVI Normalized Difference Vegetation Index (NDVI).
Location and Distances. Location controls include latitude and longitude and, to flexibly absorb
possible spatial correlations unrelated to malaria, we consider the second order polynomials in some
specifications. We also include controls in terms of the (log) of the distances (in km) to the cost,
20

to the capital and to the closest country border, all of which have been considered to be potential
determinants of civil conflicts. We include the (log) distance to Addis Ababa as a proxy for genetic
diversity following the argument by Arbatli, Ashraf and Galor (2015) on ancestral migrations. Finally,
we include an indicator for cells that are split across two (or more) countries.
Natural Resources. The analysis conditions on set of variables that are informative on the land
productivity of each cell which may be related to the stability of malaria exposure and on the presence
minerals that have been associated with civil violence. Specifically, we account for the land suitability
for agriculture using two alternative measures. Average land suitability in a cell from Ramankutty et.
al. (2002) and the caloric suitability index from Galor and Ozak (2016) which provides information
on land suitable for agriculture for the most caloric-intensive crops (average for all crops available in
the old world after 1500) (see also Buggle, 2017). We account for the presence of diamonds mines
(from Gilmore et. al, 2005), petrol fields (from Lujala et al., 2007) and mineral facilities or deposits
(from the US Geological Survey).
Ethnic Groups and Country Borders. The presence of multiple ethnic groups have been linked
to conflicts. Cervellati, Chiovelli and Esposito (2016) document the role of ancestral malaria in
favoring the emergence and persistence of ethnicities in Africa. As a result long term exposure to
malaria tends to increase ethnic fractionalization. To explicitly account for the potential role of
ethnic diversity on conflicts, and to explore this potential long channel of malaria, we control for the
number of ethnic groups in a cell. The process of colonization, during the so called scramble for Africa,
further lead to the division of ethnic groups between different countries. Following Michalopoulos
and Papaioannou (2016), that document the role of splitted groups for the likelihood of civil violence,
we also account for whether a cell host an ethnic group that is divided by country borders.
Population, Night Lights and Roads. As a final group we include a set of control variables
that, in different ways, are informative on the distribution of population and economic activity.
A relevant caveat is that, in view of the literature, these variables might be jointly affected with
civil conflict by other omitted variables and their inclusion may, therefore, lead to problems of bad
controls. Exploring the role of these covariates can nonetheless also be informative on the potential
channels linking malaria to conflicts. We account for cross-cells differences in population density
which has been considered a relevant determinant of the likelihood of civil violence. Following the
21

literature, differences in economic development indirectly accounted for controlling for the intensity
of lights at nights. Cervellati, Esposito and Sunde (2017) document the existence of a non-linear
relationship between malaria and night lights. Exploring the role of this variable is also indirectly
informative also on the level of urbanization. Finally, we account for the presence of a primary roads.
5 Results
5.1 Predicted Malaria Stability and Civil Violence: Baseline Results
Linear Specification. As discussed in Section 4, the analysis is based on the index of malaria
stability as measure of long-run malaria exposure. The advantage of this index is its exclusive reliance
on biological and geo-climatological specificities of malaria transmission, which has the advantage of
high resolution data. Figure 5 provides a bin-scatter plot of the unconditional relationship between
malaria stability and the fraction of years over the period 1997-2016 during which a cell experienced
at least one civil conflict. The graph shows a positive unconditional relationship between malaria
exposure and conflict incidence. As suggested by the quadratic fit, however, the relationship becomes
weaker for higher levels of malaria stability.
Figure 5: Stability of Malaria Transmission and Civil Conflicts
.2.4
.6.8
% Y
ears
w C
onfli
ct
0 10 20 30Malaria Stability
Note: Scatter plot (bins) of unconditional relationship between malaria stability and civil violence (in 2.5o×2.5o
cells); quadratic fit. Data sources: Kiszewski et al. (2004) and ACLED 7.
The shape of the unconditional relationship should be taken as purely suggestive as the analysis
does not condition on any of the (many) potentially relevant covariates. To investigate the relation-
ship more rigorously, we conduct regression analysis of the prevalence of conflict in a cell during the
22

period 1997-2016 on the exposure to malaria, in terms of the index value of the malaria stability in-
dex Malaria Stability of the cell, using a linear specification. The results for different specifications
of the estimation equation with regard to control variables are shown in Table 1. Standard errors
robust to clustering at the country level are shown in parentheses, Conley-robust standard errors to
account for potential spatial clustering are reported in square brackets.
The results shown in Column (1) replicate the unconditional relationship of Figure 5 and show a
significant positive association. The results in Column (2) are obtained with a specification that only
contains country fixed effects and also suggest a positive association between malaria exposure and
civil conflicts. However, once controls for geographic and climatological features of the respective cell
are added to the specification, the coefficient becomes quantitatively much weaker and the significant
association vanishes, see Column (3). Additional specifications include further controls relating to
economic potential and natural resources as in Column (4), controls for the fact that a cell belongs
to more than one countries (cells with a country border) and for cells that are populated by more
than one ethnic group as in Column (5), population density as in Column (6), or for economic
development (in the form of access to primary roads and illumination at night) as in Column (7).
Despite the risk of subsequently adding potentially ‘bad controls’ that might be affected by problems
of endogeneity or reverse causality, the estimation delivers very similar coefficient estimates, with no
evidence for any coherent link between malaria exposure, measured by the malaria stability index,
and civil conflict using a linear regression framework.
23

Table 1: Malaria Exposure and Conflicts: Linear Specification
Dependent Variable Fraction of Years with Conflicts (1997-2016) - Cell Level
(1) (2) (3) (4) (5) (6) (7)
Malaria Stability 0.016*** 0.014*** 0.009 0.006 0.004 0.004 0.006(0.003) (0.004) (0.006) (0.005) (0.006) (0.006) (0.006)[0.002] [0.002] [0.004] [0.003] [0.004] [0.004] [0.004]
Geography/Climate:
Total Area under Water No No Yes Yes Yes Yes YesAverage Temperature No No Yes Yes Yes Yes YesAverage Precipitation No No Yes Yes Yes Yes YesPrecipitation (std.) No No Yes Yes Yes Yes YesTemperature (std.) No No Yes Yes Yes Yes YesMean Elevation No No Yes Yes Yes Yes YesRuggedness No No Yes Yes Yes Yes YesNorm. Diff. Vegetation Index No No Yes Yes Yes Yes Yes
Location/Distances:
Absolute Latitude No No Yes Yes Yes Yes YesLongitude No No Yes Yes Yes Yes YesDistance to the Coast (log) No No Yes Yes Yes Yes YesDistance to the Capital (log) No No Yes Yes Yes Yes YesDistance to closest Border (log) No No Yes Yes Yes Yes YesDistance to closest River (log) No No Yes Yes Yes Yes YesDistance to Adis Ababa (log) No No Yes Yes Yes Yes Yes
Resources:
Land Suitability Agr. No No No Yes Yes Yes YesCaloric Suitability Index No No No Yes Yes Yes YesDiamond Mines No No No Yes Yes Yes YesMineral Mines No No No Yes Yes Yes YesPetrol Fields No No No Yes Yes Yes Yes
>1 Country No No No No Yes Yes Yes# Ethnic Groups No No No No Yes Yes YesPartitioned Cell No No No No Yes Yes Yes
Population dens. No No No No No Yes Yes
Economic Development:
Night Lights No No No No No No YesPrimary Roads No No No No No No Yes
Country FE No Yes Yes Yes Yes Yes Yes
Observations 442 442 442 442 442 442 442Adjusted R-squared 0.183 0.426 0.598 0.619 0.625 0.643 0.670
OLS estimates. The dependent variable is the fraction of years 1997-2016 with a conflict event in the cell (ACLED 7).See text for details. “Malaria Stability” is the index of malaria strength and stability by Kiszewski et al. (2004). Eachspecification controls for the natural logarithm of the cell area. See the text and Tables 9, 10 and 11 for a descriptionof each variable and their sources. See Table A1 for descriptive statistics. The unit of observation is a 2.5 x 2.5 degreecell. Robust standard errors clustered at the country level in parentheses. Conley standard error (300 km cut-off) insquared brackets. ***, **, * indicate significance at 1-, 5-, and 10-% level, respectively.
24

Non-Linear Specifications. In light of the arguments that suggest a hump-shaped association
between malaria exposure and malaria risk for adults discussed before, and of the non-linear pattern
that emerges from Figure 5, we next address the question of the appropriate empirical specification
of the estimation equation. In particular, as discussed in Section 3, the epidemiological features
of malaria imply that high malaria stability is associated with higher inoculation rates. However,
while affecting the health especially among children, these higher inoculation rates also imply the
development of acquired immunities among adults with consequences for their health and mortality.
This materializes in a non-monotonic effect of malaria stability on the effective burden of malaria for
adults. As consequence, one should expect a hump-shaped form of f(·) in with higher malaria risk
for the population at large in cells with low and intermediate levels of malaria stability compared to
cells with high permanent exposure (stability). We investigate this prediction by estimating more
flexible, non-linear, specifications that allow for a non-linear relation between malaria exposure and
conflict.
Table 2 presents the results from estimating the same empirical specifications as before in terms
of the control variables, but with the malaria stability index entering as second-order polynomial.
Throughout all specifications, the estimates reveal a significant positive but concave relationship
between malaria exposure and civil conflict, as indicated by the positive coefficient on the linear
malaria stability index and by the negative coefficient on the square term. Both coefficients are
affected very little by the precise specification in terms of additional control variables. In particular,
compared to the baseline specification with geographic and climatological controls in Column (3),
specifications with controls that are more likely to be affected by endogeneity problems only deliver
slightly smaller coefficients (about 25 percent). Since clustered standard errors are similar and even
slightly larger compared to Conley standard errors, we only report the former in the remaining tables.
With a coefficient of around 0.03 for the linear term and -0.001 for the quadratic term, the
maximum of the effect for the most extensive specification is around a malaria stability index of
15. In terms of magnitude, the predicted effect for cells located at the the peak of the hump-shape
relationship (which correspond to a malaria ecology index of 15) is about 22.5 percentage points larger
than the predicted effect in cells with minimum malaria stability (at zero) or at malaria stability
of 30 (where the maximum malaria stability in the sample is a cell with an index of around 34).
Compared to an unconditional average fraction of years with conflicts of 0.514, this corresponds to
a variation in the effect of almost 50 percent of the unconditional mean across the range of malaria
25
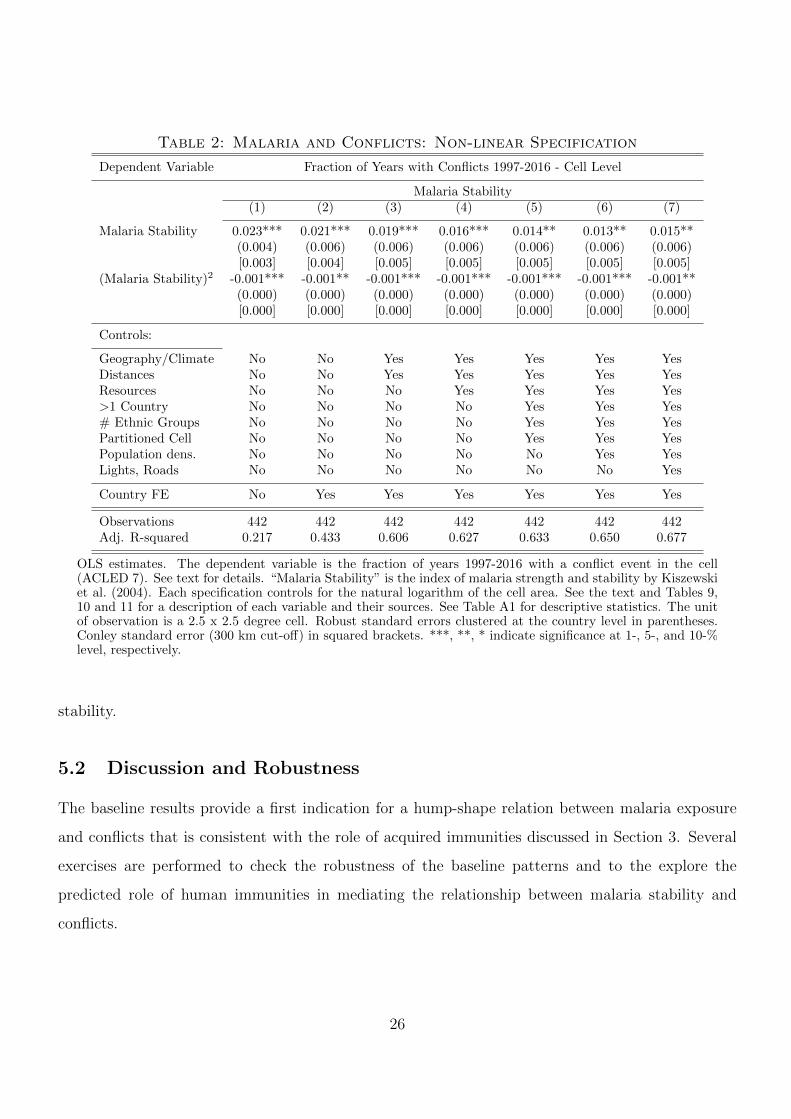
Table 2: Malaria and Conflicts: Non-linear Specification
Dependent Variable Fraction of Years with Conflicts 1997-2016 - Cell Level
Malaria Stability(1) (2) (3) (4) (5) (6) (7)
Malaria Stability 0.023*** 0.021*** 0.019*** 0.016*** 0.014** 0.013** 0.015**(0.004) (0.006) (0.006) (0.006) (0.006) (0.006) (0.006)[0.003] [0.004] [0.005] [0.005] [0.005] [0.005] [0.005]
(Malaria Stability)2 -0.001*** -0.001** -0.001*** -0.001*** -0.001*** -0.001*** -0.001**(0.000) (0.000) (0.000) (0.000) (0.000) (0.000) (0.000)[0.000] [0.000] [0.000] [0.000] [0.000] [0.000] [0.000]
Controls:
Geography/Climate No No Yes Yes Yes Yes YesDistances No No Yes Yes Yes Yes YesResources No No No Yes Yes Yes Yes>1 Country No No No No Yes Yes Yes# Ethnic Groups No No No No Yes Yes YesPartitioned Cell No No No No Yes Yes YesPopulation dens. No No No No No Yes YesLights, Roads No No No No No No Yes
Country FE No Yes Yes Yes Yes Yes Yes
Observations 442 442 442 442 442 442 442Adj. R-squared 0.217 0.433 0.606 0.627 0.633 0.650 0.677
OLS estimates. The dependent variable is the fraction of years 1997-2016 with a conflict event in the cell(ACLED 7). See text for details. “Malaria Stability” is the index of malaria strength and stability by Kiszewskiet al. (2004). Each specification controls for the natural logarithm of the cell area. See the text and Tables 9,10 and 11 for a description of each variable and their sources. See Table A1 for descriptive statistics. The unitof observation is a 2.5 x 2.5 degree cell. Robust standard errors clustered at the country level in parentheses.Conley standard error (300 km cut-off) in squared brackets. ***, **, * indicate significance at 1-, 5-, and 10-%level, respectively.
stability.
5.2 Discussion and Robustness
The baseline results provide a first indication for a hump-shape relation between malaria exposure
and conflicts that is consistent with the role of acquired immunities discussed in Section 3. Several
exercises are performed to check the robustness of the baseline patterns and to the explore the
predicted role of human immunities in mediating the relationship between malaria stability and
conflicts.
26

Flexible Specifications. Additional robustness checks confirm the main result for more flex-
ible specifications that account for spatial correlations uncorrelated with malaria in terms of a
second order polynomial in absolute latitude and longitude.26 While the estimation results pre-
sented so far reveal a consistent pattern, they are based on a quadratic specification of the function
f(Malaria Stability) in the estimation framework. Next, we explore the association between malaria
exposure, in terms of the malaria stability index, and civil violence using more flexible specifications.
As a first more flexible alternative to the quadratic specification, we allow for different coefficients
for malaria stability for each decile of the data on the malaria stability support. The corresponding
coefficient estimates for an empirical specification that includes all controls as in specification (7)
of Table 1 are depicted in Figure 6.27 The pattern emerging from this figure is hump-shaped, with
the largest and significantly positive coefficient estimates for deciles with average malaria stability
of around 14.5 and 19.
Figure 6: Malaria Stability and Civil Conflict: Semi-Parametric Estimates
-.20
.2.4
.6C
oeffi
cien
t Est
imat
es
0 3.84 6.71 10.2 14.5 19.0 26.3Malaria Stability: Average Value of Deciles
Note: Results of regressions of civil violence (in 2.5o × 2.5o cells) by malaria stability, allowing for different
coefficients by decile.
A final way to visualize the existence of a hump-shape link between predicted malaria stability
and conflicts is fit the unexplained variation that is left after controlling for all covariates (such as
the specification as in Column (7) of Table 1 but without malaria stability) non parametrically by
26See Table A2 in the Appendix.27Notice that since around 40% of all cells in the sample exhibit a malaria stability index of 0, the four lowest deciles
coincide at an average value of 0, which explains that only seven coefficients are plotted.
27

means of local polynomial regression. The results, depicted in Figure A6 in the Appendix provide
further suggestive evidence of a non monotonic relationship.
Indirect Channels. As discussed in Section 1, long term malaria exposure may affect civil violence
indirectly by affecting relevant conflict related outcomes of the process of long term development.
A first channel might be related to the quality of institutions. Along the lines of the argument
proposed by Acemoglu, Johnson, and Robinson (2001), regions that are associated with low exposure
might have been governed by colonizers that implemented inclusive institutions, whereas in regions
with intermediate exposure and therefore high risk of epidemics among adults colonizers might have
implemented extractive institutions, and European colonization was severely hampered or even pre-
vented in regions with very high malaria exposure. One element of this argument that does not
square with the epidemiological literature and the baseline results is that it refers to mortality of
European settlers that, contrary to African populations, display mortality rates that are monotonic
(and not hump-shaped) in the intensity of malaria transmission. This indirect channel would there-
fore suggest that the emergence of extractive institutions, and therefore high conflicts, in the high,
rather than in the low to intermediate, malaria stability areas. To explore this issue, we nonetheless
perform a number of robustness checks. First, to the extent that colonization history is accounted
for by the historically-determined national borders contained in the country fixed effects, the effect
of (national) institutions is already absorbed. Second, following Michalopoulos and Papaioannou
(2016), we explicitly account for whether a given cell hosts an ethnic group that has been partitioned
by country borders, and whether the cell is intersected by a country border, which additionally ac-
counts for systematic influences of colonization strategy unrelated to the malaria channel. Finally, we
also conducted an analysis for more homogeneous sub-samples with respect to colonization history
and European settlement patterns. In particular, we replicate the analysis while excluding Northern
Africa, which has a different colonization history, excluding North and South Africa, or excluding
countries with significant numbers of European settlers (which might indicate suitable conditions
for long-term settlements and hence incentives to implement inclusive rather than extractive institu-
tions). The results from these robustness checks coherently reveal the same non-linear relationship
between long-run malaria exposure and conflict as in the main sample.28
Another indirect channel refers to the long term effect of malaria on African, rather than European
28See Table A4 in the Appendix.
28

populations. Cervellati, Chiovelli and Esposito (2016) provide arguments and evidence that highly
malarial areas are characterized by larger ethnic diversity which could be expected to affect civil
conflicts. To explicitly explore this channel we explicitly account for the number of ethnic groups in
the cells. This channel does not appear to the main, or the only, driver of the findings since controlling
for ethnic diversity reduced slightly the role of malaria stability (and the unreported effect of ethnic
diversity on conflicts is positive and significant). Another long term effect of malaria stability can be
related to population density, the incentives for urbanization and economic development in general.
Depetris-Chavin and Weil (2016) find no evidence of a significant link between malaria and pre-
colonial population density and proxies for development. Cervellati, Esposito and Sunde (2016)
suggest the existence of a link between malaria exposure and light density at nights. The main
patterns are nonetheless robust to the controlling for population density, night light intensity and
access to primary roads.
Alternative Measures of Long Term Exposure to Malaria: Malaria Endemicity in 1900.
To investigate the robustness of this finding, we replicate the estimation using as alternative measure
of malaria exposure a novel measure of malaria endemicity in the population around 1900. This
measure accounts for the prevalence of the pathogen in the respective populations during the early
stages of European colonization. Being informative about historical malaria exposure, this measure
also provides valuable information regarding potential endogeneity issues. The results are shown in
Table A3 in the Appendix. Also with this measure, the estimation results from the same empirical
specifications with respect to the other control variables deliver consistent evidence for a non-linear,
hump-shaped relationship between malaria exposure and conflict prevalence.29
Other factors of resistance to malaria infections: genetic immunities. Genetic immunities
also relate to the degree of malaria stability since they are the results of process of genetic selection
in the ancestral population in response to the exposure to selective pressure by malaria. The link
between malaria stability and (average) genetic immunities is illustrate in Figure A7 in the Appendix.
The relationship between predicted malaria stability and genetic immunities is increasing and con-
29The peak of the effect is obtained for an index level of 3.5 when considering an average linear coefficient of 0.245
and a quadratic coefficient of 0.035. Quantitatively, the effect of variation in malaria endemicity is even slightly larger
than one obtained with malaria stability, where the predicted conflict for cells at the peak is 43 percentage points
larger than for cells with no endemicity.
29

cave, and essentially flat for malaria stability above 15. The overall correlation between genetic
immunities is around 0.6 but it is essentially zero for high malaria stability since the population is
generally highly genetically immune in these endemic areas where the selective pressure of malaria
was highest.
In contrast to acquired immunities, innate immunities are not related to age and to the individual
exposure to the pathogen during the life of individuals and, therefore, do not induce the age peak
shift phenomenon. Nonetheless information on genetic resistance to malaria infections offers the
opportunity to explore the role of variation in human resistance to the disease. Genetic immunities,
per se, should have no effect o conflict in the absence of malaria. They should, however, attenuate
the (latent) incidence in the population in the face of increasing inoculation rates. To check this
possibility we explore the role of innate immunities alone and in interaction with malaria exposure.
The findings reported in Table A5 in the Appendix show that, once conditioning on malaria stability,
genetic immunities have no effect on conflict, but that the effect of increasing malaria stability, and
therefore the effect of increasing latent inoculation rates, is attenuated by higher genetic resistance
to the pathogen.
Alternative Conflict Measures. To investigate the robustness of the result with respect to the
measure of civil violence, we replicate the estimation using alternative measures of conflict at the
extensive and intensive margin. While the results so far have been based on the share of years with
any violent conflict in a given cell, an alternative measure is to count the number of conflicts in a cell.
Panel A of Table 3 presents the corresponding results for the log of the number of total conflicts (+1)
as dependent variable, using the same specifications of the estimation framework as in the previous
tables. The results confirm the concave shape of the association of malaria stability with conflicts.30
To ensure that the results are not driven by the data from a particular source (ACLED), Panel B
of Table 3 presents the corresponding estimates for the fraction of years with any conflict in a given
cell constructed from an alternative source, the UCDP GED data set, with similar results. Panel C
of Table 3 presents estimates for a measure that reflects the severity of civil violence at the intensive
margin, the log number of fatalities reported in the ACLED data, as dependent variable. Again,
30Quantitatively, the results are similar with the effect peaking at a somewhat lower level of malaria stability.
30
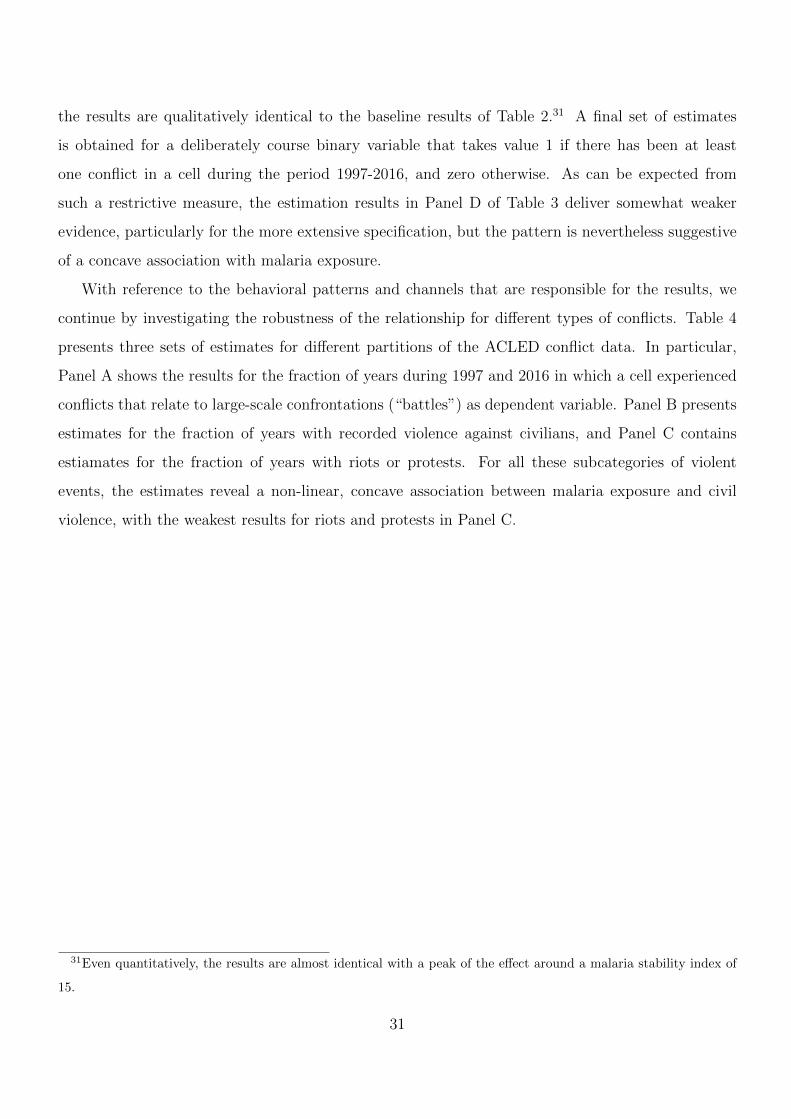
the results are qualitatively identical to the baseline results of Table 2.31 A final set of estimates
is obtained for a deliberately course binary variable that takes value 1 if there has been at least
one conflict in a cell during the period 1997-2016, and zero otherwise. As can be expected from
such a restrictive measure, the estimation results in Panel D of Table 3 deliver somewhat weaker
evidence, particularly for the more extensive specification, but the pattern is nevertheless suggestive
of a concave association with malaria exposure.
With reference to the behavioral patterns and channels that are responsible for the results, we
continue by investigating the robustness of the relationship for different types of conflicts. Table 4
presents three sets of estimates for different partitions of the ACLED conflict data. In particular,
Panel A shows the results for the fraction of years during 1997 and 2016 in which a cell experienced
conflicts that relate to large-scale confrontations (“battles”) as dependent variable. Panel B presents
estimates for the fraction of years with recorded violence against civilians, and Panel C contains
estiamates for the fraction of years with riots or protests. For all these subcategories of violent
events, the estimates reveal a non-linear, concave association between malaria exposure and civil
violence, with the weakest results for riots and protests in Panel C.
31Even quantitatively, the results are almost identical with a peak of the effect around a malaria stability index of
15.
31

Table 3: Malaria and Conflicts: Alternative Measures of Conflict Intensity
Panel A: Log Total Conflicts ACLED (1997-2016)(1) (2) (3) (4) (5) (6) (7)
Malaria Stability 0.122*** 0.125*** 0.123*** 0.101*** 0.089** 0.082** 0.093**(0.024) (0.032) (0.038) (0.036) (0.038) (0.037) (0.035)
(Malaria Stability)2 -0.005** -0.005*** -0.006*** -0.006*** -0.005*** -0.005*** -0.005***(0.002) (0.002) (0.001) (0.001) (0.002) (0.001) (0.002)
Adj. R-squared 0.159 0.398 0.590 0.617 0.626 0.645 0.676
Panel B: Fraction of Years with Conflict UCDP GED (1989-2015)(1) (2) (3) (4) (5) (6) (7)
Malaria Stability 0.011*** 0.011** 0.009** 0.007* 0.006 0.005 0.006(0.003) (0.004) (0.004) (0.004) (0.004) (0.004) (0.004)
(Malaria Stability)2 -0.000 -0.000 -0.001** -0.001*** -0.001*** -0.001** -0.001**(0.000) (0.000) (0.000) (0.000) (0.000) (0.000) (0.000)
Adj. R-squared 0.115 0.430 0.531 0.551 0.555 0.574 0.581
Panel C: Log Total Fatalities ACLED (1997-2016)(1) (2) (3) (4) (5) (6) (7)
Malaria Stability 0.177*** 0.175*** 0.205*** 0.181*** 0.162*** 0.155*** 0.165***(0.031) (0.043) (0.050) (0.049) (0.054) (0.053) (0.052)
(Malaria Stability)2 -0.006** -0.006*** -0.008*** -0.008*** -0.007*** -0.007*** -0.007***(0.003) (0.002) (0.001) (0.002) (0.002) (0.002) (0.002)
Adj. R-squared 0.217 0.509 0.624 0.637 0.649 0.663 0.676
Panel D: At least one Conflict ACLED (1997-2016)(1) (2) (3) (4) (5) (6) (7)
Malaria Stability 0.009*** 0.008** 0.007** 0.004 0.004 0.004 0.004(0.002) (0.003) (0.003) (0.003) (0.003) (0.003) (0.003)
(Malaria Stability)2 -0.000*** -0.000** -0.000** -0.000 -0.000 -0.000 -0.000(0.000) (0.000) (0.000) (0.000) (0.000) (0.000) (0.000)
Adj. R-squared 0.120 0.169 0.207 0.224 0.222 0.222 0.226
Observations (all panels) 442 442 442 442 442 442 442
Controls (all Panels):
Geography/Climate No No Yes Yes Yes Yes YesDistances No No Yes Yes Yes Yes YesResources No No No Yes Yes Yes Yes>1 Country No No No No Yes Yes Yes# Ethnic Groups No No No No Yes Yes YesPartitioned Cell No No No No Yes Yes YesPopulation dens. No No No No No Yes YesLights, Roads No No No No No No Yes
Country FE No Yes Yes Yes Yes Yes Yes
OLS estimates. The dependent variable is the fraction of years 1997-2016 with a conflict event in the cell(ACLED 7). See text for details. “Malaria Stability” is the index of malaria strength and stability by Kiszewskiet al. (2004). Each specification controls for the natural logarithm of the cell area. See the text and Tables 9,10 and 11 for a description of each variable and their sources. See Table A1 for descriptive statistics. The unitof observation is a 2.5 x 2.5 degree cell. Robust standard errors in parentheses clustered at the country level.***, **, * indicate significance at 1-, 5-, and 10-% level, respectively.
32

Table 4: Malaria and Conflicts: Alternative Types of Conflicts ACLED (1997-
2016)
Panel A: Fraction of Years with Battles (1997-2016)(1) (2) (3) (4) (5) (6) (7)
Malaria Stability 0.020*** 0.018*** 0.020*** 0.019*** 0.017*** 0.016** 0.017***(0.003) (0.006) (0.006) (0.006) (0.006) (0.006) (0.006)
(Malaria Stability)2 -0.001* -0.001** -0.001*** -0.001*** -0.001*** -0.001*** -0.001***(0.000) (0.000) (0.000) (0.000) (0.000) (0.000) (0.000)
Adj. R-squared 0.247 0.540 0.654 0.670 0.672 0.694 0.703
Panel B: Fraction of Years with Violence Against Civilians ACLED (1997-2016)(1) (2) (3) (4) (5) (6) (7)
Malaria Stability 0.022*** 0.017*** 0.014** 0.012** 0.010 0.009 0.010*(0.003) (0.005) (0.006) (0.005) (0.006) (0.006) (0.006)
(Malaria Stability)2 -0.001*** -0.001** -0.001*** -0.001*** -0.001** -0.001** -0.001**(0.000) (0.000) (0.000) (0.000) (0.000) (0.000) (0.000)
Adj. R-squared 0.209 0.455 0.612 0.642 0.650 0.678 0.697
Panel C: Fraction of Years with Riots/Protests (1997-2016) ACLED (1997-2016)(1) (2) (3) (4) (5) (6) (7)
Malaria Stability 0.022*** 0.010* 0.007 0.005 0.004 0.003 0.004(0.003) (0.005) (0.005) (0.005) (0.006) (0.006) (0.006)
(Malaria Stability)2 -0.001*** -0.000 -0.000** -0.000* -0.000* -0.000 -0.000(0.000) (0.000) (0.000) (0.000) (0.000) (0.000) (0.000)
Adj. R-squared 0.209 0.316 0.516 0.536 0.540 0.566 0.596
Observations (all panels) 442 442 442 442 442 442 442
Controls (all Panels):
Geography/Climate No No Yes Yes Yes Yes YesDistances No No Yes Yes Yes Yes YesResources No No No Yes Yes Yes Yes>1 Country No No No No Yes Yes Yes# Ethnic Groups No No No No Yes Yes YesPartitioned Cell No No No No Yes Yes YesPopulation dens. No No No No No Yes YesLights, Roads No No No No No No Yes
Country FE No Yes Yes Yes Yes Yes Yes
OLS estimates. The dependent variable is the fraction of years 1997-2016 with a conflict event in the cell(ACLED 7). See text for details. “Malaria Stability” is the index of malaria strength and stability by Kiszewskiet al. (2004). Each specification controls for the natural logarithm of the cell area. See the text and Tables 9,10 and 11 for a description of each variable and their sources. See Table A1 for descriptive statistics. The unitof observation is a 2.5 x 2.5 degree cell. Robust standard errors in parentheses clustered at the country level.***, **, * indicate significance at 1-, 5-, and 10-% level, respectively.
33

5.3 Exploring the Role of Anti-Malarial Policies
In a last step, we explore the role of anti-malarial policies. To this end, we use novel data on anti-
malarial policies in terms of the population coverage with insecticide-treated bed nets (ITNs), indoor
residual spraying (IRS), and artemisinin-based combination therapy (ACT). The empirical analysis
investigates the link between these policies and conflict prevalence, as well as their interaction with
the exposure to malaria. The results of this analysis are informative about the mechanism as well as
about the scope of policy, since one would expect antimalarial policies to moderate violence mainly
in areas with a high malaria risk for adults in light of the role of immunities documented before.
Given the intrinsic cross-sectional nature of the data a first concern is about the existence of
third factor that correlates with both conflict prevalence and policy coverage. Our interest is not
on the role of policies per se, but rather on the role of the interaction term between policies in high
risk areas. This effect can be estimated consistently even if a third factor correlates with the policy
variable, as long as the policy variable is jointly independent of the malaria exposure, see Nizalova
and Murtazashvili (2016).
A potentially more serious concern is the possibility that policy implementation is prevented, or
made difficult, by the occurrence of conflicts. As mentioned in Section 2 this concern is well funded in
the context of large scale civil wars and conflicts involving massive displacement of people and in the
presence of refugees camps, see in particular Montalvo and Reynal-Querol (2007) for cross-country
data on civil wars. No consistent patterns have been detected in terms of the effect of localized small
scale violence (see Messina et al., 2011 and Sedda et al. 2015).
An important dimension regarding the implementation of the anti-malarial policies is the require-
ment of decisions and actions at the country level. While the data on policy coverage are available at
the disaggregate (sub-national) level, the data reveal strong country-level patterns, which are visible
also in the spatial distribution of policy coverage depicted in Figure 4 reported in Section 4. These
country-level patterns likely reflect the decisions to implement these policies, as well as data patterns
related to coverage and documentation. The geographic coverage of the data, which originally stem
from health surveys and field studies, is related to country-level factors and smoothed by spatial
interpolation. Importantly, these patterns differ from those seen with genetic immunities, which do
not exhibit patterns related to country borders. Both features, the variation at country level and the
geographic clustering, imply that the policy data are characterized by higher spatial autocorrelation
34

and geographic clustering than the data on conflicts and on the covariates, which are available at high
levels of spatial disaggregation. This also poses a challenge for the use of policy data with excessively
small grid cells.32 Moreover, the local deployment of anti-malaria policies might be influenced by
localized civil conflicts.
In light of this, we first consider the coverage of anti-malarial policies at the country level. In
the context of an estimation framework that exploits cell-level data, this implies loosing information
about within-country variation in policy coverage. At the same time, using country level policy cov-
erage limits the potential of reverse causality running from the occurrence of localized violent events
to policy coverage in a given cell. In particular, the use of country-level variation in policy coverage
in interaction with local long-term malaria exposure (which is related to exogenous geographic and
bio-climatic conditions) provides an identification strategy that exploits exogenous variation at the
country level in interaction with local conditions. A similar logic has been used frequently in labor
economics applications, see, e.g., Blanchard and Katz (1992).33 Finally, as discussed in Section 4,
the coverage with anti-malaria policies was essentially zero by the year 2000, and most large scale
interventions were implemented around or after 2005. To investigate the role of policies for conflict
as well as the role of conflict for policy coverage, we use coverage data for the year 2005 and exploit
variation in conflicts pre and post 2005.
Preliminaries. We begin by exploring the role of localized conflicts before 2005 on the coverage
of anti-malaria policies. To this end, we regress the coverage of anti-malaria policies in 2005 on
prevalence during the period 1997-2005. The results, shown in Table 5, reveal no statistically signifi-
cant pattern linking conflict prevalence before policy implementation and policy coverage in 2005 in
any of the specifications. Conflicts explain virtually no variation in coverage of anti-malaria policies
at the country level.34 This finding provides a first suggestive indication about the validity of the
identification strategy as it reveals no systematic robust influence of local conflict activity before
2005 on country-level policy coverage in 2005.
32This was also an important reason for conducting the analysis using 2,5o as baseline.33A similar identification strategy was used by Manacorda and Tesei (2016) in their analysis of the effect of mobile
phone coverage on protests in Africa.34Similar patterns emerge for the effect of conflicts over the period 1997-2005 on policy coverage at the cell level as
reported in Table A6 in the Appendix.
35

Table 5: Violence before 2005 and Anti-Malaria Policies at Country Level in 2005
Dependent Variable Anti-Malaria Policies - Country Level in 2005
(1) (2) (3) (4) (5) (6) (7)
Conflicts (1998-2004) -0.147 -0.137 -0.311 -0.250 -0.254 -0.159 -0.140(0.298) (0.224) (0.257) (0.238) (0.248) (0.243) (0.241)
Sets of Covariates:
Geography/Climate No No Yes Yes Yes Yes YesDistances No No Yes Yes Yes Yes YesResources No No No Yes Yes Yes Yes>1 Country No No No No Yes Yes Yes# Ethnic Groups No No No No Yes Yes YesPartitioned Cell No No No No Yes Yes YesPopulation dens. No No No No No Yes YesLights, Roads No No No No No No Yes
Country FE No No No No No No No
Observations 383 383 383 383 383 383 383Adj. R-squared -0.001 0.268 0.296 0.339 0.336 0.349 0.354
OLS estimates. The dependent variable is the coverage with anti malaria policies at country level in 2005 interms of insecticide-treated bed nets (ITNs), indoor residual spraying (IRS), and artemisinin-based combinationtherapy (ACT) as of 2005 (Bhatt et al., 2015). Conflicts (1997-2005) measures the fraction of years 1997-2005with a conflict event in the cell (ACLED 1997-2016). Each specification controls for the natural logarithm ofthe cell area. See the text and Tables 9, 10 and 11 for a description of each variable and their sources. SeeTable A1 for descriptive statistics. The unit of observation is a 2.5 x 2.5 degree cell. Robust standard errors inparentheses clustered at the country level. ***, **, * indicate significance at 1-, 5-, and 10-% level, respectively.
High Malaria Risk Areas for Adults: Dichotomous Measurement. To move a step forward
in the investigation it is useful to provide a dichotomous coding of high malaria risk for adults. The
hump-shaped pattern of the association between malaria exposure and civil conflict can be interpreted
as being related to the high malaria risk areas for adults. In line In view of the epidemiological
literature discussed and the evidence presented in Section 3 the risk of serious symptoms or even
death for adults is low (or zero) in areas that are not compatible with transmission of the pathogen
and low stability areas due to the small inoculation rates and is also low in high stability areas where,
in spite of the high inoculation rates, immune adults are effectively protected from infection.
We construct a dichotomous measure of this high risk areas for adults by coding a binary variable
that takes value one only in the low to intermediate malaria stability areas. We code cells as high
risk for malaria infections of adults if the stability index takes positive but low values, and as low risk
for malaria infection either if malaria stability is zero or takes sufficiently high values. The question
is what is the natural threshold above which malaria stability is large. Following the epidemiological
36

evidence on the hump shape link between malaria stability and mortality we code high stability
areas for levels of malaria stability above 15. This is also compatible with the view that above this
level cells tend to display large historical endemicity (see Figure A3 in the Appendix) and that the
selective pressure from the pathogen in the past was large enough to induce the development of
intense genetic immunities (see Figure A7 in the Appendix).
Table 6 presents the estimation results for specifications with the same set of control variables as
before, but with a binary measure for malaria risk that has been constructed as described. The results
confirm that conflict prevalence is significantly higher in cells with high malaria risk as compared to
cells with a low malaria risk. The results in Panel B show, for an alternative coding of high malaria
risk areas in the intermediate range ∈ (5, 25], that the baseline coding provides a conservative measure
of high risk for adults.
The results document that the hump-shape effect of malaria stability on conflicts can be detected
also with a simple dichotomous measure. The binary measure is very rough but it has the advantage
of not relying on information on the intensive margin of malaria stability. Also it allows us to explore
the role of policies along the lines of a difference-in-difference design as discussed next.
The effect of anti-malarial policies in high and low areas for adults. As a first step in the
investigation of the potential joint effect of malaria risk and anti-malaria interventions on conflict we
explore the role of policy coverage in 2005 in subsequent conflicts.
Table 7 presents the results for regressions of the prevalence of cell-level civil conflict after 2005
on specifications with an interaction term between malaria risk, measured using the same binary
indicator variable as before, and the coverage of anti-malaria policies at the country level in 2005.
The estimates again show a positive effect of high malaria risk (in terms of a binary indicator) and
conflict, which is statistically significant in most specifications. Quantitatively, this effect is smaller
than in the baseline results of Panel A of Table 6. However, the coverage of anti-malaria policies at
the country level has a significantly negative influence on the effect of malaria risk on cell-level civil
conflict.35 In other words, a higher policy coverage tends to reduce conflict in cells with high risk
of epidemic malaria outbreaks among adults. This effect is sizable in comparison to the main effect.
Moreover, this specification explains a considerable part of the variation in conflicts at the cell level.36
35The main effect of anti-malaria policies at the country level is not identified in a specification with country fixed
effects.36Also notice that the placebo results for predicting policies in 2005 by violence before 2005 also holds when allowing
37

Table 6: Malaria and Conflicts: Binary Measures for High Malaria Risk
Dependent Variable Fraction of Years with Conflicts 1997-2016 - Cell Level
Panel A: Binary Measure with Malaria Stability ∈ (0, 15](1) (2) (3) (4) (5) (6) (7)
Malaria - High Risk DV ∈ (0, 15] 0.181** 0.200** 0.083* 0.090* 0.083* 0.068* 0.029(0.069) (0.075) (0.047) (0.047) (0.047) (0.039) (0.038)
Observations 442 442 442 442 442 442 442Adj. R-squared 0.082 0.405 0.618 0.622 0.629 0.645 0.668
Panel B: Binary Measure with Malaria Stability ∈ (5, 25](1) (2) (3) (4) (5) (6) (7)
Malaria - High Risk DV ∈ (5, 25] 0.221*** 0.152** 0.074* 0.080* 0.081* 0.078* 0.083**(0.053) (0.069) (0.037) (0.041) (0.044) (0.041) (0.036)
Observations 442 442 442 442 442 442 442Adj. R-squared 0.099 0.383 0.616 0.619 0.627 0.646 0.672
Controls (For all Panels):
Geography/Climate No No Yes Yes Yes Yes YesDistances No No Yes Yes Yes Yes YesResources No No No Yes Yes Yes Yes>1 Country No No No No Yes Yes Yes# Ethnic Groups No No No No Yes Yes YesPartitioned Cell No No No No Yes Yes YesPopulation dens. No No No No No Yes YesLights, Roads No No No No No No Yes
Country FE No Yes Yes Yes Yes Yes Yes
OLS estimates. The dependent variable is the fraction of years 1997-2016 with a conflict event in the cell(ACLED 7). See text for details. “Malaria Stability” is the index of malaria strength and stability by Kiszewskiet al. (2004). “Malaria - High Risk DV” is a binary variable that identifies cells with high risk of epidemicmalaria outbreaks among adults, reflected by levels of the index of malaria strength and stability by Kiszewskiet al. (2004) in the interval (0, 15] (Panel A) and (5, 20] (Panel B). Each specification controls for the naturallogarithm of the cell area. See the text and Tables 9, 10 and 11 for a description of each variable and theirsources. See Table A1 for descriptive statistics. The unit of observation is a 2.5 x 2.5 degree cell. Robuststandard errors in parentheses clustered at the country level. ***, **, * indicate significance at 1-, 5-, and 10-%level, respectively.
These findings complement the findings regarding immunity in light of the fact that immunity and
resistance are low in these high risk areas, making the populations particularly vulnerable to malaria
outbreaks in these regions. The results are robust when controlling for the prevalence of conflict in
the respective cell in the period before 2005.37
As a final step, we explore the potential of anti-malaria policies to reduce conflict in a simple
for a heterogeneous effect of conflicts in high and low stability areas by interacting the conflict incidence with the
respective binary indicator, see Table A7 in the Appendix, or when using a binary indicator for policies, see Table A8.37See Table A9 in the Appendix for details.
38

Table 7: Malaria, Policies (Country Level) and Violent Events
Dependent Variable Fraction of Years with Conflicts (2006-2016) - Cell Level
(1) (2) (3) (4) (5) (6) (7)
Malaria - High Risk DV ∈ (0, 15] 0.129* 0.127** 0.067** 0.044* 0.040 0.038 0.015(0.067) (0.058) (0.026) (0.026) (0.026) (0.026) (0.028)
Malaria - High Risk DV ∈ (0, 15] -0.052 -0.082*** -0.071*** -0.088*** -0.087*** -0.090*** -0.077***× Pol. Country 2005 (0.042) (0.024) (0.018) (0.015) (0.016) (0.017) (0.016)
Sets of Controls:
Geography/Climate No No Yes Yes Yes Yes YesDistances No No Yes Yes Yes Yes YesResources No No No Yes Yes Yes Yes>1 Country No No No No Yes Yes Yes# Ethnic Groups No No No No Yes Yes YesPartitioned Cell No No No No Yes Yes YesPopulation dens. No No No No No Yes YesLights, Roads No No No No No No Yes
Country FE Yes Yes Yes Yes Yes Yes Yes
Observations 383 383 383 383 383 383 383Adjusted R-squared 0.050 0.360 0.552 0.570 0.574 0.578 0.599
OLS estimates. The dependent variable is the fraction of years 2006-2016 with a conflict event in the cell(ACLED 7). See text for details. “Malaria - High Risk DV” is a dummy that identifies cells with low tointermediate levels of stability of malaria transmission given by levels of the index of malaria strength andstability by Kiszewski et al. (2004) in the interval (0, 15]. Anti malaria policies measures the average coveragein a country of main malaria control interventions in terms of insecticide-treated bed nets (ITNs), indoorresidual spraying (IRS), and artemisinin-based combination therapy (ACT) as of 2005 (Bhatt et al., 2015).Each specification controls for the natural logarithm of the cell area. See the text and Tables 9, 10 and 11 for adescription of each variable and their sources. See Table A1 for descriptive statistics. The unit of observation isa 2.5 x 2.5 degree cell. Robust standard errors in parentheses clustered at the country level. ***, **, * indicatesignificance at 1-, 5-, and 10-% level, respectively.
differences-in-differences framework. Identification in such a framework comes from the timing and
intensity of the policy treatment both of which may be potentially affected by conflicts. To limit
potential endogeneity problems with the actual timing of policies we restrict attention to a long
difference set up by looking at two sub-periods: before 2005 (where policy coverage was essentially
zero) and after 2005. To further limit problems of endogeneity and measurement at the intensive
margin, we create a time varying binary indicator variable that takes value one after 2005 only in the
areas in which policy coverage was sufficiently large (we take the sample average as the respective
threshold). The diff-in-diff is then implemented by comparing the differential effect in areas with
high malaria risk for adults (i.e., areas characterized by low to intermediate malaria stability) and
in areas with low malaria risk for adults (locations with zero or large malaria stability). Given the
39

epidemiological evidence we should expect no sizable effect of policies on health and mortality of
adults in low malaria risk cells (that is in cells with high and zero malaria transmission).
More specifically, we regress the fraction of years with conflicts (or alternatively, the number of
yearly conflict-related fatalities) on the cell level for the period before and after 2005, on a binary
measure of policy coverage, an indicator for the period after 2005 (the “treatment” period), and an
interaction with the (time-invariant) binary indicator characterizing cells with high malaria risk for
adults. Since the coverage of anti-malaria policies is essentially zero before 2005, this specification
corresponds to estimating the differential effect of the implementation of anti-malaria policies with
high coverage in cells with high and low malaria stability.
The results are shown in Table 8 and reveal that conflict prevalence increased in the second
sample period, but not differentially by malaria exposure. While policy coverage appears to have no
consistent relation with conflict prevalence in cells with low malaria risk, civil conflict prevalence is
significantly reduced by anti-malaria policies in cells with high malaria risk.
The findings are suggestive of the role of policy implementation in reducing violent conflicts, but
only in areas with high risk (low resistance) for adults and not in areas with low risk (high resistance).
6 Concluding Remarks
This paper has explored the existence of a link between the long-term exposure to malaria and the
occurrence of civil conflicts in Africa. The empirical analysis exploits disaggregate data at the level
of 2.5 degree grid cells for the whole of Africa.
The empirical strategy built on insights from the epidemiology of malaria, which have document
changing patterns in the age composition and mortality of malaria infections for different levels of
inoculation rates. Adult mortality from malaria peaks in areas with low to intermediate levels of
malaria stability where the risk of being bitten by infected mosquitos is non-negligible but where
the adult population is not resistant or immune. The results document a hump-shaped relationship
between the intensity of malaria transmission and civil violence. This finding consistently emerges
for alternative measures of long term malaria exposure and using various estimation strategies in-
cluding both parametric and non parametric regressions. The hump-shaped relation is found for
different measures of civil violence, including the likelihood of violence and on its intensity (includ-
ing fatalities). The effect is sizable for violent confrontations between armed groups and violence
40
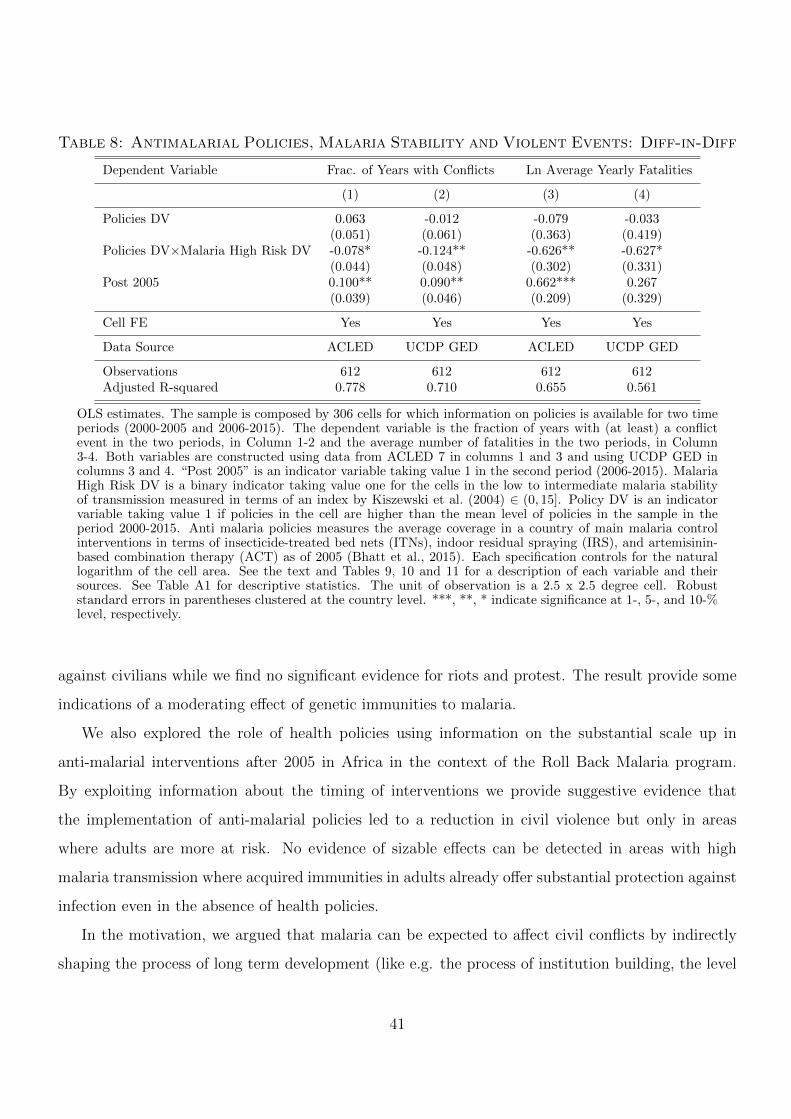
Table 8: Antimalarial Policies, Malaria Stability and Violent Events: Diff-in-Diff
Dependent Variable Frac. of Years with Conflicts Ln Average Yearly Fatalities
(1) (2) (3) (4)
Policies DV 0.063 -0.012 -0.079 -0.033(0.051) (0.061) (0.363) (0.419)
Policies DV×Malaria High Risk DV -0.078* -0.124** -0.626** -0.627*(0.044) (0.048) (0.302) (0.331)
Post 2005 0.100** 0.090** 0.662*** 0.267(0.039) (0.046) (0.209) (0.329)
Cell FE Yes Yes Yes Yes
Data Source ACLED UCDP GED ACLED UCDP GED
Observations 612 612 612 612Adjusted R-squared 0.778 0.710 0.655 0.561
OLS estimates. The sample is composed by 306 cells for which information on policies is available for two timeperiods (2000-2005 and 2006-2015). The dependent variable is the fraction of years with (at least) a conflictevent in the two periods, in Column 1-2 and the average number of fatalities in the two periods, in Column3-4. Both variables are constructed using data from ACLED 7 in columns 1 and 3 and using UCDP GED incolumns 3 and 4. “Post 2005” is an indicator variable taking value 1 in the second period (2006-2015). MalariaHigh Risk DV is a binary indicator taking value one for the cells in the low to intermediate malaria stabilityof transmission measured in terms of an index by Kiszewski et al. (2004) ∈ (0, 15]. Policy DV is an indicatorvariable taking value 1 if policies in the cell are higher than the mean level of policies in the sample in theperiod 2000-2015. Anti malaria policies measures the average coverage in a country of main malaria controlinterventions in terms of insecticide-treated bed nets (ITNs), indoor residual spraying (IRS), and artemisinin-based combination therapy (ACT) as of 2005 (Bhatt et al., 2015). Each specification controls for the naturallogarithm of the cell area. See the text and Tables 9, 10 and 11 for a description of each variable and theirsources. See Table A1 for descriptive statistics. The unit of observation is a 2.5 x 2.5 degree cell. Robuststandard errors in parentheses clustered at the country level. ***, **, * indicate significance at 1-, 5-, and 10-%level, respectively.
against civilians while we find no significant evidence for riots and protest. The result provide some
indications of a moderating effect of genetic immunities to malaria.
We also explored the role of health policies using information on the substantial scale up in
anti-malarial interventions after 2005 in Africa in the context of the Roll Back Malaria program.
By exploiting information about the timing of interventions we provide suggestive evidence that
the implementation of anti-malarial policies led to a reduction in civil violence but only in areas
where adults are more at risk. No evidence of sizable effects can be detected in areas with high
malaria transmission where acquired immunities in adults already offer substantial protection against
infection even in the absence of health policies.
In the motivation, we argued that malaria can be expected to affect civil conflicts by indirectly
shaping the process of long term development (like e.g. the process of institution building, the level
41

of urbanization and the interaction between different ethic groups) and directly, by affecting adults
morbidity and mortality. The results are compatible with the possibility that the long term effect of
malaria works through a direct, rather than an indirect, channel and is linked to the actual incidence
of the disease in the adult population. Lack of data prevents to take this as a final conclusion,
however. The findings do suggest, however, that the effect are likely heterogenous and concentrated
in areas where adults, rather than children, are mostly at risk of malaria infections.
The results regarding the link between the long-run exposure to malaria and civil conflict comple-
ment recent findings on short-run variation in malaria exposure at the local level, and on the role of
exposure to vector-borne diseases across countries. While this recent stream of literature has mostly
concentrated on the role of vector-transmitted diseases there is no a priori reasons to think that
exposure to pathogen matters only for this class of diseases. For instance, the recent reports about
violence in the context of the 2014 Ebola epidemic suggest that epidemic pathogens transmitted
directly from human to human may also affect violence and conflicts. It remains largely open to
what extent the dynamics and mechanisms are similar in these contexts.
Finally, the empirical results are suggestive of a potentially important effects of anti-malarial
policies above and beyond health conditions. Moreover, the results also suggest a potential role for
policy beyond treatment and prevention. Even though in the case of malaria, no effective vaccine is
available, the evidence is compatible with the view that vaccines might provide another instrument to
reduce health-related conflict. However, the results do not allow to perform a meaningful cost-benefit
analysis for policy. Definitely more work is needed to uncover the links between disease exposure
and civil violence.
42

References
Acemoglu, D., and S. Johnson (2007): “Disease and Development: The Effect of Life Expectancyon Economic Growth,” Journal of Political Economy, 115(6), 925–985.
Acemoglu, D., S. Johnson, and J. A. Robinson (2001): “The Colonial Origins of ComparativeDevelopment: An Empirical Investigation,” American Economic Review, 91(5), 1369–1401.
Alsan, M. (2015): “The Effect of the TseTse Fly on African Development,” American EconomicReview, 105(1), 382–410.
Arbatli, C. E., Q. Ashraf, and O. Galor (2013): “The Nature of Civil Conflict,” BrownUniversity Economics Working Paper, 2013-15.
(2015): “The Nature of Conflict,” Williams College Department of Economics WorkingPaper, 2015-08.
Bayoh, M., and S. Lindsay (2003): “Effect of temperature on the development of the aquaticstages of Anopheles gambiae sensu stricto (Diptera: Culicidae),” Bulletin of Entomological Re-search, 93(5), 375–381.
Becker, G. S., and C. B. Mulligan (1997): “The Endogenous Determination of Time Prefer-ence,” Quarterly Journal of Economics, 112(3), 729–758.
Berman, N., and M. Couttenier (2015): “External Shocks, Internal Shots: The Geography ofCivil Conflicts,” Review of Economics and Statistics, 97(4), 758–776.
Berman, N., M. Couttenier, D. Rohner, and M. Thoenig (2015): “This mine is mine! Howminerals fuel conflicts in Africa,” mimeo, University of Lausanne.
Besley, T., and M. Reynal-Querol (2014): “The Legacy of Historical Conflict: Evidence fromAfrica,” American Political Science Review, 108(2), 319–336.
Bhatt, S., S. Weiss, E. Cameron, D. Bisanzio, B. Mappin, U. Dalrymple, K. E. Battle,C. L. Moyes, A. Henry, P. A. Eckhoff, E. A. Wenger, O. Briet, M. A. Penny, T. A.Smith, A. Bennett, J. Yukich, T. P. Eisele, J. T. Griffin, C. A. Fergus, M. Lynch,F. Lindgren, J. M. Cohen, C. L. J. Murray, D. L. Smith, S. I. Hay, R. E. Cibulskis,and P. W. Gething (2015): “The effect of malaria control on Plasmodium falciparum in Africabetween 2000 and 2015,” Nature, 526, 207–211.
Blanchard, O. J., and L. Katz (1992): “Regional Evolutions,” Brookings Papers on EconomicActivity, 1992(1), 1–75.
Blattman, C., and E. Miguel (2010): “Civil War,” Journal of Economic Literature, 48(1), 3–57.
Briant, A., P.-P. Combes, and M. Lafourcade (2010): “Dots to boxes: Do the size and shapeof spatial units jeopardize economic geography estimations?,” Journal of Urban Economics, 67(3),287–302.
Buggle, J. (2017): “Growing Collectivism: Irrigation, Group Conformity and Long-Run Techno-logical Divergence,” .
43

Buggle, J., and R. Durante (2017): “Climate risk, cooperation, and the co-evolution of cultureand institutions,” .
Cervellati, M., G. Chiovelli, and E. Esposito (2016): “Bite and Divide: Ancestral Exposureto Malaria and the Emergence and Persistence of Ethnic Diversity in Africa,” mimeo, Universityof Bologna.
Cervellati, M., E. Esposito, and U. Sunde (2017): “Long-Term Exposure to Malaria andDevelopment: Disaggregate Evidence for Contemporaneous Africa,” Journal of Demographic Eco-nomics, 83(1), 129–148.
Cervellati, M., E. Esposito, U. Sunde, and S. Valmori (2016): “Malaria Risk and CivilViolence,” CEPR Discussion Paper, 11496.
Cervellati, M., and U. Sunde (2011): “Life Expectancy and Economic Growth: The Role ofthe Demographic Transition,” Journal of Economic Growth, 16, 99–133.
(2015): “The Economic and Demographic Transition, Mortality, and Comparative Devel-opment,” American Economic Journal: Macroeconomics, 7(3), 189–225.
Cervellati, M., U. Sunde, and S. Valmori (2016): “Pathogens, Weather Shocks and CivilConflicts,” Economic Journal, forthcoming.
Christiansen-Jucht, C., P. E. Parham, A. Saddler, J. C. Koella, and M.-G. Basanez(2014): “Temperature during larval development and adult maintenance influences the survival ofAnopheles gambiae,” Parasites & Vectors, 7(489).
Ciccone, A. (2011): “Economic Shocks and Civil Conflict: A Comment,” American EconomicJournal: Applied Economics, 3(4), 215–227.
Collier, P., and A. Hoeffler (2004): “Greed and Grievance in Civil War,” Oxford EconomicPapers, 56(4), 563–595.
Collier, P., A. Hoeffler, and D. Rohner (2009): “Beyond Greed and Grievance: Feasibilityand Civil War,” Oxford Economic Papers, 61(1), 1–27.
Collier, P., and D. Rohner (2008): “Democracy, Development, and Conflict,” Journal of theEuropean Economic Association, 6(2), 531–540.
Couttenier, M., and R. Soubeyran (2014): “Drought and Civil War in Sub-Saharan Africa,”Economic Journal, 124(575), 201–240.
(2015): “A Survey of the Causes of Civil Conflicts: Natural Factors and Economic Condi-tions,” Revue Economie Politique, forthcoming.
Dal Bo, P., and G. R. Frechette (2017): “On the Determinants of Cooperation in InfinitelyRepeated Games: A Survey,” Journal of Economic Literature, forthcoming.
Depetris-Chauvin, E., and D. Weil (2017): “Malaria and Early African Development: Evidencefrom the Sickle Cell Trait,” Economic Journal, forthcoming.
44

Doolan, D. L., C. Dobano, and J. K. Baird (2009): “Acquired Immunity to Malaria,” ClinicalMicrobiology Reviews, 22(1), 13–26.
Doss, C., J. McPeak, and C. B. Barrett (2008): “Interpersonal, Intertemporal and SpatialVariation in Risk Perceptions: Evidence from East Africa,” World Development, 36(8), 1453–1468.
Esposito, E. (2015): “Side Effects of Immunities: American Slavery in the US South,” Universityof Bologna, mimeo.
Esteban, J. M., L. Mayoral, and D. Ray (2012): “Ethnicity and Conflict: An EmpiricalInvestigation,” American Economic Review, 102, 1310–1342.
Falk, A., A. Becker, T. Dohmen, B. Enke, D. Huffman, and U. Sunde (2017): “GlobalEvidence on Economic Preferences,” University of Bonn, mimeo.
Fearon, J. D., and D. D. Laitin (2003): “Ethnicity, Insurgency, and Civil War,” AmericanPolitical Science Review, 97(1), 75–90.
Gallup, J. L., and J. D. Sachs (2001): “The Economic Burden of Malaria,” American Journalof Tropical Medicine and Hygiene, 64(1), 85–96.
Gallup, J. L., J. D. Sachs, and A. D. Mellinger (1999): “Geography and Economic Devel-opment,” International Regional Science Review, 22(2), 179–232.
Galor, O., and O. Ozak (2016): “The Agricultural Origins of Time Preference,” AmericanEconomic Review, 106(10), 3064–3103.
Galor, O., O. Ozak, and A. Sarid (2016): “Geographical origins and economic consequencesof language structures,” .
Gayer, M., D. Legros, P. Formenty, , and M. A. Connolly (2007): “Conflict and EmergingInfectious Diseases,” Emerging Infectious Diseases, 13(11), 1625–1631.
Gilmore, E., N. P. Gleditsch, P. Lujala, and J. K. Rod (2005): “Conflict diamonds: a newdataset,” Conflict Management and Peace Science, 22(3), 252–272.
Griffin, J. T., N. M. Ferguson, and A. C. Ghani (2013): “Estimates of the changing age-burden of Plasmodium falciparum malaria disease in sub-Saharan Africa,” Nature Communica-tions, 5(3136), 1–10.
Grossman, H. I. (2001): “The Creation of Effective Property Rights,” American Economic Review,91(2), 347–352.
Harari, M., and E. La Ferrara (2016): “Conflict, Climate, and Cells: A Disaggregated Anal-ysis,” Bocconi University, mimeo.
Hay, S., C. Guerra, A. Tatem, A. Noor, and R. Snow (2004): “The global distribution andpopulation at risk of malaria: past, present and future,” Lancet Infectious Diseases, 4(6), 327–336.
Hay, S. I., D. J. Rogers, G. D. Shanks, M. F. Myers, and R. W. Snow (2001): “Malariaearly warning in Kenya,” Trend Parasitol., 17(2), 95–99.
45

Hay, S. I., D. L. Smith, and R. W. Snow (2008): “Measuring malaria endemicity from intenseto interrupted transmission,” Lancet Infect Diseases, 8(6), 369–378.
Hirshleifer, J. (1995): “Anarchy and Its Breakdowm,” Journal of Political Economy, 103(1),26–52.
Howes, R. E., M. Dewi, F. B. Piel, W. M. Monteiro, K. E. Battle, J. P. Messina,A. Sakuntabhai, A. W. Satyagraha, T. N. Williams, J. K. Baird, and S. I. Hay(2013): “Spatial distribution of G6PD deficiency variants across malaria-endemic regions,” MalariaJournal, 12(418), 1–15.
Howes, R. E., A. P. Patil, F. B. Piel, O. A. Nyangiri, C. W. Kabaria, P. W. Gething,P. A. Zimmerman, C. Barnadas, C. M. Beall, A. Gebremedhin, D. Mnard, T. N.Williams, and a. S. I. H. David J. Weatherall (20111): “The global distribution of theDuffy blood group,” Nature Communications, 2(266).
Kiszewski, A., A. Mellinger, A. Spielman, P. Malaney, S. E. Sachs, and J. Sachs(2004): “A global index representing the stability of malaria transmission,” American Journal ofTropical Medicine and Hygiene, 70(5), 486–498.
Kolaczinski, J. (2005): “Roll Back Malaria in the aftermath of complex emergencies: the exampleof Afghanistan,” Tropical Medicine and International Health, 10(9), 888–893.
Lammers, J., and S. van Wijnbergen (2008): “HIV/AIDS, Risk Aversion and IntertemporalChoice,” Tinbergen Institute Discussion Paper, 2007-098/1.
Langhorne, J., F. M. Ndungu, A.-M. Sponaas, and K. Marsh (2008): “Immunity to Malaria:More Questions than Answers,” Nature Immunology, 8.
Lorentzen, P., J. McMillan, and R. Wacziarg (2008): “Death and Development,” Journalof Economic Growth, 13(2), 81–124.
Lujala, P., J. K. Rod, and N. Thieme (2007): “Fighting Over Oil: Introducing a New Dataset,”Conflict Management and Peace Science, 24(3), 239–256.
Lyons, C. L., M. Coetzee, and S. L. Chown (2013): “Stable and fluctuating temperatureeffects on the development rate and survival of two malaria vectors, Anopheles arabiensis andAnopheles funestus,” Parasites & Vectors, 6(104).
Lysenko, A.J., S. I. (1968): “Geography of malaria. Amedico-geographic profile of an ancientdisease,” Medicinskaja Geografija, p. 25146.
MacDonald, G. (1956): “Epidemiological basis of malaria control,” Bullettin of the World HealthOrganization, 15, 613–626.
(1957): The Epidemiology and Control of Malaria. Oxford University Press, Oxford.
Manacorda, M., and A. Tesei (2016): “Liberation Technology: Mobile Phones and PoliticalMobilization in Africa,” CEP Discussion Paper, 1419.
46

McPeak, J., P. D. Little, and C. Doss (2012): Risk and Social Change in an African RuralEconomy: Lifelihood in Pastoralist Communities. Routledge Press, London and New York.
Messina, J. P., S. M. Taylor, S. R. Meshnick, A. M. Linke, A. K. Tshefu, B. Atua,K. Mwandagalirwa, and M. Emch (2011): “Population, behavioural and environmentaldrivers of malaria prevalence in the Democratic Republic of Congo,” Malaria Journal, 10(161),1–11.
Michalopoulos, S., and E. Papaioannou (2016): “The Long-Run Effects of the Scramble forAfrica,” American Economic Review, 106(7), 1802–1848.
Miguel, E., S. Satyanath, and E. Sergenti (2004): “Economic Shocks and Civil Conflict: AnInstrumental Variables Approach,” Journal of Political Economy, 112(4), 725–753.
Montalvo, J. G., and M. Reynal-Querol (2005): “Ethnic Polarization, Potential Conflict,and Civil Wars,” American Economic Review, 95(3), 796–816.
(2007): “Fighting Against Malaria: Prevent Wars While Waiting for the Miraculous Vac-cines,” Review of Economics and Statistics, 89(1), 165–177.
Murray, C. J. L., L. C. Rosenfeld, S. S. Lim, K. G. Andrews, K. J. Foreman, D. Har-ing, N. Fullman, M. Naghavi, R. Lozano, and A. D. Lopez (2012): “Global malariamortality between 1980 and 2010: a systematic analysis,” Lancet, 379, 413–431.
New, M., D. Lister, M. Hulme, and I. Makin (2002): “A high-resolution data set of surfaceclimate over global land areas,” Climate Research, 21(1), 1–25.
Nizalova, O. Y., and I. Murtazashvili (2016): “Exogenous Treatment and Endogenous Factors:Vanishing of Omitted Variable Bias on the Interaction Term,” Journal of Econometric Methods,5(1), 71–77.
Piel, F., A. Patil, R. Howes, O. Nyangiri, P. Gething, M. Dewi, W. Temper-ley, T. Williams, D. Weatherall, and S. Hay (2013): “Global epidemiology of sicklehaemoglobin in newborns: a contemporary geostatistical model-based map and population esti-mates,” Lancet, 381(9861), 142–151.
Ramankutty, N., J. A. Foley, J. Norman, and K. McSweeney (2002): “The global dis-tribution of cultivable lands: current patterns and sensitivity to possible climate change,” GlobalEcology and Biogeography, 11(5), 377–392.
Riley, Shawn J., S. D. D., and R. Elliot (1999): “A terrain ruggedness index that quantifiestopographic heterogeneity,” Intermountain Journal of Sciences, 5(1).
Sachs, J. D. (2003): “Institutions Don’t Rule: Direct Effects of Geography on Per Capita Income,”NBER Working Paper, 9490.
Sedda, L., Q. Qi, and A. J. Tatem (2015): “A geostatistical analysis of the association be-tween armed conflicts and Plasmodium falciparum malaria in Africa, 1997-2010,” Malaria Journal,14(500), 1–11.
47

Skaperdas, S. (1992): “Cooperation, Conflict, and Power in the Absence of Property Rights,”American Economic Review, 82(3), 720–739.
Webb, J. L. A. J. (2009): Humanitys burden: a global history of malaria, vol. 69. CambridgeUniversity Press.
Weil, D. (2010): “Endemic Diseases and African Economic Growth: Challenges and Policy Re-sponses,” Journal of African Economies, 19(3), 81–109.
(2011): “Malaria and Early Economic Development in Africa,” mimeo.
(2014): “The Impact of Malaria on African Development over the Longue Duree,” in Africa’sDevelopment in Historical Perspective. Cambridge University Press, Cambridge.
Whitfield, J. (2002): “A round up of the history and biology of the malaria parasite,” Nature.
48

Table 9: Data Sources and Description of Main Variables
Variable Description and Data Sources
Measures of Violence: ACLED. Baseline measure is the fraction of years with at leastone conflict event in the cell over the period 1998-2015. Alternative measures for conflictsover the same time span are: a dummy taking value one if there is at least one conflict inthe cell in the period, the total number of conflicts and the (log) number of fatalities. Interms of conflict types we code the fractions of years with battles, with violence againstcivilians and riots or protests. Source: ACLED Version 7 (1997-2016), ACLED - ArmedConflict Location and Event Data Project.
Measures of Violence: UCDP. The baseline measure is the fraction of years with at leastone conflict event in the cell over the period 1998-2015. As robustness we also codethe total number of events. Source: UCDP Georeferenced Event Dataset (GED) Globalversion 17.1 (2016).
Malaria Stability. Index measuring the predicted force and stability of malaria transmis-sion based on biological characteristics of diverse vector mosquitoes and their interactionwith local climate. Data source: Kiszewski, Mellinger, Spielman, Malaney, Sachs, andSachs (2004).
Historical Malaria Endemicity. Prevalence of malaria in the population in 1900. Lysenkoand Semashko (1968) and digitalized by Hay (2004).
Genetic Immunities. Average predicted frequency of genetic immunities to malaria interms of sickle haemoglobin alleles, G6PD deficiency and Duffy blood group in the generalpopulation. Source: Piel et al. (2013) and Howes et al. (2011, 2013).
Anti-Malaria Policies. Anti-Malaria Policies (av. coverage) is the average coverage in thecell in the year for three major anti-malaria policies: Insecticide treated bednet cover-age (ITN), Indoor residual spraying coverage (IRS) and Artemisinin-based combinationtherapy coverage (ACT). Anti-Malaria Policies (max coverage) is the cell year averagecoverage of the policy with the higher coverage. Source: Bhatt et al. (2015), retrievedfrom http://www.map.ox.ac.uk/.
49
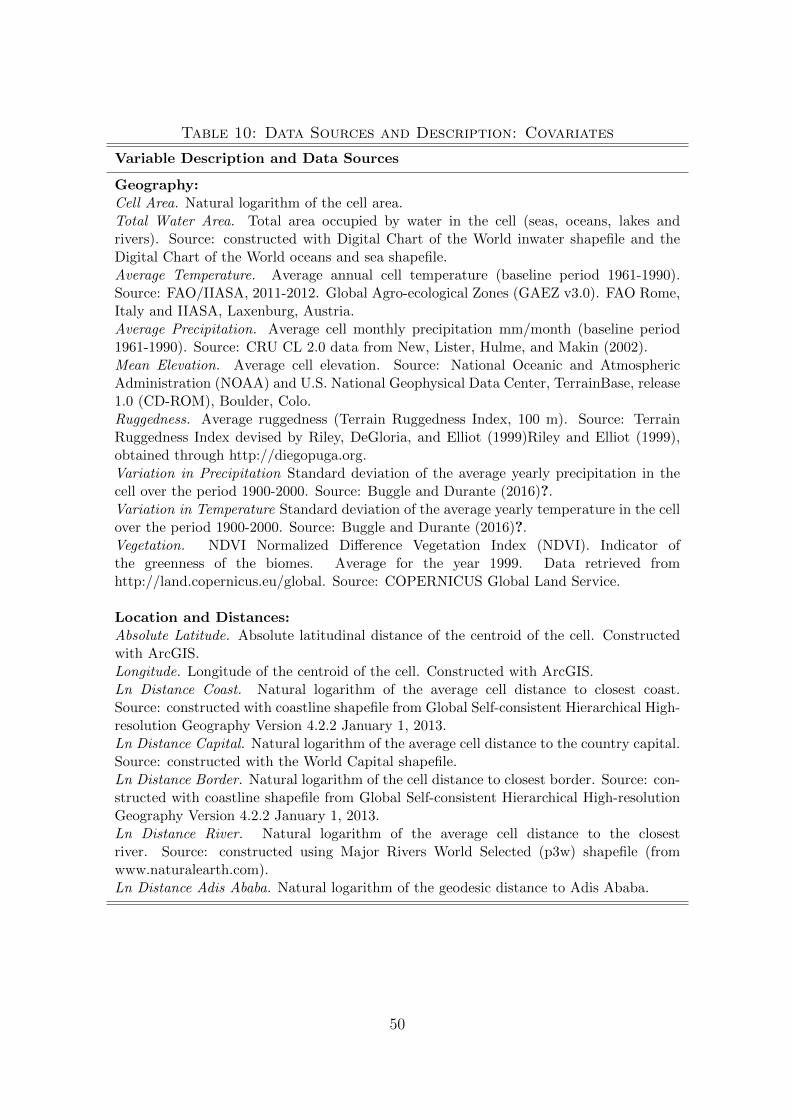
Table 10: Data Sources and Description: Covariates
Variable Description and Data Sources
Geography:Cell Area. Natural logarithm of the cell area.Total Water Area. Total area occupied by water in the cell (seas, oceans, lakes andrivers). Source: constructed with Digital Chart of the World inwater shapefile and theDigital Chart of the World oceans and sea shapefile.Average Temperature. Average annual cell temperature (baseline period 1961-1990).Source: FAO/IIASA, 2011-2012. Global Agro-ecological Zones (GAEZ v3.0). FAO Rome,Italy and IIASA, Laxenburg, Austria.Average Precipitation. Average cell monthly precipitation mm/month (baseline period1961-1990). Source: CRU CL 2.0 data from New, Lister, Hulme, and Makin (2002).Mean Elevation. Average cell elevation. Source: National Oceanic and AtmosphericAdministration (NOAA) and U.S. National Geophysical Data Center, TerrainBase, release1.0 (CD-ROM), Boulder, Colo.Ruggedness. Average ruggedness (Terrain Ruggedness Index, 100 m). Source: TerrainRuggedness Index devised by Riley, DeGloria, and Elliot (1999)Riley and Elliot (1999),obtained through http://diegopuga.org.Variation in Precipitation Standard deviation of the average yearly precipitation in thecell over the period 1900-2000. Source: Buggle and Durante (2016)?.Variation in Temperature Standard deviation of the average yearly temperature in the cellover the period 1900-2000. Source: Buggle and Durante (2016)?.Vegetation. NDVI Normalized Difference Vegetation Index (NDVI). Indicator ofthe greenness of the biomes. Average for the year 1999. Data retrieved fromhttp://land.copernicus.eu/global. Source: COPERNICUS Global Land Service.
Location and Distances:Absolute Latitude. Absolute latitudinal distance of the centroid of the cell. Constructedwith ArcGIS.Longitude. Longitude of the centroid of the cell. Constructed with ArcGIS.Ln Distance Coast. Natural logarithm of the average cell distance to closest coast.Source: constructed with coastline shapefile from Global Self-consistent Hierarchical High-resolution Geography Version 4.2.2 January 1, 2013.Ln Distance Capital. Natural logarithm of the average cell distance to the country capital.Source: constructed with the World Capital shapefile.Ln Distance Border. Natural logarithm of the cell distance to closest border. Source: con-structed with coastline shapefile from Global Self-consistent Hierarchical High-resolutionGeography Version 4.2.2 January 1, 2013.Ln Distance River. Natural logarithm of the average cell distance to the closestriver. Source: constructed using Major Rivers World Selected (p3w) shapefile (fromwww.naturalearth.com).Ln Distance Adis Ababa. Natural logarithm of the geodesic distance to Adis Ababa.
50

Table 11: Data Sources and Description: Covariates (Ctd.)
Variable Description and Data Sources
Natural Resources:Land Suitability. Average land suitability in the cell. Source: Ramankutty (2002) .Caloric Suitability Index Potential agricultural output (measured in calories) post-1500.Source: Galor and Ozak, (2016).Diamond Mines. Indicator variable taking value 1 if at least one petrol field is located inthe cell, 0 otherwise. Source: Gilmore et al. (2005)Petrol Fields. Indicator variable taking value 1 if at least a diamond mine is located inthe cell, 0 otherwise. Source: Lujala et al. (2007).Mines Indicator variable taking value 1 if at least a mineral facilities or mineral deposit islocated in the cell, 0 otherwise. Source: U.S. Geological Survey, U.S. Department of theInterior.
Shared Cells, Population and Economic Activities:>1 Country. Indicator variable taking value one if the cell is split across two countries, 0otherwise. Source: Constructed with ArcGIS.# Ethnic Groups. Number of ethnic groups in the cell. Geo-referencing of ethnic groupsdataset (GREG). Source: https://icr.ethz.ch/data/greg/Partitioned Cell. Indicator variable taking value one if the cell there is an ethnic groupthat have been partitioned by a country border, 0 otherwise. Source: Constructed withArcGIS.Ethnic groups. A dummy indicating if more than one ethnic group is observed in acell (constructed with a ArcGIS). Source: “Geo-referencing of ethnic groups” (GREG)database.Population. Average population in the cell in year 1995. Source: Center for InternationalEarth Science Information Network - CIESIN - Columbia University, United Nations Foodand Agriculture Programme - FAO, and Centro Internacional de Agricultura Tropical -CIAT. 2005. Gridded Population of the World, Version 4 (GPWv3): Population CountGrid. Palisades, NY: NASA Socioeconomic Data and Applications Center (SEDAC).http://sedac.ciesin.columbia.edu/data/set/gpw-v3-population-count.Night Lights. Average night light intensity in the cell. Source: constructed with data fromNOOA National Geophysical Data Centre for the year 2000.Primary Roads. Indicator variable taking value one if the cell is crossed by at least oneprimary road. Source: World Roads Shapefile, Esri.
51

Appendix: Additional Figures
Figure A1: Exposure to Malaria and Long-Term Orientation0
2040
6080
100
Long
-Ter
m O
rient
atio
n (W
VS
)
0 10 20 30Malaria Stability
(a) World
010
2030
40Lo
ng-T
erm
Orie
ntat
ion
(WV
S)
0 10 20 30Malaria Stability
(b) Africa
Note: Scatter plot, quadratic fit and kernel-weighted local polynomial regression results. Sources: World ValuesSurvey (taken from Galor and Ozak, 2016) and Kiszewski et al. (2004). See Section 4 for details.
Figure A2: Severity of Malaria Infections by Age
Mechanisms of immunityImmune attack could theoretically be directed at any point in the life cycle from the time of entry of the sporozoite (Fig. 1a). However, longi-tudinal studies in exposed populations suggest that immune responses to the pre-erythrocytic stages probably have limited involvement8. Certainly when the liver stage is bypassed by direct injection of blood-stage parasites, immune adults are still able to limit parasite popula-tion expansion and avoid symptoms9. This is in contrast to deliberate immunization with either whole irradiated sporozoites10 or vaccines based on pre-erythrocytic antigens, which can induce considerable immunity and indeed form the basis of the most advanced malaria vaccine available at present11. The mechanism by which these vac-cines may act is indicated by studies in mice in which elimination of pre-erythrocytic parasites requires mainly CD8+ effector cells produc-ing interferon-γ (IFN-γ) that kill parasites in infected hepatocytes12. Antibodies to the sporozoites are thought to have a lesser function.
For erythrocytic stages, potential targets for an immune response are free merozoites or intraerythrocytic parasites. Given that HLA class I or II molecules are absent from the surface of the parasite or the infected red blood cell (RBC), it is usually assumed that humoral responses are
key in blood-stage immunity. In mouse models, B cells and antibodies are important in eliminating parasites13, with some contribution from ‘parasiticidal’ mediators released from macrophages or similar cells of the innate system and probably activated by T cells14. Most infor-mation on the function of human immune responses to blood-stage parasites has been provided by longitudinal studies in endemic popula-tions, supported by classical passive-transfer experiments15,16.
The mechanisms by which antibody is effective include blockade of the invasion of RBCs by merozoites17, antibody-dependent cellular killing mediated by cytophilic antibodies18 and binding of antibody to parasite-induced molecules on the RBC surface, leading to greater clearance of infected RBCs19. However, the relative importance of each of these mechanisms is still a matter of debate. Some human studies point to an important function for antibody-dependent cellular kill-ing20, and work with mice expressing a human Fcγ receptor (FcγR) supports this view21. However, the few studies of mouse models lacking FcγR or complement suggest that parasite can be eliminated with-out opsonization22,23. Perhaps the ‘take-home’ message is that there is no single measure of a protective antibody response for a complex pathogen.
726 volume 9 number 7 july 2008 nature immunology
Human malariaP. falciparumP. vivaxP. ovaleP. malariae
Antibody
Rodent malariaP. yoeliiP. bergheiP. chabaudiP. vinckei
AntibodyCD4+ T cellsγδ-T cellsMacrophagesROI-NO
CD8+ T cells(CD4+ T cells)NK cellsNKT cellsγδ-T cellsAntibody
FeverCerebal malariaRespiratory distressAmemiaHypoglycemia
Severe malaria
Mild malaria
Asymptomatic infection
Perc
ent of m
axi
mum
100
90
80
70
60
50
40
30
20
10
0
Age (years)
0 10 20 30 40 50
rev iew
a
b
Figure 1 The life cycle of the malaria parasite Plasmodium falciparum and acquisition of immunity in an area of endemic transmission. (a) Possible immune mechanisms at various stages of the plasmodium life cycle in the mammalian host. Top left and right, various plasmodia that infect humans and experimental rodent models. Sporozoites are injected through the dermis by a female anopheles mosquito, enter the bloodstream (pink shaded area, left) and migrate to the liver, then enter hepatocytes (brown shaded area) and undergo an amplification phase lasting between 2 and 9 days. Merozoites released after rupture of the infected hepatocyte invade rBCs and initiate the asexual cycle in rBCs (pink shaded area, right); each cycle of invasion and replication is between approximately 24 and 72 hours, depending on the species of plasmodium. Sexual stages (male and female gametocytes) are formed during the erythrocytic cycle; this stage continues the life cycle in the mosquito after a blood meal. Parasite stages in the liver are clinically silent. Fever and severe malaria are associated with the parasite cycle in the blood, as well as adherence of infected rBCs to blood vessel endothelium and to each other (rosetting; inset in gray). Numbers indicate effector mechanisms thought to be effective against plasmodium in the mammalian host and in blocking transmission to the mosquito: 1, antibodies to sporozoites neutralize sporozoites and/or block invasion of hepatocytes; 2, iFN-γ and CD8+ T cells (CD4+ dependent), natural killer (NK) cells, natural killer T (NKT) and γδ T cells kill intrahepatic parasites; 3, antibodies to merozoites opsonize merozoites for uptake and/or inhibit invasion of rBCs; 4, antibodies to infected rBCs surface opsonize infected rBCs for phagocytosis and/or block the adhesion of infected rBCs to endothelium; TNF and iFN-γ activate macrophages to phagocytose and/or kill infected rBCs and merozoites; antibodies to glycosylphosphatidylinositol neutralize parasite toxins and prevent the induction of excessive inflammation; 5, antibodies to infected rBCs prevent the sequestration of gametocytes, which prevents the sequestration and maturation of gametocytes; and 6, antibody and complement taken up in the blood meal mediate the lysis of gametocytes and prevent fertilization and further development of the parasite in the mosquito. rOi, reactive oxygen intermediate; NO, nitrous oxide. (b) Population indices of immunity in an endemic area of P. falciparum transmission (adapted from ref. 96). Change over time of various indices of malaria in a population living in an endemic area of P. falciparum transmission: asymptomatic infection (pink), mild disease (febrile episodes caused by malaria; blue) and severe or life-threatening disease (green). The data are normalized and are presented as the percent of maximum cases for each population index.
©20
08 N
atur
e P
ublis
hing
Gro
up
http
://w
ww
.nat
ure.
com
/nat
urei
mm
unol
ogy
Note: In Malaria Endemic Areas. Figure extracted from Langhorne et al. (2008, Figure 1b).
52

Figure A3: Stability of Malaria Transmission and Malaria Endemicity
01
23
45
Mal
aria
End
emic
ity (i
n 19
00)
0 10 20 30Malaria Stability
Note: Bin Scatter plot of malaria stability and malaria endemicity in 1900 (in 2.5o × 2.5o cells). Data sources:Kiszewski et al. (2004) and Hay et al. (2004).
Figure A4: Endemicity of Malaria in the Population in 1900
Note: Spatial distribution of the endemicity around 1900 (in 2.5o × 2.5o cells). Data source: Hay et al. (2004).
53

Figure A5: Genetic Immunities
Note: Spatial distribution of the prevalence of genetic immunities (in terms of average prevalence of sickle-celltrait, G6PD, and Duffy antigen negative) in the population (in 2.5o×2.5o cells). Data sources: Piel et al.(2013)and Howes et al. (2011 and 2013).
Figure A6: Malaria Stability and Civil Conflict: Local Polynomial Fit of residualvariation
-.1-.0
50
.05
.1%
Yea
rs w
Con
flict
- re
sidu
aliz
ed
0 10 20 30Malaria Stability
Note: Kernel-weighted local polynomial regression of civil violence (in 2.5o × 2.5o cells) by malaria stability,conditional on all controls as in specification (7) of Table 1 but without malaria stability.
54

Figure A7: Malaria Exposure and Genetic Immunities
0.1
.2.3
.4.5
Gen
etic
Imm
uniti
es
0 10 20 30Malaria Stability
Scatter plot of average prevalence of genetic immunities in the population against malaria ecology (malariatransmission and stability index constructed by Kiszewski et al., 2004) in 2.5o × 2.5o cells.
55

Additional Tables and Results
56

Table A1: Summary Statistics
Variable Mean Std. Dev. Min. Max. N
Fraction of Years with Conflicts 1997-2016 0.514 0.345 0 1 442Av. Conflict Fatalities p.a. 1482.353 7301.889 0 119965 442Conflict Fatalities DV 7.05 6.335 0 20 442Battle DV 6.253 6.234 0 20 442Strategic Conflict DV 3.717 4.385 0 20 442Riots/Protests DV 6.165 5.991 0 20 442Violence ag. Civilians DV 6.919 6.392 0 20 442Malaria Stability (demeaned) 0 8.863 -8.066 24.369 442
Malaria Stability2 78.370 100.218 0.004 593.858 442Malaria Endemicity 2.461 1.737 0 5 441Cell Area 20.194 0.596 17.122 20.468 442Total Water Area 2199.295 2663.489 0.685 14581.728 442Av. Precipitation 57.68 53.935 0.112 265.381 442Av. Temperature 23.806 3.47 13.78 29.966 442Precipitation (std.) 148.642 100.169 0.217 513.099 442Temperature (std.) 0.126 0.069 0.024 0.349 442Mean Elevation 554.99 426.575 -1533.861 2008.812 442Ruggedness 63454.443 69394.01 1270.976 364646.719 442Norma. Diff. Vegetation Index 144.192 48.559 16.321 231.409 442Latitude 5.154 18.379 -33.868 35.75 442Longitude 18.941 16.448 -23.75 57.75 442Distance to Capital (ln) 12.83 0.945 8.303 14.394 442Distance to Coast (ln) 12.133 2.009 0 14.129 442Distance to cl. Border (ln) 10.64 2.111 0 12.887 442Distance to River (ln) 0.938 0.737 0.116 2.655 442Distance to Addis Ababa (ln) 7.893 0.625 4.475 8.814 442Land Suitability Agr. 0.255 0.253 0.001 0.946 442Caloric Suitability I. 913.569 791.366 0 2555.548 442Diamond Mines 0.199 0.4 0 1 442Mineral Mines 0.862 0.345 0 1 442Petrol Fields 0.208 0.406 0 1 442> 1 Country 0.523 0.5 0 1 442# Ethnic Groups 3.342 2.326 1 11 442Partitioned Cell 0.738 0.44 0 1 442Population dens. (1995) 32.759 74.358 0.031 595.528 442Night Lights (1995) 2.647 0.985 2.001 13.151 442Primary Roads 0.437 0.497 0 1 442Av. Genetic Immunity 0.26 0.141 0.004 0.458 442Av. Policy CoverageAv. 0.026 0.039 0 0.165 383
57

Table A2: Malaria and Conflicts: Non-linear Specification (Robustness)
Dependent Variable Fraction of Years with Conflicts 1997-2016 - Cell Level
Malaria Stability(1) (2) (3) (4) (5) (6) (7)
Malaria Stability 0.023*** 0.021*** 0.018*** 0.016*** 0.014** 0.013** 0.014**(0.004) (0.006) (0.006) (0.006) (0.006) (0.006) (0.006)
(Malaria Stability)2 -0.001*** -0.001** -0.001*** -0.001*** -0.001*** -0.001*** -0.001**(0.000) (0.000) (0.000) (0.000) (0.000) (0.000) (0.000)
Controls:
Geography/Climate (ext.) No No Yes Yes Yes Yes YesDistances No No Yes Yes Yes Yes YesResources No No No Yes Yes Yes Yes>1 Country No No No No Yes Yes Yes# Ethnic Groups No No No No Yes Yes YesPartitioned Cell No No No No Yes Yes YesPopulation dens. No No No No No Yes YesLights, Roads No No No No No No Yes
Country FE No Yes Yes Yes Yes Yes Yes
Observations 442 442 442 442 442 442 442Adj. R-squared 0.217 0.433 0.606 0.627 0.633 0.650 0.677
OLS estimates. The dependent variable is the fraction of years 1997-2016 with a conflict event in the cell(ACLED 7). See text for details. “Malaria Stability” is the index of malaria strength and stability by Kiszewskiet al. (2004). Each specification controls for the natural logarithm of the cell area. Geography/Climate (ext.)includes second-order polynomials of absolute latitude and longitude to flexibly account for spatial correlationsunrelated to malaria. See the text and Tables 9, 10 and 11 for a description of each variable and their sources.See Table A1 for descriptive statistics. The unit of observation is a 2.5 x 2.5 degree cell. Robust standarderrors clustered at the country level in parentheses. ***, **, * indicate significance at 1-, 5-, and 10-% level,respectively.
58

Table A3: Malaria Endemicity and Conflicts: Non-linear Specification
Dependent Variable Fraction of Years with Conflicts 1997-2016 - Cell Level
Malaria Endemicity(1) (2) (3) (4) (5) (6) (7)
Malaria Endemicity 0.250*** 0.284*** 0.284*** 0.284*** 0.284*** 0.238*** 0.238***(0.050) (0.066) (0.066) (0.066) (0.066) (0.057) (0.057)
(Malaria Endemicity)2 -0.032*** -0.037** -0.037** -0.037** -0.037** -0.030** -0.030**(0.010) (0.015) (0.014) (0.014) (0.014) (0.013) (0.013)
Controls:
Geography/Climate No No Yes Yes Yes Yes YesDistances No No Yes Yes Yes Yes YesResources No No No Yes Yes Yes Yes>1 Country No No No No Yes Yes Yes# Ethnic Groups No No No No Yes Yes YesPartitioned Cell No No No No Yes Yes YesPopulation dens. No No No No No Yes YesLights, Roads No No No No No No Yes
Country FE No Yes Yes Yes Yes Yes Yes
Observations 441 441 441 441 441 441 441Adjusted R-squared 0.309 0.517 0.518 0.518 0.518 0.564 0.564
OLS estimates. The dependent variable is the fraction of years 1997-2016 with a conflict event in the cell(ACLED 7). See text for details. “Malaria Stability” is the index of malaria strength and stability by Kiszewskiet al. (2004). Panel B: “Malaria Endemicity in 1900” is the index of average historical malaria endemicity byLysenko and Semashko (1968) and digitalized by Hay et al. (2004). Each specification controls for the naturallogarithm of the cell area. See the text and Tables 9, 10 and 11 for a description of each variable and theirsources. See Table A1 for descriptive statistics. The unit of observation is a 2.5 x 2.5 degree cell. Robuststandard errors clustered at the country level in parentheses. Conley standard error (8 degrees cut-off) insquared brackets. ***, **, * indicate significance at 1-, 5-, and 10-% level, respectively.
59

Table A4: Accounting for Settlement by Europeans
Dependent Variable Fraction of Years with Conflicts 1997-2016 - Cell Level
Sample (Both Panels) Excluding Excl. North and Excl. CountriesNorth Africa South Africa Settled Europeans
Panel A: Malaria Stability
(1) (2) (3) (4) (5) (6)
Malaria Stability 0.022*** 0.016** 0.027*** 0.019*** 0.028*** 0.018***(0.006) (0.006) (0.004) (0.005) (0.003) (0.006)
(Malaria Stability)2 -0.001** -0.001** -0.001*** -0.001** -0.001*** -0.001***(0.000) (0.000) (0.000) (0.000) (0.000) (0.000)
Observations 359 359 333 333 362 362Adjusted R-squared 0.200 0.645 0.287 0.661 0.302 0.723
Controls:
Geography/Climate No Yes No Yes No YesDistances No Yes No Yes No YesResources No Yes No Yes No Yes>1 Country No Yes No Yes No Yes# Ethnic Groups No Yes No Yes No YesPartitioned Cell No Yes No Yes No YesPopulation dens. No Yes No Yes No YesLights, Roads No Yes No Yes No Yes
Country FE No Yes No Yes No Yes
OLS estimates. The dependent variable is the fraction of years 1997-2016 with a conflict event in the cell(ACLED 7). See text for details. Panel A: “Malaria Stability” is the index of malaria strength and stability byKiszewski et al. (2004). Each specification controls for the natural logarithm of the cell area. See the text andTables 9, 10 and 11 for a description of each variable and their sources. Specifications in Column (1) and (2) donot contain cells located in North Africa (Morocco, Algeria, Tunisia, Lybia and Egypt), in Column (3) and (4)cells located in North Africa and in South Africa, in Column (5) and (6) cells located in countries where 100,000inhabitants with European ancestry (South Africa, Angola, Namibia, Madagascar, Tunisia and Morocco). SeeTable A1 for descriptive statistics. The unit of observation is a 2.5 x 2.5 degree cell. Robust standard errors inparentheses clustered at the country level. ***, **, * indicate significance at 1-, 5-, and 10-% level, respectively.
60
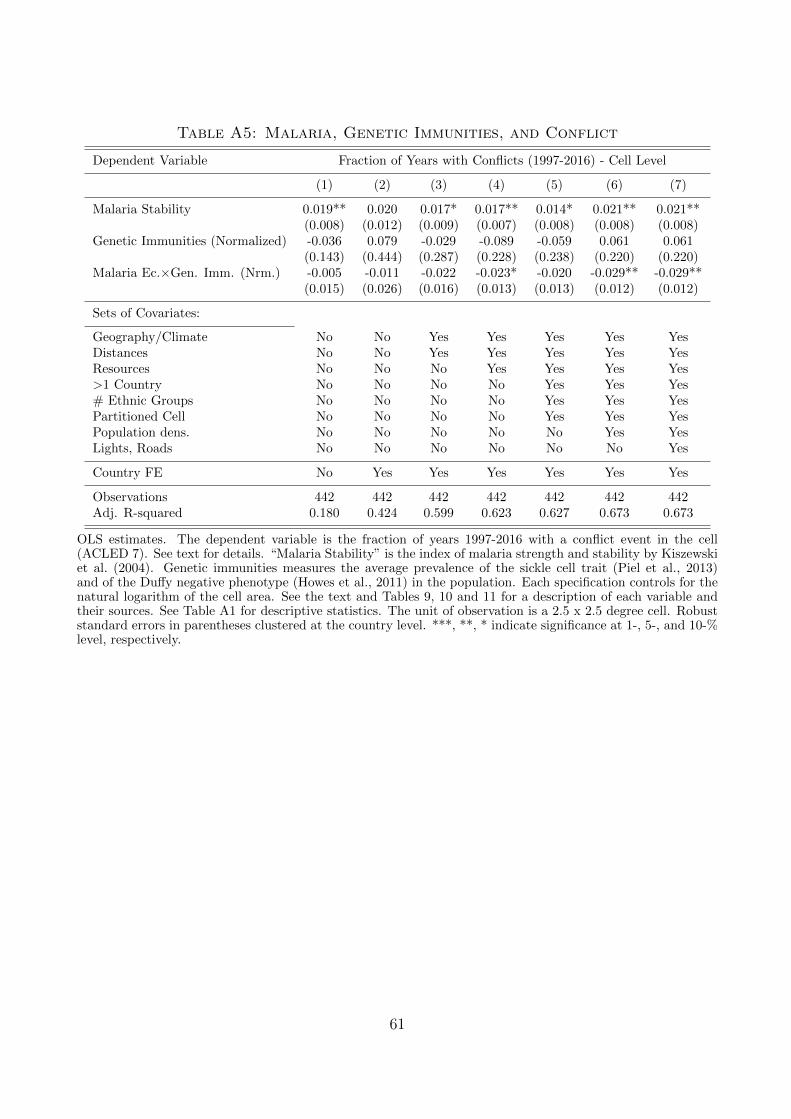
Table A5: Malaria, Genetic Immunities, and Conflict
Dependent Variable Fraction of Years with Conflicts (1997-2016) - Cell Level
(1) (2) (3) (4) (5) (6) (7)
Malaria Stability 0.019** 0.020 0.017* 0.017** 0.014* 0.021** 0.021**(0.008) (0.012) (0.009) (0.007) (0.008) (0.008) (0.008)
Genetic Immunities (Normalized) -0.036 0.079 -0.029 -0.089 -0.059 0.061 0.061(0.143) (0.444) (0.287) (0.228) (0.238) (0.220) (0.220)
Malaria Ec.×Gen. Imm. (Nrm.) -0.005 -0.011 -0.022 -0.023* -0.020 -0.029** -0.029**(0.015) (0.026) (0.016) (0.013) (0.013) (0.012) (0.012)
Sets of Covariates:
Geography/Climate No No Yes Yes Yes Yes YesDistances No No Yes Yes Yes Yes YesResources No No No Yes Yes Yes Yes>1 Country No No No No Yes Yes Yes# Ethnic Groups No No No No Yes Yes YesPartitioned Cell No No No No Yes Yes YesPopulation dens. No No No No No Yes YesLights, Roads No No No No No No Yes
Country FE No Yes Yes Yes Yes Yes Yes
Observations 442 442 442 442 442 442 442Adj. R-squared 0.180 0.424 0.599 0.623 0.627 0.673 0.673
OLS estimates. The dependent variable is the fraction of years 1997-2016 with a conflict event in the cell(ACLED 7). See text for details. “Malaria Stability” is the index of malaria strength and stability by Kiszewskiet al. (2004). Genetic immunities measures the average prevalence of the sickle cell trait (Piel et al., 2013)and of the Duffy negative phenotype (Howes et al., 2011) in the population. Each specification controls for thenatural logarithm of the cell area. See the text and Tables 9, 10 and 11 for a description of each variable andtheir sources. See Table A1 for descriptive statistics. The unit of observation is a 2.5 x 2.5 degree cell. Robuststandard errors in parentheses clustered at the country level. ***, **, * indicate significance at 1-, 5-, and 10-%level, respectively.
61

Table A6: Violence before 2005 and Anti-Malaria Policies after 2005
Dependent Variable Anti-Malaria Policies (2005)
(1) (2) (3) (4) (5) (6) (7)
Conflicts (1998-2004) -0.274 -0.142 -0.225 -0.134 -0.152 -0.084 -0.103(0.330) (0.216) (0.236) (0.205) (0.204) (0.204) (0.200)
Sets of Covariates:
Geography/Climate No No Yes Yes Yes Yes YesDistances No No Yes Yes Yes Yes YesResources No No No Yes Yes Yes Yes>1 Country No No No No Yes Yes Yes# Ethnic Groups No No No No Yes Yes YesPartitioned Cell No No No No Yes Yes YesPopulation dens. No No No No No Yes YesLights, Roads No No No No No No Yes
Country FE No Yes Yes Yes Yes Yes Yes
Observations 306 306 306 306 306 306 306Adj. R-squared 0.019 0.404 0.453 0.505 0.509 0.514 0.530
OLS estimates. Anti malaria policies measure the average coverage in each grid-cell of main malaria controlinterventions in terms of insecticide-treated bed nets (ITNs), indoor residual spraying (IRS), and artemisinin-based combination therapy (ACT) as of 2005 (Bhatt et al., 2015). Conflicts (1997-2005) measures the fractionof years 1997-2005 with a conflict event in the cell (ACLED 1997-2016). Each specification controls for thenatural logarithm of the cell area. See the text and Tables 9, 10 and 11 for a description of each variable andtheir sources. See Table A1 for descriptive statistics. The unit of observation is a 2.5 x 2.5 degree cell. Robuststandard errors in parentheses clustered at the country level. ***, **, * indicate significance at 1-, 5-, and 10-%level, respectively.
62

Table A7: Violence before 2005 and Anti-Malaria Policies at Country Level in2005
Dependent Variable Anti-Malaria Policies - Country Level in 2005
(1) (2) (3) (4) (5) (6) (7)
Conflicts (1998-2004) -0.195 0.108 -0.079 -0.024 0.000 0.123 0.140(0.245) (0.242) (0.157) (0.184) (0.191) (0.204) (0.209)
Conflicts (1998-2004) -0.155 -0.458 -0.415 -0.400 -0.445 -0.483 -0.494×Malaria - High Risk DV ∈ (0, 15] (0.443) (0.415) (0.394) (0.387) (0.355) (0.349) (0.349)
Malaria - High Risk DV ∈ (0, 15] 0.573 0.302 0.152 0.133 0.156 0.162 0.172(0.399) (0.297) (0.264) (0.240) (0.238) (0.241) (0.244)
Sets of Covariates:
Geography/Climate No No Yes Yes Yes Yes YesDistances No No Yes Yes Yes Yes YesResources No No No Yes Yes Yes Yes>1 Country No No No No Yes Yes Yes# Ethnic Groups No No No No Yes Yes YesPartitioned Cell No No No No Yes Yes YesPopulation dens. No No No No No Yes YesLights, Roads No No No No No No Yes
Country FE No No No No No No No
Observations 383 383 383 383 383 383 383Adjusted R-squared 0.055 0.273 0.300 0.343 0.340 0.355 0.360
OLS estimates. The dependent variable is the coverage with anti malaria policies at country level in 2005 interms of insecticide-treated bed nets (ITNs), indoor residual spraying (IRS), and artemisinin-based combinationtherapy (ACT) as of 2005 (Bhatt et al., 2015). Conflicts (1997-2005) measures the fraction of years 1997-2005with a conflict event in the cell (ACLED 1997-2016). “Malaria - High Risk DV” is a dummy that identifiescells with low to intermediate levels of stability of malaria transmission given by levels of the index of malariastrength and stability by Kiszewski et al. (2004) in the interval (0, 15]. Each specification controls for thenatural logarithm of the cell area. See the text and Tables 9, 10 and 11 for a description of each variable andtheir sources. See Table A1 for descriptive statistics. The unit of observation is a 2.5 x 2.5 degree cell. Robuststandard errors in parentheses clustered at the country level. ***, **, * indicate significance at 1-, 5-, and 10-%level, respectively.
63

Table A8: Anti-Malaria Policies at Country Level in 2005 and Violence before2005
Dependent Variable Anti-Malaria Policies - Binary Indicator of Country Level Coverage in 2005
(1) (2) (3) (4) (5) (6) (7)
Conflicts (1998-2004) 0.094 0.109 -0.021 -0.011 0.078 0.048 0.039(0.111) (0.085) (0.094) (0.093) (0.094) (0.094) (0.084)
Sets of Covariates:
Geography/Climate No No Yes Yes Yes Yes YesDistances No No Yes Yes Yes Yes YesResources No No No Yes Yes Yes Yes>1 Country No No No No Yes Yes Yes# Ethnic Groups No No No No Yes Yes YesPartitioned Cell No No No No Yes Yes YesPopulation dens. No No No No No Yes YesLights, Roads No No No No No No Yes
Country FE No No No No No No No
Observations 383 383 383 383 383 383 383Adjusted R-squared 0.016 0.252 0.382 0.406 0.421 0.455 0.502
OLS estimates. The dependent variable is a binary indicator taking value 1 if the coverage with anti malariapolicies at country level in 2005 in terms of insecticide-treated bed nets (ITNs), indoor residual spraying (IRS),and artemisinin-based combination therapy (ACT) as of 2005 (Bhatt et al., 2015) was above the country averagein 2005. Conflicts (1997-2005) measures the fraction of years 1997-2005 with a conflict event in the cell (ACLED1997-2016). “Malaria - High Risk DV” is a dummy that identifies cells with low to intermediate levels of stabilityof malaria transmission given by levels of the index of malaria strength and stability by Kiszewski et al. (2004)in the interval (0, 15]. Each specification controls for the natural logarithm of the cell area. See the text andTables 9, 10 and 11 for a description of each variable and their sources. See Table A1 for descriptive statistics.The unit of observation is a 2.5 x 2.5 degree cell. Robust standard errors in parentheses clustered at the countrylevel. ***, **, * indicate significance at 1-, 5-, and 10-% level, respectively.
64

Table A9: Malaria, Policies (Country Level) and Violent Events: Controllingfor Past Conflict
Dependent Variable Fraction of Years with Conflicts (2006-2016) - Cell Level
(1) (2) (3) (4) (5) (6) (7)
Malaria - High Risk DV ∈ (0, 15] 0.016 0.045** 0.039** 0.032* 0.032 0.032 0.022(0.042) (0.022) (0.018) (0.019) (0.019) (0.019) (0.018)
Malaria - High Risk DV ∈ (0, 15] -0.020 -0.043** -0.050*** -0.062*** -0.062*** -0.062*** -0.057***× Pol. Country 2005 (0.013) (0.016) (0.010) (0.011) (0.012) (0.012) (0.012)
Sets of Controls:
Conflicts (1997-2005) Yes Yes Yes Yes Yes Yes YesGeography/Climate No No Yes Yes Yes Yes YesDistances No No Yes Yes Yes Yes YesResources No No No Yes Yes Yes Yes>1 Country No No No No Yes Yes Yes# Ethnic Groups No No No No Yes Yes YesPartitioned Cell No No No No Yes Yes YesPopulation dens. No No No No No Yes YesLights, Roads No No No No No No Yes
Country FE Yes Yes Yes Yes Yes Yes Yes
Observations 383 383 383 383 383 383 383Adj. R-squared 0.599 0.686 0.721 0.721 0.720 0.719 0.723
OLS estimates. The dependent variable is the fraction of years 2006-2016 with a conflict event in the cell(ACLED 1997-2016). See text for details. “Malaria - High Risk DV” is a dummy that identifies cells withlow to intermediate levels of stability of malaria transmission given by levels of the index of malaria strengthand stability by Kiszewski et al. (2004) in the interval (0, 15]. Anti malaria policies measures the averagecoverage in a country of main malaria control interventions in terms of insecticide-treated bed nets (ITNs),indoor residual spraying (IRS), and artemisinin-based combination therapy (ACT) as of 2005 (Bhatt et al.,2015). Each specification controls for the natural logarithm of the cell area and the fraction of years withconflicts in the period 1997-2005. See the text and Tables 9, 10 and 11 for a description of each variable andtheir sources. See Table A1 for descriptive statistics. The unit of observation is a 2.5 x 2.5 degree cell. Robuststandard errors in parentheses clustered at the country level. ***, **, * indicate significance at 1-, 5-, and 10-%level, respectively.
65