long-term consequences of biological and … consequences of biological and biogeochemical changes...
TRANSCRIPT
Long-term consequences of biological and biogeochemical changes in theHorseshoe Bend LTREB Agroecosystem, Athens, GA.
David C. Coleman*1, Mark D. Hunter2, Paul F. Hendrix1, D. A. Crossley, Jr.1, Sofia Arce-Flores 1, Breana Simmons3 and Kyle Wickings.1, Institute of Ecology, University of Georgia,Athens, GA 306021 , Department of Ecology and Evolution, University of Michigan, AnnArbor, MI 48109,2 Natural Resource Ecology Laboratory, Colorado State University, Ft.Collins, CO 805233
Symposium on “Revisiting the Crossroads of Ecology and Agriculture: a Tribute toBen Stinner”
* Corresponding author: e-mail: [email protected]
Long-term consequences of biological and biogeochemical changes in the HorseshoeBend LTREB Agroecosystem, Athens, GA.
1. Introduction:
We thank Patrick Bohlen and the organizers for inviting us to participate in this
publication honoring the life and work of Ben Stinner, who was an early alumnus of the
Horseshoe Bend project, where he conducted the research leading to his Ph.D. degree in
1984.
The maintenance of soil organic matter (SOM) is considered a desirable goal in
agroecosystems (Coleman et al. 1984, 1994; Bossuyt et al. 2002). SOM maintains soil
structural stability, enhances water holding capacity, soil fertility and crop production,
ensuring long-term agricultural ecosystem stability (Dick et al. 1997; Hassink et al. 1997;
Denef et al. 2004). Soil is estimated to be the largest terrestrial pool of C, containing 1500
Pg, twice that of the atmosphere (Schlesinger 1997).
Agroecosystems that utilize conservation tillage or no-tillage techniques are promising
alternatives to deep moldboard plowing, because they enhance agricultural sustainability,
and reduce losses to erosion (Six et al. 1999). Tillage practices disrupt soil aggregates which
may lead to increased aggregate turnover and increased decomposition of SOM (Six et al.
1998). Reduced aggregation leads to subsequent lower levels of SOM in conventional tillage
(CT) than in no-tillage (NT) treatments (Paustian et al. 1998). Conversely, there is an
increase in C content under NT which is attributed to a combination of slower litter
decomposition and reduced soil disturbance under NT (Coleman et al. 1994; Paustian et al.
1997).

Six et al. (1999) developed a conceptual model of aggregate turnover, depicting
organic C accumulation, mineral fraction, and particulate organic matter (POM). Faster
macroaggregate turnover in CT than in NT results in: (1) fewer macroaggregates being
maintained, with more free microaggregates being present in CT, and (2) less fine POM and
new microaggregates formed in CT. By the end of the cycle, fewer microaggregates contain
crop-derived C in CT than in NT (Six et al. 1999).
Several soil scientists have used the natural signal from C3-type vegetation (δ13C ca.
–26‰) in the indigenous soil organic matter, and then followed the change that occurs from
growing C4-type vegetation (δ13C ca. –12‰) in experimental fields (Balesdent et al. 1987;
Balesdent and Balabane 1992). Our studies have used a modified approach, converting
from a regime of C3 winter cover crops (wheat, rye, clover) and C4 summer maize or grain
sorghum crops, to all C3 winter crops and summer (kenaf, cotton) crops. We are following
changes in isotopic ratios of some soil C pools, measuring the long-term accretion of C in
various soil fractions (Coleman et al. 1994; Six et al. 1998, 1999) in our agroecosystem. This
research on a sub-tropical soil serves as a useful comparison and contrast to the results of
Balesdent et al. (1987, 2000) in temperate soils and Cerri et al. (1995) in tropical soils. We
expect that C stabilization (i.e., slower C turnover) will be more pronounced over the long-
term in NT than in CT plots due to C protection within microaggregate fractions in the upper
soil stratum of NT.
The studies presented here were conducted in the Horseshoe Bend Agroecosystem
Long-term Research in Environmental Biology (LTREB) site, Athens, Georgia. Our objectives
were: (1) to measure the peak standing crop biomass of our summer crops across decadal
time spans, and to relate those trends to other aspects of tillage management and winter

cover crop; (2) to determine the influence of both tillage methods (CT and NT) on water-
stable aggregate distribution and SOM dynamics and (3) to investigate the changes in 13C in
both tillage practices. We hypothesized that the contrast between tillage treatments would
change over time, with greater macroaggregation and organic matter fractions in NT vs. CT,
and faster C turnover in both macro- and microaggregates in CT vs. NT.
2. Materials and Methods:
2.1. The Horseshoe Bend field site
Horseshoe Bend is a two ha. research site of the University of Georgia, situated in
bottomland (fine loamy siliceous thermic Rhodic Kanhapludult in the Hiwassee series with
66% sand, 13% silt, and 21% clay) along the middle fork of the Oconee River, in Athens-
Clarke County, GA. Mean annual precipitation is 1270mm., and annual mean minimum and
maximum temperatures are 8.3 and 19.30 C. for Conventional Tillage (CT) and 9.5 and 17.50
C. for No-tillage (NT) plots (Hendrix et al. 2001). Soil pH is 6.0 in the surface 2 cm. and 5.7 at
depths of 5-10 cm. Research has been conducted continuously at Horseshoe Bend since
Odum et al. (1974) set up old fields in the mid-1960’s. From 1978 onward, four 0.1 ha plots
have been managed with moldboard plowing (to 15 cm.) followed by disking (conventional
tillage = CT), and another four 0.1 ha. plots have been managed using a no-tillage (NT)
regime, with the only soil disturbance being direct seed drilling in these untilled plots. We
sow winter cover crops of wheat and crimson clover, and various summer crops, including
grain sorghum (Sorghum bicolor) corn (Zea mays L.), and beginning in 1999, cotton
(Gossypium hirsutum L.), either engineered Bt (producing the Cry1Ac protein), or Non-Bt. In
spring and summer, we make topical applications of Roundup herbicide to control C4 weeds,
such as Johnson grass (Sorghum halepense) The NT plots have built up a significant organic

layer near the soil surface, and tend to be dominated by fungal tissues in the top 1-2 cm
(Beare et al. 1992, 1994a, b). In contrast, the CT plots have a more uniform distribution of
the organic carbon in the soil profile in the top 15-cm. The tillage and Bt treatments are set
up in a split-split plot design.
2.2. Sampling and analytical procedures
For net primary production aboveground, we sampled quadruplicate one-quarter
meter samples in late October. Thus four each were taken from rye and clover winter cover
crop sites of each management plot, for a total of 64 samples. The biomass samples were
oven dried in a forced-air oven at 600 C. until fully dry, then weighed to determine total mass.
At the time of sampling for crop biomass, samples for weeds and litter were taken in the
same quadrats in some years, and also recorded.
For soil organic matter analyses, samples (5.8 cm. dia., 0-5 and 5-15 cm) were taken
from CT and NT plots in quadruplicate for each 0.1 ha. plot. Samples were kept field moist at
40 C. for no more than 24 h., and processed for macro-and micro-aggregates using the wet
sieving technique of Beare et al. (1994a, b). Delta 13C values were determined on ground
samples of micro- and macro-aggregates on a Finnigan MAT Isotope Ratio Spectrometer. All
analyses were made in triplicate and analyzed by Analysis of Variance, or nonparametric
statistics.
The distribution of aggregates was measured using a modified Yoder (1936) wet-
sieving apparatus that was designed to handle larger masses of soil on stacked sieves (21.6
cm. dia.), which allowed for complete recovery of all particles from individual samples (Beare
and Bruce 1993). Soil was air dried prior to sieving and suspended in distilled water at room
temperature on the largest sieve 5 minutes before sieving. Each 50 g subsample was

distributed on the surface of the top sieve of the 3-sieve stack (2000 µm above the 250 µm
sieve). The soil was wet-sieved oscillating 21 x/min. for 5 min., through the three sieves to
obtain four aggregate size fractions: (1) 2000 µm (large macroaggregates), (2) 250 to 2000
µm, (3) 53 to 250 µm (microaggregates) and (4) < 53 µm (silt- plus clay size particles).
Following sieving, the sieves were lowered to the bottom of the stroke and the fresh OM from
crop residue was aspirated from the surface before draining and placed into an aluminum
cake pan. After wet sieving, the water columns were drained and the soil sieves were
backwashed into cake pans and left to dry in a drying chamber (10o C). Subsamples of soil
were taken to enable calculation of sample weight to oven-dry weights. The 53 µm pan was
removed from the bucket and a stirrer was used to mix the water in the bucket. After mixing,
a 200 ml. subsample was taken and placed in its respective pan. Subsamples from each size
fraction were ground and analyzed for total C and 13C. Sub-samples were taken from the dry
aggregate size fractions noted above to separate the POM associated and Mineral
associated C and N. Details of this method are described by Cambardella and Elliott (1992).
Subsamples of intact aggregates were mixed with sodium hexametaphosphate and shaken
for 12 h on a reciprocal shaker. The dispersed organic matter plus sand was collected on a
53 µm mesh sieve; the water in the soil slurry was evaporated in a forced-air oven at 500 C
and the dried sample ground and analyzed by Dumas combustion on a Carlo/Erba analyzer.
The difference between the C and N values for the evaporated soil slurry and those obtained
from a non-dispersed soil sample was considered to be equal to the C or N retained in the
sieve.
2.3. Isotope analysis:
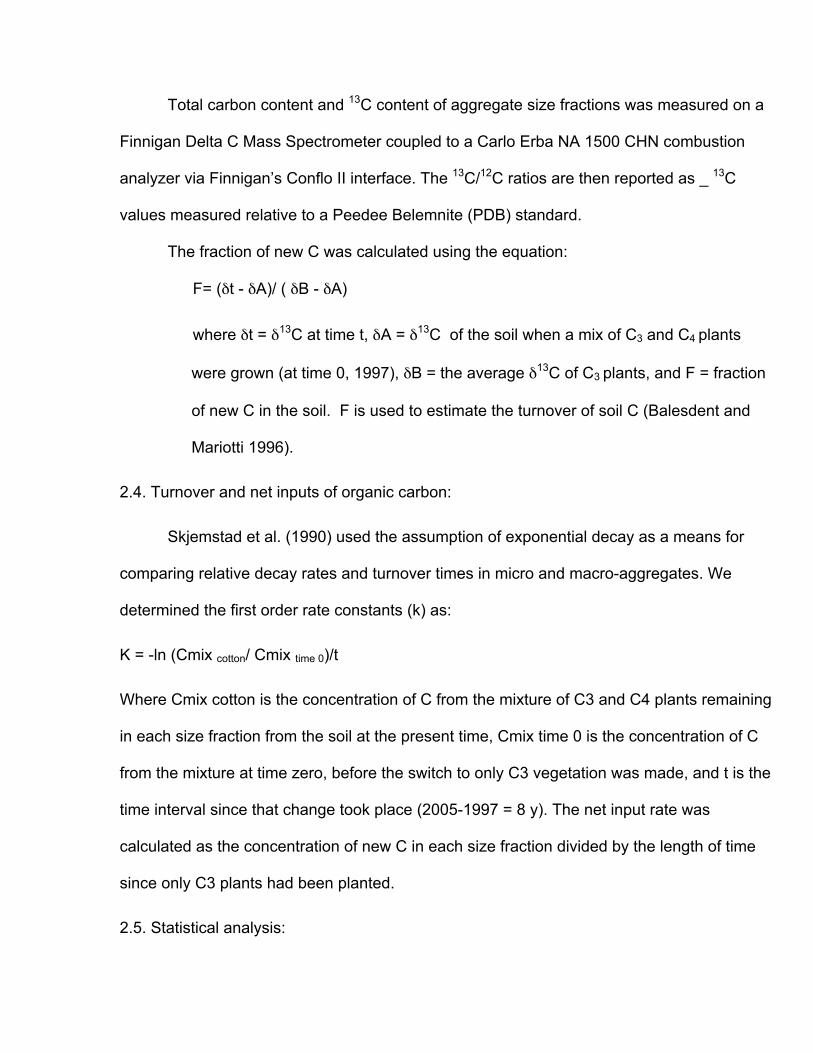
Total carbon content and 13C content of aggregate size fractions was measured on a
Finnigan Delta C Mass Spectrometer coupled to a Carlo Erba NA 1500 CHN combustion
analyzer via Finnigan’s Conflo II interface. The 13C/12C ratios are then reported as _ 13C
values measured relative to a Peedee Belemnite (PDB) standard.
The fraction of new C was calculated using the equation:
F= (δt - δA)/ ( δB - δA)
where δt = δ13C at time t, δA = δ13C of the soil when a mix of C3 and C4 plants
were grown (at time 0, 1997), δB = the average δ13C of C3 plants, and F = fraction
of new C in the soil. F is used to estimate the turnover of soil C (Balesdent and
Mariotti 1996).
2.4. Turnover and net inputs of organic carbon:
Skjemstad et al. (1990) used the assumption of exponential decay as a means for
comparing relative decay rates and turnover times in micro and macro-aggregates. We
determined the first order rate constants (k) as:
K = -ln (Cmix cotton/ Cmix time 0)/t
Where Cmix cotton is the concentration of C from the mixture of C3 and C4 plants remaining
in each size fraction from the soil at the present time, Cmix time 0 is the concentration of C
from the mixture at time zero, before the switch to only C3 vegetation was made, and t is the
time interval since that change took place (2005-1997 = 8 y). The net input rate was
calculated as the concentration of new C in each size fraction divided by the length of time
since only C3 plants had been planted.
2.5. Statistical analysis:

The experiment was analyzed as a nested split plot design, and analyzed by the SAS
statistical package for analysis of variance (ANOVA-PROC GLM, SAS Institute, 1990).
Tukey’s HSD (p<0.05) was used for mean separation.
3. Results:
3.1. Crop Biomass
Crop biomass at Horseshoe Bend has been measured intermittently since 1984.
The majority of variation in above-ground crop biomass is explained by the species of crop
being grown. Biomass was greatest for corn, then kenaf, followed by sorghum and cotton
(F3,36=101.40, p<0.001, Figure 1). There are also some modest effects of cover crop,
tillage, and year on crop biomass. For example, a clover cover crop provides a substantial
boost to corn production, whereas its effects on other crops are negligible (F3,36=8.06,
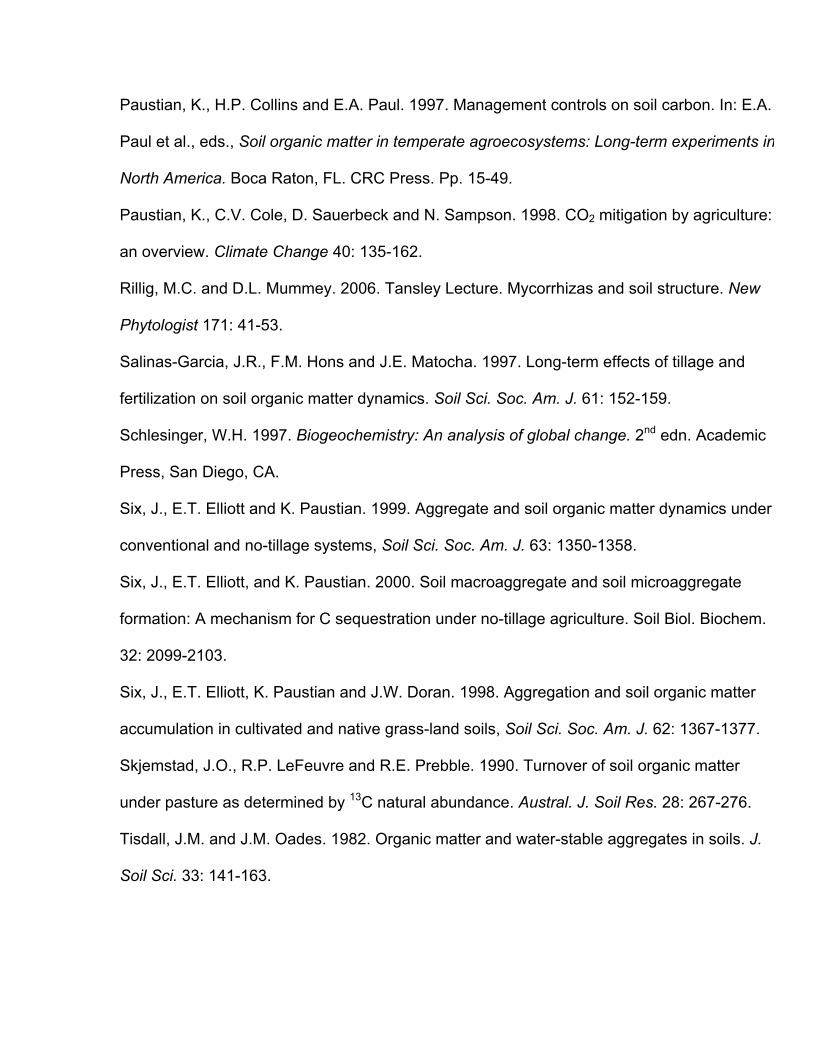
p=0.0003, Figure 2). Likewise, tillage has its greatest impact on corn and sorghum
production. In general, corn biomass was higher under conventional tillage than under no
tillage, with the exception of the year 1996. In contrast sorghum biomass was higher under
no tillage than conventional tillage (F11,184=3.64, p<0.0001, Figure 3).
Overall, these data suggest that tillage and cover crop have relatively minor effects
on crop biomass with the clear exception of corn. Corn biomass was favored by a cover
crop of clover and conventional tillage.
3.2. Weed biomass
The above-ground biomass of weeds in the fall was estimated, starting in 1991. Again, the
species of crop planted explained the greatest variation in the fall biomass of weeds
(F3,36=133.78, p<0.0001) with very low weed production under cotton (Figure 4). Weed

biomass was generally higher under no tillage than under conventional tillage, with the
greatest differences observed under corn production (F7,131=2.74, p=0.0109, Figure 4)
Overall, weed biomass under cotton was very low, although this was likely driven in part by
significant drought during the cotton years. As expected, weed biomass was higher under
no tillage.
3.3. Litter biomass
During 1991 (sorghum) and 1992 (corn), estimates were made of above-ground litter
biomass during the fall sampling period. Litter biomass was greater under no tillage than
under conventional tillage, with a larger effect of tillage on litter biomass under corn
production (F1,12=32.10, p=0.0001, Figure 5).
3.4. Changes in water-stable aggregates
Our hypothesis was that there will be more accumulation of carbon in aggregates in
NT and hence more rapid loss and turnover of C in the CT treatments.
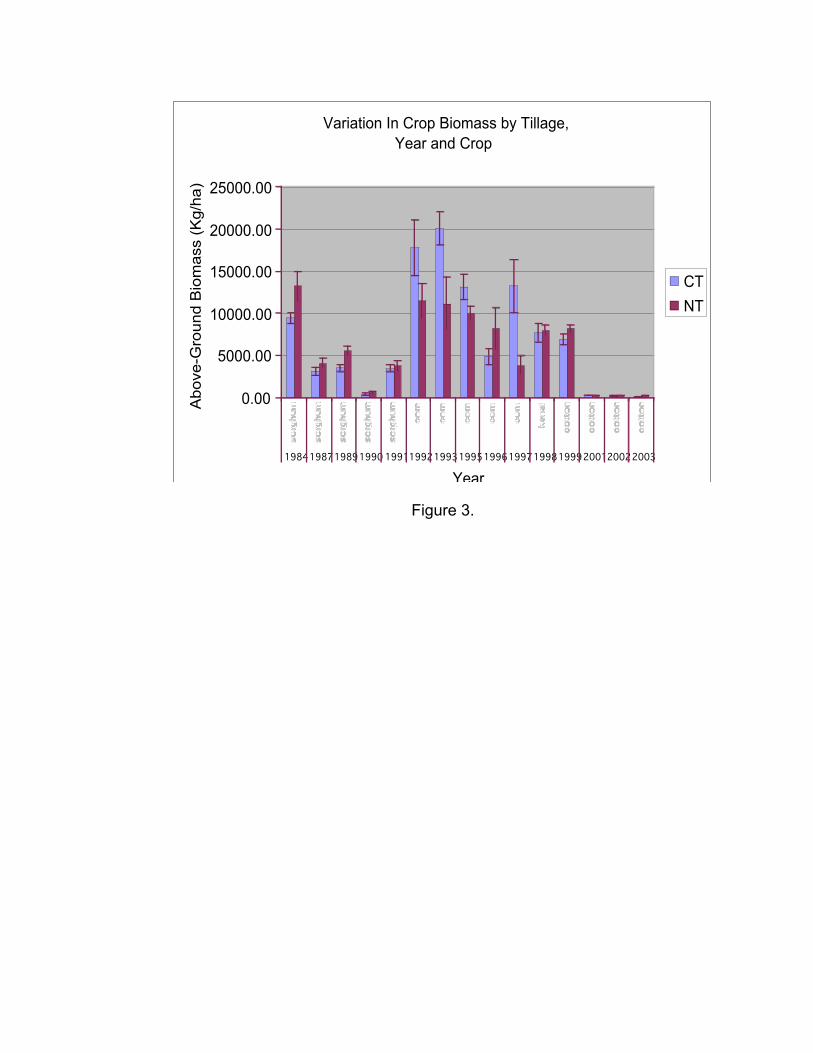
The distribution of water stable aggregates was influenced significantly by tillage
management in both depths of soils (Fig. 6, a and b). Macroaggregates (>2000 µm)
comprised the larges percentage of the total soil, and they were 1.6 time greater (p <0.001)
in NT than in CT. For aggregates of 250-2000, 53-250 and < 53 µm, the aggregates in CT
plots were 1.3, 2.9 and 2.2 times greater than NT, respectively (p<0.05). At 5-15 cm. depth,
the distribution of macroaggregates from NT was 1.2 times greater than in CT. There was
no significant difference in the smaller WSA size classes.
Total C and N were significantly different by tillage, aggregate size and their
interaction (p< 0.01, Fig. 7). Total sand free C and N in 0-5 cm soils were significantly
higher for all aggregate size classes in NT than CT. In the 0-5 cm layer, sand-free C and N

were highest in the 250-2000 µm aggregates, with total C and N being 1.6 and 1.5 times
greater. In contrast, there were no significant differences in aggregate C and N in the 5-15
cm depths.
The differences in particulate organic matter (POM)-associated C and N were
significantly affected by tillage and aggregate size class for all aggregate size classes in
surface soils (N) and in aggregates >2000 µm and 250-2000 µm (C)(fig. 8). In general, the
C/N ratios were much greater between size classes for the POM associated organic matter
than for the Mineral Associated POM.
We compared total C within the same tillage practices for the three different
sampling dates 1997, 2000 and 2005 (Fig. 9). Total C in NT surface soils showed a
significant loss for aggregate size classes > 53 µm, and a constant concentration of C in
the aggregates < 53 µm. The net loss of C from 1997 to 2005 was reduced and average of
1.6 times (40 g C kg-1) of C concentration in the NT treatment. In contrast, surface soils of
CT showed no significant differences in time for the > 53 µm size classes, but significantly
different total C concentration in <53 µm aggregates.
3.5. Changes in delta 13C in aggregates.
There were significant differences in 13C ratios in time within tillage method (Fig. 10).
Ratios for all aggregate size classes were shifting towards the 13 C ratios of C3 plants. The
values for NT in the surface soils were generally lower (more negative) compared to CT. In
both NT and CT, the aggregates >53 µm had the youngest age (most negative 13C ratio) and
the aggregate < 53 µm showed the oldest signature, being older in CT than NT. Both the 0-5
and 5-15 cm depths in CT were significantly more negative in the year 2000 than in 2005,
and the 5-15 cm depth in NT was not significantly different in 1997 and 2000.

For surface soils there were similar values of new C in CT and NT (Table 1); in lower
depths, the larger aggregates in CT had more new C incorporated than NT. The proportion
of new C did not show a significant variation for both depths within the NT practice, with a
similar behavior in CT except for the deeper soil profile.
Table 2 shows the average rate constant (k) for loss and turnover time (1/k) of the
mixture of C4 and C3 -C and average net input rate of C3-C in aggregate size fractions as
determined by 13C natural abundance. The k was lower for microaggregates than for
macroaggregates in both tillage treatments and the turnover was faster in CT than in NT for
both surface and deep soil in most all of aggregate size fractions. The turnover of
aggregate associated old C in microaggregates was 27.08 years for NT and 26.12 for CT
(0-5 cm) and for the deeper soil profile the difference was greater (34.5 and 12 yr,
respectively). In the 5-15 cm. depth the aggregates < 53 µm for both NT and CT had very
little net input rate of new C. Furthermore, within tillage there was a difference of turnover
within aggregate size fractions.
4. Discussion:
4.1. Aggregate distribution
Macroaggregates (> 2000 µm) from surface soils of NT were more abundant than
those of CT soils, and the situation was reversed for smaller aggregates in the surface
horizon. Several researchers found more macroaggregates in NT vs. CT soils (Beare et al.
1994a; Six et al. 2000; Bossuyt et al. 2002). Our results are similar to those obtained by
Beare et al. (1994a), Hendrix et al. (1998) and Collins (2001) in the same field site. Tillage
management changes soil conditions (aeration, temperature, moisture) and decomposition
rates of litter (Cambardella and Elliott 1992). In NT, residue accumulates at the surface

where litter decomposition rate is slowed due to drier conditions and reduced contact
between soil microorganisms and litter (Salinas-Garcia et al. 1997). A greater proportion of
the microbial biomass is composed of fungi, which contribute to macroaggregate formation
and stabilization (Tisdall and Oades 1982; Beare et al. 1992). In CT, subsurface soil is
brought to the surface and exposed to wet-dry, freeze-thaw cycles and raindrop impact
(Beare et al. 1994; Paustian et al. 1997).
Higher microbial activity (e.g., in CT soils) depletes SOM, which eventually leads to
decreased microbial biomass and activity and consequently a lower production of
microbial-derived binding agents and a loss of aggregation (Jastrow et al. 1996; Six et al.
1998). Six et al. (1999) developed a conceptual model of aggregate turnover that shows
the faster macroaggregate turnover in CT than in NT results in fewer macroaggregates
being maintained, and more free microaggregates being present in CT than in NT soils.
Our results (Fig. 1) support this model, with more macroaggregates existing in NT than in
CT and more microaggregates in CT than in NT (0-5 cm).
4.2. Carbon and Nitrogen concentrations
The total sand-free concentrations of aggregate C and N were up to 1.6 and 1.5
times greater in the surface layers of NT than in CT (Fig. 7). With aggregate disruption,
more organic substrates are made available for microbial attack, with ensuing increased
SOM decomposition, and hence a decrease in C content. Beare et al. (1994a), Dick et al.
(1997) and Six et al. (1999) also found higher C concentrations in surface samples of NT
compared to CT soils.
POM-associated C and N values were greater in NT than in CT in all aggregate size
classes in surface soils, and they were greater for larger than smaller aggregates (Fig. 8).

Thus aggregate formation and stabilization processes are directly related to the
decomposition of root-residue and the dynamics of POM C in the soil (Gale et al. 2000).
Beare et al. (1994a) noted that the differences in distributions of POM between depths in
NT and CT may be a function of biological activity near the soil surface, including fungi
(Doran, 1980), roots (Cheng et al. 1990) and soil fauna (Parmelee et al. 1990), that assist
in incorporating POM within macroaggregates and to increase their stability. Examining
surface soils in CT (Fig. 9) there were no significant differences in time for all of the larger
size classes, but there was a significantly different concentration of total C for aggregates
<53 µm, indicating that for CT and NT of this size class the C in this fraction is stabilized by
intimate associations with mineral particles. Gregorich et al. (1995) also found that the most
stable organic matter is associated with this small size fraction. For both depths the old C
associated with microaggregates may be physically protected, as was observed also by
Christensen (1992).
4.3. Carbon-13 concentrations and Carbon turnover
Carbon turnover for NT and CT soils was calculated over time, showing delta-13 C
values from 1997 onward (Fig. 10). We observed significant differences in time within
tillage method. Increased tillage intensity enhanced turnover of SOM and decreased soil
aggregation (Six et al., 1998). Because the average annual inputs of aboveground crop
plus weed residues to NT and CT are very similar in HSB (Beare et al. 1994a; this paper),
we attribute the differences in SOM content to differences in assimilation and
decomposition of SOM under both tillage treatments. However, in this study, total C was
reduced in NT plots for 2005 compared to previous years (Fig. 9), which was not the case
with CT. Perhaps there was an unusually large biomass of cotton that remained to

decompose after being cut. Therefore the woody tissue was incorporated into the soil faster
in CT than in NT.
The fraction of new C in the soil is a direct expression of carbon turnover (Table 1).
The similar values of new C in CT and NT suggest that the increase of C was proportional
in both tillage practices over time. Similar results were noted by Six et al. (1998). In lower
depths (5-15 cm) more new C was incorporated into new C for the larger aggregates of CT
vs. NT, again suggesting that new organic matter movement through the soil profile in CT.
More details on this study of delta 13C change in soil macro- and microaggregates are given
in Arce-Flores and Coleman (2007).
Our research shows considerably increased mean residence time of SOM under NT
vs. CT managements, similar to results measured by Paustian et al. (1997). Most of the
aggregate size fractions experienced faster turnover in CT than in NT in both surface and
deeper depths (Table 2). The turnover of aggregate-associated old C in microaggregates
was 27.08 y for NT and 26.12 for CT (0-5 cm) and was greater for the 5-15 cm depth (34.5
and 12 y) for NT and CT, respectively. In the deeper profile the microaggregates < 53 um in
both NT and CT had very little net input rate of new C. The measured turnover times for
micro- and macroaggregates are in accord with the aggregate hierarchy concept of Oades
and Waters (1991), and further demonstrate the mechanisms involved in the binding of
micro- vs. macroaggregates (Tisdall and Oades 1982).
The net input rate of C3 pathway OM to aggregates increased from micro- to
macroaggregates, which supports the concept that larger aggregates are bound together
initially by root exudates and exfoliates and mycorrhizal hyphae. As they senesce and
begin to undergo comminution, they are then incorporated into the intra-aggregate POM of

larger macroaggregates first (Jastrow et al. 1996). The roles of mycorrhizal mycelia and
their products are probably important in microaggregate formation, but little research has
been carried out on this phenomenon yet (Rillig and Mummey 2006). In earlier studies at
Horseshoe Bend, Bossuyt et al. (2002) measured more young C accumulated in the
subsurface soil of CT than in NT, but it was not stabilized over the long term. They found,
similar to our study, greater long-term stabilization of C in the surface layers of NT
compared to CT.
Because the total C concentration in the three different sampling times between
1997 and 2005 remained relatively constant suggests that old C associated with
microaggregates may be physically protected. As surface soils in CT are exposed to
variable abiotic conditions, these factors contribute to the more frequent disruption of soil
aggregates, releasing the aggregate protected SOM for mineralization (Beare et al. 1994b)
and also to a lower production of aggregate stabilizing agents (Angers et al. 1993).
5. Conclusions
Long-term studies of soil detrital food webs and the dynamics of soil organic matter
at Horseshoe Bend have been illustrative of several basic principles of ecology, and we feel
that it has grown and matured with the influence of Ben Stinner and his colleagues who
were so influential in establishing the studies nearly three decades ago.
References:
Angers, D.A., N. Bissonnette, A. Legere and N. Samson. 1993. Microbial and biochemical
changes induced by rotation and tillage in a soil under barley production. Can. J. Soil Sci. 73:
39-50.
Arce-Flores, S. and D.C. Coleman. 2007. Comparing water-stable aggregate distributions,
organic matter fractions and carbon turnover using 13C natural abundance in conventional
and no-tillage soils. Soil Biol. Biochem. (submitted).
Balesdent, J., A. Mariotti and B. Guillet. 1987. Natural 13C abundance as a tracer for soil
organic matter dynamics studies. Soil Biol. Biochem. 19: 25-30.
Balesdent, J. and M. Balabane. 1992. Maize root-derived soil organic carbon estimated by
natural 13C abundance. Soil Biol. Biochem. 24: 97-101.
Balesdent, J. and A. Mariotti. 1996. Measurement of soil organic matter turnover using 13C
natural abundance, In: T.W. Boutton, S.I. Yamasaki (Eds.), Mass Spectrometry of Soils,
Marcel Dekker, New York, pp. 83-111.
Balesdent, J., C. Chenu and M. Balabane. 2000. Relationship of soil organic matter
dynamics to physical protection and tillage, Soil Tillage Res. 53: 215-230.
Beare, M.H. and R.R. Bruce. 1993. A comparison of methods for measuring water-stable
aggregates: Implications for determining environmental effects on soil structure. Geoderma
56: 87-104.
Beare, M.H., R.W. Parmelee, P.F. Hendrix, W. Cheng, D.C. Coleman and D.A. Crossley, Jr.
1992. Microbial and faunal interactions and effects on litter nitrogen and decomposition in
agroecosystems, Ecol. Monogr. 62: 569-591.

Beare, M.H., P. F. Hendrix and D.C. Coleman, 1994a. Water-stable aggregates and organic
matter fractions in conventional and no-tillage soils, Soil Sci. Soc. Am. J. 58: 777-786.
Beare, M.H., M.L. Cabrera, P.F. Hendrix and D.C. Coleman. 1994b. Aggregate-protected
and unprotected pools of organic matter in conventional and no-tillage soils, Soil Sci. Soc.
Am. J. 58: 787-795.
Bossuyt, H., J. Six and P.F. Hendrix. 2002. Aggregate-protected carbon in no-tillage and
conventional tillage agroecosystems using carbon-14 labeled plant residue. Soil Sci. Soc.
Am. J. 66: 1965-1973.
Cambardella, C.A. and E.T. Elliott. 1992. Particulate organic matter across a grassland
cultivation sequence. Soil Sci. Soc. Am. J. 56: 777-783.
Cerri, C., C. Feller, J. Balesdent, R. Victoria and A. Plenecassagne, 1985. Application du
traçage isotopique naturel en 13C a l’etude de la dynamique de la matiére organique dans les
sols, Comptes Rendus Acad. Sci. Paris 300: 423-428.
Cheng, W., D.C. Coleman, and J.E. Box, Jr. 1990. Root dynamics, production and
distribution in agroecosystems on the Georgia Piedmont using minirhizotrons. J. Appl.
Ecol. 27:592-604.
Christensen, B.T. 1992. Physical fractionation of soil and organic matter in primary particle
size and density separates. Advances in Soil Science 20: 1-90.
Coleman, D. C., C. V. Cole and E. T. Elliott. 1984. Decomposition, organic matter turnover
and nutrient dynamics in agroecosystems. Pages 83-104 In: R. Lowrance, B. R. Stinner and
G. J. House (eds.) Agricultural ecosystems--unifying concepts. Wiley/Interscience. New
York.
Coleman, D.C., P.F. Hendrix, M.H. Beare, D.A. Crossley, Jr., S. Hu and P.C.J. van Vliet,
1994. The impacts of management and biota on nutrient dynamics and soil structure in sub-
tropical agroecosystems: impacts on detritus food webs, in: C.E. Pankhurst, B.M. Doube,
V.V.S.R. Gupta and P.R. Grace (Eds.), Soil Biota Management in Sustainable Farming
Systems, CSIRO, Melbourne, Australia, pp. 133-143.
Collins, K., H. Bossuyt and P. Hendrix, 2001. Tillage effects on carbon turnover in soil
organic matter fractions measured using 13C natural abundance, B.Sc. Thesis, University of
Georgia, Athens.
Denef, K., J. Six, R. Merckx and K. Paustian. 2004. Carbon sequestration in microaggregates
of no-tillage soils with different clay mineralogy. Soil Sci. Soc. Am. J. 68: 1935-1944.
Dick, W.A., W.M. Edwards and E.M. McCoy. 1997. Continuous application of no-tillage to
Ohio soils: Changes in crop yields and organic matter-related soil properties. p. 171-182 in E.
A. Paul et al. (ed.) Organic matter in temperate agroecosystems: Long-term experiments in
North America. CRC Press, Boca Raton, FL.
Doran, J.W. 1980. Soil microbial and biochemical changes associated with reduced tillage.
Soil Sci. Soc. Am. J. 44: 765-771.
Gale, W.J., C.A. Cambardella and T.B. Bailey. 2000. Root-derived carbon and the formation
and stabilization of aggregates. Soil Sci. Soc. Am. J. 64: 201-207.
Gregorich, E.G., B.H. Ellert and C.M. Monreal. 1995. Turnover of soil organic matter and
storage of corn residue carbon estimated from natural 13C abundance. Can. J. Soil Sci. 75:
161-167.

Hassink, J., A. P. Whitmore and J. Kubát. 1997. Size and density fractionation of soil organic
matter and the physical capacity of soils to protect organic matter, Eur. J. Agron. 7: 189-199.
Hendrix, P.F., A.J. Franzluebbers and D.V. McCracken, 1998. Management effects of carbon
accumulation and loss in soils on the southern Appalachian Piedmont of Georgia, USA, Soil
Tillage Res. 47: 245-251.
Hendrix, P. F., E.P. Odum, D. A. Crossley, Jr. and D. C. Coleman. 2001. Horseshoe Bend
Research: Old-field Studies (1965-1975) and Agroecosystem Studies (1976-2000). Pp.
164-177 in G.W. Barrett and T.L. Barrett (eds.), Holistic Ecology: The Evolution of the
Georgia Institute of Ecology (1940-2000). Taylor & Francis, New York.
Jastrow, J.D., T.W. Boutton and R. M. Miller. 1996. Carbon dynamics of aggregate-
associated organic matter estimated by Carbon-13 natural abundance. Soil Biol. Biochem.
28: 665-676.
Odum, E.P., S.E. Pomeroy, J.C. Dickinson, III and K. Hutcheson. 1974. The effect of late
winter litter burn on the composition, productivity and diversity of a 4-year old fallow-field in
Georgia, Proc. Ann. Tall Timbers Fire Ecol. Conf. 13: 399-415.
Oades, J.M., and A.G. Waters. 1991. Aggregate hierarchy in soils. Austral. J. Soil Res. 29:
926-928.
Parmelee, R. W., M.H. Beare, W. Cheng, P.F. Hendrix, S.J. Rider, D.A. Crossley, Jr. and
D. C. Coleman. 1990. Earthworms and enchytraeids in conventional and no-tillage
agroecosystems: A biocide approach to assess their role in organic matter breakdown. Biol.
Fertil. Soils 10:1-10.
Paustian, K., H.P. Collins and E.A. Paul. 1997. Management controls on soil carbon. In: E.A.
Paul et al., eds., Soil organic matter in temperate agroecosystems: Long-term experiments in
North America. Boca Raton, FL. CRC Press. Pp. 15-49.
Paustian, K., C.V. Cole, D. Sauerbeck and N. Sampson. 1998. CO2 mitigation by agriculture:
an overview. Climate Change 40: 135-162.
Rillig, M.C. and D.L. Mummey. 2006. Tansley Lecture. Mycorrhizas and soil structure. New
Phytologist 171: 41-53.
Salinas-Garcia, J.R., F.M. Hons and J.E. Matocha. 1997. Long-term effects of tillage and
fertilization on soil organic matter dynamics. Soil Sci. Soc. Am. J. 61: 152-159.
Schlesinger, W.H. 1997. Biogeochemistry: An analysis of global change. 2nd edn. Academic
Press, San Diego, CA.
Six, J., E.T. Elliott and K. Paustian. 1999. Aggregate and soil organic matter dynamics under
conventional and no-tillage systems, Soil Sci. Soc. Am. J. 63: 1350-1358.
Six, J., E.T. Elliott, and K. Paustian. 2000. Soil macroaggregate and soil microaggregate
formation: A mechanism for C sequestration under no-tillage agriculture. Soil Biol. Biochem.
32: 2099-2103.
Six, J., E.T. Elliott, K. Paustian and J.W. Doran. 1998. Aggregation and soil organic matter
accumulation in cultivated and native grass-land soils, Soil Sci. Soc. Am. J. 62: 1367-1377.
Skjemstad, J.O., R.P. LeFeuvre and R.E. Prebble. 1990. Turnover of soil organic matter
under pasture as determined by 13C natural abundance. Austral. J. Soil Res. 28: 267-276.
Tisdall, J.M. and J.M. Oades. 1982. Organic matter and water-stable aggregates in soils. J.
Soil Sci. 33: 141-163.

Yoder, R.E. 1936. A direct method of aggregate analysis of soils and a study of the
physical nature of erosion losses. J. Amer. Soc. Agric. 28: 337-351.

Figure Legends
Fig. 1. Above-ground biomass of crops measured during the fall at Horseshoe Bend.
Fig. 2. Effects of winter cover crop on crop biomass at Horseshoe Bend
Fig. 3. Yearly variation in the effects of tillage on crop biomass at Horseshoe Bend.
Fig. 4. Yearly variation in the effects of tillage on weed biomass at Horseshoe Bend.
Fig. 5. The effects of tillage on litter biomass at Horseshoe Bend
Fig. 6. Distribution of water-stable aggregates from conventional and no tillage soils at 0-5
(a) and 5-15 (b) depth. Bars are means ± S.E. Asterisks indicate significant differences
(P<0.05, Tukey's HSD) between tillage treatments within size class; n=32.
Fig. 7. Total C and N (g kg-1; normalized to a sand-free basis) in water-stable aggregates
from conventional and no tillage soils at 0-5 and 5-15 depth. Bars are means ± S.E.
Asterisks indicate significant differences (P<0.05, Tukey's HSD) between tillage treatments
within size class; n=32.
Fig. 8. Particulate Organic Matter-Associated Carbon and Nitrogen (g kg-1; normalized to a
sand-free basis) in water-stable aggregates from conventional and no tillage soils at 0-5
and 5-15 depth. Bars are means ± S.E. Asterisks indicate significant differences (P<0.05,
Tukey's HSD) between tillage treatments within size class; n=32.
Fig. 9. Total Carbon concentration in time for No Tillage and Conventional Tillage in
different depths (0-5 and 5-15 cm) and aggregate size fractions.
Fig. 10. 13C ratios of No tillage and Conventional Tillage in time in different depths (0-5 and
5-15 cm) and aggregate size fractions

Fall Crop Biomass
0
2000
4000
6000
8000
10000
12000
14000
corn cotton kenaf sorghum
Crop Species
Ab
ov
e-G
rou
nd
Bio
ma
ss
(K
g/h
a)
Figure 1.

Fall Crop Biomass
0.002000.004000.00
6000.008000.0010000.0012000.00
14000.0016000.00
corn cotton kenaf sorghum
Crop Species
Ab
ov
e-G
rou
nd
Bio
ma
ss
(k
g/h
a)
Clover
Rye
Figure 2.
Variation In Crop Biomass by Tillage, Year and Crop
0.00
5000.00
10000.00
15000.00
20000.00
25000.00
1984198719891990 19911992199319951996199719981999200120022003
Year
Ab
ove
-Gro
un
d B
iom
ass
(K
g/h
a)
CT
NT
Figure 3.

Weed Biomass by Tillage, Year & Crop
0.001000.002000.003000.004000.005000.006000.007000.00
sorghum
corn
corn
corn
corn
corn
kenaf
cotton
cotton
cotton
cotton
19911992199319951996199719981999200120022003
Year
Ab
ove-G
rou
nd
Bio
mass
(Kg
/ha)
CT
NT
Figure 4.

Fall Litter Biomass
0.00
2000.00
4000.00
6000.00
8000.00
10000.00
corn sorghum
Crop Plant
Lit
ter
Bio
ma
ss
(K
g/h
a)
CT
NT
Figure 5.
Water-stable aggregates Conventional vs No tillage (5-15 cm)
Water-stable aggregates (%
)
0
10
20
30
40
50
No TillageConventional Tillage
>2000 2000-250 250- 53 <53
*
*
*
aggregate size class (µm)
aggregate size class (µm)
Water-stable aggregates Conventional vs No tillage (0-5 cm)
Water-stable aggregates (%
)
0
10
20
30
40
50
60
70
No Tillage
Conventional Tillage
>2000 2000-250 250- 53 <53
*
*
*
*
Fig 6.
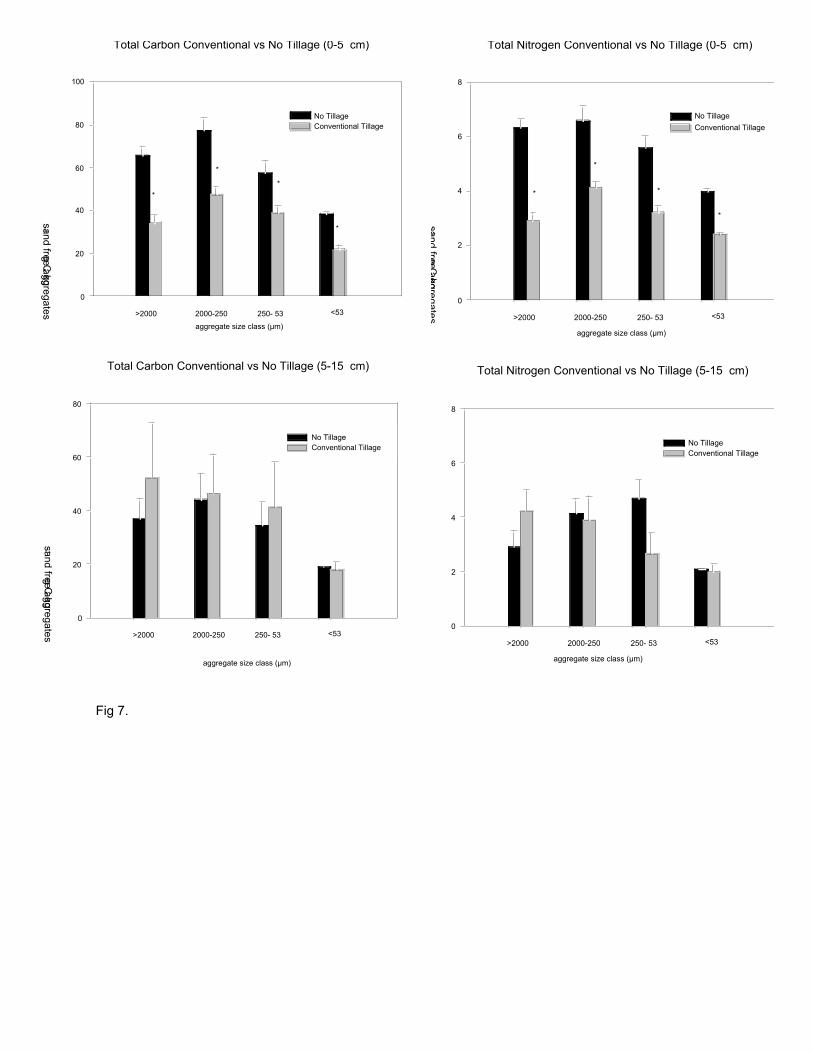
Fig 7.
Total Carbon Conventional vs No Tillage (0-5 cm)
g C kg
-1 sand free aggregates
0
20
40
60
80
100
No TillageConventional Tillage
>2000 2000-250 250- 53 <53
*
*
*
*
aggregate size class (µm)
Total Carbon Conventional vs No Tillage (5-15 cm)
g C kg
-1 sand free aggregates
0
20
40
60
80
No TillageConventional Tillage
>2000 2000-250 250- 53 <53
aggregate size class (µm)
aggregate size class (µm)
Total Nitrogen Conventional vs No Tillage (0-5 cm)
g C kg
-1 sand free aggregates
0
2
4
6
8
No Tillage
Conventional Tillage
>2000 2000-250 250- 53 <53
*
*
*
*
aggregate size class (µm)
Total Nitrogen Conventional vs No Tillage (5-15 cm)
g C kg
-1 sand free aggregates
0
2
4
6
8
No TillageConventional Tillage
>2000 2000-250 250- 53 <53

Fig 8.
POM associated Nitrogen Conventional vs No tillage(0-5 cm)
g C kg
-1 sand free aggregates
0
1
2
3
4
No TillageConventional Tillage
>2000 2000-250 250- 53 <53
*
*
N.A.
*
aggregate size class (µm)
POM associated Nitrogen Conventional vs No tillage(5-15 cm) g C
kg-1
sand free aggregates
0
1
2
3
4
No TillageConventional Tillage
>2000 2000-250 250- 53 <53
**
N.A.
aggregate size class (µm)
aggregate size classes (µm)
POM associated Carbon Conventional vs No tillage(0-5 cm)
g C kg
-1 sand free aggregates
0
10
20
30
40
50
No TillageConventional Tillage
>2000 2000-250 250- 53 <53
*
*
*
N.A.
aggregate size classes (µm)
POM associated Carbon Conventional vs No tillage (5-15 cm)
g C kg
-1 sand free aggregates
0
5
10
15
20
25
30
No TillageConventional Tillage
>2000 2000-250 250- 53 <53
*
N.A.
*

Fig. 9.
Total Carbon No Tillage ( 0-5 cm)
g C kg
-1 sand free aggregates
0
20
40
60
80
100
120
140
>2000 2000-250 250- 53 <53
a a
b
b
b
c c c
a
a a a
Total Carbon Conventional Tillage (0-5 cm)
19972000
2005
>2000 2000-250 250- 53 <53
*
Total Carbon Conventional Tillage (5-15 cm)
1997
20002005
>2000 2000-250 250- 53 <53
*
>2000 2000-250 250- 53 <53
a
b b
aggregate size classes (µm)
Total Carbon No Tillage (5-15 cm)
g C kg
-1 sand free aggregates
0
20
40
60
80

Fig 10.
1997
20002005
σ13C ratio Conventional Tillage 5-15 cm
> 2000 2000 - 250 250 - 53 <53
Αggregate size classes ( µm)
aa a
cc
c
d
d
d
b b
e
-28
-26
-24
-22
-20
σ13
C ratio No Tillage 5-15 cm
σ13
C ratio
> 2000 2000 - 250 250 - 53 <53
Αggregate size classes ( µm)
aa
a a ad
b
bc
c
d d
a
? ggregate size classes (?m)
???
C ratio
? ggregate size classes (?m)
19972000
2005
???
C ratio Conventional Tillage 0-5 cm??
> 2000 2000 - 250 250 - 53 <53
aa
aa
b
b
b b
c
c
c
b
? ??C ratio No Tillage 0-5 cm??
-26
-25
-24
-23
-22
-21
-20
> 2000 2000 - 250 250 - 53 <53
aa
aa
b
b
b
b
c
cc
b

Table 1. Fraction of new carbon in 2000 and 2005 compared to 1997 at two depths, 0-5
and 5-15 cm. at Horseshoe Bend, Athens, GA.
Aggregate size No Tillage (0-5 cm) Conventional Tillage ( 0-5 cm)
(µm) 2000 2005 2000 2005
>2000 0.18 0.40 0.18 0.43
2000-250 0.31 0.41 0.27 0.41
250-53 0.23 0.38 0.15 0.28
<53 0.19 0.25 0.10 0.13
No Tillage (5-15 cm) Conventional Tillage (5-15 cm)
2000 2005 2000 2005
>2000 0.07 0.43 0.07 0.77
2000-250 0.08 0.57 0.09 0.67
250-53 0.07 0.70 0.06 0.56
<53 0.07 0.04 0.30 0.001

Table 2. Average rate constant (k) for loss and turnover time (1/k) of the mixture of C4 and C3
Carbon and average net input rate of C3-C in aggregate size fractions at 0-5 and 5-15 cm.
depths as determined by 13C natural abundance.
No Tillage (0-5 cm) Conventional Tillage (0-5 cm)
Aggregate size k 1/ k Net input rate k 1/ k Net input rate
(µm) yr -1 yr g kg -1 fraction yr -1 yr -1 yr g kg -1 fraction yr -1
>2000 0.08 12.51 3.30 0.12 8.58 1.86
2000-250 0.10 10.25 3.98 0.10 10.43 2.42
250-53 0.12 8.66 2.74 0.10 10.49 1.36
<53 0.04 27.08 1.21 0.04 26.12 0.36
No Tillage (5-15 cm) Conventional Tillage (5-15 cm)
Aggregate size k 1/ k Net input rate k 1/ k Net input rate
(µm) yr -1 yr g kg -1 fraction yr -1 yr -1 yr g kg -1 fraction yr -1
>2000 0.06 15.89 2.00 0.13 7.49 5.03
2000-250 0.08 13.17 3.16 0.10 9.69 3.89
250-53 0.15 6.58 3.03 0.08 12.18 2.89
<53 0.03 34.50 0.10 0.08 12.01 0.001