long-haul low cost airlines: a new business model … valicek... · long-haul low cost airlines: a...
TRANSCRIPT

Long-haul low cost airlines: A new business modelacross the transatlantic and its cost characteristics∗
Christian Soyk, Jürgen Ringbeck and Stefan Spinler
Chair in Logistics Management, WHU - Otto Beisheim School of Management
May 4th, 2017
Abstract
Existing academic literature is inconclusive about characteristics and viability of the long-haullow cost airline businessmodel, whereas several airlines of this type are emerging. This articleaims to uncover its defining characteristics by clustering a sample of 37 transatlantic airlinesusing principal component and hierarchical cluster analyses along a newly constructedlong-haul airline business model framework. To contribute to the evaluation of businessmodel viability, cost advantages between clusters are analyzed subsequently followed by adiscussion of their sustainability. Key findings include the characterization of the emerginglong-haul LCC business model and its significant differences from existing legacy hub andleisure carrier models. On a cluster average, 30-34% lower unit costs were identified.
Keywords— Airlines, Business models, Long-haul, Low cost, Point-to-point
∗Draft manuscript. Please do not cite without the authors’ permission.
1

Transatlantic airline business models
1 IntroductionLow cost carriers (LCCs) such as Ryanair and Southwest Airlines have revolutionized short- andmedium-haul1 airline markets across the world since the 1990s. The validity of the businessmodel is proven practically through higher profitabilities (cf. Corbo, 2016). Additionally,many academic studies of short-/medium-haul LCCs were conducted, which agree on commonunderlying principles of the business model (cf. Fu et al., 2011; de Wit and Zuidberg, 2012; Choet al., 2015; Fageda et al., 2015; Fu et al., 2015).
Long-haul LCCs are a more recent phenomenon. Since the 2000s, carriers of this typehave emerged in the Asia-Pacific region, foremost AirAsia X in 2003 and Jetstar in 2007.Since 2015, this type of airline has emerged in the transatlantic market, for example Eurowingslong-haul, Norwegian long-haul, Westjet long-haul and Wow air. Existing academic literature isinconclusive about the economic viability and potential of long-haul LCCs. More fundamentally,there is no consistent definition of the actual business model. For example, the model is oftendescribed as the short-haul low cost model moving into the long-haul arena, whereas someauthors see these carriers as identical to already existing leisure carriers. Yet other authors statethat these carriers are doomed to fail or are very limited to certain routes.
To fill this gap in the literature, this paper aims to uncover the defining characteristicsof the long-haul LCC business model. To this end, we adapt and enhance an existing airlinebusiness model framework for long-haul operations. This framework builds the foundation forthe subsequent clustering of airlines using principal component and hierarchical cluster analyses.Furthermore, to contribute to the discussion on long-haul LCC business model viability, costdifferences are analyzed. To enable a comparison between business model clusters, system-wideunit costs are calculated and adjusted for differences in stage-length. Finally, the sources of costadvantages and their sustainability are discussed by analyzing unit cost differences in furtherdetail through a comparison of two exemplary carriers.
Besides the academic novelty, there is also practical relevance for this study. Managersare monitoring the contemporary long-haul LCC development closely, as the ignorance the ofshort-/medium-haul LCC development in the 1990s and 2000s has caused many legacy hubcarriers to become unprofitable or forced them to restructure. Policy makers, for example, need tobe aware if long-haul growth shifts away from primary to secondary airports to allocate resourcesand re-evaluate infrastructure policies early on.
The remainder of this paper is structured as follows: Section 2 reasons the focus on thetransatlantic market, Section 3 presents a review of previous studies on long-haul LCCs andairline business model frameworks. Section 4 introduces the adapted long-haul business modelframework and the airline sample used in this study. In Section 5, methods and results of theairline clustering are discussed. Subsequently, Section 6 discusses the defining characteristicsof the long-haul LCC business model. Section 7 provides insights from the cost benchmarkbetween airline clusters and discusses sustainability of cost advantages. Section 8 concludes thispaper and suggests further research.
1For the purpose of this paper, short- and medium-haul operations include flights with stage lengths up to4000km as defined by Eurocontrol (2005)
2

Transatlantic airline business models
2 The transatlantic airline marketWe are focusing on airlines from one region to ensure geographical comparability. The threereasons for the selection of the transatlantic market are detailed in this section. There are fourkey groups of transatlantic carriers commonly referred to: Airlines that are part of a joint venture(JV), airlines that are part of an alliance but not part of a JV, leisure carriers and fourth, thosenewly emerging LCCs of interest in this study.
One of three joint ventures was formed between Star Alliance members Air Canada, UnitedAirlines and the Lufthansa Group carriers Austrian Airlines, Brussels Airlines, Lufthansa, andSwiss. Another joint venture was created between the Sky Team members Air France, Alitalia,Delta Airlines, and KLM. The third joint venture was formed between One World membersAmerican Airlines, British Airways (including Paris-based carrier Open Skies), Finnair, andIberia. Transatlantic long-haul routes are the remaining key profit pool for these JV carriers.This profit pool has been maintained mainly through the oligopoly-like structure of the threelarge joint ventures (Francis et al., 2007). This remaining profit pool is a first key reason for theselection of the transatlantic market in this study.
Air Berlin and TAP are examples of carriers that are part of one of the three alliances butnot part of one of the JVs. These carriers benefit from alliance-wide code-sharing agreementsbut do not market their flights collectively as JV carriers. Leisure carriers such as TuiFly orThomas Cook serve some transatlantic routes with low frequencies and are focused on leisurepassengers, often as the subsidiaries of holiday package companies.
Since 2008 and 2009 respectively, the Open Skies agreements between the EuropeanUnion (EU) and the United States (US) and Canada (CA) allow any EU, US or CA airline tooperate commercial flights connecting any point between the relevant territories. These OpenSkies agreements significantly lowered barriers to entry (De Poret et al., 2015). Likely motivatedby this development, several new transatlantic long-haul carriers have emerged, for exampleEurowings long-haul, Norwegian long-haul, Westjet long-haul, and WOW Air. InternationalAirlines Group (IAG) and Air France/KLMGroup have announced the start of their own long-haullow cost subsidiaries. Interestingly, this long-haul low cost market is approached from differentdirections: Eurowings is a subsidiary of Lufthansa, an existing legacy carrier, while Norwegianis a traditional short-haul LCC entering the long-haul market. The recent liberalization of thismarket is the second key reason for the selection of this market for our studies.
Figure 1 depicts the transatlantic seat capacity (directional EU-US/CA) by carrier typeover the past four combined flight plan periods. It can be observed that the supply-side marketshare of the dominating joint venture carriers has declined from 77% in the combined summerand winter flight plan periods 2013/14 to 70% in 2016/17. Therefore, recently, non-JV carriershave grown at a significantly higher pace than the JV airlines. The strongest part of the growthhas come from the long-haul LCCs. These carriers only contributed 0.4M seats in 2013/14 butalready 2.3M in 2016/17, having gained market share significantly, from 1% to 5%. This recentshift in capacity share is the third reason for the selection of the transatlantic market in this study.
3 Literature reviewThis section begins with a review of previous studies that examined the phenomenon of long-haulLCCs. Subsequently, previous airline business model frameworks are summarized and comparedto identify the most suitable framework for adaptation for this long-haul analysis.
3

Transatlantic airline business models
Figure 1: Transatlantic seating capacity (westbound) along flight plan periods split by carriertype
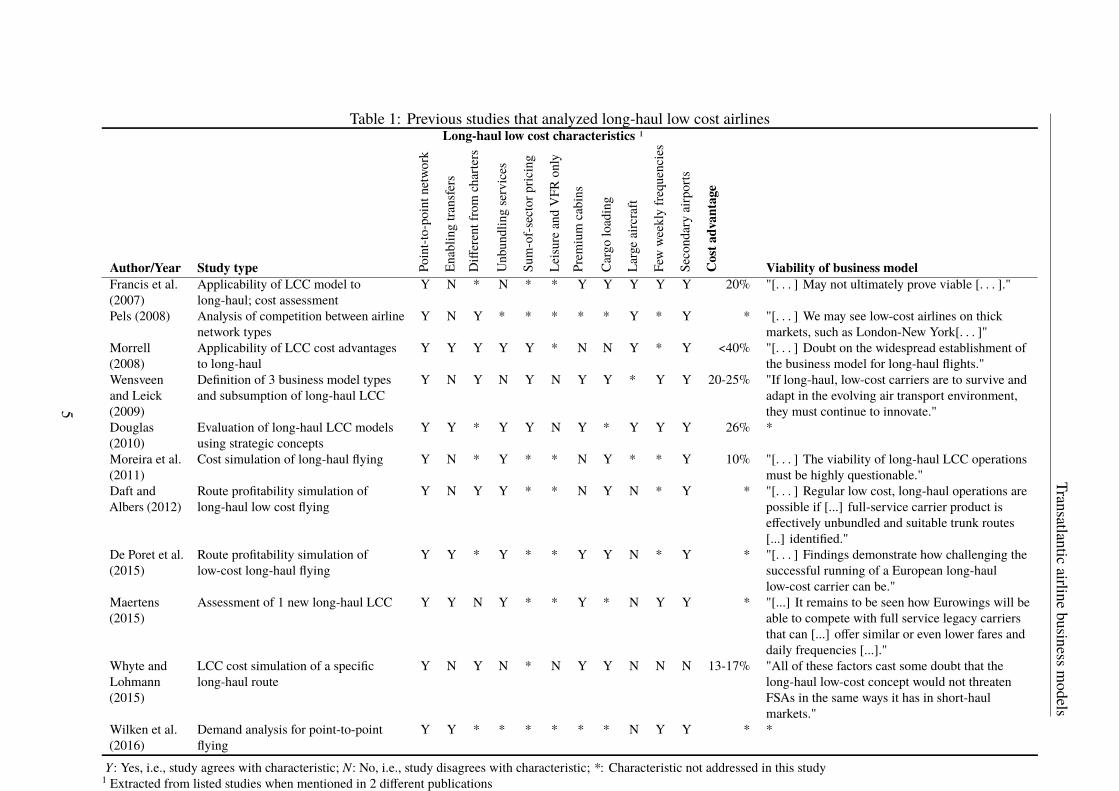
3.1 Previous studies on long-haul LCCsPrevious studies that addressed long-haul LCCs are listed in Table 1. To compare studies indetail, 11 characteristics that describe the long-haul LCC business model were extracted fromthe studies based on their appearance in at least two of the studies. Subsequently, each study wasassessed along the 11 characteristics, which will be discussed in more detail below.
Previous studies agreed on one common characteristic of long-haul LCCs regarding theflight network design: all studies describe a long-haul LCC model that operates a point-to-pointnetwork instead of a hub-and-spoke network as operated by hub carriers such as British Airwaysor United Airlines. Point-to-point airlines operate a more decentral network and focus on simpleoperations, whereas hub carriers schedule their flights in and out of their hub to enable passengersto connect between flights. Often 50-60% of the passengers on long-haul flights of hub carriersare connecting passengers, not starting and terminating their travel at the ends of the long-haulflight (Morrell, 2008).
Although only Morrell (2008), Wensveen and Leick (2009), and Douglas (2010) actuallymention pricing schemes for connecting flights of long-haul LCCs, all three expect the samesum-of-sector pricing concept. This type of pricing scheme for connecting flights simply adds theprices of two ormore flight legs to determine the overall fare for thewhole Origin-Destination (OD)journey. Another pricing scheme often applied by hub carriers determines prices individually foreach OD, more independent of the legs traveled. In that case, tickets are often priced at marginalcosts and well below the sum of the prices of the two individual flight legs (Wittmer et al., 2011,p.88). This pricing scheme becomes particularly challenging for the overall profitability when acarrier has a large share of connecting passengers priced at this marginal cost level (Tretheway,2004).
4
Transatlanticairline
businessmodels
Table 1: Previous studies that analyzed long-haul low cost airlinesLong-haul low cost characteristics 1
Author/Year Study type Point-to-pointn
etwork
Enablin
gtra
nsfers
Differentfrom
charters
Unbundlingservices
Sum-of-s
ectorp
ricing
Leisu
reandVFR
only
Prem
ium
cabins
Cargoloading
Largeaircraft
Fewweeklyfre
quencies
Secondaryairports
Cos
tadv
anta
ge
Viability of business modelFrancis et al.(2007)
Applicability of LCC model tolong-haul; cost assessment
Y N * N * * Y Y Y Y Y 20% "[. . . ] May not ultimately prove viable [. . . ]."
Pels (2008) Analysis of competition between airlinenetwork types
Y N Y * * * * * Y * Y * "[. . . ] We may see low-cost airlines on thickmarkets, such as London-New York[. . . ]"
Morrell(2008)
Applicability of LCC cost advantagesto long-haul
Y Y Y Y Y * N N Y * Y <40% "[. . . ] Doubt on the widespread establishment ofthe business model for long-haul flights."
Wensveenand Leick(2009)
Definition of 3 business model typesand subsumption of long-haul LCC
Y N Y N Y N Y Y * Y Y 20-25% "If long-haul, low-cost carriers are to survive andadapt in the evolving air transport environment,they must continue to innovate."
Douglas(2010)
Evaluation of long-haul LCC modelsusing strategic concepts
Y Y * Y Y N Y * Y Y Y 26% *
Moreira et al.(2011)
Cost simulation of long-haul flying Y N * Y * * N Y * * Y 10% "[. . . ] The viability of long-haul LCC operationsmust be highly questionable."
Daft andAlbers (2012)
Route profitability simulation oflong-haul low cost flying
Y N Y Y * * N Y N * Y * "[. . . ] Regular low cost, long-haul operations arepossible if [...] full-service carrier product iseffectively unbundled and suitable trunk routes[...] identified."
De Poret et al.(2015)
Route profitability simulation oflow-cost long-haul flying
Y Y * Y * * Y Y N * Y * "[. . . ] Findings demonstrate how challenging thesuccessful running of a European long-haullow-cost carrier can be."
Maertens(2015)
Assessment of 1 new long-haul LCC Y Y N Y * * Y * N Y Y * "[...] It remains to be seen how Eurowings will beable to compete with full service legacy carriersthat can [...] offer similar or even lower fares anddaily frequencies [...]."
Whyte andLohmann(2015)
LCC cost simulation of a specificlong-haul route
Y N Y N * N Y Y N N N 13-17% "All of these factors cast some doubt that thelong-haul low-cost concept would not threatenFSAs in the same ways it has in short-haulmarkets."
Wilken et al.(2016)
Demand analysis for point-to-pointflying
Y Y * * * * * * N Y Y * *
Y: Yes, i.e., study agrees with characteristic; N: No, i.e., study disagrees with characteristic; *: Characteristic not addressed in this study1 Extracted from listed studies when mentioned in 2 different publications
5

Transatlantic airline business models
Previous studies also agree on target passenger groups, although only three studies discussthis characteristic in particular. The three studies highlight that long-haul LCC models wouldnot only target leisure and Visiting Friends and Family (VFR) groups but also price-sensitivebusiness travelers.
The remaining 8 characteristics are not consistently described in previous academic studies.Starting with the enablement or facilitation of transfers, earlier studies such as Francis et al.(2007) point out the importance of hub feed for long-haul flights but clearly describe that along-haul LCC would not have any feed, except for self-connecting passengers. On the otherhand, De Poret et al. (2015), for example, conclude that a long-haul low cost operating model canbe successful on very thick routes or when sufficient feeder traffic can be found at either end ofthe route. They further state that transfer passengers from connecting hubs of short-haul LCCsmight be a viable option for this business model.
Regarding a differentiation of long-haul LCCs from charter airlines, Pels (2008), forexample, concludes that charter carriers would be different from long-haul LCCs as the formerrelies on tour operators to fill their aircraft whereas the latter carriers have to sell their own tickets.On the other hand, Maertens (2015) identifies major similarities between the business model ofEurowings long-haul and leisure operators. Whereas similarities to leisure carriers can certainlystill be a valid characteristic, Maertens (2015) has limited his study to Eurowings long-haul,potentially not being representative for all emerging transatlantic long-haul carriers.
Another characteristic of long-haul low cost flying mentioned in previous studies is theunbundling of services. Unbundling refers to a trend introduced by short-/medium-haul LCCswhere the ticket is sold separately from any add-ons such as luggage, a seat reservation, or foodand drink options. Francis et al. (2007) and Wensveen and Leick (2009) stated that cutting theseadd-on services on long-haul flights would be difficult and likely less accepted by passengers. Incontrast, more recent studies from De Poret et al. (2015) and Maertens (2015) see the absence offrills in the lowest ticket price as a key characteristic for the long-haul low cost model.
In terms of travel classes offered, Moreira et al. (2011) and Daft and Albers (2012) describelong-haul low cost as a single-class model with absence of any premium classes. More recentstudies from De Poret et al. (2015) and Maertens (2015) describe the model with a premiumclass.
The usage of cargo space is again discussed with various outcomes. Morrell (2008) expectsthat due to high density single-class economy seating and the associated luggage volume andweight, no additional cargo space/weight would be available. Daft and Albers (2012) specificallystate that additional cargo load could be the decisive factor for profitable operations when loadfactors are low.
Particularly earlier studies from Francis et al. (2007), Pels (2008), Morrell (2008), andDouglas (2010) find that very large aircraft such as the Airbus A380 would be required to achievesignificant unit cost advantages over other carriers and are thus aircraft of choice for long-haulLCCs. More recent studies from Daft and Albers (2012), De Poret et al. (2015), Maertens(2015), and Wilken et al. (2016) identified smaller, efficient aircraft as a key characteristic for thisbusiness model, as it would be difficult to find sufficiently large markets to fill single-class AirbusA380. Wilken et al. (2016) even expects that smaller 200 seat single-aisle long-haul aircraft suchas the Airbus A321LR would be better suitable for long-haul point-to-point flying.
Except for Whyte and Lohmann (2015), all studies agree that long-haul point-to-pointflying would result in only few weekly frequencies being offered per destination, much less thanthe daily operations of hub carriers on most long-haul routes. The driver for this would be thelower point-to-point demand due to absence of feeder traffic and/or the usage of large aircraft.
6
Transatlantic airline business models
Most studies describe usage of secondary airports as a characteristic of long-haul low costflying, albeit to different extends. For example, Francis et al. (2007) believe the secondary airportstrategy to be less effective due to the absence of facilities required for long-haul flying. Whyteand Lohmann (2015) state that long-haul LCCs will require major airports for passengers to beable to self-connect from other flights.
Summarizing this review, we formulate the following key insight:
Insight 1: There is no common definition of the long-haul LCC business model inacademic literature and elements of this model are often described with oppositecharacteristics.
In this study, we aim to clearly define the long-haul LCC business model. We can alsoobserve a simultaneous emergence of several transatlantic carriers as described in Section 2.All emerging carriers refer to themselves as long-haul LCCs. Based on these observations, wehypothesize the following:
Hypothesis 1: Transatlantic long-haul LCCs have a similar business model amongeach other and are significantly different from other long-haul carriers, thus,forming a new business model cluster in themselves.
It is clearly difficult to review business model viability if there is no common definition ofthe model itself. However, we attempted to summarize previous evaluations in Table 1 by quotingthe critical sentences of the respective articles. Whereas, for example, Francis et al. (2007) andMoreira et al. (2011) state that the success of long-haul LCC operations is questionable, others,e.g. Pels (2008) and Daft and Albers (2012), believe that the model could work if sufficientdemand can be gathered.
As for the short-/medium-haul LCCs, the potential success of long-haul LCCs is likelycorrelated with their ability to lower their operating costs significantly compared to theircompetitors. Previous studies estimate potential savings between 10% (Moreira et al., 2011) and40% (Morrell, 2008). Summarizing the previous studies, we can derive the following insight:
Insight 2: There is no consistent view in academic literature on long-haul LCCbusiness model viability, driven by different estimates around potential costadvantages.
We thus aim to further analyze the actual cost differences between the emerging long-haullow cost and other carriers, leveraging the findings and definitions of the first part of this study.Again, given the recent emergence and growth of these long-haul LCCs as outlined in Section 2,we believe that there must be a significant cost advantage for the carriers to operate profitable:
Hypothesis 2: Transatlantic long-haul LCCs have a significant cost advantageover other transatlantic carriers.
7

Transatlantic airline business models
3.2 Previous studies on airline business model frameworksResearch on business models has become an important aspect for both academia and managementwith the purpose to accurately describe a company’s value generation system with a manageablenumber of components. In this study, we aim to structurally analyze different airlines using thisbusiness model approach. We intend to adjust and extend existing airline business model frame-works. We will thus review existing industry-specific frameworks in this section. Furthermore,we will also relate these frameworks to the latest research on industry-unspecific business modelresearch.
Wirtz et al. (2016) summarizes the current state of general, industry-unspecific, researchon business models and provides a framework summarizing the findings of previous studies.Figure 2 depicts this framework with strategic components Strategy, Resources, and Cooperation,market components Customer,Market offer, Revenue, and operations componentsManufacturing,Procurement, and Financial. Underlying elements of each component are summarized beneaththe component name within each of the boxes.2
Figure 2: Components and underlying elements of the industry-unspecific business modelframework, adapted from Wirtz et al. (2016)
From an industry-specific perspective, two airline business model frameworks havebeen developed and applied or enhanced several times, as indicated in Table 2. Mason andMorrison (2008) developed the Product and organizational architecture framework, which wasenhanced later by Lohmann and Koo (2013) and Jean and Lohmann (2016). This frameworkdifferentiates between the product and organizational architecture of an airline. The productaspect contains service quality elements that relate the product to consumer preferences, namelyconnectivity, convenience, and comfort. The organizational architecture describes the verticalstructure, production and distribution/sales elements.Mason and Morrison (2008) The secondkey airline-related framework stems from Daft and Albers (2013) and was applied and enhanced
2To harmonize nomenclature from different authors, this work describes over-arching dimensions of theframework as components and underlying, more descriptive dimensions as elements. Individual variables withinthese elements are referred to as items.
8

Transatlantic airline business models
by Daft and Albers (2015). It differentiates between corporate core logic, configuration of valuechain activities, and assets.
Table 2: Previous studies on airline business model frameworksAuthor/Year Study type Elements Items ApplicationMason andMorrison(2008)
Development of businessmodel framework forcomparison of low costairlines
12: Profitability, Cost driver, Revenue,Connectivity, Convenience, Comfort,Distribution/sales, Aircraft, Labour,Airports attractiveness; Marketstructure
37 6 Europeancarriers
Daft and Albers(2013)
Development offramework for measuringconvergence of airlinebusiness models
7: Internal policy choices, externalvalue network, inbound, production,marketing, tangible assets, intangibleassets
40 5 Germancarriers
Lohmann andKoo (2013)
Examination of airlinebusiness model spectrum
6: Revenue, connectivity, convenience,comfort, aircraft, and labor
20 9 UScarriers
Daft and Albers(2015)
Empirical analysis ofairline business modelconvergence
8: Basic offering, Internal policychoices, external value network,inbound activities, production,marketing activities, tangible assets,intangible assets
36 26 Europeancarriers
Pereira andCaetano (2015)
Meta-study categorizingexisting airline businessmodel frameworks
N/A N/A N/A
Corbo (2016) Examination of hybridbusiness modelsestablished betweenLCCs and hub carriers
6: Network, revenue streams,distribution channels, alliances andpartnerships, fleet structure, valueproposition
10 6 UScarriers, 6Europeancarriers(separately)
Jean andLohmann(2016)
Analysis of externaleffects on airlinebusiness model changesover time
6: Revenue, connectivity, convenience,comfort, aircraft, and labor
22 8 UScarriers
For this study, we have selected and adapted an existing airline-specific business modelframework based on the self-imposed requirement to cover the business model aspects mostcomprehensively. To evaluate which of the existing frameworks are closest to the industry-unspecific framework, we allocated elements from Mason and Morrison (2008) and Daft andAlbers (2015) to the components of the integrated business model framework of Wirtz et al.(2016). As a result, the framework of Daft and Albers (2015) was chosen as it covers allcomponents from the industry-unspecific framework from Wirtz et al. (2016). The frameworkof Mason and Morrison (2008), although still very broad, did not fully cover cooperation,manufacturing, and procurement components.3
Table 2 further displays the application of the respective airline-specific frameworks. Allprevious studies were applied to airline samples on one continent. Thus, the selected frameworkhad to be adapted for application to long-haul operations. This adaptation will be detailed in thenext section.
3Table A.1 in the appendix provides the detailed allocation of the relevant airline-specific elements to those ofthe industry-unspecific components and elements.
9

Transatlanticairline
businessmodels
Table 3: Long-haul airline business model framework
Component1 Element2 Item2 Scale2 Explanation Data Source3 #Strategy Type of air
productNetworkconnectivity(long-haul)
# of potential intra-airlineconnections per long-haularrival
Count of same airline departures between 30-180minutes after long-haul arrival. Averaged acrossall transatlantic arrivals.
Diio LLC (2016) 1
Geographic focus Networkconcentration(long-haul)
# of long-haul flights / # oforigin airports
Origin airports are all long-haul airports oncontinent where airline is registered.
Diio LLC (2016) 2
Resources Fleet structure Fleetinhomogeneity(long-haul)
# of different aircraft typesserving transatlanticmarket
Different sizes of one type counted individually,e.g. B787-8/B787-9 counted as two types.
Diio LLC (2016) 3
Aircraft size(long-haul)
Aircraft cabin area (m2)averaged by # of flights
Cabin area determined by aircraft type. Weightedby # of transatlantic flights per aircraft type.
Diio LLC (2016),http://airbus.com,http://boeing.com
4
Cooperation Inter-organizationalrelationships
Cooperationintensity
(0: Interlining only, 1:Code-sharing, 2: Part ofglobal alliance, 3: Part ofjoint venture)
Cooperation analysis based on the transatlanticmarket.
Airline websites 5
Customer Targetproduct-marketcombination
Premium passengerfocus (long-haul)
# of premium seats / total# of seats
Seats counted as premium if different seat productother than economy seat installed.
Diio LLC (2016);Airline websites
6
Focus on recurringpassengers
[0: No Frequent FlyerProgram (FFP) available,1: FFP available]
FFPs target regular fliers, mainly business travelers.The availability of FFPs is seen as an indicationthat the airline targets this traveler group.
Airline websites 7
Focus on leisurepassengers
[0: Airline is subsidiary ofholiday package company,1: Airline is no subsidiaryof holiday packagecompany]
Holiday package companies often have their ownairline subsidiary focused on bringing packageholiday passengers to their destinations.Individually offered flights are less important.
Airline annualreports, latestavailable in 08’2016
8
Distribution Use of GDS [0: No, 1: Yes] Any use of a global GDS (Global distributionsystem).
Airline websites 9
Market offer Service product Service quality Skytrax rating (# of stars) Skytrax overall service rating using a scale from 1to 5.
Airlineequality.com 10
10

Transatlanticairline
businessmodels
Table 3: Long-haul airline business model framework
Component1 Element2 Item2 Scale2 Explanation Data Source3 #Revenue Fare structure One-way fare
availability(long-haul)
(0: No discounted fares, 1:100% of discounted returnfare, 2: 50% ofdiscounted return fare)
No discounted fares: One-way equals one-way flexfare. Determined by comparing one-way andreturn prices on 3 routes per carrier.
Airline websites 11
Bundling concepton-board(long-haul)
[0: Nothing included, 1:Food and drinks included]
Services included in lowest base fare. Airline websites 12
Bundling conceptother amenities(long-haul)
(0: Nothing included, 1:Seat reservation included,2: Bag included, 3: Seatreservation and bagincluded)
Services included in lowest base fare. Scaledeveloped by incurred cost for carrier: Bagincluded rated higher, as bag handling incurshigher costs for carrier than seat reservation.
Airline websites 13
Manufactur-ing
Route network Flight frequencies(long-haul)
# of weekly flights / # ofcity-pairs
Diio LLC (2016) 14
Transfer pricingcomplexity
(0: No bundledconnecting flights offered,1: Sum-of-sector pricing,2: OD pricing)
Focus of the airline on transfer passengers withinthe network: Discounted OD fares increasetransfer passenger volume. Determined bycomparing transfer connection fares with the sumof the individual fares of the flight legs. Tested on3 routes per carrier.
Airline websites 15
Airport sizes(long-haul)
% of flights served fromhub airports
A hub airport was defined with >100,000long-haul seats / month (outgoing). Airport notseen as hub if larger airport in the IATA metroregion.
Diio LLC (2016) 16
Procurement Supplymanagement
Fleet age(long-haul)
Average age (# of years) oflong-haul fleet
Age of aircraft since first date of delivery frommanufacturer.
http://airfleets.net 17
Financial Financemanagement,infrastructure
Excluded from analysis due to limited data availability across sample.
1According to industry-unspecific framework as depicted in Figure 2 2Adapted for long-haul from Daft and Albers (2015) or newly defined3 All data bases and websites accessed in 09’2016
11

Transatlantic airline business models
4 Long-haul airline business model framework and airlinesample
The selected business model framework from Daft and Albers (2015) had to be adjusted forthe application to long-haul carriers. We removed, adjusted, and added items and scales butensured that elements continue to be represented by their respective subordinated items. Table3 summarizes the full business model framework used in this study, including the 17 items,respective scales, further explanation and data sources. Components are named according tothe industry-unspecific framework from Wirtz et al. (2016), elements, items and scales areadapted from Daft and Albers (2015). The financial component was not covered in this study, asrelevant data was not available across the full airline sample. However, characteristics of thisfinancial component are also reflected through other components, e.g. the fleet structure or supplymanagement. Items that are specifically measuring long-haul relevant aspects of an airline, aremarked accordingly with the supplement long-haul.
There are three types of scales used in this framework. Continuous scales measure theconcrete metric impact of an item. This type of scale is indicated in Table 3 with a # or %sign. For example, fleet inhomogeneity is measured using the number of different aircraft types.The second type are dichotomous ordinal scales, which are indicated with box brackets []. Forexample, the availability of a frequent flyer program is measured with either 0 or 1, indicatingwhether or not a program is available. The third type are non-dichotomous ordinal scales, wherethere are more than two options to choose from. Values are ordered in an ascending way andonly one value can be chosen. These scales are marked using round brackets (). For example,cooperation intensity is measured in this way, where 0 represents the lowest value, interliningonly, and 3 the highest value, the airline is part of a joint venture. In this case, being part of a jointventure is rated higher than being part of an alliance or code-sharing, which indeed is a moreintensive way of cooperating between airlines. Another important example is the measurement oflong-haul one-way fare availability. A rating of 0 highlights that no one-way fares are available,and 2, the highest rating, actually represents the highest value for this item, i.e., the one-way fareis priced at about 50% of the return fare.
Table 4: Filter applied to determine relevant airline sampleCriteria Reasoning Comment(1) All passenger airlines flyingtransatlantic betweenUS/CA1and Europe (EU282,CH1, IS1, NO1)
All sizable transatlanticmarkets need to beincluded.
Airline subdivisions with identical marketingcarrier but different brands were analyzedseparately, e.g. British Airways Open Skieswas analyzed separately, while SwissEdelweiss Air was not.
(2) All airlines operating > 10frequencies per month (total alldestinations)
Excluding irrelevantairlines to increasecomparability.
Operating ≤ 10 frequencies per monthequivalent to max. 1 long-haul aircraft.
(3) All airlines headquartered inmarkets from (1)
Excluding airlines flyingunder 6th or 7th freedom.
Carriers are shaped by their home market.Evaluation in the transatlantic spectrum coulddistort the results.
(4) Excluding particular carriers Excluding carriers thatcannot be compared.
La Compagnie, FR2 operates fewbusiness-class only flights and was excluded.
1 Referring to ISO 3166-1 alpha-2 letter country codes2 EU28: European Union comprising 28 member states (as of 2015)
Airlines analyzed in this paper were selected along four criteria, as summarized in Table 4.First, all passenger airlines that are marketing flights between US, Canada and the key European
12

Transatlantic airline business models
markets were selected. Key European markets were defined as countries, where an Open Skiesagreement is in place, i.e. EU28 member states plus Iceland (IS), Norway (NO), Switzerland(CH)). Hereby, flights operated by a subdivision of an airline or by a third party using identicalmarketing carrier codes were analyzed as separate carriers only when flights are marketed anddistributed as different brands, e.g. Air Canada Rouge and British Airways Open Skies wereanalyzed separately, while Lufthansa Cityline and Swiss Edelweiss Air were not. Second, ofthis sample, only airlines operating at least 10 transatlantic frequencies per month (total for alldestinations) were selected, as airlines with less frequencies were thought to be irrelevant forthis analysis. Third, airlines that do not originate in one of the above mentioned countries wereremoved from the sample to exclude 6th and 7th freedoms flights4 not of interest in this study.And fourth, very particular airlines not comparable to any other carrier were excluded.
Table 5: Airline sample selected for analysisCarrier Carrier Name Country of Origin AllianceAA American Airlines United States OneWorldAB Air Berlin Germany OneWorldAC Air Canada Canada StarAllianceAC/RV Air Canada Rouge Canada StarAllianceAF Air France France SkyTeamAY Finnair Finland OneWorldAZ Alitalia Italy SkyTeamBA British Airways United Kingdom OneWorldBA/EC Open Skies France OneWorldBY Thomson Airways United Kingdom noneDE Condor Germany noneDL Delta Air Lines United States SkyTeamDY Norwegian Air Shuttle Norway noneEI Aer Lingus Ireland noneEW Eurowings Germany noneFI Icelandair Iceland noneIB Iberia Spain OneWorldIG Meridiana fly Italy noneKL KLM Royal Dutch Airlines Netherlands SkyTeamLH Lufthansa Germany StarAllianceLO LOT Polish Airlines Poland StarAllianceLX SWISS Switzerland StarAllianceMT Thomas Cook Airlines U.K. United Kingdom noneOR TUIfly Netherlands Netherlands noneOS Austrian Airlines Austria StarAllianceS4 SATA International Portugal noneSE XL Airways France France noneSK Scandinavian Airlines System Sweden StarAllianceSN Brussels Airlines Belgium StarAllianceSS CORSAIR France noneTP TAP Portugal Portugal StarAllianceTS Air Transat Canada noneUA United Airlines United States StarAllianceUX Air Europa Spain SkyTeamVS Virgin Atlantic Airways United Kingdom noneWS Westjet Canada noneWW WOW Air Iceland none
46th and 7th freedom flights are flights that are operated between two countries by a carrier that is notheadquartered in either the origin or the destination country of the particular flight.
13

Transatlantic airline business models
Table 5 lists the resulting airline sample of 37 airlines. Both airline selection and subsequentanalysis were based on the flight scheduling data base Diio LLC (2016) using data from August2016. August data was selected since it is the month (together with July) with highest transatlantictraffic volume, driven in part by leisure carriers. Since the target of this study was to arrive at amost comprehensive overview, we decided for the month with the strongest volume across allcarriers, including leisure airlines.
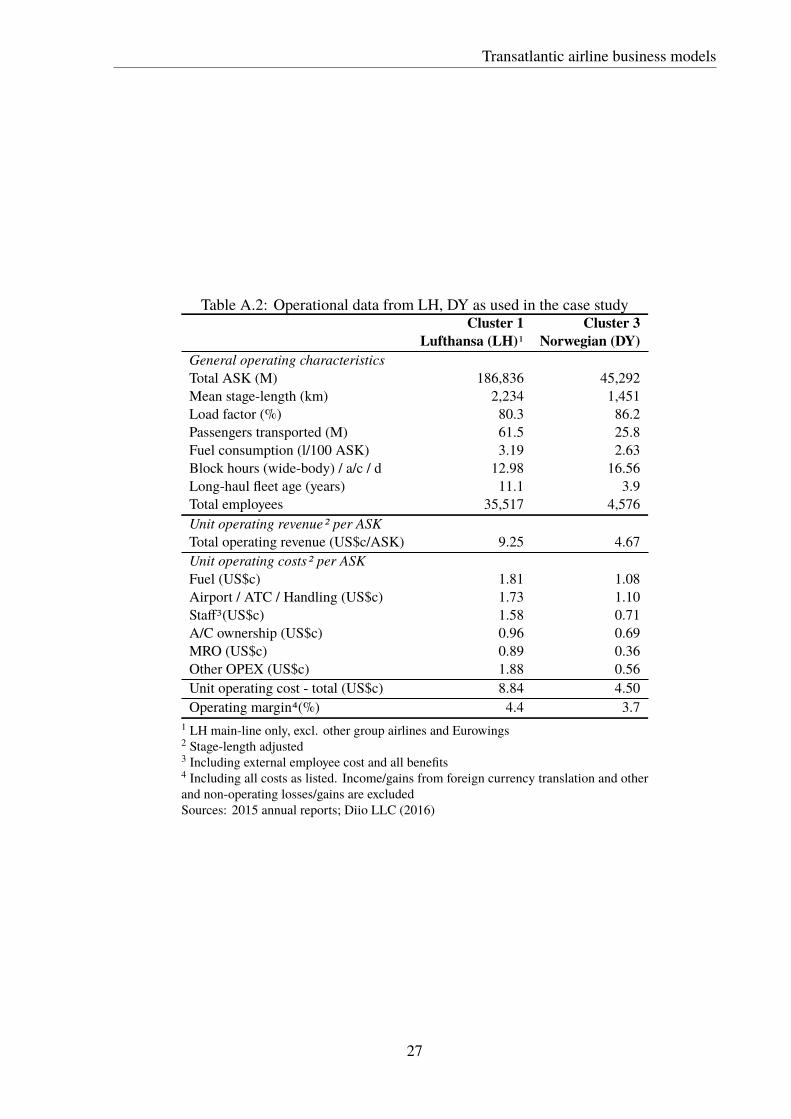
5 Determining business model clustersTo validate Hypothesis 1, i.e., newly emerging long-haul LCCs exhibit a similar business modelamong each other and are significantly different from other long-haul models, we performedprincipal component analysis (PCA) and hierarchical cluster analysis.
In transportation research, PCA has been used to interpret data sets with a large numberof interrelated variables (see, for example Hansen et al. (2000) and Brons et al. (2009)). PCAreduces the dimensionality of the original data to a set of factors, which together account for asmuch variation of the original data set as possible. The factors are created by finding eigenvectorsof the correlation matrix. Variables from the original data set with the highest correlation tothe principal component factors are defined as loading variables. Data points with a strongcorrelation to one of the principal components generally have a strong correlation with theloading variables as well. (Jolliffe, 2002)
Hierarchical clustering analysis is a commonly applied cluster method in transportationresearch (see, for example, Sarkis and Talluri (2004) and Cabral and Ramos (2014)). This methodinitially places each data observation into its own cluster. Subsequently, two clusters with highestproximity are merged at each step. As a measure of proximity we used the average linkagealgorithm.5 Both PCA and cluster analysis were executed on a PC version of SPSS.
We combined PCA and hierarchical cluster analysis due to several reasons: PCA simplifiesthe ample number of variables within the business model framework by identifying the mostrelevant items that load the principal components. Through this, individual items driving thedifferentiation of clusters can be interpreted, which was seen as an essential part of this study.The visualization of clusters along the principal components provides guidance for the potentialnumber of clusters. On the other hand, through the reduction of variables onto few principalcomponents, part of the variation of the variables is removed. Thus, for the final cluster definitionwe applied hierarchical cluster analysis to the original data set. At the same time, the applicationof two different methodologies to the original data adds credibility to the results.
16 out of 17 variables from the framework defined in Section 4 are used in both methods.Variable # 9 was excluded as all airlines in the sample were using global distribution systems(GDS), thus this variable did not contain any variance. We used data from 37 airlines as definedin Section 4.
Two principal components were selected based on Cattell’s scree plot criterion (Jolliffe,2002). The scree plot can be observed in Figure B.1. The two first Eigenvalues explained 55.5%of the total variation. Oblimin factor rotation was applied subsequent to the initial identificationof factors to achieve simpler and more interpretable factors. The factor score of the individualitems can be obtained from Table 6.
Figure 3 depicts the loadings of principal components 1 (PC1) and 2 (PC2) with the
5The average linkage algorithm defines the proximity between two clusters as the average distance between allpossible pairs of items within any two clusters.
14

Transatlantic airline business models
Table 6: Rotated factor loadings of PCAItems Factor 1 Factor 2
1 Network connectivity 0.847 -0.0172 Network concentration 0.687 0.0633 Fleet inhomogeneity 0.622 0.1004 Aircraft size 0.524 -0.1055 Cooperation intensity 0.840 0.2256 Premium passenger focus 0.547 0.1517 Focus on recurring passengers 0.576 -0.3128 Focus on leisure passengers -0.737 0.34010 Service quality 0.573 0.14911 One-way fare availability -0.823 -0.17512 Bundling concept on-board 0.112 0.89213 Bundling concept other amenities 0.386 0.71414 Flight frequencies 0.816 0.11615 Transfer pricing complexity 0.685 -0.09716 Airport sizes 0.585 0.18217 Fleet age -0.031 0.716Significant items with factor loading of > ‖0.5‖ are marked inboldOblimin factor rotation was appliedItem #9 was excluded as reasoned in Section 5
analyzed 16 items. Since all items correlate with one of the PCs with a value higher than 0.5, weretained all 16 variables in the plot.
Figure 3: Factor loadings of principal components
PC1 is positively loaded with cooperation intensity, network connectivity, flight fre-quencies, network concentration, transfer pricing complexity, airport sizes, service quality,fleet inhomogeneity, premium passenger focus, and focus on recurring passengers. Negativecorrelation exists with focus on leisure passengers and one-way fare availability. We have thusnamed PC1 component characteristics in positive direction with central network, hubbing, and
15

Transatlantic airline business models
focus on premium and recurring passengers. Negative PC1 component characteristics were bestdescribed with decentral network, no hubbing, and focus on leisure passengers.
PC2 is positively loaded with increasing fleet age and higher service levels in lowest long-haul fare classes, both on-board and pre-/post flight. We thus called the positive characteristicsof PC2 services included and old fleet. The negative characteristics of PC2 were described withno services included and new fleet.
Figure 4 visualizes the scoring of the airlines within the sample along the principalcomponents PC1 and PC2. Three groups of carriers can be identified based on the visualproximity of certain airlines in the data plot along the principal components. A first group ofairlines is located in the top right quadrant. These airlines generally have a more central network,focus on connectivity and premium passengers. A second group of airlines can be located in thetop left quadrant. According to the principal components, these airlines operate a less centralnetwork with low connectivity and simple pricing but have similar service and fleet age levels ascluster 1 airlines. The third cluster of airlines is located in the lower bottom half of the diagram.In terms of network centrality, connectivity and premium focus, this group of carriers is locatedin between groups one and two. These airlines offer significantly lower service levels in thelowest fare and operate newer aircraft fleet. This group contains airlines DY, EW, WW, and WS,which have recently started with transatlantic long-haul operations.
Figure 4: Principal component factor scores including cluster allocation determined by hierarchicalclustering method. Airline letter codes according to Table 5.
To determine whether these visual groupings of carriers can be referred to as clusters,a hierarchical cluster analysis was conducted using the original data set of the 16 variables,normalized between 0 and 1. The dendogram displaying the hierarchical connections betweengroups and the formation of clusters is shown in Figure B.2. We chose three clusters based onthe visual observations from the PCA factor score plot. The allocation of airlines to these threeclusters through the hierarchical clustering method can also be observed in Figure 4: The type ofmarker represents the cluster into which the airline was allocated based on hierarchical clusteranalysis.
16

Transatlantic airline business models
One difference between the plot of the PC factor scores and the results of the hierarchicalclustering can be observed. Whereas from a visual point-of-view, IG and S4 would be counted aspart of the second cluster, hierarchical clustering analysis allocated the two carriers into clusterone. This can be explained as both IG and S4 have incorporated leisure-like characteristics butare also operating a rather central hub network. For this case, we have decided to select theresults of the hierarchical clustering method as our final allocation, as the PCA factor scores donot reflect the total variance of the data set, whereas the hierarchical clustering method has beenapplied to the original data set, reflecting the full variance of the data.
Based on hierarchical cluster analysis and the results of PCA, we named cluster oneairlines Legacy hub, as it contains carriers such as Lufthansa, Air France, and American Airlines.Cluster two was named Leisure, as it contains leisure or charter carriers such as Thomas Cookand Air Transat. Cluster three was named No frills point-to-point, as it contains the new long-haulcarrier types that differentiate through their focus on a point-to-point network and the exclusionof frills or services in the lowest ticket fare. From now on, we will refer to no frills point-to-pointcarrier instead of long-haul LCCs, as we believe it better reflects the business model.
When revisiting Hypothesis 1 formulated in Section 3, we believe we have confirmed thethesis that newly emerging transatlantic long-haul carriers have a similar business model amongthemselves, significantly different from other leisure or hub models.
6 Characteristics of the long-haul no frills point-to-point car-riers
Table 7 summarizes mean values by airline cluster for the 16 (out of 17) analyzed variables.Prior to this, all variables were normalized between 0 and 1 with lowest and highest values,respectively. The statistical significance of differences between clusters has been tested withthe non-parametric Kruskal-Wallis H-test. Except for aircraft size and fleet inhomogeneity, theNull-Hypothesis that there is no significant difference between at least two out of three clustershas been rejected at the 5% level for all other items. For fleet inhomogeneity, the Null-Hypothesisis rejected at the 10% level.
In the following, we will discuss differences between airline clusters along the componentsand elements as defined in the business model framework in Table 3.
Strategy, resources, and cooperation
Items network connectivity and network concentration describe the network strategy of theairlines. Network connectivity measures how many potential connections before or after ascheduled long-haul flight departure or arrival, respectively, can be counted on average acrossthe whole network. As expected, this value is highest for legacy hub carriers. The value islowest for leisure carriers. No frills point-to-point carriers lie in between the two other businessmodel clusters. No frills point-to-point carriers offer more connections to long-haul flightsleveraging their short-haul network, enabling passengers to connect. This is a clear and importantdifferentiation to the existing leisure business model.
Network concentration is a measurement of how centralized the network of an airline is.Our analysis shows that it is highest for cluster one (i.e., legacy hub) carriers. This was expectedsince a concentrated network is the foundation of any hub carrier’s business model. For clusterthree (i.e., emerging no frills point-to-point) airlines, the average network concentration is as
17

Transatlantic airline business models
Table 7: Mean values of normalized items for each airline clusterItems Cluster 1 Cluster 2 Cluster 3 Kruskal-Wallis
Legacy Hub Leisure No frills p2p H-test p-value1 Network connectivity1 0.47 0.00 0.17 16.3 0.0002 Network concentration1 0.28 0.07 0.07 11.3 0.0043 Fleet inhomogeneity2 0.32 0.11 0.09 6.0 0.0514 Aircraft size3 0.53 0.47 0.36 1.4 0.4985 Cooperation intensity1 0.83 0.14 0.17 22.1 0.0006 Premium passenger focus1 0.40 0.18 0.15 10.8 0.0057 Focus on recurring passengers1 0.96 0.29 1.00 18.9 0.0008 Focus on leisure passengers1 0.00 0.86 0.00 29.9 0.00010 Service quality1 0.46 0.00 0.00 7.3 0.02611 One-way fare availability1 0.19 1.00 1.00 20.8 0.00012 Bundling concept on-board1 1.00 1.00 0.00 36.0 0.00013 Bundling concept other amenities1 0.76 0.48 0.00 17.5 0.00014 Flight frequencies1 0.59 0.17 0.22 16.7 0.00015 Transfer pricing complexity1 0.90 0.36 0.75 13.4 0.00116 Airport sizes1 0.84 0.59 0.48 7.7 0.02117 Fleet age1 0.47 0.40 0.07 9.0 0.011
Number of airlines in cluster 26 7 41 Statistically significant at 5%-level2 Statistically significant at 10%-level3 Not statistically significant at 10%-levelAll values normalized between 0 and 1 across all clusters: 0 represents lowest value within sample, 1represents highest valueItem #9 was excluded as reasoned in Section 5
low as for leisure airlines, pointing towards a similarly decentralized network with a focus onpoint-to-point routes.
Both clusters two and three airlines have a more homogeneous long-haul fleet than legacyhub carriers. Cluster two and three carriers seem to be able to operate their long-haul flights withfew different aircraft types, whereas legacy hub carriers require different size aircraft to servedifferent markets from their hub.
Although we expected no frills point-to-point carriers to have smaller aircraft sizescompared to other airlines, these results could not be confirmed as differences were statisticallyinsignificant.
Most legacy hub carriers are part of a joint venture and/or one of the three large alliances.Both leisure and no frills point-to-point carrier cooperate significantly less. Likely driven by thelower need for connecting passengers as indicated by the low network connectivity.
Summarizing the above findings, we conclude that the network strategy of emerging carriersexhibits significant differences from both legacy hub and leisure carriers. Emerging carriers focuson a decentralized point-to-point model while leveraging low-complexity coincidental feedertraffic at existing short-haul bases. A more homogeneous long-haul fleet reduces complexity.So far, these carriers have entered fewer inter-organizational relationships, potentially to furtherlimit complexity.
Customer, market, and revenue
When observing target customer-market combination scores across the business models, it seemsthat legacy hub carriers focus on premium passengers and service quality, while both leisureand no frills point-to-point carriers score significantly lower on both metrics without significantdifferences between the two groups. However, no frills point-to-point carrier focus on recurring
18

Transatlantic airline business models
passengers just as legacy hub carrier using their frequent flyer programs. Leisure carriers have asignificantly smaller focus on recurring passengers. This is in line with the high focus on touristicpassengers of leisure carriers. Leisure airlines can rely on package holiday companies to fill theseats of their aircraft and are less dependent on recurring passengers.
Most legacy hub carriers employ complex pricing/revenue management systems todifferentiate between business travelers willing to pay higher prices and e.g. tourists. This islikely to increase unit revenue as well as back office complexity cost. For example, return ticketsthat include a weekend stay are generally priced lower than tickets without a weekend stay. Thelatter one is targeted at business travelers that prefer to return prior to the weekend. As a result,long-haul low cost one way fares are often not available at legacy hub carriers, which wouldundermine this mentioned differentiation. On the other hand, no frills point-to-point and leisureairlines do offer low price one-way fares.
Both legacy hub and leisure carriers include on-board services such as food and drinks aswell as other services such as checked luggage into their lowest base ticket price on transatlanticflights. The emerging airlines in cluster three generally include fewer or no on-board or airportamenities into the lowest base ticket price. The absence of frills in the lowest base fare (i.e.,debundling) enables the airline to offer lower prices, which causes cluster three carriers to have atendency to appear in (online) price comparisons with the lowest priced tickets, thus, having ahigh chance to be selected by the customer. Additionally, these airlines benefit from opportunitiesto earn more ancillary revenues for add-on services.
Regarding the customer, market, and revenue components of the business, we haveobserved that the emerging carriers are again neither following the legacy hub nor the leisuremodel but rather pick essential parts suitable for a long-haul point-to-point model. No frillspoint-to-point carriers target all passenger groups including recurring business travelers and haveincorporated a simple one-way pricing to allow customers to mix flights from different airlines.Furthermore, similar to short-haul LCCs, all services are excluded in the lowest ticket price.
Operations and procurement
From an operations point-of-view, no frills point-to-point carrier operate fewer flight frequenciesper route compared to legacy hub carriers. This is a very essential difference, as the absenceof large numbers of transfer passengers reduces the demand for a long-haul flight leg. In turn,depending on the aircraft size, the airline cannot fill a daily flight per route. Thus, to servedestinations with a high (daily) frequency, either the city-pair would have to bear sufficientdirect demand or the carrier would have to increase the share of connecting passengers, likelylowering the cost-benefits achieved through the low-complexity approach incorporated by nofrills point-to-point carriers today.
Legacy hub carriers generally price tickets by city pair instead of by flight leg. Fares fortransfer passengers on competing routes are often lower than direct flights. Given a lower needfor connecting passengers, leisure and no frills point-to-point carriers have a higher tendency toemploy this leg-based pricing scheme for connecting flights, eliminating cross-subsidization offlights and removing complexity from their pricing and revenue management departments.
Compared to legacy hub carriers, both no-frills point-to-point and leisure carriers usesmaller (non-hub) secondary airports. These secondary airports generally impose lower landingand handling charges which result in a lower cost structure of these airlines.
Furthermore, no-frill point-to-point airlines have a significantly lower average fleet agethan both legacy hub and leisure carriers, which points towards a higher fuel efficiency and inturn lower operating cost. It will be interesting to monitor over time whether this trend will
19

Transatlantic airline business models
continue once these airlines have reached maturity, i.e., whether a young fuel efficient fleet ispart of the carrier’s procurement strategy.
From an operations point-of-view, emerging carriers include aspects known from short-haul low cost and leisure carriers, rather than legacy hub carriers: No frills point-to-point carriersoperate fewer frequencies due to the wanted absence of large numbers of transfer passengers andagain here, operate with a low cost focus by strongly utilizing secondary airports and focusing onyounger fuel efficient aircraft.
Concluding this section, we observe that emerging carriers include business model aspectsof legacy hub, leisure, as well as short-haul LCCs, forming it into a coherent business model.To summarize, we can describe the emerging business model of cluster three carriers in thefollowing way:
Insight 3: No frills point-to-point carriers operate a decentral point-to-pointmodel while leveraging low-complexity coincidental feeder traffic at existingshort-haul bases. These carriers target all passengers groups and have a strongfocus on low complexity and low cost.
7 Cost analysisIn this section, cost differences between airline clusters are quantified and discussed. At first,the unit costs of the carriers within each cluster are normalized and compared. In a second step,the unit costs of an exemplary long-haul no frills point-to-point carrier are compared with anexemplary carrier from the legacy hub cluster in detail to discuss sustainability of cost advantages.
7.1 Cluster cost benchmarkTo validate Hypothesis 2, i.e., emerging transatlantic long-haul LCCs have a significant (20-30%)cost advantage over transatlantic carriers, we compared unit costs by airline cluster.
Cost per available seat kilometer (CASK) was used as the unit cost of choice, calculatedusing total operating costs and total system-wide available seat kilometers (ASK) during 2015.Annual reports for the year 2015 were chosen, as this was the latest full-year published dataavailable at the point of analysis.
Although total costs increase with stage-length, CASK decrease, as aircraft and creware more productive since being more time in the air and less on the ground, and stage-lengthindependent airport and handling, or overhead costs can be distributed across more kilometers.Different airlines can have fundamentally different system-wide mean stage lengths dependingon the network. Carriers with a higher share of short-haul routes will have a lower system-widemean stage-length and vice versa. Thus, CASK need to be adjusted when comparing thembetween carriers. Swan and Adler (2006) have provided a very useful function explainingthe influence of stage length and seat capacity on a single flight. In their airline data project,Swelbar and Belobaba (2016) apply a method that is commonly applied in the airline industry.The latter formula adjusts costs based on the stage-length difference of a carrier to the samplemean. It cannot fully account for all differences of the cost data between carriers. For example,cost differences arising from different shares of narrow-body and wide-body aircraft withinthe network might not be fully reflected through this equation. However, we expect it to havesufficient accuracy for the purpose of comparing total costs across airline clusters. We have
20

Transatlantic airline business models
chosen the formula as applied by Swelbar and Belobaba (2016), where li is the system-widemean stage-length of carrier i:
C ASKadj,i = C ASKunadj,i ∗
√li
1n∑n
i=1 li
Figure 5 displays the stage-length adjusted system-wide CASKs (left axis) and the stage-length (right axis) of the airlines within the sample. For 32/37 airlines cost data was derivedfrom the sources as indicated. For non-listed carriers, no public cost data was available. Themean system-wide stage length across the sample was calculated with 2,531km in 2015.
Figure 5: Stage-length adjusted system-wide CASK and mean stage-lengths for airlines withinthe 3 determined clusters
Cluster one, i.e., legacy hub carriers have a stage-length adjusted mean CASK of US$c7.73 (Sample standard variation: σs,1 = 1.09), cluster two (leisure) carriers of US$c 8.09(σs,2 = 1.03), and cluster three (no-frills point-to-point) carriers of US$c 5.35 (σs,3 = 0.76). Thisequals a 30% lower average cost base of no frills point-to-point carriers compared to legacy hubcarriers, and a 34% lower average cost base versus leisure carriers, on an stage-length adjustedbasis.6
When revisiting the second hypothesis formulated in Section 3, we believe we haveconfirmed the thesis that transatlantic long-haul LCCs have a significant unit cost advantage overother transatlantic carriers.
7.2 Sustainability of cost advantagesWe have observed that no frills point-to-point carriers on average have a 30%-34% unit costadvantage over other carriers. To further understand these cost differences and evaluate their
6A remark on the applied formula for stage-length adjustment, as we discussed the accuracy of the formulaearlier: Although we cannot conclude on the accuracy of the method, the results are according to our expectationsthat no frills point-to-point carriers have lowest costs in the sample. We thus believe that the applied stage-lengthadjustment formula provides sufficient accuracy to compare unit costs between airline clusters.
21

Transatlantic airline business models
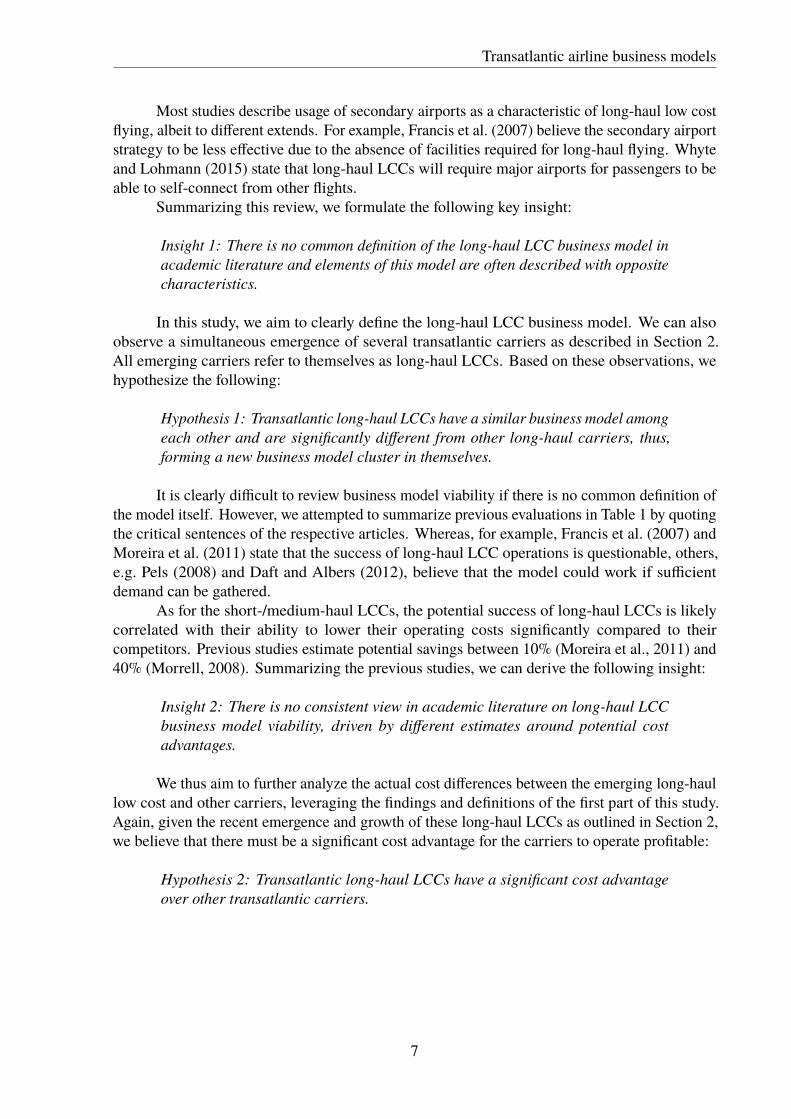
sustainability, a comparison of individual cost items is necessary. Data from publicly availableannual reports was not comparable on a cost item base across the full sample. Thus, a case studyapproach was chosen. We compared the no frills point-to-point carrier with the lowest unit cost(Norwegian Air Shuttle, DY) to the largest legacy hub carrier in Europe (Lufthansa, LH).7 Wedecided that both carriers in this case study had to stem from the same continent to rule out majorcost differences due to geography or accounting.
Figure 6 compares the stage-length adjusted unit operating costs between Norwegian andLufthansa. Norwegian has a significant unit cost advantage over Lufthansa: With total operatingcost (incl. aircraft depreciation) of 4.5 US$c/ASK, Norwegian operates at significantly (49%)lower cost than Lufthansa. The degree of sustainability of this cost advantage over time will bediscussed in the following paragraphs.
Figure 6: Differences in operating costs between Lufthansa and Norwegian by cost item
The largest cost difference lies in the Other operating expenses (or Other OPEX).Norwegian’s operating expenses are 1.3 US$c/ASK (or 70%) lower compared to Lufthansa. Thiscost item includes administrative costs for further (external) services, marketing, sales, systems,IT, and customer relations. In an extensive hub-and-spoke network, large volumes of connectingpassengers require processes and customer relation structures e.g. to manage irregularities suchas missed connections. Complex OD pricing systems need to be in place to optimize revenuestreams also from connecting passengers, not just on a single flight basis. An inhomogenouslong-haul aircraft fleet results in more complex aircraft and crew rotations as well as crew training.All of these aspects need to be organized and managed in the back-office, often requiring complexsystems and infrastructure. The same is true for different service classes: Managing differentservice classes, e.g. four classes at Lufthansa, increases complexity, and thus cost, further. SinceNorwegian focuses on more efficient and less complex point-to-point (long-haul) networks, asignificant portion of this cost advantage can be claimed to be a sustainable advantage of thisbusiness model.
7Table A.2 summarizes the most relevant collected data used in this case study.
22

Transatlantic airline business models
Norwegian operates at 55% lower staff cost per ASK than Lufthansa. Generally, lowercost crew contracts, less overseas rest time, as well as less senior crews have been previouslydiscussed as potential drivers for lower staff cost in low cost long-haul airlines. (De Poret et al.,2015; Whyte and Lohmann, 2015) Whereas the latter advantage will seize over time, a lowercrew cost base and more efficient deployment are sustainable competitive advantages - as long asthe advantage over other carriers remains.
Fuel cost are a significant cost bucket for airlines. Norwegian has 40% lower unit fuelcost than Lufthansa. Key driver for this lower consumption and cost per unit are younger, morefuel efficient aircraft, and a higher seat density. Unless Norwegian will phase-out its aircraftsignificantly earlier than Lufthansa, sustaining a younger, more fuel efficient fleet, the firstsource of cost advantage will diminish over time and cannot be seen as a sustainable competitiveadvantage. The seating density can be viewed as a sustainable advantage, as long as the additionalseats can be filled with paying customers.
Figure 6 combines passenger- and flight-related airport and handling fees, as well as airtraffic control (ATC) expenses, as they are not separately reported by both airlines. Our analysisshows that Norwegian operates at 37% lower cost than Lufthansa. A key reason is likely theusage of secondary airports such as London Gatwick or Oakland close to San Francisco, whichgenerally charge lower landing and passenger-related fees than large hub airports. (De Poret et al.,2015) Only 7% of Lufthansa’s long-haul destinations/origins are non-primary airports, which istypical for a legacy hub carrier and likely the key reason for higher Airport / ATC / Handlingcosts. It can thus be concluded that this cost advantages is more sustainable for Norwegian.
Although we have focused this discussion on costs, we need to point out differences inunit revenues between the two carriers. Lufthansa earns significantly higher (9.3 US$c/ASK)revenues per ASK than Norwegian (4.7 US$c/ASK), stage-length adjusted. Key reason is theclear focus of Lufthansa on premium passengers, offering a sophisticated First, Business, andPremium Economy class product. The share of premium seats per aircraft is also significantlyhigher at Lufthansa. The higher unit revenues translate into a slightly higher operating marginfor Lufthansa of 4.4% vs. 3.7% for Norwegian.
Maintenance, Repair, and Overhaul (MRO) costs are 60% lower for Norwegian. Keyreason is a younger fleet that does not e.g. require significant overhaul procedures at this point.Once the fleet age increases, these costs will also increase for Norwegian. MRO costs also includeoverhaul of cabin interior such as the exchange of premium class seats. In 2015, Lufthansainvested heavily into their seat product. Given Norwegian’s lower focus on premium passengersand less advanced two class product, there will be fewer expenses of this kind.
The last cost advantage from the point-to-point network becomes obvious when looking atcombined charter, leasing and aircraft depreciation costs. These asset costs are around 28% lowerat Norwegian, although the opposite trend would be expected due to the average long-haul fleetage, 3.9 years at Norwegian versus 11.1 years of Lufthansa. A younger fleet can be expected toresult in higher leasing or depreciation costs. This unexpected result can be explained once morewith the point-to-point network design. Norwegian has the opportunity to utilize its long-haulaircraft significantly more per day: 16.6 hours versus 13.0 hours at Lufthansa. Due to a lowerneed for connecting passengers, there is a lower need to schedule aircraft to stay on the ground towait for connecting passengers from other flights. Furthermore, Norwegian only uses one singlelong-haul aircraft type in two configurations (Boeing 787-8 and 787-9), whereas Lufthansa usesseven different long-haul aircraft types for different markets, thus incurring a higher need to formsub-fleets with higher average stand-by requirements per aircraft, for example for maintenance).In addition, asset costs at Norwegian can also be distributed among significantly more seats per
23

Transatlantic airline business models
aircraft.Emerging carriers have sustainable cost advantages due to the nature of their business
model. Lower other operating costs, charter/leasing/depreciation costs, airport expenses, and (ashare of the) lower staff costs are sustainable cost advantages over legacy and often also leisurecarriers that will likely continue to prevail. Fuel and MRO cost advantages will (at least partly)diminish over time, apart from the advantage obtained through a higher seat density. ParticularlyNorwegian’s increasing share of long-haul ASKs will likely further widen the unit cost gap toboth legacy hub and leisure carriers.
Insight 4: In this case study, unit cost advantages of no-frills point-to-pointairlines could be observed across all cost items, of which a significant shareseems to be sustainable. Highest savings are obtained in overhead and complexitymanagement as well as staff costs.
8 ConclusionPrevious studies on long-haul LCCs do not agree on either business model characteristics orlevel and sustainability of cost advantages. Thus, the aim of this paper was to provide clarityregarding the defining business model characteristics and cost advantages of emerging long-haulLCCs, with a focus on the liberalized transatlantic market.
We were able to validate our first hypothesis that the business model of the emerging long-haul LCCs is significantly different from existing legacy hub and leisure carriers and that theseairlines form their own cluster. The key differences lie in the focus on a decentral point-to-pointmodel while leveraging low-complexity and non-discounted feeder traffic at existing short-haulbases. Compared to leisure carriers, target customers are not only leisure and VFR, but alsobusiness passengers. A strong focus on cost can further be observed, particularly through lowcomplexity operations, homogeneous and efficient long-haul fleets, de-bundled services, andutilization of secondary airports. Based on our findings, we named this model the long-haulno frills point-to-point carrier. On a cluster mean, no frills point-to-point carriers operate at30-34% lower costs than legacy hub or leisure carriers, respectively, thus validating our secondhypothesis.
There are two key aspects that this study did not answer but will need additional focus.First, revenue differences on a long-haul flight leg operated by a legacy hub carrier vs. a no frillspoint-to-point carrier were not studied. Legacy hub carriers often transport >50% of connectingpassengers on a long-haul flight. As a result, ticket revenues are split between different flightlegs. A study that compares actually accrued revenues on long-haul flights of carriers withdifferent business models could provide further insights into the reach and limitations of along-haul point-to-point business model. Second, due to the absence of large volumes of transferpassengers, the point-to-point business model might be restricted to thick markets. A thoroughdemand analysis building on the findings of Wilken et al. (2016) to identify the potential andlimitations for these carriers could be enlightening, particularly with the market entrance of smalland efficient long-haul aircraft such as the Airbus A321neoLR, i.e., long-range, from 2019.
24

Transatlantic airline business models
AcknowledgmentsWe would like to thank Pierre Galvin from Amadeus IT Group and Marcia Urban from BauhausLuftfahrt e.V. for their continuous feedback. Furthermore, we would like to thank the manyanonymous reviewers for their valuable comments. All remaining errors are ours.
25

Transatlantic airline business models
A Tables
Table A.1: Allocation of elements from airline-specific business model frameworks to industry-unspecific elements and components
Industry-unspecific Airline-specificComponentsfrom Wirtzet al. (2016)
Elements fromWirtz et al. (2016)
Elements from Daftand Albers (2015)
Elements fromMason andMorrison (2008)
Elements in thisstudy
Strategy Strategic positionsand developmentpaths, valuepropositions
Type of air product,Geographical focus,input factor policy,business policy
Profitability index,Connectivity
Type of airproduct,geographic focus
Resources (Core) competencies,(core) assets
Fleet structure,human capital,property capital
Aircraft productivity,Labor productivity
Fleet structure
Cooperation Networks,partnerships
Inter-organizationalrelationships
N/A Inter-organizationalrelationships
Customer Customerrelationships/ targetgroups, channelconfiguration
Targetproduct-marketcombination,Distribution,Advertising
Distribution/sales,Airport attractiveness
Targetproduct-marketcombination,Distribution
Market offer Competitors, marketstructure, valueoffering
Cabin product,ground product
Market structure,convenience, comfort
Service product
Revenue Revenue streams,revenuedifferentiation
Fare structure Revenue achievement Fare structure
Manufacturing Manufacturing/operations, valuegeneration
Route network N/A Route network
Procurement Resource acquisition,information
Supply management N/A Supplymanagement
Financial Financing, capitalallocation, coststructure
Finance management,infrastructure
Cost drivers Excluded
26
Transatlantic airline business models
Table A.2: Operational data from LH, DY as used in the case studyCluster 1 Cluster 3
Lufthansa (LH)1 Norwegian (DY)General operating characteristicsTotal ASK (M) 186,836 45,292Mean stage-length (km) 2,234 1,451Load factor (%) 80.3 86.2Passengers transported (M) 61.5 25.8Fuel consumption (l/100 ASK) 3.19 2.63Block hours (wide-body) / a/c / d 12.98 16.56Long-haul fleet age (years) 11.1 3.9Total employees 35,517 4,576Unit operating revenue2 per ASKTotal operating revenue (US$c/ASK) 9.25 4.67Unit operating costs2 per ASKFuel (US$c) 1.81 1.08Airport / ATC / Handling (US$c) 1.73 1.10Staff3(US$c) 1.58 0.71A/C ownership (US$c) 0.96 0.69MRO (US$c) 0.89 0.36Other OPEX (US$c) 1.88 0.56Unit operating cost - total (US$c) 8.84 4.50Operating margin4(%) 4.4 3.7
1 LH main-line only, excl. other group airlines and Eurowings2 Stage-length adjusted3 Including external employee cost and all benefits4 Including all costs as listed. Income/gains from foreign currency translation and otherand non-operating losses/gains are excludedSources: 2015 annual reports; Diio LLC (2016)
27
Transatlantic airline business models
B Figures
Figure B.1: Principal component analysis: Scree plot of Eigenvalues
28

Transatlantic airline business models
Figure B.2: Hierarchical cluster analysis: Results of cluster analysis shown in dendogram
29

Transatlantic airline business models
ReferencesBrons, M., Givoni, M., and Rietveld, P. (2009). Access to railway stations and its potential in
increasing rail use. Transportation Research Part A: Policy and Practice, 43(2):136–149.
Cabral, A. M. R. and Ramos, F. d. S. (2014). Cluster analysis of the competitiveness of containerports in Brazil. Transportation Research Part A: Policy and Practice, 69:423–431.
Cho, W., Windle, R. J., and Dresner, M. E. (2015). The impact of low-cost carriers on airportchoice in the US: A case study of the Washington–Baltimore region. Transportation ResearchPart E: Logistics and Transportation Review, 81:141–157.
Corbo, L. (2016). In search of business model configurations that work: Lessons from thehybridization of Air Berlin and JetBlue. Journal of Air Transport Management, In press.
Daft, J. and Albers, S. (2012). A profitability analysis of low-cost long-haul flight operations.Journal of Air Transport Management, 19(1):49–54.
Daft, J. and Albers, S. (2013). A conceptual framework for measuring airline business modelconvergence. Journal of Air Transport Management, 28:47–54.
Daft, J. and Albers, S. (2015). An empirical analysis of airline business model convergence.Journal of Air Transport Management, 46:3–11.
De Poret, M., O’Connell, J. F., and Warnock-Smith, D. (2015). The economic viability oflong-haul low cost operations: Evidence from the transatlantic market. Journal of Air TransportManagement, 42:272–281.
de Wit, J. G. and Zuidberg, J. (2012). The growth limits of the low cost carrier model. Journalof Air Transport Management, 21:17–23.
Diio LLC (2016). Diio Mi - Market Intelligence for the Aviation Industry.
Douglas, I. (2010). Long-haul market entry by value-based airlines: Dual business models supportproduct innovation. World Review of Intermodal Transportation Research, 3(3):202–214.
Eurocontrol (2005). Glossary for Flight Statistics & Forecasts. Technical report, EuropeanOrganization for the Safety of Air Navigation (EUROCONTROL).
Fageda, X., Suau-Sanchez, P., and Mason, K. J. (2015). The evolving low-cost business model:Network implications of fare bundling and connecting flights in Europe. Journal of AirTransport Management, 42:289–296.
Francis, G., Dennis, N., Ison, S., and Humphreys, I. (2007). The transferability of the low-costmodel to long-haul airline operations. Tourism Management, 28(2):391–398.
Fu, X., Dresner, M., and Oum, T. H. (2011). Effects of transport service differentiation in theUS domestic airline market. Transportation Research Part E: Logistics and TransportationReview, 47(3):297–305.
Fu, X., Lei, Z., Wang, K., and Yan, J. (2015). Low cost carrier competition and route entry in anemerging but regulated aviation market – The case of China. Transportation Research Part A:Policy and Practice, 79:3–16.
30

Transatlantic airline business models
Hansen, M. M., Gillen, D., and Djafarian-Tehrani, R. (2000). Aviation infrastructure performanceand airline cost: A statistical cost estimation approach. Transportation Research Part E:Logistics and Transportation Review, 37(1):1–23.
Jean, D. A. and Lohmann, G. (2016). Revisiting the airline business model spectrum: Theinfluence of post global financial crisis and airline mergers in the US (2011 - 2013). Researchin Transportation Business and Management, 21:76–83.
Jolliffe, I. T. (2002). Principal Component Analysis. Springer, 2nd edition.
Lohmann, G. and Koo, T. T. R. (2013). The airline business model spectrum. Journal of AirTransport Management, 31:7–9.
Maertens, S. (2015). The new Eurowings flights from Germany. German Aerospace Center -Institute for Air Transport and Airport Research, page Working Paper.
Mason, K. J. and Morrison, W. G. (2008). Towards a means of consistently comparing airlinebusiness models with an application to the ’low cost’ airline sector. Research in TransportationEconomics, 24(1):75–84.
Moreira, M. E., O’Connell, J. F., and Williams, G. (2011). The Viability of Long-Haul, LowCost Business Models. Journal of Air Transport Studies, 2(1):69–91.
Morrell, P. (2008). Can long-haul low-cost airlines be successful? Research in TransportationEconomics, 24(1):61–67.
Pels, E. (2008). Airline network competition: Full-service airlines, low-cost airlines and long-haulmarkets. Research in Transportation Economics, 24(1):68–74.
Pereira, B. A. and Caetano, M. (2015). A conceptual business model framework applied to airtransport. Journal of Air Transport Management, 44-45:70–76.
Sarkis, J. and Talluri, S. (2004). Performance based clustering for benchmarking of US airports.Transportation Research Part A: Policy and Practice, 38(5):329–346.
Swan, W. M. and Adler, N. (2006). Aircraft trip cost parameters: A function of stage lengthand seat capacity. Transportation Research Part E: Logistics and Transportation Review,42(2):105–115.
Swelbar, W. S. and Belobaba, P. P. (2016). Airline Data Project.
Tretheway, M. W. (2004). Distortions of airline revenues: why the network airline businessmodel is broken. Journal of Air Transport Management, 10(1):3–14.
Wensveen, J. G. and Leick, R. (2009). The long-haul low-cost carrier: A unique business model.Journal of Air Transport Management, 15(3):127–133.
Whyte, R. and Lohmann, G. (2015). Low-cost long-haul carriers: A hypothetical analysis of a’Kangaroo route’. Case Studies on Transport Policy, 3(2):159–165.
Wilken, D., Berster, P., and Gelhausen, M. C. (2016). Analysis of demand structures onintercontinental routes to and from Europe with a view to identifying potential for new low-costservices. Journal of Air Transport Management.
31

Transatlantic airline business models
Wirtz, B. W., Pistoia, A., Ullrich, S., and Göttel, V. (2016). Business Models: Origin,Development and Future Research Perspectives. Long Range Planning, 49(1):36–54.
Wittmer, A., Bieger, T., and Müller, R. (2011). Aviation Systems: Management of the IntegratedAviation Value Chain. Springer, 1st edition.
32