london market review 2015 - health | aon 2012 2013 usd 108bn usd 81bn usd 44b 2014 usd n 39bn usd...
TRANSCRIPT

Aon Risk SolutionsAon Broking
Risk. Reinsurance. Human Resources.
London Market Review 2015Property and Casualty


Property & Casualty 3
Executive summary . . . . . . . . . . . . . . . . . . . . . . . . . . . . . . . . . . . . . . . . . . 4
International property . . . . . . . . . . . . . . . . . . . . . . . . . . . . . . . . . . . . . . . 6
Metals industry . . . . . . . . . . . . . . . . . . . . . . . . . . . . . . . . . . . . . . . . . . . . . . . 8 Pulp and paper industry . . . . . . . . . . . . . . . . . . . . . . . . . . . . . . . . . . . . . . . 10 Mining industry . . . . . . . . . . . . . . . . . . . . . . . . . . . . . . . . . . . . . . . . . . . . . . 12
U.S. property . . . . . . . . . . . . . . . . . . . . . . . . . . . . . . . . . . . . . . . . . . . . . . 14
International casualty . . . . . . . . . . . . . . . . . . . . . . . . . . . . . . . . . . . . . . . 16
U.S. casualty . . . . . . . . . . . . . . . . . . . . . . . . . . . . . . . . . . . . . . . . . . . . . . 18
Product recall and contamination . . . . . . . . . . . . . . . . . . . . . . . . . . . . . 19
Hospital professional liability . . . . . . . . . . . . . . . . . . . . . . . . . . . . . . . . . 20
Appendices . . . . . . . . . . . . . . . . . . . . . . . . . . . . . . . . . . . . . . . . . . . . . . . 23Natural disaster events
IUA London member markets
Lloyd’s syndicates
Contributors . . . . . . . . . . . . . . . . . . . . . . . . . . . . . . . . . . . . . . . . . . . . . . 27
We categorise the London market for the purposes of this report as Lloyd’s of London (Lloyd’s) and the company market represented by the International Underwriting Association (IUA) .
For each of the sectors we have included supporting insurance market statistics and insight from a wide selection of industries and territories that have seen new developments or where London markets set lead terms. (This excludes UK retail risks.)
The objective of the report is to share market data and trend information that help insurance buyers accessing the London market make informed risk transfer and risk management decisions.
Contents

4 London Market Review 2015
Executive summary
2014–warmer, with light winds
The London property and casualty market enjoyed a second consecutive year where below average natural
catastrophe losses allowed most carriers to report strong financial results for 2014, even
in the context of often brutal competition in the property insurance sector.
Insured natural catastrophe losses during 2014 were USD 39 billion, set against a ten-year average of USD
63 billion. Globally 2014 was the warmest year since records began in 1880, a timely reminder of the longer
term trend of increased natural catastrophe events linked to climate change.
Total insured natural catastrope losses
Source: Aon Benfield
When natural catastrophe losses are below the median, the London market–Lloyd’s syndicates in particular–tend
to post better than global peer group loss ratios. 2014 was a case in point.
This helped London underwriters successfully compete and retain market share, when rates for many territories
and industrial risk classes are near or heading towards those seen at the end of the soft market of 1999–2001.
Reinsurer capital globally grew to USD 575 billion, including USD 62 billion of deployed alternative capacity–both
record highs. The size of natural catastrophe losses required to burn off enough capital to change the soft market
trend is therefore much greater.
Change in global reinsurer capital
2015 outlook–changeable
With market conditions event-dependent, it is difficult to accurately forecast the speed and direction of future
market trends. The most likely outcome for 2015 is Scenario 1– a soft market (with occasional short term rate
spikes and regional differences). However, many market commentators argue that Scenario 2 is becoming
more likely: a hard market due to climate change, and an uptick in geopolitical risk and a concern over a major
cyber terrorism event or health pandemic.
0
25
50
75
100
125
20122011 2013
USD 108bn USD
81bn USD 44b
2014
USD 39bnn
USD
$410B $340B $400B $470B
$455B
$505B
$540B
$575B
-17% 18%
18% -3% 11%
7% 6%
2007 2008 2009 2010 2011 2012 2013 Q3 2014

Property & Casualty 5
Global insurance market future scenarios
Broader policy terms A growing trend observed in 2014 and we expect to develop further in 2015, is the broadening of policy
coverage. Exclusions are being gradually loosened, and additional coverage extensions are often added
without charge. Rewording of cyber coverage buyback clauses is also occurring.
Increased appetite Emboldened by three good underwriting years, we have observed an increase in the London market’s
appetite for some of the higher risk sectors such as mining, metals, and pulp and paper. Specific
industry coverage is included in the report to analyse this trend.
Musical chairs
In the London casualty market a number of new carrier start–ups in the sector requiring underwriter talent
kicked off a round of musical chairs that is still playing. When all the underwriters are in their new seats
buyers can expect an increase in competition for their business.
Market consolidation
At the time of writing a new wave of carrier consolidation had commenced with the announcements of
XL’s purchase of Catlin, where scale is quoted as the principal reason for the deal, followed by news of
Fairfax’s offer for Brit. Further consolidation is expected as global players look to secure a larger London
market presence from limited options.
Luigi Sturani Head of Property, Casualty and Crisis Management
Mark Parker Chief Commercial Officer, Property, Casualty and Crisis Management
*Note major industry-specific loss experience changes would still move market terms for that specific industry sector
Scenario 1 Soft market (with occasional short-term rate spikes and regional differences) due to:
Annual natural catastrophe losses between USD 40 billion to USD 80 billion, with all these events:
1. Geopolitical risk level unchanged
2. World economy continues to grow at 3–4% annually
3. No significant change in average world wide risk loss levels*
Scenario 2 Hard market due to:
Natural catastrophe losses over USD 100 billion in an annual period, with one or more of the following events:
1. Major cyber terrorism event
2. Increased global conflict / religious war
3. Financial crisis (Greek euro exit / China property bubble)
4. Health pandemic / black swan

6 London Market Review 2015
2014 trends The international (non U.S.) sector of the London market provides insurance and reinsurance protection for companies located in over 200 countries. Consequently, high-level market trends should be applied to local factors, such as natural catastrophe events or regional industry cluster trends, for example hotels in the Caribbean or manufacturing in Asia.
There was increased competition for all classes of property risk during 2014, with over-capacity and the signing down of carrier participation stoking a softening market trend. Some countries and industry sector rates dropped to levels not seen since 1999–2001.
Even buyers with claims activity often secured small rate reductions, if a special case was made relating to the loss cause.
The London market has a heavy weighting towards natural catastrophe-exposed countries and the more complex industrial risks that often require large policy limits. This means the sector is more volatile than a general basket of property risks and the rate movements detailed in the table should be considered in this context.
Theoretical total London per risk capacity increased to USD 1. 9 billion, part of the global theoretical capacity of USD 4.8 billion per risk. The big difference, and a continuation of the trend kicked off in Spring 2013, is that both London and global carriers are being much more aggressive in using their per risk stamp capacity to protect and / or pursue market share.
International property
2014 and Q1 2015 premium rate changes
Country Loss free Loss active
Australia -10% to -25% flat to +5%
Brazil -5% to -15% +0% to +10%
Chile -10% to -20% +0% to +10%
China -5% to -10% +0% to +10%
Colombia 0% to -10% +10% to +15%
Europe (ex UK) -5% to -15% 0% to +15%
India -5% to -25% +5% to +10%
Indonesia -5% to -10% +5% to +15%
Israel -5% -20% +5% to +10%
Japan -5%to -15% +5 to +15%
Middle East 0% to -10% +5 to +25%
New Zealand -10% to -20% 0% +15%
Russia / CIS -5% to -10% +5% to +20%
South Africa -5%to -15% 0% to +5%
Taiwan -5%to -15% +10% to +15%
Turkey -5% to -20% +5% to +10%
Global programmes -5% to -25% -5% to +20%
Even buyers with claims activity often secured small rate reductions, if a special case was made relating to the cause of loss.

Property & Casualty 7
2015 outlook Asia Pacific Australian and New Zealand-domiciled companies with London market placements again secured some of the largest improvement in terms, tracking local market rate movements.
Despite thinner rates, the sector remained profitable for London due to the below average level of major risk and natural catastrophe losses.
Slower ecomomic growth and lower commodity prices for the many mining companies headquartered in Australia who use the London market, will mean lower ingoing business interruption values and consequently smaller base premiums in 2015.
Australian and New Zealand risk managers have historically blended local, regional and London / European market shares to manage their organisation’s interests over the market cycle. We expect this competitive dynamic to intensify unless the soft market trend changes.
The London market wrote new or increased shares on a number of Indonesian, Indian and Japanese risks in 2014 and we expect this trend to continue in 2015.
Europe, Middle East and Africa As premium volume for London’s traditional heavy industrial risks and global programmes with significant natural catastrophe exposure has shrunk, London underwriters and brokers have cast their eyes more widely to compete aggressively on EMEA-located business they had not prioritised in the past. We expect this to continue in 2015. The sector was profitable in 2014, with only two large natural catastrophe losses: flooding in Southeastern Europe in May 2014 which caused insured losses of USD 250.
million and storms during June 2014 across France and Germany which accounted for USD 3 billion of losses.
Economic sanctions imposed on Russia in Spring 2014, created uncertainty for brokers and underwriters with March and April inception dates. Once the new laws were understood there was a small reduction in the level of business transacted on Russian industrial property risks, with oil and gas companies most affected.
Africa and the Middle East are two regions with strong economic growth trajectories, and Aon observed double digit percentage premium growth to London in 2014. However, the region remains a challenge for London to grow market share because local markets compete aggressively where price is the principal differentiator. Where more holistic risk engineering and risk management packaged service are offered, deals involving London and European marketed are regularly closed.
Latin America Other than losses connected to the year-long drought in Brazil–estimated at USD 450 million–Latin America was free of major natural catastrophe losses in 2014, delivering a profitable year for both local and London markets.
Rates in Chile, Columbia and Peru showed the largest declines due to the link to natural catastrophe rates, which were already tracking lower in both the insurance and reinsurance markets. We expect this trend to continue in 2015.
The economies of Brazil and Argentina are slowing and will place pressure on buyers seeking to balance their total cost of risk strategy with local market and international security choices.
Sophisticated Latin American buyers with long-term London and European carrier relationships have targeted lower policy deductibles and long-term policy deals as well as rate reductions, to improve their total cost of risk positions with some success.
Year USD billion
Global 4.8
London 1.9
2015 theoretical international property market capacity (per risk)

8 London Market Review 2015
Many metals companies insure their mining (including refining if integrated) and smelting risks separately, because they secure better terms from the market due to the larger capacity and greater competition for standalone smelting risks, compared to combined mining and smelter placement options.
Hybrid Hybrid placements, where the smelter and mining risk are insured together but the below ground mining risk is reinsured separately into 1) a specialist market or 2) a captive insurance vehicle or 3) a standalone local market placement, are common. Some companies use a mix of all three strategies.
This section of the report covers refining and smelting risk on a standalone basis, or the parts of a hybrid placement left by carving out elements of mining risk. The mining section of this report covers stand-alone miners and integrated miners with combined placements.
2014 trends At the global metals industry level the sector enjoyed a year of below-average loss activity, under-pinned by below-median global natural catastrophe losses.
Within this trend there were some significant differences. In EMEA, risk loss claims for the steel industry were above average. The Middle East aluminium smelter industry also continued to be loss active. There were large individual losses in Latin America and the U.S., but they did not exceed the metal industry rolling average for these regions.
The diagram below outlines the average rate reduction for metals risks. (Made up from 95% steel / aluminium / copper / zinc producers / and 5% other metals).
While rates continue to trend downwards we have noted growing resistance to chase rates lower. Many of the traditional metal industry lead underwriters are now participating excess of the primary USD 10–50 million layers, as they believe rates are too cheap but wish to maintain client relationships, allowing specialist primary underwriters to compete for the first loss layer.
Metals industry
Metals industry combined PD / BI rate evolution
30%
Q1 08 Q1 09 Q1 10 Q1 11 Q1 12 Q1 13 Q1 14
25%
20%
15%
10%
5%
0%
-5%
-10%
-15%
-20%
-25%
Q1 15
Pulp & paper All sectors
30%
Q1 08 Q1 09 Q1 10 Q1 11 Q1 12 Q1 13 Q1 14
25%
20%
15%
10%
5%
0%
-5%
-10%
-15%
-20%
-25%
Q1 15
Metals All sectors
Source: Aon

Property & Casualty 9
2015 outlook The metals industry is quite difficult to forecast because unlike the mining sector where rates were ramped up by major losses in prior years and are still relatively high, rates for the metals sectors are at or near previous market cycle lows, but remain profitable at this level due to recent levels of loss activity. The question is how low will they go?
Competition We anticipate that competition in the sector will continue, but carriers will become much more selective regarding how they utilise their capacity. Some carriers will cut back participation or increasingly move to excess layer positions on loss active placements or those with below average risk management profiles. For the best, well-managed risks we expect market competition to increase.
Interwoven with the rating trend is a push by brokers to broaden policy coverage for their clients at minimal or zero cost, by loosening policy exclusions and / or adding or widening policy coverage extensions. This trend will continue and has historically been the forerunner to the end of the soft market cycle.
For further details on the steel and aluminium industries, please refer to the Aon 2015 report dedicated to the sector.
Rates for the metals sectors are at or near previous market cycle
lows, but remain profitable at this level due to recent levels of loss activity. The question is how low
will they go?
Interwoven with the rating trend is a push
by brokers to broaden policy coverage
for their clients at minimal or zero cost.

10 London Market Review 2015
2014 trends The pulp and paper sector sector is well served by London carriers due to the specialist underwriting knowledge required to write these complex property damage and business interruption risks. Black Liquor Recovery Boilers have a significant explosion potential and many plants are located in natural catastrophe zones.
Improving loss ratios Based on Aon data the loss experience for the pulp and paper industry in 2014 was below average, with no stand-out differences between the main producing countries in the northern hemisphere–Canada, the U.S. and Scandinavia–and their peers in Indonesia, China and Chile. Aon’s claim statistics indicate an improving trend in loss frequency and severity in the sector.
This can be partly explained by a lower level of natural catastrophe claims in the past three years, however, the underlying risk loss experience is also showing a down-ward trend, which suggests an improvement in risk man-agement and loss control within the industry.
The graph opposite outlines the market trend for pulp and paper rates. They reduced at a slightly faster rate than the property sector average and we saw this trend continue through 2014 into the first quarter of 2015.
2015 outlook Compared to other commodity sectors, the prices for pulp and paper products have been less volatile and ingoing values are forecast to be stable.
Many integrated paper and packaging companies have posted growth in volumes and revenues for 2014, which contrasts with most metals and mining companies.
This is significant because it indicates maintenance and capital expenditure budgets will not be reduced or possibly grow, which is a positive for the sector’s insurers and reinsurers.
We also expect to see pulp and paper companies from Canada, the U.S. and Scandinavia, to continue to use the London market for deductible buyback and captive protection placements as they attempt to manage their total cost of risk downwards through the market cycle.
Pulp and paper industry
Based on Aon data, the loss experience for the pulp and paper industry in 2014 was below average, with no stand-out differences between the main producing countries in the northern hemisphere—Canada, the U.S. and Scandinavia—and their peers in Indonesia, China and Chile.

Property & Casualty 11
Pulp and paper industry combined PD / BI rate evolution
30%
Q1 08 Q1 09 Q1 10 Q1 11 Q1 12 Q1 13 Q1 14
25%
20%
15%
10%
5%
0%
-5%
-10%
-15%
-20%
-25%
Q1 15
Pulp & paper All sectors
30%
Q1 08 Q1 09 Q1 10 Q1 11 Q1 12 Q1 13 Q1 14
25%
20%
15%
10%
5%
0%
-5%
-10%
-15%
-20%
-25%
Q1 15
Metals All sectors
Strong long-term relationships between clients and their lead insurer(s) are prevalent in the sector, and we expect London carriers with existing leading positions to maintain or attempt to grow market share.
Good relations Mutually beneficial business relationships between carriers and pulp and paper companies are the foundation for competitive terms in this sector due to the high hazard risk and the requirement for specialist sector underwriting and a focus on risk engineering. Strong long-term relationships between clients and their lead insurer(s) are prevalent in the sector, and we expect London carriers with existing leading positions to maintain or attempt to grow market share.
Source: Aon

12 London Market Review 2015
2014: fortune favoured the brave The big news from 2014 was the low level of mining industry claims, across all size mining risks, which based on Aon’s analysis, ran at a levels between 40–50% of the ten-year average. This is in contrast to the 2008–2012 period when the sector, delivered loss ratios of over 300%, resulting in withdrawals from the sector an associated reduction of capacity and tightening of policy coverage. Those brave carriers that stayed with the mining sector have seen their fortunes turn around, and enjoyed a bumper year.
In the 2014 mining section of this report we split out market commentary for 1) major global miners and 2) medium and junior miners, because high levels of loss activity in the first group and much lower loss ratios and capacity requirements from the second, have created two markedly different market dynamics to review.
We again review the two sectors separately as major differences in placement dynamics are at play. Carriers remain cautious towards the major miner sector, but are attracted by the premium pool and deductibles that are available. Some are seeking to grow market share, and a number of carriers have written mining risks in 2014 that they had declined in prior years.
Major global mining companies For the small group of major global mining companies that have large multi-territory operations and were also the source of the 2008–2012 claims, rates fell and available market capacity increased.
These companies have complex and often unique risk profiles and held differing objectives for their 2014 renewals. Some traded the rate reductions available for increased natural catastrophe limits, while others used premium savings to protect their captive insurers from elements of risks they had been forced to retain during the mining sectors’ recent hard market.
Despite the softening trend, lead mining carriers in London and Europe continued to maintain a disciplined approach to underwriting the sector, even in the face of increased competition.
2015 outlook The price of iron ore and copper has reduced significantly during the past 12 months, so ingoing business interruption values declared in 2015 are forecast to be lower than 2014. This will mean that total premium for the sector starts from a lower base and we anticipate that carriers will be resistant to rate reductions that further compounds this situation. If loss levels remain below average however, we expect the current rate reduction trend and the availability of wider policy coverage to continue.
The chart below shows global mining market capacity for different types of mining. This is very much a guide because natural catastrophe limits, and individual company risk profiles drive market capacity. This capacity is also qualified by the term “usable”–in other words capacity at a price that buyers are prepared to pay and providing the cover they require.
Mining industry
Global mining market capacity
“Usable” global per risk marketcapacity 2014 2015
Above ground / opencast mining USD 1.4 billion to USD 1.7 billion USD 1.8 billion to USD 2 billion
Below ground hard rock USD 300 million to USD 450 million USD 300 million to USD 550 million
Below ground soft rock / coal USD 100 million to USD 230 million USD 120 million to USD 250 million

Property & Casualty 13
Medium and junior miners While classified as medium and junior for underwriting purposes, companies in this category include many world-class mining companies that insure assets in access of USD 10 billion. For these organisations assets are often, but not exclusively, in a single country and as a group have not delivered to the insurance market the run of large losses that the global major companies have. Both insureds and insurers in this group have benefited from below average natural catastrophe losses and risk losses, with underwriters recording low loss ratios and buyers enjoying reduced insurance costs. 2014 was also a period when brokers sought to widen coverage and the following table includes some of the areas that experienced revised terms from prior renewals.
Policy coverage improvements
Areas of coverage improvement or sub-limit increases
Tailing dams Port blockage sub-limits
Interdependency Contingent business interruption
Flood definitions / exclusions Underground sub-limits
Civil unrest Cyber risks
U.S. and Canadian miners have enjoyed improved terms helped by soft market conditions in the general property market, where some carriers have looked to write mining risks to make up for lost premium volume in other industries.
For the mining hubs of Australia, South Africa and Latin America rate reductions and broader policy coverage was the norm for 2014 and for Q1–Q2 2015 renewal discussions this trend is continuing.
Saudi Arabia, as a growth country for the mining industry, was also popular. The absence of significant natural catastrophe exposures and well-managed risks attracted carriers looking to diversify and grow their portfolios.
Underground The underground coal mining sector has experienced a small uptick in usable capacity, but still requires participation from a large number of carriers to build a block of capacity over USD 100 million.
It is our expectation that this trend will gather pace, and significantly more underground risk capacity will become available from a blend of new and existing sources.
Gold While the sample pool is relatively small, it appears gold miners have been targeted as a preferred class by certain insurers and reinsurers. Significantly lower rates and wider policy coverage is available to those that exhibit high-quality risk management and a professional risk transfer approach.
Ebola For Europe, the Middle East and Africa terms and issues have often been country-specific. Miners in West African countries have had to manage Ebola outbreaks, and in most instances without insurance coverage for lost production. A range of new products arrived in the market after the event.

14 London Market Review 2015
2014 trends 2014 saw a rapid softening of the U.S. property market that had seen rates sustained in 2013 following Superstorm Sandy in late 2012.
A number of high-profile markets looked to hold ratings in the first quarter of 2014. However, it was apparent that the continued low interest rate environment, lack of catastrophe losses, and influx of new capital will inevitably lead to significant rate reductions. In fact, the largest U.S. catastrophe losses recorded in 2014 were 2.9 billion from severe weather events and associated flooding in the central U.S. and a cumulative drought effect of USD 1.5 billion across the U.S. as referenced in appendix 1, suggesting that there will be little downward pressure on ratings.
The London market not only matched the U.S. rate trend but recognised the importance of being even more competitive and the larger players frequently flexed their muscles in an attempt to squeeze the smaller market participants off placements and / or secure preferential signings. The table below details the average rate movement range per quarter, demonstrating the quickening pace of market softening as the year progressed.
2015 outlook Catastrophe treaties renewed on 1 January with significant double digit reductions; the outlook for 2015 sees little sign of a let-up in the downward rating cycle. The final months of 2014 certainly saw an increased drive for premium income to fill year-end budgets.
Barring a major earthquake, we see no immediate sign of any break in the sustained trend of further market softening. The majority of U.S. business renews in advance of the 2015 windstorm season and we predict double digit rate reductions. In the longer term we see perhaps only the occasional pauses in rate softening for large natural catastrophes similar to Sandy. However, it will probably take a mega catastrophe or series of events exceeding USD 100 billion to change the direction of the market. The total per risk capacity for U.S. natural perils is forecast to be slightly up in 2015 as noted in the table below.
U.S. property
Quarter and year Claims free Loss active
Q1 2014 0% to -5% +0% to +12.5%
Q2 2014 -5% to -10% 0% to +10%
Q3 2014 0% to -5% +0% to +12.5%
Q4 2014 -5% to -10% 0% to +10%
Q1 2015 -5% to -15% 0% to -5%
Q2 2015 -5% to -15% 0% to -5%
2014 / 2015 average quarterly rate changes
Catastrophe treaties renewed on 1 January with significant double digit reductions; the outlook for 2015 sees little sign of a let-up in the downward rating cycle.
Peril Total capacity per risk
London market capacity per risk
California Earthquake USD 600 million USD 225 million
Windstorm USD 1 billion USD 350 million
U.S. large risk sector capacity

Property & Casualty 15
London market edge Against a background of softening rating trends, the challenge for the London market is to remain “relevant” but to continue to be pro active to market changes.
Fortunately, London and European underwriters have also benefited from the lack of catastrophe events and enjoyed excellent results on their U.S. portfolios in 2014. Therefore, in addition to continually providing a high quality of service and security, London carriers are offering dedicated SPS (facility) solutions through Aon for the following industries:
• Real estate • Hospitality• Entertainment
These industry solutions stand alongside London carrier expertise in financial institutions, retail, railroads, and technology industries, all of which enjoy access to broad policy wordings, and the London market’s experienced claims service.
It is a unique feature of the London carrier and U.S. insured relationships that both enjoy a deep mutual understanding, built up over decades of trading together. This business empathy is built on annual dialogue, roadshow, or indeed at the unique Aon Miami Symposium.
Structured portfolio solutions and facilities The London market is offering a number of new Aon Structured Portfolio Solution options in 2015, one of the most in demand products has been a new homeowners Aon Flood Facility developed between our London team and Aon Affinity.
Also available from the London market are a wide range of dedicated U.S. facilities including mortgage impairment products and a number of creative and competitively priced deductible buyback products.
During the soft market U.S. buyers are challenging London to create compelling reasons to continue placing business there, and to date the market has risen to the call with a larger and more tailored range of risk transfer products and solutions.

16 London Market Review 2015
2014 trends There were interesting developments and outcomes for the 2014 year within the international casualty market. Throughout the period we heard commentary from carriers about the squeeze on margin associated with increased overheads and claims cost and low investment returns.
There was further talk of changes to reinsurance treaties putting further pressure on direct writers. But international casualty market results remained positive to the extent that the sector looked an attractive zone to enter or expand into as part of a wider portfolio.
We observed new carriers coming in and an expansion of long-standing writers of other segments spreading across the liability market.
This led to an unprecedented need for experienced talent to staff up the new portfolio opportunities and there followed a flurry of underwriters moving from one organisation to another.
Clearly the new participants arriving with fresh ideas, new concepts and exciting business plans needed to be fed and driven forward. For the established carriers losing their talent, it became a time to rebuild teams with new people and to maintain current portfolios, while seeking to develop new business.
This was all very good news for clients and a very new situation to that observed in this market segment over the preceding years.
Competition increased not only between the London markets, but also with local market expansions and competitive drive. Premium reductions and positioning varied according to risk type, quality and the usual factors, but on average rate on line reductions in the order of 5% to 10% were noted.
Long-term agreements were offered and innovation on coverage, scope and product offering climbed high on both buyers’ and underwriters’ agendas.
International casualty
Country Loss free Loss active
Global programmes -5% to -10% +5 to +20%
Australia -5% to -10% +10 to +20%
Canada -5% to -10% +5 to +25%
EMEA -5% to -10% +10 to +30%
Rest of the world -5% to -10% +5 to +15%
2014 rate change range

Property & Casualty 17
2015 outlook At the time of writing we see a continuation of the trend that opened 2015. Senior underwriters who have moved have not yet arrived at their new offices and plans are therefore yet to be executed. Further underwriter moves are ongoing and more to come likely.
Capacity continues to expand, as does the challenge presented by new and expanding markets to the current writers. The reinsurance market overall has been favourable to the direct liability market and we see and hear of greater flexibility in coverage on offer for reinsurance treaties, offering benefits to our direct clients.
We see an additional USD 75 million of capacity entering the market contributing to what was probably USD 75 million to 100 million of new and expansionist capacity in 2014.
This additional capacity has also come to the fore with the movement of experienced underwriters and a notable expansion of lead markets in the segment. There is greater flexibility towards offering global capacity, including U.S. domestic risk, and more markets offering combined onshore and offshore energy liability coverage. Construction capacity will remain strong and competitive. We have seen good continued growth in this sector and expect this trend to continue.
Our premium rate expectations are for a reduction of 5–10%. We believe 2015 will be an exciting year in the international casualty sector. Major buyers in Australia, Canada and Latin America can expect to see some improvement in coverage even in more challenging industries such as oil and gas, and mining and power, where the potential for sizeable casualty claims exists.
Year Capacity
2014 USD 2 billion
2015 USD 2.2 billion
International casualty total London market capacity
18 London Market Review 2015
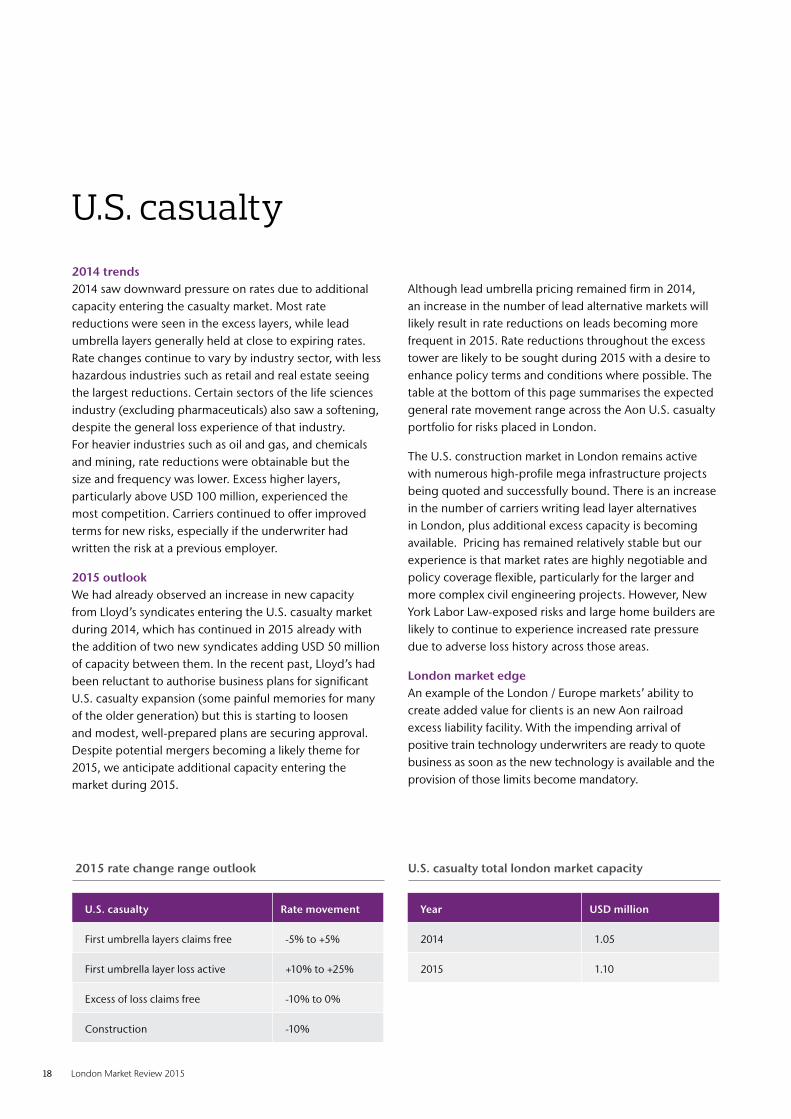
2014 trends 2014 saw downward pressure on rates due to additional capacity entering the casualty market. Most rate reductions were seen in the excess layers, while lead umbrella layers generally held at close to expiring rates. Rate changes continue to vary by industry sector, with less hazardous industries such as retail and real estate seeing the largest reductions. Certain sectors of the life sciences industry (excluding pharmaceuticals) also saw a softening, despite the general loss experience of that industry. For heavier industries such as oil and gas, and chemicals and mining, rate reductions were obtainable but the size and frequency was lower. Excess higher layers, particularly above USD 100 million, experienced the most competition. Carriers continued to offer improved terms for new risks, especially if the underwriter had written the risk at a previous employer.
2015 outlook We had already observed an increase in new capacity from Lloyd’s syndicates entering the U.S. casualty market during 2014, which has continued in 2015 already with the addition of two new syndicates adding USD 50 million of capacity between them. In the recent past, Lloyd’s had been reluctant to authorise business plans for significant U.S. casualty expansion (some painful memories for many of the older generation) but this is starting to loosen and modest, well-prepared plans are securing approval. Despite potential mergers becoming a likely theme for 2015, we anticipate additional capacity entering the market during 2015.
Although lead umbrella pricing remained firm in 2014, an increase in the number of lead alternative markets will likely result in rate reductions on leads becoming more frequent in 2015. Rate reductions throughout the excess tower are likely to be sought during 2015 with a desire to enhance policy terms and conditions where possible. The table at the bottom of this page summarises the expected general rate movement range across the Aon U.S. casualty portfolio for risks placed in London.
The U.S. construction market in London remains active with numerous high-profile mega infrastructure projects being quoted and successfully bound. There is an increase in the number of carriers writing lead layer alternatives in London, plus additional excess capacity is becoming available. Pricing has remained relatively stable but our experience is that market rates are highly negotiable and policy coverage flexible, particularly for the larger and more complex civil engineering projects. However, New York Labor Law-exposed risks and large home builders are likely to continue to experience increased rate pressure due to adverse loss history across those areas.
London market edge An example of the London / Europe markets’ ability to create added value for clients is an new Aon railroad excess liability facility. With the impending arrival of positive train technology underwriters are ready to quote business as soon as the new technology is available and the provision of those limits become mandatory.
U.S. casualty
U.S. casualty Rate movement
First umbrella layers claims free -5% to +5%
First umbrella layer loss active +10% to +25%
Excess of loss claims free -10% to 0%
Construction -10%
Year USD million
2014 1.05
2015 1.10
2015 rate change range outlook U.S. casualty total london market capacity
Property & Casualty 19
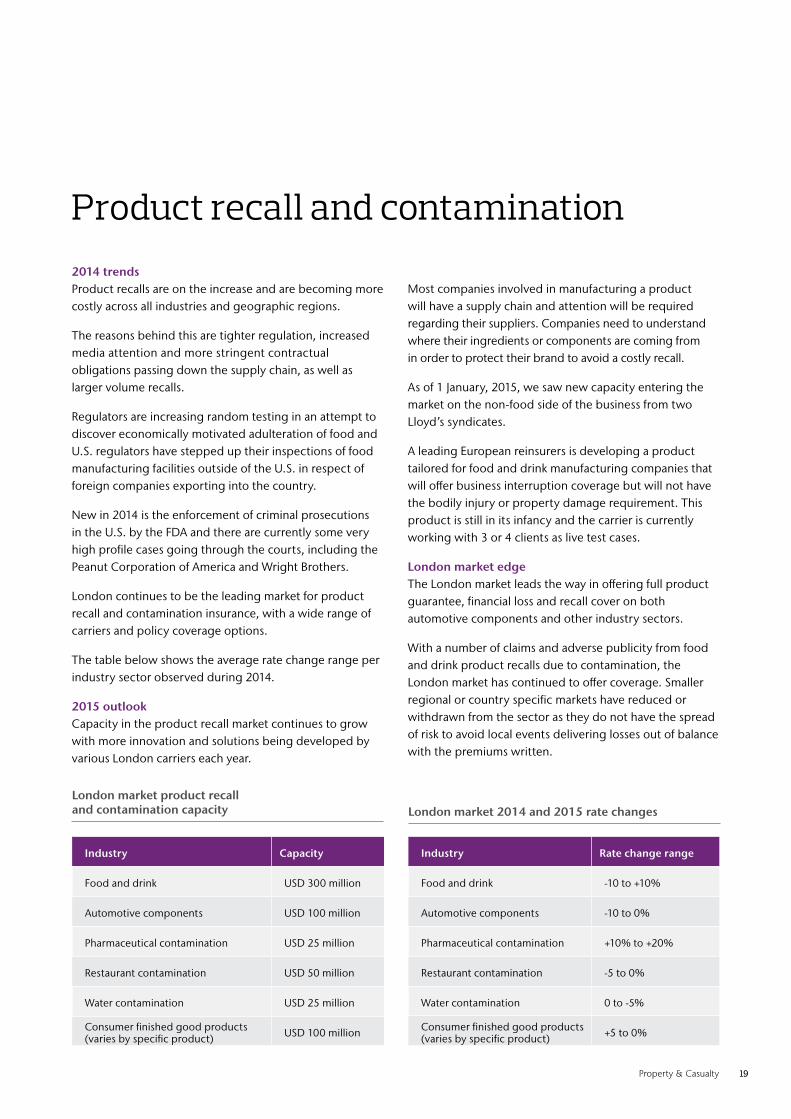
2014 trends Product recalls are on the increase and are becoming more costly across all industries and geographic regions.
The reasons behind this are tighter regulation, increased media attention and more stringent contractual obligations passing down the supply chain, as well as larger volume recalls.
Regulators are increasing random testing in an attempt to discover economically motivated adulteration of food and U.S. regulators have stepped up their inspections of food manufacturing facilities outside of the U.S. in respect of foreign companies exporting into the country.
New in 2014 is the enforcement of criminal prosecutions in the U.S. by the FDA and there are currently some very high profile cases going through the courts, including the Peanut Corporation of America and Wright Brothers.
London continues to be the leading market for product recall and contamination insurance, with a wide range of carriers and policy coverage options.
The table below shows the average rate change range per industry sector observed during 2014.
2015 outlook Capacity in the product recall market continues to grow with more innovation and solutions being developed by various London carriers each year.
Most companies involved in manufacturing a product will have a supply chain and attention will be required regarding their suppliers. Companies need to understand where their ingredients or components are coming from in order to protect their brand to avoid a costly recall.
As of 1 January, 2015, we saw new capacity entering the market on the non-food side of the business from two Lloyd’s syndicates.
A leading European reinsurers is developing a product tailored for food and drink manufacturing companies that will offer business interruption coverage but will not have the bodily injury or property damage requirement. This product is still in its infancy and the carrier is currently working with 3 or 4 clients as live test cases.
London market edge The London market leads the way in offering full product guarantee, financial loss and recall cover on both automotive components and other industry sectors.
With a number of claims and adverse publicity from food and drink product recalls due to contamination, the London market has continued to offer coverage. Smaller regional or country specific markets have reduced or withdrawn from the sector as they do not have the spread of risk to avoid local events delivering losses out of balance with the premiums written.
Product recall and contamination
Industry Capacity
Food and drink USD 300 million
Automotive components USD 100 million
Pharmaceutical contamination USD 25 million
Restaurant contamination USD 50 million
Water contamination USD 25 million
Consumer finished good products (varies by specific product) USD 100 million
London market product recall and contamination capacity
Industry Rate change range
Food and drink -10 to +10%
Automotive components -10 to 0%
Pharmaceutical contamination +10% to +20%
Restaurant contamination -5 to 0%
Water contamination 0 to -5%
Consumer finished good products (varies by specific product) +5 to 0%
London market 2014 and 2015 rate changes

20 London Market Review 2015
2014 trends There are now more markets with worldwide underwriting capabilities rather than simply a focus on either U.S. or non-U.S. business. However, there remains a significant group of carriers who have maintained this division.
The market remained soft with premiums reducing by between 5% and 20% year-on-year. Greater reductions on rate could be negotiated on accounts which demonstrated significant improvements in clinical and patient safety.
Meanwhile, the quality dashboard took a more influential weighting in the underwriting decision and has become a key part of discussions with clients during meetings or hospital tours.
The abundance of capacity has also influenced pricing, although many clients have remained loyal to carriers, keeping in mind the long-tail nature of hospital professional liability cases, and the general increase in claim severity and healthcare industry change.
Away from rating pressures, there has also been a softening of policy terms and conditions with attractive long-term agreement contracts of up to three years available. Such agreements provide companies with long-term coverage and pricing stability and also provide a hedge against future market hardening.
2015 outlook The outlook for 2015 is for the market to continue to soften. New carriers are looking to gain market share, while existing carriers are protecting their positions, helping to create increased competition.
As healthcare strategy evolves in each territory, London markets will continue to align hospital professional liability solutions to wider corporate objectives, such as premium that is correlated with quality improvements.
There are areas of emerging exposures in the hospital environment and it is likely there will be a push for greater integration of such coverages.
The value of the quality and patient safety clinical dashboard, which has become a key part of underwriting submissions, will grow in the eyes of insurers because if gives a prospective view for insurers and allows them the opportunity to negotiate more bespoke added value coverage and products for hospitals.
London markets are looking to diversify their portfolios by balancing large hospitals with allied groups, such as dentistry, primary care and mental health institutions. Additionally, markets are looking at developing portfolios in areas of high growth, particularly in Latin America and Asia.
Hospital professional liability
Year Rate movement
2014 -5% to 20%
2015 -5% to 20%
Year USD Million
2012 USD 200 Million
2013 USD 230 Million
2014 USD 250 Million
2015 USD 260 Million
2015 range rate change outlook London market capacity

Property & Casualty 21
London market edge The London market, in partnership with Aon, has developed a UK medical malpractice product which incorporates a range of coverage enhancements, preferential pricing and dedicated claims expertise targeted at small and medium-sized healthcare providers. The product is supported by two Lloyd’s syndicates offering diversification and the benefit of Lloyd’s security and general underwriting agreements.
London underwriters also offer a specialist product for the fertility and mental health segments of healthcare in the UK, both with a unique set of risk features. The market and Aon have crafted a broad policy form to provide coverage for supported by a specialist claims handling capability.
Healthcare Advantage is a London market product developed by Aon for allied healthcare professionals and providers in Canada. The solution provides a range of coverage lines, including medical malpractice, errors and omissions and general and cyber liability. This one-stop policy reduces the chances of coverage gaps and delivers cost synergies.
Greater reductions on rate could be negotiated
on accounts which demonstrated significant improvements in clinical
and patient safety.
There are areas of emerging exposures in
the hospital environment and it is likely there will
be a push for greater integration of such
coverages.
5% and 20%
The market remained soft with premiums
reducing by between
year on year.

22 London Market Review 2015
Appendices

Property & Casualty 23
Appendix 1–Natural disaster events
Date(s) Event Location Deaths Structures / claims Economic loss1 (USD)
Insured loss1 (USD)
September Flooding India, Pakistan 648 375,000 18 billion 700 million
October 12-14 Cyclone Hudhud India 68 200,000 11 billion 650 million
July 15-20 Typhoon Rammasun
China, Philippines, Vietnam 206 1,000,000 7.2 billion 300 million
Summer Drought China N/A N/A 5.2 billion 750 million
February 8-16 Winter weather Japan 95 288,000 5.0 billion 2.5 billion
May 13-21 Flooding Southeast Europe 86 150,000 4.5 billion 250 million
Year-long Drought Brazil N/A N/A 4.3 billion 450 million
June 18-20 Severe weather France, Germany 6 750,000 4.0 billion 3.0 billion
May 18-23 Severe weather United States 0 425,000 4.0 billion 2.9 billion
Year-long Drought United States N/A N/A 4.0 billion 1.5 billion
All Other Events 65 billion 26 billion
Totals 132 billion 39 billion
Date(s) Event Location Insured loss actual (USD)
Insured loss2 (2014 USD)
August 2005 Hurricane Katrina United States 66.9 billion 80.7 billion
March 11, 2011 EQ / tsunami Japan 35 billion 37.1 billion
October 2012 Hurricane Sandy U.S., Caribbean, Bahamas, Canada 30.2 billion 30.9 billion
August 1992 Hurricane Andrew U.S., Bahamas 15.7 billion 26.4 billion
January 17, 1994 Earthquake United States 15.3 billion 24.8 billion
Yearlong 2012 Drought United States 18 billion 18.8 billion
September 2008 Hurricane Ike United States 15.2 billion 16.5 billion
June–December 2011 Flooding Thailand 15.5 billion 16.3 billion
October 2005 Hurricane Wilma United States 12.5 billion 14.8 billion
February 22, 2011 Earthquake New Zealand 13.5 billion 14.5 billion
2014 Top 10 global economic and insured loss events
Top 10 costliest global insured loss events (1950–2014)1 Subject to change as loss estimates develop
2 Adjusted using U .S . Consumer Price Index (CPI)

24 London Market Review 2015
Appendix 2
Ace European Group Limited
AIG Europe Limited
Allianz Global Corporate Specialty AG
Allied World Assurance Company (Europe) Ltd
Arch Insurance Company (Europe) Ltd
Aspen Insurance UK Limited
Assicurazioni Generali S.p.A. (UK Branch)
AXA Corporate Solutions SA
Aviva Insurance Limited
Axis Specialty Europe Plc
Catlin Insurance Company (UK) Ltd
Chubb Insurance Company of Europe SE
CNA Insurance Company Limited
Endurance Worldwide Insurance Limited
Everest Reinsurance (Bermuda) Ltd
FARADAY Reinsurance Company Limited
General Reinsurance Company
Global Aerospace Underwriting Managers (GAUM)
Great Lakes Reinsurance (UK) Plc
Hannover Re SE
Houston Casualty Company London
International Insurance Company of Hannover SE
Lancashire Insurance Company (UK) Limited
Liberty Mutual Insurance Europe Limited
Markel International Insurance Company Limited
Munich Reinsurance Company
New India Assurance Company Limited
QBE Insurance (Europe) Ltd
Royal & Sun Alliance Insurance plc
SCOR UK Company Limited
Sirius International Insurance Corporation
Swiss Re Europe S.A, UK Branch
Swiss Re International SE, UK Branch
Tokio Marine Kiln Insurance Limited
Tokio Millennium Re (UK) Limited
Torus Insurance (UK) Ltd
Transatlantic Re
Trans Re London
Travelers Insurance Company
W R Berkley Insurance Europe Ltd
XL Re Ltd
XL Insurance Company
Zurich Insurance Plc
IUA London member markets
Property & Casualty 25
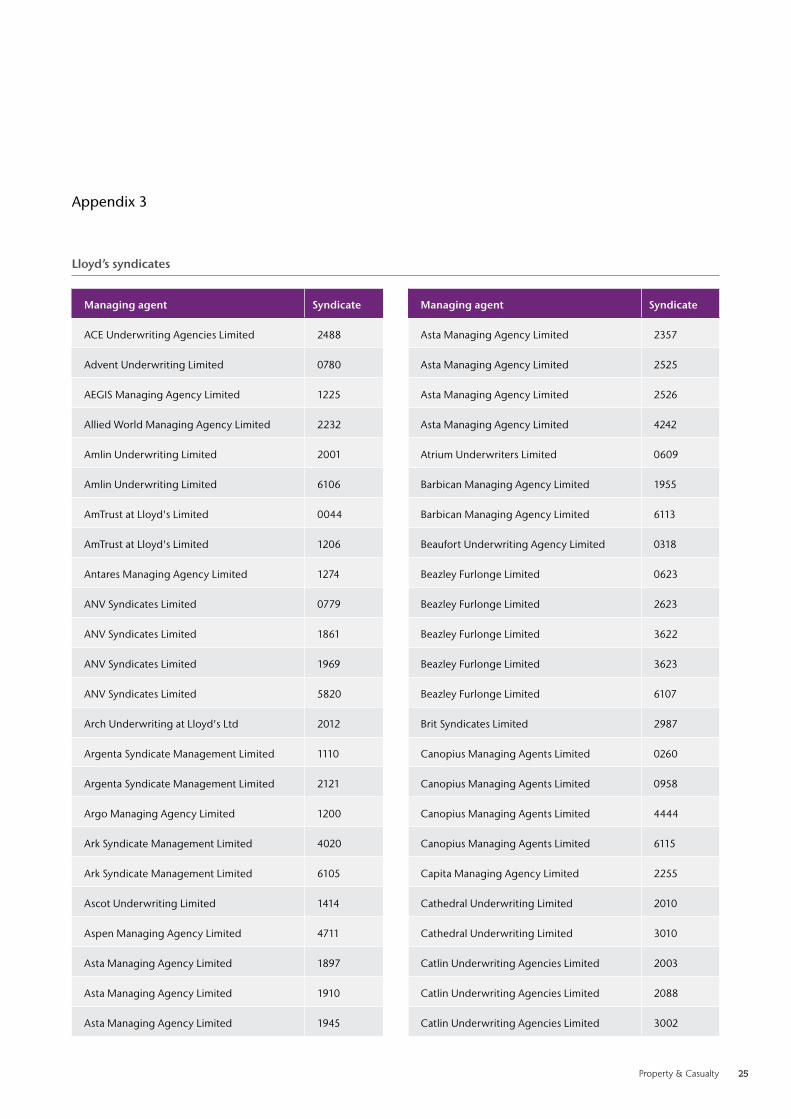
Appendix 3
Managing agent Syndicate
ACE Underwriting Agencies Limited 2488
Advent Underwriting Limited 0780
AEGIS Managing Agency Limited 1225
Allied World Managing Agency Limited 2232
Amlin Underwriting Limited 2001
Amlin Underwriting Limited 6106
AmTrust at Lloyd's Limited 0044
AmTrust at Lloyd's Limited 1206
Antares Managing Agency Limited 1274
ANV Syndicates Limited 0779
ANV Syndicates Limited 1861
ANV Syndicates Limited 1969
ANV Syndicates Limited 5820
Arch Underwriting at Lloyd's Ltd 2012
Argenta Syndicate Management Limited 1110
Argenta Syndicate Management Limited 2121
Argo Managing Agency Limited 1200
Ark Syndicate Management Limited 4020
Ark Syndicate Management Limited 6105
Ascot Underwriting Limited 1414
Aspen Managing Agency Limited 4711
Asta Managing Agency Limited 1897
Asta Managing Agency Limited 1910
Asta Managing Agency Limited 1945
Managing agent Syndicate
Asta Managing Agency Limited 2357
Asta Managing Agency Limited 2525
Asta Managing Agency Limited 2526
Asta Managing Agency Limited 4242
Atrium Underwriters Limited 0609
Barbican Managing Agency Limited 1955
Barbican Managing Agency Limited 6113
Beaufort Underwriting Agency Limited 0318
Beazley Furlonge Limited 0623
Beazley Furlonge Limited 2623
Beazley Furlonge Limited 3622
Beazley Furlonge Limited 3623
Beazley Furlonge Limited 6107
Brit Syndicates Limited 2987
Canopius Managing Agents Limited 0260
Canopius Managing Agents Limited 0958
Canopius Managing Agents Limited 4444
Canopius Managing Agents Limited 6115
Capita Managing Agency Limited 2255
Cathedral Underwriting Limited 2010
Cathedral Underwriting Limited 3010
Catlin Underwriting Agencies Limited 2003
Catlin Underwriting Agencies Limited 2088
Catlin Underwriting Agencies Limited 3002
Lloyd’s syndicates

26 London Market Review 2015
Managing agent Syndicate
Catlin Underwriting Agencies Limited 6111
Catlin Underwriting Agencies Limited 6112
Chaucer Syndicates Limited 1084
Chaucer Syndicates Limited 1176
Chubb Managing Agent Ltd 1882
ERS Syndicate Management Limited 0218
Faraday Underwriting Limited 0435
Hardy (Underwriting Agencies) Limited 0382
HCC Underwriting Agency Ltd 4141
Hiscox Syndicates Limited 0033
Hiscox Syndicates Limited 3624
Hiscox Syndicates Limited 6104
Liberty Syndicate Management Limited 4472
Managing Agency Partners Limited 2791
Managing Agency Partners Limited 6103
Markel Syndicate Management Limited 1400
Markel Syndicate Management Limited 3000
Marketform Managing Agency Limited 2468
Mitsui Sumitomo Insurance Underwriting at Lloyd's 3210
Montpelier at Lloyd's Limited 5151
Munich Re Underwriting Limited 0457
Navigators Underwriting Agency Limited 1221
Managing agent Syndicate
Newline Underwriting Management Limited 1218
Novae Syndicates Limited 2007
Pembroke Managing Agency Limited 4000
Pembroke Managing Agency Limited 6110
QBE Underwriting Limited 0386
QBE Underwriting Limited 2999
RenaissanceRe Syndicate Management Limited 1458
RJ Kiln & Co. Limited 0308
RJ Kiln & Co. Limited 0510
RJ Kiln & Co. Limited 0557
RJ Kiln & Co. Limited 1880
R&Q Managing Agency Limited 1991
S.A. Meacock & Company Limited 0727
Shelbourne Syndicate Services Limited 2008
Sportscover Underwriting Limited 3334
Starr Managing Agents Limited 1919
Talbot Underwriting Ltd 1183
The Channel Managing Agency Limited 2015
Torus Underwriting Management Limited 1301
Travelers Syndicate Management Limited 5000
W R Berkley Syndicate Management Limited 1967
XL London Market Ltd 1209
Lloyd’s syndicates (continued)

ContributorsU.S. property
Simon Methven+44 (0)20 7086 [email protected]
Paul Foreman+44 (0)20 7216 [email protected]
International property
Massimiliano Roveda+44 (0)20 7086 [email protected]
Jorge Artunduaga+44 (0)20 7086 [email protected]
Jamie Topping+44 (0)20 7086 [email protected]
U.S. casualty
Simon Good+44 (0)20 7086 [email protected]
U.S. casualty construction
Galen Brislane+1 441 595 [email protected]
International casualty
Richard Payne+44 (0)20 7216 [email protected]
Product recall & contamination
Kary Yates+44 (0)20 7086 [email protected]
Hospital professional risks
Will Barber+44 (0)20 7086 [email protected]
Mining & metals
Mark Parker+44 (0)20 7216 [email protected]
Mark Kettle+44 (0)20 7216 [email protected]
David Williams+44 (0)20 7086 [email protected]
Bruce Dettling+44 (0)20 7086 [email protected]
Craig Dowell+44 (0)20 7086 [email protected]
Pulp & paper
Julian Catmull+44 (0)20 7086 [email protected]
James Pash +44 (0)20 7086 2028 [email protected]
Please contact your local Aon office or any of the above for further copies of this report.

Risk. Reinsurance. Human Resources.
About Aon Aon plc (NYSE:AON) is a leading global provider
of risk management, insurance and reinsurance
brokerage, and human resources solutions and
outsourcing services . Through its more than
66,000 colleagues worldwide, Aon unites to
empower results for clients in over 120 countries
via innovative and effective risk and people
solutions and through industry-leading global
resources and technical expertise . Aon has been
named repeatedly as the world’s best broker, best
insurance intermediary, reinsurance intermediary,
captives manager and best employee benefits
consulting firm by multiple industry sources . Visit
www .aon .com for more information on Aon and
www .aon .com/manchesterunited to learn about
Aon’s global partnership with Manchester United .
© Aon plc 2015. All rights reserved.The information contained herein and the statements expressed
are of a general nature and are not intended to address the
circumstances of any particular individual or entity . Although
we endeavor to provide accurate and timely information and
use sources we consider reliable, there can be no guarantee that
such information is accurate as of the date it is received or that it
will continue to be accurate in the future .
No one should act on such information without appropriate
professional advice after a thorough examination of the
particular situation .
Aon UK Limited is authorised and regulated by the Financial
Conduct Authority .
FP 8831
www.aon.com