logistics and infrastructure: challenges and opportunities harry caldwell federal highway...
TRANSCRIPT
Logistics and Infrastructure: Challenges and Opportunities
Harry CaldwellFederal Highway Administration
Office of Freight Management and Operations
Federal Highway AdministrationOffice of Freight Management and Operations2
Objectives
logistics and transportation infrastructure infrastructure and economic development challenges facing future infrastructure
development and use approaches to problem solving
Federal Highway AdministrationOffice of Freight Management and Operations3
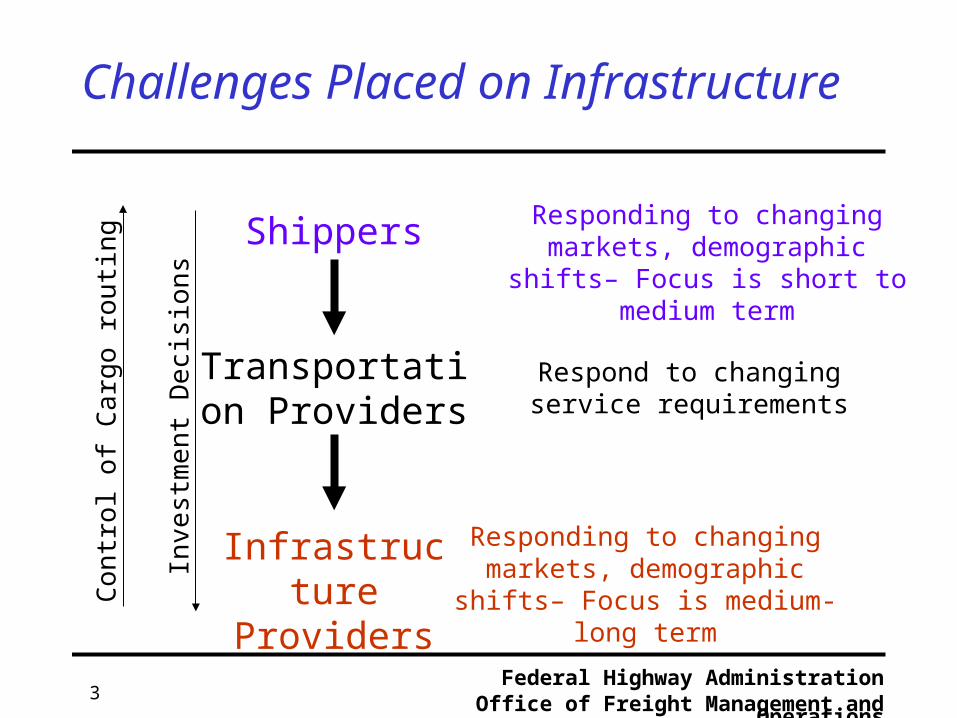
Challenges Placed on Infrastructure
Shippers
Transportation Providers
Infrastructure Providers
Responding to changing markets, demographic shifts– Focus is short to
medium term
Respond to changing service requirements
Responding to changing markets, demographic shifts– Focus is
medium-long term
Con
trol
of
Car
go r
outin
g
Inve
stm
ent D
ecis
ions
Federal Highway AdministrationOffice of Freight Management and Operations4
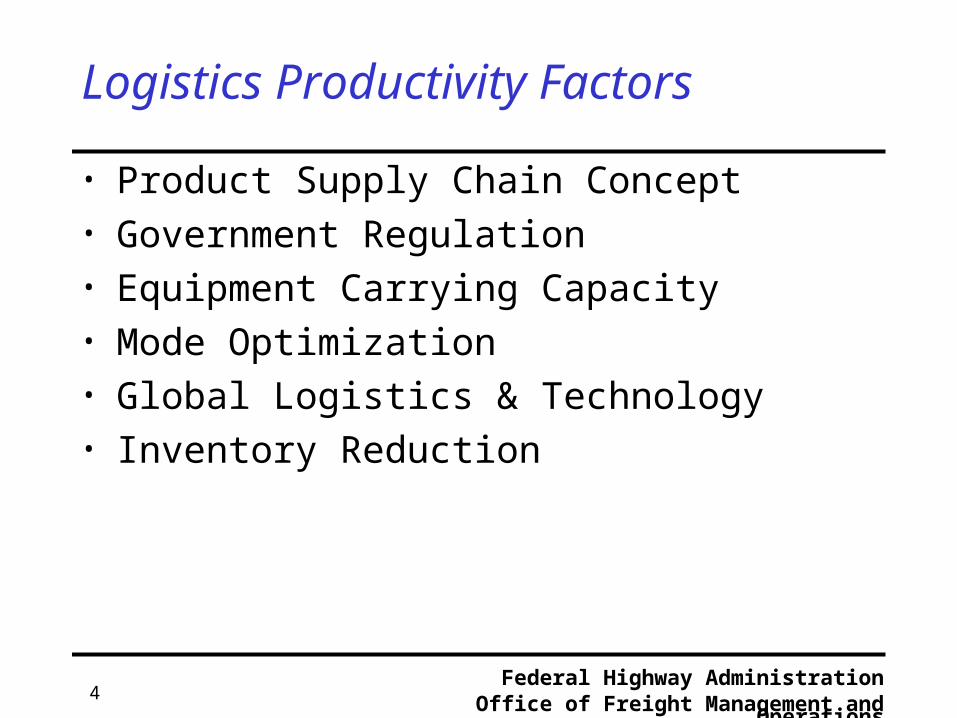
Logistics Productivity Factors
• Product Supply Chain Concept• Government Regulation• Equipment Carrying Capacity• Mode Optimization• Global Logistics & Technology • Inventory Reduction
Federal Highway AdministrationOffice of Freight Management and Operations5
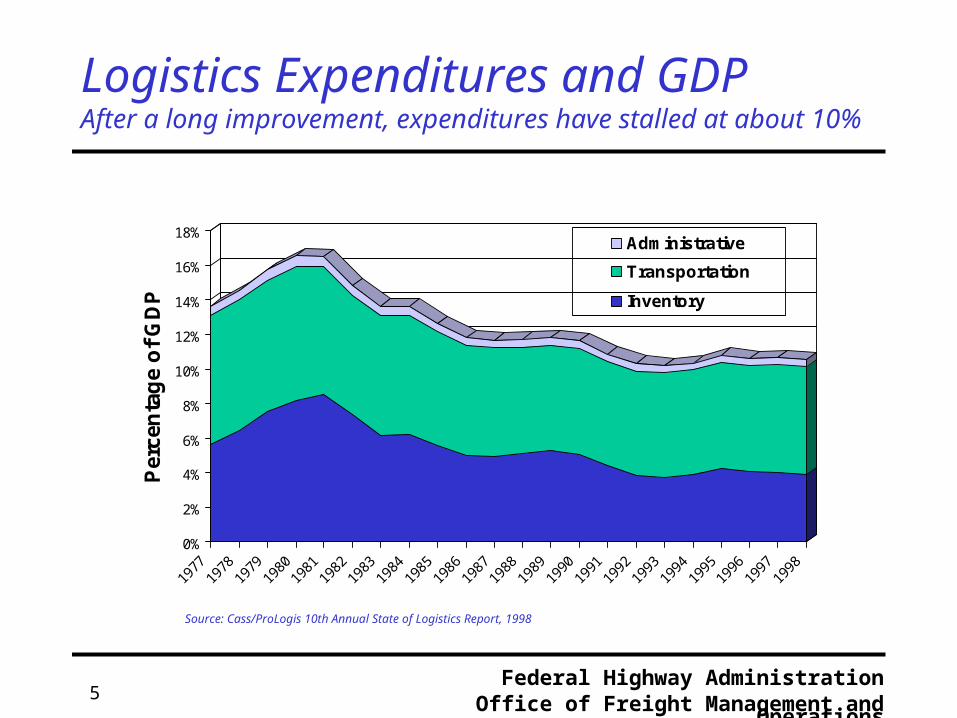
Logistics Expenditures and GDPAfter a long improvement, expenditures have stalled at about 10%
0%
2%
4%
6%
8%
10%
12%
14%
16%
18%
Per
cen
tag
e o
f G
DP
1977
1978
1979
1980
1981
1982
1983
1984
1985
1986
1987
1988
1989
1990
1991
1992
1993
1994
1995
1996
1997
1998
Administrative
Transportation
Inventory
Source: Cass/ProLogis 10th Annual State of Logistics Report, 1998
Federal Highway AdministrationOffice of Freight Management and Operations6
2%
4%
6%
8%
10%
Avera
ge A
nn
ual G
row
th
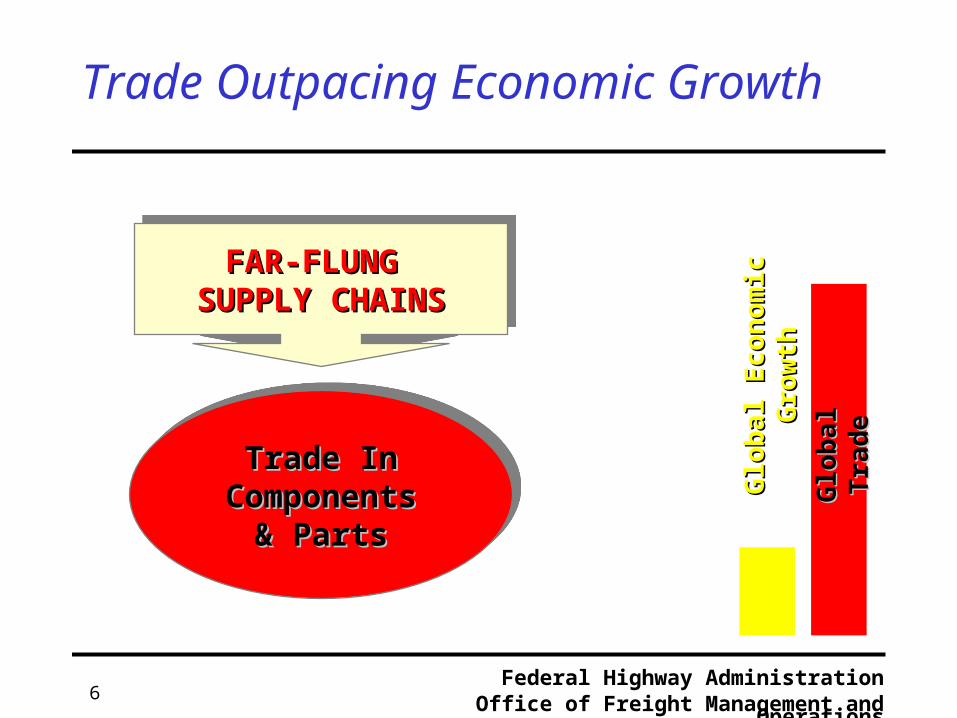
Trade Outpacing Economic Growth
Trade InTrade InComponentsComponents
& Parts& Parts
Trade InTrade InComponentsComponents
& Parts& Parts
FAR-FLUNG FAR-FLUNG SUPPLY CHAINSSUPPLY CHAINS
FAR-FLUNG FAR-FLUNG SUPPLY CHAINSSUPPLY CHAINS
Glo
bal
Glo
bal
Tra
de
Tra
de
Glo
bal Econ
om
ic
Glo
bal Econ
om
ic
Gro
wth
Gro
wth
Federal Highway AdministrationOffice of Freight Management and Operations7
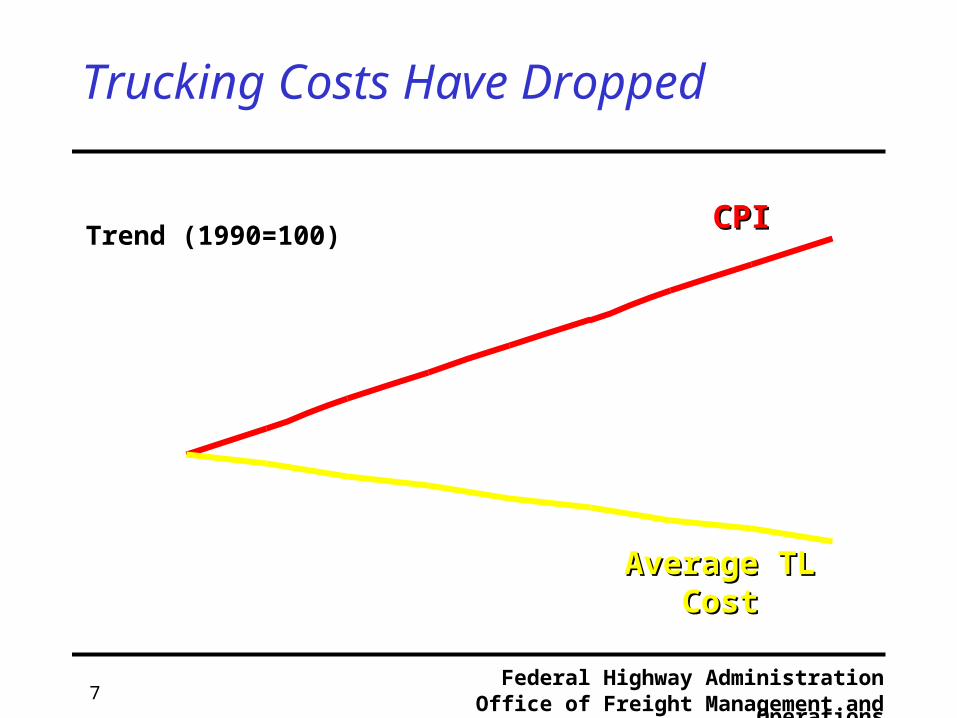
70
100
130
160
1990 1991 1992 1993 1994 1995 1996 1997 1998
Trucking Costs Have Dropped
CPICPI
Average TL Average TL CostCost
Trend (1990=100)
Federal Highway AdministrationOffice of Freight Management and Operations8
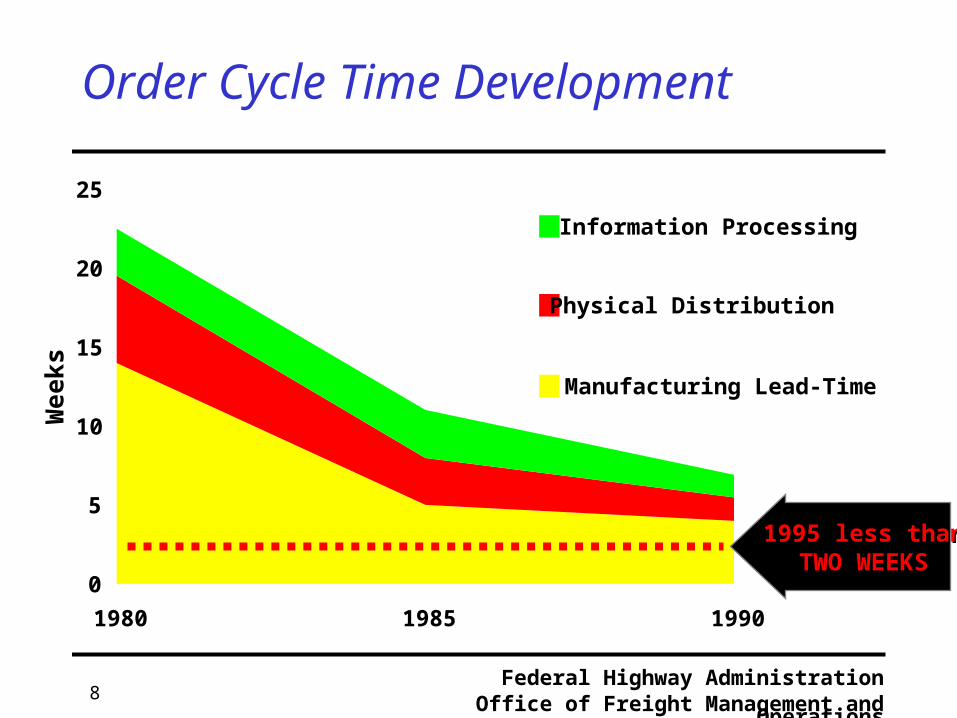
0
5
10
15
20
25
1980 1985 1990
Weeks
Order Cycle Time Development
Information Processing
Physical Distribution
Manufacturing Lead-Time
1995 less thanless thanTWO WEEKSTWO WEEKS
Federal Highway AdministrationOffice of Freight Management and Operations9
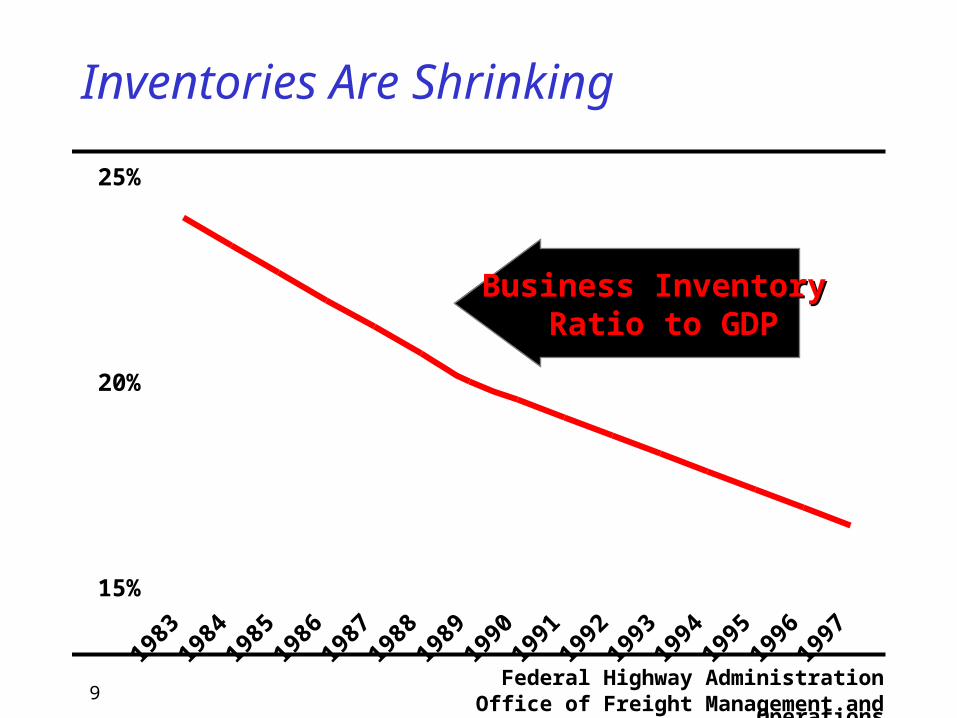
15%
20%
25%
1983
1984
1985
1986
1987
1988
1989
1990
1991
1992
1993
1994
1995
1996
1997
Inventories Are Shrinking
Business Inventory Business Inventory Ratio to GDPRatio to GDP
Federal Highway AdministrationOffice of Freight Management and Operations10
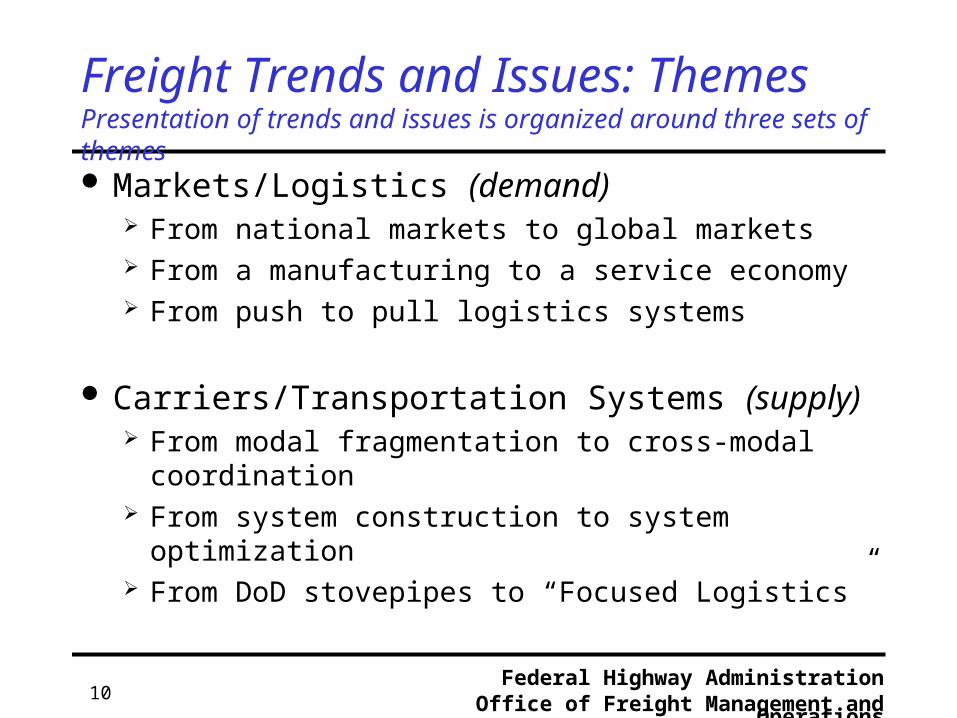
Freight Trends and Issues: ThemesPresentation of trends and issues is organized around three sets of themes Markets/Logistics (demand)
From national markets to global markets From a manufacturing to a service economy From push to pull logistics systems
Carriers/Transportation Systems (supply) From modal fragmentation to cross-modal coordination From system construction to system optimization From DoD stovepipes to “Focused Logistics”
Federal Highway AdministrationOffice of Freight Management and Operations11
Themes (continued)
Public Policy From economic deregulation to safety regulation From modal to multi-modal surface transportation
policy From low visibility to environmental accountability
Federal Highway AdministrationOffice of Freight Management and Operations12
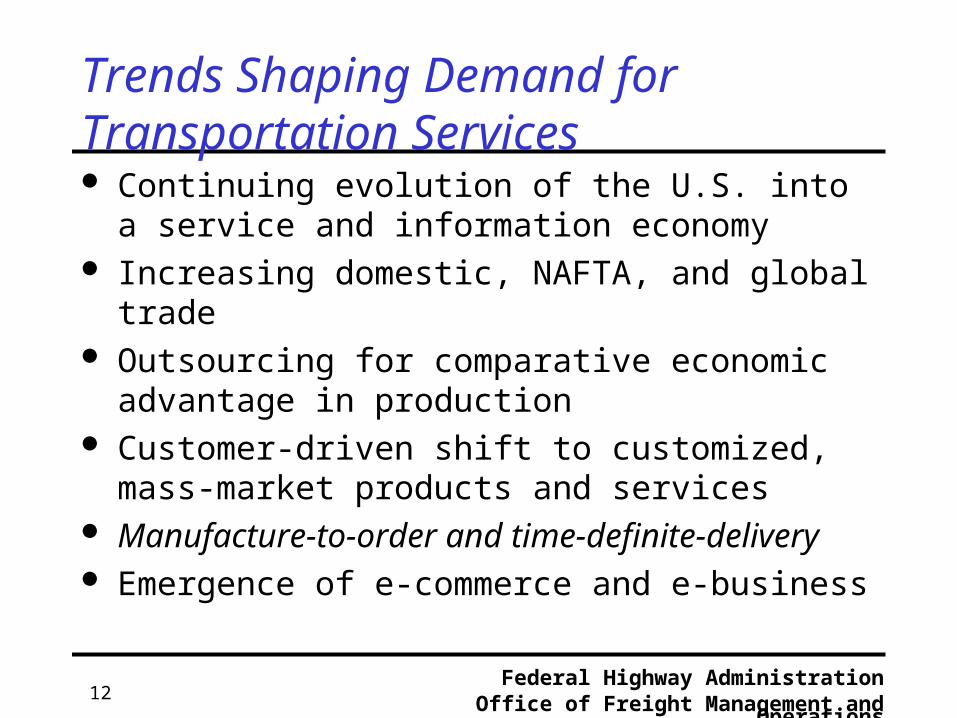
Trends Shaping Demand for Transportation Services Continuing evolution of the U.S. into a service
and information economy Increasing domestic, NAFTA, and global trade Outsourcing for comparative economic advantage
in production Customer-driven shift to customized, mass-market
products and services Manufacture-to-order and time-definite-delivery Emergence of e-commerce and e-business
Federal Highway AdministrationOffice of Freight Management and Operations13
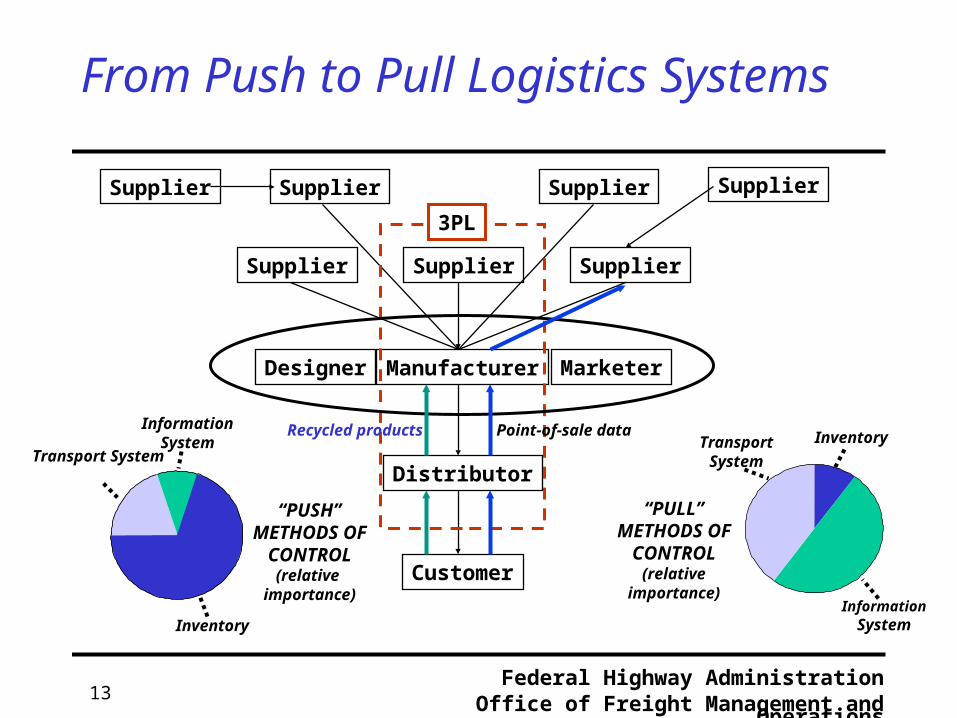
Supplier Supplier Supplier
Distributor
Customer
Manufacturer
Supplier Supplier Supplier Supplier
3PL
MarketerDesigner
Inventory
InformationSystem
Transport System
“PUSH”METHODS OF
CONTROL(relative
importance)
Inventory
InformationSystem
Transport System
“PULL”METHODS OF
CONTROL(relative
importance)
Point-of-sale dataRecycled products
From Push to Pull Logistics Systems
Federal Highway AdministrationOffice of Freight Management and Operations14
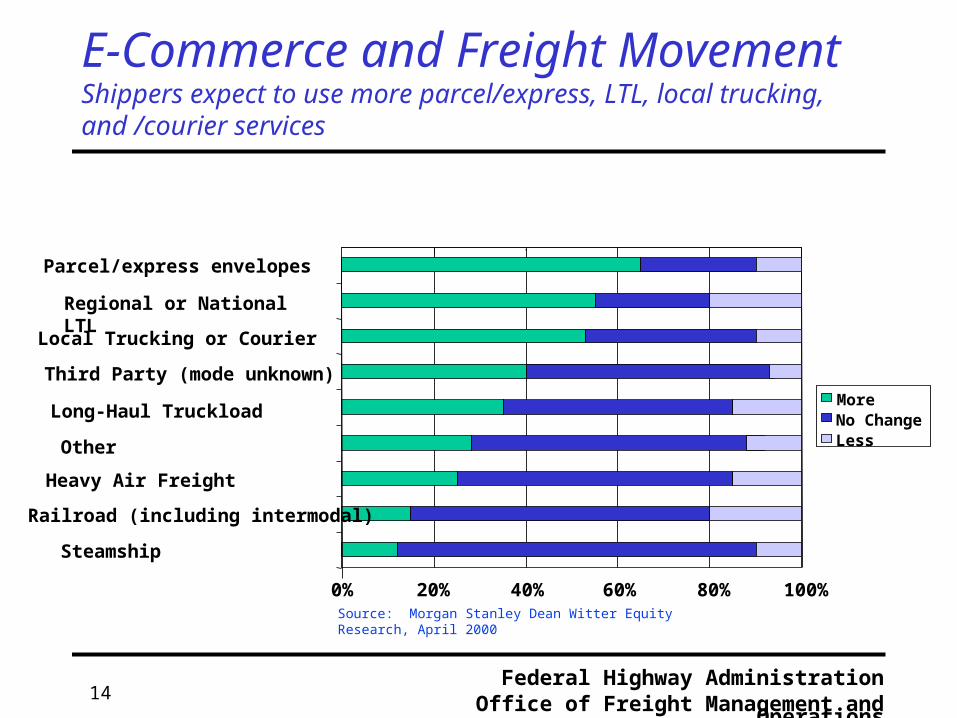
0% 20% 40% 60% 80% 100%
Parcel/express envelopes
Regional or National LTL
Local Trucking or Courier
Third Party (mode unknown)
Long-Haul Truckload
Other
Heavy Air Freight
Railroad (including intermodal)
Steamship
MoreNo ChangeLess
Source: Morgan Stanley Dean Witter Equity Research, April 2000
E-Commerce and Freight MovementShippers expect to use more parcel/express, LTL, local trucking, and /courier services
Federal Highway AdministrationOffice of Freight Management and Operations15
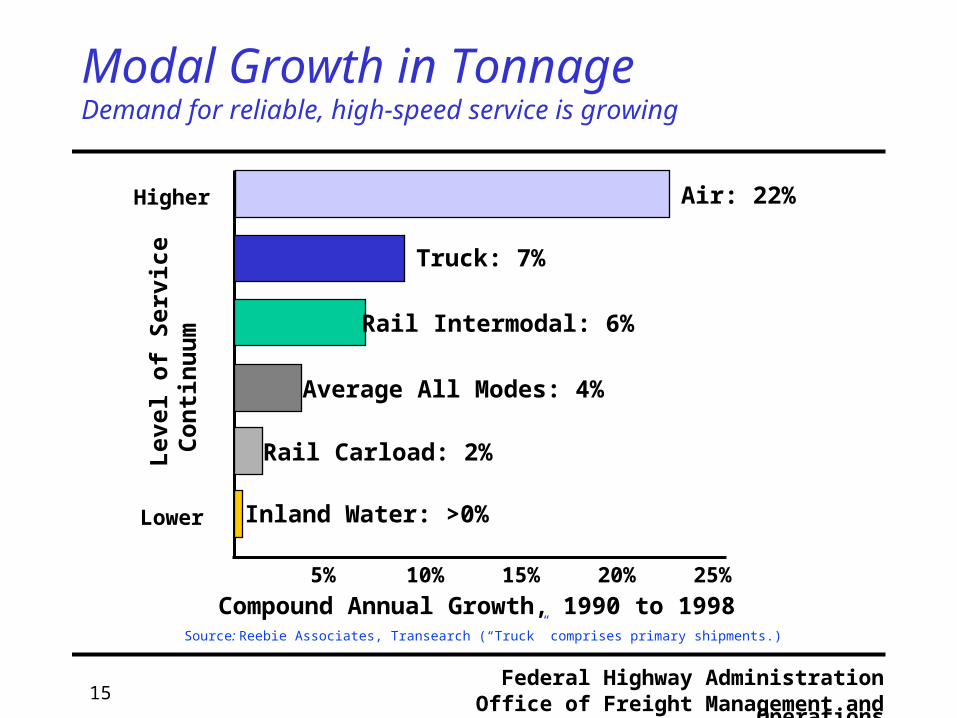
Source: Reebie Associates, Transearch (“Truck” comprises primary shipments.)
Air: 22%
Truck: 7%
Rail Intermodal: 6%
Average All Modes: 4%
Rail Carload: 2%
Inland Water: >0%
Higher
Lower
5% 10% 15% 20% 25%
Compound Annual Growth, 1990 to 1998
Lev
el o
f S
ervi
ce C
on
tin
uu
m
Modal Growth in Tonnage Demand for reliable, high-speed service is growing
Federal Highway AdministrationOffice of Freight Management and Operations16
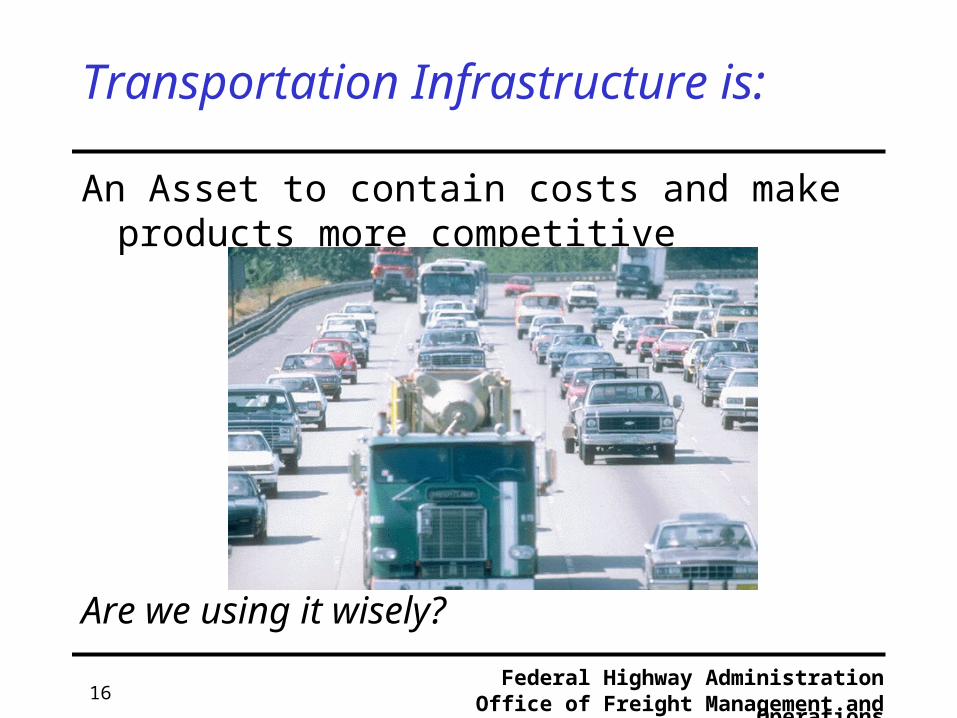
Transportation Infrastructure is:
An Asset to contain costs and make products more competitive
Are we using it wisely?
Federal Highway AdministrationOffice of Freight Management and Operations17
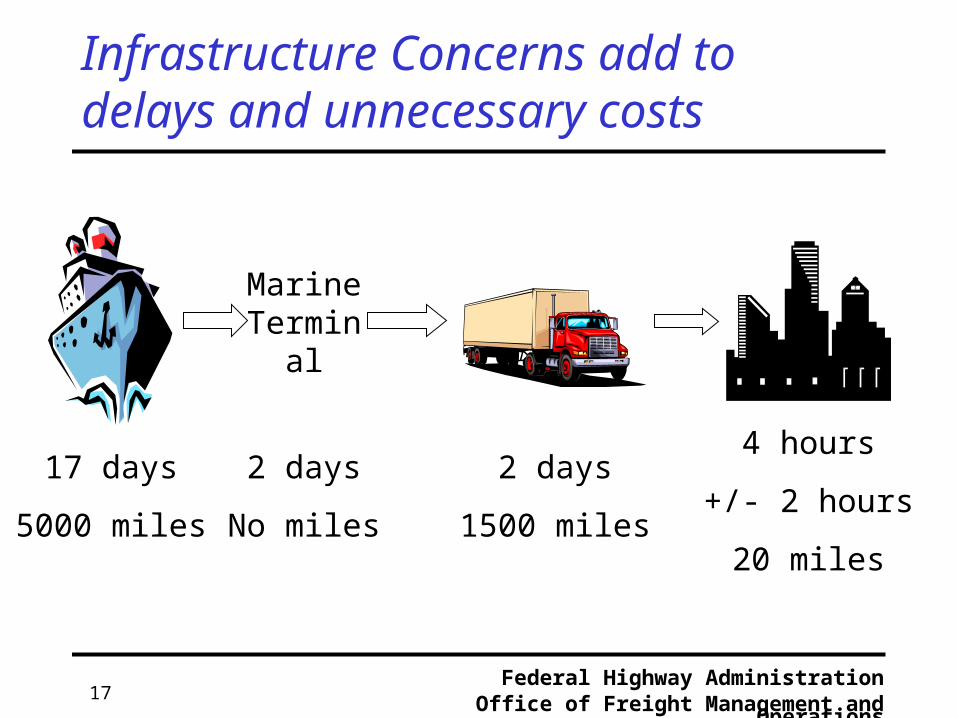
17 days
5000 miles
2 days
No miles
Marine Terminal
4 hours
+/- 2 hours
20 miles
Infrastructure Concerns add to delays and unnecessary costs
2 days
1500 miles
Federal Highway AdministrationOffice of Freight Management and Operations18
Top Gateways for International Freight Exports and imports in tons
Exports
Imports
Federal Highway AdministrationOffice of Freight Management and Operations19
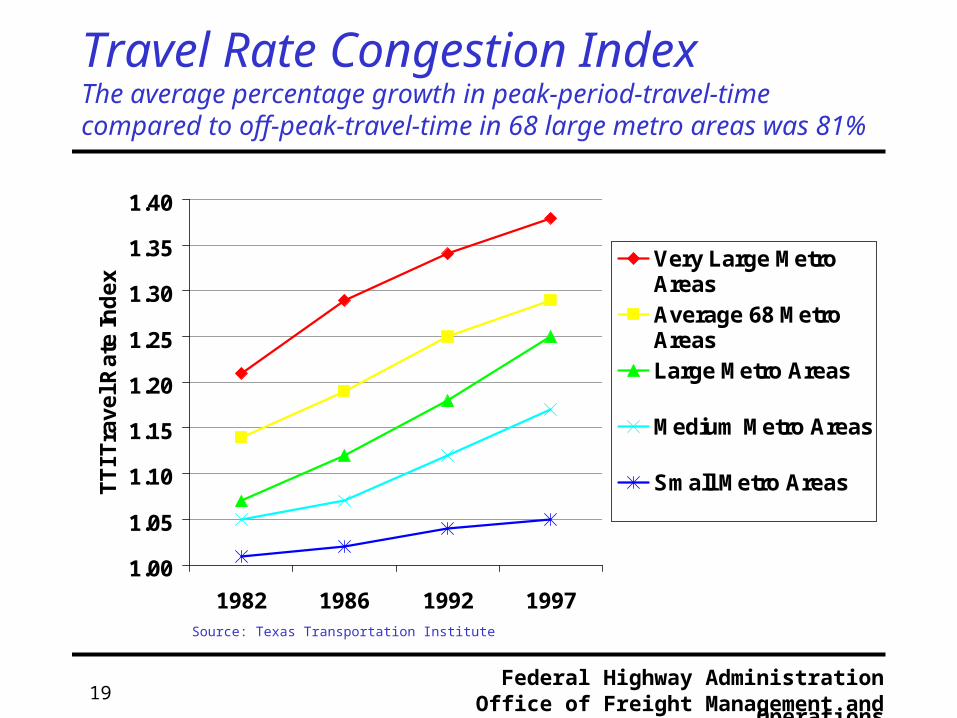
Source: Texas Transportation Institute
Travel Rate Congestion IndexThe average percentage growth in peak-period-travel-time compared to off-peak-travel-time in 68 large metro areas was 81%
1.00
1.05
1.10
1.15
1.20
1.25
1.30
1.35
1.40
1982 1986 1992 1997
TT
I Tra
ve
l Ra
te In
de
x
Very Large MetroAreasAverage 68 MetroAreasLarge Metro Areas
Medium Metro Areas
Small Metro Areas
Federal Highway AdministrationOffice of Freight Management and Operations20
0
500
1000
1500
2000
2500
3000
3500
4000
Air Highway Class I Rail NavigationChannel
Pipeline
Sy
ste
m M
iles
(th
ou
sa
nd
s)
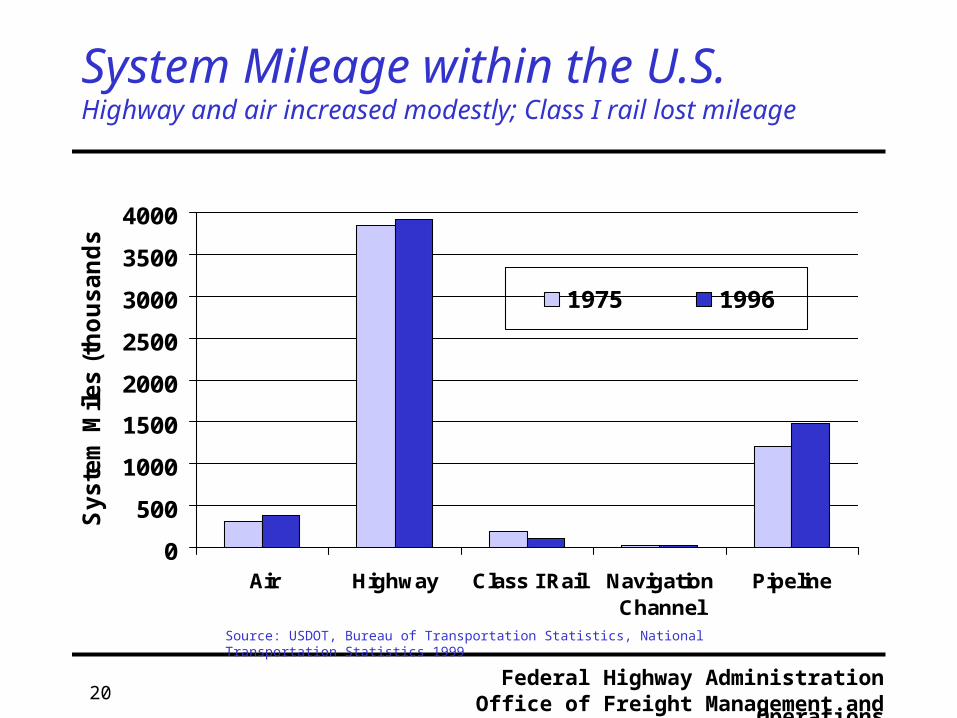
1975 1996
Source: USDOT, Bureau of Transportation Statistics, National Transportation Statistics 1999
System Mileage within the U.S.Highway and air increased modestly; Class I rail lost mileage
Federal Highway AdministrationOffice of Freight Management and Operations21
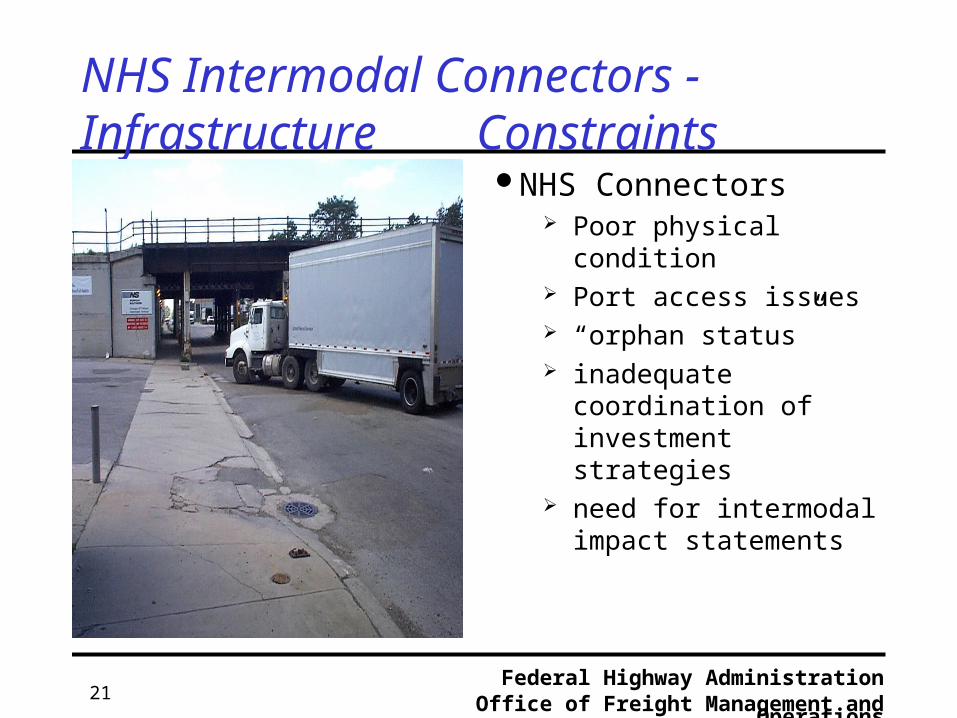
NHS Intermodal Connectors - Infrastructure Constraints
NHS Connectors Poor physical condition Port access issues “orphan status” inadequate coordination of
investment strategies need for intermodal impact
statements
Federal Highway AdministrationOffice of Freight Management and Operations22
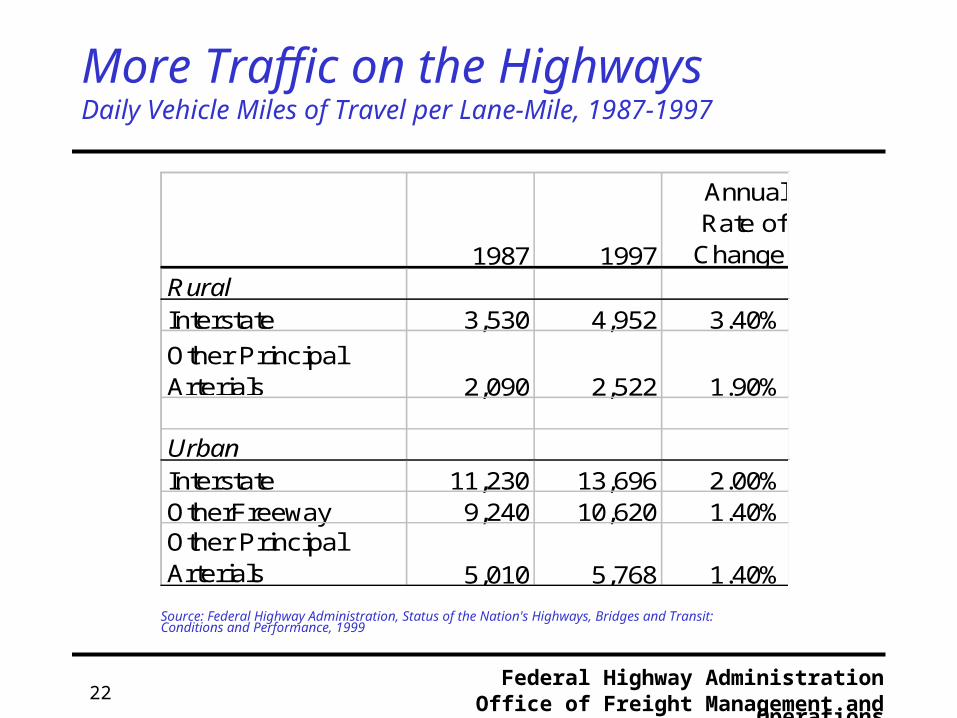
More Traffic on the HighwaysDaily Vehicle Miles of Travel per Lane-Mile, 1987-1997
1987 1997
Annual Rate of
Change RuralInterstate 3,530 4,952 3.40%
Other Principal Arterials 2,090 2,522 1.90%
UrbanInterstate 11,230 13,696 2.00%OtherFreeway 9,240 10,620 1.40%Other Principal Arterials 5,010 5,768 1.40%
Source: Federal Highway Administration, Status of the Nation's Highways, Bridges and Transit: Conditions and Performance, 1999

Federal Highway AdministrationOffice of Freight Management and Operations23
Source: Regan & Golob, Transportation Journal, Sep. 99
California Motor Carriers’ Perception of Congestion and ResponseCarriers are investing in technology to counter increasing congestion
82% see congestion as serious or critical
Costs of slower speed Scheduling problems Driver morale Accidents & insurance Higher fuel & maintenance
85% see congestion worsening over next five years
Carrier Use of Mobile Communications, Pre-Pass
Transponders, and Automatic Vehicle Location Systems
0%10%20%30%40%50%60%70%80%
Comm Pre-Pass AVL

Federal Highway AdministrationOffice of Freight Management and Operations24
Compound Annual Growth, 1998 to 2010
Regional GNP Growth Rates to 2010
3.0%
3.1%
3.4%
3.4%
3.4%
3.4%
3.5%
3.6%
4.4%
0.0% 1.0% 2.0% 3.0% 4.0% 5.0%
NEW ENGLAND
MIDDLE ATLANTIC
EAST SOUTH CENTRAL
EAST NORTH CENTRAL
PACIFIC
WEST SOUTH CENTRAL
WEST NORTH CENTRAL
SOUTH ATLANTIC
MOUNTAIN
Federal Highway AdministrationOffice of Freight Management and Operations25
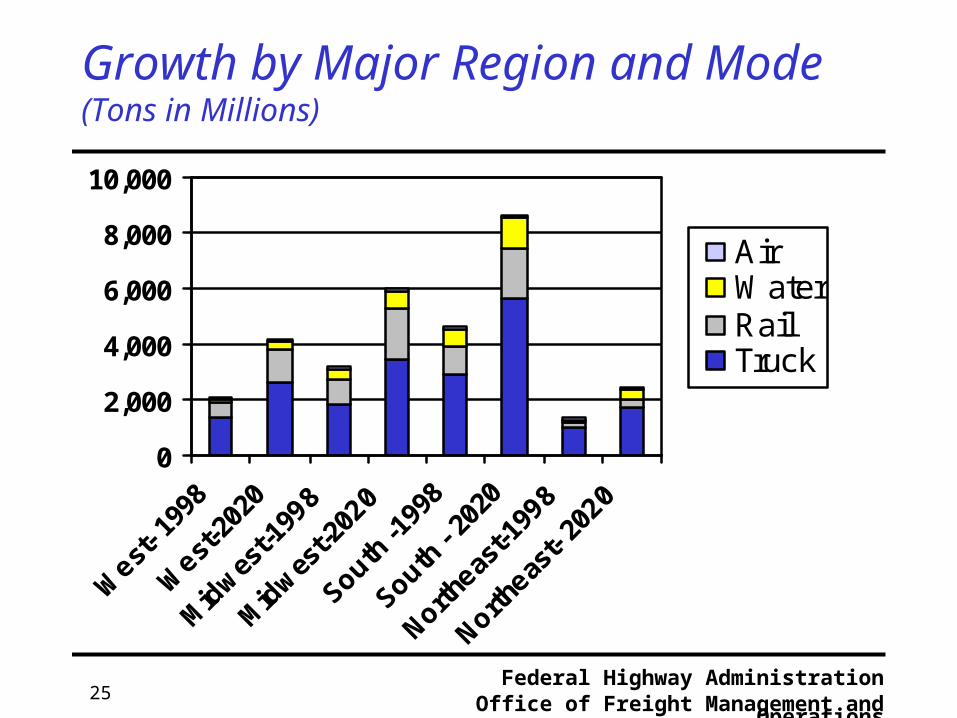
Growth by Major Region and Mode(Tons in Millions)
0
2,000
4,000
6,000
8,000
10,000
West
- 199
8
West
-202
0
Mid
wes
t-199
8
Mid
wes
t-202
0
South -1
998
South -
2020
Northeas
t-199
8
Northeas
t- 20
20
AirWaterRailTruck
Federal Highway AdministrationOffice of Freight Management and Operations26
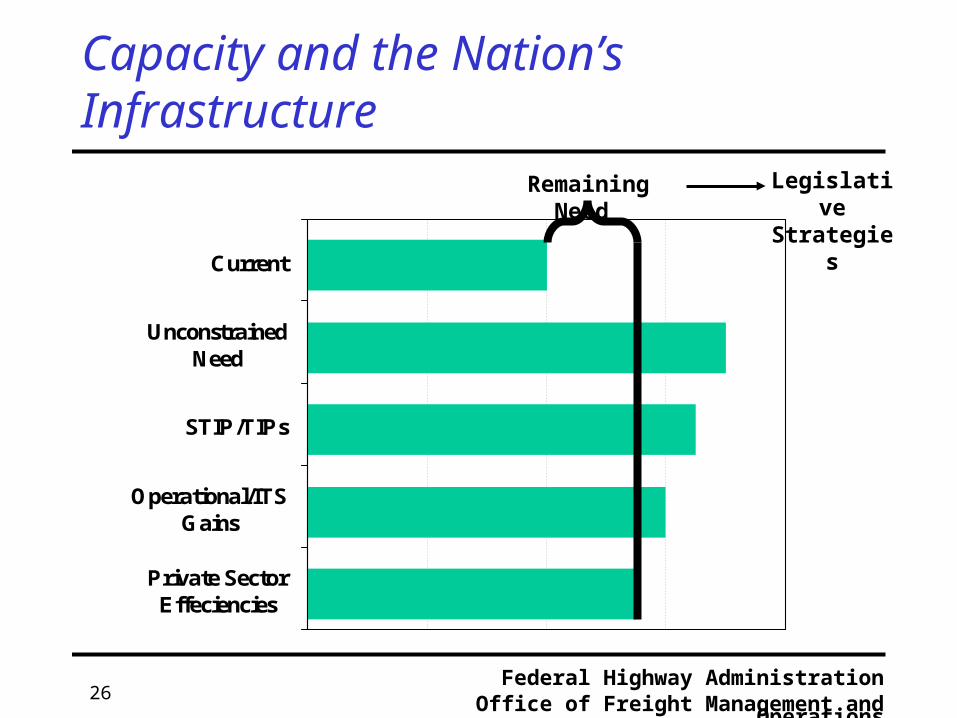
Private SectorEffeciencies
Operational/ITSGains
STIP/TIPs
UnconstrainedNeed
Current
Capacity and the Nation’s Infrastructure
Remaining Need Legislative Strategies
Federal Highway AdministrationOffice of Freight Management and Operations27
From System Construction to System Optimization Highway congestion, especially landside access to ports
and terminals Insufficient rail and intermodal terminal capacity fragmented operational strategies; immature national and
international ITS and automated identification standards Shortages of labor and skills Limitation of public and private finance for system
maintenance and new capacity Public-public and public-private integration of ITS and IT
systems
Federal Highway AdministrationOffice of Freight Management and Operations28
From Modal to Multi-Modal Surface Transportation Policy Trends
Evolving public sector awareness of the need for multi-modal policy, planning, and investment (ISTEA and TEA-21)
Increasing state and local control of transportation investment
Increasing use of highway trust funds for system preservation
Growing demand to re-link transportation investment and economic development
Federal Highway AdministrationOffice of Freight Management and Operations29
From Modal to Multi-Modal Surface Transportation Policy (continued) Implications for freight
More complex planning and investment environment Mismatch between scale of transport operations
(increasingly regional and global) and public sector jurisdictions (local and state)
Issues Role of multistate freight and trade corridor programs Identifying and financing freight projects of national
significance Use of highway trust funds for non-highway freight
projects
Federal Highway AdministrationOffice of Freight Management and Operations30
From Modal to Multi-Modal Surface Transportation Policy (continued)
Issues ... Slow, inflexible public planning and project delivery
compared to private sector Disjointed modal planning Difficult to engage private sector freight interests in
state and MPO planning processes; limited freight representation
Inadequate freight planning data and analysis tools
Federal Highway AdministrationOffice of Freight Management and Operations31
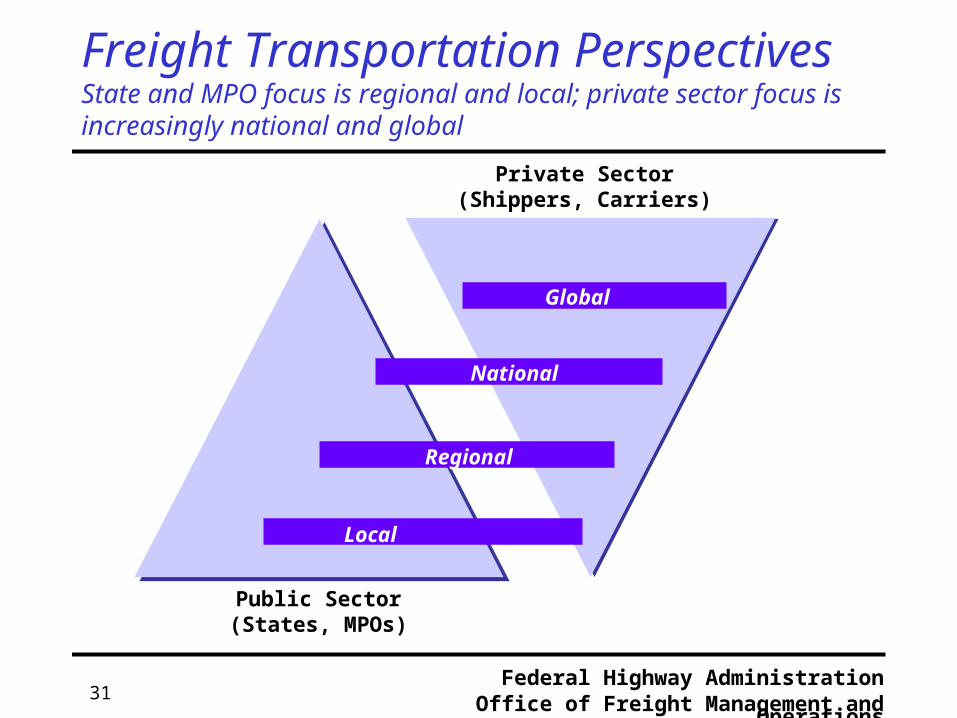
Public Sector(States, MPOs)
Private Sector(Shippers, Carriers)
Global
National
Regional
Local
Freight Transportation PerspectivesState and MPO focus is regional and local; private sector focus is increasingly national and global
Federal Highway AdministrationOffice of Freight Management and Operations32
Why Identified Projects Go Unprogrammed Low priority in State/MPO plans Lack of local match or sponsorship Lack of private sector participation Neighborhood/Community opposition Environmental concerns Physical/Other Constraints
Federal Highway AdministrationOffice of Freight Management and Operations33
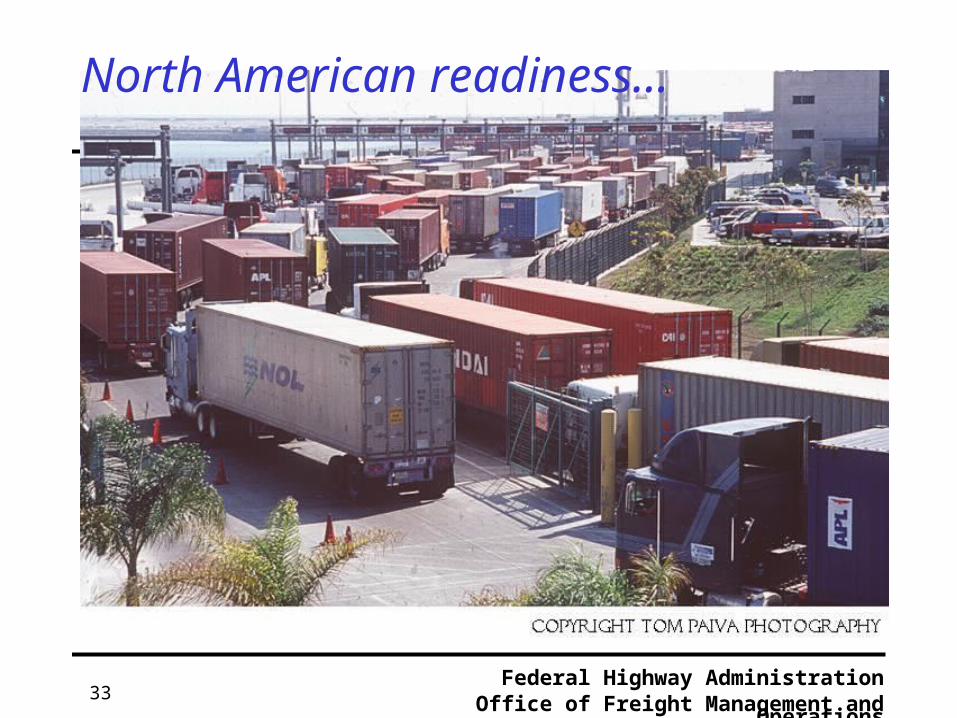
North American readiness…
Federal Highway AdministrationOffice of Freight Management and Operations34
The Challenge
Over the past 20 years, highway travel demand has increased an average of over 3.0 percent per year
During that same time, highway capacity has increased at a rate of 0.3 percent per year.
Over the next 20 years, freight movements are expected to double, with more intense growth in major traffic lanes, hubs, and POE
customer expectations will increase; environmental issues will intensify
Federal Highway AdministrationOffice of Freight Management and Operations35
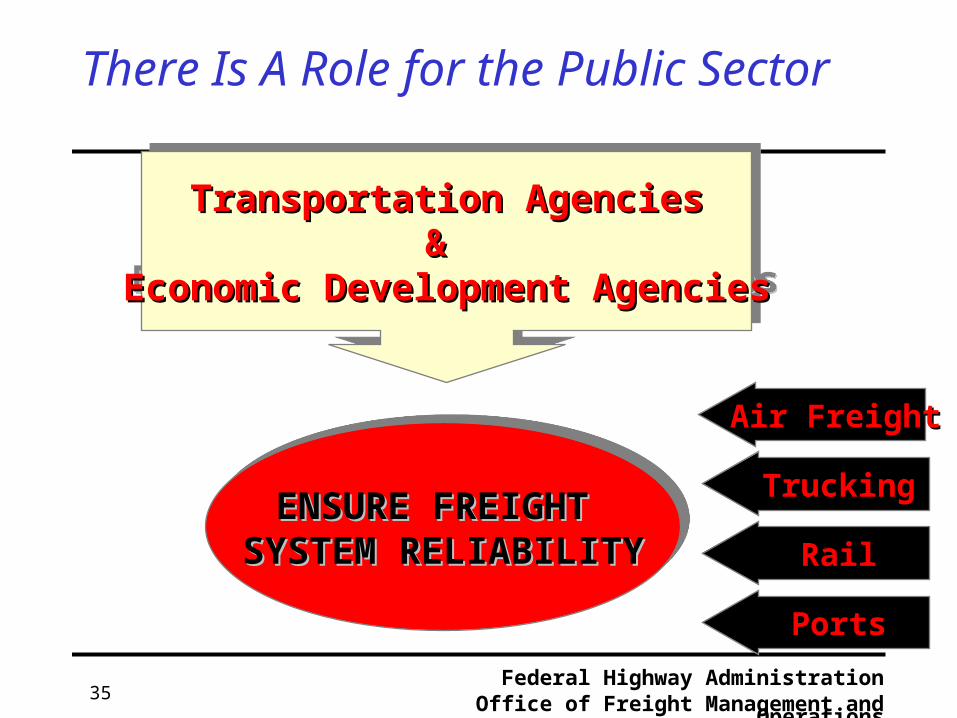
There Is A Role for the Public Sector
ENSURE FREIGHT ENSURE FREIGHT SYSTEM RELIABILITYSYSTEM RELIABILITYENSURE FREIGHT ENSURE FREIGHT
SYSTEM RELIABILITYSYSTEM RELIABILITY
Transportation AgenciesTransportation Agencies& &
Economic Development AgenciesEconomic Development Agencies
Transportation AgenciesTransportation Agencies& &
Economic Development AgenciesEconomic Development Agencies
Air FreightAir Freight
TruckingTrucking
RailRail
PortsPorts
Federal Highway AdministrationOffice of Freight Management and Operations36
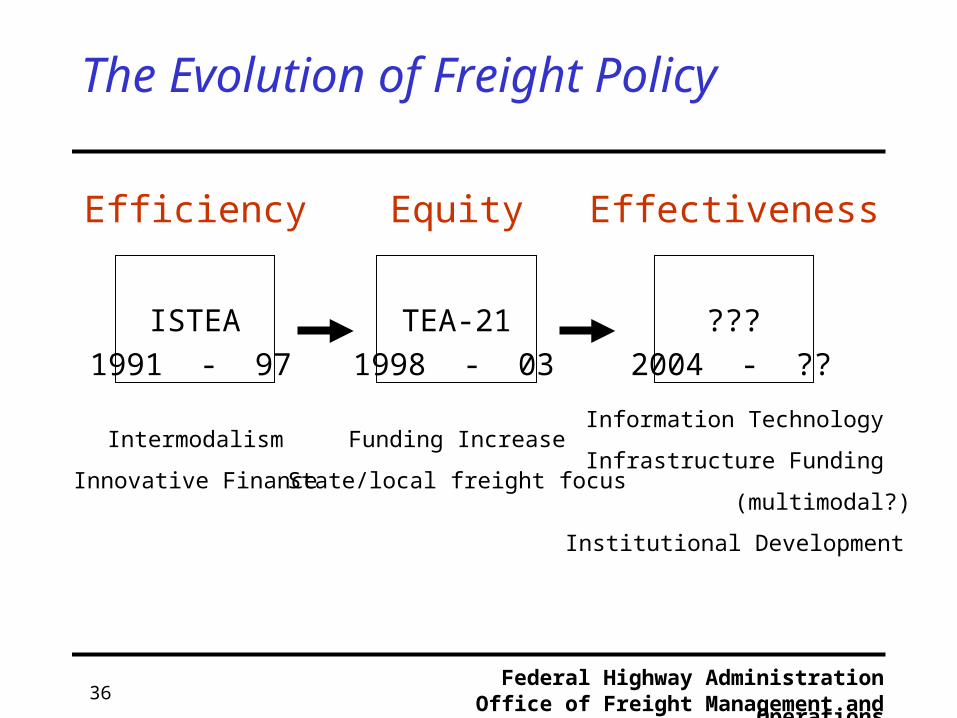
ISTEA
Intermodalism
Innovative Finance
TEA-21
Funding Increase
State/local freight focus
???
Information Technology
Infrastructure Funding
(multimodal?)
Institutional Development
Efficiency Equity Effectiveness
1991 - 97 1998 - 03 2004 - ??
The Evolution of Freight Policy
Federal Highway AdministrationOffice of Freight Management and Operations37
Future Challenges
Institutional Development - break the paradigms
Encouraging multistate, regional, and binational intermodal freight coalitions
Establishing statewide and metropolitan freight advisory groups
Developing tools to evaluate freight improvement options

Federal Highway AdministrationOffice of Freight Management and Operations38
Future Challenges - 3 I’s
Information Technology - leverage technology to optimize system performance
ITS - need full deployment; links throughout supply chain Border crossings and ports of entry - national security,
trade processing, credentialing Data needs - develop real-time operations information
system - technology as enabler
Federal Highway AdministrationOffice of Freight Management and Operations39
Future Challenges
Infrastructure - early planning & public/private partnerships
Improve financing options - eligibility issues…multijurisdictional infrastructure banks
Develop financing guidelines Raise freight concerns during the planning process
Federal Highway AdministrationOffice of Freight Management and Operations40
Logistics Challenges….Policy Responses Comprehensive ops strategy…intermodal ITS support for private sector efficiency gains data and analytical development corridor and border support creation of RCOEs to support inst. dev. Initiate FDP…planning, prog, finance initiate pilot projects illustrating each element
independent T&E
NAFTA component...variations of the above