local spatially dependent driving forces of urban...
TRANSCRIPT

TitleLocal spatially dependent driving forces of urban expansion inan emerging Asian megacity: The case of Greater Jakarta(Jabodetabek)
Author(s) Pravitasari, Andrea Emma; Saizen, Izuru; Tsutsumida,Narumasa; Rustiadi, Ernan; Pribadi, Didit Okta
Citation Journal of Sustainable Development (2015), 8(1): 108-119
Issue Date 2015-01-28
URL http://hdl.handle.net/2433/210474
Right
Copyright for this article is retained by the author(s), with firstpublication rights granted to the journal. This is an open-accessarticle distributed under the terms and conditions of theCreative Commons Attribution license(http://creativecommons.org/licenses/by/3.0/).
Type Journal Article
Textversion publisher
Kyoto University

Journal of Sustainable Development; Vol. 8, No. 1; 2015 ISSN 1913-9063 E-ISSN 1913-9071
Published by Canadian Center of Science and Education
108
Local Spatially Dependent Driving Forces of Urban Expansion in an Emerging Asian Megacity: The Case of Greater Jakarta (Jabodetabek)
Andrea Emma Pravitasari1,2, Izuru Saizen1, Narumasa Tsutsumida1,3, Ernan Rustiadi2 & Didit Okta Pribadi4 1 Graduate School of Global Environmental Studies, Kyoto University, Japan 2 Faculty of Agriculture, Bogor Agricultural University, Indonesia 3 Department of Geography, University of Leicester, Leicester, UK
4 Chair for Strategic Landscape Planning and Management, Center for Life and Food Sciences Weihenstephan, Technische Universität München, Germany
Correspondence: Andrea Emma Pravitasari, Laboratory of Regional Planning, Graduate School of Global Environmental Studies, 2nd Floor, Research Building. No.5, Main Campus, Kyoto University, Yoshida-honmachi, Sakyo-ku, Kyoto-city, Japan, 606-8501. Tel: 81-75-753-6370; 81-90-6609-7090. E-mail: [email protected]; [email protected]
Received: October 8, 2014 Accepted: November 21, 2014 Online Published: January 28, 2015
doi:10.5539/jsd.v8n1p108 URL: http://dx.doi.org/10.5539/jsd.v8n1p108
This research was supported by JSPS KAKENHI Grant Number 25360010.
Abstract Urban expansion and urbanization have been continuing to grow rapidly, especially in Asian megacities. Greater Jakarta (Jabodetabek) has emerged as the world’s second largest urban area, with a population of 28 million in 2010, where urban expansion has a significant impact on the local as well as the global environment. Efforts to control urban expansion must start from a clear understanding of its various driving forces at a local, regional, and global level. Studies of the interdependencies between these driving forces in the local spatial relationships in emerging Asian megacities remain limited. This study explores the driving forces of urban expansion in Jabodetabek by considering local spatial dependency and analyzes the spatial characteristics of this urbanized area as well as identifies spatial variations in the relationship between urban expansion and its driving forces by using Geographically Weighted Regression. The presented findings show that the driving forces affecting urban expansion in the Jabodetabek region vary spatially. Owing to the influence of the global and regional economies on Jabodetabek, we find that the demographic, infrastructural, and natural elements driving forces significantly affect urban expansion in this region according to location. Outside the core of this megacity, urban expansion in most areas is significantly affected by local demographic as well as infrastructural driving forces. Jakarta city, as the core of the Jabodetabek megacity, is becoming independent of these local driving forces, however, since it is now more characterized as a global city and thus tending to have more linkages with the world market. Keywords: geographically weighted regression, Jabodetabek, local spatial dependency, megacity, urban expansion
1. Introduction Urbanization, or the concentration of people in cities, has radically transformed societies in recent years. More people tend to live in cities because they are major centers of urban development, innovation, culture, and economic activity (Angel, Parent, Civco, & Blei, 2011). Cities play an important role as the engine of the global economy, generating 80–95% of the world’s GDP (Seto, Fragkias, Guneralp, & Reilly, 2011). However, the rapid growth of cities has led to global environmental changes and emerging social costs. Many issues concerning the growth of cities such as climate change, carbon emissions, the urban heat island, urban sprawl, the loss of prime agricultural land, increasing water and air pollution, overcrowding, crime, traffic congestion, poverty, and social exclusion are often associated with urbanization (Bolay, 2012; Zhao, 2010; United Nations Habitat [UN Habitat], 2008; Hasse & Lathrop, 2003). About 75% of global energy consumption and 80% of greenhouse gas emissions occur in cities (Geng, Peng, & Tian, 2011). In addition, wealth in cities is unequally distributed, with around 30% of the urban population living in slums or poor informal settlements that lack basic services (United Nations
www.ccsenet.org/jsd Journal of Sustainable Development Vol. 8, No. 1; 2015
109
Water Decade Programme on Advocacy and Communication [UNW-DPAC], 2010). Such informal settlements have often emerged as a result of rapid and uncontrolled urbanization due to immigration, the incapacity of public and private institutions to provide low-income housing, and inappropriate land administration and planning (Davis, 2008; Zhu, 2010). Moreover, they will continue to grow to accommodate population growth since they constitute an important source of urban housing in low and middle-income countries (Fernandes, 2011), where recent population growth and urban expansion has been concentrated (Angel et al., 2011; World Bank, 2011). By 2050, 95% of urban expansion is expected to take place in such countries (UNW-DPAC, 2010).
In some countries, urban areas have grown so rapidly they have become “megacities” (i.e., urban areas with a population of more than 10 million). Today, there are 18 megacities in the world with very diverse characteristics, and most of these are located in developing countries, especially in tropical or temperate zones (Research Institute of Human and Nature [RIHN], 2014). These megacities have created unprecedented intricate patterns of human–environment interactions, each having a massive influence on the other cities and on the global environment. Because Asian megacities typically sprout from several urban centers (Ng & Hills, 2003), their urbanization patterns differ from the city growth experienced in Western countries. Urbanization and growth in Asian megacities, while showing some of the characteristics of Western urbanization, also exhibit features unique to Asian countries (Murakami, Zain, Takeuchi, Tsunekawa, & Yokota, 2005). Several studies have pointed out land-use mixture as a major feature of Asian urbanization. McGee (1991), for example, indicated that rapid urban growth creates a chaotic mixture of urban and rural land use that results in serious environmental problems and a lack of adequate urban infrastructure. Living wisely in a megacity could thus become one of the most important dimensions of sustainability in the global environment, because megacity residents are the first to be impacted by both global and local environmental problems, even though they receive significant social and economic benefits from urban life.
Controlling and managing megacities in a sustainable way is needed to encourage the future prosperity of humanity and its coexistence with the global environment. To mitigate global environmental problems while improving the quality of local people’s lives, it is important to identify the characteristics of megacities. Understanding the spatial characteristics of urbanized areas in all megacities is therefore highly recommended because of their diverse characteristics, which can be analyzed by exploring the driving forces of their urban expansion patterns.
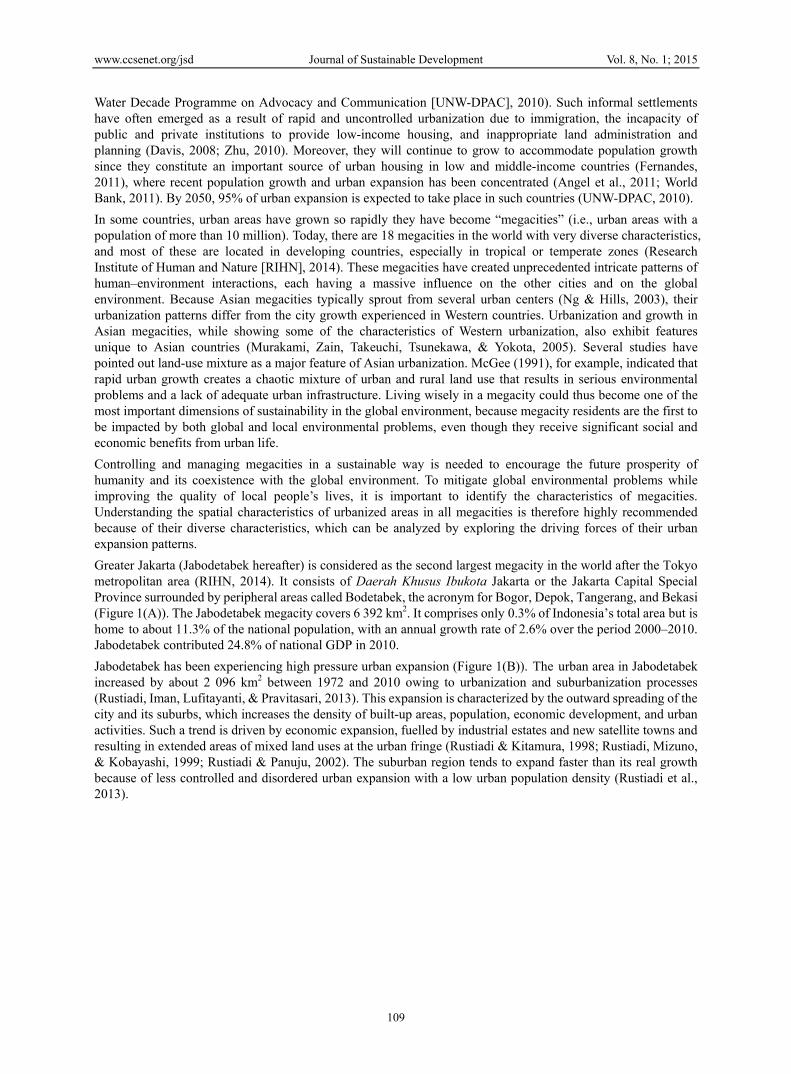
Greater Jakarta (Jabodetabek hereafter) is considered as the second largest megacity in the world after the Tokyo metropolitan area (RIHN, 2014). It consists of Daerah Khusus Ibukota Jakarta or the Jakarta Capital Special Province surrounded by peripheral areas called Bodetabek, the acronym for Bogor, Depok, Tangerang, and Bekasi (Figure 1(A)). The Jabodetabek megacity covers 6 392 km2. It comprises only 0.3% of Indonesia’s total area but is home to about 11.3% of the national population, with an annual growth rate of 2.6% over the period 2000–2010. Jabodetabek contributed 24.8% of national GDP in 2010.
Jabodetabek has been experiencing high pressure urban expansion (Figure 1(B)). The urban area in Jabodetabek increased by about 2 096 km2 between 1972 and 2010 owing to urbanization and suburbanization processes (Rustiadi, Iman, Lufitayanti, & Pravitasari, 2013). This expansion is characterized by the outward spreading of the city and its suburbs, which increases the density of built-up areas, population, economic development, and urban activities. Such a trend is driven by economic expansion, fuelled by industrial estates and new satellite towns and resulting in extended areas of mixed land uses at the urban fringe (Rustiadi & Kitamura, 1998; Rustiadi, Mizuno, & Kobayashi, 1999; Rustiadi & Panuju, 2002). The suburban region tends to expand faster than its real growth because of less controlled and disordered urban expansion with a low urban population density (Rustiadi et al., 2013).

www.ccsen
Figure 1
By 2010, tranging froespecially (especiallymost of thRegency (rivers that fuel the sh
Rising popopportunitsuburbanizprocesses affording slums are 1976). SluHuman Sethan 5 milincentive housing scinhabit lan
Like otherand globallocal, regiospatial relathat affectJakarta is global citythat the lo
net.org/jsd
1. (A). Admini
the increasing om 5 km2 to min Bogor, T
y irrigated rice he Bekasi Reg(5%) (Rustiadi
flow through hrinking of agri
pulation growties, and the azation. Howevhas been the emodern/high-cillegal, poor fa
um areas can bettlements Progllion slum dwefor these citizcarcity, and as nd that no one
r emerging Asil environment.onal, and globationship in emt urban expanthe area least
y and it has tenocal variation
istrative Map o
population grmore than 80
Tangerang, andfields) in Jabo
gency (12% oi et al., 2013). those areas heicultural lands
wth, the emergavailability of ver, one negativemergence of sclass residence
families or indibe found in sgram (2003) esellers in Jabodzens to invest these scarcitieelse wants.
ian megacities Efforts to conal driving forcmerging Asian
nsion in the Jaaffected by th
nded to have mof demograph
JABODETABEK
(A)
Journal of Su
of Jabodetabek
rowth in Jabodkm2 in size (Hd Bekasi. Baodetabek coverf the total areIrrigated rice
elp irrigate rices.
gence of new easy transpor
ve impact of raslums. Higher es built by prividuals who deveral spots instimate that 26detabek alone.
in infrastructes increase and
s, the urban exntrol urban expces. Studies of n megacities aabodetabek reghese local drivmore linkages whic, infrastruct
ustainable Devel
110
k; (B) Urban E
detabek had leHerlambang, 2sed on land-ured approximatea of Jabodetafields are spre
e fields. Howe
town projects rtation might aapidly growingland prices in
rivate housing do not earn sufn Jabodetabek6% of Indones The constantture. Rapid urd housing pric
xpansion in Jabpansion must sf the interdepenare still limitedgion vary spa
ving forces. Jakwith regional atural, and natu
lopment
Expansion in Ja
ed to 27 new t2011). Indeed,use/cover chately 1 700 km2
abek), Tangeraead throughouever, rapid urb
and large maall be factors g development the center of companies. A
fficiently are fk, notably alonia’s urban popt threat of demrbanization haces rise, econo
bodetabek has start from a clendencies betwed. We hypotheatially. Howevkarta city has as well as globural elements
1
2
(B
abodetabek fro
own projects i, urban areas aange analysis, 2 in 2010, spreaang Regency (ut Bekasi and Tban developme
anufacturing cthat encouragt or urbanizatiurban areas pr
Although manyforced to live ing the river. R
pulation lives inmolition and evas created probomic constraint
a significant iear understandeen the drivingesize that the lver, we estima
become morebal economic cdriving forces
1993
2010
B)
Vol. 8, No. 1;
om 1993 to 201
in peripheral aare still expan
agricultural ading widely a(7.5%), and BTangerang, anent in this area
centers, greatee urbanizationon/suburbanizrohibit people y of Jabodetabin them (ZorbaReports by then slums, with viction leaves blems of landts force the po
impact on the ding of their vag forces in the ocal driving fo
ate that the cie characterizedcenters. We sus in the region
2015
10.
areas, ding, areas cross
Bogor d the may
r job n and ation from bek’s augh, e UN more little
d and oor to
local arious local orces ty of
d as a spect n are

www.ccsenet.org/jsd Journal of Sustainable Development Vol. 8, No. 1; 2015
111
significantly affecting the urban expansion process in Jabodetabek and are not spatially uniform. A clear picture and more specific about the existence of spatial variation of local elements driving-forces can facilitate planners and policy makers to manage and control urban expansion in the region.
The objectives of this study are thus to explore the driving forces of urban expansion in Jabodetabek by considering the local spatial dependency and to analyze the spatial characteristics of the urbanized area as well as to identify spatial variation in the relationship between urban expansion and its driving forces. To support these goals, Geographically Weighted Regression (GWR) is considered as an appropriate model for this analysis. In recent years, numerous studies have applied GWR to explore spatial variations in the relationship between environmental and socioeconomic indicators (Ogneva-Himmelbrger et al. 2009), regional development (Yu, 2006), population segregation (Yu & Wu, 2004), ecology (Su, Xiao, & Zhang, 2012), natural resources management (Jaimes, Sendra, Delgado, & Plata, 2010; Clement, Orange, Williams, Mulley, & Epprecht, 2009), and social studies (Farrow, Larrea, Hyman, & Lema, 2005; Malczewski & Poetz, 2005). GWR’s ability to show the local spatial dependency of each location can describe the characteristics of spatial relationships among the variables in order to explain urban expansion in Jabodetabek.
2. Materials and Methods GWR attempts to capture spatial variations by allowing the regression model parameters to change over space. Model parameters are estimated by weighting all neighboring observations that have a greater influence on the regression point than those observations further away. GWR then produces a set of local regression results including local parameter estimates and their t-test values for the location of each observation. Visualizations and analyses of the local regression results can demonstrate the spatial variations in the relationships between the dependent and independent variables. Therefore, GWR may serve as a useful tool for exploring spatial variations in the associations between urban expansion and its relevant influencing factors.
GWR is a type of local statistic that assumes that the regression results can change over time. For the location of each observation, it produces a set of local regression results including local parameter estimates and their t-test values, local R2 values, and local residuals. The formula of the GWR model is as follows:
(1)
where Yj is the dependent variable of observation j, Xij is the independent variable Xi at location j, uj and vj are the coordinates for the location of observation j, β0 (uj,vj) is the intercept for observation j, and βi (uj,vj) is the local parameter estimate (regression coefficient) for independent variable Xi at location j.
In this study, the optimal bandwidth was determined by minimizing the corrected Akaike Information Criterion with a correction for finite sample sizes, as described in Fotheringham, Brunsdon, and Chalton (2002). The bi-square kernel has a clear-cut range where kernel weighting is non-zero. This was selected since it is suitable for clarifying local extents for model fitting. By contrast, the adaptive kernel can adapt the size of the bandwidths to the spatial variations in the locations where data are denser, and the number of areas included in the kernel is kept constant so that using the bi-square kernel is secure. The weighting function for the adaptive bi-square kernel bandwidth can be stated in the following form: = (1 − ⁄ ) < ( )0 > ( ) (2)
where Wij is the weight of observation at location j for estimating the coefficient at location i, dij is the Euclidean distance between observations i and j, and ( ) is an adaptive bandwidth size defined as the kth nearest neighbor distance. The regression results of the GWR model including the local parameter estimates and their t-test values were interpreted to examine the spatial variations in the relationships between the dependent and independent variables.
The GWR model was constructed by using ArcGIS 10.2 and GWR 4.0 software. In this study, because the location of an observation was defined by using the longitude and latitude of the district centroid, the adaptive bi-square kernel bandwidth was used. To identify the driving forces that are affecting rapid urban expansion in Jabodetabek, several variables were included in the GWR analysis. The change ratio of the urban area (URB) was selected as the dependent variable (Y). This variable was chosen as a proxy of increasing urban expansion since the rapid growth of built-up or urban areas significantly affects global environmental change by producing greenhouse gas emissions. Based on the literature review, several variables were considered as having
jij
p
ijjijjj vuvu εββ +Χ+=Υ
=10 ),(),(

www.ccsenet.org/jsd Journal of Sustainable Development Vol. 8, No. 1; 2015
112
relationships with urban expansion, such as population growth (Bilsborrow & Okoth-Ogendo, 1992; Van, 2008), agricultural activities (Lopez et al., 2001; E. Njungbwen & A. Njungbwen, 2011), development level and increasing urban infrastructure (Gillham, 2001), distance to the central business district or city center (Rustiadi et al., 2013), distance to the river (Aguayo, Wiegand, Azocar, Wiegand, & Vega, 2007; Brown, Goovaerts, Burnicki, & Li, 2002; Pijanowski, Brown, Shellito, & Manik, 2002), and distance from access roads or highways (Aquayo et al., 2007; Newman, Kenworthy, & Vintila, 1992; Azócar, Romero, Sanhueza, Vega, Aguayo, & Munoz, 2007).
The independent variables (X) in our GWR model represented three types of driving forces, namely demographic, infrastructural, and natural elements. In the GWR model, population growth (POPGRO) and percentage of agricultural households (AGRHH) were selected as proxies of demographic driving forces. For infrastructural driving forces, we employed three independent variables, namely a district settlement facilities index (DFINDEX), distance to the capital regency/municipality (D_CAPREG), and distance to the toll road (D_TOLL). Finally, a variable for distance to the river (D_RIVER) was selected as the proxy of natural elements. The Y and X variables used in the GWR model are described in Table 1.
URB data were taken from land-use/cover change analysis for 1993–2010 (Rustiadi et al. 2013). POPGRO, AGRHH, DFINDEX, and D_CAPREG data were collected from the PODES datasets on village-level statistics provided by the Central Bureau of Statistics (BPS) for 1993 and 2010. D_RIVER and D_TOLL data were extracted from topography map provided from BAKOSURTANAL (National Coordinator for Surveys and Mapping Agency) in 2010. For these variables, we calculated the distance to the river and distance to the toll road by using the proximity tools in ArcGIS. The data for each independent variable (X) and for the dependent variable (Y) used in the GWR model can be seen in Fig. 2. We used data in year of 1993 and 2010 as a representative year to capture the phenomenon ‘before’ and ‘after’ monetary crisis.
Table 1. The dependent (Y) and independent variables (X) used in the GWR model
Variable Variable
Code Detail Explanation
Y URB Change ratio of the urban area from 1993 to 2010 (%)
Y (%) = [(urban area in 2010 – urban area in 1993)/total area] × 100
X1 POPGRO Population growth from 1993 to 2010 (%)
X2 AGRHH Agricultural households or households that are involved in agricultural activities
in 1993 (%)
X3 DFINDEX* District settlement facilities index in 1993
X4 D_CAPREG Distance to the capital of regency/municipality in 1993 (m)
X5 D_TOLL Distance to the toll road in 1993 (m)
X6 D_RIVER Distance to the river in 1993 (m)
Note:
Y: proxy of increasing of urban expansion; X1, X2: proxy of demographic driving forces; X3, X4, X5: proxy of infrastructural driving forces; X6: proxy of natural elements driving forces.
*DFINDEX: an index that measures the development level of regions, especially related to urban infrastructure/facilities such as education, health, the economy, social services, and other public facilities.

www.ccsenet.org/jsd Journal of Sustainable Development Vol. 8, No. 1; 2015
113
Figure 2. Maps of the independent and dependent variables
Maps of the parameter estimates (β coefficient), local R2, and standardized residuals obtained from the GWR models provide a simple way in which to detect spatially varying relationships between urbanization and related factors. R2 alone is simply a measure of the error in the regression over the total regression. Local R2 indicates how well the local regression model fits the observations (local models with low values perform poorly). Residuals are the differences between the observed and predicted y values, while standardized residuals have a mean of zero and a standard deviation of one.
3. Results and Discussion The local R2 of the GWR model was found to range from 0.174 to 0.612 (Figure 3). In this model, a higher value of local R2 corresponded not to Jakarta (i.e., the core of Jabodetabek), but to the suburban/periphery areas (Bodetabek). This result shows that the core of Jabodetabek seems likely to become more and more independent from the influence of the surrounding areas. The core of megacity, especially the Central Business District (CBD) of Jakarta city has become characterized as a globalized city, which tends to have more linkages with the world market, a global urban system, global diasporic networks, and global cultural flows (Brenner & Roger, 2006). Hajer and Reijndorp (2001) considered this character as “an archipelago of an enclave”.

www.ccsenet.org/jsd Journal of Sustainable Development Vol. 8, No. 1; 2015
114
Figure 3. The local R2 of the GWR model
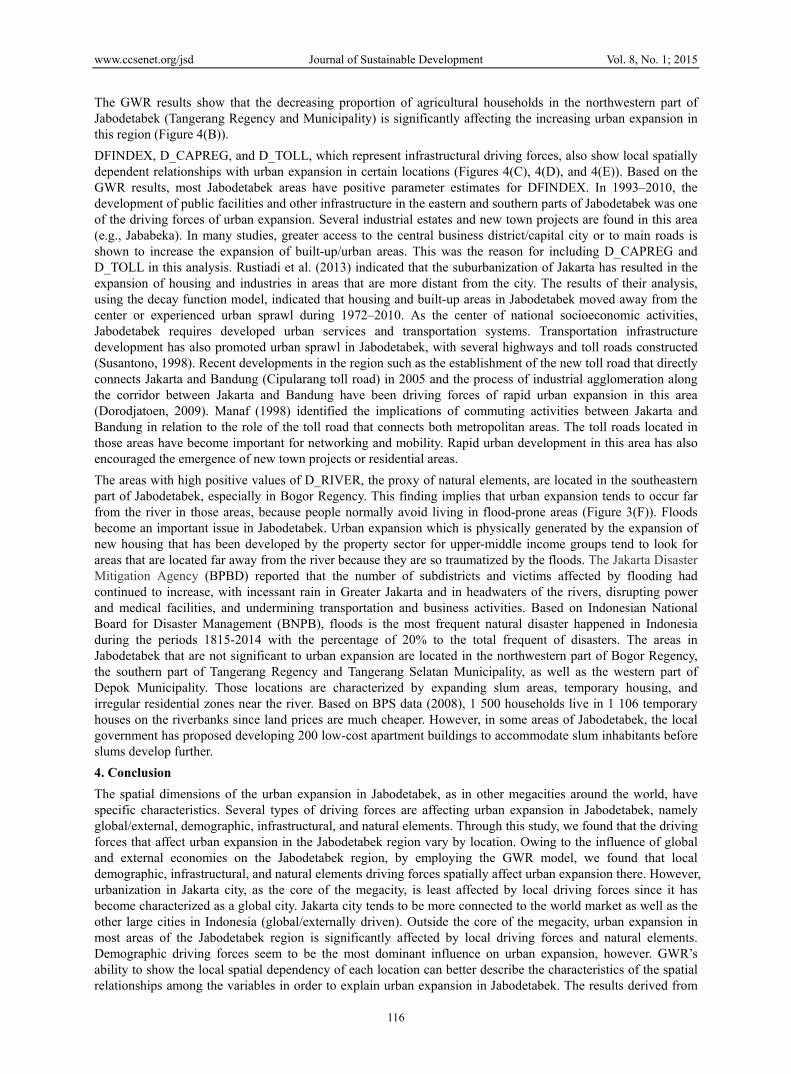
The spatial distribution maps of the parameter estimates (β coefficient) for each independent variable including the significance of the t-test values of these parameter estimates from the GWR model are shown in Figure 4. Based on the study area, demographic driving forces seem to be the most dominant influence on urban expansion. The total area in which demographic factors (POPGRO and AGRHH) are significantly causing urban expansion covers most of the Jabodetabek region except some areas of Jakarta city (Figures 4(A) and 4(B)).
POPGRO has a significant positive effect on urban expansion across most of the area, excluding only the Tangerang region and the western part of Jakarta city. The high population growth in this suburban area is mainly due to the continuing excessive in-migration from outside the Jabodetabek region as well as migration from the core of the megacity (Jakarta city) to its peripheries. The in-migration into the Jabodetabek region is affecting both the central and suburban areas, but the latter are absorbing more migrants. In 2010, 1 427 933 migrants migrated to Jakarta city compared with 2 630 119 to the suburbs (Bodetabek), which represented 14.6% of the total population (Rustiadi, Pribadi, Pravitasari, Indraprahasta, & Iman, 2014). In many industrial centers of Jabodetabek region, most migrants work in the manufacturing industry. There are now more than 35 industrial centers in Jabodetabek accounting for an area of over 18 000 hectares (Hudalah, Viantari, Firman, & Woltjer, 2013). Since the end of the 1980s, no new industrial land has been developed in Jakarta city, as the available industrial land across Jakarta has declined. In Jakarta, employment zones can only be found in the northern part, although a considerable number of new zones are present in the suburbs and suburban employment zones now comprise the majority of the total area. By contrast, during the 1990s, the widescale development of private industrial land took place in the suburbs, notably concentrated in Cikarang (Bekasi District). In fact, Cikarang, with a total industrial land area of nearly 6 000 hectares, has in the past two decades become the largest planned industrial center in Southeast Asia (Hudalah & Firman, 2012). Hence, urban expansion in Bekasi and the surrounding areas is significantly affected by population growth (Figure 4(A)), since the eastern suburbs have received a significant influx of employment, filling in the planned industrial centers along the highway. Therefore, those areas are characterized by not only industrial estates, but also new town projects. Many new town developers envision building kota mandiri (autonomous towns), complete with major urban facilities and employment centers (Hudalah & Firman, 2012).

www.ccsen
N
AccordingJakarta citboomed inconverted areas beca2011; Lopforces with
net.org/jsd
Note: n
Figure 4. S
g to Rustiadi ety until the bn the suburbsinto built-up
ause of housinpez, Aide, & Th urban expan
not significant a
Spatial distribu
et al., (2014), beginning of th
s. During the areas, mostly
ng demand anThomlinson, 2nsion is also sh
Journal of Su
at p<0.05
ution of the pa
built-up areas he 1980s. Hopeak period transformed i
d other growi2001). In this hown by the d
0.79 – 22.23 – 66.66 – 111.48 –16.68 –
-4.89 –-2.12 –0.01 –4.67 –8.31 –
-20.83-13.54-7.19 –0.01 –2.16 –
ustainable Devel
115
arameter estima
were still conowever, since
of 1992–2000into land for hing economic study, the loc
decreasing per
2.236.66 11.48 – 16.68 – 21.27
– -2.12– 0.00
– 4.67 – 8.31 – 12.73
3 – -13.544 – -7.19 – 0.00
– 2.16 – 6.25
lopment
ates of each in
ncentrated withe the late 190, about 90 7housing, roadsactivities (E. al spatial relat
rcentage of agr
ndependent var
hin the establis980s, property760 ha of agrs, and industriNjungbwen antionship of dericultural hous
Vol. 8, No. 1;
riable
shed boundariy developmentricultural landial and commeand A. Njungbemographic drseholds (AGR
-9.63 –-7.22 –-4.89 –0.01 –3.18 –
15.7-9.77-4.910.01 5.18
-5.42-2.990.01 1.57 3.93
2015
es of t has
was ercial bwen, iving HH).
– -7.22– -4.89 – 0.00
– 3.18 – 9.26
6 – -9.777 – -4.91 1 – 0.00 – 5.18 – 12.17
2 – -2.999 – 0.00 – 1.57 – 3.93 – 7.43
www.ccsenet.org/jsd Journal of Sustainable Development Vol. 8, No. 1; 2015
116
The GWR results show that the decreasing proportion of agricultural households in the northwestern part of Jabodetabek (Tangerang Regency and Municipality) is significantly affecting the increasing urban expansion in this region (Figure 4(B)).
DFINDEX, D_CAPREG, and D_TOLL, which represent infrastructural driving forces, also show local spatially dependent relationships with urban expansion in certain locations (Figures 4(C), 4(D), and 4(E)). Based on the GWR results, most Jabodetabek areas have positive parameter estimates for DFINDEX. In 1993–2010, the development of public facilities and other infrastructure in the eastern and southern parts of Jabodetabek was one of the driving forces of urban expansion. Several industrial estates and new town projects are found in this area (e.g., Jababeka). In many studies, greater access to the central business district/capital city or to main roads is shown to increase the expansion of built-up/urban areas. This was the reason for including D_CAPREG and D_TOLL in this analysis. Rustiadi et al. (2013) indicated that the suburbanization of Jakarta has resulted in the expansion of housing and industries in areas that are more distant from the city. The results of their analysis, using the decay function model, indicated that housing and built-up areas in Jabodetabek moved away from the center or experienced urban sprawl during 1972–2010. As the center of national socioeconomic activities, Jabodetabek requires developed urban services and transportation systems. Transportation infrastructure development has also promoted urban sprawl in Jabodetabek, with several highways and toll roads constructed (Susantono, 1998). Recent developments in the region such as the establishment of the new toll road that directly connects Jakarta and Bandung (Cipularang toll road) in 2005 and the process of industrial agglomeration along the corridor between Jakarta and Bandung have been driving forces of rapid urban expansion in this area (Dorodjatoen, 2009). Manaf (1998) identified the implications of commuting activities between Jakarta and Bandung in relation to the role of the toll road that connects both metropolitan areas. The toll roads located in those areas have become important for networking and mobility. Rapid urban development in this area has also encouraged the emergence of new town projects or residential areas.
The areas with high positive values of D_RIVER, the proxy of natural elements, are located in the southeastern part of Jabodetabek, especially in Bogor Regency. This finding implies that urban expansion tends to occur far from the river in those areas, because people normally avoid living in flood-prone areas (Figure 3(F)). Floods become an important issue in Jabodetabek. Urban expansion which is physically generated by the expansion of new housing that has been developed by the property sector for upper-middle income groups tend to look for areas that are located far away from the river because they are so traumatized by the floods. The Jakarta Disaster Mitigation Agency (BPBD) reported that the number of subdistricts and victims affected by flooding had continued to increase, with incessant rain in Greater Jakarta and in headwaters of the rivers, disrupting power and medical facilities, and undermining transportation and business activities. Based on Indonesian National Board for Disaster Management (BNPB), floods is the most frequent natural disaster happened in Indonesia during the periods 1815-2014 with the percentage of 20% to the total frequent of disasters. The areas in Jabodetabek that are not significant to urban expansion are located in the northwestern part of Bogor Regency, the southern part of Tangerang Regency and Tangerang Selatan Municipality, as well as the western part of Depok Municipality. Those locations are characterized by expanding slum areas, temporary housing, and irregular residential zones near the river. Based on BPS data (2008), 1 500 households live in 1 106 temporary houses on the riverbanks since land prices are much cheaper. However, in some areas of Jabodetabek, the local government has proposed developing 200 low-cost apartment buildings to accommodate slum inhabitants before slums develop further.
4. Conclusion The spatial dimensions of the urban expansion in Jabodetabek, as in other megacities around the world, have specific characteristics. Several types of driving forces are affecting urban expansion in Jabodetabek, namely global/external, demographic, infrastructural, and natural elements. Through this study, we found that the driving forces that affect urban expansion in the Jabodetabek region vary by location. Owing to the influence of global and external economies on the Jabodetabek region, by employing the GWR model, we found that local demographic, infrastructural, and natural elements driving forces spatially affect urban expansion there. However, urbanization in Jakarta city, as the core of the megacity, is least affected by local driving forces since it has become characterized as a global city. Jakarta city tends to be more connected to the world market as well as the other large cities in Indonesia (global/externally driven). Outside the core of the megacity, urban expansion in most areas of the Jabodetabek region is significantly affected by local driving forces and natural elements. Demographic driving forces seem to be the most dominant influence on urban expansion, however. GWR’s ability to show the local spatial dependency of each location can better describe the characteristics of the spatial relationships among the variables in order to explain urban expansion in Jabodetabek. The results derived from

www.ccsenet.org/jsd Journal of Sustainable Development Vol. 8, No. 1; 2015
117
the GWR model show significant spatial information that would be useful for making recommendations to land-use planners and policymakers with regard to controlling urbanization as well as minimizing the negative impact of rapid urban expansion in Jabodetabek. The presented results imply the need for specific local policies. All local authorities in Jabodetabek have to use specific policies to control the widescale urban expansion since every location has a different local spatial dependency based on its individual characteristics.
References Aguayo, M. I., Wiegand, T., Azócar, G. D., Wiegand, K., & Vega, C. E. (2007). Revealing the driving forces of
mid-cities urban growth patterns using spatial modeling: a case study of Los Ángeles, Chile. Ecology and Society, 12(1), 13.
Angel, S., Parent, J., Civco, D. L., & Blei, A. M. (2011). Making Room for a Planet of Cities. Cambridge, MA, USA: Lincoln Institute of Land Policy. (p.76).
Azócar, G., Romero, H., Sanhueza, R., Vega, C., Aguayo, M., & Muñoz, M. D. (2007). Urbanization patterns and their impacts on social restructuring of urban space in Chilean mid-cities: the case of Los Ángeles, central Chile. Landuse Policy, 24, 199-211. http://dx.doi.org/10.1016/j.landusepol.2005.04.003
Bilsborrow, R. E., & Okoth-Ogendo, H. W. O. (1992). Population driven changes in land use developing countries. Ambio, 21, 37-45.
Bolay, J. C. (2012). What sustainable development for the cities of the South. Urban issues for a third millenium. Int. J. Urban Sustain. Dev, 4, 76-93. http://dx.doi.org/10.1080/19463138.2011.626170
Brenner, N., & Roger, K. (Eds.). (2006). The global cities reader. Abingdon and New York: Routledge.
Brown, D. G., Goovaerts, P., Burnicki, A., & Li, M. Y. (2002). Stochastic simulation of land-cover change using geostatistics and generalized additive models. Photogrammetric Engineering and Remote Sensing, 68(10), 1051-1062.
Clement, F., Orange, D., Williams, M., Mulley, C., & Epprecht, M. (2009). Drivers of afforestation in Nothern Vietnam: assessing local variations using geographically weighted regression. Applied Geography, 29(4), 561-576. http://dx.doi.org/10.1016/j.apgeog.2009.01.003
Davis, M. (2008). Planet of Slums. USA: Common Knowledge, 14, 5-34.
Dorodjatoen, A. M. H. (2009). The emergence of Jakarta-Bandung mega-urban region and its future challenges. Jurnal Perencanaan Wilayah dan Kota, 20(1), 15-33.
Farrow, A., Larrea, C., Hyman, G., & Lema, G. (2005). Exploring the spatial variation of food poverty in Ecuador. Food Policy, 30, 510-531. http://dx.doi.org/10.1016/j.foodpol.2005.09.005
Fernandes, E. (2011). Regularization of informal settlements in Latin America. Cambridge, MA, USA: Lincoln Institute of Land Policy.
Fotheringham, A. S., Brunsdon, C., & Charlton, M. (2002). Geographically weighted regression: The analysis of spatially varying relationships. England: John Wiley & Sons.
Geng, Y., Peng, C., & Tian, M. (2011). Energy use and CO2 emission inventories in the four municipalities of China. Energy Procedia, 5, 370-376. http://dx.doi.org/10.1016/j.egypro.2011.03.063
Gillham, O. (2002). The limitless city: a primer on the urban sprawl debate. Washington DC: Island Press.
Hajer, M., & Reijndorp, A. (2001). In search of new public domain. Analysis and strategy. Rotterdam: Nai Publisher.
Hasse, J. E., & Lathrop, R. G. (2003). Land resource impact indicators of urban sprawl. Applied Geography, 23(2-3), 159-175. http://dx.doi.org/10.1016/j.apgeog.2003.08.002
Herlambang, S. (2011). Profil pengembangan kota baru di Jabodetabek 1985-2010 (Profile of new town development in Jabodetabek 1985-2010). Kompas, 26 July 2011. Center for Metropolitan Studies. Jakarta: Tarumanagara University. Print.
Hudalah, D., & Firman, T. (2012). Beyond property: Industrial estates and post-suburban transformation in Jakarta Metropolitan Region. Cities, 29(1), 40-48.
Hudalah, D, Viantari, D., Firman, T., & Woltjer, J. (2013). Industrial land development and manufacturing deconcentration in Greater Jakarta. Urban Geography, 34(7), 950-971. http://dx.doi.org/10.1080/02723638.2013.783281

www.ccsenet.org/jsd Journal of Sustainable Development Vol. 8, No. 1; 2015
118
Jaimes, N. B. P., Sendra, J. B., Delgado, M. G., & Plata, R. F. (2010). Exploring the driving forces behind deforestation in the state of Mexico (Mexico) using geographically weighted regression. Applied Geography, 30, 576-591. http://dx.doi.org/10.1016/j.apgeog.2010.05.004
Lopez, T., del, M., Mitchell, A. T., & Thomlinson, J. R. (2001). Urban expansion and the loss of prime agricultural lands in Puerto Rico. Ambio, 30(1), 49-54.
Malczewski, J., & Poetz, A. (2005). Residential burglaries and neighborhood socioeconomic context in London, Ontario: global and local regression analysis. The Professional Geographer, 57, 516-529. http://dx.doi.org/10.1111/j.1467-9272.2005.00496.x
Manaf, M. (1998). The impact of Jakarta-Bandung mega urban development on the performance of Jakarta-Bandung highway. Master thesis. Bandung: Bandung Institute of Technology.
McGee, T. G. (1991). The emergence of desakota regions in Asia: expanding a hypothesis. In N. Ginsburg, B. Koppel, & T. G. McGee (Eds.), The Extendeed Metropolis: Settlement Transition in Asia (pp. 3-25). Honolulu: University of Hawai Press.
Murakami, A., Zain, A. M., Takeuchi, K., Tsunekawa, A., & Yokota, S. (2005). Trends in urbanization and patterns of land use in the Asian mega cities Jakarta, Bangkok and Metro Manila. Landscape and Urban Planning, 70, 251-259. http://dx.doi.org/10.1016/j.landurbplan.2003.10.021
Newman, P., Kenworthy, J., & Vintila, P. (1992). Housing, transport and urban form. National Housing Strategy, Department of Health, Housing and Community Services, Canberra, Australia.
Ng, M. K., & Hills, P. (2003). World cities or great cities? A comparative study of five Asian metropolises. Cities, 20, 151-165. http://dx.doi.org/10.1016/S0264-2751(03)00003-9
Njungbwen, E., & Njungbwen, A. (2011). Urban Expansion and Loss of Agricultural Land in Uyo Urban Area: Implications for Agricultural Business. Ethiopian Journal of Environmental Studies and Management, 4(4).
Ogneva-Himmelberger, Pearsall, Y. H., & Rakshit, R. (2009). Concrete evidence and geographically weighted regression: A regional analysis of wealth and the land cover in Massachusetts. Applied Geography. http://dx.doi.org/10.1016/j.apgeog.2009.03.001
Pijanowski, B. C., Brown, D. G., Shellito, B. A., & Manik, G. A. (2002). Using neural networks and GIS to forecast landuse changes: a land transformation model. Computers, Environment, and Urban Systems, 26, 553-575. http://dx.doi.org/10.1016/S0198-9715(01)00015-1
RIHN. (2014). Fukami, N., Yamada, K., & Uchiyama, Y. (Eds.). Kyojuu kankyou ruikei kara Megacity no guroobaruna renkan to doutai o toraeru. Zen-kyuu toshi zenshi kenkyuu jouhou-sho sougou chikyuu kankyou gaku kenkyuusho. In Japanese. (Capturing the dynamics and changes of global megacities from living environment point of view. The Report on Global City History. The Megacities Project. Research Institute for Humanity, RIHN).
Rustiadi, E., & Kitamura, T. (1998). Analysis of land use change in city suburb. A case study on some subdistricts of the Bekasi Area of West Java, Indonesia. Journal of Rural Planning Association Japan, 17(1), 20-29. http://dx.doi.org/10.2750/arp.17.20
Rustiadi, E., Mizuno, K., & Kobayashi, S. (1999). Measuring spatial patterns of the suburbanization process. A case study of Bekasi District, Indonesia. Journal of Rural Planning Association Japan, 18(1), 31-41. http://dx.doi.org/10.2750/arp.18.31
Rustiadi, E., & Panuju, D. R. (2002). A spatial pattern of suburbanization process: Case study of Jabotabek Region. In Y. Himiyama, M. Hwang. & T. Ichinose (Eds.), Landuse Change in Comparative Perspectives (pp. 33-52). Japan: Science Publishers, Inc.
Rustiadi, E., Iman, L. S., Lufitayanti, T., & Pravitasari, A. E. (2013). LUCC Inconsistency analysis to spatial plan and land capability (Case study: Jabodetabek Region). In Y. Himiyama (Ed.), Toward Sustainable Landuse in Asia (IV). SLUAS Science Report 2013.
Rustiadi, R., Pribadi, D. O., Pravitasari, A. E., Indraprahasta, G. S., & Iman, L. S. (2014). Jabodetabek megacity: From development toward urban complex management system. In R. B. Singh (Ed.), Urban Development Challenges, Risks and Resilience in Asian Megacities. Tokyo: Springer.
Seto, K. C., Fragkias, M., Guneralp, B., & Reilly, M. K. (2011). A meta-analysis of global urban land expansion. PloS one, 6, e23777. http://dx.doi.org/10.1371/journal.pone.0023777

www.ccsenet.org/jsd Journal of Sustainable Development Vol. 8, No. 1; 2015
119
Su, S., Xiao, R., & Zhang, Y. (2012). Multi-scale analysis of spatially varying relationships between agricultural landscape patterns and urbanization using geographically weighted regression. Applied Geography, 32(2), 360-375. http://dx.doi.org/10.1016/j.apgeog.2011.06.005
Susantono, B. (1998). Transportation land use dynamics in Metropolitan Jakarta. Barkeley Planning Journal, 12(1). Retrieved December 6, 2013, from http://www.escholarship.org/uc/item/2g41499w.page-1
UN-Habitat, United Nations Human Settlement Programme. (2003). The challenge of slums: Global report on human settlements 2003. Kenya: UN-Habitat.
UN-Habitat. (2008). State of the world’s cities 2008/2009-Harmonious Cities. Nairobi, Kenya. p.204.
UNW-DPAC. (2010). Water and cities facts and figures. Proceedings of Sustainable Water Management in Cities: Engaging Stakeholders for Effective Change and Action. Aragoa, Spain, 13-17 December 2010. p.4.
Van, T. T. (2008). Research on the effect on urban expansion on agricultural land in Ho Chi Minh City by using remote sensing method. VNU Journal of Science, Earth Sciences, 24, 104-111.
World Bank. (2011). World Development Report 2011. In E. Giralt, & D. Andrew (Eds.), Washington, DC, USA: The World Bank Group. p.416.
Yu, D. L. (2006). Spatially varying development mechanisms in the Greater Beijing area: A geographically weighted regression investigation. Annals of Regional Science, 40, 173-190. http://dx.doi.org/10.1007/s00168-005-0038-2
Yu, D., & Wu, C. (2004). Understanding population segregation from Landsat ETMþ imagery: a geographically weighted regression approach. GIScience & Remote Sensing, 41(3), 187-206. http://dx.doi.org/10.2747/1548-1603.41.3.187
Zhao, P. (2010). Sustainable urban expansion and transportation in a growing megacity: Consequences of urban sprawl for mobility on the urban fringe of Beijing. Habitat International, 34(2), 236-243. http://dx.doi.org/10.1016/j.habitatint.2009.09.008
Zhu, J. (2010). Symmetric development of informal settlements and gated communities: Capacity of the state – The case of Jakarta, Indonesia. Asia Research Institute. Working Paper Series No.135. National University of Singapore.
Zorbaugh, H. W. (1976). The gold coast and the slum: A sociological study of Chicago’s Near North Side. Chicago: The University of Chicago Press.
Copyrights Copyright for this article is retained by the author(s), with first publication rights granted to the journal.
This is an open-access article distributed under the terms and conditions of the Creative Commons Attribution license (http://creativecommons.org/licenses/by/3.0/).