livestock systems, environment and area payments + livestock systems and high nature value farming...
Post on 19-Dec-2015
213 views
TRANSCRIPT

Livestock systems, environment and area payments
+Livestock systems and High Nature Value
Farming
Erling Andersen
Danish Centre for Forest, Landscape and Planning
European Livestock Policy Evaluation Network
Udine, November 2002

Livestock systems, environment and area payments
EFNCP seminar, Brussels, July 2002

Two scenarios
All direct support substituted by:
1. UAA premium- a unionwide homogeneous area payment on the total farmed area
2. Grassland premium- a unionwide homogeneous area payment on permanent and rough grassland

Source: FADN-CCE-DG Agriculture/A-3; adaptation LEI.
Assessment 1Grazing livestock sectors
Share of support:Share of
farmsToday UAA
premiumGrassland
premiumDairy cattle 40,3 36,0 35,7 25,5Beef cattle 21,6 24,4 18,8 20,0Mixed cattle 19,7 18,7 16,4 14,7Mixed sheep 5,3 2,1 2,5 1,8Meat sheep 4,8 6,5 12,5 18,3Meat grazinglivestock
4,4 9,7 10,7 15,6
Dairy sheep 1,8 0,6 1,0 1,0Mixed grazinglivestock
1,2 1,5 2,0 2,7
Mixed goats 0,6 0,3 0,1 0,1Dairy grazinglivestock
0,2 0,2 0,2 0,3
Dairy goats 0,1 0,1 0,1 0,0

Assessment 2Land use
Share of support:Share of
farmsToday UAA
premiumGrassland
premium
Permanent 48 45 56 84
Arable 34 38 32 11
Grassland 12 14 11 4
Off-farmgrazing
3 1 1 1
Off-farm pro-duced fodder
3 1 0 0
Source: FADN-CCE-DG Agriculture/A-3; adaptation LEI.

Assessment 2Land use - Permanent grassland systems
58 ha58 GLU84% Permanent and rough grassFFI: 19100 Ecu33% older than 6578% of UAA in LFA
Source: FADN-CCE-DG Agriculture/A-3; adaptation LEI.

Assessment 2Land use - Permanent grassland systems
0 50 100 150 200 250 300
Fertiliser
Crop protection
Stocking density
Grassland
Permanent grass
Grassland pressure
Source: FADN-CCE-DG Agriculture/A-3; adaptation LEI.

Assessment 2Land use - Permanent grassland systems
%
Share of farms 48
Share of UAA 56
Share of GLU 52
Share of support 45
Share of livestock support 60
UAA payment 56
Grassland payment 84
Source: FADN-CCE-DG Agriculture/A-3; adaptation LEI.

Assessment 2Land use - Arable systems
49 ha51 GLU11% permanent and rough grassFFI: 24370 Ecu35% older than 6547% of UAA in LFA
Source: FADN-CCE-DG Agriculture/A-3; adaptation LEI.

Assessment 2Land use - Arable systems
0 50 100 150 200 250 300
Fertiliser
Crop protection
Stocking density
Grassland
Permanent grass
Grassland pressure
Source: FADN-CCE-DG Agriculture/A-3; adaptation LEI.

Assessment 2Land use - Arable systems
%
Share of farms 34
Share of UAA 32
Share of GLU 32
Share of support 38
Share of livestock support 17
UAA payment 32
Grassland payment 11
Source: FADN-CCE-DG Agriculture/A-3; adaptation LEI.

Assessment 2Land use - Off-farm grazing systems
20 ha32 GLU> 5 months off farmgrazingFFI: 15006 Ecu35% older than 6580% of UAA in LFA
Source: FADN-CCE-DG Agriculture/A-3; adaptation LEI.

Assessment 2Land use - Off-farm grazing systems
0 50 100 150 200 250 300
Fertiliser
Crop protection
Stocking density
Grassland
Permanent grass
Grassland pressure
Source: FADN-CCE-DG Agriculture/A-3; adaptation LEI.

Assessment 2Land use - Off-farm grazing systems
%
Share of farms 3,1
Share of UAA 0,9
Share of GLU 1,4
Share of support 1,5
Share of livestock support 2,4
UAA payment 0,9
Grassland payment 0,7
Source: FADN-CCE-DG Agriculture/A-3; adaptation LEI.

Assessment 3Intensity
Share offarms
Share ofsupport
today
UAApremium
Grasslandpremium
High input 18 11 9 7
Medium input 51 56 48 41
Low input 31 33 43 52
Source: FADN-CCE-DG Agriculture/A-3; adaptation LEI.

Assessment 4Size
Share offarms
Share ofsupport
today
UAApremium
Grasslandpremium
Large-scale 13 33 37 40
Medium-scale 63 58 55 53
Small-scale 25 9 7 7
Source: FADN-CCE-DG Agriculture/A-3; adaptation LEI.

Some conclusions
UAA premium:
+ sheep- beef cattle + permanent grass+ Low intensity+ Large scale
Grassland premium:
+ sheep- beef and dairy cattle + permanent grass+ Low intensity+ Large scale

Some conclusions
Both premiums favour the livestock systems with the better environmental profiles
The two different premiums favour the same livestock systems, but with different intensity
The UAA premium shows a more just distribution than the current support with regard to the share of farms, UAA and grazing livestock.

Livestock systems and High Nature Value Farming
European Environmental Agency, Copenhagen, February 2002

Distribution on grazing livestock systems
% of allgrazinglivestockfarms
Off-farmgrazingsystems
Arablesystems
Permanentgrass
systems
Grasslandsystems
Total
Low input 1 6 21 2 30Mediuminput
1 18 25 8 52High input 2 7 7 2 18
Total 3 31 53 13 100

The regional importance of grazing livestock systems

The regional importance of low-input grazing livestock systems

Example 1: Low-input grassland - dairy Sheep & goat

Example 1: Low-input grassland - dairy Sheep & goat
Key-characteristics
System IndexAverage UAA ha 55,1 112Average economicsize (ESU)
12,7 65
Gross Farm Income(ECU)
21719 90
Farmers older than 65%
39 106
Total LU 25,0 80Sheep LU 21,4 84Goat LU 2,7 75Goat, breedingfemales heads
22 80
Ewes heads 172 93

Example 1: Low-input grassland - dairy Sheep & goat
Key environmental indicators
System IndexCost fertiliser ECU/ha 13 37Cost crop protection ECU/ha 1 6Total stocking rate (totalLU/UAA)
0,5 71
Grassland pressure (GrazingLU/Grassland)
0,5 47
Average share of UAA intemporary grass %
5 85
Average share of UAA inpermanent grass %
39 209
Average share of UAA in roughgrass %
42 135
Source: FADN-CCE-DG Agriculture/A-3; adaptation LEI.

Example 2: Low-input of-farm grazing - dairy cattle
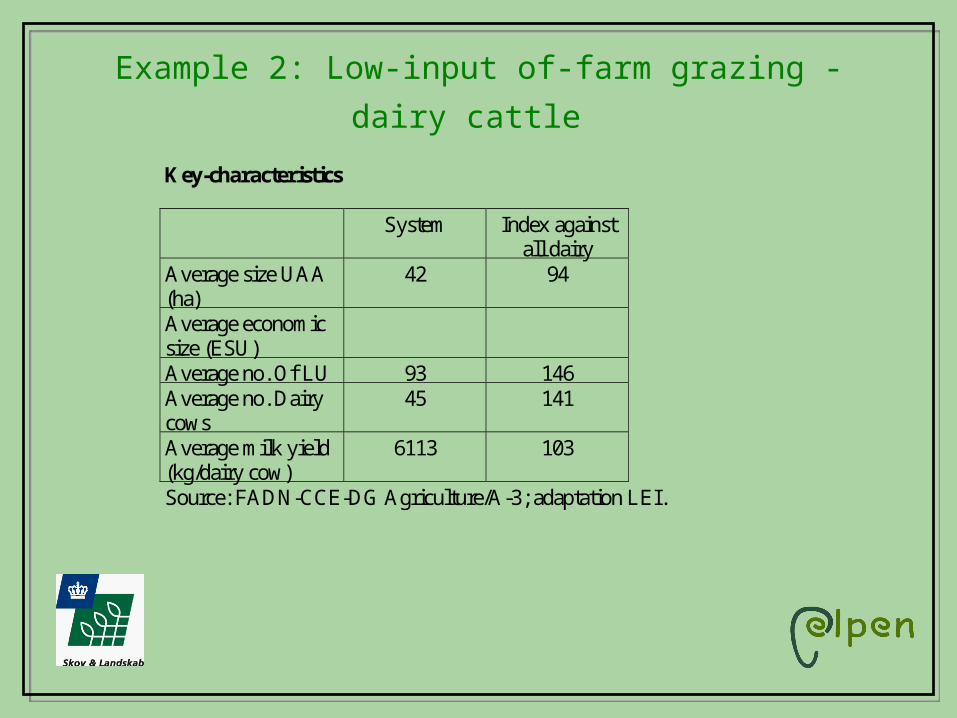
Example 2: Low-input of-farm grazing - dairy cattle
Key-characteristics
System Index againstall dairy
Average size UAA(ha)
42 94
Average economicsize (ESU)Average no. Of LU 93 146Average no. Dairycows
45 141
Average milk yield(kg/dairy cow)
6113 103
Source: FADN-CCE-DG Agriculture/A-3; adaptation LEI.

Example 2: Low-input of-farm grazing - dairy cattle Key environmental indicators
System Index against alldairy
Cost of fertilisers(Ecu/ha)
111 120
Cost of crop protection(Ecu/ha)
10 24
Total Stocking rate(Total LU/ha UAA)
2,2 156
Grassland pressure(GrazingLU/hagrassland)
2,0 85
Average share of UAAin temporary grass (%)
9,8 87
Average share of UAAin permanent grass (%)
71,8 191
Average share of UAAin rough grass (%)
14,3 709
Source: FADN-CCE-DG Agriculture/A-3; adaptation LEI.

Conclusions
• Based on the expert knowledge and FADN data we have build a typology of grazing livestock systems with different environmental profiles
• High Nature Value Farming systems can be identified, described and located regionally
• More detailed information on farming practices and location is needed - reference farms and GIS-analysis